
Submitted:
06 July 2023
Posted:
10 July 2023
You are already at the latest version
Abstract
This paper focuses on a joint model to analyse longitudinal proportion and survival data. After transforming the longitudinal proportional data by a logit function, we adopt a partially linear mixed-effect model for it, in which nonlinear function of time is fitted via using B-splines technique and a centered Dirichlet Process Mixture Model (CDPMM) is specified for a general distribution of random effects. The survival data is assumed to a Cox proportional hazard model, the sharing random effects joint model is developed for the two types of data. Combining the Gibbs sampler and the Metropolis-Hastings algorithm, we propose a Bayesian Lasso (BLasso) method to simultaneously estimate unknown parameters and select important covariates. Simulation studies are conducted to investigate the finite sample performance of the proposed methods. An example from the MA.5 research experiment is used to illustrate the proposed methodologies.
Keywords:
longitudinal proportional data
; survival data
; joint model
; Bayesian variable selection
; B-splines
; CDPMM metnod
1. Introduction
Joint analysis of longitudinal and survival data have been widely applied to cancer and HIV/AIDS clinical studies where time to event outcomes, such as disease free and overall survivals, are usually the primary endpoints. In particular, after Faucett and Thomas [1] and Wulfsohn and Tsiatis [2] introduced what is the standard joint model, the joint model has been extensively explored. The advantages of joint models have been discussed by researchers [3,4,5,6,7,8]. However, in clinical trials, some patients with poor quality of life may drop out of the study due to disease recurrence or death. In this case, the absence of quality of life measures resulting from the withdrawal of these patients is informative. In order to provide strong evidence for the tradeoff between intensive treatment and the associated poor quality of life for patients, we conducted joint modeling of longitudinal life measures and survival data to investigate the relationship between them. For longitudinal quality of life and survival data, Henderson et al. [9] and Zeng and Cai [10] considered the use of shared normal distribution random effects to jointly analyze the relationship between longitudinal quality of life and survival time. Tang et al. [11] considered a novel semiparametric joint model for multivariate longitudinal and survival data to analyze data from the International Breast Cancer Study. Longitudinal life quality measurement data can be linearly converted into longitudinal proportion data whose value range is in the unit interval (0,1) [12]. For the longitudinal component, there are two methods to deal with it. The first method applied the classic linear mixed model to the longitudinal scale data after logit transformation, and the second method directly used the simplex distribution to model the longitudinal scale data. The models established by the two methods both used the EM algorithm and the Laplace approximation to estimate the unknown parameters. In order to be more flexible and practical, this paper will use a partial linear mixed effect model to the logit transformed longitudinal scale data, and use the B-splines method to model the nonlinear function in the model. Meanwhile, to promote the feasibility of our proposed model, we use CDPMM method to model random effects.
In addition, variables selection in the joint model is also considered. In traditional regression models, methods of variable selection include the forward selection method, backward elimination method, stepwise selection method or some information criterion such as the Akaike information criterion. But these approaches are computationally expensive and unstable for the complicated models with a large number of covariates. Therefore, some penalized likelihood methods are gradually proposed, especially Lasso of Tibshirani [13] estimating linear regression coefficients by -constrained least squares. Tibshirani [13] proposed that Lasso estimates can be interpreted as posterior norm estimates when the regression parameters have independent and identical Laplacian priors (ie, double exponential priors). Motivated by this connection, under the Bayesian framework, Park and Casella [14] proposed the BLasso variable selection method by imposing the double exponential prior on the regression coefficients and the gamma distribution on the shrinkage parameter. The BLasso method has been applied to linear regression model [15], semi-parametric structural equation model [16] and joint models of longitudinal and survival data [17]. Therefore, this paper extended that BLasso variable selection method to the joint model of longitudinal proportion data and survival data and a BLasso approach is developed to simultaneously estimate unknown parameters and identify the significant effect of the important covariates.
The rest of this paper is organized as follows. In Section 2, the joint model of longitudinal proportion and survival data is introduced. In Section 3, the Bayesian estimations of joint model are proposed. In Section 4, three numerical simulations are presented to evaluate the performance of the proposed methods. In Section 5, we apply the proposed approach to the MA.5 research experiment data and some concluding remarks are given in Section 6. Technical details are given in Appendix A.
2. Model and Notation
Consider a data set from n individuals. Let be a longitudinal proportional measurement for the i-th individual () at observation time point for , and . We assume is the logit-transformation of , and . Further, and are the true survival time and censoring time, respectively. Let denotes the corresponding observed event time, and denotes the failure indicator, where is a indicator function.
Denote , , , . Let be time-independent random effects underlying both the longitudinal and survival processes for the i-th individual. Given the random effects , assume that follows partially linear mixed-effect model
where and represent the time-independent design vectors of fixed and random effects associated with , respectively. And is a fixed effects regression parameters, is a random effects vector, is a twice continuous differentiable unknown function, and is a white noise process with variance . Also, we assume that ’s are independent of . To facilitate the feasibility of our proposed model, instead of the traditional normality assumption, which may be violated in some applications [18], it is specified the random effects by Dirichlet process (DP) mixture of normals.
For event time , given random effects , we assume that follows the hazard model
where is the known fixed effects design matrix linking the unknown parameter vector to , is an unknown parameter vector linking to , and is an unknown basic hazard function.
From the above discussion, it is suggested to link models (1) and (2) through shared random effects, called a shared random effects joint model (JMSRE). Parameter in model JMSRE reflects the correlation between transformed longitudinal proportional data and survival data, given random effects. When , it means that the longitudinal index is not necessarily related to the event time, that is, longitudinal proportional data and survival data can be modeled separately. So in this case joint modeling is not necessary and longitudinal indicators can be ignored for modeling survival data.
Further, to make Bayesian inference on based on model (1), we approximate through a B-splines method
where , d is the degree of B-splines, K is the number of knots, is a unknown coefficient vector, and .
3. Bayesian estimation of joint model
3.1. Prior specification
To develop Bayesian inference on the considered models, we need specifying the prior distributions for . For conjugation, we consider the following priors for :
where , and are pre-given hyperparameters, denotes the Gamma distribution with parameter and the shape parameter .
Following Tang et al. [17], we specify the DP mixture of normals for the random effects , that is, with , where is a random probability with an unknown form. one common approach is to specify DP prior to approximate , i.e., in which is a base distribution that serves as a starting-point for constructing the nonparametric distribution, and is a weight that indicates the researcher’s certainty of as the distribution of . To gain the form of , motivated by Ohlssen et al. [18] and Yang et al. [19], we consider the following truncated approximate centered Dirichlet Process Mixture Model (CDPMM), which can specify the prior distribution of as follows:
where , and is a random probability weight chosen to be independent of such that and . In order to ease the computational intensity, according to take moderate value proposed by Ishwaran and Zarepour (2000) [20], we consider , and is given by the following stick-breaking procedure:
where for , and so that . The prior distribution for the unknown parameter is given by with prespecified hyperparameters and [21]. Here, we took the hyperparameters and to be 25 and 5, respectively.
Sampling from posterior distributions of with the above specified DP prior is quite difficult and inefficient. An efficient and flexible method for solving the above question is to represent in terms of a latent variable , which records each ’s cluster membership and conveys its parametric value to the distribution of . Let , , and in which , and they can be reformulated by
where denotes a discrete probability measure concentrated at g, is specified by the stick-breaking prior as given in Equation (5), and . Here, and can be specified by
respectively, where , denotes the Gamma distribution with parameters and , and and are prespecified hyperparameters [18]. We consider , , , , , and in the paper. Given the values of , and , we can sample from with .
Hereafter we mainly introduce the variable selection principle of BLasso method [14,16] for the proposed joint model JMSRE. We need to identify not only the important variables in models (1) and (2). In particular, we also need to identify whether the parameter is , and our proposed BLasso method does just that. In general, the prior distribution of the regression parameters is set to a multivariate normal distribution. Following the idea of Bayesian Lasso inference [14], we consider the following hierarchical priors for , and :
where , and are the regularization parameters that control the tail decay. In particular, in order to better control the effect of tail decay, this paper sets different regularization parameters for different components of the same parameter. Inspired by Park and Casella [14], we further consider the following super-priorities for these tuning parameters:
3.2. Bayesian analysis of joint model
To obtain Bayesian estimates of unknown parameters and , a hybrid algorithm combining the block Gibbs sampler and the Metropolis-Hastings algorithm is employed to iteratively draw as follows.
(A) Conditional distribution of
It follows from Equation (3) and Equation (7) that the conditional posterior distribution is expressed as
which yields
where , .
(B) Conditional distribution of According to Equation (3) and the prior of in Equation (4), the conditional distribution is given by
which yields
where , .
(C) Conditional distribution of
It follows from Equation (3) and the prior of in Equation (4) that the conditional distribution is given by
which yields
(D) Conditional distribution of
For reasons of space, the sampling of follows the steps in Appendix A, which can also be seen in Tang et al. [24]
(E) Conditional distribution of
It follows from Equation (3) and Equation (8) that the conditional distribution is proportional to
which is not a familiar distribution. Therefore, the well-known Metropolis-Hastings (MH) algorithm is adopted to simulate observations from the above given conditional distribution, which is implemented as follows. Given the current value , new candidates are generated from , where . The new is accepted with probability
where
with The variance coefficient can be chosen such that the average acceptance rate are approximately 0.25 or more.
(F) Conditional distribution of
From Equation (3) and Equation (9), the conditional distribution is proportional to
which is not a familiar distribution. Similar to above (E), given the current value , new candidates are generated from , where . The new is accepted with probability
where
and The variance coefficient can be chosen such that the average acceptance rate are approximately 0.25 or more.
By the above iterative process, we can obtain a series of sample . Then, Bayesian estimates of , , , , and can be obtained by
Similarly, the consistent estimates of the posterior covariance matrices of , , , , and can be obtained via the sample covariance matrices. For example
Therefore, the variance of the corresponding parameter can be obtained through the diagonal elements of the sample covariance matrix of the random sample sequence.
4. Simulation Studies
In this section, we conducted three simulation studies to investigate the finite performance of the above proposed methods.
We considered the model defined in models (1) and (2) with 200 individuals. Here, the specific model is as follows:
The data were generated as follows: observation time was generated randomly between 0 and 3, the covariates and followed the Bernoulli distribution with the success probability 0.5 and 0.3, respectively. The covariates and were generated form the multivariate normal distribution with mean vector 0 and covariance matrix . And the covariance matrix is a symmetric positive definite matrix whose diagonal elements are 1 and the rest are . The random error is generated from the normal distribution with mean 0 and variance . And . The baseline hazard function and . The censoring time was generated from the Uniform distribution , and was generated from the Exponential distribution with mean , . Our main purpose is to use the proposed approaches to identify the unimportant covariates and estimate nonzero coefficients. Bayesian results were obtained from 200 replications.
To show that our proposed method above can both accurately estimate parameters of interest and identify unimportant variables, but also flexibly capture the feature of nonlinear function and random effects , we consider three different simulation studies as follows.
Simulation I.
Simulation II.
Simulation III.
which the mean censoring rates of the survival times in the three simulation studies are 44%, 45%, and 37%, respectively.
For each of the above generated data sets, the proposed semiparametric Bayesian procedure was used to simultaneously evaluate Bayesian estimates of unknown parameters and select the important covariates. The prior hyperparameters , corresponding to the hyperparameters of the hyper priors for the adjustment coefficients in Equations (10)-(). and , corresponding to the prior parameters of . We set the degree of B-splines , the number of konts , and . To investigate the convergence of the proposed algorithm, we calculated the estimated potential scale reduction (EPSR) values of parameters. In addition, we also need to test whether the nonlinear function fitted by the B-splines method is convergent. It can be seen from Figure 1 that the EPSR values were less than 1.2 after about 3000 iterations in three simulation studies. Thus, 3000 () observations were collected to calculated Bayesian estimates of parameters after 3000 iterations in producing Bayesian results for each of 200 replications. Results obtained under three simulation studies were reported in Table 1, where “Bias” is the difference between the true value and the mean of the estimates based on 200 replications, “RMS” is the root mean square between the estimates based on 200 replications and its true value, and “F0” is the proportion that parameter is identified to be zero in 200 replications in terms of the criterion that a parameter is identified to be 0 if its confidence interval contains 0.
Results of Table 1 indicated that (i) Bayesian estimates of parameters are reasonably accurate because their absolute biases are less than 0.10 and the root mean square of their RMS values are less than 0.20; (ii) BLasso could identify the correct models in most cases regardless of prior inputs of parameters because the F0 values corresponding to the important covariates were less than , but the F0 values corresponding to unimportant covariates were more than . The performance of the proposed approach to recover the nonlinear function can be measured by the root mean square error
where , represents the Bayesian estimated value of the parameter vector in the r-th replication. Similar to the root mean square error of nonlinear function, we also calculate the root mean square error of random effects. Figure 2 plots the estimated curve and estimated density of the nonlinear function and the random effects of the replication in which the mean of the RASE of the nonlinear function and the random effects is in the middle of the 200 replications, and against true curves and true density in three simulation studies, respectively. Inspection of Figure 2 showed that (i) the Bayesian B-splines method proposed in this paper can be flexible enough fit the true curve of the nonlinear function ; (ii) the CDPMM method proposed is flexible enough to capture the general shapes of our considered three distribution assumptions for ; (iii) the estimated 95% confidence region of the nonlinear function can cover its true curve with a fairly narrow area. From Table 2, based on the results of 200 replications in three simulation studies, the estimated means and standard deviation (SD) of random effects are enough near to their corresponding true values, and 25%, 50% and 75% quantile of the mean of the RASE of the nonlinear function and the random effects are enough small and close to illustrate that it is robust to apply CDPMM to estimate random effects. All these findings indicated that (i) our proposed Bayesian B-splines can be flexible enough fit the true curve of the nonlinear; (ii) Bayesian procedure could well capture the true information of regardless of their true distributions and forms; (iii) BLasso could identify the true model with a high probability.
5. An Example
In this section, we apply the method proposed in the previous sections to the MA.5 research experiment conducted by the Clinical Trial Group of the National Cancer Institute of Canada. The data contains 716 women with early-stage breast cancer before menopause. 356 patients were randomly selected to receive cyclophosphamide, epirubicin, and fluorouracil (CEF) adjuvant chemotherapy as the experimental group. The remaining 360 patients received cyclophosphamide, methotrexate, and fluorouracil (CMF) adjuvant chemotherapy as the control group of the trial. In clinical trials, visits were made before the start of treatment, each of the 6 treatment cycles, and every three months after treatment. At each visit, medical history and physical examination are accepted, and BCQ (Breast Cancer Questionnaire) is used to assess the patient’s quality of life. The dataset has a total of 7807 observations. By the end of the study, a total of 366 patients had died, and the censorship rate was about . For a detailed study of this data, please refer to the literature of Song et al. [22] and Levine et al. [24]. We linearly convert the evaluated BCQ score into a unit interval , and the longitudinal data constrained on the interval is the longitudinal proportion data that we are interested in. The survival time of interest in the trial is the recurrence-free survival time (RFS), which is defined as the time from randomization to disease recurrence. Different treatment options, age, and the number of tumor-positive lymph nodes may directly affect RFS and the quality of life of patients. Similar to Tang et al. [17], we fitted the MA.5 research experiment data set to the following model:
where represents the BCQ score after logit function transformation, is a two-class treatment index, indicates that the i-th patient underwent CEF treatment, indicates that the i-th patient underwent CMF treatment. Age and the number of lymph node metastases are binary variables. Patients who are less than or equal to 40 years old belong to the younger group, that is, . Patients who are older than 40 years old belong to the elderly group, that is, . When the number of lymph node metastases is 0-3, , otherwise it is 1. The nonlinear is estimated by using cubic B-splines function, and the domain of cubic B-splines function is . The prior distributions and the values of all hyperparameters in the case study are the same as those set in the simulation study above. Based on the above settings, we calculated EPSR values for all parameters and are shown in the left panel in Figure 3, which shows that after about 3000 iterations, all EPSR values are less than 1.2. Therefore, we use the 3000 iterations after the 3000th time to calculate the Bayesian estimation. The example analysis results are shown in Table 3.
Inspection of Figure 3 showed that (i) the estimated density of random effects is approximately normally distributed. The distribution settings for random effects in our Simulation III correspond to. This shows that our CDPMM method is effective and reasonable; (ii) the estimated nonlinear function first decreases, then increases and finally stabilizes with time t. Although there are some fluctuations in the tail, this is reasonable and can be ignored. From Table 3, we can see that (i) the risk ratio of randomly receiving CEF and CMF treatment is , which means patients who randomly receive CEF chemotherapy have a lower risk; (ii) the credible interval of does not contain 0, indicating that different adjuvant chemotherapy regimens have a significant impact on the QOL of patients and CEF chemotherapy is more toxic than CMF chemotherapy; (iii) the risk ratio of the number of lymph node metastases greater than or equal to 4 to less than 4 is , which means that the number of lymph node metastases is greater than or equal to 4. The risk of breast cancer recurrence is greater in patients, and the RFS is shorter; (iv)the regression coefficient of the patient’s lymph node metastasis number greater than or equal to 4 is , and its credible interval does not contain 0, which is highly significant. This suggests that patients with more lymph nodes have a lower quality of life, which is also consistent with clinical experience; (v) the risk ratio between the young group and the old group is , which means the risk of breast cancer recurrence is higher and the RFS is shorter in the young group; (vii) the credible interval of does not contain 0, indicating that different ages have a significant impact on the QOL of patients. It indicates that the quality of life of the olderly group is better than that of the young group. (viii) and the credible interval of does not contain 0, which means that is significantly different from 0. This shows that there is a significant correlation between the longitudinal proportional data and survival data, and the JMSRE model proposed in this paper is applicable and reasonable for the analysis of the MA.5 research experiment data.
6. Concluding Remarks
In this paper, a semiparametric joint model for longitudinal proportional data and survival data is proposed by relaxing the normality assumption of random effects and without specifying a nonlinear function that affects longitudinal responses. The advantages of the proposed model include: (i) the proposed method improves the flexibility of jointly modeling longitudinal proportional data and survival data; (ii) the proposed B-splines method can flexibly capture different nonlinear functions; (iii) the proposed CDPMM method can flexibly capture the unimodal, bimodal and multimodal features of random effects; (iv) the computational burden is not heavy, e.g. it takes about 4 minutes to run the replication in the above simulation study and about 2 hours to run the breast cancer dataset.
Our simulation studies and example analysis show that the Bayesian estimation proposed based on the joint model are quite accurate and relatively robust. The nonlinear function curve estimated by Bayesian B-splines is more flexible and can capture the true characteristics of the nonlinear function. And CDPMM method could also well capture the true information of . BLasso method could identify the true model with a high probability. Compared with the method proposed by Song et al. [22] to jointly model longitudinal proportional data and survival data, the joint model proposed in this paper is more flexible.
The joint model of longitudinal proportional data and survival data proposed in this paper still has many unsolved problems and we need to solve the following problems in the future: (i) does not make any constraints on the form of the basic hazard function; (ii) the distribution of random effects does not depend on the normality assumption and still has robust inferences; (iii) consider more complex spline models, for example nodes can be automatically selected to improve the performance of the proposed model; (iv) consider a joint model for the variable longitudinal proportional outcome and the multivariate survival outcome.
Appendix A
Conditional distribution of
Let denotes all unknown parameters associated with distribution of , for . can be iteratively draw by using the following steps:
Step (a) Conditional distribution of given is given by
where and .
Step (b) For , the diagonal elements of is conditionally distributed as
where is the jth element of and is the jth element of .
Step (c) For , is conditionally distributed as
where is the j th diagonal element of .
Step (d) Following Ishwaran and Zarepour [20], given , the conditional distribution of can be given by
where is a random weight sampled from the the following beta distribution.
Step (e) Given L and , the conditional distribution of can be obtained by following generalized Dirichlet distribution:
where for , and is the number of whose value equals to g. is independently generated from a Beta distribution . Then, are obtained from the following formula:
Step (f) Let be the d unique values of (i.e., unique number of “clusters”), for , is conditionally distributed as follows:
where and for . Given , , and .
Step (g) Given g, for , the jth diagonal element of is conditionally distributed as
where is the jth element of and is the jth element of . Given , and .
Step (h) Given , the conditional distribution of is obtained by
where is proportional to with , and are sampled from step (e). Given , and , the prior of is distributed as with and being the elements of sets and , respectively.
Step (i) The conditional distribution is non-standard and cannot be derived directly via Gibbs sampling for . Specially,
The Metropolis-Hastings algorithm used to sample is implemented as follows. At the mth iteration with a current value , a new candidate is drawn from the normal distribution , where and . The new is accepted with probability
where represents the remaining random effects except the random effects of the ith individual. The variance can be chosen such that the average acceptance rate is approximately 0.25 or more.
References
- Faucett, C.L.; Thomas, D.C. Simultaneously modelling censored survival data and repeatedly measured covariates: a gibbs sampling approach. Stat. Med. 1996, 15, 1663–1685. [Google Scholar] [CrossRef]
- Wulfsohn, M.S.; Tsiatis, A.A. A Joint model for survival and longitudinal data measured with error. Biometrics 1997, 53, 330–339. [Google Scholar] [CrossRef] [PubMed]
- Schluchter, M.D. Methods for the analysis of informatively censored longitudinal data. Stat. Med. 1992, 11, 1861–1870. [Google Scholar] [CrossRef] [PubMed]
- Tsiatis, A.A.; Degruttola, V.; Wulfsohn, M.S. Modeling the relationship of survival to longitudinal data measured with error: applications to survival and CD4 counts in patients with AIDS. J. Am. Stat. Assoc. 1995, 90, 27–37. [Google Scholar] [CrossRef]
- Tsiatis, A.A.; Davidian, M. Joint modeling of longitudinal and time-to-event data: an overview. Stat. Sin. 2004, 14, 809–834. [Google Scholar] [CrossRef]
- Yu, M.; Law, N.J.; Taylor, J.M.G.; Sandler, H.M. Joint longitudinal-survival-cure models and their application to prostate cancer. Stat. Sin. 2004, 14, 835–862. [Google Scholar] [CrossRef]
- Diggle, P.J.; Sousa, I.; Chetwynd, A.G. Joint modelling of repeated measurements and time-to-event outcomes: the fourth armitage lecture. Stat. Med. 2008, 27, 2981–2998. [Google Scholar] [CrossRef] [PubMed]
- Lawrence, A.; Gould, *!!! REPLACE !!!*; et al. Joint modeling of survival and longitudinal non-survival data: current methods and issues. Stat. Med. 2015, 34, 2181–2195. [Google Scholar] [CrossRef]
- Henderson, R.; Diggle, P.; Dobson, A. Joint modelling of longitudinal measurements and event time data. Biostatistics 2000, 1, 465–480. [Google Scholar] [CrossRef]
- Zeng, D.; Cai, J. Simultaneous modelling of survival and longitudinal data with an application to repeated quality of life measures. Lifetime Data Analysis 2005, 11, 151–174. [Google Scholar] [CrossRef]
- Tang, A.; Zhao, X.; Tang, N. Bayesian variable selection and estimation in semiparametric joint models of multivariate longitudinal and survival data. Biom. J. 2017, 59, 57–78. [Google Scholar] [CrossRef] [PubMed]
- Song, P.X.; Tan, M. Marginal models for longitudinal continuous proportional data. Biometrics 2000, 56, 496–502. [Google Scholar] [CrossRef] [PubMed]
- Tibshirani, R. Regression shrinkage and selection via the lasso. J. R. Stat. Soc. B. 1996, 58, 267–288. [Google Scholar] [CrossRef]
- Park, T.; Casella, G. The Bayesian Lasso. J. Am. Stat. Assoc. 2008, 103, 681–686. [Google Scholar] [CrossRef]
- Hans, C. Bayesian lasso regression. Biometrika 2009, 96, 835–845. [Google Scholar] [CrossRef]
- Guo, R.; Zhu, H.; Chow, S.M.; Ibrahim, J.G. Bayesian Lasso for semiparametric sructural equation models. Biometrics 2012, 68, 567–577. [Google Scholar] [CrossRef]
- Tang, A.; Zhao, X.; Tang, N. Bayesian variable selection and estimation in semiparametric joint models of multivariate longitudinal and survival data. Biom. J. 2017, 59, 57–78. [Google Scholar] [CrossRef]
- Ohlssen, D.I.; Sharples, L.D.; Spiegelhalter, D.J. Flexible random effects models using Bayesian semiparametric models: applications to institutional comparisons. Stat. Med. 2007, 26, 2088–2112. [Google Scholar] [CrossRef]
- Yang, M.; Dunson, D.B.; Baird, D. Semiparametric bayes hierarchical models with mean and variance constraints. Comput. Stat. Data. Anal. 2010, 54, 2172–2186. [Google Scholar] [CrossRef]
- Ishwaran, H.; Zarepour, M. Markov chain monte carlo in approximate dirichlet and beta two-parameter process hierarchical models. Biometrika 2000, 87, 371–390. [Google Scholar] [CrossRef]
- Chow, S.; Tang, N.; Yuan, Y.; Song, X.; Zhu, H. Bayesian estimation of semiparametric nonlinear dynamic factor analysis models using the Dirichlet process prior. Br. J. Math. Stat. Psychol. 2011, 64, 69–106. [Google Scholar] [CrossRef] [PubMed]
- Song, H.; Peng, Y.; Tu, D. Jointly modeling longitudinal proportional data and survival times with an application to the quality of life data in a breast cancer trial. Lifetime Data Analysis 2017, 23, 183–206. [Google Scholar] [CrossRef] [PubMed]
- Levine, M.; Bramwell, V.; Pritchard, K.; et al. Randomized trial of intensive cyclophosphamide, epirubicin, and fluorouracil chemotherapy compared with cyclophosphamide, methotrexate, and fluorouracil in premenopausal women with node-positive breast cancer. J. Clini. Oncol. 1998, 16, 2651–2658. [Google Scholar] [CrossRef] [PubMed]
- Tang, A.; Duan, X.; Zhao, Y. Bayesian variable selection and estimation in semiparametric simplex mixed-effects models with longitudinal proportional data. Entropy 2022, 24, 1466. [Google Scholar] [CrossRef]
Figure 1.
EPSR values of all parameters against iteration numbers for a randomly selected replication in Simulation I (left panel), Simulation II (middel panel) and Simulation III (right panel).
Figure 1.
EPSR values of all parameters against iteration numbers for a randomly selected replication in Simulation I (left panel), Simulation II (middel panel) and Simulation III (right panel).

Figure 2.
Estimated versus trues of nonlinear function (upper panels,) and estimated versus true denisties for random effects (lower panels) in Simulation I (left panel), Simulation II (middel panel) and Simulation III (right panel).
Figure 2.
Estimated versus trues of nonlinear function (upper panels,) and estimated versus true denisties for random effects (lower panels) in Simulation I (left panel), Simulation II (middel panel) and Simulation III (right panel).
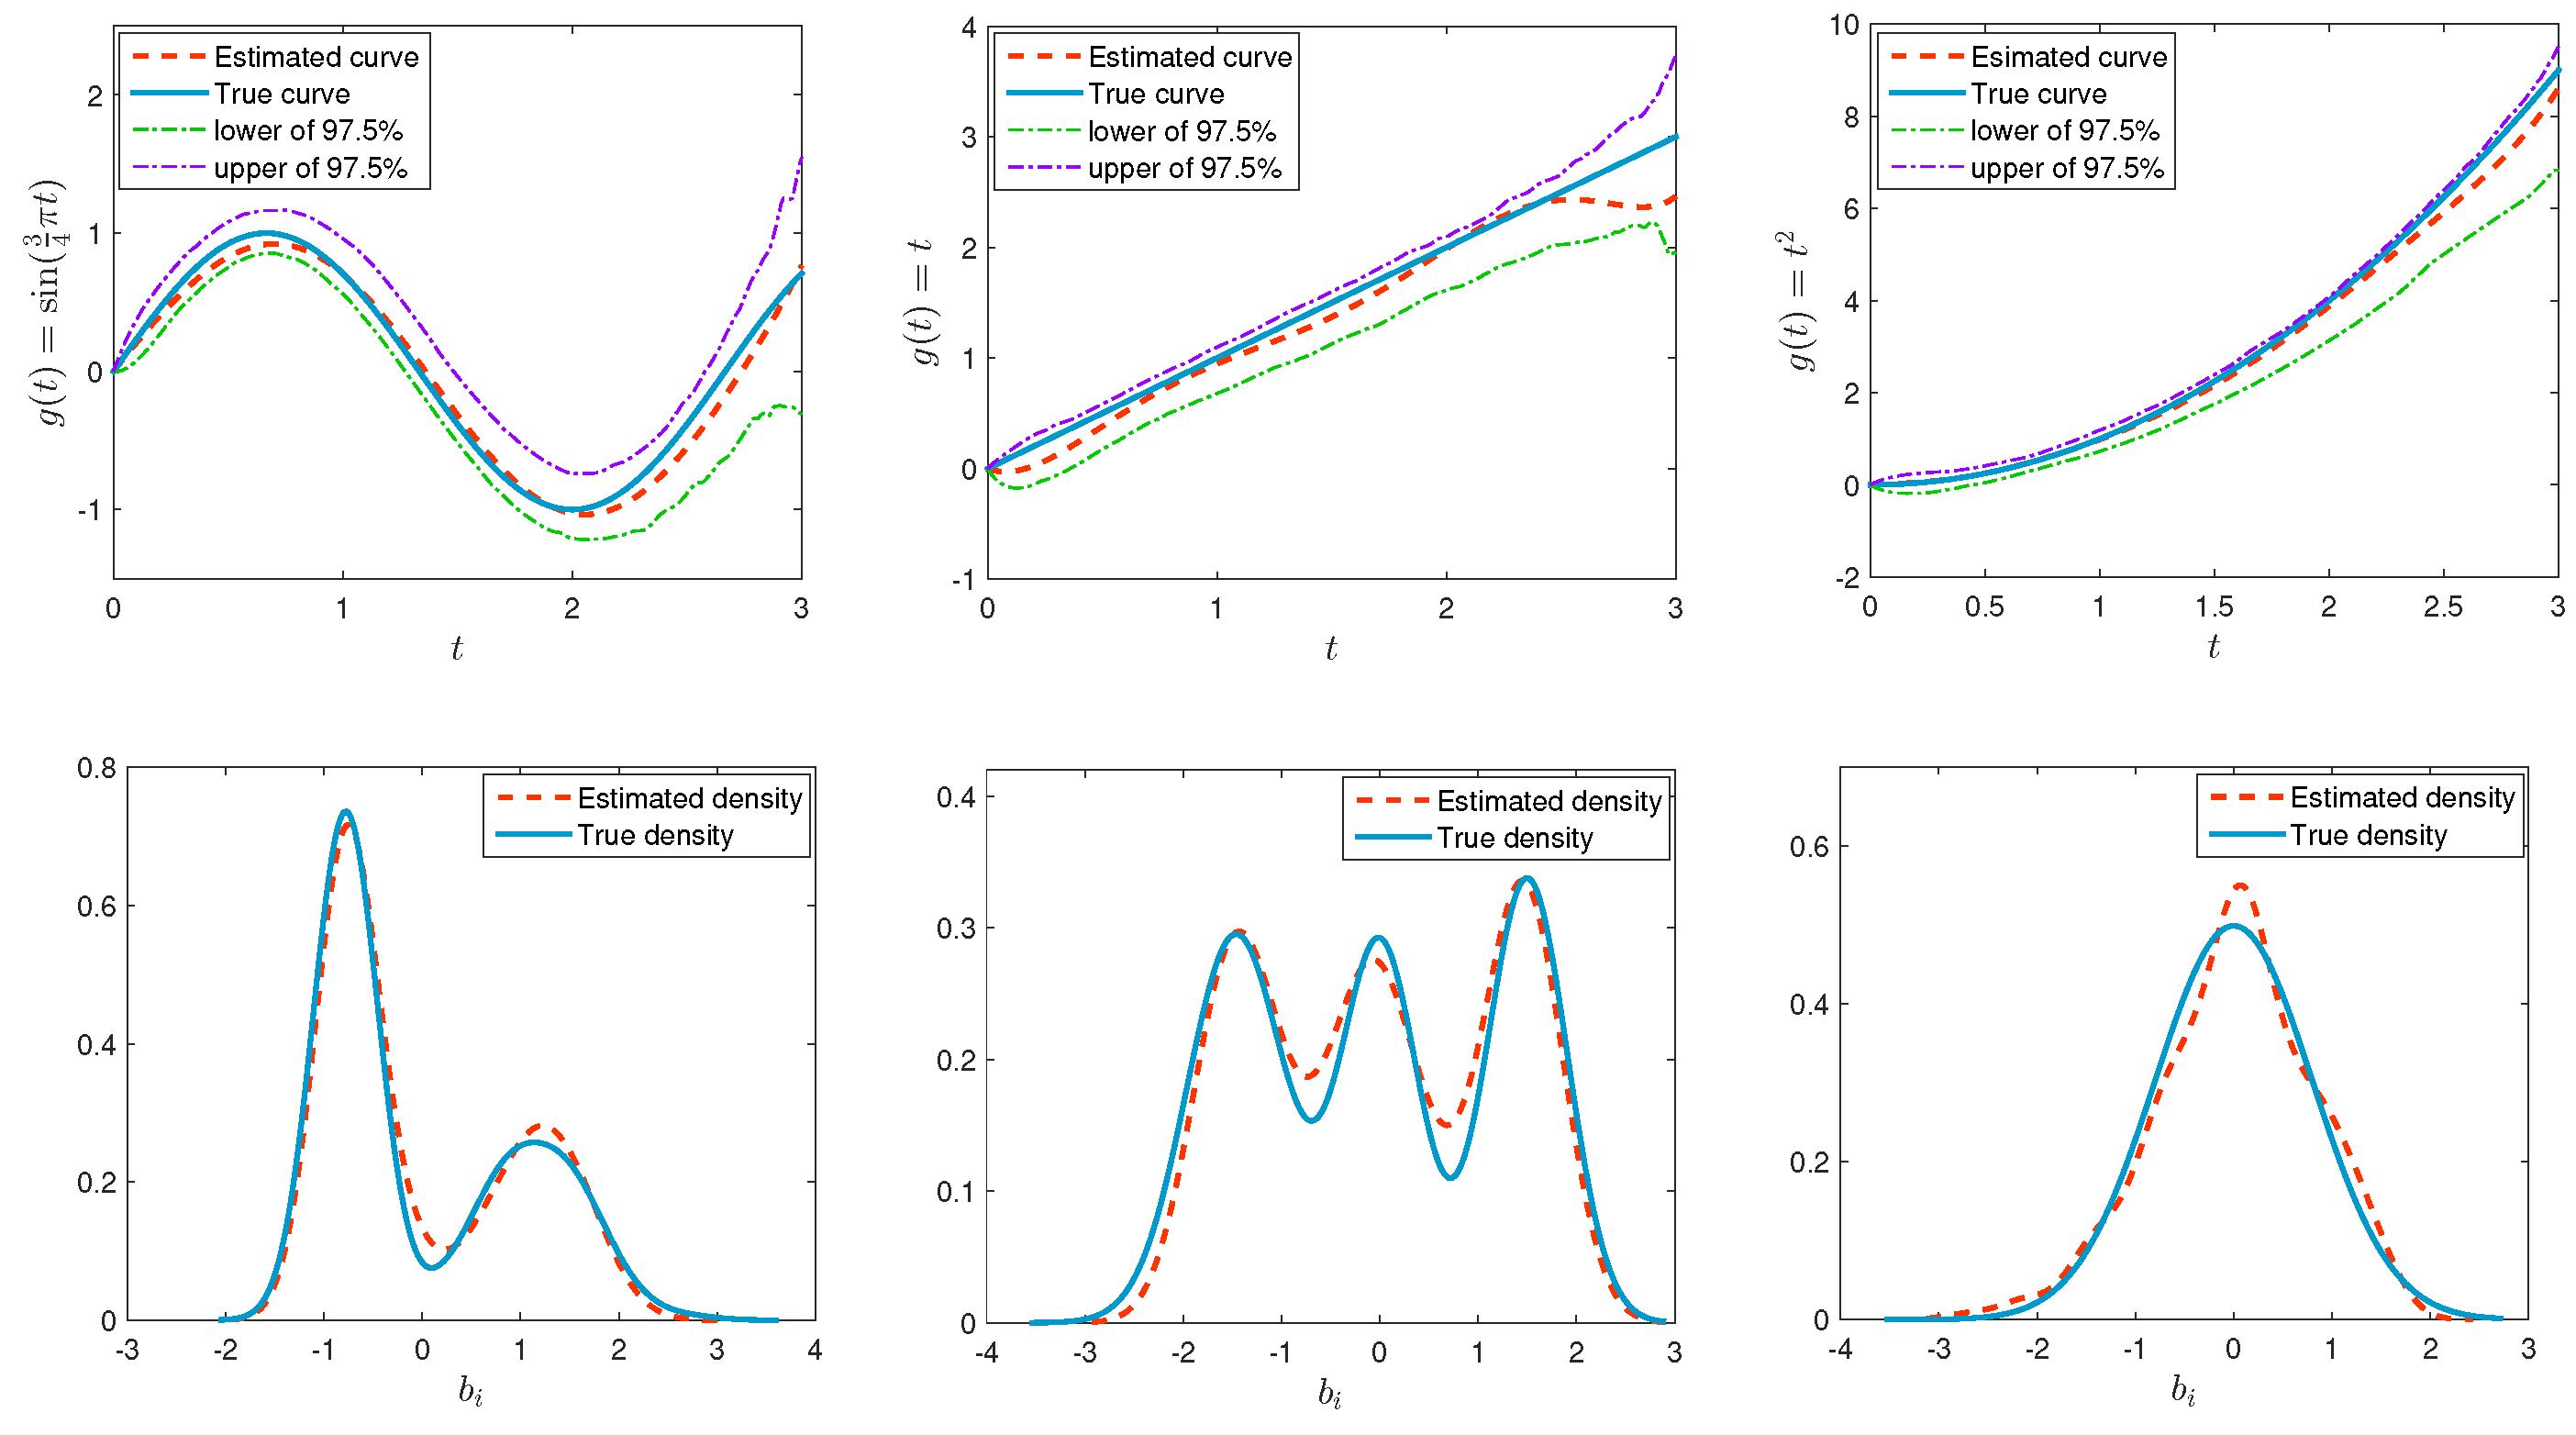
Figure 3.
EPSR values of all parameters (left panel), estimated curve for nonlinear function (middle panel) and estimated density for random effects (right panel) in the the MA.5 research experiment study.
Figure 3.
EPSR values of all parameters (left panel), estimated curve for nonlinear function (middle panel) and estimated density for random effects (right panel) in the the MA.5 research experiment study.
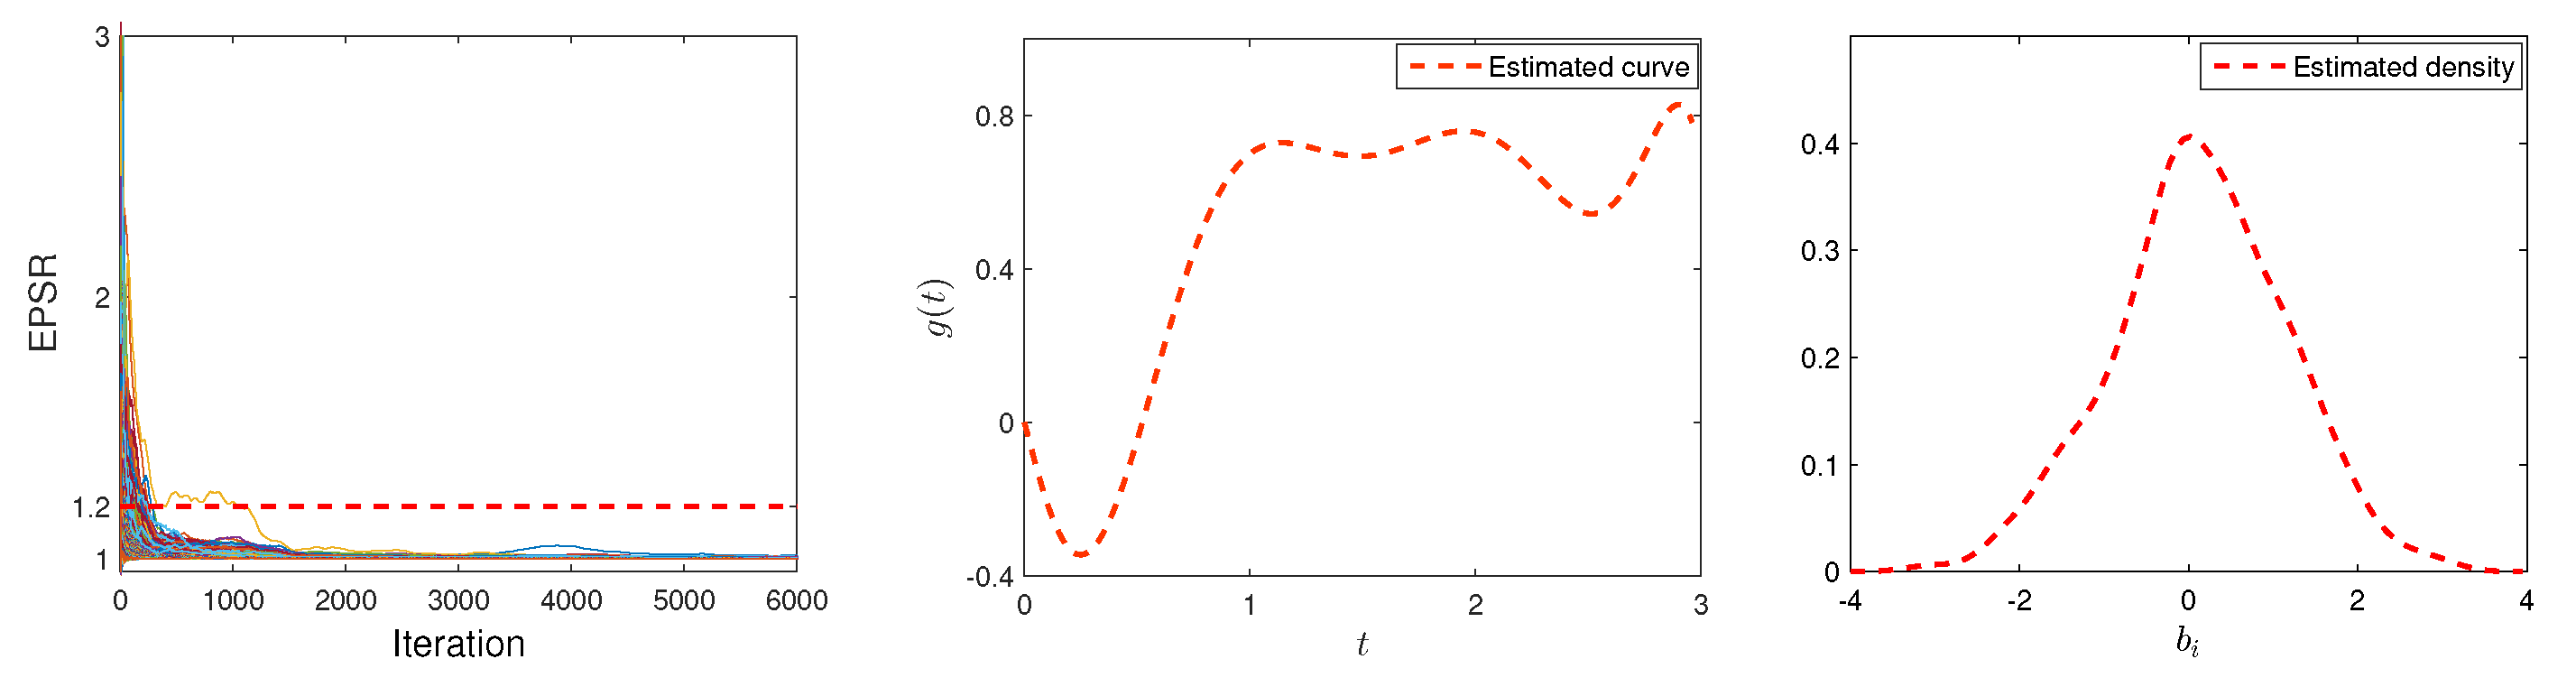

Table 1.
Bayesian estimates of parameters in the simulation studies.
| Pra. | True | Simulation I | Simulation II | Simulation III | |||||||
|---|---|---|---|---|---|---|---|---|---|---|---|
| Bias | RMS | F0(%) | Bias | RMS | F0(%) | True | Bias | RMS | F0(%) | ||
| 1.00 | -0.005 | 0.058 | 0.0 | -0.080 | 0.112 | 0.0 | 1.00 | -0.015 | 0.104 | 0.0 | |
| 0.00 | 0.002 | 0.036 | 99.0 | 0.001 | 0.049 | 98.0 | 0.50 | -0.009 | 0.077 | 0.0 | |
| 0.00 | -0.002 | 0.033 | 99.0 | 0.005 | 0.042 | 99.5 | -0.50 | 0.011 | 0.085 | 0.0 | |
| -0.50 | 0.005 | 0.041 | 0.0 | 0.003 | 0.056 | 0.0 | -0.50 | 0.001 | 0.079 | 0.0 | |
| 0.50 | -0.001 | 0.037 | 0.0 | -0.009 | 0.063 | 0.0 | 0.50 | 0.000 | 0.083 | 0.0 | |
| -1.00 | 0.013 | 0.066 | 0.0 | 0.006 | 0.091 | 0.0 | -1.00 | 0.028 | 0.136 | 0.0 | |
| 0.00 | 0.010 | 0.120 | 95.5 | -0.004 | 0.105 | 98.0 | -0.50 | 0.002 | 0.125 | 0.5 | |
| 1.00 | 0.001 | 0.148 | 0.0 | -0.052 | 0.144 | 0.0 | 1.00 | -0.008 | 0.141 | 0.0 | |
| -0.50 | 0.018 | 0.138 | 5.0 | 0.039 | 0.136 | 6.5 | -0.50 | 0.008 | 0.127 | 2.5 | |
| 0.00 | -0.002 | 0.197 | 97.0 | 0.010 | 0.178 | 97.5 | 1.00 | -0.007 | 0.191 | 0.0 | |
| 0.60 | 0.006 | 0.106 | 0.0 | -0.019 | 0.088 | 0.0 | 0.60 | -0.002 | 0.145 | 1.0 | |
| 0.36 | -0.002 | 0.018 | – | -0.001 | 0.019 | – | 0.36 | 0.005 | 0.020 | – | |
Table 2.
Estimated mean and standard deviation for random effects, and quantiles of mean RASE for nonlinear functions and random effects.
Table 2.
Estimated mean and standard deviation for random effects, and quantiles of mean RASE for nonlinear functions and random effects.
| Est of random effects | Quantile of RASE | ||||||
|---|---|---|---|---|---|---|---|
| Mean | Est mean | SD | Est SD | 25% | 50% | 75% | |
| Simulation I | -0.011 | -0.007 | 1.004 | 0.961 | 0.091 | 0.115 | 0.138 |
| Simulation II | -0.023 | 0.014 | 1.268 | 1.202 | 0.135 | 0.181 | 0.239 |
| Simulation III | -0.001 | -0.001 | 0.879 | 0.797 | 0.109 | 0.152 | 0.227 |
Table 3.
Bayesian estimatations of parameters in the MA.5 research experiment study.
| Par. | Est | SD | CI |
|---|---|---|---|
| 0.241 | 0.038 | ( 0.171, 0.321) | |
| 0.309 | 0.050 | ( 0.214, 0.414) | |
| 0.263 | 0.046 | ( 0.168, 0.344) | |
| -0.334 | 0.142 | (-0.608,-0.057) | |
| 0.719 | 0.143 | ( 0.452, 0.999) | |
| 0.600 | 0.145 | ( 0.315, 0.880) | |
| 0.259 | 0.135 | ( 0.003, 0.542) | |
| 0.180 | 0.003 | ( 0.174, 0.186) |
Disclaimer/Publisher’s Note: The statements, opinions and data contained in all publications are solely those of the individual author(s) and contributor(s) and not of MDPI and/or the editor(s). MDPI and/or the editor(s) disclaim responsibility for any injury to people or property resulting from any ideas, methods, instructions or products referred to in the content. |
© 2023 by the authors. Licensee MDPI, Basel, Switzerland. This article is an open access article distributed under the terms and conditions of the Creative Commons Attribution (CC BY) license (http://creativecommons.org/licenses/by/4.0/).
Copyright: This open access article is published under a Creative Commons CC BY 4.0 license, which permit the free download, distribution, and reuse, provided that the author and preprint are cited in any reuse.


