Submitted:
06 July 2023
Posted:
07 July 2023
You are already at the latest version
Abstract
Air pollution is related to the development of people's livelihood. As one of the main pollutants in the air, formaldehyde affects people's physical and mental health. In order to remove formaldehyde and better protect the health of residents, it is very necessary to develop efficient adsorption materials. In this study, a cellulose composite aerogel Microcrystalline Cellulose/ N-(2- aminoethyl) -3- aminopropyl methyl dimethoxysilane (MCC/APMDS) modified by APMDS was explored. The pore volume and specific surface area of the modified aerogel decreased, the average pore diameter increased, and the adsorption capacity of formaldehyde was stronger. The adsorption experiment shows that the sample prepared under the conditions of APMDS dosage of 6 wt%, reaction time of 4 h and reaction temperature of 90℃ has the largest average pore size (14.56 nm) and the largest formaldehyde adsorption capacity (9.52 mg/g). The excellent adsorption of the composite aerogel is due to high porosity and rich active amino groups on the surface. This study provides valuable information for the preparation of adsorption materials with high formaldehyde adsorption capacity for air purification.
Keywords:
Cellulose
; Aerogel
; Adsorption
; Formaldehyde
1. Introduction
According to research, per capita indoor stay time usually exceeds 90%[1,2,3,4]. Formaldehyde is the poster child for indoor pollutants, and more than 65% of formaldehyde is used in the production of synthetic resins in building materials[5]. There is a significant evidence that formaldehyde has a positive and important effect on the development of nasopharyngeal cancer[6,7,8]. Indoor formaldehyde pollution sources are widespread. Such as, urea-formaldehyde resins, melamine resins, phenolic resins used as adhesives for furniture boards[9,10,11] paint, lampblack and smoking in home kitchens[12] are the most common sources[13]. In addition, it will make the indoor crowd feel headache, nausea, mucosal inflammation, nasopharynx, eye and throat irritation, asthma, asthma, allergic rhinitis and eczema, fatigue, etc[13,14]. Long-term inhalation of formaldehyde can also lead to low learning and work efficiency, and have an unfavorable effect on the physical and mental health of residents[15,16,17].
So far, several indoor formaldehyde removal strategies have been developed, such as adsorption, plasma-catalyzed decomposition, photo catalytic degradation, and plant purification methods. Adsorption is one of the most convenient methods for indoor formaldehyde removal, its advantages mainly lie in its fast removal rate, high efficiency, simple operation, energy saving and low cost. Usually, adsorption methods are divided into physical adsorption and chemical adsorption. Physical adsorption relies on weak inter molecular forces between the adsorbent and formaldehyde, and therefore, its stability is poor. In contrast, chemisorption relies on the surfactant functional group of the adsorbent forming a strong chemical bond with HCHO. As a result, it is highly stable and selective. Therefore, many adsorbents, such as SiO2[18,19], Al2O3[20], MOFs[21], and microporous carbonaceous materials[22,23], have been widely studied for indoor formaldehyde adsorption and removal. In recent years, various novel materials, such as active carbon fibers (ACFs), carbon nanotubes (CNTS), graphene, metal-organic skeletons (MOF), and porous organic polymers (pops)[7,9,22,24,25], have been introduced as an effective adsorbent for removing HCHO. The adsorption performance of nitrogen-containing porous materials for HCHO is better than that of common adsorbents, and the adsorption performance is closely related to the type and content of surface nitrogen[26]. Therefore, surface modification of adsorbent is an effective way to improve adsorption capacity by increasing the adsorption active site and selectivity of HCHO.
Amino modified cellulose aerogel adsorbents show high adsorption capacity of HCHO. APMDS is often used for functionalization of cellulose nanofibers to enhance the adsorption capacity of cellulose aerogel. APMDS modified cellulose aerogel are usually achieved through two different pathways. One is the synthesis of amino-silanized cellulose by freeze-drying cellulose and APMDS suspension, and the preparation of amino-silanized cellulose aerogel. Li[27] Et al. reacted CNF suspension with APMDS suspension to prepare APMDS-modified CNF, and finally prepared modified CNF aerogel through ultrasonic treatment and freeze-drying. Another approach is to functionalize cellulose hydrogels or cellulose membranes in APMDS solution and then proceed with supercritical carbon dioxide drying or freeze-dried to prepare it. Zhang[28] Et al. reacted the prepared cellulose hydrogel spheres in 12 w t% APMDS solution for 12 hours (100℃) and finally obtained amino modified A-NCC aerogel by freeze-drying.
Compared with traditional adsorption materials, nano-cellulose-based aerogel have better adsorption capacity, and their adsorption performance for formaldehyde can be further improved by means of amino functionalization. As an adsorbent, nano-cellulose-based aerogel are a potential field for current and future research.
2. Preparation of MCC/APMDS composite aerogel
Dissolving 0.1 g microcrystalline cellulose in 5 g 60 w t% LiBr solution (1: 100), we magnetically stirred it until evenly dispersed. We then heated it in a 140℃ oil bath on high for 20 min until a clear homogeneous solution was formed. We poured the hot cellulose suspension into the mold, and then used an ultrasonic cleaner to remove air bubbles from the cellulose suspension. After that, we cooled it to room temperature to form a gel. We soaked the formed gel in deionized water and rinsed it with excessive deionized water until lithium bromide could not be detected by using silver nitrate solution. The gel was then solvent displaced using ethanol and tert-butanol, trying to replace the water in the hydrogel with tert-butanol. Finally, it was frozen in an ultra-low temperature freezer at -80℃ for 12 h. After taking out the frozen sample, we placed it in a freeze dryer to get cellulose aerogel.
The cellulose hydrogels and tert-butanol (mass ratio 1: 4) prepared above were placed in a 250 ml round-bottomed flask and the pH of the mixture was adjusted to 4-5 by adding acetic acid to facilitate the hydrolysis of APMDS. Then, a certain amount of APMDS (0, 2, 4, 6, and 8 w t%, based on the total mass of the cellulose hydrogel and tert-butanol mixture) was added to this mixture and the mixture was reacted at 90℃ for 4 h. After the reaction was completed, the APMDS and its self-condensation were removed by repeated washing three to five times with the tert-butanol solution, while solvent replacement was carried out, and the gel after solvent replacement was freeze-dried for 24 h to obtain MCC/APMDS composite aerogel. The above composite aerogel modified by APMDS with different mass fractions (2, 4, 6 and 8 w t%) were denoting as ACC-1, ACC-2, ACC-3 and ACC-4, respectively. The aerogel prepared with mass fraction 0 w t% were denoting as CAB aerogel.
According to the above method, 6 w t% APMDS was added to the mixture solution of cellulose hydrogel and tert-butanol (mass ratio 1: 4). The reaction temperature was controlled at 90℃, and the reaction time was set as 1, 2, 3, 4, and 5 h. After the reaction was completed, the MCC/APMDS composite aerogel with different reaction times (1, 2, 3, 4, 5 h) was washed, solvent replacement was carried out, and the gel after solvent replacement was freeze-dried in accordance with the above methods to obtain ACC-1h, ACC-2h, ACC-3h, ACC-4h, and ACC-5h, respectively.
Also according to the above method, 6 w t% APMDS was added to the mixture solution of cellulose hydrogel and tert-butanol (mass ratio 1: 4). The reaction time was controlled as 4 h, and the reaction temperature was set as 60, 70, 80, 90, and 100℃. After the reaction was completed, the MCC/APMDS composite aerogel with different reaction temperatures (60, 70, 80, 90, and 100℃) was washed, solvent replacement was carried out, and the gel after solvent replacement was freeze-dried according to the above methods. Finally, the composite aerogel was obtained as ACC-60, ACC-70, ACC-80, ACC-90, and ACC-100, respectively.
3. Characterization details
The morphology of the sample was observed by scanning electron microscope (JSM 7600F), where the current was 10 μ A, and the acceleration voltage was 5 kV. The structure of the sample was analyzed by an infrared spectrometer, where the scanning range was 4000 ~ 400 cm-1, and the resolution was 4 cm-1. After drying the aerogel sample at 60 ℃ for 12 h, the pore structure of the sample was determined by a specific surface area and porosity meter (ASAP 2020). X-ray diffractometer (D/max-2500VL/PC) was used to characterize the crystalline state of the corresponding aerogel samples and cellulose raw materials, where the acceleration voltage was 40 KV, the current was 50 mA, the scanning speed was 4 °/min, and the scanning range was 5° ~ 40°. The thermal stability of the corresponding aerogel samples and cellulose samples was analyzed by a thermos gravimetric analyzer (NETZSCH STA409PC), where the heating rate was 10 K/min, and the measuring range was 40 ~ 600 ℃. X-ray photoelectron spectroscopy (THERMO) was used to analyze the surface of cellulose aerogel samples before and after modification.
4. Analysis of adsorption of gaseous formaldehyde
The static adsorption experiment of gaseous formaldehyde was carried out on the prepared sample at room temperature. The 0.05 g aerogel sample was weighed and then dried in a vacuum drying oven at 80℃ for 12 h. We then put it into the transition chamber of the glove box (170 L). Weighing 20 mg of paraformaldehyde, we put it into a round-bottomed flask, heat it at 70℃ in a water bath for 1 h, and pass the formaldehyde gas generated by the reaction into the reaction chamber of a box. After the concentration of gaseous formaldehyde in the reactor became stable for 1 h, we opened the transition chamber and placed the weighed aerogel sample in the reaction chamber for adsorption. We placed the portable formaldehyde detector (PPM HTV in the UK) in the reaction chamber of the glove box in advance. After the aerogel sample began to adsorb, the sampling interval was 30 min in the early stage and 60 min in the late stage of adsorption. We then determined the concentration of formaldehyde and calculated the adsorption amount. The adsorption amount of formaldehyde was calculated using the following formula:
In the formula: is the adsorption amount of formaldehyde at t time, mg/g; and are the initial concentration and time concentration of formaldehyde, mg/m3; is the mass of aerogel, mg; is the volume of glove box, m3.
5. Results and discussion
5.1. SEM analysis
Figure 1 shows a comparison of microscopic morphology observed by SEM between CAB aerogel (Fig. a) and ACC-3 (Fig. b) composite aerogel. It can be seen that the addition of APMDS did not significantly change the shape of the internal structure of the cellulose aerogel. The aerogel samples all showed a three-dimensional network structure with irregularly shaped Nano-scale pores. The aerogel observed in the Figure 1 are highly porous, indicating that the pore morphology did not collapse during processing. CAB aerogel have a low density (21.8 mg/cm3) and high porosity (98.2%), compared with the uniform porosity of CAB aerogel, as the introduction of APMDS, a large number of pores in aerogel are blocked and cross linked, forming a flaky structure. This phenomenon may be due to the introduction of APMDS, which promotes the aggregation of cellulose during freezing and requires a certain space for the cross linking and aggregation of amine loaded groups. Thereby causing the pores to be blocked.
5.2. N2 Sorption Isotherms and BET analysis, FT-IR analysis, XRD analysis
FT-IR diagram of CAB and MCC/APMDS composite aerogel(c); XRD diagram of CAB and MCC/APMDS composite aerogel(d).
As shown in Figure 2a, similar isotherm curves were obtained, and the aerogel before and after modification had H1-type retention rings of type IV isotherms, indicating the typical mesoporous structure of aerogel. P /P0 formed a large retention ring structure in the range of 0.8 to 1.0, which revealed the existence of mesoporous structure in aerogels, with abundant mesoporous and microporous. In addition, the pore size distribution curve shown in Figure 2b shows that the pore size of the aerogel before and after modification is concentrated in the range of 2-20 nm, and the peak value of the MCC/APMDS composite aerogel moves to the left compared to the CAB aerogel. It is possible due to the change in pore structure distribution resulting from the grafting of APMDS to the cellulose chain. After APMDS was grafted onto cellulose, the specific surface area and pore distribution of aerogel were changed. After APMDS modification, the pore volume and specific surface area of the aerogel were reduced. By using BJH and BET methods to calculate the characteristics of pore parameters, it is concluded that the specific surface area and pore volume of CAB aerogel and ACC-3 aerogel are 127.1 m2/g and 0.272 cm3/g, 102.8 m2/g and 0.212 cm3/g, respectively. The average pore size of the modified aerogel increases from 12 nm to 14.56 nm, meaning that some microporous may be covered. The results are consistent with those obtained from the examination of SEM images.
As shown in Table 1, the aerogel before and after modification belong to lightweight materials with high porosity. However, the density of the aerogel after amination modification with APMDS increases and its porosity decreases. This may be because the introduction of APMDS leads to the increase of the mass of cellulose aerogel, the blockage of the pores inside aerogel and the decrease of the spatial structure, which leads to the increase of the density and the decrease of the porosity of the modified aerogel.
Figure 2c shows the FTIR spectra of CAB aerogel and the aerogel modified with APMDS. As shown, the infrared absorption spectra of both modified and unmodified aerogel show bands typical of cellulose. For example, the broad absorption peak at 3430 cm−1 is the stretching vibration peak of hydroxyl groups between cellulose molecules. The absorption peak near 2926 cm−1 is the stretching vibration peak of C-H, and the bending vibration peak of -CH2 is the absorption peak near 1429 cm−1. The absorption peak near 1163 cm−1 is the asymmetric stretching vibration peak of C-O-C ether in the pyran ring. The absorption peak around 1060 cm−1 can be attributed to the absorption vibration peak of C-O. These results show that aerogel modified by APMDS are still the matrix materials of cellulose.
In addition, some important changes in the infrared spectrum were observed after modification with APMDS compared to the IR spectra of CAB aerogel. There is a new peak at 1261cm-1, which is usually related to C−O−Si tensile vibration. Due to the introduction of the N−H bond after modification, with the increase of APMDS concentration, the band intensity around 2926 cm−1 increases. In addition, two new bands were observed at 795 and 1575 cm−1, which were attributed to N-H bending vibration and N-H stretching vibration of −NH2 after amination. All these results showed that APMDS was successfully grafted onto CNF, and the primary amine group of APMDS remained intact.
Figure 2d shows the XRD curves of CAB and ACC-3 aerogel samples. It can be seen from the Figure 2d that diffraction peaks at 2θ =12.1° and 20.2°, and these diffraction peaks correspond to the crystal plane of type Ⅱ cellulose respectively. The characteristic curves of ACC-3 aerogel show the characteristic peaks of cellulose. This indicates that the crystal structure of cellulose was not changed by the introduction of APMDS.
5.3. XPS analysis, TG analysis
Figure 3 shows the XPS spectra using CAB and MCC/APMDS composite aerogel respectively. It can be seen from the broad sweep spectra that amino silane grafting reaction occurred in MCC/APMDS composite aerogel after modification with APMDS, and Si element appeared in the broad sweep spectra, which is consistent with the results of infrared analysis. The low resolution spectra of the unmodified CAB aerogel showed that C and O atoms were the main components in the aerogel, while N and Si silicon elements were detected in the modified aerogel, indicating successful grafting of APMDS with cellulose. As can be seen from the high-resolution maps of C1s and N1s of ACC-3 (illustration of Figure 3b), there are four types of carbon bonds: C-C (C1, 284.8eV), C-O (C2, 286.4eV), O-C-O (C3, 287.8eV) and C-N (C4, 288.9eV), respectively. Presence of the N element is divided into two forms, namely -NH2 and -NH3 +. This indicated that the primary amino group was protonated during chemical grafting.
As shown in Figure 3c, MCC/APMDS composite aerogel has two thermal degradation processes. The first thermal degradation process is between 50℃ and 180℃. In this temperature range, cellulose aerogel has slight thermal degradation, and the absorbed water inside the aerogel overflows, resulting in slight mass loss. Thermal degradation was observed between 200 °C and 400°C, which may be related to the breaking of cellulose glycosides bonds, the inside of aerogel collapsed and degraded, which produced a lot of water and gas, and then cellulose aerogel lost a lot of weight. The weight loss residual amount of the aerogel modified with APMDS is larger than that of CAB aerogel. At the same time, with the increase of the use of APMDS, the greater the content of nitrogen, the greater the weight loss residual amount, which may be due to the possible existence of Si element in APMDS that the modified CNC aerogel generate refractory substances, such as SiO2, during thermal degradation, thus increasing the thermal degradation residues of aerogel. Because the higher the content of nitrogen, the more refractory substances it produces, so the weight loss residue of MCC/APMDS composite aerogel is increasing, and the maximum residue reaches 25.6%. The results also indirectly indicated that AEAPMDS was successfully grafted onto cellulose. In addition, the thermos gravimetric curve of modified aerogel is much smoother than that of unmodified aerogel, probably because the introduction of APMDS makes the chemical bond energy of CAB aerogel increase, which requires higher thermal degradation energy and the degradation process is more moderate.
5.4. Effect of different reaction conditions on nitrogen content of MCC/APMDS composite aerogel samples
Single factor method was used to investigate the effects of APMDS dosage (based on the total mass of the mixture solution), reaction time and reaction temperature on the nitrogen content of MCC/APMDS composite aerogel. At the same time, the nitrogen content of MCC/APMDS composite aerogel samples was detected by X-ray photoelectron spectroscopy, and the final results were obtained as shown in Figure 3d.
Figure 3d shows the effect of APMDS usage on nitrogen content of MCC/APMDS composite aerogel when the reaction time is 4 h and the reaction temperature is 90℃. It can be seen from the Figure 3d that with the increase of the amount of APMDS added, the nitrogen content of the sample increases rapidly. However, when the amount of APMDS was greater than 6%, there was almost no increase in nitrogen content. This may be because the higher amount of APMDS may lead to the rapid formation of APMDS self-condensation polymer, which is not conducive to the reaction of APMDS with cellulose. Therefore, nitrogen content increased slowly after the application of 6wt% APMDS. The results showed that the appropriate amount of APMDS was 6wt% and the nitrogen content of MCC/APMDS composite aerogel reached 8.98 w t% when 6wt% APMDS was used.
Figure 3e shows the effect of reaction time on nitrogen content of MCC/APMDS composite aerogel when the amount of APMDS is 6wt% and the reaction temperature is 90℃. As shown in Figure 3e, nitrogen content of MCC/APMDS composite aerogel increased rapidly with the increase of reaction time before 3h. But at 4h, they almost all reached their own plateau. This may be because before the reaction time of 3h, due to the reaction of a large number of reactive hydroxyl groups on cellulose and high content of free amino s silanols formed by hydrolysis of APMDS in the reaction medium, the content of nitrogen elements increases rapidly. After the reaction time reaches 4 h, the reactive hydroxyl groups or APMDS reactions on cellulose are exhausted. As a result, the nitrogen content of MCC/APMDS composite aerogel remained constant after 4 h of reaction. The results showed that the nitrogen content of MCC/APMDS composite aerogel reached the maximum when the reaction time was 4 h.
Figure 3f shows the effect of reaction temperature on nitrogen content of MCC/APMDS composite aerogel when the amount of APMDS is 6wt% and the reaction time is 4 h. When the reaction temperature is lower than 70℃, the nitrogen content of MCC/APMDS composite aerogel increases very slowly with the increase of temperature. However, they increase significantly after 70℃ until the reaction temperature rises to 90℃. After 90℃, little effect of reaction temperature on amine load was observed. This is because APMDS is prone to hydrolysis to form amino silanols even at room temperature, so the results suggest that temperatures higher than 70℃ are needed to facilitate the reaction of amino silanols with hydroxyl groups on cellulose. The rapid increase in the nitrogen content of the MCC/APMDS composite aerogel after the reaction temperature was 70℃ may be due to the increase in temperature, which increases the rate constant of the reaction of APMDS with the hydroxyl group on the cellulose. At temperatures greater than 90℃, the nitrogen content of MCC/APMDS composite aerogel has little effect. These results indicate that the optimum temperature is 90℃.
From the above results, it can be seen that the nitrogen content of MCC/APMDS composite aerogel reaches its maximum when the amount of APMDS is 6wt%, the reaction time is 4 h, and the reaction temperature is 90℃.
5.5. Formaldehyde adsorption performance analysis
The adsorption results of formaldehyde gas by MCC/APMDS composite aerogel are shown in Figure 4. The experiment was conducted at 25℃ and the initial concentration of formaldehyde was 5.0 mg/m3. Fig. a, b and c are the results of adsorption of formaldehyde gas by MCC/APMDS composite aerogel by the amount of APMDS, reaction time and reaction temperature, respectively. It can be seen from the Figure 4 that after formaldehyde adsorption by MCC/APMDS composite aerogel for 2 h, the sample tends to be saturated, and its maximum adsorption capacity is 9.52 mg/g. As can be seen from Figure 4a, formaldehyde adsorption capacity of the modified aerogel increased with the increase of the concentration of the modifier. When the amount of APMDS reached 8wt %, the adsorption capacity of the aerogel for formaldehyde gas hardly increased compared with that of the 6wt %. As can be seen from Figure 4b, with the increase of reaction time, the adsorption amount of formaldehyde by aerogel increases, and when the reaction time reaches 5 h, the formaldehyde adsorption amount hardly increases. It can be seen from Figure 4c that the formaldehyde adsorption capacity increases with the increase of temperature. When the reaction temperature is lower than 80℃, the formaldehyde adsorption capacity of aerogel increases slowly, and when the temperature reaches 100℃, the formaldehyde adsorption capacity hardly increases. This phenomenon is related to the change of nitrogen content in MCC/APMDS composite aerogel.
As can be seen from Figure 5a,b, after adsorption of formaldehyde by MCC/APMDS composite aerogel, its internal pores become smaller and partially microporous are covered, which proves that the aerogel modified by APMDS has good adsorption performance on formaldehyde. According to Figure 6a,b, when MCC/APMDS composite aerogel sorbent formaldehyde, the content of -NH3+ is obviously reduced, which indicates that the positively charged nitrogen groups are closer to formaldehyde molecules. This indicates that the adsorption effect of MCC/APMDS composite aerogel on formaldehyde mainly depends on the protonated -NH3+ group of APMDS to react with formaldehyde to produce Schiff base, to achieve the effect of formaldehyde removal.
6. Conclusions and Outlook
In this paper, 2 w t% cellulose hydrogel was used as matrix material, modified with amino silane (APMDS), and MCC/APMDS composite aerogel was successfully prepared by heating, solvent replacement and freeze-drying. The sample prepared under the conditions of APMDS dosage of 6 w t%, reaction time of 4 h and reaction temperature of 90℃ has the largest average pore size (14.56 nm) and the largest formaldehyde adsorption capacity (9.52 mg/g). The excellent adsorption of the composite aerogel is due to high porosity and rich active amino groups on the surface. This study provides valuable information for the preparation of adsorption materials with high formaldehyde adsorption capacity for air purification.
Author Contributions
Yaning Li: Methodology, Investigation, Writing-original draft; Zhongzheng Liu: Conceptualization, Visualization, Writing - review and editing; Chuanxi Chi: Software, Data curation; Bin Yuan: Formal analysis, Validation; Guiquan Jiang: Formal analysis, Resources; Jianxi Song: Funding acquisition, Project administration.
Institutional Review Board Statement
This manuscript does not contain any studies involving human or animal subjects.
Data Availability Statement
No new data were created or analyzed in this study.
Acknowledgments
This work was financially supported by Jilin Provincial Development and Reform Commission Project (2021C036-9), Jilin Province fund project (YDZJ20221ZYTS672), Jilin City Science and Technology Innovation Development Plan Project (20200104081), Project of Jilin Provincial Department of Education (JJKH20220079KJ).
Conflicts of interest
There are no conflicts to declare.
References
- Dai, X.; Liu, J.; Yin, Y.; Ren, H.; Chen, X. Modeling and controlling indoor formaldehyde concentrations in apartments: On-site investigation in all climate zones of China. Building and Environment. 2018, 127, 98–106. [Google Scholar] [CrossRef]
- Huang, Y.; Su, T.; Wang, L.; Wang, Z.; Liu, W. Evaluation and characterization of volatile air toxics indoors in a heavy polluted city of northwestern China in wintertime. Science of the Total Environment. 2019, 662, 470–480. [Google Scholar] [CrossRef]
- Zhang, B.; Hu, X.; Zhang, Y.; Feng, G.; Yu, Y. Research progress on indoor formaldehyde pollution and its influencing factors in China, a Review. IOP Conference Series: Earth and Environmental Science. 2021, 692, 3. [Google Scholar] [CrossRef]
- Wang, J.T.; Zhong, Z.M. Study on adsorption of formaldehyde by aminated Chitosan/silica aerogels. Chemical Enterprise Management. 2018, 16, 40–44. [Google Scholar]
- Tang, X.; Bai, Y.; Duo, N.G.; Bai, C. Formaldehyde in China: Production, consumption, exposure levels, and health effects. Environment International. 2009, 36, 1210–1224. [Google Scholar] [CrossRef] [PubMed]
- Huangfu, Y.; Lima, N.M.; O’Keefe, P.T.; Zhang, J. Whole house emission rates and loss coefficients of formaldehyde and other VOCs as a function of air change rate. Indoor Air. 2020, 30, 831–844. [Google Scholar] [CrossRef]
- Zhang, Z.F.; Zhang, X.; Zhang, X.M.; Wu, Y.Y.; Cui, L. Indoor occurrence and health risk of formaldehyde, toluene, xylene and total volatile organic compounds derived from an extensive monitoring campaign in Harbin, a megacity of China. Chemosphere. 2020, 250, 126324. [Google Scholar] [CrossRef]
- Wu, L.R.; Zhang, L.X.; Yu, F.; Chen, J.H.; Ma, J. Facile composite of amino carbon nanotubes / graphene: Preparation and adsorption for gaseous formaldehyde. China Environmental Science. 2015, 35, 3251–3256. [Google Scholar]
- Liu, Z.; Wu, P. Preparation of Chitosan/Cellulose Aerogel Beads and Its Formaldehyde Gas Adsorption Performance. Chemistry and Industry of Forest Products. 2017, 37, 27–35. [Google Scholar]
- Piekarski, C.M.; Francisco, A.; Luz, L.; da Silva, P.H.M. Life cycle assessment of medium-density fiberboard (MDF) manufacturing process in Brazil. Journal of Cleaner Production. 2017, 575, 103–111. [Google Scholar] [CrossRef]
- Lopes-Silva, D.A.; Rocc Lahr, F.A.; Varandal, D.; Ferreira-Leitão, V.S.; Ormond da Silva, J. Environmental performance assessment of the melamine-urea-formaldehyde (MUF) resin manufacture: A case study in Brazil. Journal of Cleaner Production. 2015, 96, 299–307. [Google Scholar] [CrossRef]
- Canha, N.; Lage, J.; Coutinho, J.T.; Freitas, M.C.; Almeida-Silva, M. Comparison of indoor air quality during sleep in smokers and non-smokers’ bedrooms: A preliminary study. Environment International. 2015, 85, 236–241. [Google Scholar] [CrossRef]
- Salthammer, T.; Menteşe, S.; Marutzky, R. Formaldehyde in the Indoor Environment. Chemical Reviews. 2010, 110, 2536–2572. [Google Scholar] [CrossRef]
- Becerra, J.A.; Lizana, J.; Gil, M.; Tapia, A.; González, M.; Vera, T. Identification of potential indoor air pollutants in schools. Environmental Science and Pollution Research. 2020, 242, 118420–118438. [Google Scholar] [CrossRef]
- Baloch, M.; Maesano, C.; Christoffersen, J.; et al. Indoor air pollution, physical and comfort parameters related to schoolchildren’s health: Data from the European SINPHONIE study. Environment International. 2015, 78, 79–87. [Google Scholar] [CrossRef]
- Gfa, B.; Bao, J.; Cao, H.; et al. Concentration characteristics of gaseous carbonyl compounds in urban houses in two different climatic zones of China and health risk assessment for schoolchildren. Science of The Total Environment. 2014, 472, 1107–1114. [Google Scholar] [CrossRef]
- Na, G.; Liu, Y. Study on formaldehyde adsorption performance of hemin modified pineapple leaf fiber. Journal of Hainan Normal University (Natural Science). 2017, 30, 356–359. [Google Scholar]
- Xu, Z.; Chen, Y.; Ding, S.; Song, S.; Zhang, X.; Wang, S. Microemulsion-assisted preparation of a mesoporous ferrihydrite/SiO2 composite for the efficient removal of formaldehyde from air. Journal of Physical Chemistry C. 2013, 117, 15699–15706. [Google Scholar] [CrossRef]
- Yao, L.; Guo, D.; Bei, C.; Yang, X.; Yu, S. Bio-template-assisted synthesis of hierarchically hollow SiO2 microtubes and their enhanced formaldehyde adsorption performance. Journal of Hazardous Materials. 2013, 274, 110–116. [Google Scholar] [CrossRef]
- Chen, D.; Qu, Z.; Sun, Y.; Chen, C.; Zou, Z. Adsorption-desorption behavior of gaseous formaldehyde on different porous Al2O3 materials. Journal of Colloid and Interface Science. 2011, 355, 370–377. [Google Scholar] [CrossRef]
- Kim, R.; Ryu, U.J.; Jee, S.; Kim, S.H.; Kim, H.G.; Lee, C.H. Surface coating of MOF layers on the nanocrystals of other MOFs using nanoparticle mediated nucleation for the efficient removal of formaldehyde. Journal of Hazardous Materials. 2011, 402, 123470. [Google Scholar] [CrossRef]
- Liao, Y.; Pan, X. Self-indicating and high-capacity mesoporous aerogel-based biosorbent fabricated from cellulose and chitosan via co-dissolution and regeneration for removing formaldehyde from indoor air. Environmental Science: Nano. 2021, 8, 1283–1295. [Google Scholar] [CrossRef]
- Zhang, K.; Xu, Z.; Li, W.; Liu, S. Preparation of Urea/Nicotinamide Modified Activated Carbon and Its Formaldehyde Adsorption Performance. Chemistry and Industry of Forest Products. 2020, 40, 75–82. [Google Scholar]
- Yin, Y.; Wang, Z.; Wang, S.; Zhang, X.; Wu, J. Cellulose-based formaldehyde adsorbents with large capacities: Efficient use of polyethylenimine for graphene oxide stabilization in alkaline–urea system. Journal of Applied Polymer Science. 2019, 136, 47999. [Google Scholar] [CrossRef]
- Yan, S.; Wang, B. Study on adsorption behavior of hemp charcoal/PET functional fiber on formaldehyde. Synthetic Technology and Application. 2018, 33, 1–5. [Google Scholar]
- Shen, W.; Wei, B.; Deng, Y.; Sun, Y.; Wang, J. Nitrogen-containing porous carbons: Synthesis and application. Journal of Materials Chemistry A. 2015, 3, 13108–13128. [Google Scholar] [CrossRef]
- Li, Y.; Jia, P.; Xu, J.; Li, Y.; Liu, C. The Aminosilane Functionalization of Cellulose Nanofibrils and the Mechanical CO2 Adsorption Characteristics of Their Aerogel. Industrial and Engineering Chemistry Research. 2020, 59, 2874–2882. [Google Scholar] [CrossRef]
- Zhang, T.; Zhang, Y.; Jiang, H.; Yan, B.; Chen, Y. Aminosilane-grafted spherical cellulose nanocrystal aerogel with high CO2 adsorption capacity. Environ Sci Pollut Res Int. 2019, 26, 16716–16726. [Google Scholar] [CrossRef]
Figure 1.
SEM diagram of CAB and MCC/APMDS composite aerogel.
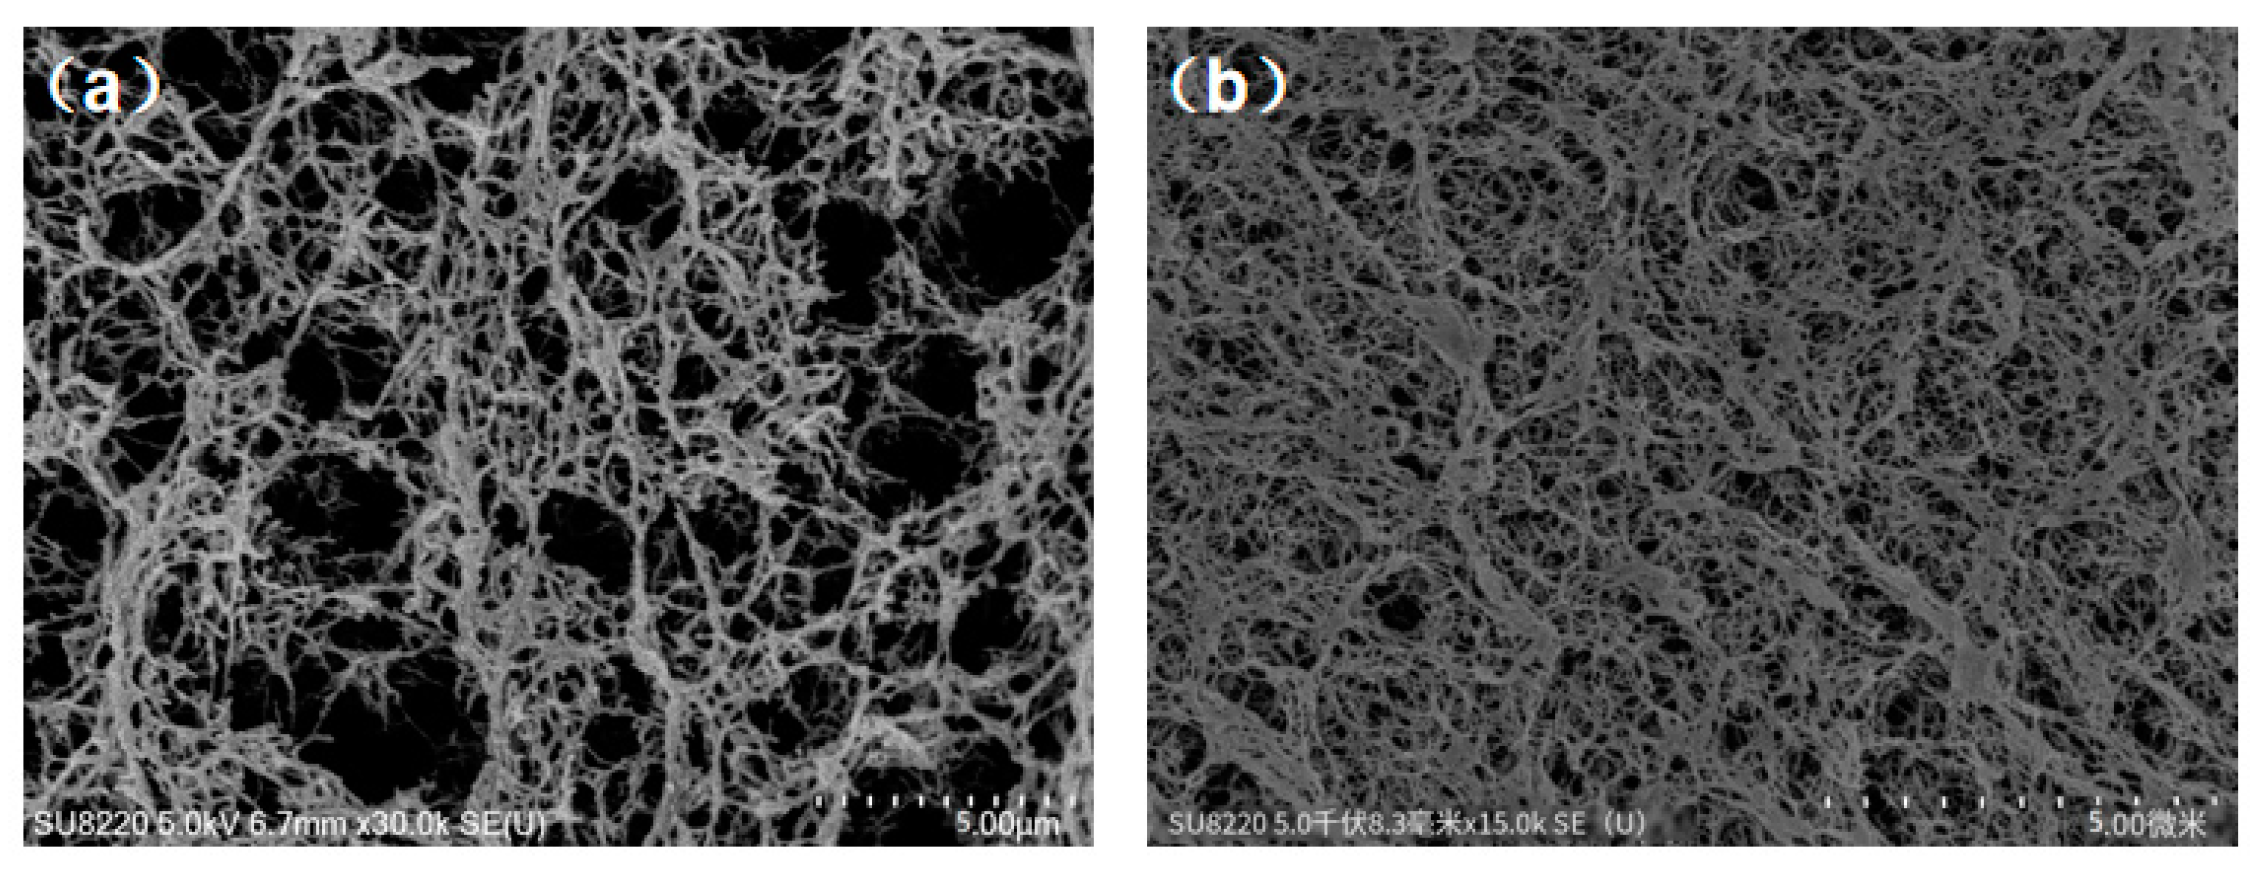
Figure 2.
N2 adsorption-desorption isotherm (a) and pore size distribution (b) of aerogels.
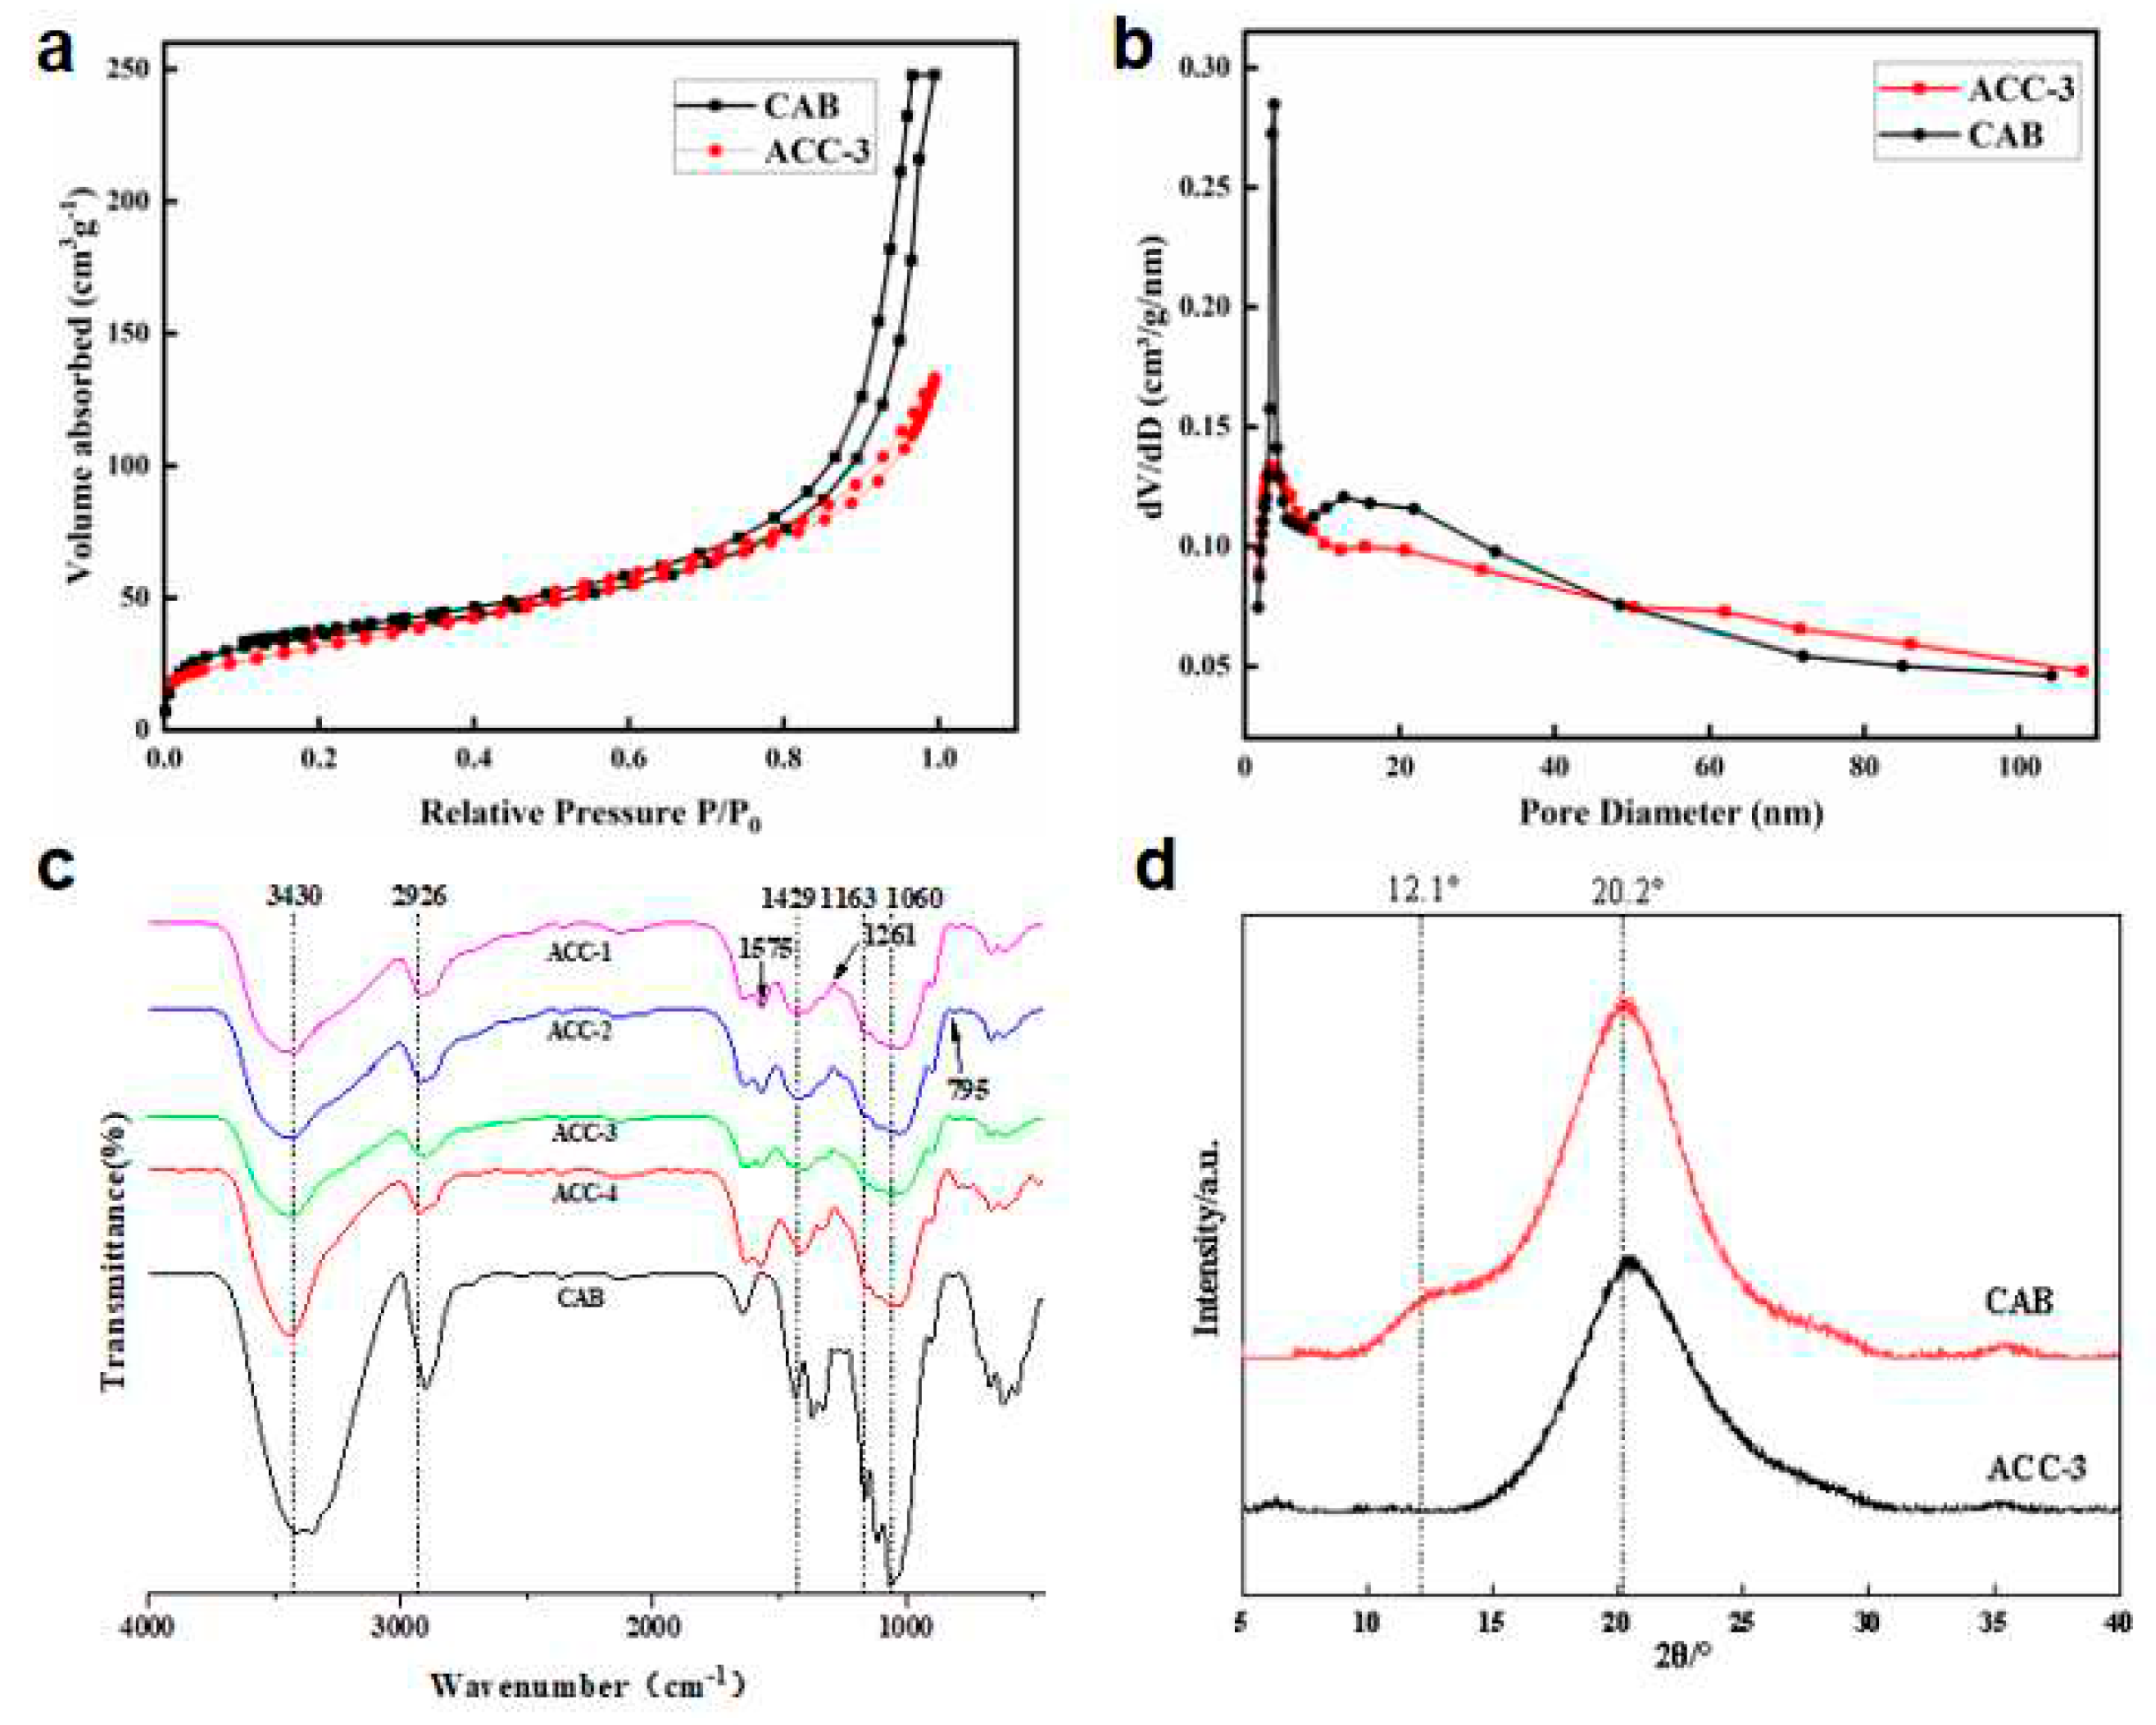
Figure 3.
XPS spectra: (a) CAB; (b) ACC-3; TG spectra of CAB and MCC/APMDS composite aerogel(c); Effect of APMDS usage onnitrogen content of MCC/APMDS composite aerogel(d); Effect of reaction time on nitrogen content of MCC/APMDS composite aerogel(e); Effect of reaction temperature on nitrogen content of MCC/APMDS composite aerogel(f).
Figure 4.
Change of formaldehyde concentration.
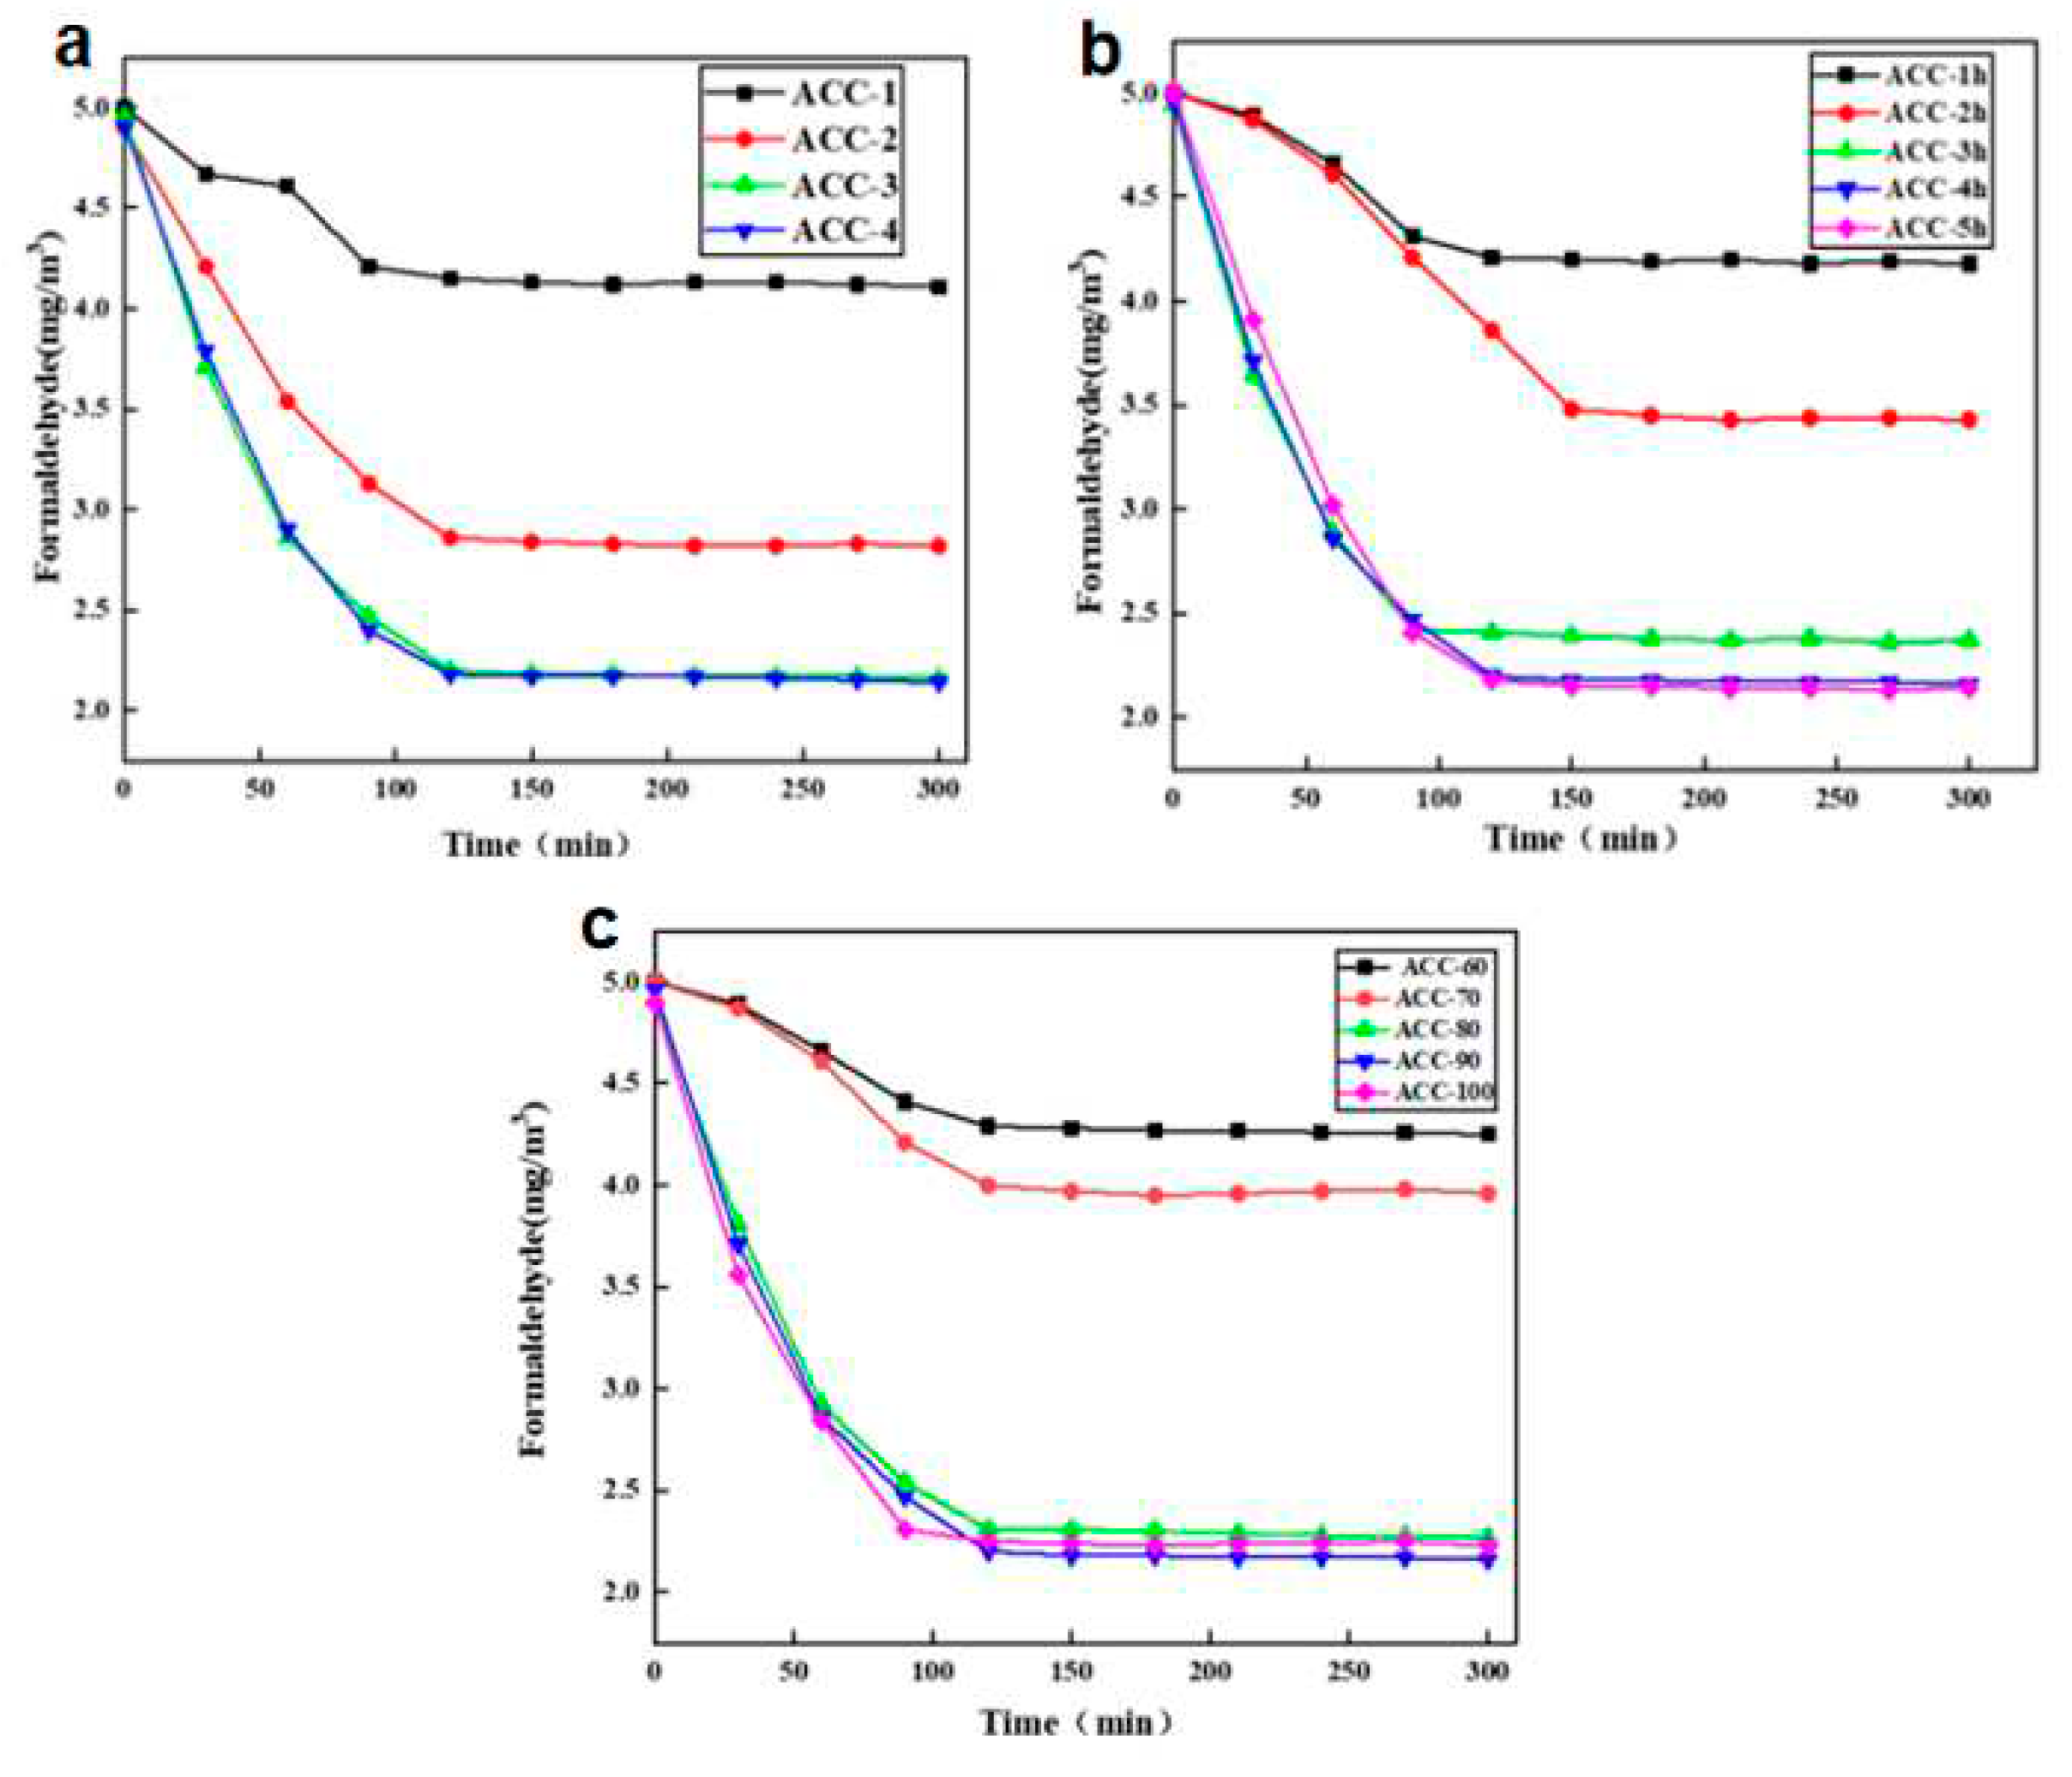
Figure 5.
SEM diagram of sample ACC-3 before and after adsorption.
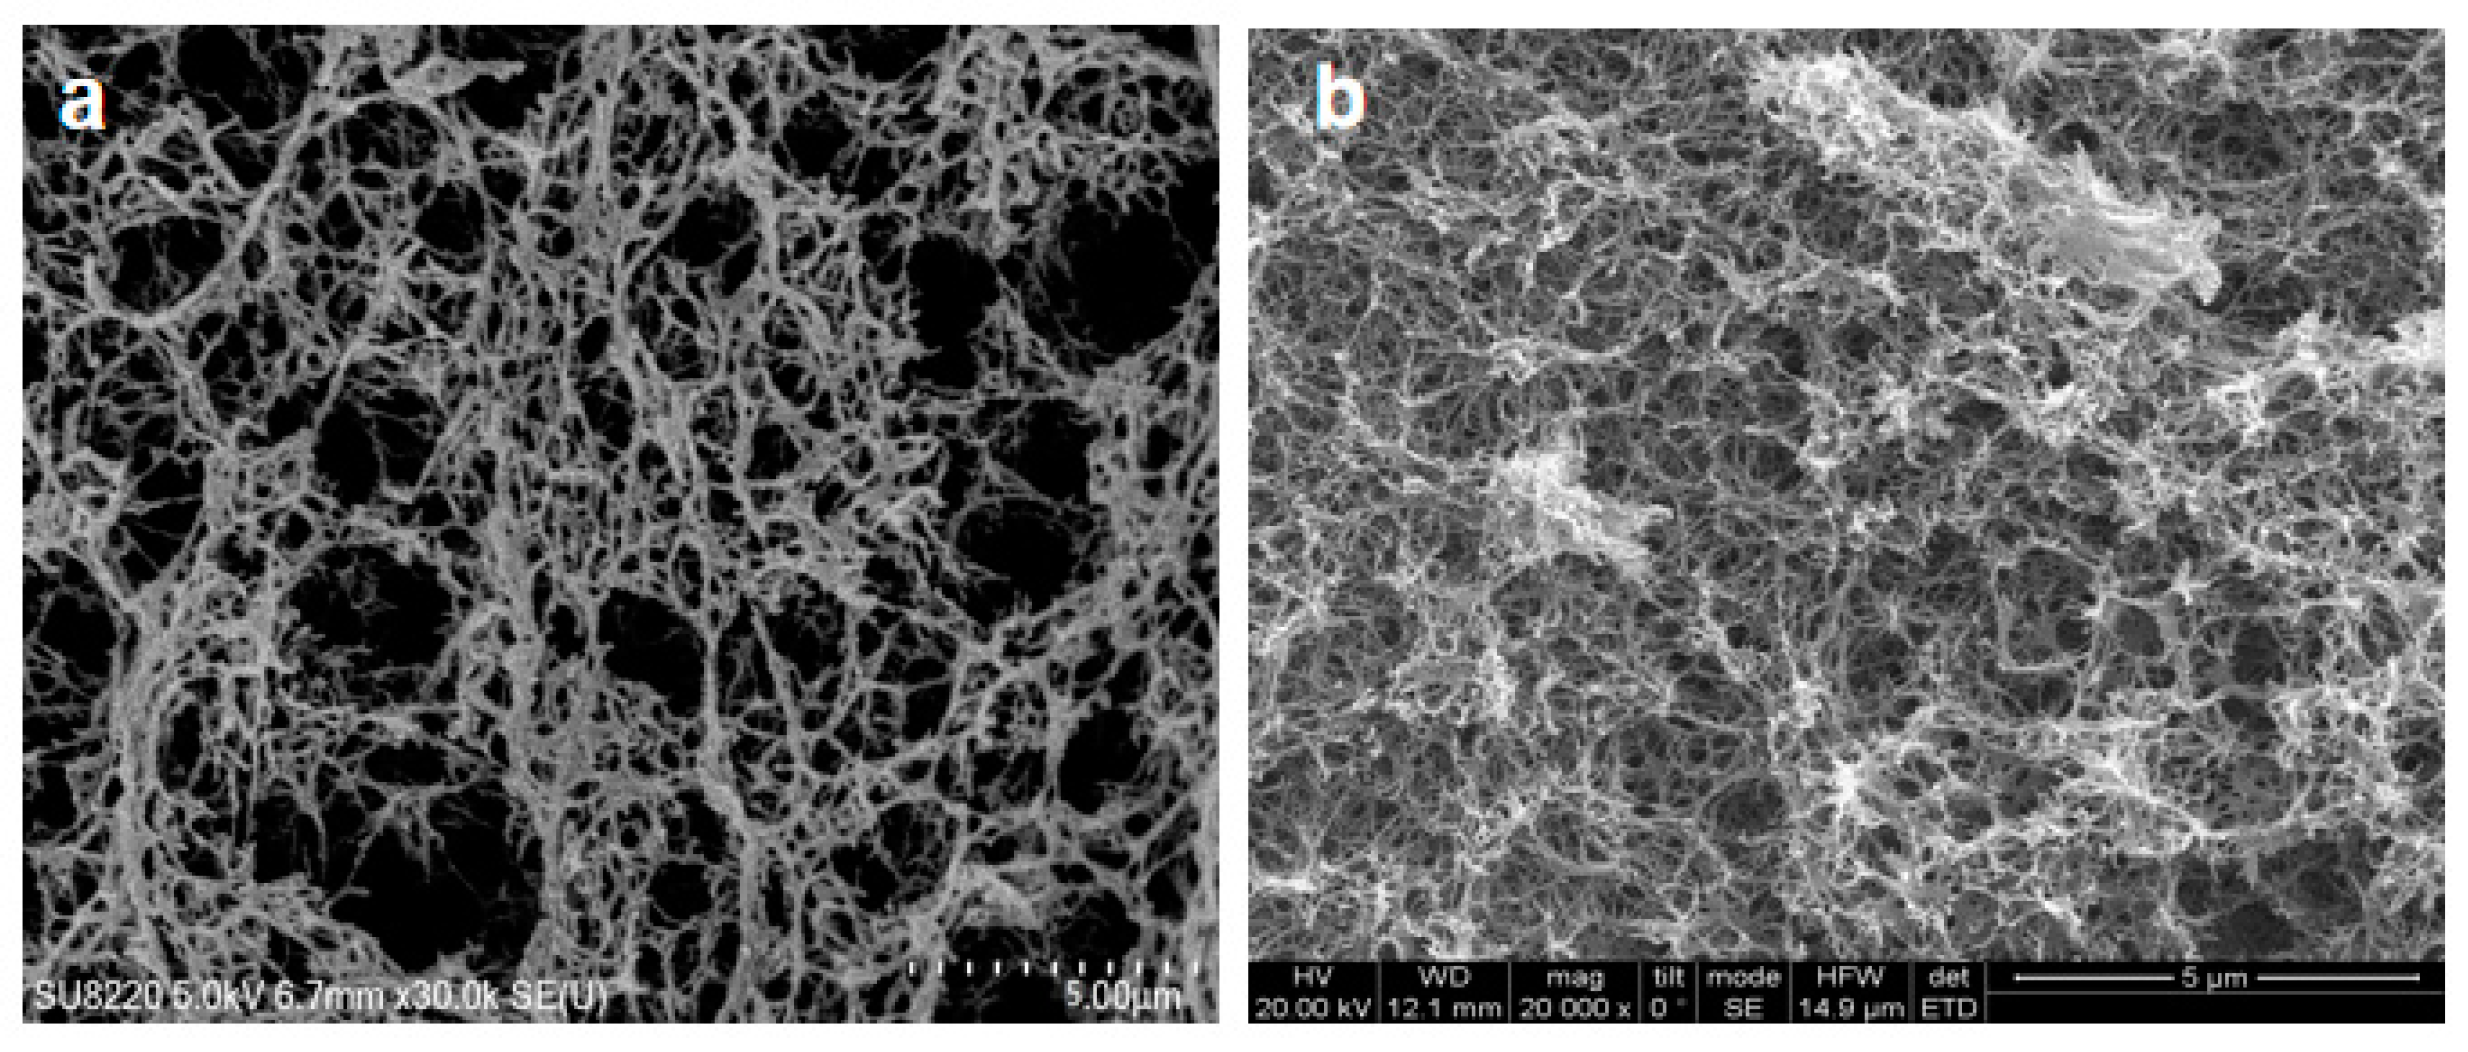
Figure 6.
N1s high-resolution pattern of samples before and after ACC-3 adsorption: (a) before adsorption; (b) post-adsorption.
Figure 6.
N1s high-resolution pattern of samples before and after ACC-3 adsorption: (a) before adsorption; (b) post-adsorption.
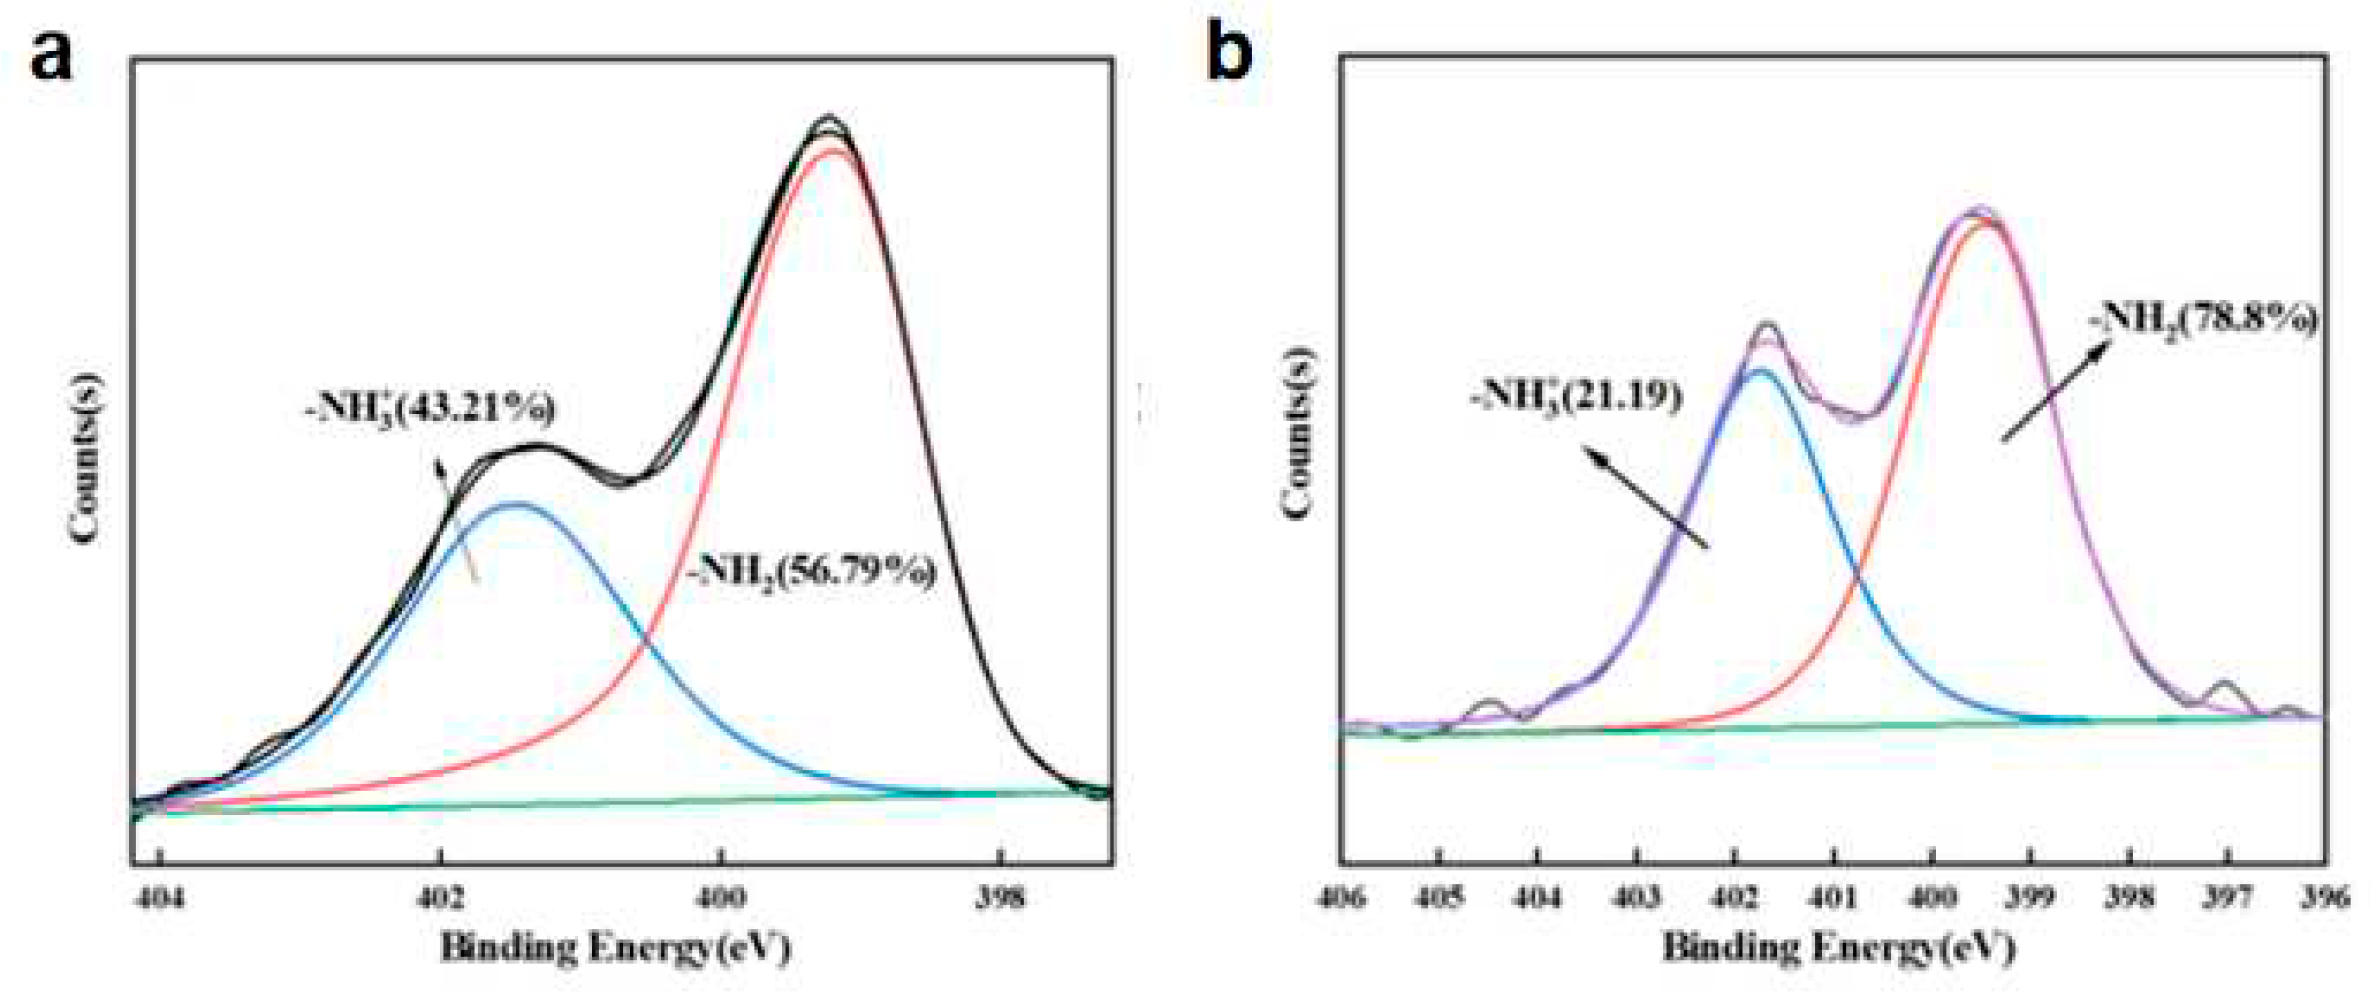

Table 1.
Physical properties of CAB and MCC/APMDS composite aerogel.
| Sample | BET surface area /(m2g. -1 ) |
Average aperture /nm | Total pore volume/( cm3·g-1 ) | Density (mg/cm3) |
|---|---|---|---|---|
| CAB | 127.1 | 12 | 0.272 | 21.8 |
| ACC-3 | 102.8 | 14.56 | 0.212 | 26.7 |
Disclaimer/Publisher’s Note: The statements, opinions and data contained in all publications are solely those of the individual author(s) and contributor(s) and not of MDPI and/or the editor(s). MDPI and/or the editor(s) disclaim responsibility for any injury to people or property resulting from any ideas, methods, instructions or products referred to in the content. |
© 2023 by the authors. Licensee MDPI, Basel, Switzerland. This article is an open access article distributed under the terms and conditions of the Creative Commons Attribution (CC BY) license (http://creativecommons.org/licenses/by/4.0/).
Copyright: This open access article is published under a Creative Commons CC BY 4.0 license, which permit the free download, distribution, and reuse, provided that the author and preprint are cited in any reuse.


