Submitted:
03 July 2023
Posted:
03 July 2023
You are already at the latest version
Abstract
Plant N concentration (PNC) has been commonly used to guide farmers in assessing maize (Zea mays L.) N status and making in-season N fertilization decisions. However, PNC varies based on the development stage and therefore a relationship between biomass and N concentration is needed (i.e., critical N dilution curves; CNDC) to better understand when plants are N deficient. A few CNDC have been developed and used for plant N status diagnoses, but have not been tested in the US Midwest. The objective of this study was to evaluate under highly diverse soil and weather conditions in the US Midwest the performance of CNDCs developed in France and China for assessing maize N status. Maize N rate response trials were conducted across eight US Midwest states over three years. This analysis utilized plant and soil measurements at V9 and VT development stages and final grain yield. Results showed that the French CNDC (y=34.0x-0.37, where y is critical PNC, x is aboveground biomass) was better with a 91% N status classification accuracy compared to only 62% with the Chinese CNDC (y=36.5x-0.48). The N nutrition index (NNI), which is the quotient of the measured PNC and the calculated critical N concentration (Nc), based on the French CNDC was significantly related to soil nitrate-N content (R2=0.38-0.56). Relative grain yield on average reached a plateau at NNI values of 1.36 at V9 and 1.21 at VT, but for individual sites ranged from 0.80 to 1.41 at V9 and from 0.62 to 1.75 at VT. The NNI threshold values or ranges optimal for crop biomass production may not be optimal for grain yield production. It is concluded that the CNDC developed in France is suitable as a general diagnostic tool for assessing maize N status in US Midwest. However, the threshold values of NNI for diagnosing maize N status and guiding N applications vary significantly across the region, making it challenging for guiding specific on-farm N management. More studies are needed to determine how to effectively use CNDC to make in-season N recommendations in the US Midwest.
Keywords:
critical nitrogen dilution curve
; nitrogen nutrition index
; soil nitrate-N content
; crop nitrogen status diagnosis
; precision nitrogen management
1. Introduction
Precision nitrogen (N) management can improve N use efficiency by synchronizing N supply and crop N demand in space and time, which can minimize negative environmental impacts and maintain or increase crop yield [1]. To determine crop N demands, farmers need to accurately diagnose crop N status at key development stages. Historically, N diagnosis techniques for maize (Zea mays L.) have focused either on soil N availability via soil nitrate sampling or plant N concentration (PNC) via plant tissue analysis, which are compared to a standardized critical soil or plant N concentration to determine if and how much additional N fertilizer is needed [2,3]. Sampling for PNC can provide a better assessment of N needs compared to soil sampling as plants integrate many factors influencing N availability [2,3,4]. But many have found PNC alone unreliable for predicting grain yield and in-season N fertilizer needs [2,4,5,6].
One difficulty of using PNC as a diagnostic tool is the critical N concentration changes throughout maize development as PNC becomes diluted with greater above-ground biomass (AGB) [7,8]. To overcome this difficulty for maize, critical N concentrations have been used to relate AGB using a negative power function, termed ‘critical N dilution curve’ (CNDC; Nc=aW-b) [7], where Nc is the critical N concentration for N sufficient maize in g kg-1 and W is the shoot biomass expressed in Mg ha−1 [9]. The a and b terms are estimated parameters, where a represents the Nc at 1 Mg ha−1 of total shoot biomass and b describes the decreasing relationship between Nc and AGB [7]. The concern of growth-stage dependency with PNC is thus resolved by dividing the measured PNC by an established Nc at a specific AGB, creating an easy-to-interpret N nutrition index (NNI) of plant N status. Crop N status is optimal when NNI is 1, while NNI > 1 indicates surplus, and NNI < 1 indicates deficiency [7]. For practical applications, different threshold ranges have been proposed for optimal crop N status {e.g., 0.9 < NNI ≤ 1.1 [10]; 0.95 < NNI ≤ 1.05 [11]; 1.00 ≤ NNI ≤ 1.25 [12]}.
While CNDC might be useful to manage in-season N application, as with most diagnostic tools, CNDC is crop-specific [13,14,15,16,17,18]. For maize, a CNDC for long-season hybrids originated in France was reported [14] and validated by others in Canada [19] and the Shandong Province of China [20]. But researchers in Northeast China, where shorter-season hybrids are typically grown, found this CNDC unsuitable for N status diagnosis [21,22,23], and a new CNDC was developed [21]. Failure for one CNDC to work across regions and hybrids supports the need for region-specific curves. Further, it is well established that many factors influence plant N status, including genotypes [24], soil texture [25,26], crop rotation [25,27], tillage [28], and weather [29].
The US is the world’s largest producer and exporter of maize, with over 80% of its production in the Midwest region [30]. A series of environmental problems has been linked to maize production in this region, and there is a great need to improve maize N management for sustainable development in the US Midwest [31,32,33,34]. The CNDCs developed elsewhere have not been tested extensively in the US Midwest for their suitability in assessing maize N status. Therefore, the objective of this study was to evaluate under highly diverse soil and weather conditions in the US Midwest the performance of CNDCs developed in France and China for assessing maize N status. A secondary objective was to determine the relationship of the NNIs from the US Midwest with relative grain yield and soil nitrate.
2. Materials and Methods
2.1. Research sites and treatment
A total of 49 maize N rate response trials were conducted from 2014 to 2016 in eight US Midwestern States as part of a public-industry partnership, and the details of these experiments can be found in [35]. Briefly, eight at-planting N application treatments (0 to 315 kg N ha-1 in 45 kg N ha-1 increments) were arranged in a randomized complete block design with four replications at each site.
2.2. Sampling and laboratory procedures
Plant sampling and PNC analysis were conducted at the V9 ± 1 development stage [36] for 13 locations (2015-2016) and at the VT developmental stage for 47 locations (2014-2016). Plant samples were collected by cutting six representative plants at ground level. Samples were oven-dried at 60 to 70 ℃ to a constant weight then ground to pass through a <1 mm sieve and sent to Agvise Laboratories Inc. (Northwood, ND, USA) to determine PNC by combustion analysis (Dumas Combustion method with an Elementary Rapid N Cube Nitrogen Analyzer; Elementar Analysensyteme GmbH Landgenselbold, Germany).
Soil samples were also collected for each N application treatment at the same time of plant sampling by taking a composite of six cores with a hand-probe to a depth of 30 cm. The soil samples were air-dried, ground, passed through a 2 mm sieve, and analyzed for soil nitrate-N concentration using a cadmium reduction method [37] at Agvise Laboratories Inc. Additional details regarding the plant and soil measurement and analysis protocols can be found in [35].
Grain yield was determined by hand or combine harvesting the middle two or four rows (depending on plot length and width) of each plot. Grain moisture was adjusted to 15.5 g kg-1.
2.3. Data Analysis
The data with AGB ≥1 Mg ha-1 and the corresponding PNC were compared using an analysis of variance (ANOVA; SPSS 18.0, SPSS Inc., Chicago, Illinois, USA). Sites with no AGB response to N application rates (P > 0.05) were excluded from evaluating the CNDCs. The data were classified into N-limiting and non-limiting groups according to criteria from [19,38]. The N-limited maize increased in AGB (P ≤ 0.05) with increasing N rate whereas non-limiting maize increased in PNC, but not AGB (P ≤ 0.05) with increasing N rate.
The NNI of maize at each sampling date and N rate was determined by dividing the PNC by Nc at the same AGB and NNI assessed with the French (Equation 1) [14] and Chinese (Equation 2) CNDCs [21].
where Nc is the critical plant N concentration, and W is the total shoot biomass expressed in Mg ha-1 based on dry matter weight.
Nc = 34.0W-0.37
Nc = 36.5W-0.48
The NNI values were related to soil nitrate measurements collected at the same time as plant tissue sampling. The NNI values were also compared to relative grain yield (i.e., each grain yield divided by that site-years’ largest grain yield [11]. The relationship of relative yield and NNI were examined using a linear-plateau function in SAS version 9.4 (SAS Institute, 2015, Cary, North Carolina, USA).
3. Results
3.1. Variability of plant and soil N status indicators
Both plant and soil N status indicators varied across different N rates, development stages, and site-years (Table 1). Soil nitrate-N content had larger variability (CV=59.8-136.6%) than plant N status indicators (CV=26.1-54.2%) across growth stages. The well-established fact that average PNC decreases as shoot biomass increases [7] was observed as the crop developed from V9 to VT. The CV for PNC and NNI was similar across growth stages (26.1-29.2%), but it was greater for AGB and plant N uptake at V9 stage (44.3-54.2% vs 29.4-37.8% at VT). Greater variability in V9 AGB and PNU may be a reflection of sampling protocol, since plants were collected between V8 and V10 (V9 ±1 development stage). Another possible reason is that more samples were collected around V9 than VT development stage. All plant and soil N status indicators were significantly affected by different N application rates, with large variabilities at each N rate (Figure 1). All the N status indictors increased with N rates, so were their variabilities in most cases.
3.2. Evaluation of the existing critical N dilution curves
At the V9 stage, both CNDCs had the same accuracy (89%) to classify N-limiting and non-limiting conditions (Figure 2, Table 2). At the VT stage, the French CNDC maintained similar accuracy for both classifications. In contrast, the Chinese CNDC was only 66% accurate for N-limited maize, though classification of N-non limiting was nearly 98% accurate (Figure 2, Table 2). Because the French CNDC maintained reasonably good (88-92%) accuracy over both development stages with this dataset, it was concluded to be a better match for maize N status diagnosis in the Midwest US Corn Belt. As a result, only the French CNDC was used for additional analyses.
3.3. Grain yield relative to NNI
Employing the French CNDC, NNI values ranged from 0.29 to 1.70 for V9 and 0.36 to 1.97 for VT development stages (Figure 3). The NNI values greater than 1 indicate that maize takes up more N than needed for the early season maximum growth [7]. The relationship between relative grain yield and NNI was described by a linear plateau model, with R2 of 0.87 at V9 and VT stages, respectively (Figure 3). Across site-years, the relative grain yield plateaued at NNI of 1.36 at the V9 development stage and 1.21 at the VT development stage. The NNI threshold values when relative yield reached a plateau for a specific site-year varied from 0.80 to 1.41 at V9 and from 0.62 to 1.75 at VT (Figure 4).
3.4. NNI and soil properties
Across N rates and site-years, NNI was significantly related to soil nitrate-N content by a 2nd order polynomial at V9 (R2= 0.38) and VT (R2= 0.56) development stages (Figure 5). At V9, NNIs at most site-years increased with soil nitrate-N content until ~200 kg N ha-1, peaking at 1.37 (data not shown). NNI increased more rapidly with increased soil nitrate-N content at VT, than at V9, increasing to 1.6 at soil nitrate-N of ~150 kg N ha 1 (Figure 5).
Relative grain yield increased with soil nitrate-N content and reached a plateau at about 100 kg ha-1 at V9 stage (Figure 6, left). At VT stage, relative grain yield reached plateau at nitrate-N content less than 50 kg ha-1, and most site-years had very high yield at soil nitrate-N content close to 0 kg ha-1.
Relationships between N fertilization rate and NNI differed among soil textural groups at V9 and VT development stages (Figure 7). For both stages, increasing N rate increased NNI for all textural groups except fine sand at VT. The fine sand group had lower NNI than the loam groups at N rates > 0 kg N ha-1. These results suggest NNI threshold could be improved by accounting for soil texture.
4. Discussion
4.1. Evaluation of published critical N dilution curves
Using data from a wide range of growing conditions in the US Midwest, it was identified that of the two CNDC evaluated, the French CNDC [14] best predicted when maize plants were N deficient or sufficient compared to the Chinese CNDC [21]. This French CNDC was also moderately related to both grain yield and soil nitrate content, further validating that this approach could be a guide for recommending N rates in-season.
The generalized CNDC equation Nc=aW-b is mainly centered on the relationship between PNC and AGB, which is closely related to the ratio of metabolic (e.g., leaves) to structural (i.e., roots and shoots) plant parts. Both PNC and AGB can be affected by plant density [39,40], soil texture [41,42,43], weather conditions [43,44] as well as other soil-landscape properties (i.e., topography, soil organic matter content, and water-holding capacity, etc.) [43,45]. Variations in the CNDC of early and late rice (Oryza sativa L.) [46], summer (shorter season variety) and spring (longer season variety) maize [23], and experimental sites [38] have been reported. So, while universal CNDCs are sought, a wide range of factors should be considered when they are developed, evaluated, and applied in production agriculture.
In order to develop a CNDC model with broad applicability for maize across a large region, such as the US Midwest, it is important to represent multiple maize development stages, environmental conditions (e.g., soils, weather, management), and hybrids. While the evaluation in this study was rich with varied environmental conditions, it was limited to only two crop development stages and a limited number of hybrids, which limits the utility of developing a CNDC for the US Midwest. However, using a large dataset like in this study to evaluate other published CNDCs is appropriate and valuable.
Compared with the Chinese CNDC, the French CNDC has a higher a value and a lower b value, which indicates higher Nc per Mg ha−1 of AGB. Physiologically, it means a more rapidly decreasing Nc with increasing AGB. The French CNDC was developed based on irrigated maize under higher planting densities (90,000 plants ha-1) [14], while the CNDC in China was developed under rainfed and lower planting densities (60,000 plants ha-1) [21]. The dataset for this analysis came from planting densities ranging from about 67,500 to 96,000 plants ha-1. Though dominated by rainfed sites (~85%), this research also included irrigated sites. This study included both short season hybrids used in North Dakota, Minnesota, and Wisconsin and longer season hybrids in other states. Both CNDCs performed similarly at the V9 development stage, which is the stage important for in-season N status diagnosis and N recommendations, so both CNDCs could be used at this development stage. The French CNDC performed slightly better at the VT stage, which is generally too late for in-season N management decisions, although it can still be important in irrigated maize fields with fertigation capability. The validity of the French CNDC has also been confirmed for maize N status diagnosis in eastern Canada across different soil textures and hybrids [19]. As a general relationship, of the two CNDCs evaluated the French CNDC appears to be more suitable for US Midwest corn N status diagnosis [14].
4.2. Determining threshold values of nitrogen nutrition index for nitrogen status diagnosis
Findings here support a linear-plateau relationship between NNI and relative yield (Figure 3). The relatively good relationship found at V9 (Figure 3) is encouraging because it is sufficiently early in the growing season to take corrective measures with in-season N application and both CNDCs can be used at this stage in the Midwest. The NNI values at earlier development stages than evaluated in this study were found to have poor correlations with grain yield, due to variations of soil N supply after sampling for NNI [7].
Reliable NNI threshold values are needed for crop N status diagnosis. While collectively NNI related well to relative grain yield (Figure 3), NNI threshold values of each site-year examined independently varied widely (Figure 4), with ranges beyond what has been previously reported (e.g., 0.95-1.05, or 0.90-1.10) [10,11]. The Nc is defined as the minimum PNC required to maximize AGB production; this value may differ from the PNC required to maximize grain yield [38]. Biomass at different development stages can have unique relationships with final grain yield. Further, final grain yield can also be influenced by many factors other than N status [47]. As a result, although NNI around 1 is optimal for biomass production at different development stages, different NNI levels may be needed for optimal grain yield production. This makes it challenging to make in-season N recommendations only using NNI. Further, the low precision due to the wide range in NNI when used across a wide range of conditions highlights the limited utility of this measurement as a universal management tool, though it could be used as a general diagnostic tool.
Values of NNI were also significantly varied across soil texture (Figure 7). The NNI values were the lowest for fine-sand sites compared with other soil texture sites across all N application rates. This could be due to high leaching losses in sandy soil. Also, organic matter is generally lower in sandy soils and thus typically contributes less plant-available N through mineralization [43]. There may be other factors limiting maize growth, and N update, like water stress or other nutrient deficiencies [48]. It has been found that critical crop N concentration under water deficit condition was lower than well-watered conditions, due to an intrinsic reduction of crop N demand [49]. As a result, the NNI threshold values in sandy soil would be lower than in less coarse textured soils. That said, the sandy soil sites of this research were all irrigated and stress from water deficiency was not considered a limiting factor for growth. However, irrigation in sandy soils, especially in this region, where there is also unpredictable precipitation, can increase nitrate-N leaching, leading to lower NNI values.
The composite of these varied results between NNI and yield indicates that the determination of suitable NNI threshold values from a single universal CNDC is impractical for guiding in-season N diagnosis and fertilization. A large crop-growing region like the US Midwest is complicated, and generally requires site-specific conditions to be incorporated into diagnostic tools [50].
4.3. Implications for practical application
After CNDC validation and generating NNI threshold values defined for a region, NNI can be utilized to diagnose crop N status as N deficient, optimal and surplus conditions [10,11]. Based on the N status, sidedress N application rates can be adjusted accordingly. Using NNI principles, several NNI-based N recommendation algorithms have been proposed or developed. One simple approach is to apply a fixed rate of N fertilizers when NNI is lower than the predefined threshold value or range, or not apply any fertilizer if NNI is above a predefined threshold value or range. Another approach is to calculate critical plant N uptake as the product of AGB and Nc. The difference between measured plant N uptake and critical plant N uptake can then be calculated and the planned in-season N application rate can be adjusted [51]. This difference can also be divided by a presumed N use efficiency value to calculate N requirement [52]. For example, the developed a model to predict in-season rice N requirement using days after transplanting, NNI, and N recovery efficiency [53].
Since NNI determination needs destructive and time-consuming plant-sampling and lab analysis, it is generally not considered practical for large-scale applications in precision N management. In lieu, methods and technologies for direct or indirect predictions of NNI have been developed, using multiple sensing technologies, such as chlorophyll meter [54], smartphone Apps [55], proximal active and passive canopy sensors [11,56,57,58,59], unmanned aerial vehicle-based remote sensing [12,60], aerial remote sensing [10], satellite remote sensing [51,61] or a combination of satellite remote sensing and smartphone Apps [62]. Recent studies indicated that crop NNI could be well predicted using a data fusion approach combining crop sensing data with genetics, environmental and management information using statistical or machine learning models [50,63]. In addition, proximal and remote sensing technologies have also been used to develop NNI-based in-season N recommendation technologies [10,64,65,66]. These and future diagnostic tools should be grounded in plant physiology and the underlying principles of CNDC and NNI, and be flexible to accommodate site-specific conditions.
5. Conclusions
This study evaluated two previously published CNDCs based on the data from 49 site-years of N rate trials conducted in eight US Midwest states. The results indicated that both CNDCs developed in France and Northeast China were suitable for maize N status diagnosis in the US Midwest Corn Belt at the V9 stage, but the French CNDC was better at the VT stage. The NNI values based on the French CNDC were significantly related to soil nitrate-N content across site-years at V9 (R2=0.38) and VT (R2=0.56) stages. However, the threshold values of NNI for relative grain yield (average values across site-years were 1.36 and 1.21 at V9 and VT, respectively) were different from those regarded optimal for biomass production (~1) and varied significantly from site-year to site-year (0.80 to 1.41 at V9 and from 0.62 to 1.75 at VT). Regional threshold values need to be developed for NNI to be useful for reliable in-season crop N status diagnosis. In addition, NNI-based in-season N recommendation strategies are needed to guide farmers to adjust their N application rates according to plant N status. Proximal and remote sensing-based non-destructive NNI prediction and in-season N recommendation methods also need to be developed for precision N management under diverse soil, weather, and management conditions across the US Midwest.
Author Contributions
Y.M. and H.S. conceptualized and designed the research, H.S. performed the data analysis, Y.M. interpreted the results, H.S. and Y.M. wrote the original manuscript. F.G.F., N.R.K., C.J.R., J.J.C., P.R.C., R.B.F., D.W.F., C.A.M.L., E.D.N., J.E.S. and J.F.S. conceptualized and designed the field experiments, coordinated the data collection, and reviewed and revised the manuscript. All authors have read and agreed to the published version of the manuscript.
Funding
The field research and data collection were supported by Corteva Agriscience, and the data analysis and paper writing were funded by Northeast Agricultural University Scholar Project (20YJXG13) and a scholarship award to Hui Shao by the China Scholarship Council, Minnesota Department of Agriculture/Agricultural Fertilizer Research and Education Council (AFREC) (R2019-20, R2020-32, R2021-32), and the USDA National Institute of Food and Agriculture (State project 1016571)
Data Availability Statement
The datasets generated during and/or analyzed during the current study are available from the corresponding authors on reasonable request.
Conflicts of Interest
The authors declare no conflict of interest.
Abbreviations
AGB, Above-ground biomass; CNDC, Critical N dilution curve; N, Nitrogen; NNI, Nitrogen nutrition index; PNC, Plant nitrogen concentration; Nc, Critical N concentration
References
- Cao, Q.; Miao, Y.; Feng, G.; Gao, X.; Liu, B.; Liu, Y.; Li, F.; Khosla, R.; Mulla, D.J.; Zhang, F. Improving Nitrogen Use Efficiency with Minimal Environmental Risks Using an Active Canopy Sensor in a Wheat-Maize Cropping System. Field Crops Res. 2017, 214, 365–372. [Google Scholar] [CrossRef]
- Binford, G.; Blackmer, A.; Cerrato, M. Nitrogen Concentration of Young Corn Plants as an Indicator of Nitrogen Availability. Agron. J. 1992, 84, 219–223. [Google Scholar] [CrossRef]
- Lemaire, G.; Gastal, F. N Uptake and Distribution in Plant Canopies. Diagn. Nitrogen Status Crops 1997, 3–43. [Google Scholar]
- Schröder, J.J.; Neeteson, J.J.; Oenema, O.; Struik, P.C. Does the Crop or the Soil Indicate How to Save Nitrogen in Maize Production? Reviewing the State of the Art. Field Crops Res. 2000, 66, 151–164. [Google Scholar] [CrossRef]
- Fox, R.H.; Roth, G.W.; Iversen, K.V.; Piekielek, W.P. Soil and Tissue Nitrate Tests Compared for Predicting Soil Nitrogen Availability to Corn. Agron. J. 1989, 81, 971–974. [Google Scholar] [CrossRef]
- Cerrato, M.; Blackmer, A. Relationships between Leaf Nitrogen Concentrations and the Nitrogen Status of Corn. J. Prod. Agric. 1991, 4, 525–531. [Google Scholar] [CrossRef]
- Lemaire, G.; Jeuffroy, M.-H.; Gastal, F. Diagnosis Tool for Plant and Crop N Status in Vegetative Stage: Theory and Practices for Crop N Management. Eur. J. Agron. 2008, 28, 614–624. [Google Scholar] [CrossRef]
- Peng, Y.; Yu, P.; Li, X.; Li, C. Determination of the Critical Soil Mineral Nitrogen Concentration for Maximizing Maize Grain Yield. Plant Soil 2013, 372, 41–51. [Google Scholar] [CrossRef]
- Ulrich, A. Physiological Bases for Assessing the Nutritional Requirements of Plants. Annu. Rev. Plant Physiol. 1952, 3, 207–228. [Google Scholar] [CrossRef]
- Cilia, C.; Panigada, C.; Rossini, M.; Meroni, M.; Busetto, L.; Amaducci, S.; Boschetti, M.; Picchi, V.; Colombo, R. Nitrogen Status Assessment for Variable Rate Fertilization in Maize through Hyperspectral Imagery. Remote Sens. 2014, 6, 6549–6565. [Google Scholar] [CrossRef]
- Xia, T.; Miao, Y.; Wu, D.; Shao, H.; Khosla, R.; Mi, G. Active Optical Sensing of Spring Maize for In-Season Diagnosis of Nitrogen Status Based on Nitrogen Nutrition Index. Remote Sens. 2016, 8, 605. [Google Scholar] [CrossRef]
- Chen, Z.; Miao, Y.; Lu, J.; Zhou, L.; Li, Y.; Zhang, H.; Lou, W.; Zhang, Z.; Kusnierek, K.; Liu, C. In-Season Diagnosis of Winter Wheat Nitrogen Status in Smallholder Farmer Fields across a Village Using Unmanned Aerial Vehicle-Based Remote Sensing. Agronomy 2019, 9, 619. [Google Scholar] [CrossRef]
- Justes, E.; Mary, B.; Meynard, J.-M.; Machet, J.-M.; Thelier-Huché, L. Determination of a Critical Nitrogen Dilution Curve for Winter Wheat Crops. Ann. Bot. 1994, 74, 397–407. [Google Scholar] [CrossRef]
- Plénet, D.; Lemaire, G. Relationships between Dynamics of Nitrogen Uptake and Dry Matter Accumulation in Maize Crops. Determination of Critical N Concentration. Plant Soil 1999, 216, 65–82. [Google Scholar] [CrossRef]
- Bélanger, G.; Walsh, J.; Richards, J.; Milburn, P.; Ziadi, N. Critical Nitrogen Curve and Nitrogen Nutrition Index for Potato in Eastern Canada. Am. J. Potato Res. 2001, 78, 355–364. [Google Scholar] [CrossRef]
- Ata-Ul-Karim, S.T.; Yao, X.; Liu, X.; Cao, W.; Zhu, Y. Development of Critical Nitrogen Dilution Curve of Japonica Rice in Yangtze River Reaches. Field Crops Res. 2013, 149, 149–158. [Google Scholar] [CrossRef]
- Zhao, B. Determining of a Critical Dilution Curve for Plant Nitrogen Concentration in Winter Barley. Field Crops Res. 2014, 160, 64–72. [Google Scholar] [CrossRef]
- Chakwizira, E.; de Ruiter, J.; Maley, S.; Teixeira, E. Evaluating the Critical Nitrogen Dilution Curve for Storage Root Crops. Field Crops Res. 2016, 199, 21–30. [Google Scholar] [CrossRef]
- Ziadi, N.; Brassard, M.; Bélanger, G.; Cambouris, A.N.; Tremblay, N.; Nolin, M.C.; Claessens, A.; Parent, L. Critical Nitrogen Curve and Nitrogen Nutrition Index for Corn in Eastern Canada. Agron. J. 2008, 100, 271–276. [Google Scholar] [CrossRef]
- Chen, P.; Wang, J.; Huang, W.; Tremblay, N.; Ou, Y.; Zhang, Q. Critical Nitrogen Curve and Remote Detection of Nitrogen Nutrition Index for Corn in the Northwestern Plain of Shandong Province, China. IEEE J. Sel. Top. Appl. Earth Obs. Remote Sens. 2013, 6, 682–689. [Google Scholar]
- Li, W.; He, P.; Jin, J. Critical Nitrogen Curve and Nitrogen Nutrition Index for Spring Maize in North-East China. J. Plant Nutr. 2012, 35, 1747–1761. [Google Scholar] [CrossRef]
- Chen, X.; Chen, F.; Chen, Y.; Gao, Q.; Yang, X.; Yuan, L.; Zhang, F.; Mi, G. Modern Maize Hybrids in N Ortheast C Hina Exhibit Increased Yield Potential and Resource Use Efficiency despite Adverse Climate Change. Glob. Change Biol. 2013, 19, 923–936. [Google Scholar] [CrossRef] [PubMed]
- Shan-Chao, Y.; Fu-Lai, S.; Qing-Feng, M.; Rong-Fang, Z.; Fei, L.; Xin-Ping, C.; ZHANG, F.-S.; Zhen-Ling, C. Validation of a Critical Nitrogen Curve for Summer Maize in the North China Plain. Pedosphere 2014, 24, 76–83. [Google Scholar]
- Paponov, I.A.; Engels, C. Effect of Nitrogen Supply on Leaf Traits Related to Photosynthesis during Grain Filling in Two Maize Genotypes with Different N Efficiency. J. Plant Nutr. Soil Sci. 2003, 166, 756–763. [Google Scholar] [CrossRef]
- Beaudoin, N.; Saad, J.; Van Laethem, C.; Machet, J.; Maucorps, J.; Mary, B. Nitrate Leaching in Intensive Agriculture in Northern France: Effect of Farming Practices, Soils and Crop Rotations. Agric. Ecosyst. Environ. 2005, 111, 292–310. [Google Scholar] [CrossRef]
- Geypens, M.; Mertens, J.; Ver Elst, P.; Bries, J. Evaluation of Fall Residual Nitrogen Influenced by Soil Chemical Characteristics and Crop History in Flanders (Belgium). Commun. Soil Sci. Plant Anal. 2005, 36, 363–372. [Google Scholar] [CrossRef]
- Zhao, R.; Chen, X.; Zhang, F.; Zhang, H.; Schroder, J.; Römheld, V. Fertilization and Nitrogen Balance in a Wheat–Maize Rotation System in North China. Agron. J. 2006, 98, 938–945. [Google Scholar] [CrossRef]
- Rozas, H.S.; Echeverría, H.E.; Studdert, G.A.; Domínguez, G. Evaluation of the Presidedress Soil Nitrogen Test for No-tillage Maize Fertilized at Planting. Agron. J. 2000, 92, 1176–1183. [Google Scholar] [CrossRef]
- Magdoff, F.R.; Jokela, W.E.; Fox, R.H.; Griffin, G.F. A Soil Test for Nitrogen Availability in the Northeastern United States. Commun. Soil Sci. Plant Anal. 1990, 21, 1103–1115. [Google Scholar] [CrossRef]
- Lee, E.K.; Zhang, X.; Adler, P.R.; Kleppel, G.S.; Romeiko, X.X. Spatially and Temporally Explicit Life Cycle Global Warming, Eutrophication, and Acidification Impacts from Corn Production in the US Midwest. J. Clean. Prod. 2020, 242, 118465. [Google Scholar] [CrossRef]
- Landis, A.E.; Miller, S.A.; Theis, T.L. Life Cycle of the Corn− Soybean Agroecosystem for Biobased Production. Environ. Sci. Technol. 2007, 41, 1457–1464. [Google Scholar] [CrossRef] [PubMed]
- Hunter, K.A.; Liss, P.S.; Surapipith, V.; Dentener, F.; Duce, R.; Kanakidou, M.; Kubilay, N.; Mahowald, N.; Okin, G.; Sarin, M. Impacts of Anthropogenic SOx, NOx and NH3 on Acidification of Coastal Waters and Shipping Lanes. Geophys. Res. Lett. 2011, 38. [Google Scholar]
- Kim, S.; Dale, B.E.; Keck, P. Energy Requirements and Greenhouse Gas Emissions of Maize Production in the USA. Bioenergy Res. 2014, 7, 753–764. [Google Scholar] [CrossRef]
- Ewing, P.M.; Runck, B.C. Optimizing Nitrogen Rates in the Midwestern United States for Maximum Ecosystem Value. Ecol. Soc. 2015, 20. [Google Scholar] [CrossRef]
- Kitchen, N.R.; Shanahan, J.F.; Ransom, C.J.; Bandura, C.J.; Bean, G.M.; Camberato, J.J.; Carter, P.R.; Clark, J.D.; Ferguson, R.B.; Fernández, F.G. A Public–Industry Partnership for Enhancing Corn Nitrogen Research and Datasets: Project Description, Methodology, and Outcomes. Agron. J. 2017, 109, 2371–2389. [Google Scholar] [CrossRef]
- Abendroth, L.; Elmore, R.; Boyer, M.; Marlay, S. Corn Growth and Development. Iowa State Univ. Extension Publication. PMR-1009. 2011.
- Brown, J.R. Recommended Chemical Soil Test Procedures for the North Central Region; Missouri Agricultural Experiment Station, University of Missouri--Columbia. 1998. [Google Scholar]
- Greenwood, D.J.; Lemaire, G.; Gosse, G.; Cruz, P.; Draycott, A.; Neeteson, J.J. Decline in Percentage N of C3 and C4 Crops with Increasing Plant Mass. Ann. Bot. 1990, 66, 425–436. [Google Scholar] [CrossRef]
- Hernández, F.; Amelong, A.; Borrás, L. Genotypic Differences among Argentinean Maize Hybrids in Yield Response to Stand Density. Agron. J. 2014, 106, 2316–2324. [Google Scholar] [CrossRef]
- Shao, H.; Shi, D.; Shi, W.; Ban, X.; Chen, Y.; Ren, W.; Chen, F.; Mi, G. Nutrient Accumulation and Remobilization in Relation to Yield Formation at High Planting Density in Maize Hybrids with Different Senescent Characters. Arch. Agron. Soil Sci. 2021, 67, 487–503. [Google Scholar] [CrossRef]
- Sogbedji, J.M.; van Es, H.M.; Yang, C.L.; Geohring, L.D.; Magdoff, F.R. Nitrate Leaching and Nitrogen Budget as Affected by Maize Nitrogen Rate and Soil Type; Wiley Online Library. 2000. [Google Scholar]
- Shahandeh, H.; Wright, A.; Hons, F.; Lascano, R. Spatial and Temporal Variation of Soil Nitrogen Parameters Related to Soil Texture and Corn Yield. Agron. J. 2005, 97, 772–782. [Google Scholar] [CrossRef]
- Tremblay, N.; Bouroubi, Y.M.; Bélec, C.; Mullen, R.W.; Kitchen, N.R.; Thomason, W.E.; Ebelhar, S.; Mengel, D.B.; Raun, W.R.; Francis, D.D. Corn Response to Nitrogen Is Influenced by Soil Texture and Weather. Agron. J. 2012, 104, 1658–1671. [Google Scholar] [CrossRef]
- Zhou, B.; Yue, Y.; Sun, X.; Wang, X.; Wang, Z.; Ma, W.; Zhao, M. Maize Grain Yield and Dry Matter Production Responses to Variations in Weather Conditions. Agron. J. 2016, 108, 196–204. [Google Scholar] [CrossRef]
- Van Es, H.; Yang, C.; Geohring, L. Maize Nitrogen Response as Affected by Soil Type and Drainage Variability. Precis. Agric. 2005, 6, 281–295. [Google Scholar] [CrossRef]
- He, Z.; Qiu, X.; Ata-Ul-Karim, S.T.; Li, Y.; Liu, X.; Cao, Q.; Zhu, Y.; Cao, W.; Tang, L. Development of a Critical Nitrogen Dilution Curve of Double Cropping Rice in South China. Front. Plant Sci. 2017, 8, 638. [Google Scholar] [CrossRef] [PubMed]
- Miao, Y.; Mulla, D.J.; Robert, P.C. Identifying Important Factors Influencing Corn Yield and Grain Quality Variability Using Artificial Neural Networks. Precis. Agric. 2006, 7, 117–135. [Google Scholar] [CrossRef]
- Gonzalez-Dugo, V.; Durand, J.-L.; Gastal, F. Water Deficit and Nitrogen Nutrition of Crops. A Review. Agron. Sustain. Dev. 2010, 30, 529–544. [Google Scholar] [CrossRef]
- Sadras, V.O.; Lemaire, G. Quantifying Crop Nitrogen Status for Comparisons of Agronomic Practices and Genotypes. Field Crops Res. 2014, 164, 54–64. [Google Scholar] [CrossRef]
- Li, D.; Miao, Y.; Ransom, C.J.; Bean, G.M.; Kitchen, N.R.; Fernández, F.G.; Sawyer, J.E.; Camberato, J.J.; Carter, P.R.; Ferguson, R.B. Corn Nitrogen Nutrition Index Prediction Improved by Integrating Genetic, Environmental, and Management Factors with Active Canopy Sensing Using Machine Learning. Remote Sens. 2022, 14, 394. [Google Scholar] [CrossRef]
- Huang, S.; Miao, Y.; Zhao, G.; Yuan, F.; Ma, X.; Tan, C.; Yu, W.; Gnyp, M.L.; Lenz-Wiedemann, V.I.; Rascher, U. Satellite Remote Sensing-Based in-Season Diagnosis of Rice Nitrogen Status in Northeast China. Remote Sens. 2015, 7, 10646–10667. [Google Scholar] [CrossRef]
- Ata-Ul-Karim, S.T.; Liu, X.; Lu, Z.; Yuan, Z.; Zhu, Y.; Cao, W. In-Season Estimation of Rice Grain Yield Using Critical Nitrogen Dilution Curve. Field Crops Res. 2016, 195, 1–8. [Google Scholar] [CrossRef]
- Wang, Y.; Shi, P.; Ji, R.; Min, J.; Shi, W.; Wang, D. Development of a Model Using the Nitrogen Nutrition Index to Estimate In-Season Rice Nitrogen Requirement. Field Crops Res. 2020, 245, 107664. [Google Scholar] [CrossRef]
- Ziadi, N.; Brassard, M.; Bélanger, G.; Claessens, A.; Tremblay, N.; Cambouris, A.N.; Nolin, M.C.; Parent, L. Chlorophyll Measurements and Nitrogen Nutrition Index for the Evaluation of Corn Nitrogen Status. Agron. J. 2008, 100, 1264–1273. [Google Scholar] [CrossRef]
- Paleari, L.; Movedi, E.; Vesely, F.M.; Thoelke, W.; Tartarini, S.; Foi, M.; Boschetti, M.; Nutini, F.; Confalonieri, R. Estimating Crop Nutritional Status Using Smart Apps to Support Nitrogen Fertilization. A Case Study on Paddy Rice. Sensors 2019, 19, 981. [Google Scholar] [CrossRef] [PubMed]
- Mistele, B.; Schmidhalter, U. Estimating the Nitrogen Nutrition Index Using Spectral Canopy Reflectance Measurements. Eur. J. Agron. 2008, 29, 184–190. [Google Scholar] [CrossRef]
- Cao, Q.; Miao, Y.; Feng, G.; Gao, X.; Li, F.; Liu, B.; Yue, S.; Cheng, S.; Ustin, S.L.; Khosla, R. Active Canopy Sensing of Winter Wheat Nitrogen Status: An Evaluation of Two Sensor Systems. Comput. Electron. Agric. 2015, 112, 54–67. [Google Scholar] [CrossRef]
- Lu, J.; Miao, Y.; Shi, W.; Li, J.; Yuan, F. Evaluating Different Approaches to Non-Destructive Nitrogen Status Diagnosis of Rice Using Portable RapidSCAN Active Canopy Sensor. Sci. Rep. 2017, 7, 14073. [Google Scholar] [CrossRef]
- Wang, X.; Miao, Y.; Dong, R.; Chen, Z.; Guan, Y.; Yue, X.; Fang, Z.; Mulla, D.J. Developing Active Canopy Sensor-Based Precision Nitrogen Management Strategies for Maize in Northeast China. Sustainability 2019, 11, 706. [Google Scholar] [CrossRef]
- Zha, H.; Miao, Y.; Wang, T.; Li, Y.; Zhang, J.; Sun, W.; Feng, Z.; Kusnierek, K. Improving Unmanned Aerial Vehicle Remote Sensing-Based Rice Nitrogen Nutrition Index Prediction with Machine Learning. Remote Sens. 2020, 12, 215. [Google Scholar] [CrossRef]
- Fabbri, C.; Mancini, M.; dalla Marta, A.; Orlandini, S.; Napoli, M. Integrating Satellite Data with a Nitrogen Nutrition Curve for Precision Top-Dress Fertilization of Durum Wheat. Eur. J. Agron. 2020, 120, 126148. [Google Scholar] [CrossRef]
- Nutini, F.; Confalonieri, R.; Crema, A.; Movedi, E.; Paleari, L.; Stavrakoudis, D.; Boschetti, M. An Operational Workflow to Assess Rice Nutritional Status Based on Satellite Imagery and Smartphone Apps. Comput. Electron. Agric. 2018, 154, 80–92. [Google Scholar] [CrossRef]
- Dong, R.; Miao, Y.; Wang, X.; Chen, Z.; Yuan, F. Improving Maize Nitrogen Nutrition Index Prediction Using Leaf Fluorescence Sensor Combined with Environmental and Management Variables. Field Crops Res. 2021, 269, 108180. [Google Scholar] [CrossRef]
- Bacenetti, J.; Paleari, L.; Tartarini, S.; Vesely, F.M.; Foi, M.; Movedi, E.; Ravasi, R.A.; Bellopede, V.; Durello, S.; Ceravolo, C. May Smart Technologies Reduce the Environmental Impact of Nitrogen Fertilization? A Case Study for Paddy Rice. Sci. Total Environ. 2020, 715, 136956. [Google Scholar] [CrossRef] [PubMed]
- Zhang, K.; Yuan, Z.; Yang, T.; Lu, Z.; Cao, Q.; Tian, Y.; Zhu, Y.; Cao, W.; Liu, X. Chlorophyll Meter–Based Nitrogen Fertilizer Optimization Algorithm and Nitrogen Nutrition Index for In-season Fertilization of Paddy Rice. Agron. J. 2020, 112, 288–300. [Google Scholar] [CrossRef]
- Lu, J.; Dai, E.; Miao, Y.; Kusnierek, K. Improving Active Canopy Sensor-Based in-Season Rice Nitrogen Status Diagnosis and Recommendation Using Multi-Source Data Fusion with Machine Learning. J. Clean. Prod. 2022, 380, 134926. [Google Scholar] [CrossRef]
Figure 1.
Maize plant and soil status indicators as affected by nitrogen (N) application rates at V9 and VT growth stages: a) plant N concentration; b) aboveground biomass; c) plant N uptake; d) N nutrition index (NNI); and e) soil nitrate-N concentration. .
Figure 1.
Maize plant and soil status indicators as affected by nitrogen (N) application rates at V9 and VT growth stages: a) plant N concentration; b) aboveground biomass; c) plant N uptake; d) N nutrition index (NNI); and e) soil nitrate-N concentration. .
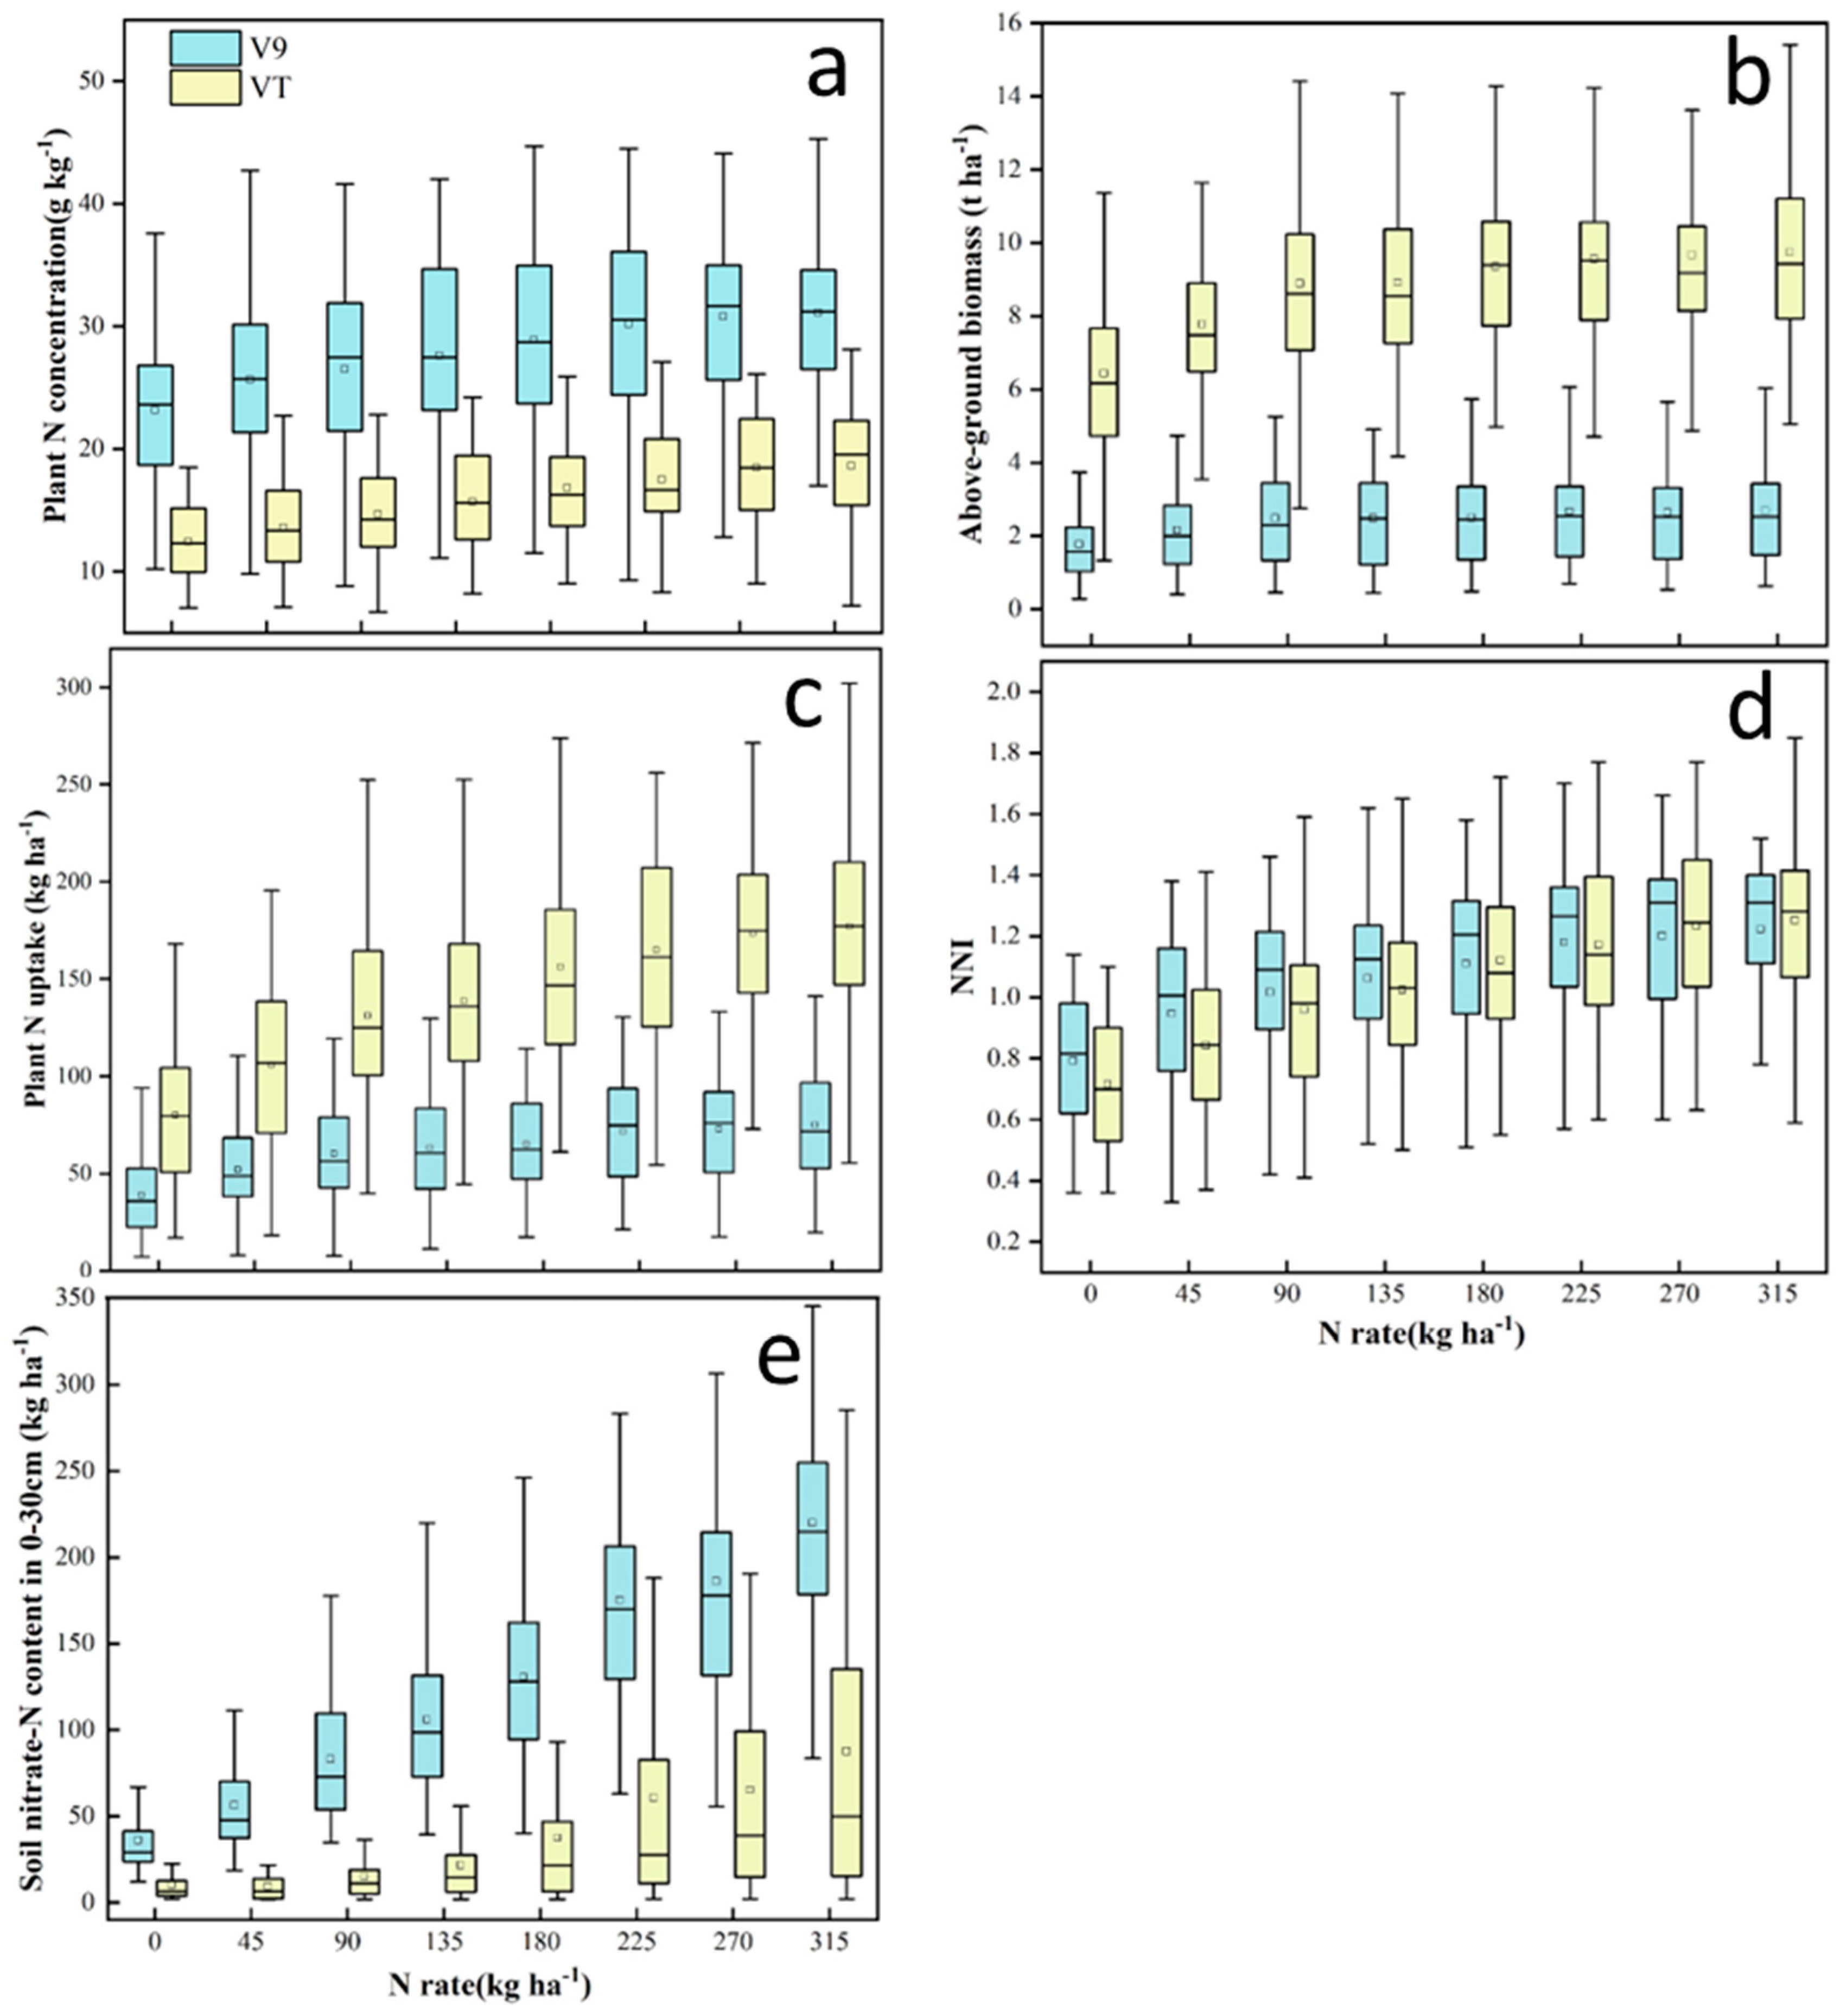
Figure 2.
Evaluation of critical N dilution curves (CNDC) developed in France (solid line) [14] and China (dashed line) [21] using shoot biomass and N concentration data from corn grown under N-limiting and non-limiting conditions in the US Midwest at V9 and VT development growth stages (a), at V9 only (b) and at VT only (c). Each point represents the value of each replication of a site-year and N rate treatment.
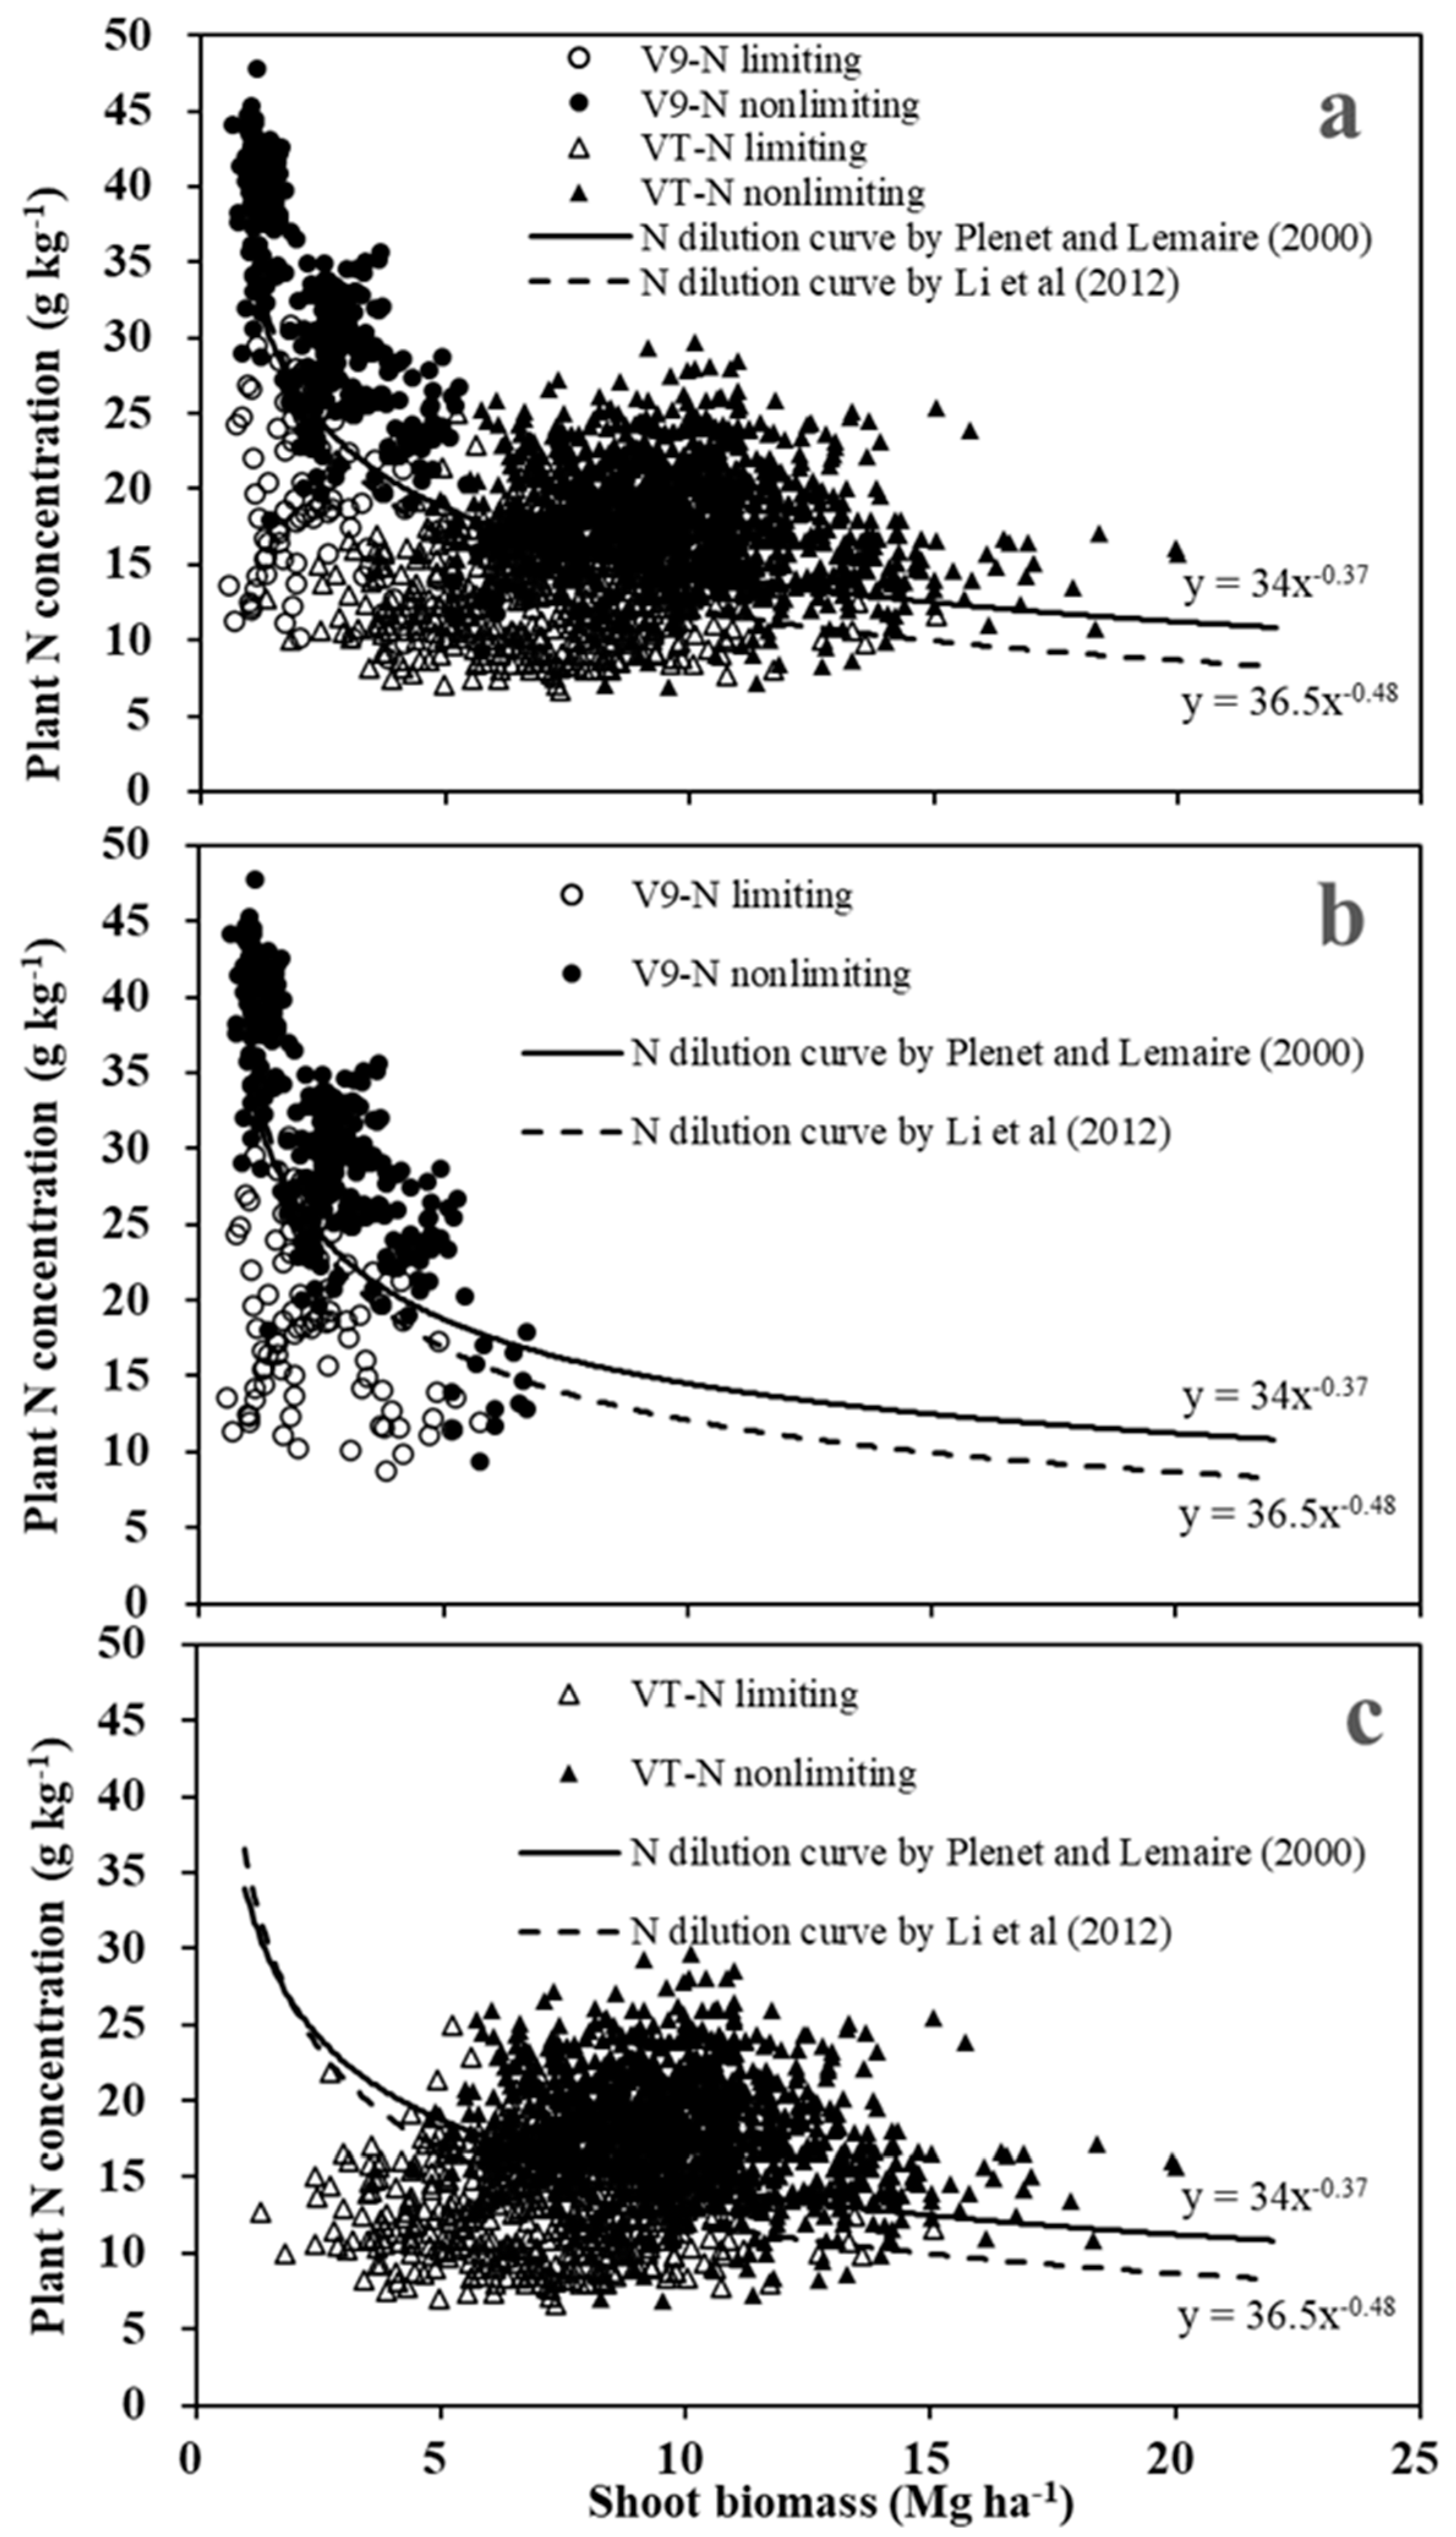
Figure 3.
Relationship between relative grain yield and NNI (based on French CNDC) [14] across different site-years at V9 (a) and VT (b), fit using linear-plateau models. Each point represents the value of each repetition of different treatments.
Figure 3.
Relationship between relative grain yield and NNI (based on French CNDC) [14] across different site-years at V9 (a) and VT (b), fit using linear-plateau models. Each point represents the value of each repetition of different treatments.

Figure 4.
Box and whisker distributions of site-year values when NNI (based on French CNDC) [14] reached the plateau for V9 and VT developmental growth stages. The solid line in the figure indicates the median, the box boundaries indicate the 25th and 75th percentile, and the whiskers the min and max.
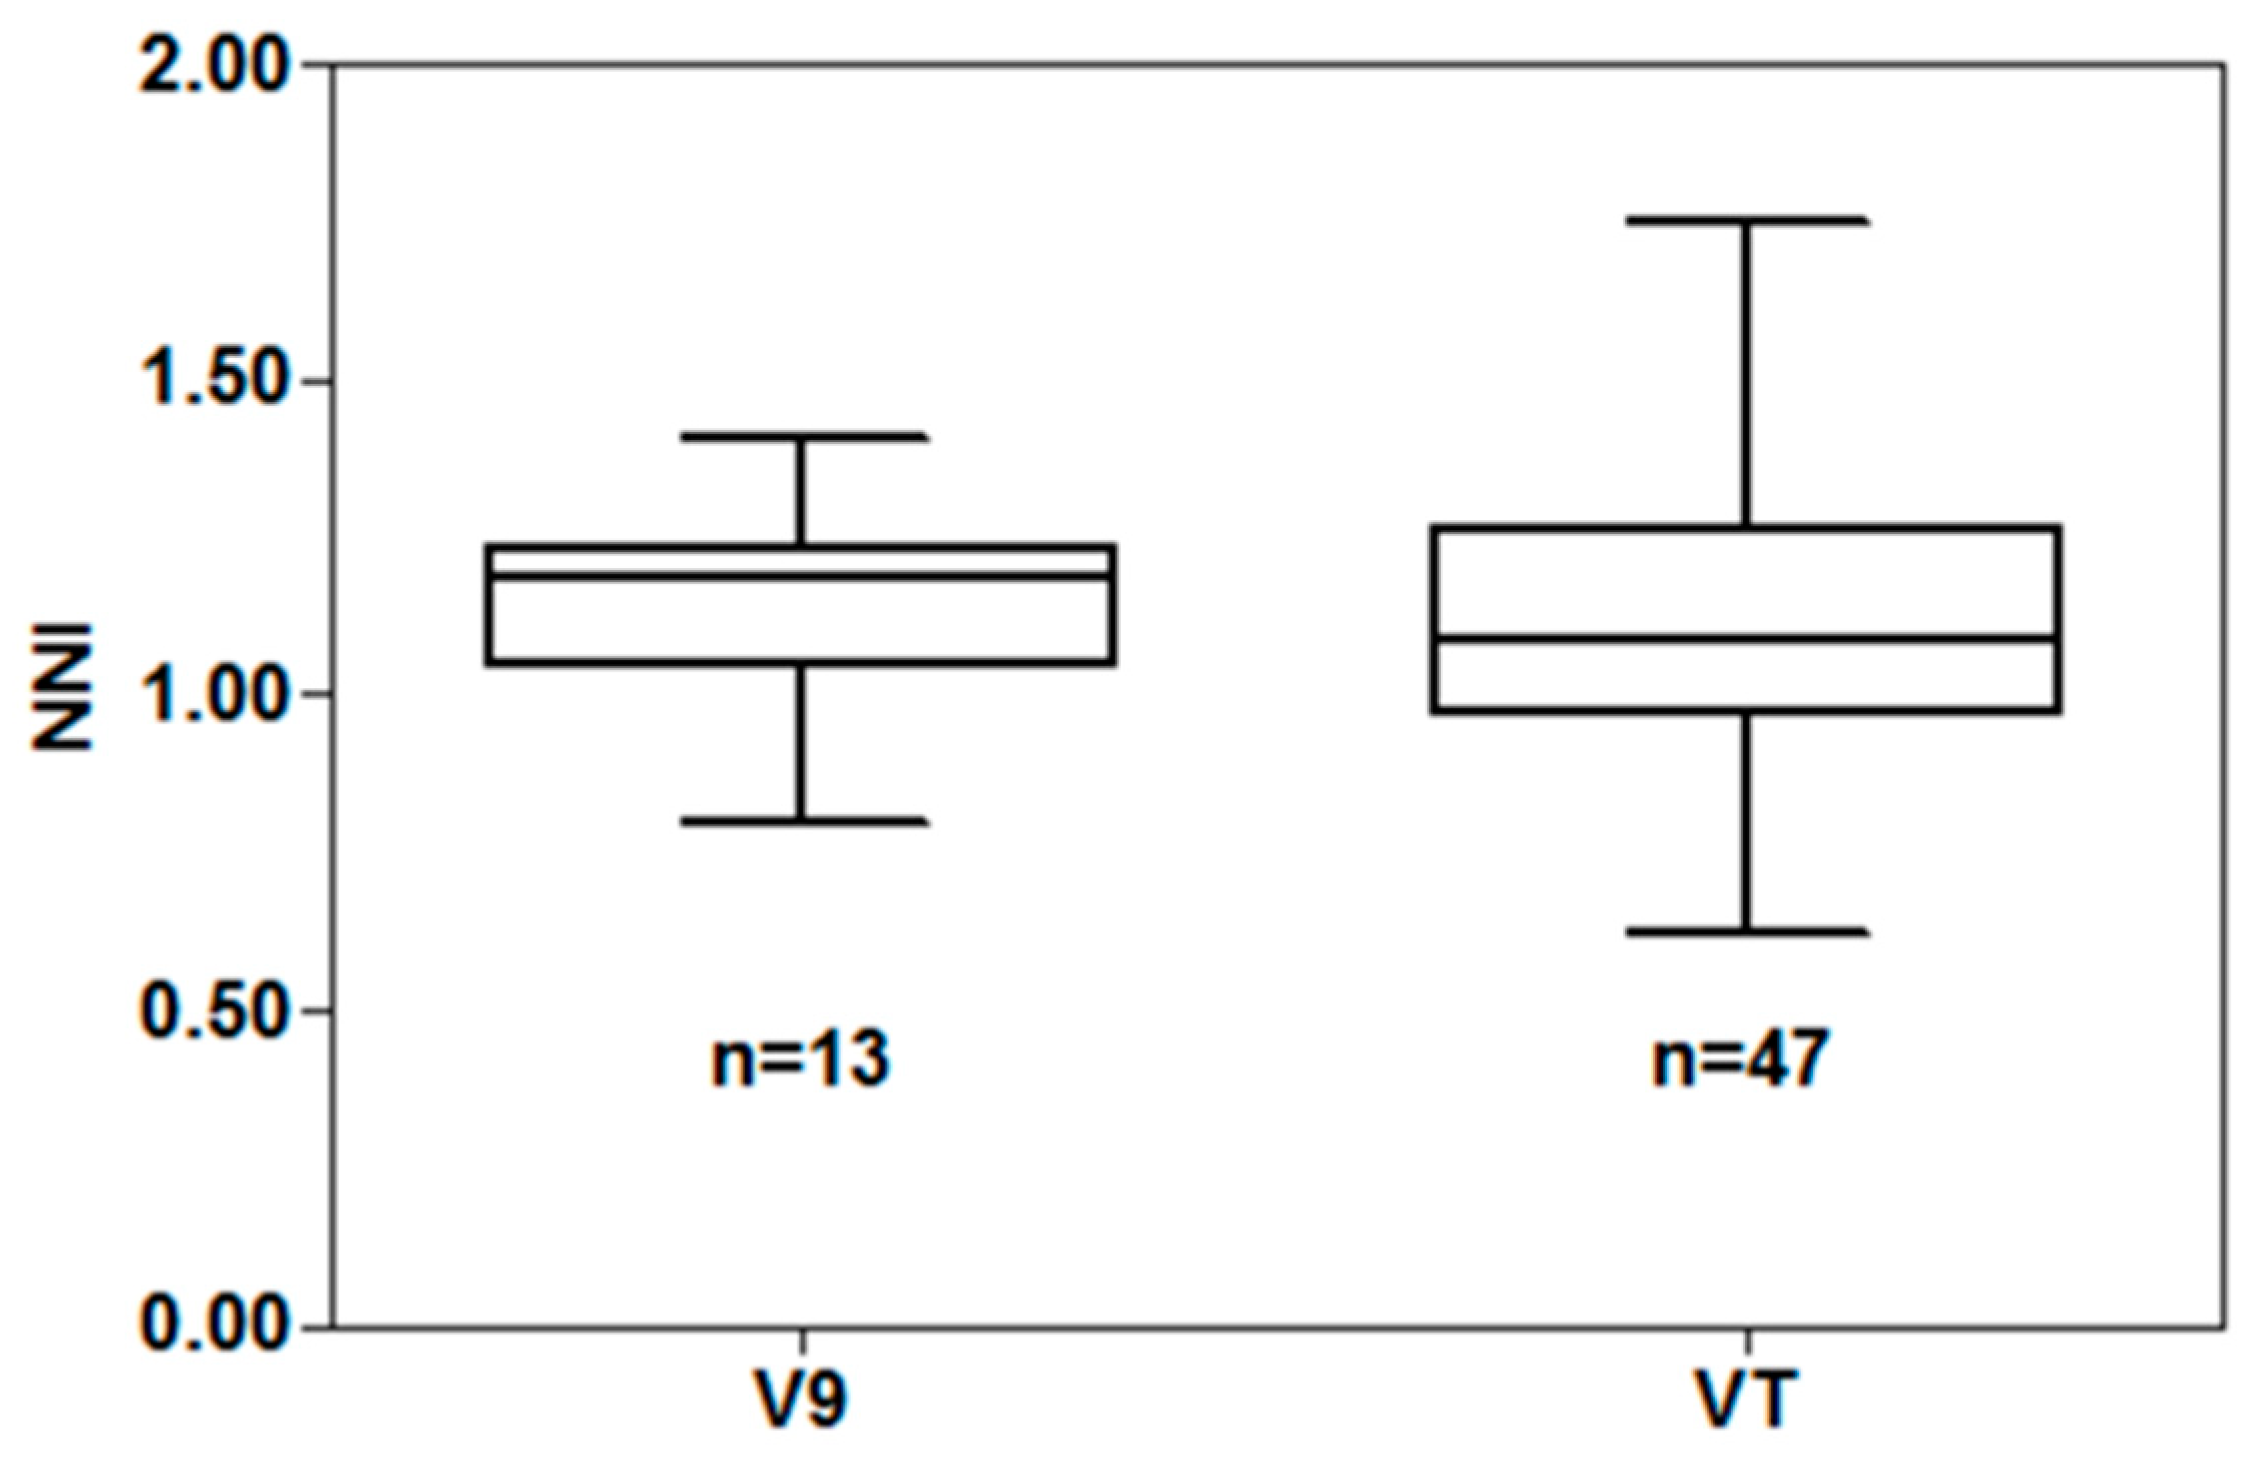
Figure 5.
Nitrogen nutrition index (NNI-based on the French CNDC) [14] shown relative to soil nitrate-N content in uppermost 0-30 cm at V9 and VT development stages. Data across site-years were pooled for the analysis. Each point represents the mean of four replications of each N rate treatment. Horizontal and vertical dash lines indicate the NNI and soil nitrate-N content values where relative grain yield reached a plateau.
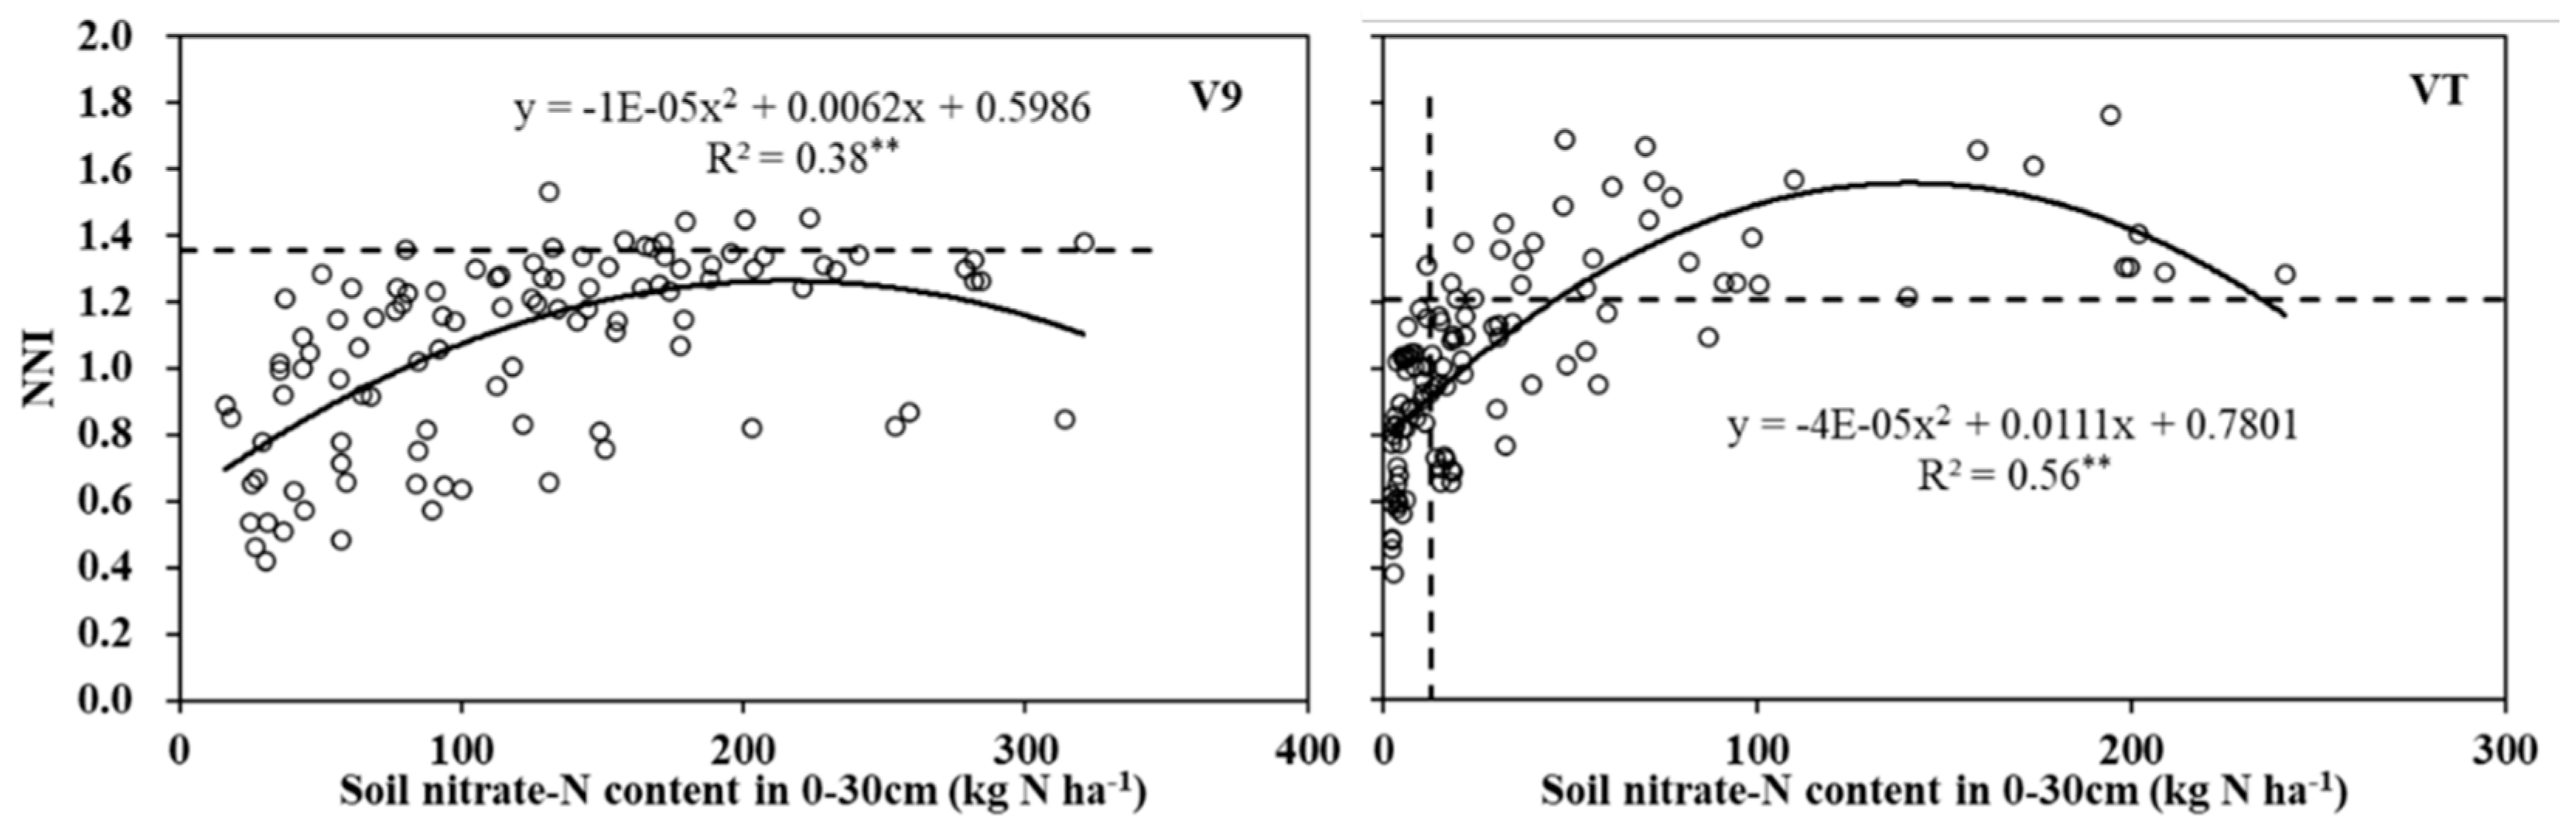
Figure 6.
Relationship between relative grain yield and soil nitrate-N content in 0-30 across different site-years and N rates at V9 (left) and VT (right) growth stages.
Figure 6.
Relationship between relative grain yield and soil nitrate-N content in 0-30 across different site-years and N rates at V9 (left) and VT (right) growth stages.
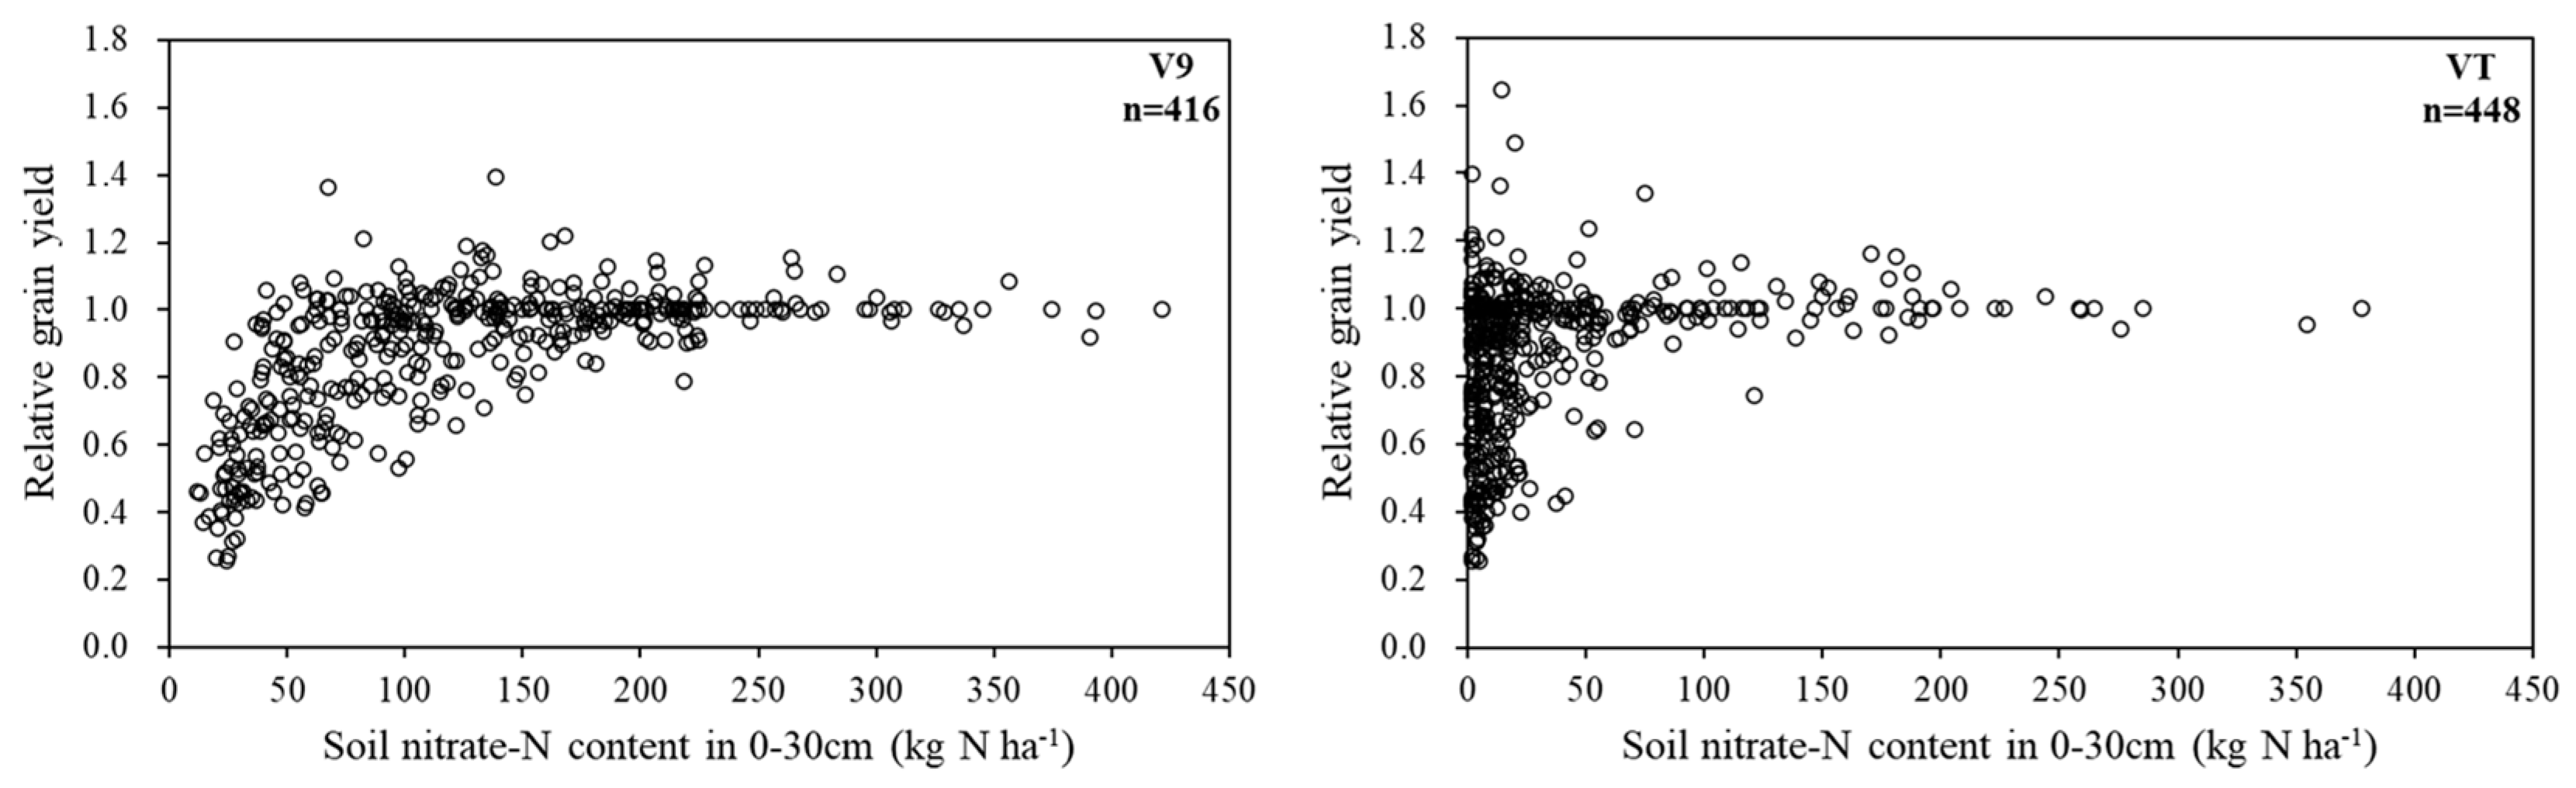
Figure 7.
Relationship between relative grain yield and soil nitrate-N content in 0-30 across different site-years and N rates at V9 (left) and VT (right) growth stages.
Figure 7.
Relationship between relative grain yield and soil nitrate-N content in 0-30 across different site-years and N rates at V9 (left) and VT (right) growth stages.
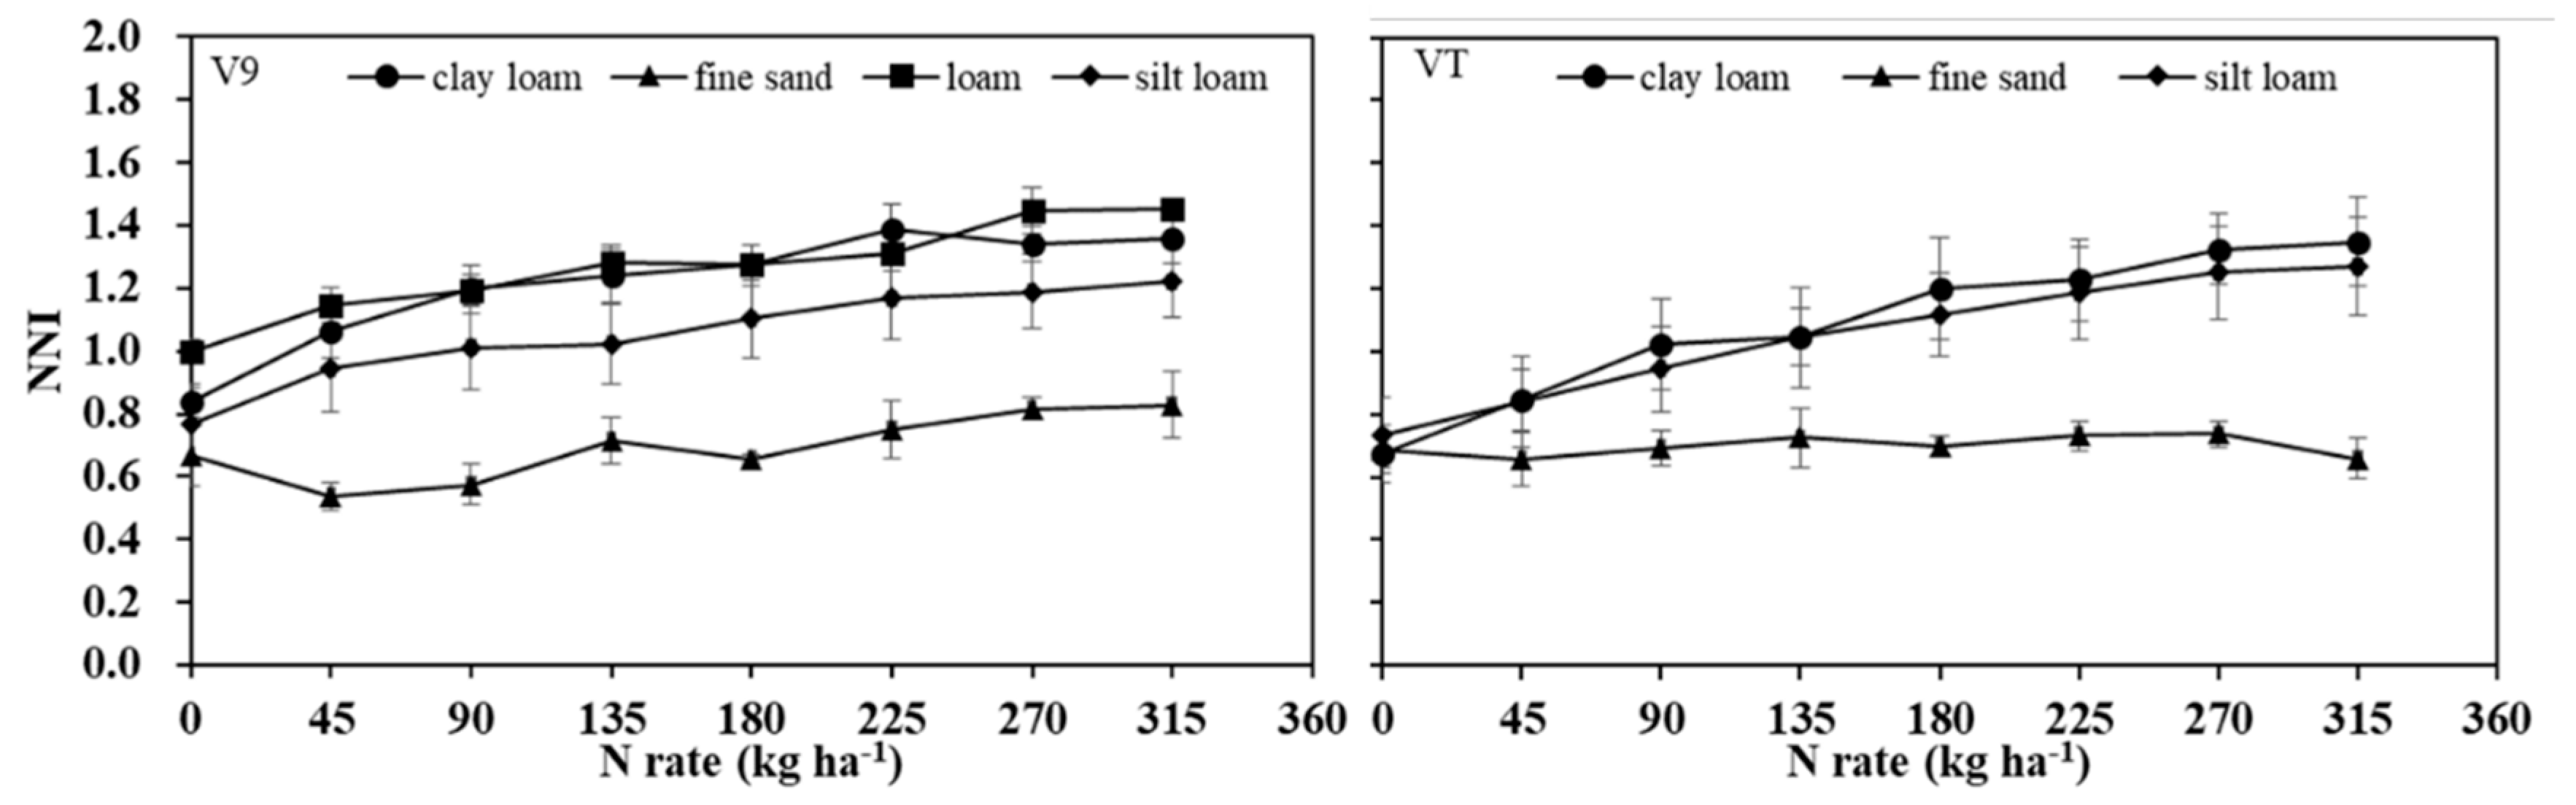

Table 1.
Descriptive statistics of plant N concentration, shoot biomass, plant N uptake, nitrogen nutrition index (NNI), and soil nitrate-N content in the 0-30 cm depth at different growth stages for maize from 49 N rate response trials conducted in the US Midwest Corn Belt.
Table 1.
Descriptive statistics of plant N concentration, shoot biomass, plant N uptake, nitrogen nutrition index (NNI), and soil nitrate-N content in the 0-30 cm depth at different growth stages for maize from 49 N rate response trials conducted in the US Midwest Corn Belt.
| Growth stage | V9 (n=104) | VT (n=112) | Across all stages (n=600) | |||||||||
| Mean | Range | SD | CV | Mean | Range | SD | CV | Mean | Range | SD | CV | |
| Plant N concentration (g kg-1) | 28.0 | 11.4-43.3 | 8.2 | 29.2 | 16.0 | 7.5-25.5 | 4.2 | 26.5 | 21.8 | 7.5-43.3 | 8.8 | 40.5 |
| Above-ground biomass (Mg ha-1) | 2.42 | 0.39-6.20 | 1.31 | 54.2 | 8.79 | 2.49-14.79 | 2.58 | 29.4 | 5.73 | 0.39-14.79 | 3.80 | 66.4 |
| Plant N uptake (kg ha-1) | 62.3 | 9.6-129.1 | 27.6 | 44.3 | 140.9 | 32.4-264.4 | 53.3 | 37.8 | 103.1 | 9.6-264.4 | 58.1 | 56.4 |
| NNI | 1.07 | 0.42-1.53 | 0.28 | 26.1 | 1.04 | 0.38-1.76 | 0.30 | 29.1 | 1.05 | 0.38-1.76 | 0.29 | 27.6 |
| Soil nitrate-N content in 0-30cm (kg ha-1) | 124.1 | 16.4-320.6 | 74.3 | 59.8 | 38.4 | 2.2-241.1 | 52.4 | 136.6 | 79.7 | 2.2-320.6 | 76.9 | 96.5 |
1 SD: standard deviation of the mean; CV: coefficient of variation (%).
Table 2.
Evaluation of the of critical N dilution curves (CNDC) developed in France [14] and China [21] for assessing N sufficiency of maize grown in the US Midwest Corn Belt using data from N limiting and N non-limiting treatments.
| Growth stage | Accuracy of French Critical N Dilution Curve (%) | Accuracy of Chinese Critical N Dilution Curve (%) | ||||
| Total | N-limiting | N-non limiting | Total | N-limiting | N-non limiting | |
| V9 (n=187) | 89.6 | 87.5 | 90.3 | 89.2 | 87.5 | 89.7 |
| VT (n=463) | 91.8 | 89.1 | 92.9 | 88.6 | 66.4 | 97.7 |
| Across all stages (n=650) | 90.7 | 88.3 | 91.5 | 61.6 | 39.0 | 66.7 |
Disclaimer/Publisher’s Note: The statements, opinions and data contained in all publications are solely those of the individual author(s) and contributor(s) and not of MDPI and/or the editor(s). MDPI and/or the editor(s) disclaim responsibility for any injury to people or property resulting from any ideas, methods, instructions or products referred to in the content. |
© 2023 by the authors. Licensee MDPI, Basel, Switzerland. This article is an open access article distributed under the terms and conditions of the Creative Commons Attribution (CC BY) license (https://creativecommons.org/licenses/by/4.0/).
Copyright: This open access article is published under a Creative Commons CC BY 4.0 license, which permit the free download, distribution, and reuse, provided that the author and preprint are cited in any reuse.


