
Submitted:
30 June 2023
Posted:
30 June 2023
You are already at the latest version
Abstract
Creep is a fundamental property naturally exists in some types of rock, which is significant for the long-term stability of roadways during the mining process. In this paper, the long-term strength of coal and rock were obtained via laboratory experiments, and a Cvisc elasto-viscoplastic model was adopted and introduced in FLAC3D, based on the 3101 transport roadway in Hongqinghe Coal Mine, to investigate the influence of creep on the stability of deep-high stress roadway. The test results show that the long-term strength of 3-1 coal and sandy mudstone, respectively, is 18.65 MPa, 39.95 MPa. The plastic zone, the deformation, and the damage of roadway surrounding rock behave an obvious increase after being excavated for 720d as the creep model was chosen. The plastic zone failure with models shear-p (1090.7 m3), shear-n (381.7 m3), tension-n (98.4 m3), and tension-p (30.8 m3), the damage value has an obvious increment of increased 21.2% (0.053), the deformation increases in the order is two-sidewalls (1978 mm), roof (907 mm), floor (101 mm). The creep of the roadway can be divided into three stages: the accelerating stage, the decaying stage, and the stable stage. The creep speed of each stage is greatly affected by the presence or absence of anchor spray support: the creep speed of the bare roadway roof, roadway side, and floor stability, respectively, is 1.01, 1.02, and 0.12 mm/d; After anchor spray support, the creep velocity, correspondingly, decreased to 0.69, 0.37, and 0.12 mm/d, and the amount of surrounding rock damage decreased from 0.302 to 0.243. This indicates that the anchor spray support can significantly reduce the creep effect of the roadway. The Cvisc creep model was verified reliable and can provide guidance for deep high-stress coal roadway support.

Keywords:
high-stress
; coal roadway
; creep
; elasto-viscoplastic model
; numerical simulation
; time-dependent stability.
1. Introduction
In recent years, with the increasing depletion of shallow coal resources in China and the increasing depth of coal mining, the difficulty of controlling the surrounding rock of deep roadways has significantly increased, and the problem of rock creep has become increasingly prominent. It has been verified that creep may cause a number of engineering disasters such as roof caving, floor heave, and side wall collapse, which increase the security risk of deep roadways. Therefore, it is of great significance for maintaining the long-term stability of roadways to consider the creep effect in the control of surrounding rock in deep roadways.
Creep is an important mechanical property of rocks and has been receiving much attention in recent decades. On one hand, physical testing is an effective means for studying numerous aspects of creep for rock. In the literature, the effectiveness of the long-term strength of rocks has been determined through uniaxial compression experiments (Helal et al. 1988; Lajtai 1991; Chen et al. 2018; Liu et al. 2020). Several researchers have investigated the creep characteristics of rocks under various environmental conditions, such as water, temperature, freeze-thaw, and acid-base solutions (Ma et al. 2018; Yao et al. 2019; Li 2017; Liu 2012; Zhang et al. 2017; Chen et al.2017; Wang et al. 2019; Jiang 2016), and various stress paths such as direct tensile creep test, uniaxial step loading creep test, triaxial cycling creep test(Shen et al. 2021; Zhao et al. 2011; Hu et al. 2015). Rock creep behavior is monitored by acoustic emission (AE)(Li 2017; Gong et al. 2015), and the fracture morphology of rock creep failure is revealed by scanning electron microscopy (SEM) (Niroshan et al. 2018; Liu et al. 2017; Jiang et al. 2017).
On the other hand, numerical simulation software can serve as a complementary means of investigation, such as FLAC3D software, RFPA 2Dsoftware and Comsol software (Xu and Yang 2018; Yin et al. 2015; Li et al. 2007; Lu and Wang 2015). In addition, Various nonlinear models have been used to study creep, among which the important ones are: the Burgers model(Cai 2013; Sheng 2006),and the viscoelastic plastic model (Zuo et al. 2018; Liu et al.2018; Zhang et al .2021), Creep damage model (Guo et al. 2018; Yin et al. 2017; Cai and Cao 2016; Wang and Sheng 2019; Huang et al.2017; Zhao et al. 2016), Creep hardening damage model (Song et al. 2012; Cheng et al. 2022). They are almost based on the Burger model. Meanwhile, numerical simulation analysis considering rock creep factors combined with on-site application in engineering practice. Kang et al.(2015) study the rock roadway creep for the kilometer-deep mine with UDEC numerical simulation. Huang et al.(2018) explore the forming reason of deep roadway’s asymmetric deformation over 1000 meters and solve the long-term stability control. Mechanism of creep-induced coal burst is put forward by researchers(Jiang et al.2015; Wang et al. 2019; Song et al. 2018; Chen et al. 2020). The simulation on the long term stability was carried out to the gypsum pillar and coal pillar(Yang et al. 2015,2017; Yang and Tian 2016; Zhang et al. 2017).By means of the contrast analysis of creep numerical simulation and physical simulation test, the mechanism of roadway floor heave has been studied(Pan et al.1998). Wei et al.(2013) pointed out that unstable rheological layer was the main cause of diverticulum damage creep. Dong et al.(2018) constructed a coupled creep model of surrounding rock and rock bolt, and proposed an improved support scheme.
However, most of the above studies based on the Burger creep model are to study the creep of roadways, while Burger model does not consider the plastic flow of deep rock mass, besides, few studies delineate the creep of deep high-stress coal roadways. Therefore, it is necessary to study the creep of deep high-stress coal roadways based on the Cvisc model considering the plastic flow. In the present paper, the 3101 transportation roadway of Hongqinghe Coal Mine is taken as the engineering background. The long-term strength of coal rock is estimated by the uniaxial compression test in the laboratory. The Cvisc creep model in FLAC3D is compared with the Mohr-Coulomb model, studying the evolution of plastic zone, damage, and displacement field in the case of deep high-stress coal roadway with or without creep participation. The objectives of this paper are as follows: (i) The long-term strength of coal and rock was obtained. (ii) Cvisc creep model considering time effect and Mohr-Coulomb were compared in numerical simulation. (3) The simulation results based on the Cvisc model were verified that it is in good agreement with the field measurements.
2. Analysis of engineering situations
2.1. Engineering geology
Hongqinghe Coal Mine is located in Inner Mongolia, China, as shown in Figure 1. This mine produces approximately 15 million tons of coal annually and area of mine field area is 140.76 km2. Its structural form is consistent with the regional coal-bearing strata. It is generally a westward dipping monoclinic structure, and the coal-bearing strata belong to the typical Yan'an Formation of the Middle and Lower Jurassic. The 31101 mining panel is located in southwest of the minefield. The strike length and the dip width of the panel are 1387m and 235m, respectively, with 3°inclination and 7.0 m thickness. Full coal seam, comprehensive mechanized mining method is adopted in this mining panel. As the first mining panel, the mean thickness of the No.3-1 coal seam is 7.0m, with an average overburden depth of 720m. The layout plan of the roadway driven along the goaf is shown in Figure 2. According to the geological survey, the immediate roof is composed of thick gray-layered sandy mudstone and siltstone with a thickness of 5.20 m. The immediate floor is composed of grayish-black sandy mudstone of shale structure, with a thickness of 8.58 m. The comprehensive geological map of the mine is shown in Figure 3.
Both the roof and floor are weak and semi-hard rock layers that have poor stability. The mechanical properties of rock mass degrade severely, under high in-situ stress, the deformation of rock masses becomes more and more serious, and the surrounding rock masses exhibit rheological deformation, as well as large and long-duration deformation. Especially, the 3101 transport roadway drives along the floor, and appears severely(obvious) deformation as time passes. Along with the squeezing failure at the lower rib of the roadway, the floor heave is also very serious, as shown in Figure 4.
2.2. Support parameters and solutions
The 31101 transport is 4900 m long, with a section size of 5600 mm×4000 mm. Combined with the characteristics of high crustal stress, surrounding rock easy to be softened and expanded when encountering air weathering, water, and construction speed, the preliminary support parameters are as follows :
- Roof support adopts 6 left-hand threaded steel longitudinal bolts, the specification isφ22mm ×L 2400mm, and the row and column spacing is 1000 mm ×1000 mm. Adopting arch-shaped high-strength tray, with a steel grade of no less than Q235 and a specification of 150 mm × 150 mm × 10mm, with an arch height of not less than 34mm, equipped with self-aligning ball pads and drag-reducing nylon washers.
- Sidewall support adopts 5 bolts, and the row and column spacing is 850 mm×1000 mm, and whose parameters are the same as the roof. The sidewall hangs 16# wire braided metal diamond mesh with a size of 5800 mm×1100 mm.
- The floor is supported by two bolts and each bolt is fitted with two resin cartridges of MSSK2350 and MSK2350. The pretension force is not less than 300 N.m.
The different supporting schemes are investigated in this study: (1)The bolt is perpendicular to the roadway roof and sidewall, (2)side bolt is at an included angle of 45° relative to the roadway roof, sidewalls, and floor. After the anchor is completed, full-section shotcrete is sprayed with C20 concrete to a thickness of 150 mm.
3. Laboratory experiments
3.1. Determination of long-term strength of coal and rock
The long-term strength of rock and coal that characterizes the aging condition is an important mechanical index to evaluate the stability of rock mass engineering. At present, two prevalent methods to calculate the long-term strength of coal and rock are summarized as follows (He et al.2002; Helal et al.1988; Niroshan et al.2018):
- By creep test. In this method, the long-term strength of rock is determined by creep experiments which are roughly equivalent to the softening critical load.
- By empirical formula: The calculation formula reads:
σcs =K ▪ Rc
This paper takes the second approach after carrying out a series of uniaxial compression experiments in the laboratory, as shown in Figure 5. Experimental results (in Table 1) indicate that the compressive strengths of coal (No.3-1) and sandy mudstone are 37.30 and 79.90 MPa, respectively. Based on Eq. (1), we obtain the long-term strengths of 3-1 coal and sandy mudstone are 18.65 and 39.95 MPa, respectively.
3.2. Mineral composition and microstructure of deep surrounding rocks
The roof and floor are mainly composed of sandy mudstone, and the 31101 transportation roadway is excavated along the floor. The sandy mudstone is gray, with microwave-wavy bedding and mudstone bands, containing plant leaf fossils. According to X-ray diffraction ( XRD) and scanning electron microscope(SEM), the main composition of sandy mudstone is quartz 50.7%, potassium feldspar 3.6%, plagioclase 15.2%, clay mineral 30.5% (Yimeng mixed bed 6.4%, illite 5.9%, kaolinite 12.2%, chlorite 6%). The sandy mudstone is rich in clay(many illite) that shows strong swelling behavior, easily disintegrates, and softens when meeting with water, and the creep phenomenon of surrounding rock is obvious during the excavation of water-rich sandy mudstone tunnels. The fracture morphology is magnified by 5000 times, and the surface of the fracture appears as a cluster of ductile pits, indicating that the sandy mudstone exhibits typical shear failure.
4. Cvisc creep numerical simulation
4.1. Elasto-viscoplastic creep constitutive model
The Cvisc model introduces a Mohr-Coulomb plastic element based on the Burgers model which assembles a series of Maxwell and Kelvin models (Hu et al. 2018). In the Cvisc model, when the applied stress is smaller than the yield stress σs of the Mohr-Coulomb criterion, the Cvisc model turns out to be the Burger model, and the rheological equation reads as equation (2). Meanwhile, when the applied stress is larger than or equal to the yield stress σs, the element undergoes plastic flow based on the Mohr-Coulomb criterion, the rheological equation is shown as equation (3).
Where ηM-Maxwell viscosity coefficient, ηK-Kelvin viscosity coefficient, EM-Maxwell modulus, EK-Kelvin modulus, σs-yield stress, εP-plastic strain.
As the stress induced by coal mining is large in the deep layers, the Cvisc model can well describe the creep characteristics and plastic flow of coal/rock mass, as shown in Figure 6.
4.2. Numerical model description
Based on the geological conditions of the surrounding rock for the 31101 transportation roadway, the numerical model is established by FLAC5.0, and the mesh is divided by local encryption and gradation. The numerical model, with the calculation range of 50m(X)× 20m(Y) × 30m(Z), was divided into 38000 zones and 42672 grid points, and the shape of the 31101 is a rectangle, and the width and height of dimensions is 5.5m×4.0m. The lateral and bottom boundary displacements are constrained, and the upper boundary represents the free surface. According to the hydraulic fracturing logging report of the Majihe Minefield where the Hongqinghe Mine is located, the in-situ stress test data of 718m and 731m are selected in Table 2. The stress boundaries of the model were set based on the results of field in-situ stress measurements: 19.0 MPa in the z-direction, 21.0MPa in the y-direction, and 24.5 MPa in the x-direction. According to the scheme in Table 1, the corresponding numerical simulations models are established to analyze the change characteristic of the roadway. The constitutive model of Mohr-Coulomb and Cvisc creep is used respectively. The rheological parameters listed in Table 3 are comprehensively analyzed according to the literature (Liu et al.2017; Jia and Kang 2002; Bai et al. 2004) and engineering geological conditions. Figure 7 (b, c) show two different supporting schemes that have been introduced in section 2.2, and four monitoring points (A, B, C, and D) are pre-set at the centers of the two sidewalls, the roof and the floor to evaluate the long-term change of the roadway. Combined with the support design of Hongqinghe 31101, the thickness of the shotcrete with C20 is 150 mm, and the main parameters and support density of bolts are shown in Table 4.
4.3. Analysis of plastic zone
After the operation is completed, the FISH language is imported into FLAC to calculate the volume of the plastic zone. Figure 8 and Figure 9 show the current shear-destroy stations and tensile-destroy state stations (by shear-n and tension-n), respectively. Figure 10 shows the previous shear-destroy station and tensile-destroy state stations (by shear -p and tension -p), respectively.
4.3.1. The volume variation of shear-n zone
As shown in Figure 8, When the roadway has no creep and support, the shear-n zone volume is 751.5 m3 and no longer changes with time.
When the roadway is subjected to creep, the zone volume of shear-n increases at 0 ~ 60 d, then slightly reduces at 60 ~ 360 d, and reduces at 360 ~ 720 d. The volume of shear-n zones for the bare roadway, the oblique anchor support, and the straight support are 846.9 m3, 554.3m3, 543.9 m3, respectively.
4.3.2. The volume variation of tension-n zones
As shown in Figure 9, under the condition of no creep, the maximum volume of tension-n zones is 40.1 m3 and no longer changes with time. While the creep deformation is considered for bare lane, the volume of tension-n zones sharply increases to 46.3 m3 at 0 ~ 60 d, the increment of tension-n zones is minimal at 60~180 d, while it is more obvious at 180~720 d (increases from 50.9 to 138.5m3 ). For the lane with creep deformation and supporting, the volume of tension zones sharply increases to 86.9 m3 for straight anchor supporting and the volume is 78.3 m3 for oblique anchor supporting between 0 to 60 d, the tension-n volume slowly reduces at 60 ~ 180 d and sharply decay at 180 ~ 360 d, then increases to 83.2 m3 for the oblique anchor supporting and 78.3 m3 for the straight anchor supporting at 720 d.
4.3.3. The volume variation of tension-p and shear-p zones
As shown in Figure 10, for the bare lane with no creep deformation, the maximum volume of shear-p and tension-p zones respectively is 3772.5 m3 and 210.2 m3, and no longer change with time. For the bare lane with creep deformation, both of these two variables rapidly increase at 0 ~ 60d, and steadily increase at 60 ~ 360 d, then slightly increase at 360 ~ 720 d. The volume of shear-p and tension-p zones reaches 4863.2 m3 and 210.2 m3, respectively. For the lane with creep deformation and supporting, the volume of shear-p and tension-p zones respectively is 4295.2 m3 and 292.3m3.
Compared to no creep, the increase in the volume of the different types of the plastic zone after 720 d of creep in the bare lane was from largest to smallest: shear-p (1090.7 m3) > shear-n (381.7 m3) >tension-n (98.4m3) >tension-p (30.8 m3). Compared with the creep for bare lane, after bolting and shotcrete, the tension-p volume increases by 51.3 m3, and the volume of other types of plastic zones decreases. When the straight anchor is supported, the reduction is from large to small: shear-n (1170 m3) > shear-p (568 m3) > tension-n (60.2 m3), and when the oblique anchor spray is supported, the reduction is from large to small: shear-n (1212.1 m3) > shear-p (568 m3)> tension-n (55.3 m3).
As shown in Figure 11, the failure of the surrounding rock began with the shear failure in the roof, tensile failure appeared in the sidewalls, and shear failure appeared in the floor. As the roof crack fissure was developed, the failure became tensile failure.
The zones of tensile failure, shear failure, and undestroyed zone developed from the inside to the outside of the surround rock. With increasing creep deformation, the area of the tensile failure in the roof was gradually increased, and the external shear failure range was gradually expanded. Then after bolting and shotcrete, the expansion trend of the plastic zone of the surrounding rock was suppressed and the shear failure zone in the roof was effectively reduced. After roadway excavation (60 ~ 180 d), supporting and the surrounding rock work were implemented together. At the same time, the two sidewalls began to gradually transfer from the tension zone to the shearing zone. The bearing capacity was maintained, and make the roadway easy to maintain. The shear plastic zone in the roof was further reduced in 180 ~ 720 d after roadway excavation. Compared with the straight anchor, the corner anchor support can effectively inhibit the development of the shear plastic zone of the roof, and the straight anchor can restrain the expansion of the stretch zone.
The plastic zone of bare roadway with creep participation was larger than no creep participation, and the plastic zone boundary of surrounding rock of creep bare roadway was not constant, while the boundary of plastic zone gradually expanded with time. Creep damage was intensified, and the residual strength and bearing capacity was reduced, which resulted in the roadway’s instability for creep. After anchoring and shotcrete, the surrounding rock was closed in time, the residual strength was maintained, and the creep stress threshold of the coal rock was increased. The supporting structure is anchored in the elastic zone, forming a stable plastic zone and thereby ensuring that the designed cross-section shape of the roadway is maintained.
4.4. Analysis of damage variables
The damage evaluation of the surrounding rock was calculated based on the volume variation of zones’ different mechanical states in the rock mass.
Where V damage - the volume of the model after excavation, m3;V total - the total volume before excavation, m3;
V excavation - thr volume of excavation, m3; V plastic zone - the volume of the plastic zone that emerged after excavation, m3;
D – damage variable.
The damage variable can be obtained from Equation (4). As shown in Figure 12, the variation of surrounding rock damage with time is as follows: Presuming no creep deformation for the bare lane, the damage of the surrounding rock is 0.249.
For bare lane with creep capability, the damage showed a rapidly increasing trend (0 ~ 60 d), from 0.249 to 0.301, while a slower increasing trend was observed at 60~360 d, from 0.301 to 0.307, however, the damage showed a slight attenuation potential (360 ~ 720 d), changed from 0.307 to 0.302. Considering bolting and shotcrete, the damage rapidly increased from 0.249 to 0.29 (0 ~ 60 d), while the damage slowly decayed from 0.29 to 0.256 (60 ~ 360 d) after bolting and shotcrete. The damage showed a slight decaying trend (360 ~ 720 d), which decreased from 0.256 to 0.243.
The surrounding rock damage rapidly increased at the beginning, and then slowly increased to the peak, after that slowly decayed. The reasons for this phenomenon were as below: the surrounding rock entered the self-stabilization stage without disturbance as the surrounding rock entered the stable stage, and the longer self-stabilization time and the lower damage degree. In the case of supporting, the stability of the surrounding rock is further improved and the degree of damage is reduced.
4.5. Analysis of the displacement field
As shown in Figure 13, the displacement of the monitoring points change with time.
When the roadway has no creep, the deformation associated with roof subsidence, floor heave, and the two-sided displacement is 115 mm, 55 mm, and 194 mm, respectively.
Under the condition of creep in the rock, the surrounding rock deformation rapidly increases:(i)In the acceleration creep stage (0 ~60 d), the creep velocity of the roof, floor, and sidewalls are 2.49, 0.32, and 3.22 mm/d, respectively.(ii)In the decline creep stage (60 ~360 d), the creep velocity of the roof, floor, and sidewalls are respectively 1.32, 0.32, and 1.42 mm/d. (iii) In the stable creep stage (360~720 d), the creep velocity of the roof, floor, and sidewalls are 1.01, 0.12, and 1.02 mm/d, respectively. Compared lane presumed to no creep deformation, the order of the roadway deformation reduction is two sidewalls (1978 mm), roof (907 mm), and floor (101 mm).
Under the condition of creep, for the lane with bolting and shotcrete, in the acceleration stage (0 ~ 60d), the creep velocity of the roof, the floor, sidewalls of the roadway are 1.75, 0.23, and 4.00 mm/d, respectively. In the decaying stage (60 ~ 360 d), the creeping velocity of the roof, the floor, and the sidewalls of the roadway are 0.89, 0.14, and 0.69 mm/d, respectively. In the stable creep stage (360 ~ 720 d), the roof, the floor, and the sidewalls’ creep velocity are 0.68, 0.10, and 0.37 mm/d, respectively. Compared with the creep-exposed roadway, the reduction in deformation of the roadway ranges from large to small: two sides (818 mm)>roof (289 mm)>floor(101 mm).
Compared with no creep, after 720 days of creep in the bare roadway, the amplitude of deformation changes from large to small on two sides (1978 mm)>roof (907 mm)>floor(101 mm). The deformation caused by the time effect accounts for 45-88% of the total deformation, and even after support, it still accounts for a large proportion. This may be due to the creep stress threshold of the floor rock being higher than the creep stress valve of the coal. In addition, the roof deforms under the effect of gravity, and the sidewalls deform to the roadway with the effect of horizontal stress. Compared to creeping bare lane, the reduction amplitude order of the roadway deformation after the anchor spray in different parts of the roadway is shown as below, sidewalls (818 mm), roof (290 mm), floor (101 mm). This may be due to the support density of the sidewalls is higher than the roof after the anchor spray, and is much higher than the floor.
In the acceleration stage, the increase in the plastic zone of the two sidewalls is due to the disturbance when the bolts are installed. With increasing time, the surrounding rock and the bolt fully play their role and increase the creep stress threshold, so the creep velocity is limited.
5. Engineering applications
5.1. Measuring point arrangement
Construction is carried out according to the reinforcement support scheme, and the “cross measurement method” is used to monitor the displacement of the 31101 transport slot section, as shown in Figure 14. Drill four vertical holes with the diameter and depth respectively of 28 and 200 mm in the middle of the roof and floor, drive four wooden piles with a length of 29 mm and 200 mm into the holes, and mark the ends of the wooden piles with paint. The deformation of roadway sidewalls, roof, and floor are measured and recorded to analyze the deformation characteristics of surrounding rock under the effect of creep.
5.2. Model validation by engineering practice
Compared with the displacement of the measured point for the undisturbed roadway with supporting, it can be seen that the simulation results have good consistency with the measured data. It can be seen that the Cvisc in FLAC simulates flow is reliable in deep high-stress environment. In this paper, an elasto-viscoplastic Cvisc creep constitutive model is firstly confirmed, and then the model is applied into a FLAC5.0 numerical environment to carry out a simulation base on the creep case of surrounding rock at 31101 transportation roadway. Finally, the proposed model is well- validated by the real engineering practice. The comparisons between field support monitoring data and simulation are shown in Figure 15.
6. Conclusion
- The long-term strength of coal is lower than sandy mudstone. The long-term strength of the sandy mudstone, coal respectively are 39.95 MPa, 18.65 MPa. The creep deformation of coal is more obvious than sandy mudstone.
- Under the high-stress environment in deep coal mines, creep has a significant influence on the deformation of coal and rock. Under bare roadway conditions, the creep composed 45 % ~ 88 % of the deformation, and the damage is 17.5 %.
- After roadway excavation, the creep of the surrounding rock can be divided into three stages: the acceleration stage (0~60 d), the decaying stage (60~360 d) , and the stable stage (360~720 d). In the acceleration stage, the displacement and damage of the surrounding rock increase rapidly; in the decaying stage, the displacement of surrounding rock and the damage slowly increase; in the stable stage, the displacement slowly increases and the damage decreases.
- Bolting and shotcrete can effectively suppress the displacement and damage of surrounding rock. Bolting and shotcrete closed the surrounding rock and maintained the residual strength of the surrounding rock, supporting and surrounding rock together acted as the load-bearing structure, this increased the stress threshold of the surrounding rock rheology and increased the stability of the roadway. In terms of restraining the creep displacement of the surrounding rock, there is no difference between the straight anchor and the oblique anchor. In terms of restraining the shear plastic zone, the oblique anchor has an advantage, and the straight has an advantage in suppressing the tensile plastic zone.
Acknowledgments
This study is supported by the National Natural Science Foundation of China (No. 52104155), (No. 51874312).
Conflicts of Interest
The authors declare that they have no conflict of interest.
Appendix A

Table A1.
Main parameters and support density of anchor.
| Name | Preload ( kN) |
Breaking load (kN) | Sidewall support density (m2/piece) | Roof support density (m2/piece) | Floor support density (m2/piece) |
|---|---|---|---|---|---|
| Anchor | 60 | 144 | 2.5 | 2.14 | 0.71 |
References
- Bai JB, Hou CZ, Huang HF (2004). Numerical simulation of the stability of narrow coal pillars along goaf roadway. Chin J Rock Mech Eng 23 (20): 3475-3475.
- Chen ZQ, He C, Dong WJ, et al(2018).Comparative analysis of physical and mechanical properties and study on energy damage evolution mechanism of Jurassic and Cretaceous muddy sandstones in northern Xinjiang [J] Geotechnical Mechanics, 39 (8): 1-13.
- Chen GQ, Guo F, Wang JC, et al(2017). Experimental study on triaxial creep properties of quartz sandstone after freezing and thawing [J] Geotechnical Mechanics, 38 (S1): 203-210.
- Cai MF(2013).Rock mechanics and Engineering. 2nd Edition [M]. Beijing: Science Press.
- Cai Yu, Cao Ping(2016). A non-stationary rock creep model considering damage based on the Burgers model [J] Geotechnical Mechanics, 37 (S2): 369-374.
- Cheng AP, Fu ZX, Liu LS, et al(2022) Creep Hardening Damage Characteristics and Nonlinear Constitutive Model of Cemented Fill [J] Journal of Mining and Safety Engineering, 39 (03): 449-457.
- Chen GX, Guo BB, Hao Z(2020). The starting conditions of rock burst under the influence of accelerated creep in the surrounding rock of circular tunnels [J] Journal of Coal Science 45 (10): 3401-3407.
- Dong EY, Wang WJ, Ma NJ, et al(2018). Analysis and control technology of anchoring spatiotemporal effect considering surrounding rock creep [J] Journal of Coal Science 43 (05): 1238-1248.
- Gong H, Li CH, Zhao K(2015). The b-value characteristics of short-term creep sound emission in red sandstone [J] Journal of Coal Science 40 (S1): 85-92.
- Guo H, Liu Y, Cui BQ, et al(2018). Research on creep damage model of filling paste [J] Mining Research and Development 38 (3): 104-108.
- Helal H , Homand-Etienne F , Josien J P(1988) . Validity of uniaxial compression tests for indirect determination of long-term strength of rocks[J]. International Journal of Mining and Geological Engineering, 6(3):249-257.
- Hu Bo, Wang ZL, Liang B, et al(2015). Experimental study on creep characteristics of rocks [J] Experimental Mechanics,30 (4): 438-446.
- Huang HF, Juneng P, Huang M, et al(2017). A Nonlinear Creep Damage Model for Soft Rock and Its Experimental Study [J] Hydrology, geological engineering Geology 44 (3): 49-54.
- Huang WP, Li C, Xing WB, et al(2018). The long term asymmetric large deformation mechanism and control technology of kilometer-deep roadway under creep state [J] Journal of Mining and Safety Engineering 35 (3): 481-489.
- He MC, Jing HH, Sun XM (2002). Soft Rock Engineering Mechanics. Science Press, Beijing, pp 18-21.
- Hu K, Feng Q, Li H, Hu Q (2018). Study on creep characteristics and constitutive model for Thalam rock mass with a fracture in a tunnel. Geotech Geol Eng 36:827–834.
- Jiang ZB(2016). Experimental study on creep characteristics of rocks under multiple environmental effects and mechanical models Dalian Maritime University.
- Jiang DY, He Y, Ouyang ZH, et al(2017). Statistical analysis of acoustic emission energy and cross-sectional morphology of sandstone under uniaxial creep [J] Journal of Coal Science, 42 (06): 1436-1442.
- Jiang FX, Feng Y, KOUAME K J A, et al(2015). Study on the "creep type" impact mechanism of high ground stress extra-thick coal seam [J] Journal of Geotechnical Engineering, 37 (10): 24-30.
- Jia GS, Kang LJ (2002). Study on stability of coal pillars in mining roadway with fully mechanized caving mining. J China Coal Soc 27 (1): 6-10.
- Kang HP, Fan MJ, Gao FQ, et al(2015). Deformation Characteristics and Support Technology of Surrounding Rocks in Deep Well Tunnels Exceeding Kilometers [J] Journal of rock mechanics and Engineering, 34 (11): 2227-2241.
- Lajtai E Z (1991). Time-dependent behavior of the rock mass. Geotech Geol Eng 9(2):109-124.
- Liu XX, Li SN, Zhou YM, et al(2020). Study on creep characteristics and long-term strength of high-stress argillaceous siltstone [J] Journal of rock mechanics and Engineering, 39 (1): 138-146.
- Li GY(2017). Experimental study on the influence of water on the creep mechanical properties of coal and rock [D] Xi'an University of Science and Technology.
- Liu YK(2012). Research on the Damage Evolution and Rheological Characteristics of Deep Rock Mass under the Action of Water and Rock [D] Central South University.
- Li P(2017). Experimental study on acoustic emission under the coupling effect of coal rock seepage and creep [J] Mining Safety and Environmental Protection 44 (4): 19-23.
- Liu CX, Wang L, Zhang XL, et al(2017). Microscopic damage mechanism analysis of short-term creep tests of deep well coal and rock under different confining pressures [J] Geotechnical Mechanics,38 (9): 2583-2588.
- Li LC, Xu T, Tang CA, et al(2007). Numerical simulation of rock creep instability and failure process under uniaxial compression [J] Geotechnical Mechanics, 28 (9): 1978-1983.
- Lu YL, Wang LG(2015) Numerical simulation of rock creep damage and fracture process based on microcrack evolution [J] Journal of Coal Science, 40 (6): 1276-1283.
- Liu KY, Xue YT, Zhou H. A Nonlinear Viscoelastic-plastic Creep Model for Soft Rock with Unsteady Parameters [J] Journal of China University of Mining and Technology, 2018, 47 (4): 921-928.
- Liu JW, Wang YJ, Song XM (2017). Numerical simulation of creep law of coal roadway supported by ultra-thousand deep wells. Min Research Development 37(6):14-17.
- Ma QY, Yu PY, Yuan P(2018). Experimental study on the influence of dry wet cycle on the creep characteristics of deep siltstone [J] Journal of rock mechanics and Engineering, 37 (3): 593-600.
- Niroshan N, Yin L , Sivakugan N, et al(2018). Relevance of SEM to Long-Term Mechanical Properties of Cemented Paste Backfill[J]. Geotechnical and Geological Engineering, 36:2171-2187.
- Pan YS, Zhu P, Wang DL(1998). The creep simulation test and numerical analysis of deep tunnel floor heave and its prevention and control [J] Journal of Heilongjiang Institute of Mining and Technology, 8 (02): 1-7.
- Shen Z, Wang J, Ning JG, et al(2021). Study on the creep characteristics of filling materials considering the content of cement [J] Mining Research and Development, 41 (6): 57-65.
- Shen MR, Chen JF(2006). Rock mechanics [M] Shanghai: Tongji University Press.
- Song YJ, Lei SY, Liu XK(2012). A Nonlinear Creep Model of Rock Based on Hardening and Damage Effects [J] Journal of Coal Science, 37 (S02): 287-292.
- Song YF, Pan YS, Li ZH, et al(2018). Research on the creep instability of isolated coal pillars under rockburst [J] Coal Mine Safety, 49 (5): 47-50.
- Wang YC, Wang YY, Li JG(2019). Research on the creep mechanism of shale under chemical corrosion effect [J] Coal Mine Safety, 50 (8): 67-71.
- Wang YY, Sheng DF(2019)Research on the entire process of rock creep considering damage based on the Burgers model [J] Mechanics Quarterly, 40 (1): 143-148.
- Wang GG, Zhu ST, Jiang FX, et al(2019). Research on the mechanism and prevention of overall instability and impact of isolated coal bodies in kilometer-deep mine tunnels [J] Journal of Mining and Safety Engineering36(5):968-976.
- Wei SJ,Gou PF,Yu CS (2013). Simulation and control technology of surrounding rock creep of large section broken chamber. J Min Saf Eng 30 (4): 489-494.
- Xu P, Yang SQ(2018).Numerical simulation of creep mechanical properties of composite rock under triaxial compression [J] Journal of Mining and Safety Engineering, 35 (1): 179-187.
- Yao QL, Zhu L, Huang QX, et al(2019). Experimental study on the influence of water content on the creep characteristics of fine-grained feldspar lithic sandstone [J] Journal of Mining and Safety Engineering,36 (5): 1034-1042.
- Yin GZ, He B, Wang H, et al(2015). Creep damage and failure law of overlying rock under the influence of deep mining [J] Journal of Coal Science 40 (6): 1390-1395.
- Yin ZP, Liu XF, Zhang JN(2017). A Nonlinear Creep Damage Model for Aqueous Rock Mass and Its Application [J] Journal of Applied Mechanics 34 (2): 377-383.
- Yang YJ, Xing LY, Zhang YQ, et al(2015) Study on the long-term stability of gypsum pillar based on creep test [J] Journal of rock mechanics and Engineering, 34 (10): 2106-2113.
- Yang YJ, Duan HQ, Liu CX, et al(2017). Reasonable Setting of Uphill Protection Coal Pillars in Deep Well Mining Areas Considering Long-Term Stability [J] Journal of Mining and Safety Engineering, 34 (5): 921-927.
- Yang Y, Tian RD(2016). Creep law of coal pillars left underground in coal mines [J] Journal of Liaoning University of Engineering and Technology: Natural Science Edition, 35 (10): 1026-1031.
- Zhang QY, Zhang LY, Xiang W, et al(2017) Study on triaxial creep test of gneissic granite considering temperature effect [J] Geotechnical Mechanics, 38 (9): 2507-2514.
- Zhao BY, Liu DY, Zhu KS, et al(2011). Experimental study on uniaxial direct tensile creep characteristics of Chongqing red sandstone [J] Journal of rock mechanics and Engineering, 30 (S2): 3960-3965.
- Zuo Y Y, Han L, Hu H, Luo SY, Zhang Y, Cheng XM(2018). Visco-elastic–Plastic Creep Constitutive Relation of Tunnels in Soft Schist. Geotech Geol Eng 36(1):389-400.
- Zhang SC, Sheng DF, An WJ, et al(2021). Nonlinear viscoelastic plastic analysis of rubber asphalt composite materials based on improved Burgers model [J] Mechanics Quarterly, 42 (03): 528-537.
- Zhao YL, Ma WH, Tang JZ, et al(2016). A rock variable parameter creep damage model based on plastic expansion and its engineering application [J] Journal of Coal, 41 (12): 2951-2959.
- Zhang JF, Wang K, Zhang XQ, et al(2017). Numerical study on the width of residual coal pillars under the influence of creep failure [J] Mining Research and Development,37 (11): 51-54.
Figure 1.
Location of the coal mine.
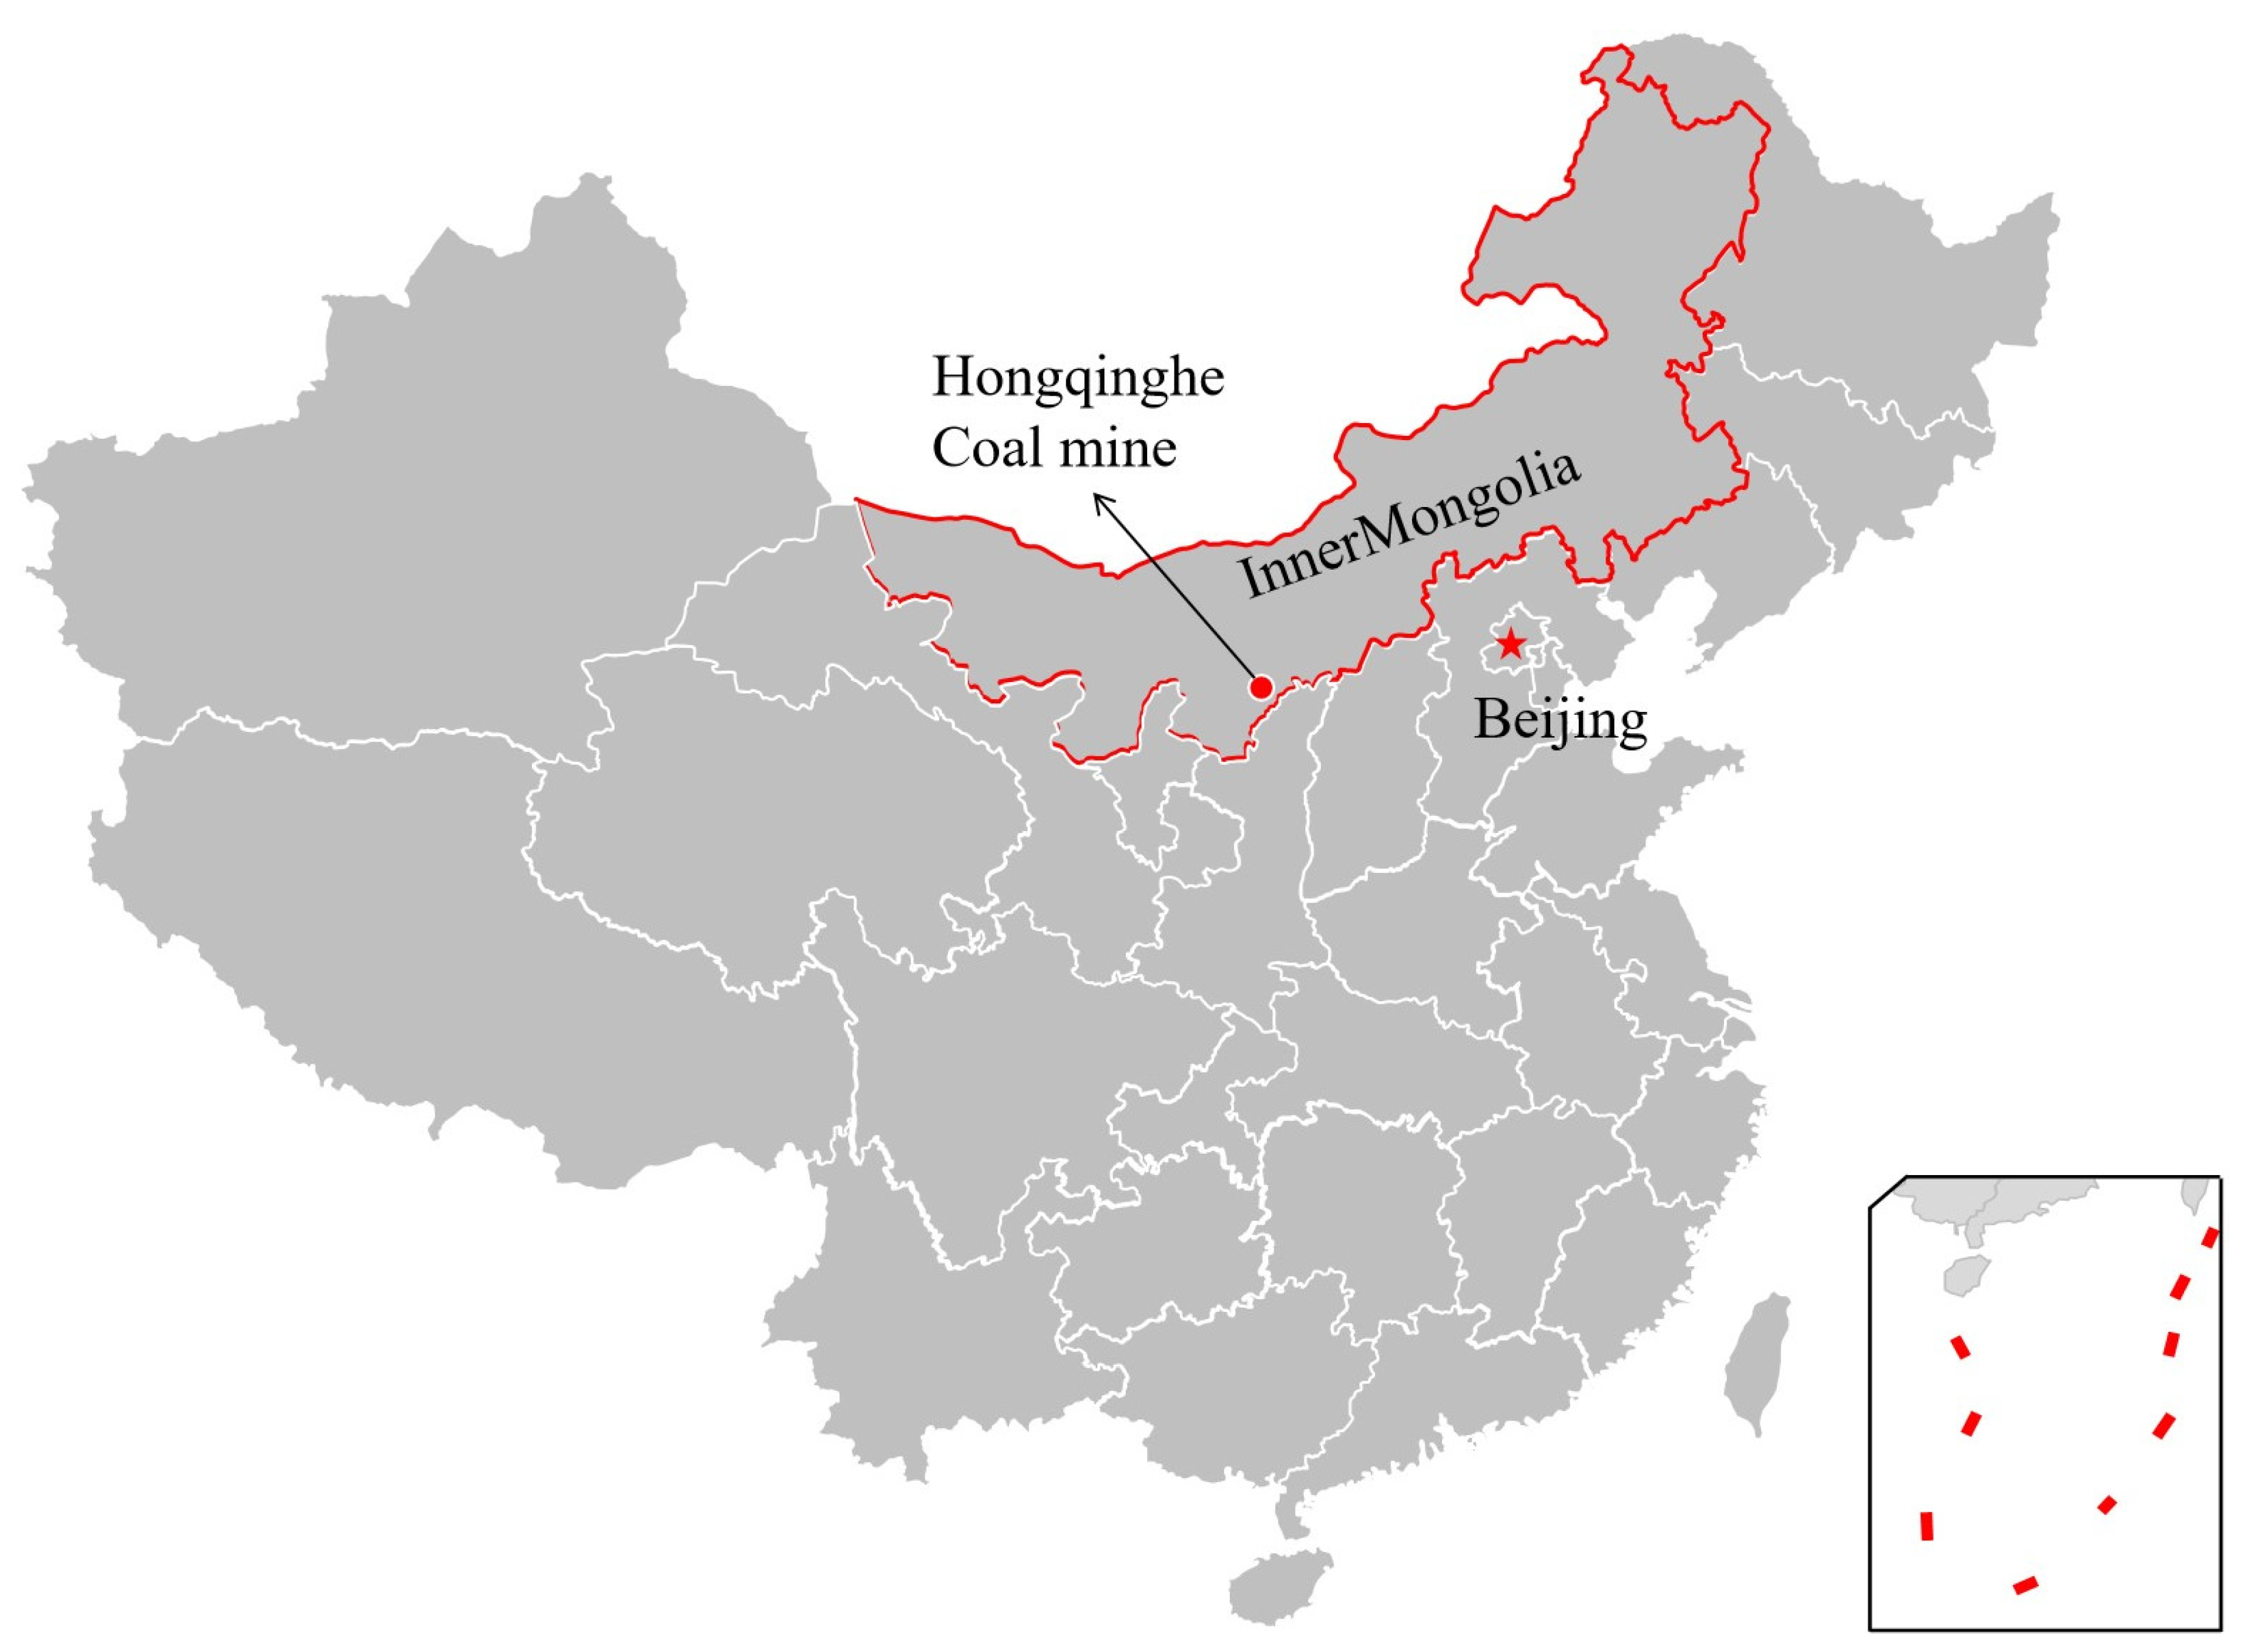
Figure 2.
Mining panel and roadway layout.
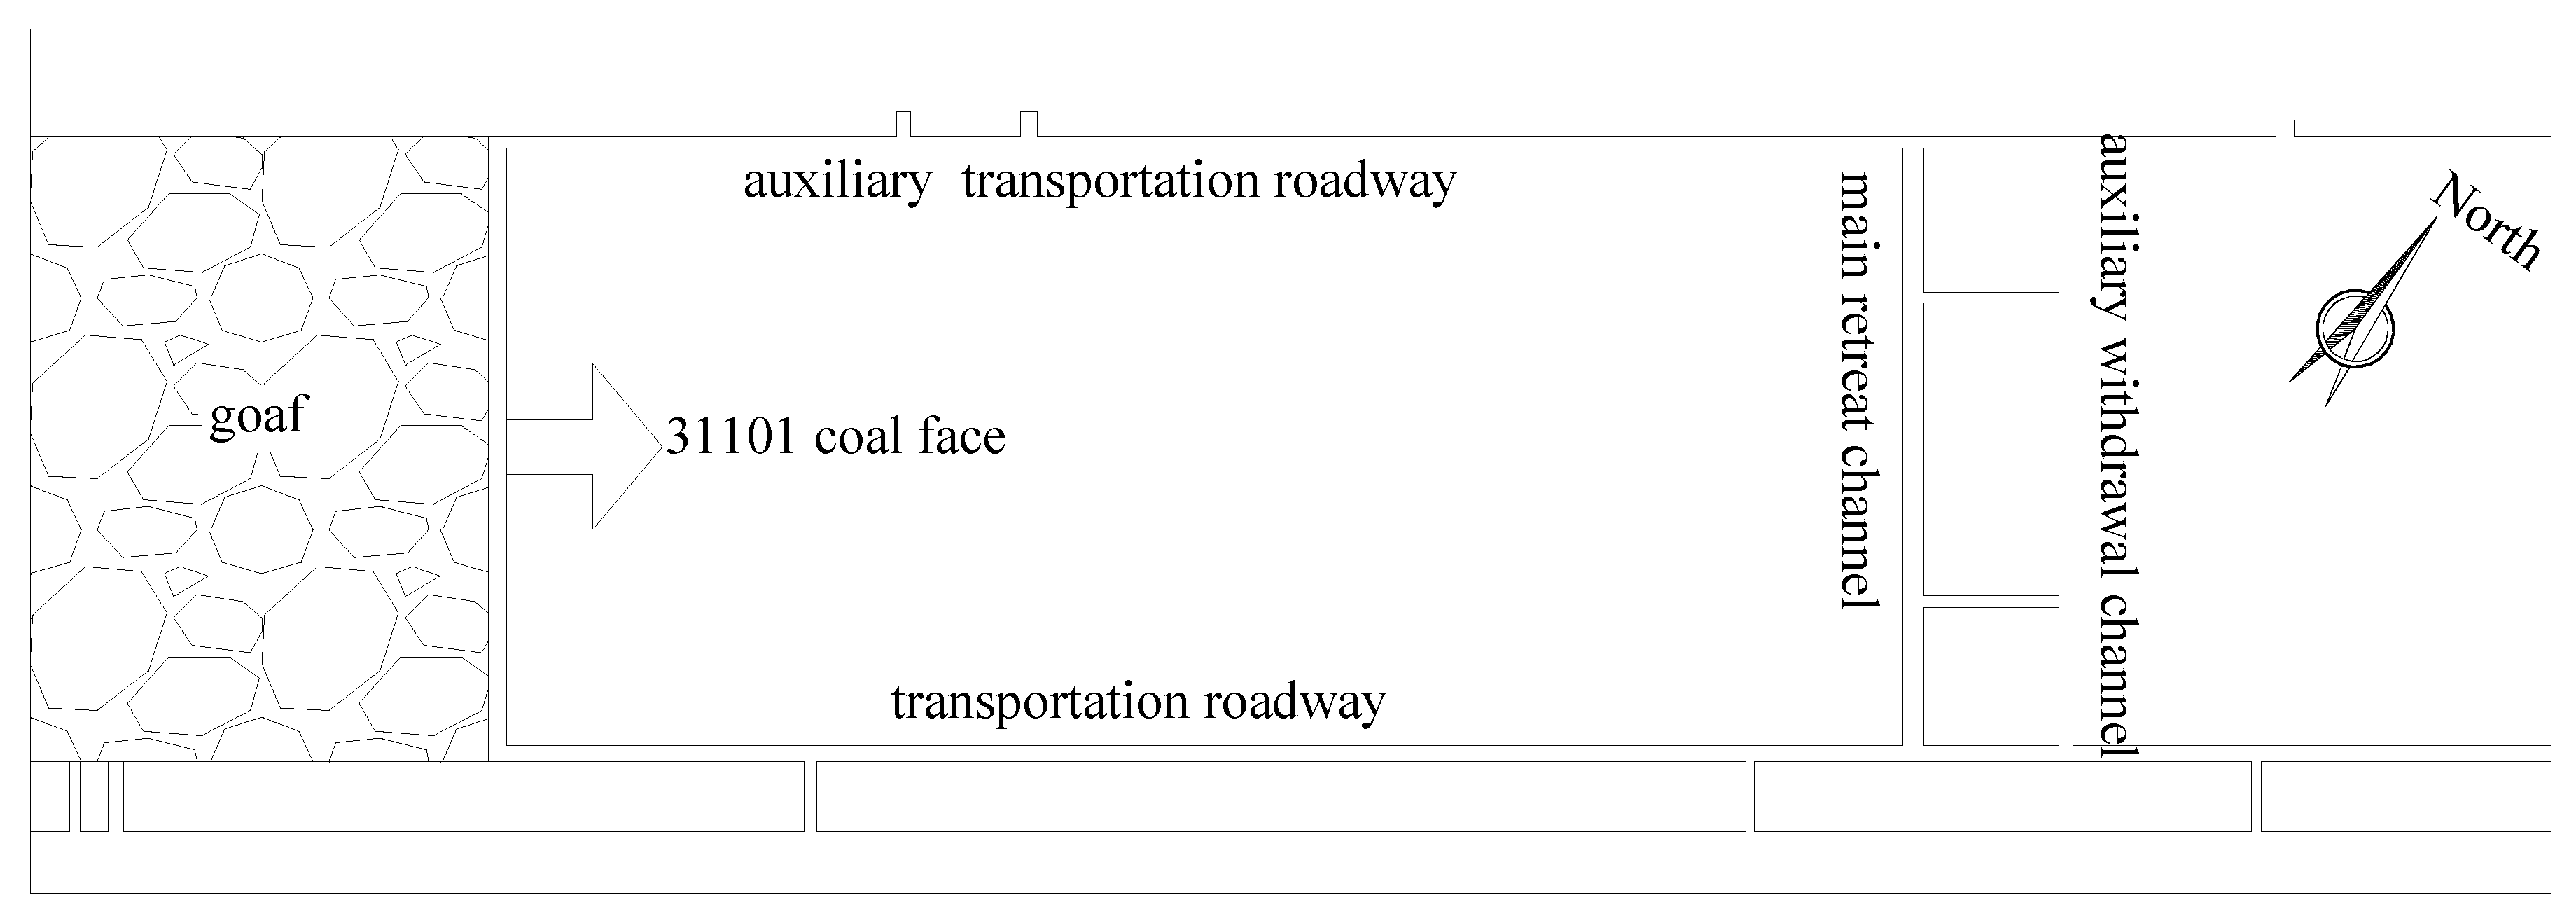
Figure 3.
Stratigraphic column and geological description.
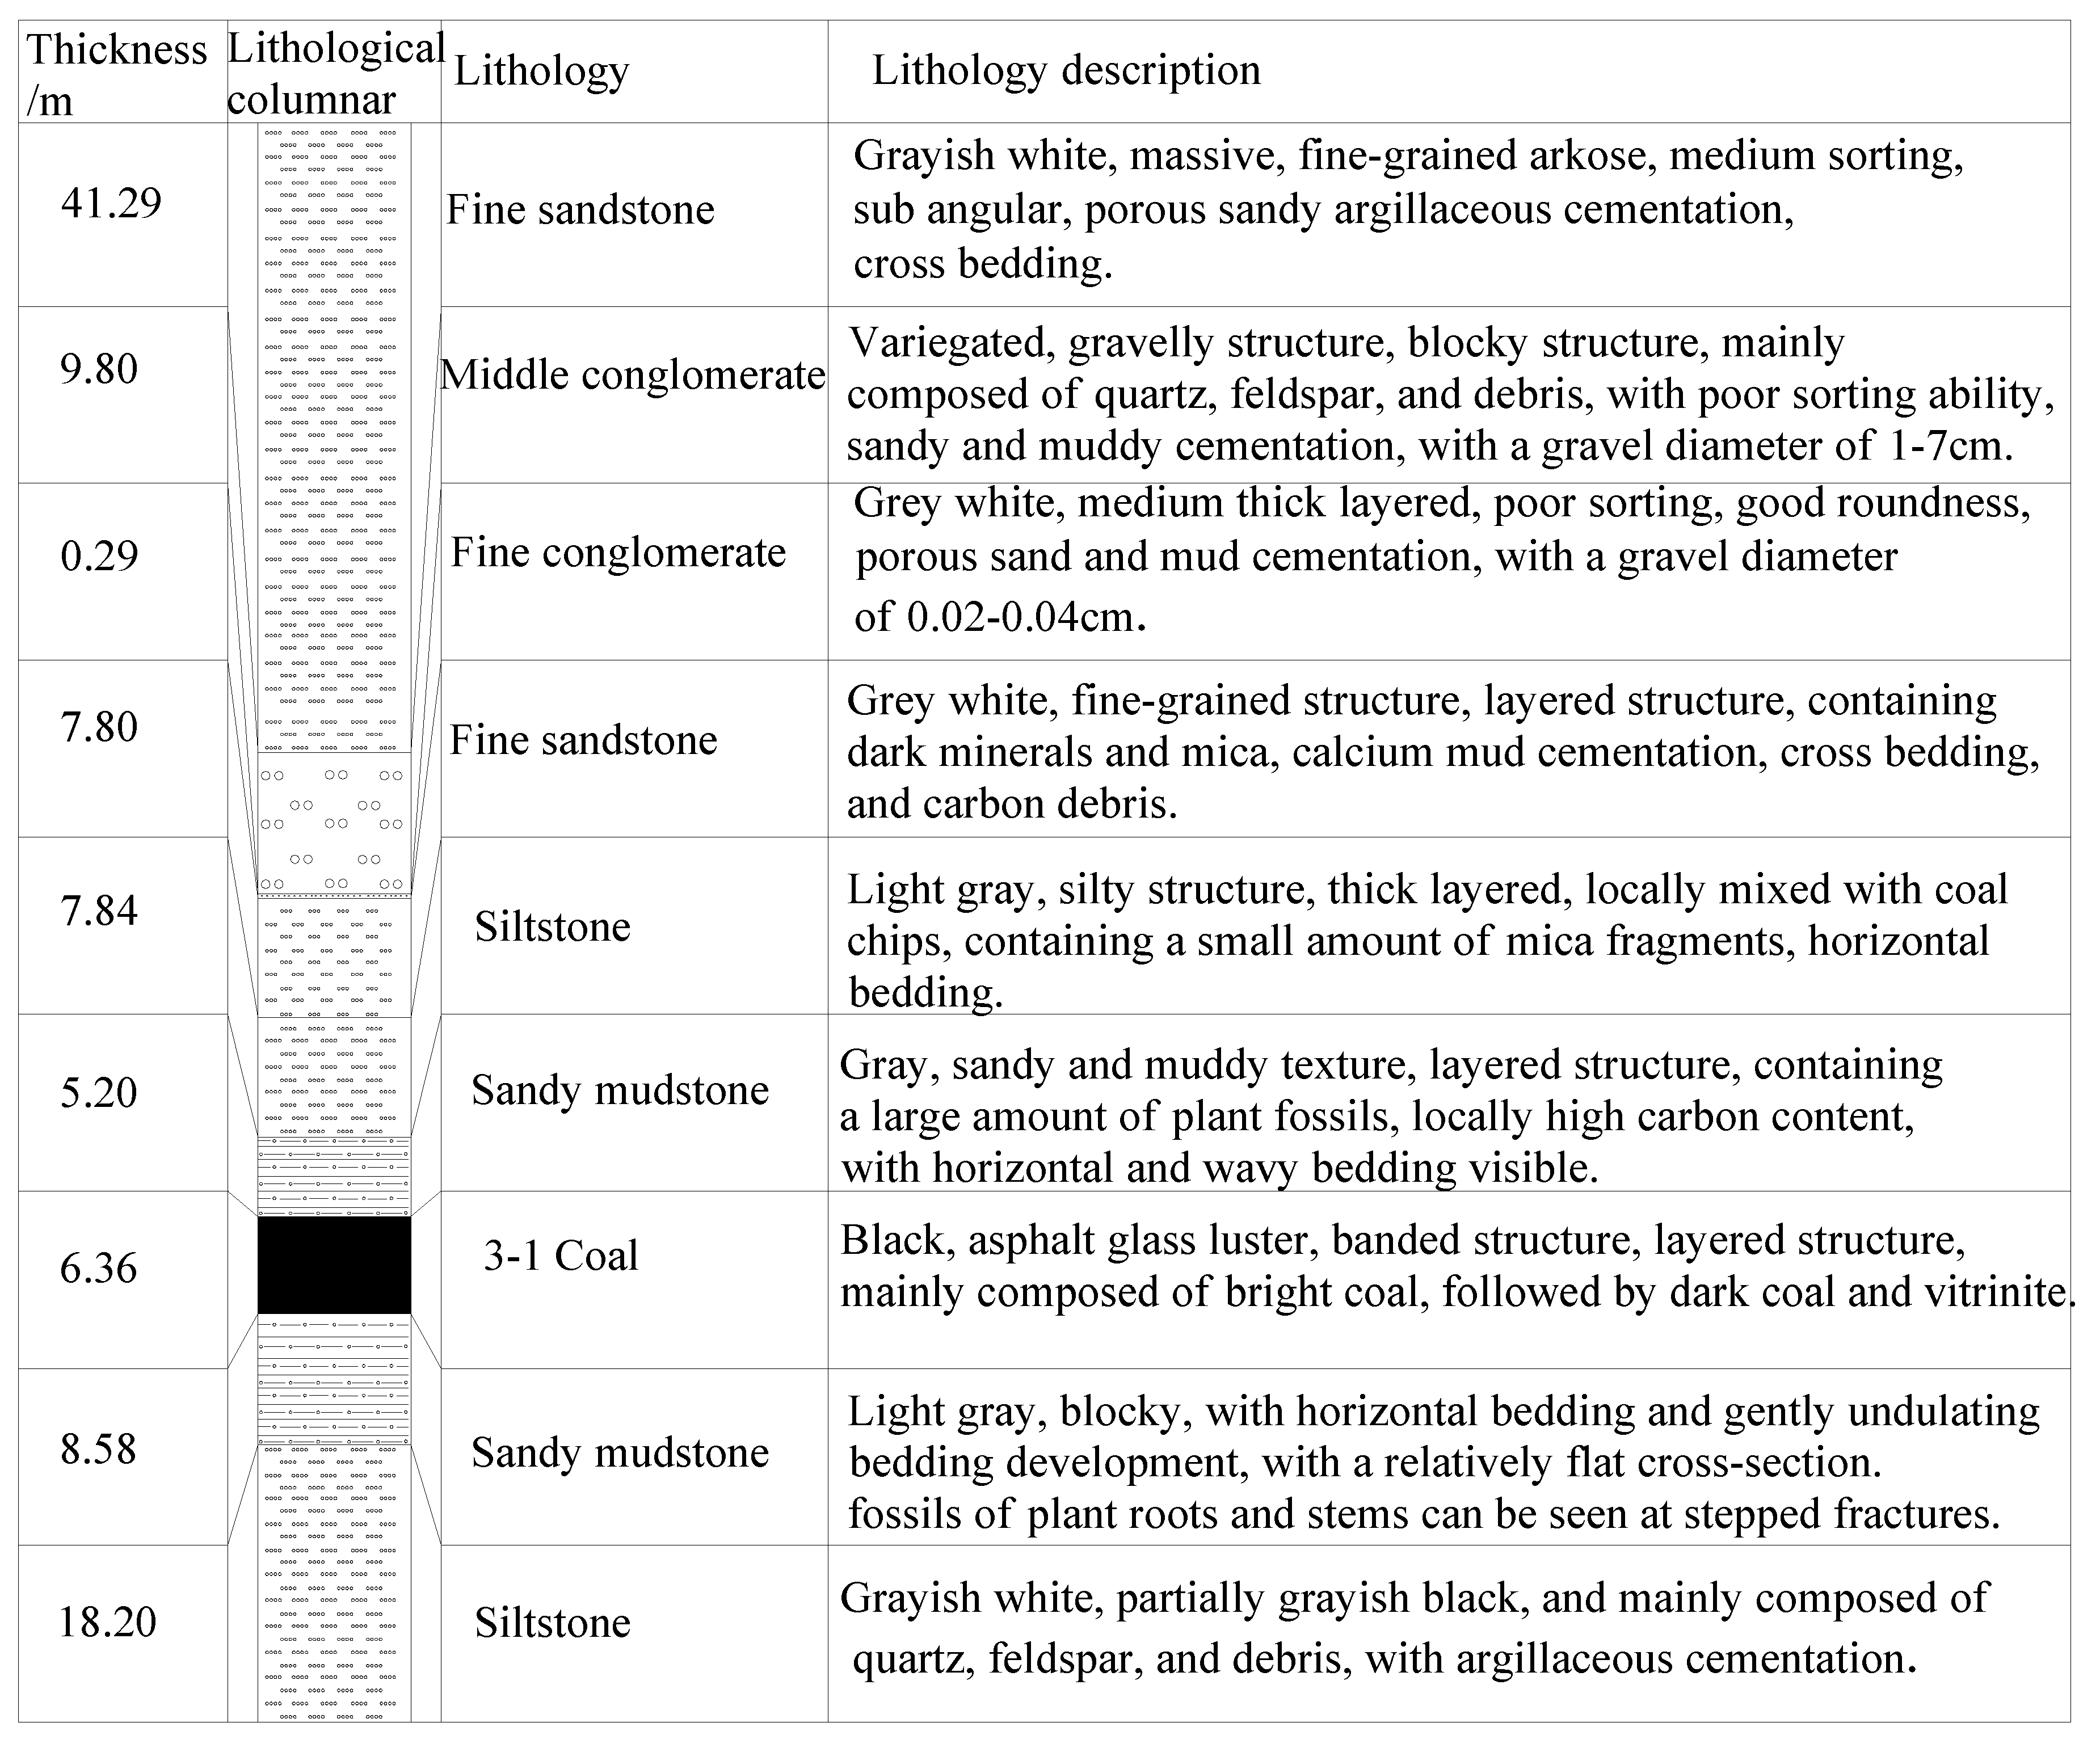
Figure 4.
Deformation plot of slot 3101.
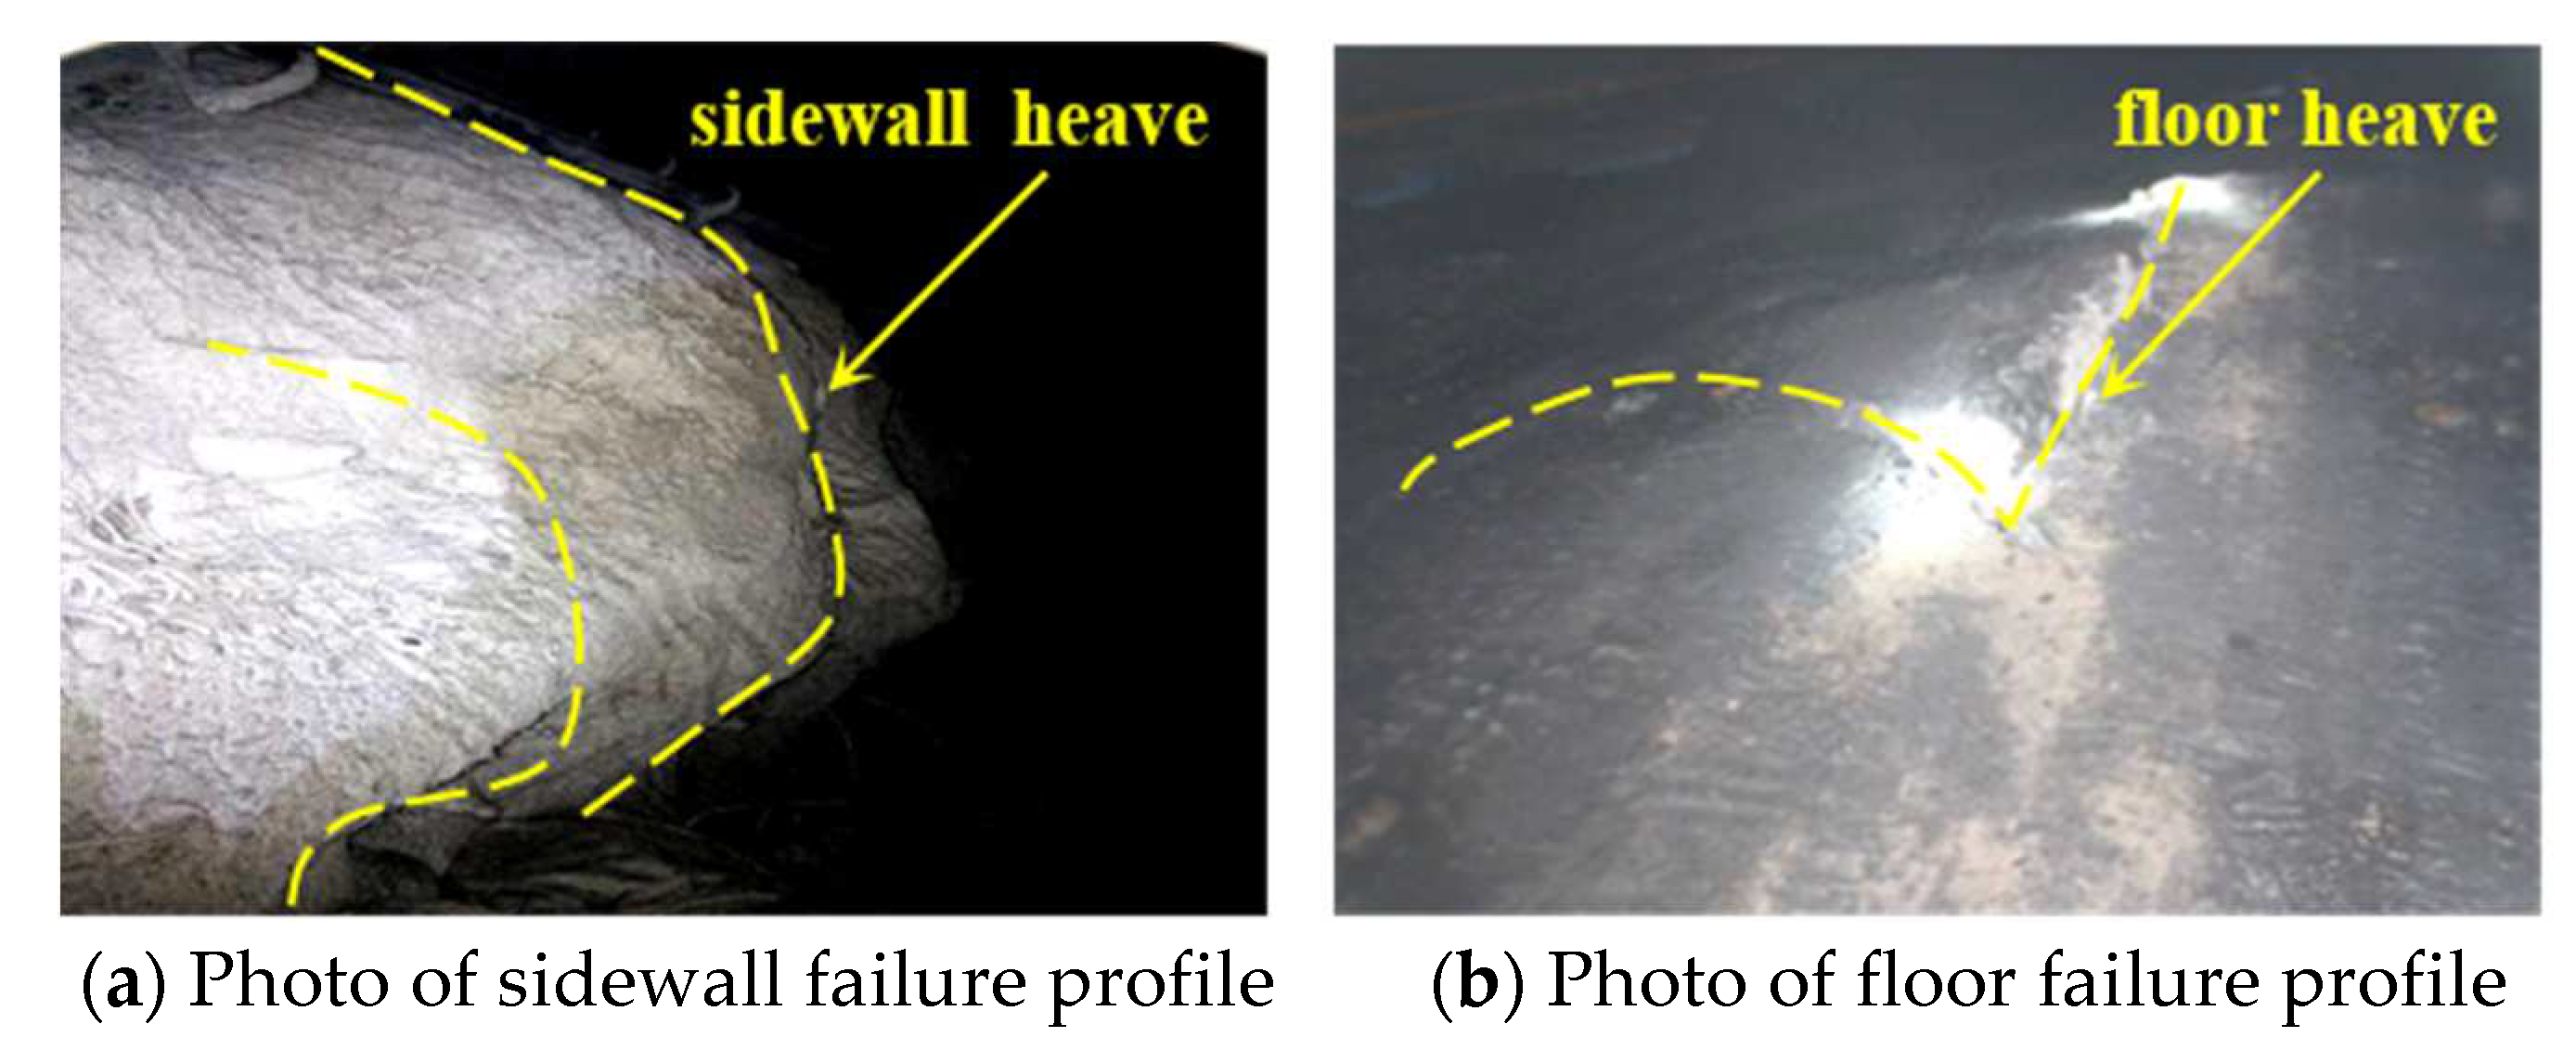
Figure 5.
Stress-strain curve.
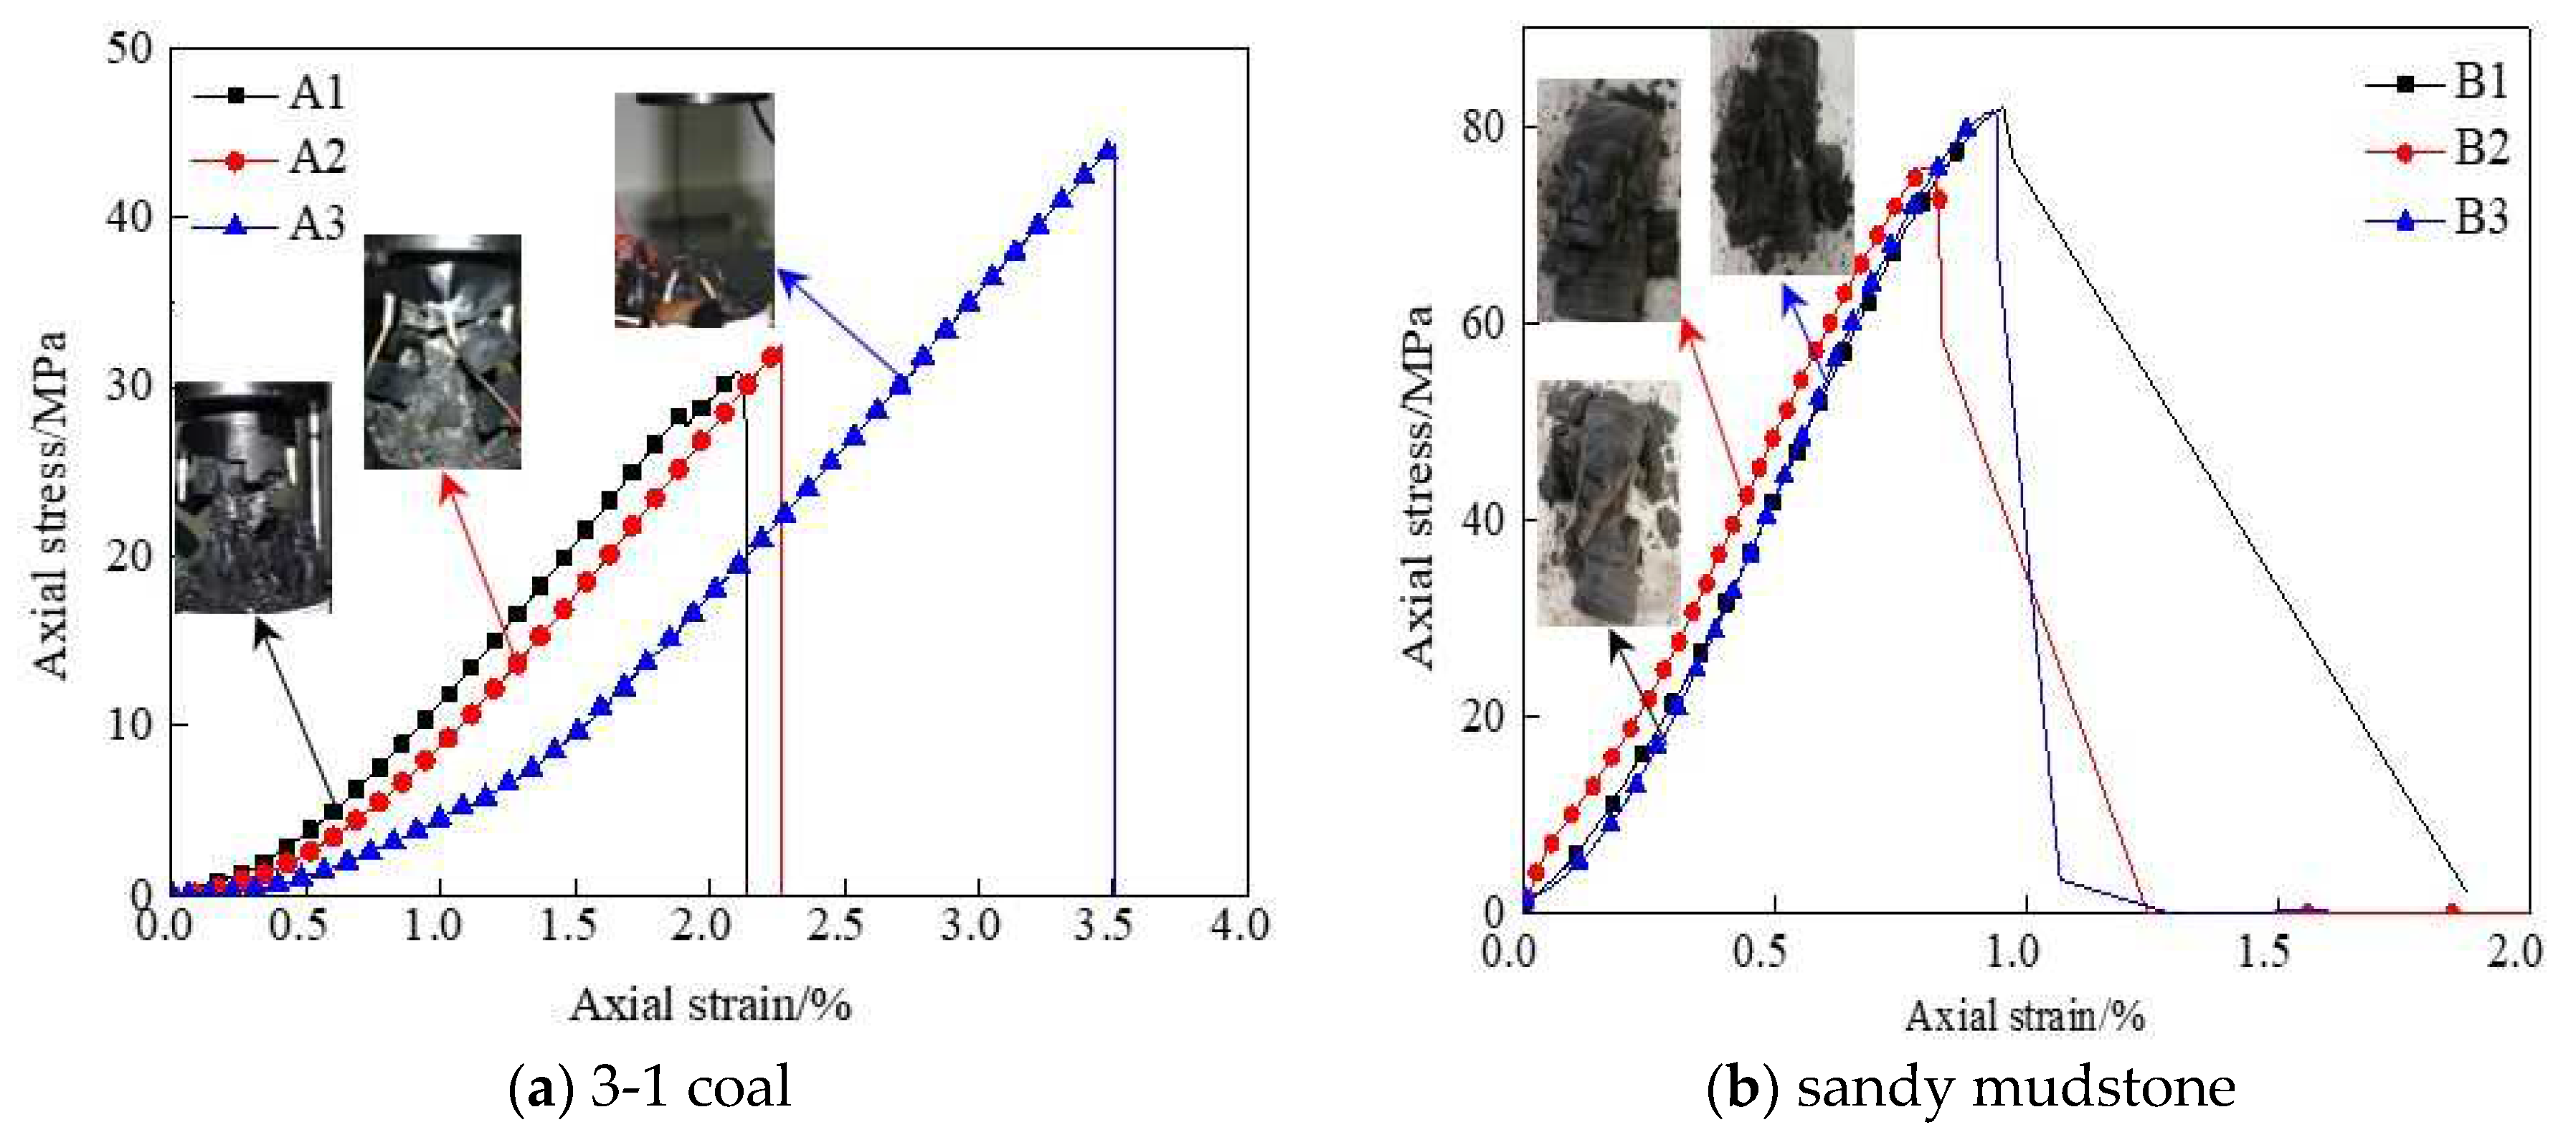
Figure 6.
Cvisc model.
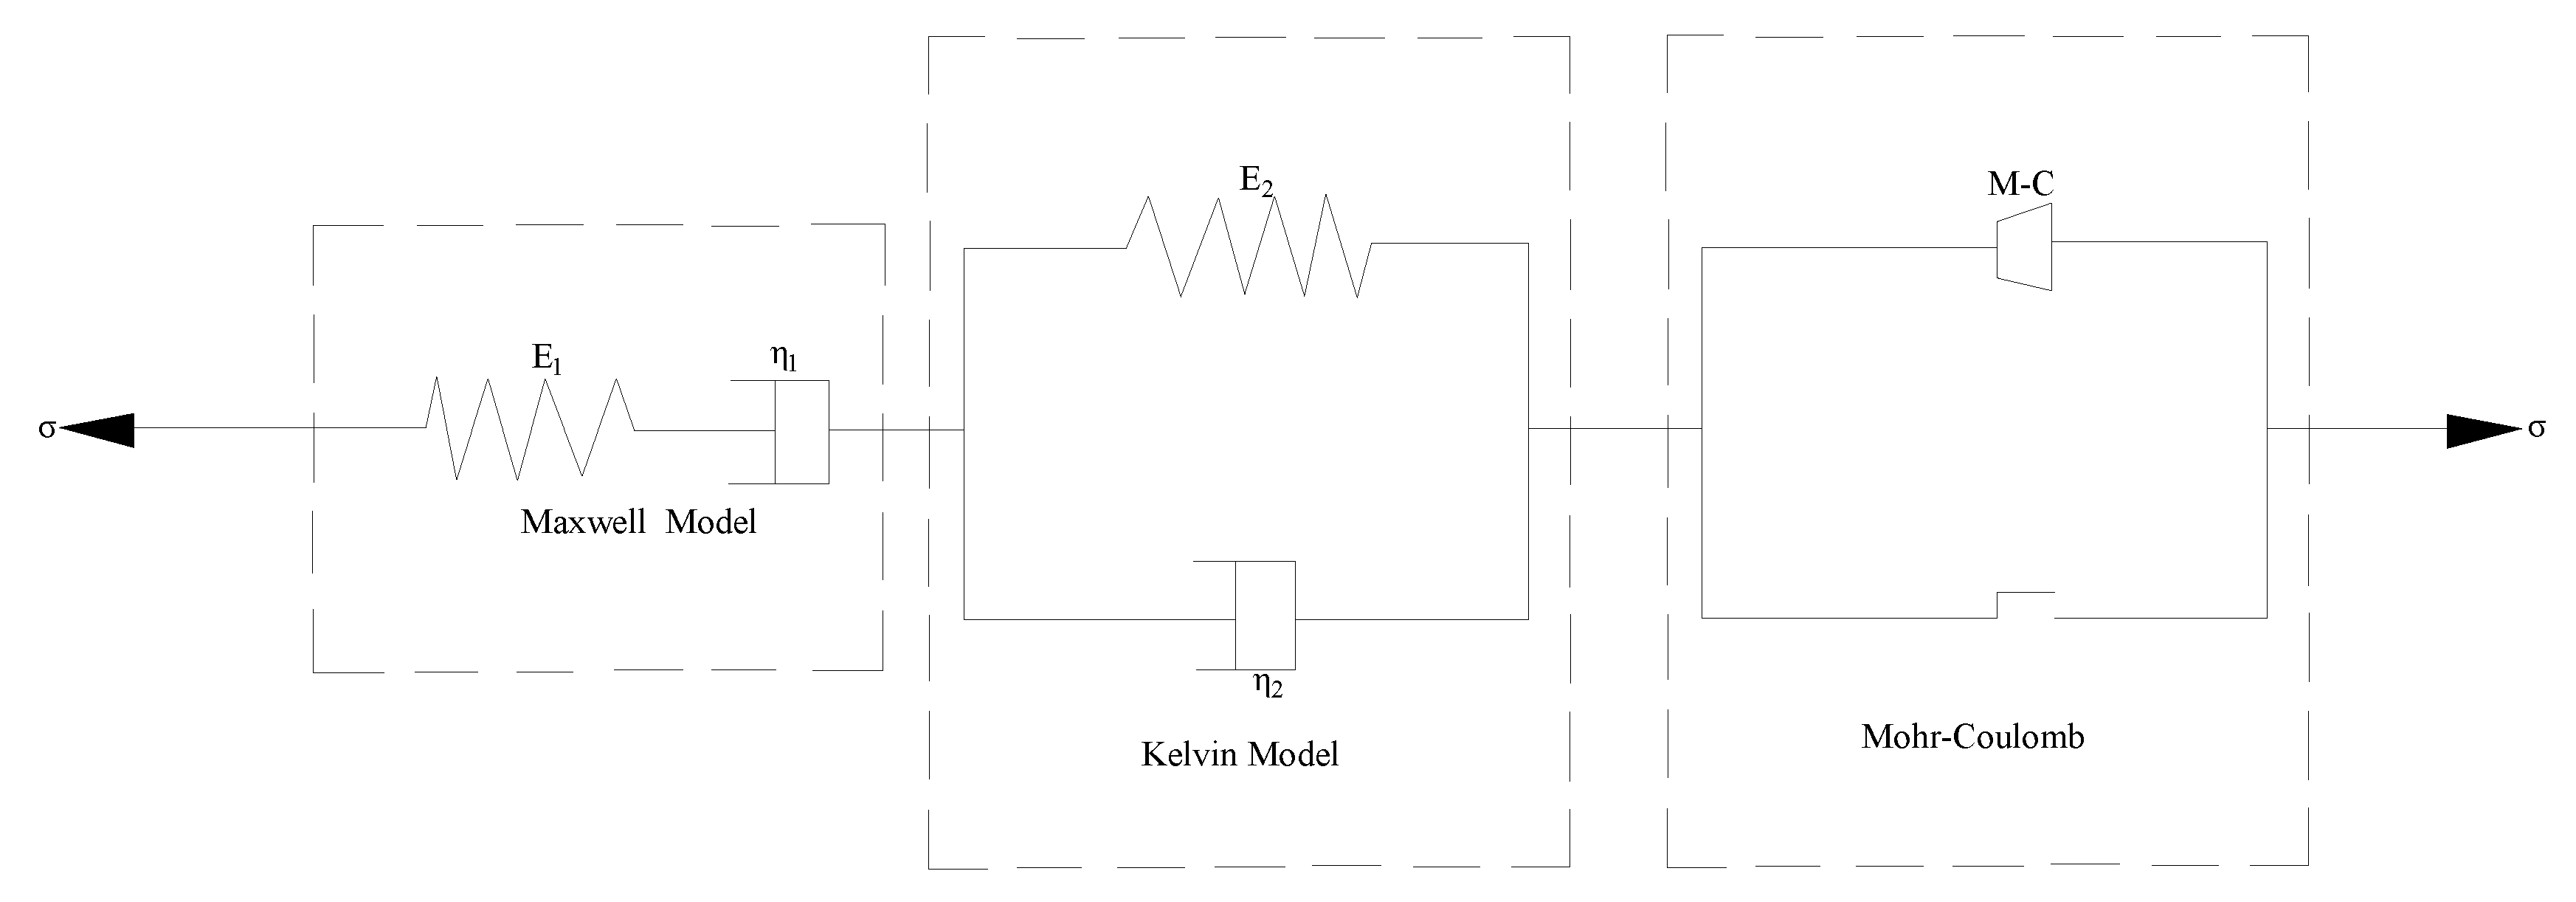
Figure 7.
Numerical model and supporting diagram.
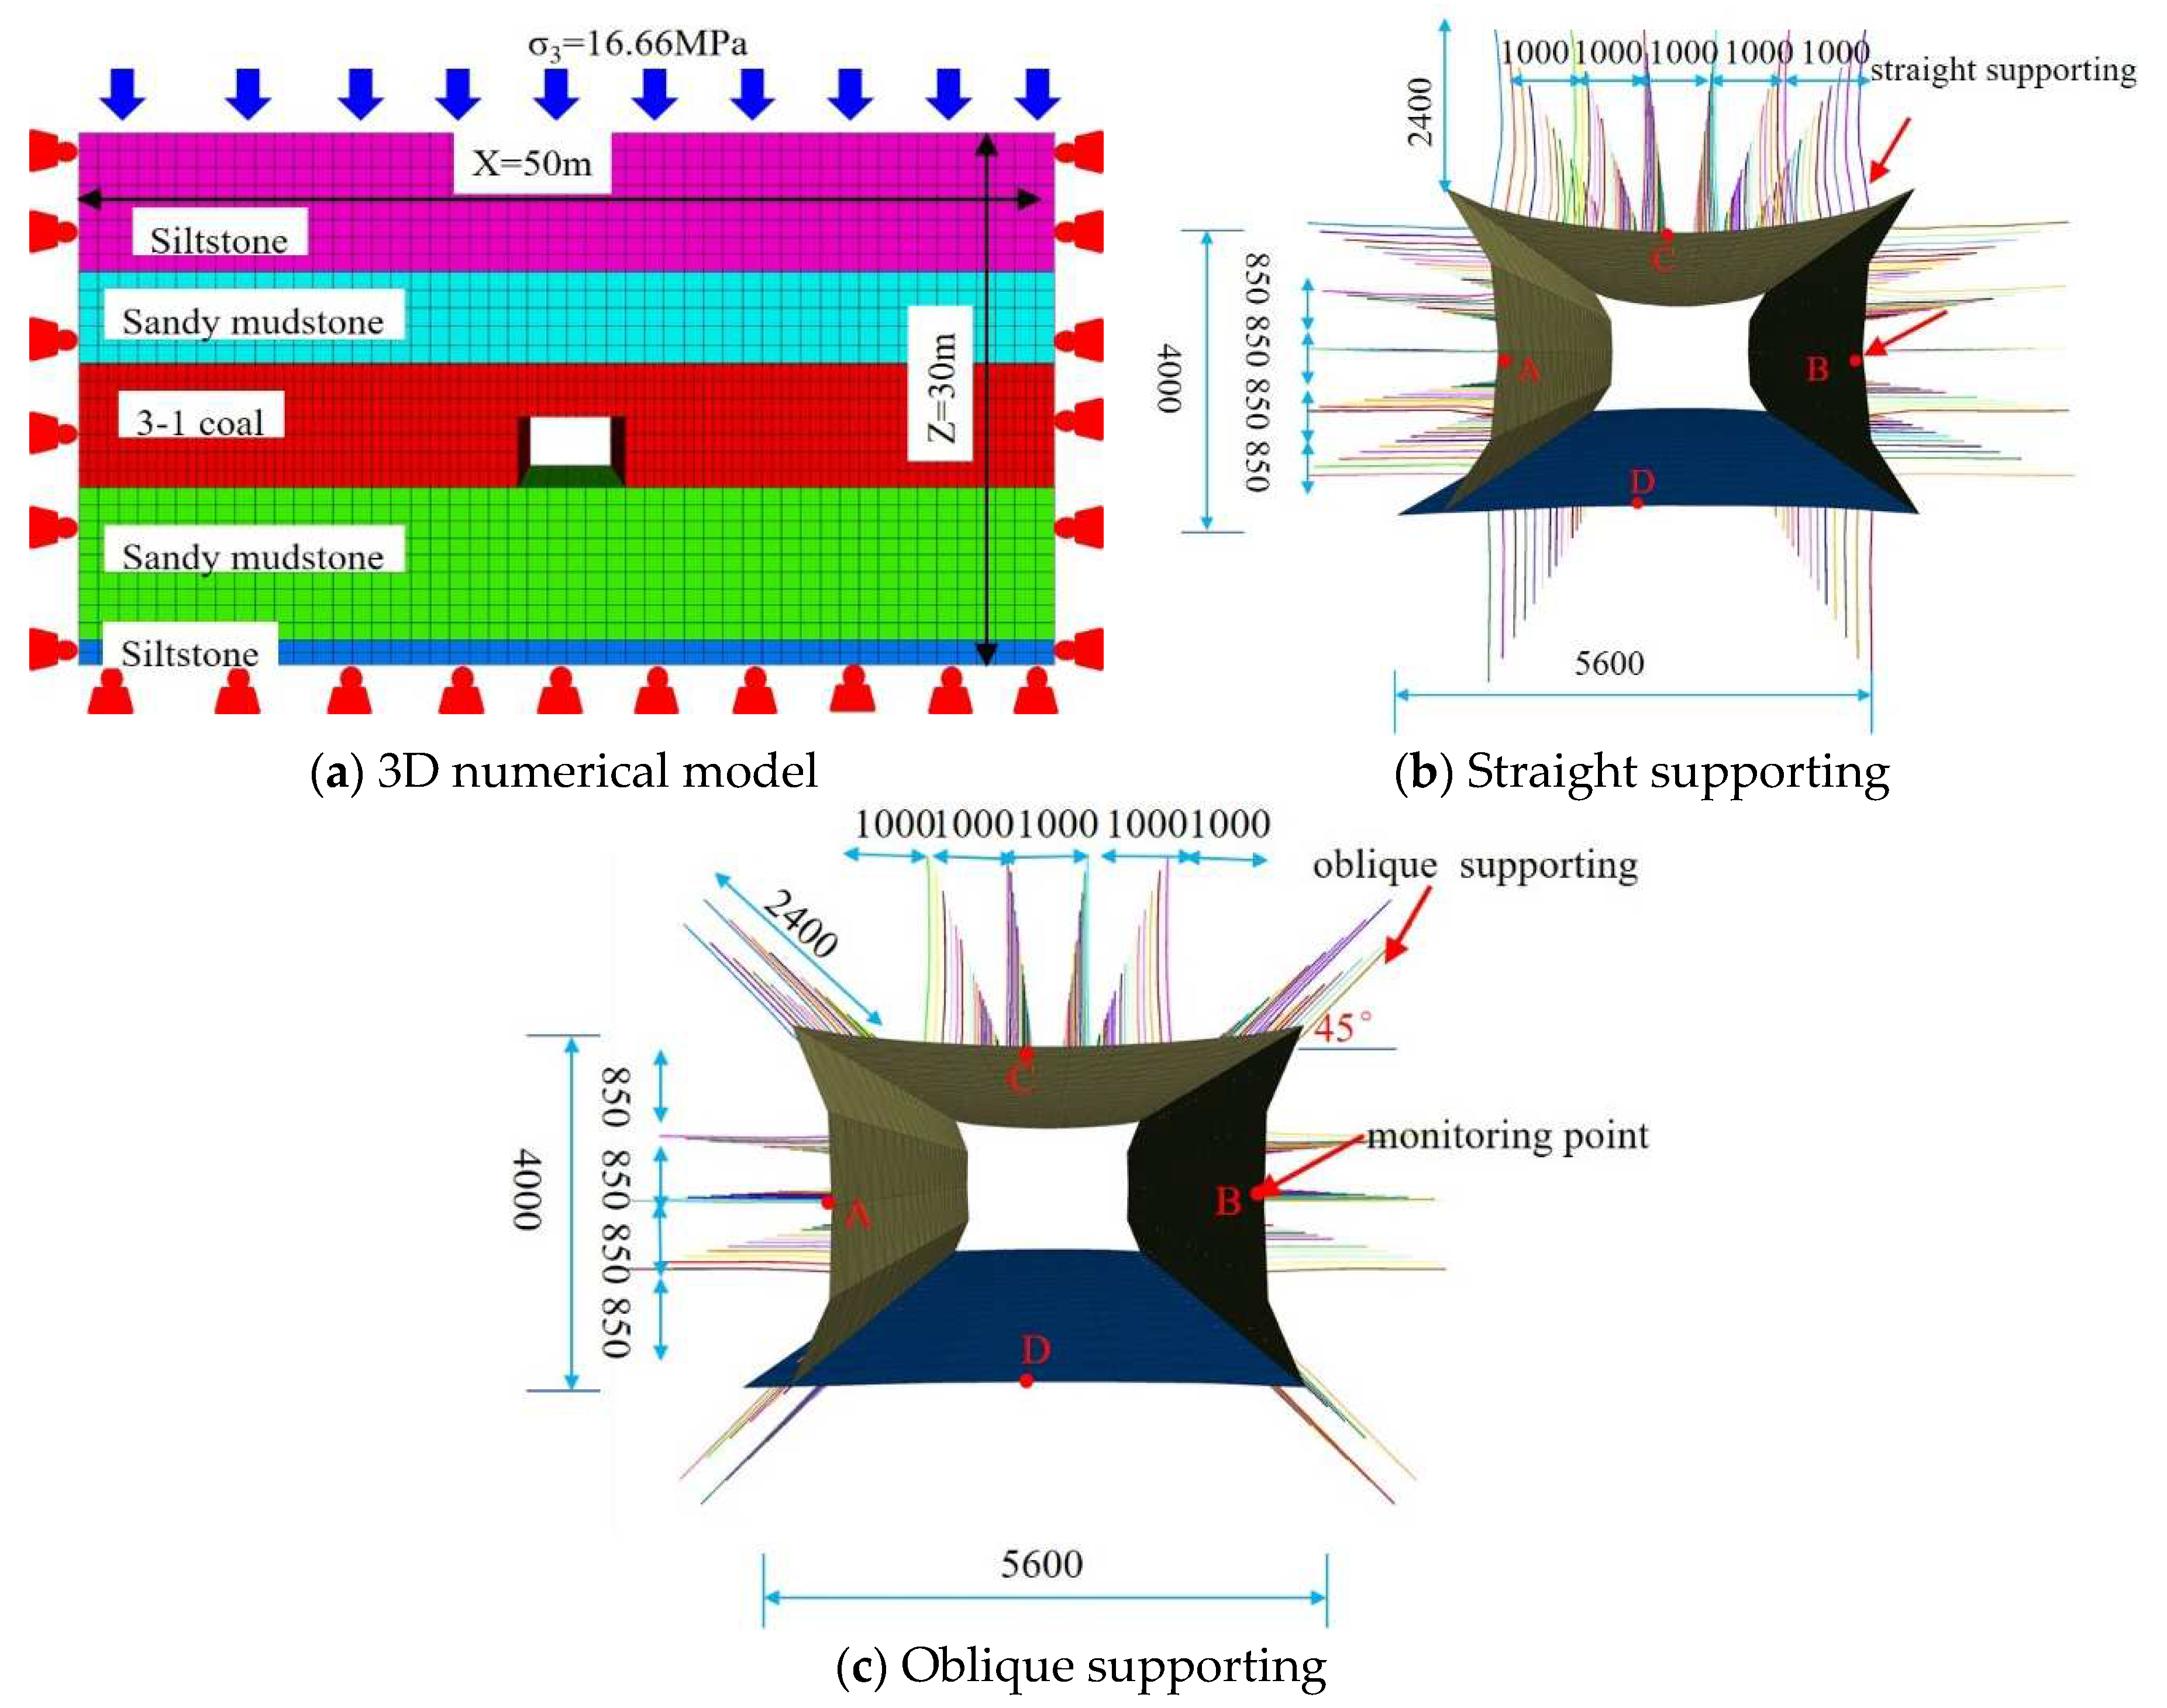
Figure 8.
The volume variation of share-n zones with time.
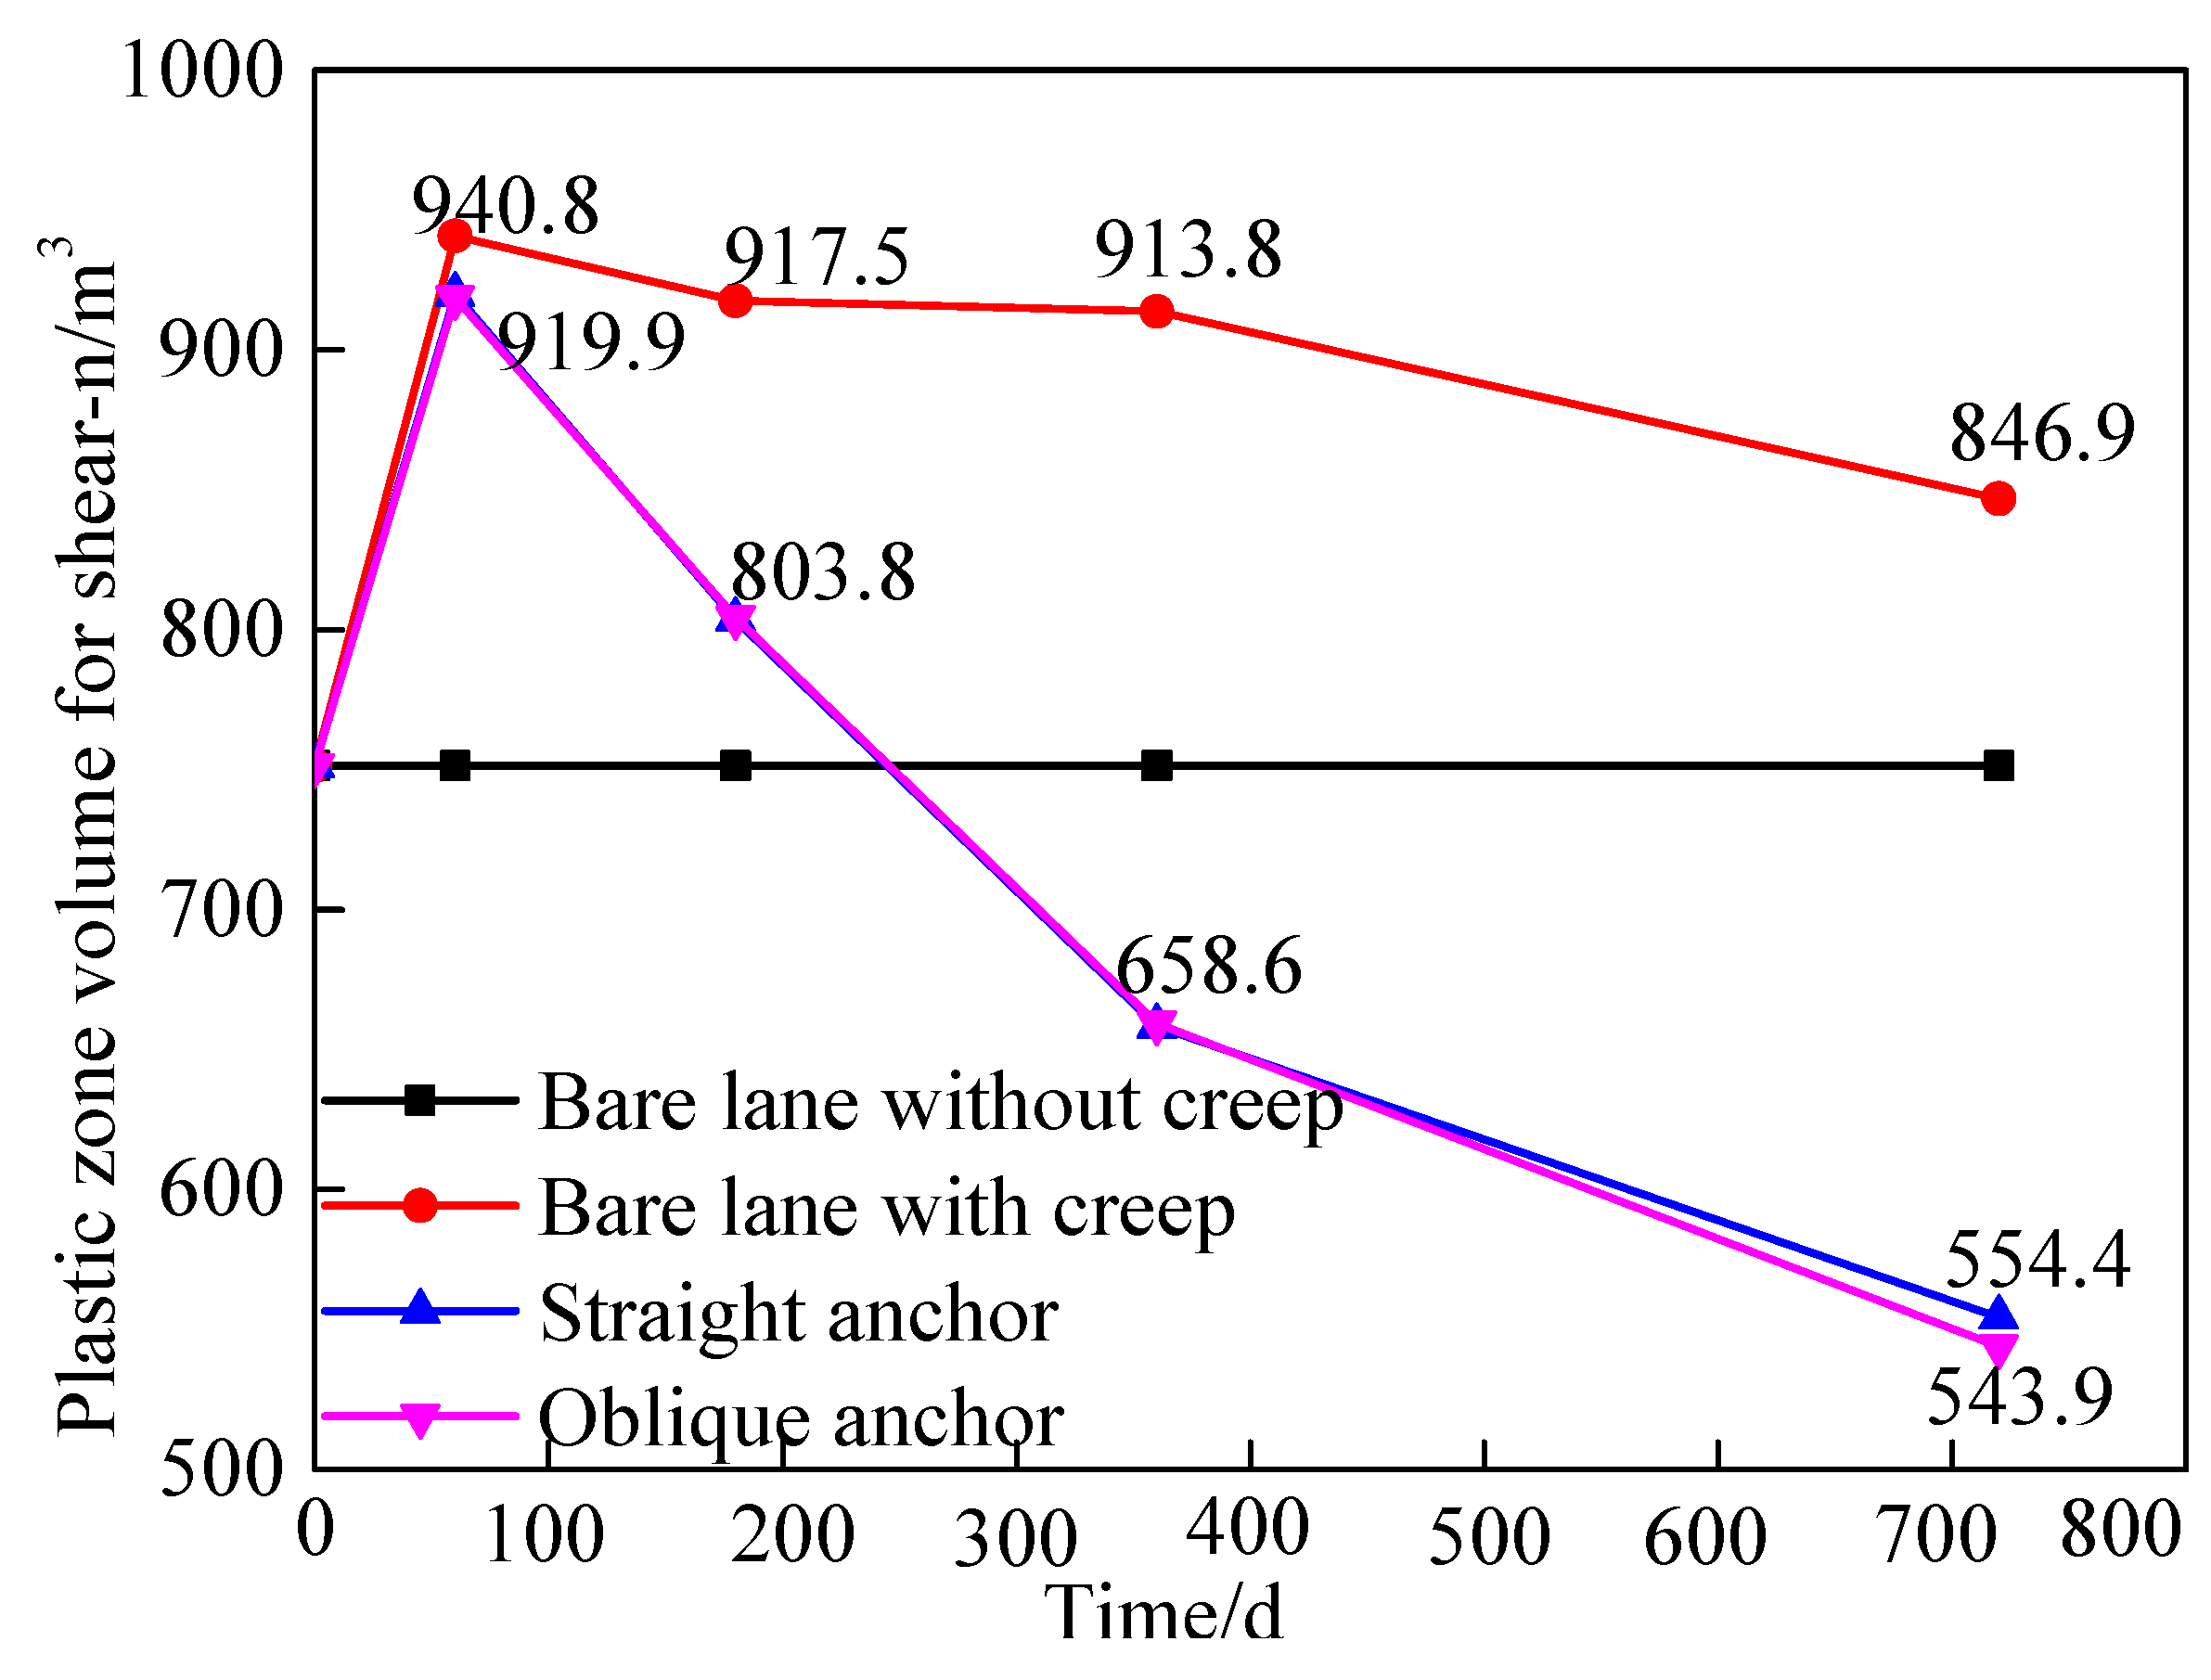
Figure 9.
The volume variation of tension-n zones with time.

Figure 10.
The volume variation of tension-p and shear-p zone with time.
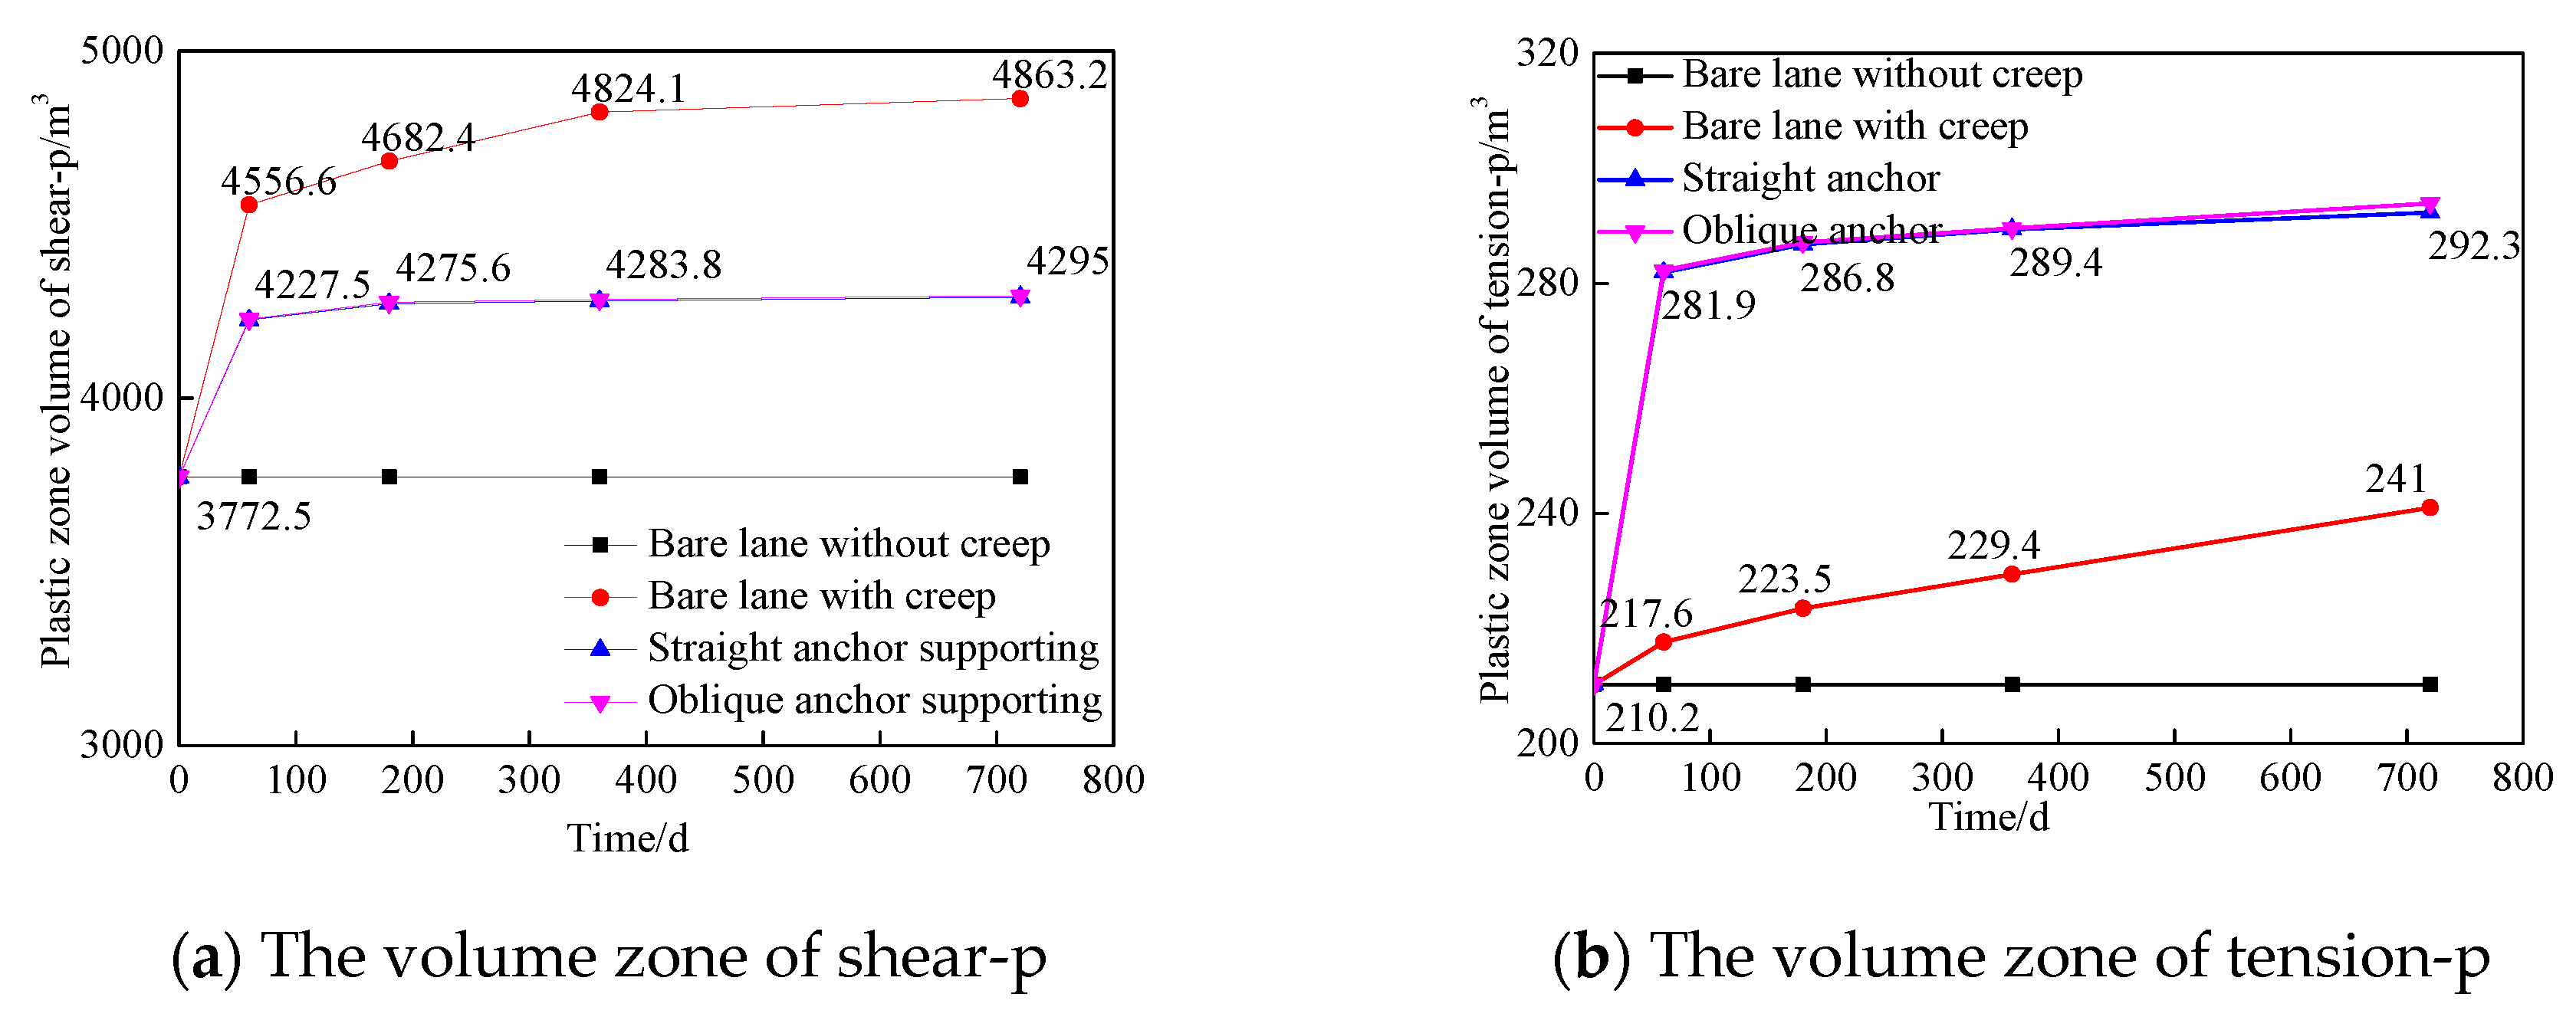
Figure 11.
Evolution of plastic zone over time.
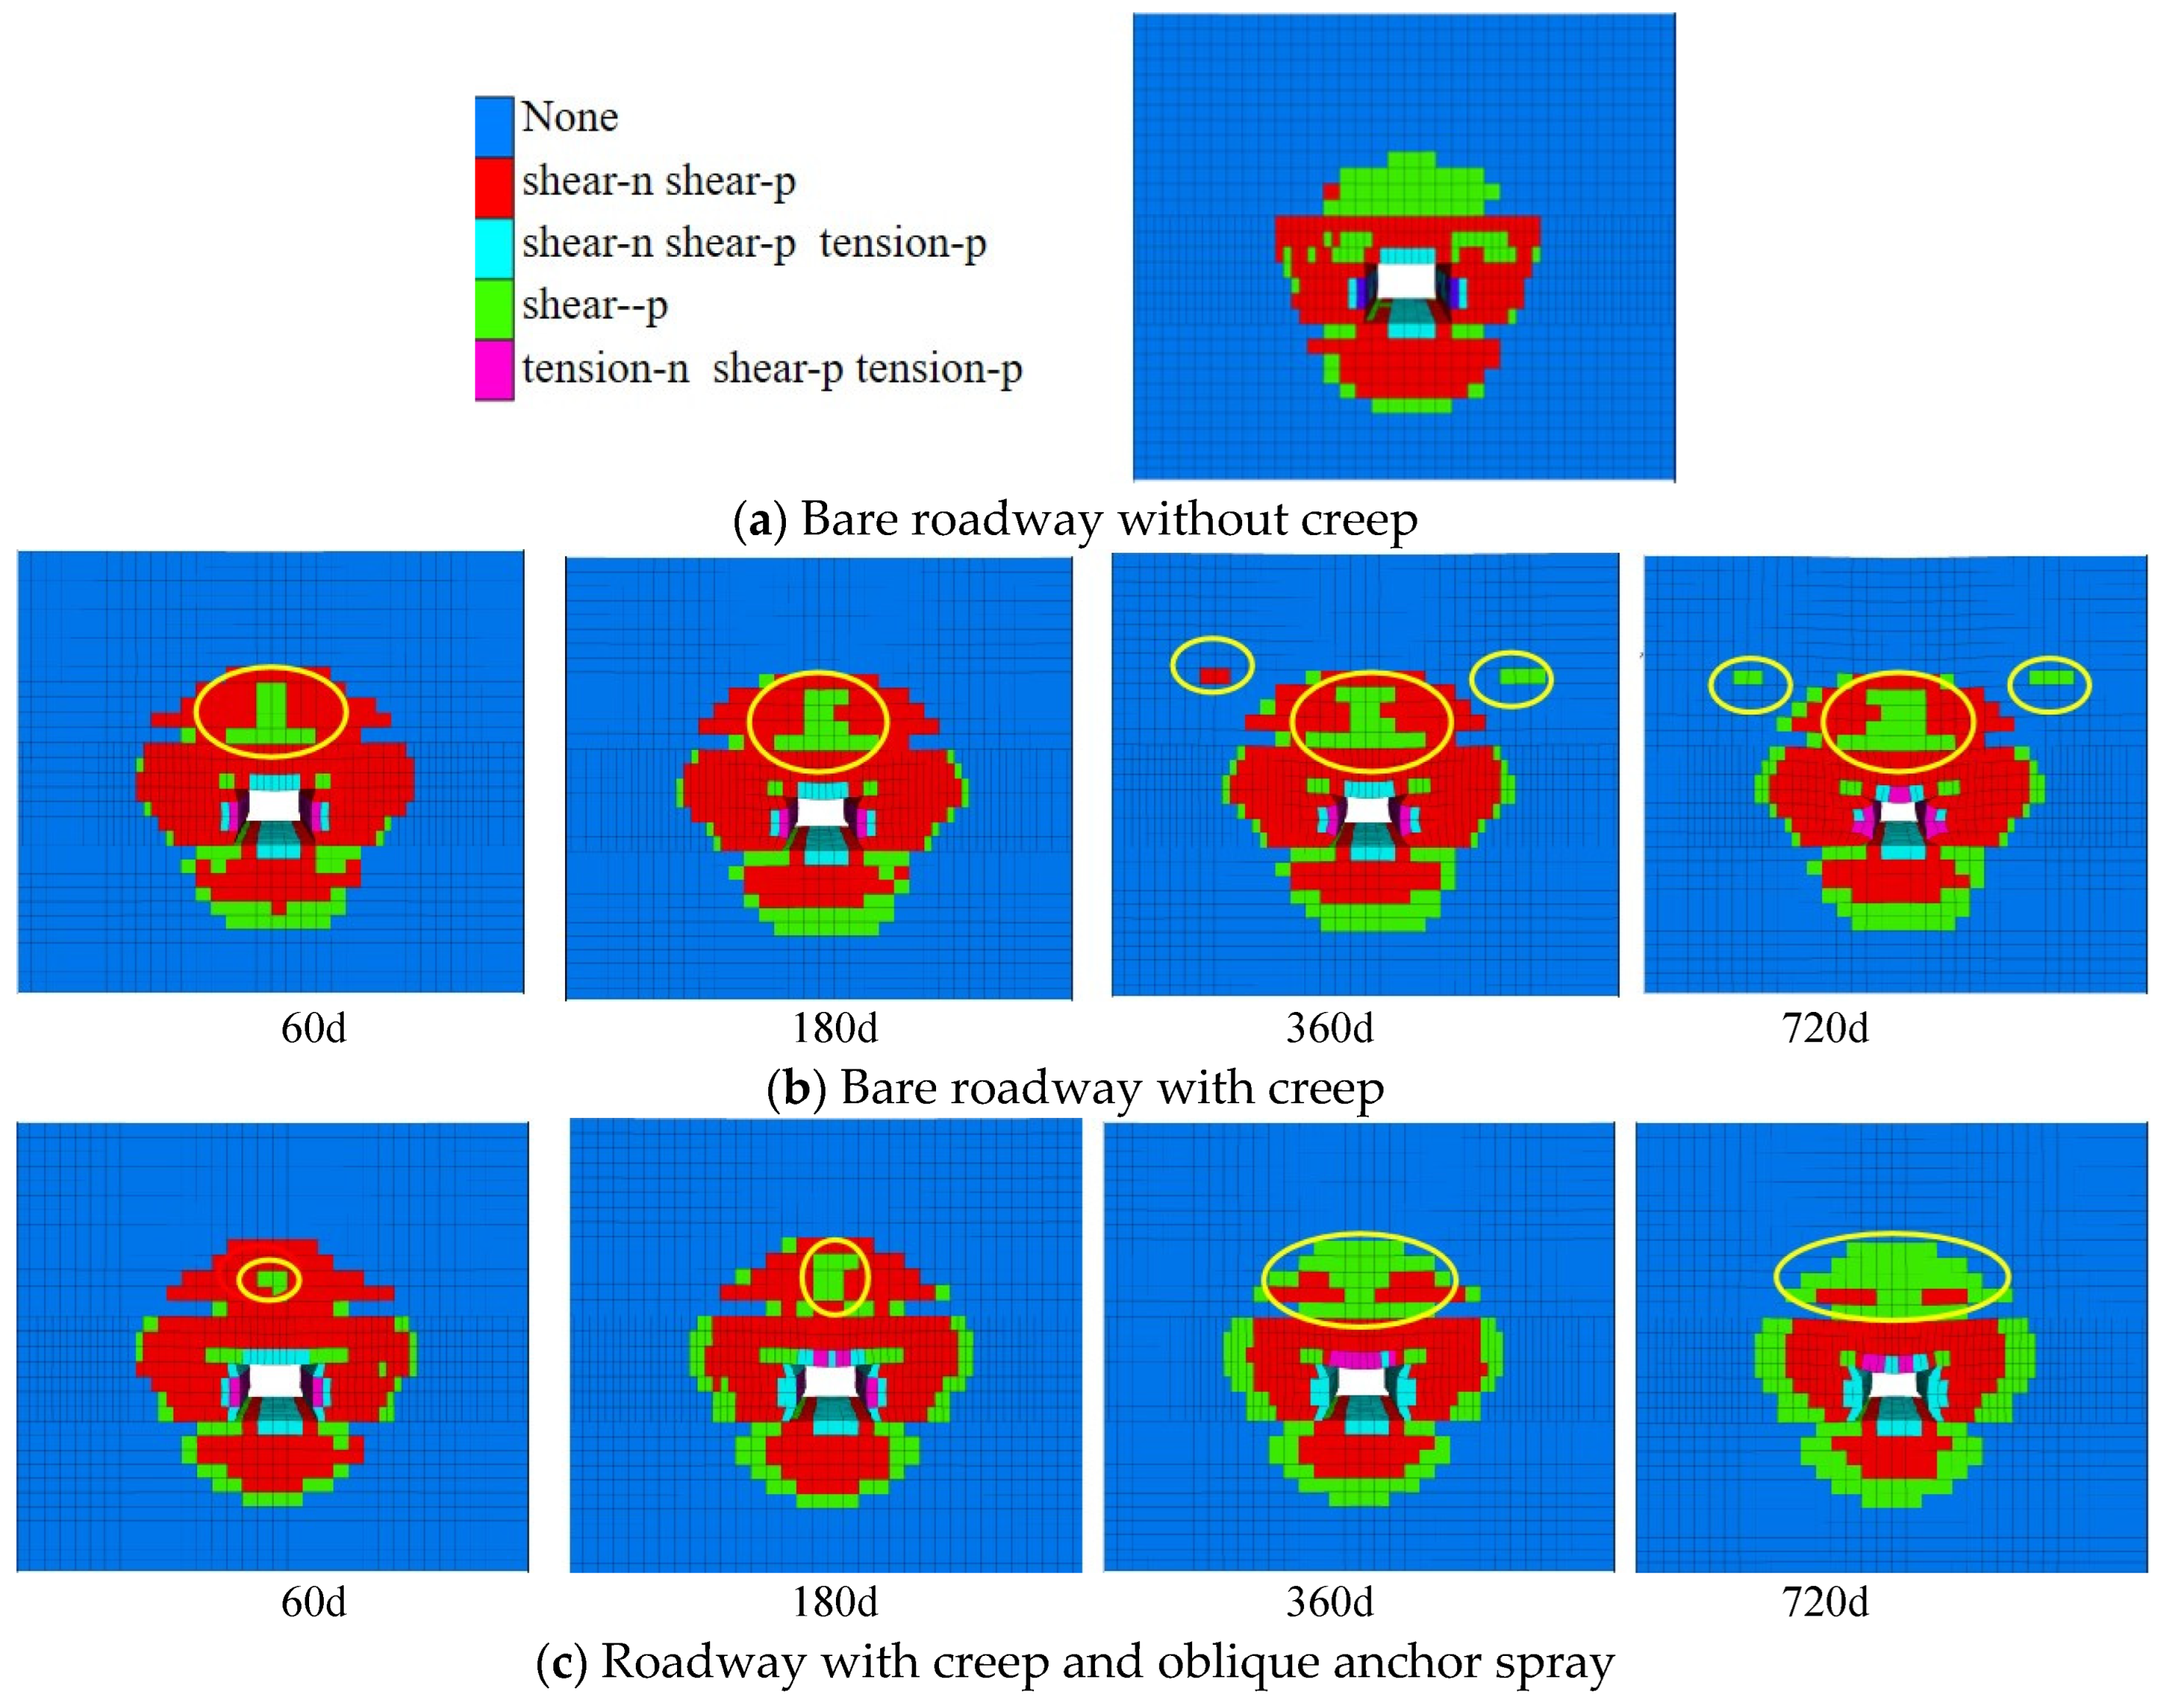
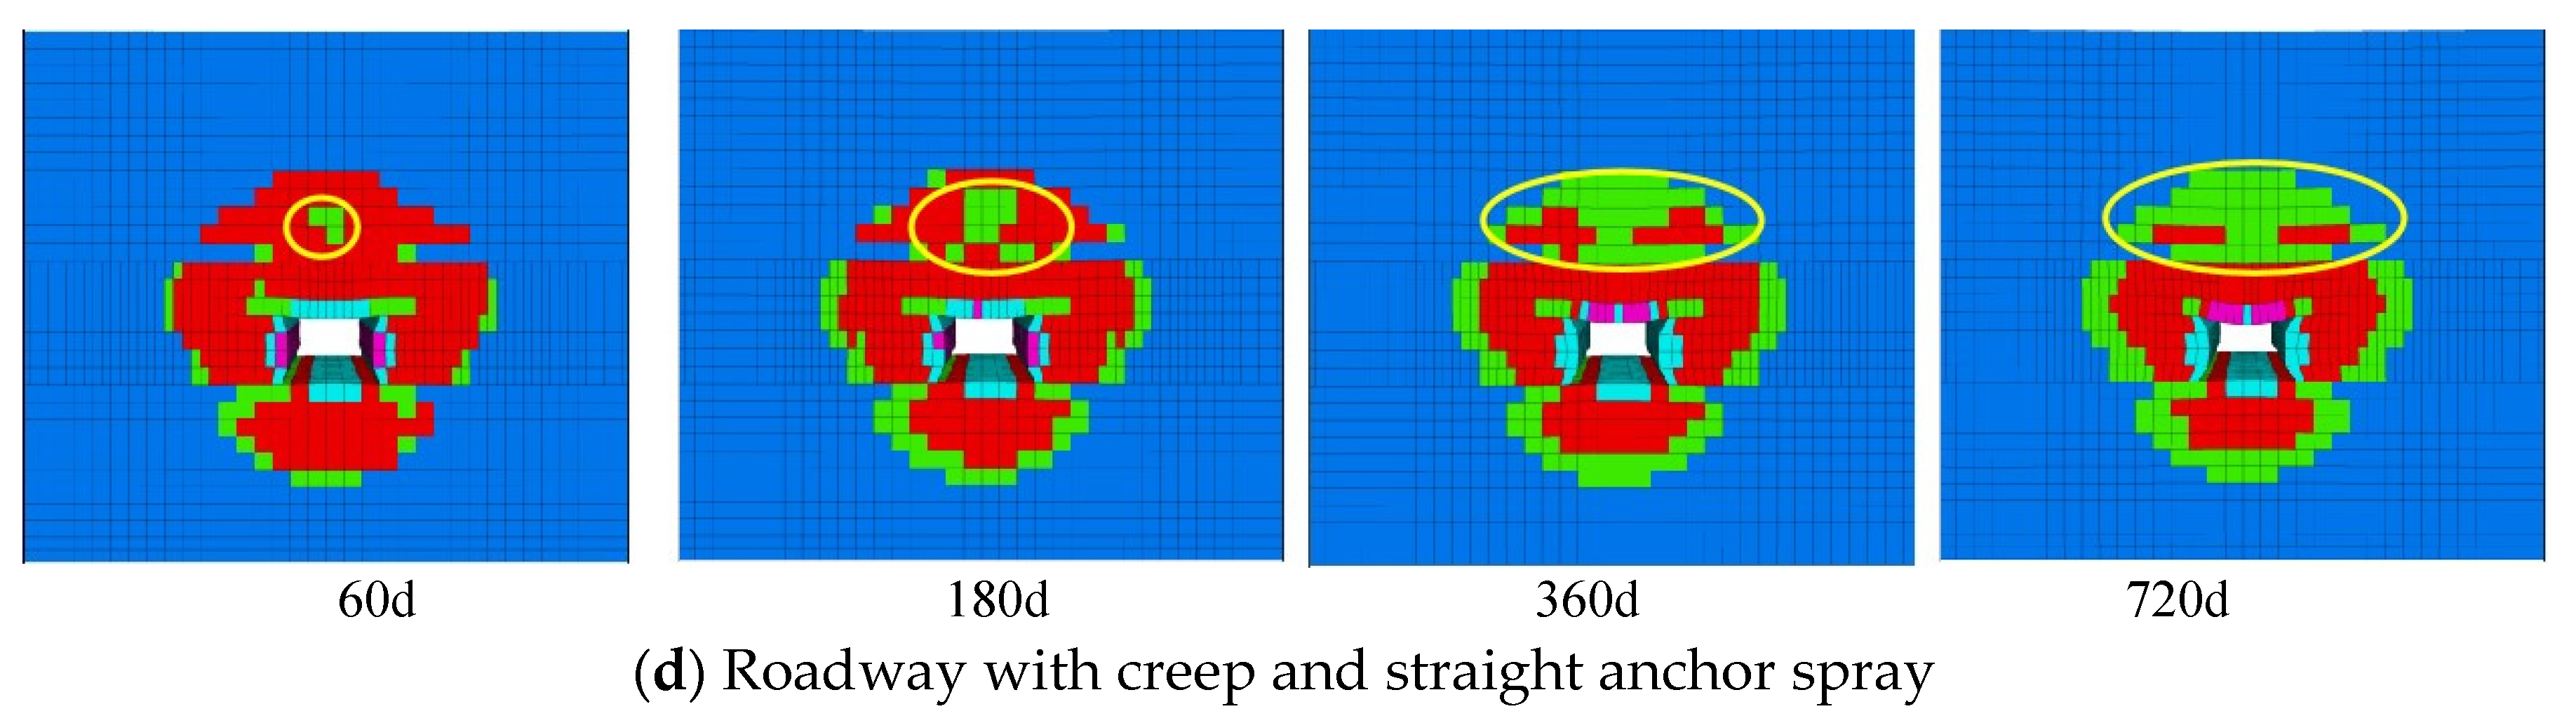
Figure 12.
Variation of surrounding rock damage with time.
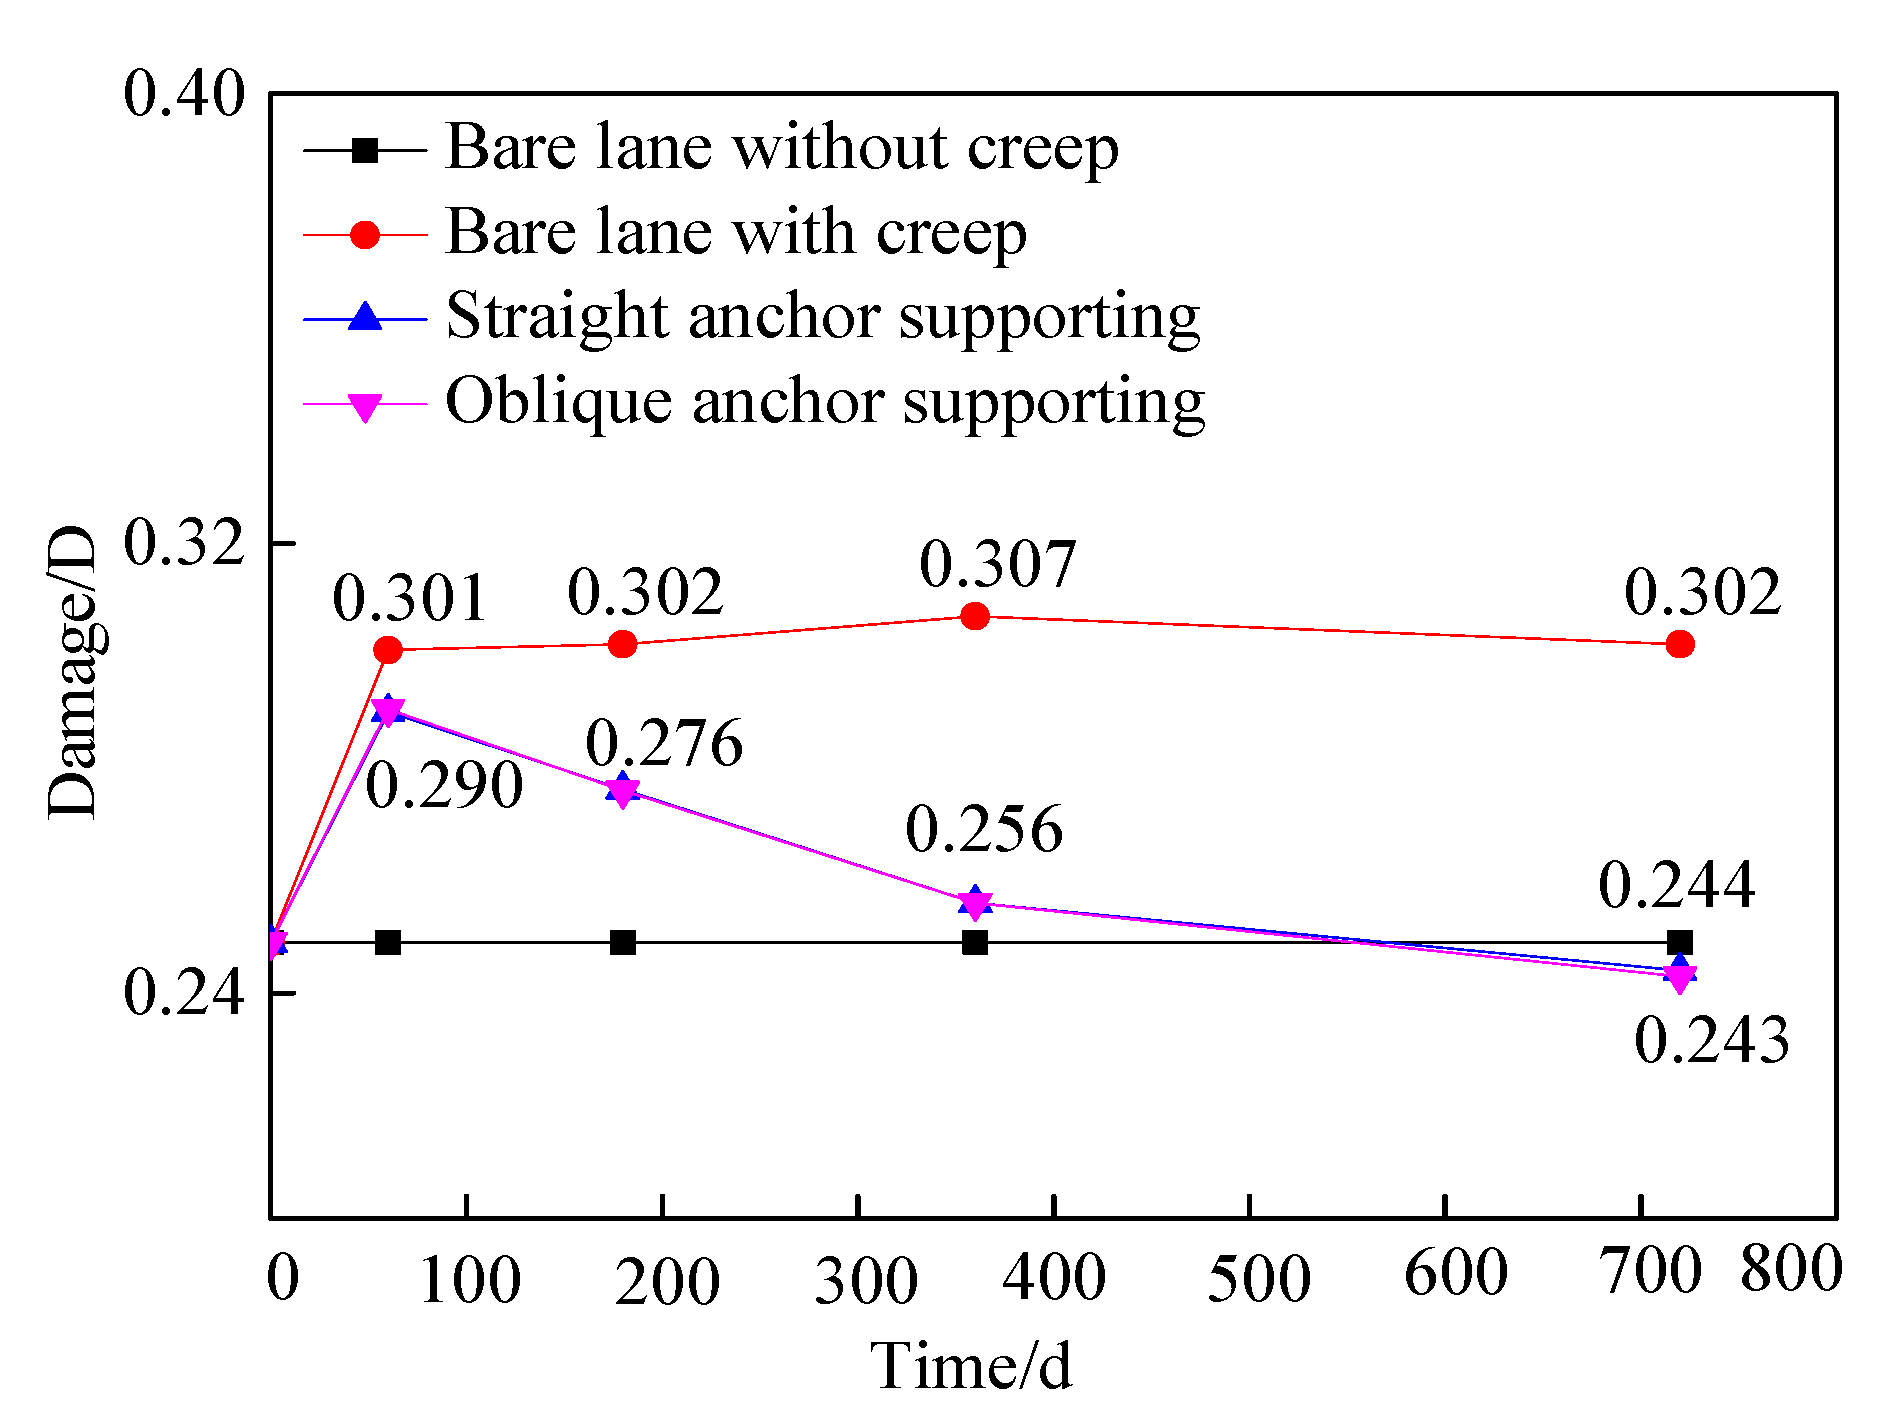
Figure 13.
Displacement field change with time.
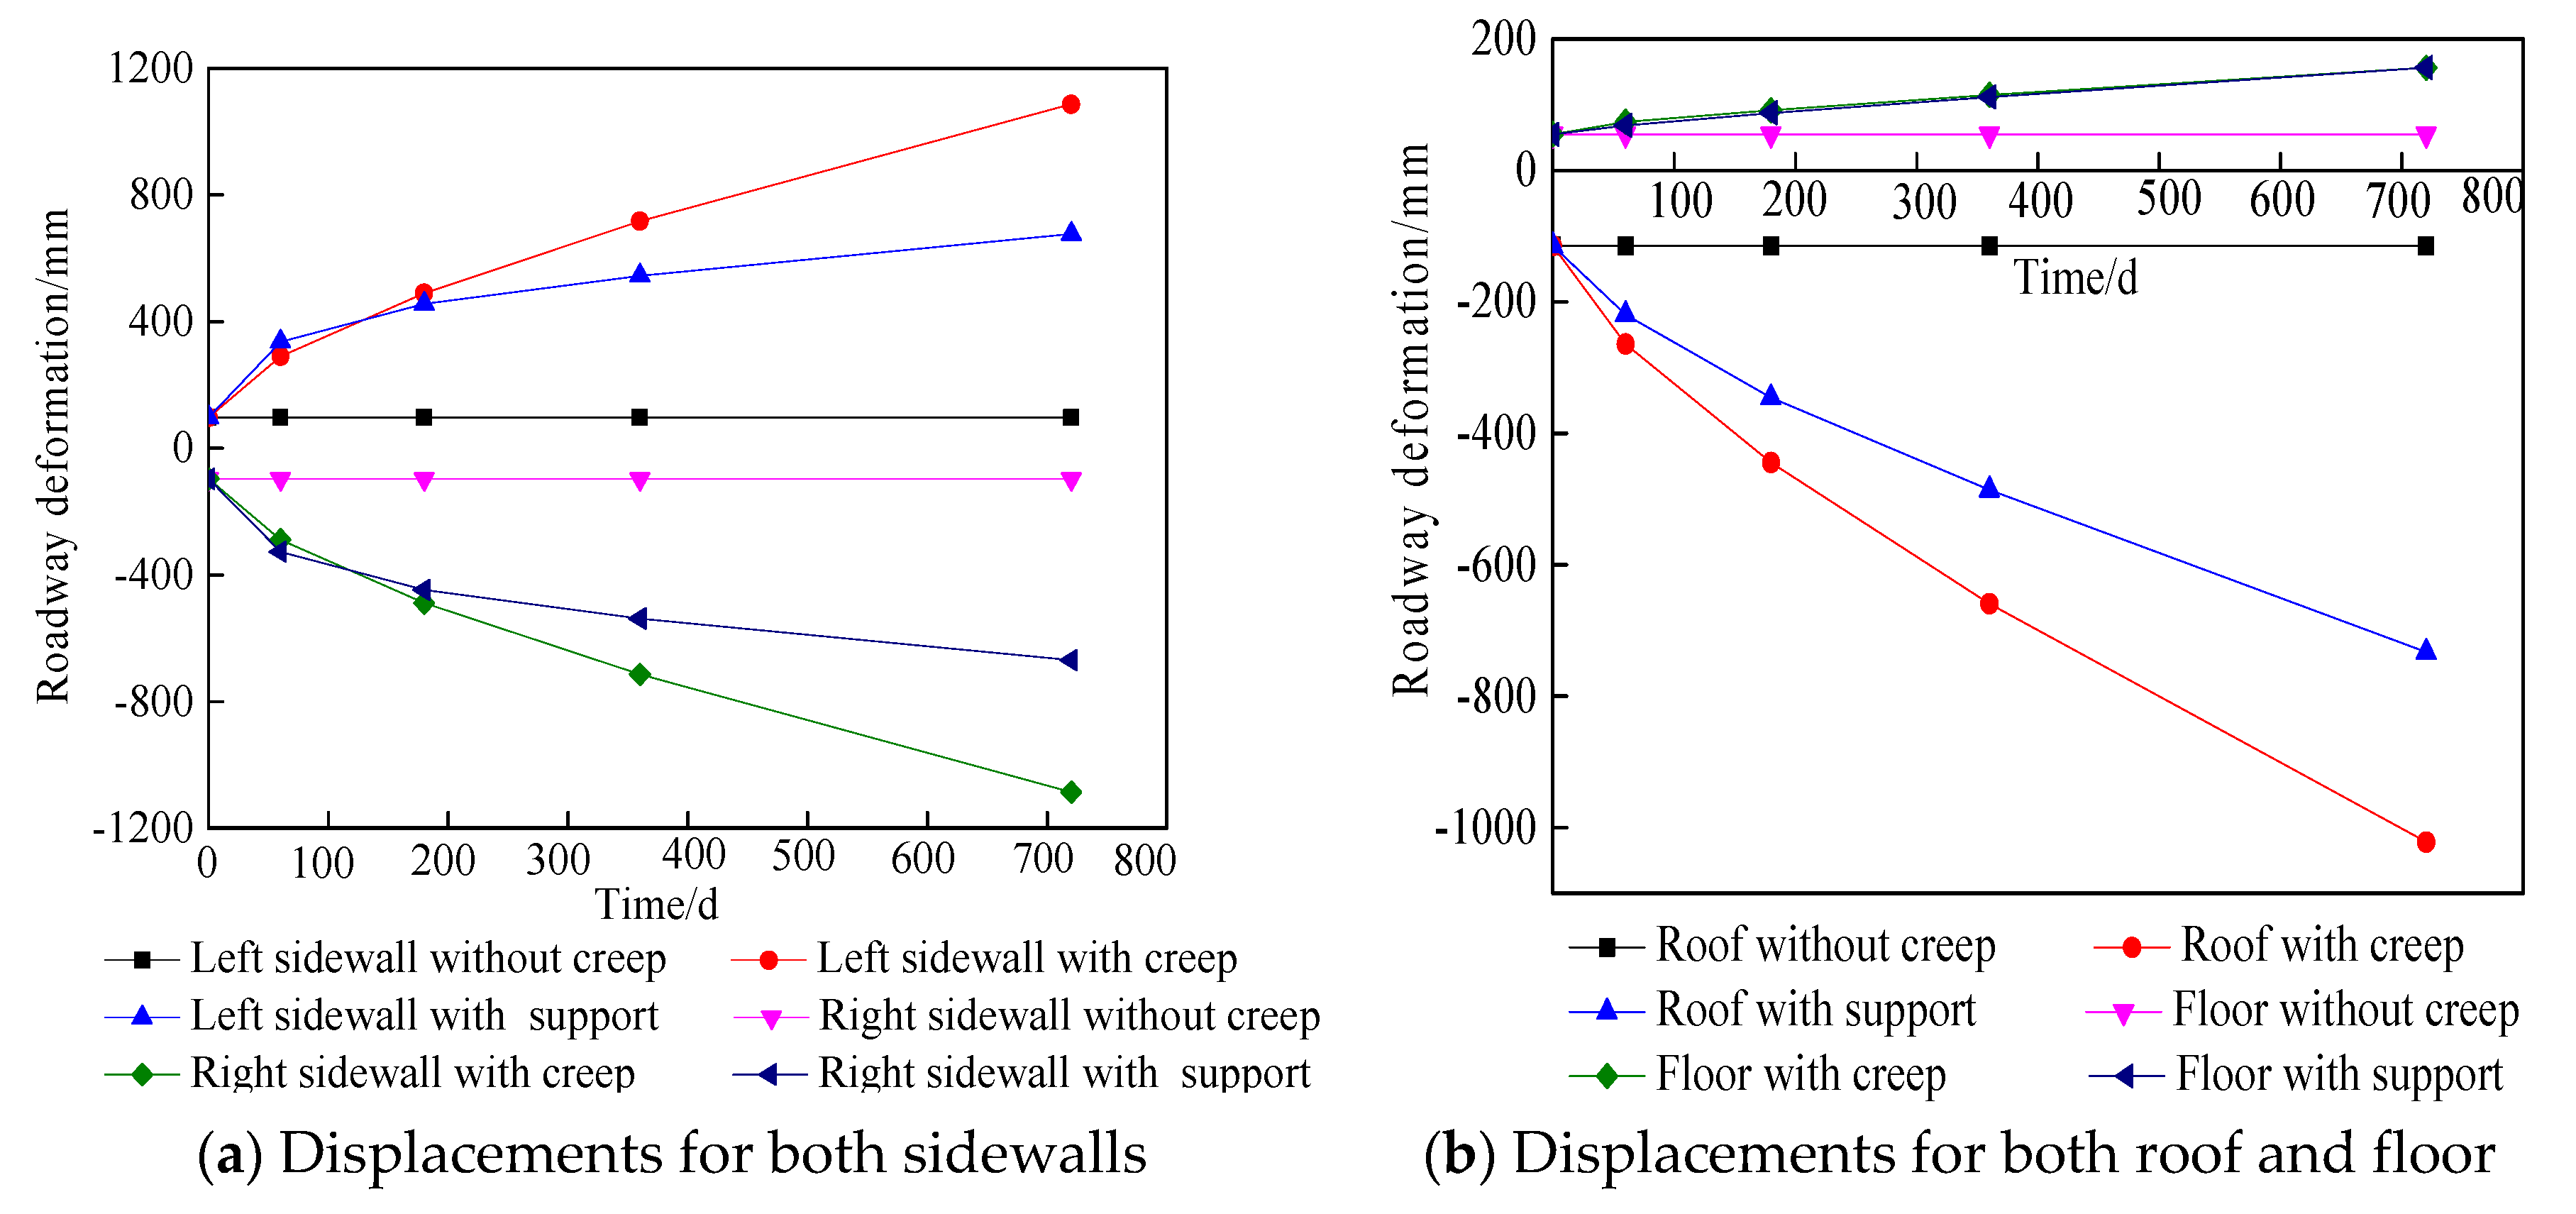
Figure 14.
Monitoring point arrangement.
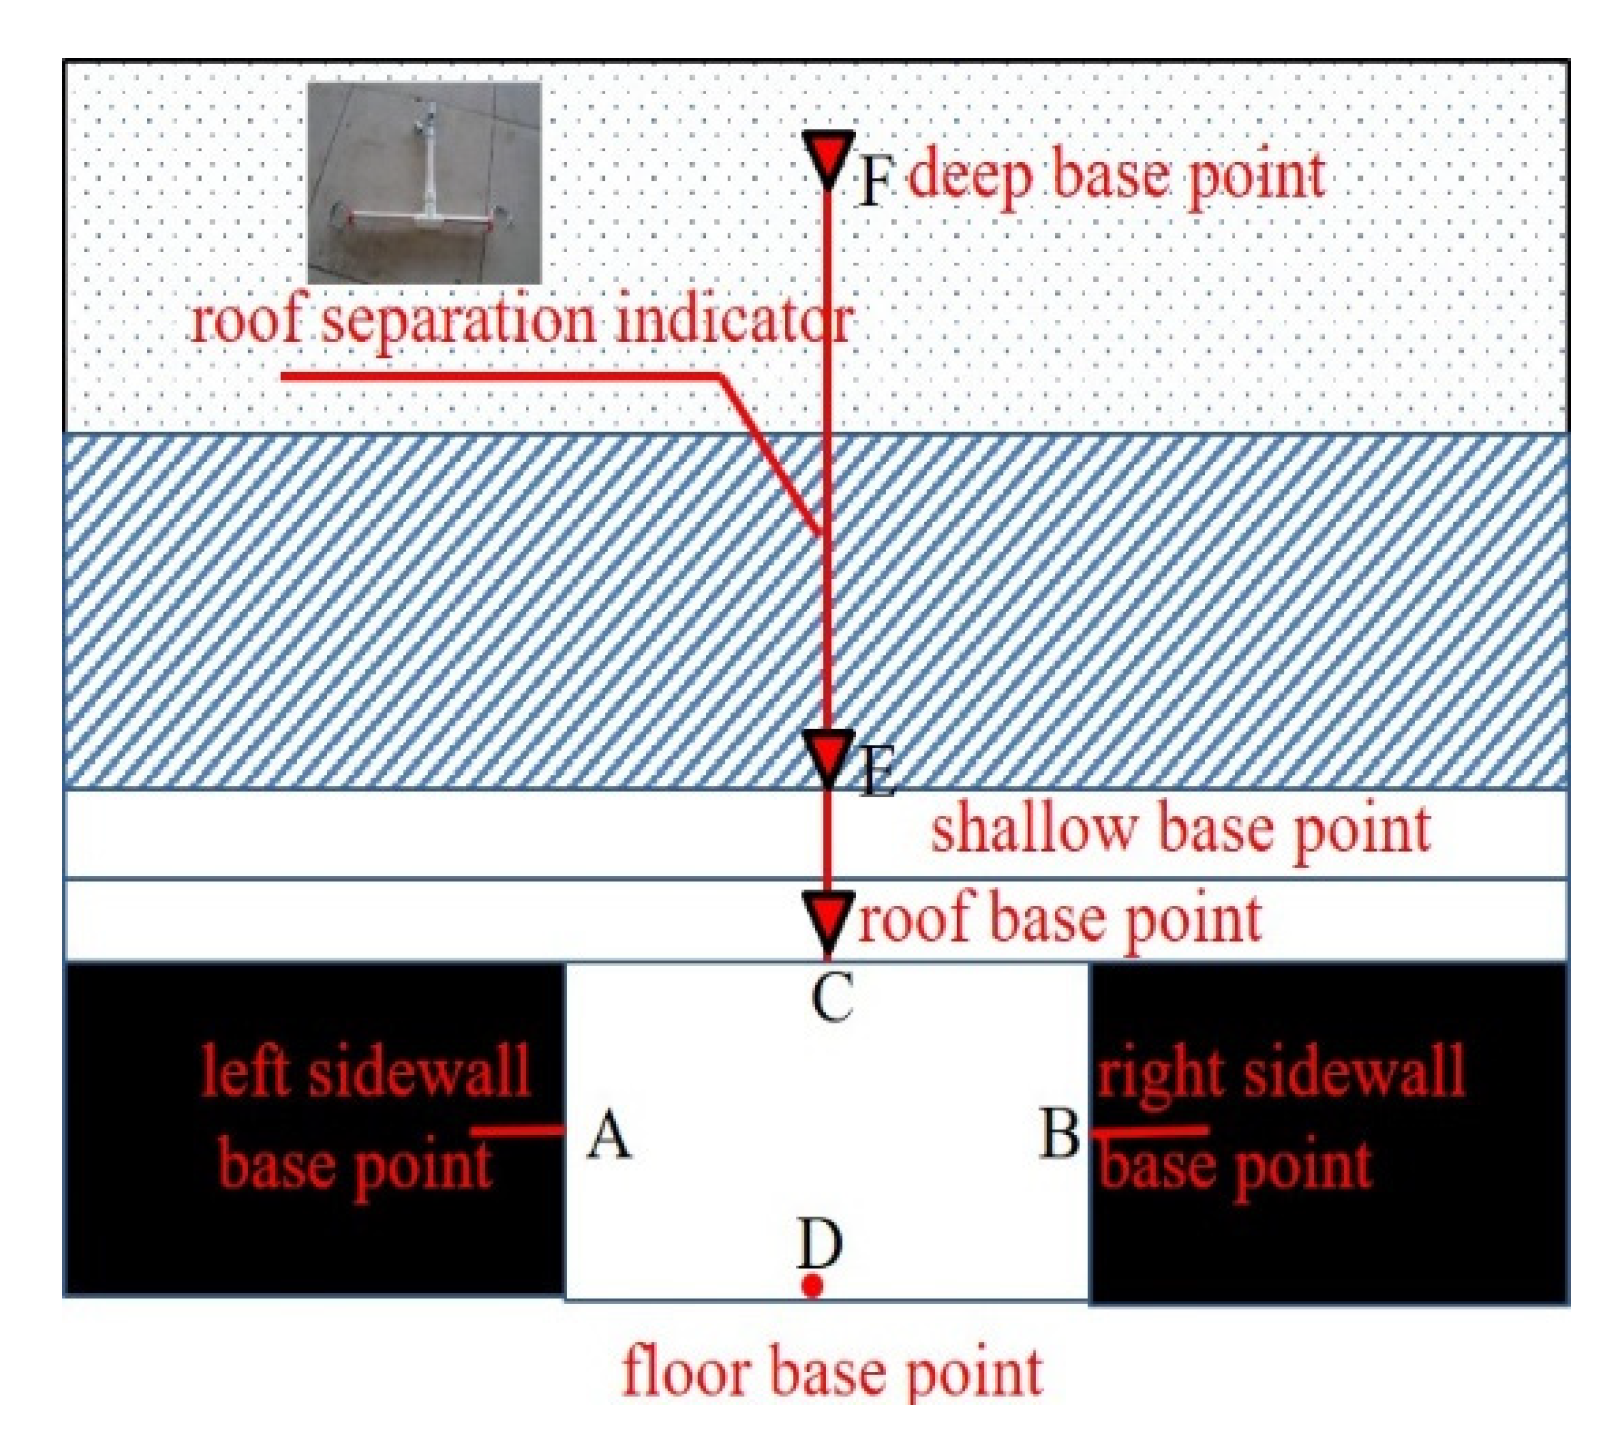
Figure 15.
Comparison between measured data and simulated.
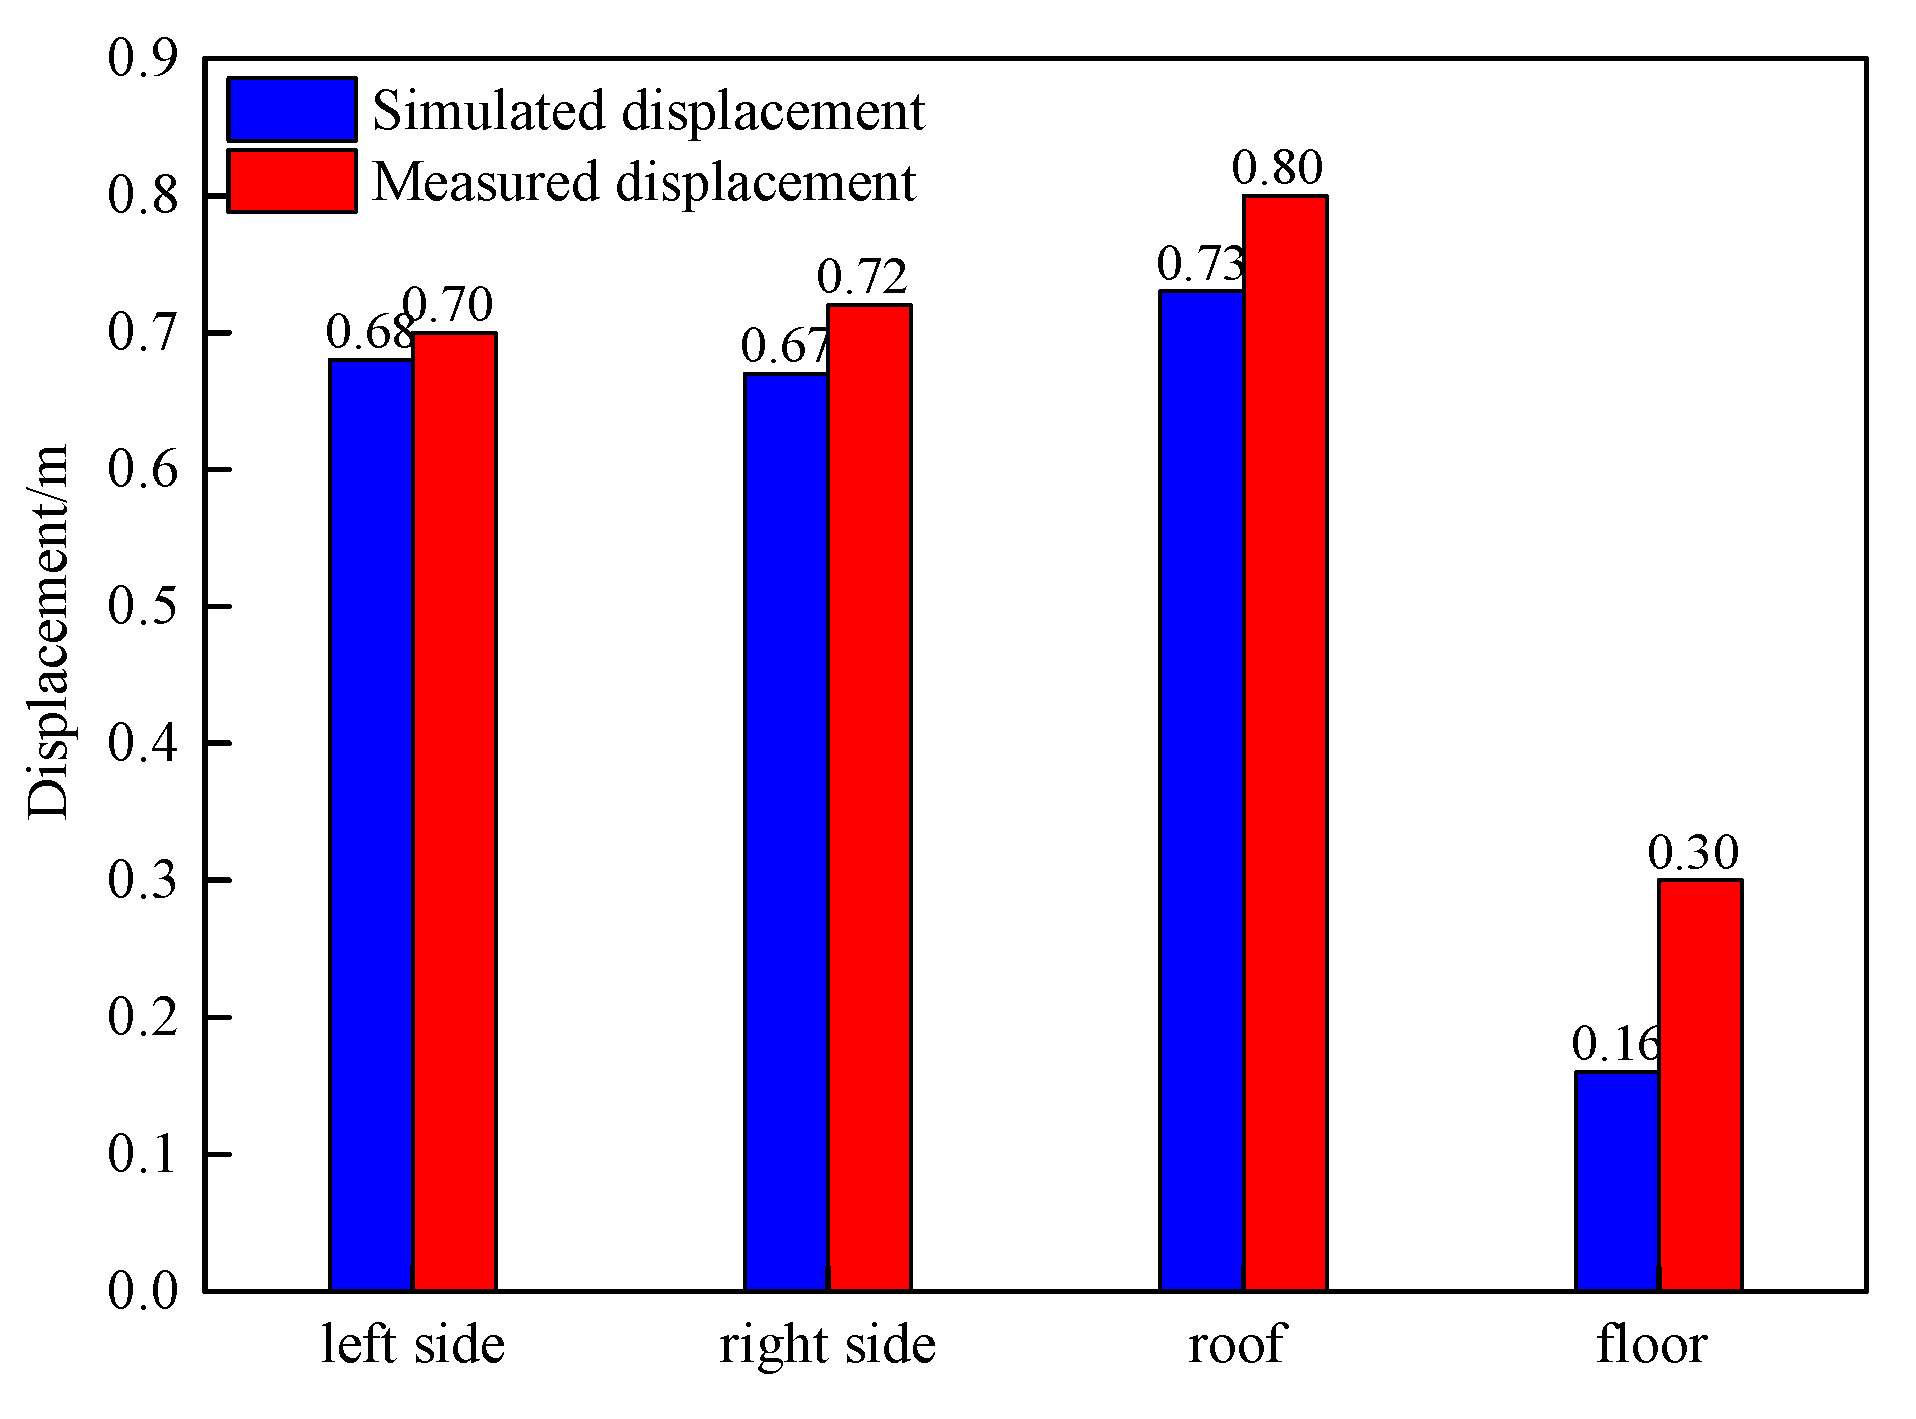
Table 1.
Values of uniaxial compressive strength (UCS) and modulus of elasticity (E) for rock and coal specimens.
Table 1.
Values of uniaxial compressive strength (UCS) and modulus of elasticity (E) for rock and coal specimens.
| Specimen(No.) | UCS(MPa) | E(GPa) | Density(g.cm-3) |
|---|---|---|---|
| A1 | 32.19 | 2.02 | 1.31 |
| A2 | 33.73 | 2.01 | 1.36 |
| A3 | 46.09 | 1.87 | 1.14 |
| B1 | 82.08 | 10.52 | 2.17 |
| B2 | 76.49 | 10.54 | 2.14 |
| B3 | 81.23 | 9.75 | 2.14 |
Table 2.
The in-situ stress test data.
| Buried depth (m) | Maximum principal stress (MPa) | Intermediate principal stress (MPa) | Minimum principal stress (MPa) | Burst orientation (°) |
|---|---|---|---|---|
| 718 | 24.21 | 21.40 | 16.51 | 45 |
| 731 | 21.00 | 20.65 | 16.81 | 45 |
| average | 22.60 | 21.00 | 16.66 | 45 |
Table 3.
The physical and mechanical parameters used for simulation.
| Rocktpe | Bulk (GPa) | GK (GPa) | GM (GPa) | ηK (GPa.h) | ηM (GPa.h) | Cohesion (MPa) | Internal friction angle (°) | Tensile strength (MPa) | Dilatancy angle (°) |
|---|---|---|---|---|---|---|---|---|---|
| siltstone | 2.02 | 132.6 | 6.1 | 937 | 23079 | 1.60 | 26.1 | 1.75 | 11.6 |
| Sandy mudstone | 2.80 | 156.3 | 5.3 | 937 | 15702 | 1.67 | 28.2 | 0.32 | 10.7 |
| 3-1 coal | 1.86 | 55.6 | 3.7 | 631 | 8703 | 1.28 | 21.8 | 0.15 | 15.3 |
| Sandy mudstone | 2.79 | 156.3 | 5.3 | 937 | 15702 | 1.61 | 27.7 | 0.30 | 10.7 |
| siltstone | 2.02 | 132.6 | 6.1 | 1331 | 23079 | 1.60 | 26.1 | 1.75 | 11.6 |
Table 4.
Shotcrete support parameters.
| Density (kg.m-3) | Elastic modulus/GPa | Poisson's ratio | Internal friction angle/(°) | Cohesion (MPa) | Tensile strength (MPa) |
|---|---|---|---|---|---|
| 2350 | 25.0 | 0.18 | 35 | 7.5 | 4.0 |
Disclaimer/Publisher’s Note: The statements, opinions and data contained in all publications are solely those of the individual author(s) and contributor(s) and not of MDPI and/or the editor(s). MDPI and/or the editor(s) disclaim responsibility for any injury to people or property resulting from any ideas, methods, instructions or products referred to in the content. |
© 2023 by the authors. Licensee MDPI, Basel, Switzerland. This article is an open access article distributed under the terms and conditions of the Creative Commons Attribution (CC BY) license (http://creativecommons.org/licenses/by/4.0/).
Copyright: This open access article is published under a Creative Commons CC BY 4.0 license, which permit the free download, distribution, and reuse, provided that the author and preprint are cited in any reuse.


