
Submitted:
28 June 2023
Posted:
29 June 2023
You are already at the latest version
Abstract
Optical immunosensors are one of the most popular category of immunosensors with applications in many fields including diagnostics, environmental and food analysis. The latter field is of particular interest not only for the scientists but also for the regulatory authorities and the public since food is essential for life but can be also the source of many health problems. In this context, the current review aims to provide an overview of the different types of optical immunosensors focusing onto their application for the determination of pathogenic bacteria in food samples. In particular, after the description of main optical transduction techniques, their implementation for the immunochemical determination of bacteria will be discussed. Finally, a short commentary about the future trends in optical immunosensors for food safety applications will be provided.
Keywords:
immunosensor
; optical detection
; bacteria
1. Introduction
Foodborne diseases affect according to World Health Organization (WHO) 1 in 10 people every year worldwide [1], with symptoms ranging from mild diarrhea to severe complications and even death [2]. According to WHO, it was estimated that the cases of food poisoning reached up to 600 million, with 420.000 deaths worldwide, amongst which 125.000 are children under the age of 5 [1]. Especially, pathogenic bacteria play a crucial role in food poisoning with the majority of the incidents to be caused by 15 pathogenic bacteria including Listeria monocytogenes, Escherichia coli O157:H7, Clostridium botulinum, Legionella pneumophila, Campylobacter jejuni, Salmonella spp., Staphylococcus aureus, Shigella, Vibrio vulnificus and Bacillus cereus [3]. Most of these bacteria are detected in dairy products, fresh vegetables, raw products and undercooked meat and seafood [4,5].
The efficiency and reliability of the techniques employed to detect these pathogens in food matrices are of paramount importance for the prevention of foodborne diseases. [6,7]. The conventional methods for bacteria detection and identification are based on culturing and colony counting. Those methods are reliable, sensitive, and are considered as the “gold standard” for detecting the presence of bacteria, however, they require prior to detection several steps such as pre-enrichment, selective enrichment, isolation and confirmation through biochemical and serological tests [8,9]. Thus, there was an urgent need for rapid bacteria detection techniques, that led to the development of new methods such as molecular and immunological ones [10]. Molecular methods rely on polymerase chain reaction (PCR) [11,12,13] to rapidly and effectively identify various bacteria through their genetic fingerprinting. On the other hand, immunoassays rely on antibodies that recognize specific proteins or liposaccharides of bacteria external membrane. Chemiluminescent Enzyme Immunoassay (CL-EIA) [14] and Enzyme-Linked-Immunosorbent Assay (ELISA)[15,16,17] are the immunochemical methods most widely employed for rapid bacterial detection and quantification. Immunoassays are characterized by high sensitivity and accuracy, simple sample preparation and low cost of instrumentation compared to other instrumental methods such as chromatographic ones. Nonetheless, these methods are laboratory bound since they involve multiple processing steps and desktop instrumentation [18,19]. The quest for portable analytical devices that could provide reliable results in short analysis time and be suitable for on-site applications has been the driving force behind the development of biosensors. Nowadays, the realization of biosensor systems that combine outstanding analytical performance with portability has moved from the sphere of fiction to reality due to the significant progress in the field of nanotechnology that enabled the fabrication of such sensors [20]. Thus, modern biosensor technologies can provide high detection sensitivity and specificity, high-speed analysis, and quantitative results in real-time [21]. Biosensors are defined by IUPAC as analytical devices that provide quantitative or semi-quantitative information by combining a biological recognition element with a physicochemical transducer, that transforms the biorecognition event into a physically detectable signal [22]. The recognition element can be any bioreceptor [23], such as nucleic acid probe, aptamer, phage, antibody, antigen, whole cell, enzyme, etc., that can bind the target molecule specifically and with high affinity [24,25,26,27,28,29,30,31] (Figure 1a).
Immunosensors, i.e., biosensors that rely on antibody-antigen reactions for analyte detection, are the most abundant category of biosensors due to the indispensable ability of antibodies for highly selective detection of the targeted analytes in complex media and the versatility of available assay formats that could be successfully employed for the determination of both low- and high-molecular weight analytes, such as bacteria [31]. They can be divided according to the transduction principle to electrochemical [32,33,34,35], piezoelectric [36,37,38] or optical ones [32,39], which can detect biological interactions by evaluating the variations in the electrical signal, mass or light, respectively (Figure 1b). Electrochemical immunosensors are cost-efficient devices and have the potential for miniaturization. Nevertheless, they lack in sensitivity and often require labels for signal enhancement to improve their detection limits. Similarly, immunosensors based on piezoelectric phenomena, even though are suitable for label-free detection, they are characterized in general by relatively low detection sensitivity [40]. On the other hand, optical immunosensors exhibit high sensitivity and offer for simple, fast and accurate detection of a great variety of analytes, including bacteria [41]. Optical detection methods (Figure 1b) are based on different transduction principles such as light absorbance, total internal reflectance, photoluminescence, fluorescence, light polarization, interferometry, Raman scattering and surface plasmon resonance [42,43].
The scope of this review is to summarize the achievements of optical immunosensors for foodborne bacteria detection. At first, short descriptions of the different detection principles employed will be provided. Then, the application of optical immunosensors for bacteria detection in different food matrices will be extensively presented. Finally, a short commentary on the future trends regarding the prospective applications and challenges of optical immunosensors in food analysis is included.
2. Principles of optical immunosensors
2.1. Assay formats
In principle, most immunosensors could offer the potential to monitor directly the antigen-antibody binding in real-time. Such direct detection although is simpler and faster, since there is no need for additional reaction steps, is usually limited to high-molecular weight analytes, for which the antigen-antibody reaction results in a measurable change of sensor response [32]. Therefore, in most immunosensors the assay formats usually applied in microtiter plate solid-phase immunoassays are followed, i.e., the competitive or the non-competitive assay format. For the low-molecular weight analytes including toxins, pesticides, antibiotics, pharmaceutical residues, etc., the preferred assay format is the competitive one, based either on immobilized antibody (Figure 2a) or on immobilized antigen or analyte-protein conjugate (Figure 2b). In the first approach, the antibody is immobilized onto the transducer surface and the concentration of the analyte is defined through its competition with a labelled analyte’ or analyte-protein conjugate for binding to the antibody. In the second approach, the analyte is immobilized onto the transducer surface (either directly or as an analyte protein conjugate) and competes with the analyte in the sample for the binding sites of the antibody. Although both approaches are applicable for a given analyte-antibody pair, the second might be advantageous regarding the stability of immobilized biomolecule, i.e., the analyte or analyte-protein conjugate, since antibodies are known to lose a great part of their functionality upon immobilization. The non-competitive or sandwich immunoassay format is suitable for high-molecular weight analytes, which have at least two antigenic determinants or epitopes in their molecule. This mean, that at least two antibodies recognizing two different parts of the analyte are available. This is essential for the realization of a non-competitive assay, since as depicted in Figure 2c, an antibody immobilized onto the transducer surface (usually referred as capture antibody) binds the antigen-analyte through one epitope and a second antibody (referred as detection or reporter antibody) is attached on a different epitope forming a “sandwich” with the antigen. The detection antibody can be labelled or not depending on the transduction principle involved.
2.2. Main optical transduction principles
The optical transduction principles can be divided into two main categories, those involving labels and the label-free ones.
2.2.1. Detection using labels
A significant number of optical immunosensors are based on use of labels such as fluorescent organic dyes, gold nanoparticles or quantum dots for the quantification of antibody-analyte reaction and the determination of analyte concentration in a sample [44]. Biosensing using fluorescently labelled molecules and optical fibers was amongst the first optical transduction principles to be explored [45]. Apart from the typical cylindrical optical fibers, planar waveguides and capillaries that enabled light propagation through total internal reflection have been also employed as transducers for the development of optical fluorescence immunosensors [46,47]. Over the years, metal nanoparticles have been employed as labels and incorporated in immunochromatographic strips or used as liquid phase reagents to obtain semi-quantitative, relying on visual evaluation, or quantitative results through implementation of an instrument that could quantitate the color, fluorescence or chemiluminescence intensity. The latter can be performed using smartphones as detection, signal processing, and transmission apparatus moving the realization of portable devices a step forward [48].
2.2.2. Label-free detection
Label-free optical biosensing on the other hand, is based almost exclusively on monitoring the refractive index changes of the layer in close contact with the optical transducer due to immunochemical reactions [37]. There are two main categories of label-free optical transduction principles, the refractometric and the reflectometric ones [49]. In refractometric immunosensors, the light that is transmitted through a waveguide creates an electromagnetic field, known as evanescent field (Figure 3), that extents in the medium above the biosensor surface. This field is influenced by refractive index changes over the transducer surface due to biomolecular layer thickness increase caused by the immunoreaction. Thus, when the evanescent wave field is coupled back to the transducer, a change in the intensity, polarization or phase of the waveguided light is observed that is proportional to the concentration of analyte in the sample enabling its quantitative determination [50,51,52]. Transducers based on surface plasmon resonance (SPR), fiber optics, grating couplers, interferometers, and ring resonators fall in this category of optical sensors (Figure 4).
Reflectometric sensors are based on light reflection by a stack of materials with different refractive indices leading to creation of an interference spectrum. The most widely explored reflectometric sensing method is the one introduced at 1991 by Gauglitz et al. [53], which is known as reflectometric interference spectroscopy (RIfS). RIfS transducers are made of a glass substrate on top of which a thin layer of transparent dielectric material has been deposited. Immunochemical reactions that take place on top of the dielectric layer are evidenced as shifts in the reflected interference spectrum. This spectrum is created due to reflection of the light beam at each interface of different refractive index with a slightly different angle leading to either constructive or destructive interference. The spectrum shift is directly correlated to the increase of biomolecular layer thickness due to immunoreaction and therefore it can be correlated to the analyte concentration in the sample through a calibration curve. Since the first report of RifS sensors, a lot of progress has been made to the direction of reducing the cost and size of the instrumentation and increase the multiplexing capabilities, e.g., by monitoring, instead of the whole spectrum, specific wavelengths [54] or even a single wavelength [55]. In addition, other material combinations have been employed as transducers including porous silicon with or without thermally grown oxide [56], porous silicon-carbon composites [57], other porous materials such as TiO2 [58], or non-transparent substrates such as silicon with a transparent dielectric composed of silicon dioxide [59,60,61] or silicon nitride [62].
3. Application of optical sensors for bacteria detection
3.1. Evanescent wave-based biosensors
3.1.1. SPR immunosensors
Surface plasmon resonance (SPR) based immunosensors are the optical biosensors most frequently used for single or multiplex, label-free foodborne pathogenic bacterial detection due to their high detection sensitivity and monitoring of binding reactions in real-time. The SPR phenomenon relies on excitation of metal free electrons (surface plasmons) when polarized light strikes at a certain angle a metal layer (usually gold) deposited on the surface of an optically transparent material (prism, grating coupler or dielectric waveguide). The excited plasmons create an evanescent wave field at the solution/gold interface. This wave is very sensitive to refractive index changes at the gold layer surface occurring due to a biomolecular reaction, and as a result, the angle of incident light has to change during the course of the reaction to preserve the surface plasmon wave, providing the means to monitor in real-time these reactions. Thus, it is possible to monitor both the immobilization of specific biomolecules (e.g., antibodies) as well as the binding of analyte to them in real-time (Figure 5) [41,44].
The first report regarding detection of bacteria with an SPR sensor is dated back to 1998 [63], and was based on a sandwich immunoassay for detection of Escherichia coli O157:H7. The sensor was modified with protein A or protein G and a mouse monoclonal or a rabbit polyclonal antibody, respectively, was then immobilized. Depending on the antibody used for detection, LODs in the range 5–7x10⁷ cfu/mL have been achieved. Vibrio cholerae O1 was also identified with an SPR biosensor functionalized with a protein G layer [64]. The sensor chip was modified with a self-assembled monolayer of a mixture of 11-mercaptoundecanoic acid and hexanethiol on which protein G was covalently bound and used to immobilize a monoclonal antibody specific to V. cholera O1. The LOD of the assay was 105 cfu/mL. The same antibody immobilization approach was employed to immobilize onto SPR chips an antibody against Legionella pneumophila achieving a LOD of 105 cfu/mL [65]. Salmonella enterica serovar Enteritidis and Escherichia coli have been detected in spiked skim milk by a direct binding assay on SPR chips modified with protein G to which the anti-bacteria specific antibodies were then bound [66]. The LOD achieved after 1-h assay was 25 cfu/mL for E. coli and 23 cfu/mL for Salmonella. Detection of Salmonella groups B, D and E with SPR has been also reported employing a sandwich assay format and using antibody pairs from different animals [67]. It was found that the LOD improved 200 times compared to direct detection [67]. The benefits of the sandwich immunoassay format for bacteria detection have been also demonstrated in a study for detection of Staphylococcus aureus with SPR, where the LOD was improved from 1x10⁷ to 1x10⁵ cfu/mL when a sandwich immunoassay format was followed instead of direct detection [68]. In another report, where the direct binding assay was compared to a sandwich assay for detection of E. coli O157:H7, a 1000-fold improvement in sensitivity was reported leading to an LOD of 103 cfu/mL [69]. The immobilization of the polyclonal antibody against E. coli was performed through covalent bonding to a monolayer of mixed thiol-terminated polyethylene glycol with alkane or carboxyl-group ends. In another report, the free amine groups of protein A were converted to thiol groups, through reaction with 2-iminothiolane, to facilitate its immobilization onto SPR chips, which are then modified with an antibody against Salmonella paratyphi [70]. A LOD of 102 cfu/mL was achieved employing the antibody modified chip in a direct binding assay. In another study, the SPR chip was modified with brushes of poly(carboxybetaine acrylamide) to reduce the non-specific binding of bacteria to its surface, while antibody modified gold nanoparticles were used as labels to increase the detection sensitivity [71]. This immunosensor could detect E. coli O157:H7 in hamburger and cucumber samples at concentrations as low as 57 and 17 cfu/mL and Salmonella spp. at 7.4x10³ and 11.7x10³ cfu/mL, respectively [71]. Gold nanoparticles modified with an antibody against Campylobacter jejuni were also employed as labels in an SPR sandwich immunoassay that allowed the detection of this bacterium at concentrations as low as 4x10⁴ cfu/mL [72]. A gold-labelled secondary antibody was also employed to increase the detection sensitivity in a sandwich SPR for L. monocytogenes by 2-4 orders of magnitude compared to the direct binding assay, providing a LOD of 102 cfu/mL [73]. In another study, in order to achieve signal enhancement, a precipitate 3,3’,5,5’-tetramethylbenzidine (TMB) substrate was used in combination with an antibody labelled with horse radish peroxidase (HRP) to detect bacteria captured by an antibody attached to SPR chip through covalent bonding to a self-assembled monolayer of mercaptoundecanoic acid [74]. Following this approach, a 250% signal enhancement was achieved with respect to the assay not employing the HRP/TMB system leading to a LOD of 104 cfu/mL for detection of E. coli in spinach leaves [74]. SPR chips have been modified in a plasma reactor in presence of cyclopropylamine vapors to induce reactive moieties containing nitrogen which were in turn used to immobilize antibodies using glutaraldehyde activation [75]. The chips were employed to detect Salmonella typhimurium by a direct binding assay that provided a LOD of 105 cfu/mL.
Along with the optimization of the SPR assays for bacteria detection, effort was devoted to sample treatment methods aiming either to improve detection sensitivity or alleviate non-specific matrix effects. For example, the performance of an SPR sensor for the detection of live, heat-killed, or detergent-lysed E. coli O157:H7 cells was investigated and LODs of 106, 105, and 104 cfu/mL, respectively, were reported [76]. The differences observed were ascribed to changes in cell size and morphology upon treatment with ethanol, whereas treatment with detergent led probably to fragmentation of cells to smaller particles that were recognized more efficiently by the antibody. The effect of sample preparation method was also evident in another study for detection of E. coli O157:H7 in different food samples [77]. In this study, milk, apple juice, and ground beef patties were spiked with E. coli O157:H7 at various concentrations and then analyzed with a portable SPR instrument commercialized by Texas Instruments Inc. under the tradename SPREETATM. The sensor chip was modified with neutravidin to enable immobilization of biotinylated antibodies against E. coli O157:H7. The spiked milk and apple juice samples were run without pretreatment, whereas the ground beef sample was extracted with buffer and homogenized prior to analysis. The LODs achieved ranged from 102–103 cfu/mL depending on the sample analyzed. In another report, where a sandwich SPR assay for Salmonella with LOD of 1.25×10⁵ cells/mL was developed [78], the authors claimed that the presence of milk did not affect the assay performance alleviating the need for sample preparation or clean-up steps.
It has been suggested that the detection of whole bacteria using SPR generally results in lower sensitivity compared to other techniques, due to the limited penetration of bacteria by the electromagnetic field and the small difference of refractive index between bacterial cytoplasm and the surrounding aqueous medium [79]. Thus, instead of running over the sensor the sample, the sample is incubated with the pathogen specific antibody and after separation of free from bound antibody, the free antibody is quantified. This assay format is known as subtraction inhibition assay (SIA) and has been applied for the detection of L. monocytogenes [80], E. coli O157:H7 [81], and B. anthracis spores [82]. The LODs reported were 1×10⁵, 3.0×10⁴, and 104 cfu/mL, respectively, and were one order of magnitude lower than those achieved with the direct binding assay. The SIA format was also applied for the detection of fungal cells that are considerably larger than the bacterial ones [83]. Thus, it has been applied for the detection of sporangia of Phytophthora infestans [83], and of Puccinia striiformis with LODs of 2.2×10⁶ sporangia/mL and 3.1×10⁵ urediniospores/mL, respectively [84]. A similar assay format was also applied for the SPR detection of Cryptosporidium parvum oocysts with a LOD of 1x10² oocysts/mL [85]. In a different approach for indirect bacteria detection by SPR, a polyclonal antibody against a cell extract enriched for the invasion-associated protein, internalin B, was used to develop an inhibition assay for Listeria monocytogenes [86]. After incubation of bacteria containing solutions with the antibody, the mixture was injected over an SRP chip modified with purified-recombinant internalin B and the signal was inversely proportional to L. monocytogenes concentration achieving a LOD of 2x10⁵ cells/mL.
In addition to single bacteria detection, multiplexed bacteria detection with SPR systems has been also explored. Thus, an antibody microarray was developed on a SPR chip for the simultaneous detection of either S. typhimurium, E. coli O157:H7, Yersinia enterocolitica and Legionella pneumophila by modifying the chip with protein G to allow immobilization of the specific for each bacterium antibody at different areas of the chip through spotting [87]. All bacteria were detected simultaneously each at a concentration of 105 cfu/mL. E. coli O157:H7, L. monocytogenes, Campylobacter jejuni and S. choleraesuis were also simultaneously detected using a multi-channel SPR system [88]. The whole chip surface was modified with streptavidin and the four bacteria antibodies were immobilized using an 8-channel fluidic (2 channels per antibody; one for the specific and the other for the non-specific signal monitoring). The LODs achieved were 1.4×10⁴ cfu/mL for E. coli, 4.4×10⁴ cfu/mL for S. choleraesuis, 1.1×10⁵ cfu/mL for C. jejuni, and 3.5×10³ cfu/mL for L. monocytogenes. An SPR imaging device was combined with an array of antibodies specific against different serotypes of L. monocytogenes aiming to monitoring the growth of live listeria cells in culture [89]. Emphasis was given to the characterization of the antibodies rather than the analytical performance of the sensor. Similarly, the detection of Salmonella with an SPR imaging array was optimized and LODs of 2.1x10⁶ and 7.6x10⁶ cfu/mL, in buffer and chicken carcass rinse have been demonstrated [90]. An SPR imaging sensor has also been applied for the simultaneous label-free detection of Salmonella spp., Shiga-toxin producing E. coli (STEC) and L. monocytogenes in chicken carcass rinse [89]. The specific for each bacterium antibodies were immobilized on the same chip and an LOD for Salmonella of 106 cfu/mL was achieved. An SPR imaging sensor (Figure 6) was also implemented for the simultaneous detection of Listeria monocytogenes and Listeria innocua achieving a LOD of 2×10² cfu/mL for both bacteria after 7-hour incubation of the sample in the fluidic cell attached to SPR chip [92].
Despite the fact that SPR has found numerous applications in diverse fields and relatively few companies have commercialized devices based on this transduction principle, the majority of these instruments are suitable for use in a lab. Thus, much effort has been devoted on reducing the equipment size and complexity in order to build up systems appropriate for analysis at the point-of-need. The SPREETATM SPR biosensor mentioned above was a successful outcome of such an effort. It included an AlGaAs light emitting diode (LED, 840 nm), a polarizer, a temperature sensor, two photodiode arrays, and a reflecting mirror combined with a gold-coated glass slide and a silicone rubber gasket of two channels. The instrument was accompanied by a software that provided all the information related to analysis of SPR curve, the real time binding, the layer thickness and flow cell temperatures. In addition to determination of E. coli O157:H7 in various food samples [77], SPREETATM SPR biosensor has been also explored for the detection of Campylobacter jejuni with an LOD of 103 cfu/mL [93]. SPREETA™ was also employed to develop a sensor to detect E. coli O157:H7 in laboratory cultures [94]. The sensitivity and specificity of detection were determined. Thus, for an assay of 35 min, a LOD for E. coli O157:H7 of 8.7x10⁶ cfu/mL was determined in single bacteria culture, whereas in mixed cultures with non-target bacteria concentrations up to 106 cfu/mL or less the LOD was 107 cfu/mL. . For higher concentrations of non-target bacteria, the sensor sensitivity was negatively affected. In another report, using also the SPREETA™ SPR sensor for E. coli detection an LOD of 90 cfu/mL is reported for a direct binding assay that lasted less than 30 min [95]. A reason for the better performance achieved, with respect to previous reports, could be attributed to the fact that the specific antibody was immobilized onto the chip surface by streptavidin and not directly. Finally, SPREETA™ was applied to detect Salmonella typhimurium at concentrations equal to or higher than 1x10⁶ cfu/mL in chicken [96]. To increase the detection sensitivity of a SPREETA™ sensor for the detection of E. coli, Au coated magnetic nanoparticles were modified with an antibody against E. coli and used to concentrate E. coli cells from water samples but also as labels in a SPR sandwich immunoassay using SPREETA™ chips, that were modified with an anti-E. coli antibody, achieving a detection limit of 3 cfu/mL [97].
Apart from SPREETA™, other attempts to create portable instruments based on the SPR principle of detection have been reported in the literature. Thus, a portable instrument that combined microfluidic and SPR technologies on a single platform was applied for the determination of E. coli and S. aureus in spiked samples [98]. In this set-up an LED was used to illuminate a gold covered rectangular prism and the reflected light was captured by a CMOS sensor and then transferred for processing to a PC. The chip was modified with 11-mercaptoundecanoic acid to facilitate the covalent binding of protein G in which an antibody against the lipopolysaccharide (LPS) of E. coli was captured enabling E. coli detection at a concentration of 3.2x10⁵ cfu/mL. In another attempt, Salmonella typhimurium was detected in the range of 107 to 109 cfu/mL within 1 h using a SPR biosensor in which the incident light from a diode laser (instead of a LED) was directed to the gold film by a rotating mirror and the light reflected from the metal film was captured by a CMOS image sensor [99].
Another approach to surpass the portability limitations of standard SPR instruments is the implementation of localized SPR or LSPR transduction approach. In LSPR, the continuous metal surface is replaced by noble-metal nanoparticles (nanospheres, nanorods, or nanodisks) of sub-wavelength size around which the surface plasmons are localized [100]. The light that strikes the nanostructures, excites the surface plasmons and when resonance is achieved, certain wavelengths are scattered from the nanostructures. Thus, immunoreactions can be monitored in real-time as shifts in the resonance wavelength [101]. The advent of LSPR opened up new horizons for detection of pathogens, especially in the direction of portable systems. Nonetheless, the first report showed that LSPR was less sensitive than the classical SPR configuration [102] or more vulnerable to interferences from the matrix of the samples analyzed [103]. More recent reports, however, show improved detection sensitivity achieved mainly through optimization of the dimensions and stability of the nanoparticles [104]. Thus, an LSPR sensor was developed for the determination of E. coli O157:H7 employing spherical gold nanoparticles non-covalently modified with a specific anti-E. coli avian antibody. A LOD of 10 cfu/mL was achieved in less than 2 h making the sensor suitable for E. coli O157:H7 determination at the point-of-need [104]. Instead of using non-continuous gold surfaces, structuring of the gold film through its deposition onto a nanostructured fluoropolymer enabled the development of a SPR sensor based on grating-coupled long-range surface plasmons which was employed for detection of E. coli O157:H7 through a sandwich immunoassay implementing metal nanoparticles modified with another anti-E. coli O157:H7 antibody as labels to achieve a LOD of 50 cfu/mL [105].
The reports regarding bacteria detection with SPR based immunosensors are summarized in Table 1.
3.1.2. Fiber optic immunosensors
Fiber optic immunosensors rely on immobilization of immunoreagents onto a part of the optical fiber from which the cladding layer has been removed to allow interaction of the waveguided photons through the evanescent wave field with the analyte in the solution surrounding the fiber (Figure 7). In order to increase the evanescent field effect, fiber tapering is applied either in the form of a tapered tip or of a continuous tapered fiber [45,106]. Tapered tips are created by reducing gradually the diameter at the end of an optical fiber down to nanometers. In order to obtain the highest possible sensitivity due to reaction, the recognition biomolecules are immobilized on the tip region with the smallest diameter where the evanescent field is stronger. Continuous tapered fibers have usually a biconical taper, comprised from a region of decreasing diameter, a region of constant diameter called the waist, and a region of increasing diameter [107]. Sensing is taking place on the waist region where the evanescent field exhibits its higher intensity, whereas the emitted light is collected from the region of increasing diameter [108]. Fiber optic biosensors have been widely employed in the field of foodborne pathogen detection due to their convenience, small size, lack of electromagnetic interference, cost-effectiveness, high sensitivity and accuracy [109].
The first label-free approach for the detection of pathogens was realized using a U-bent optical fiber sensor [110]. Bending a de-cladded fiber into a U-shaped structure enhances the penetration depth of evanescent wave and hence sensitivity of the probe. This system could detect E. coli in concentrations lower than 103 cfu/mL with an assay duration of 1 h. A similar approach employing a plastic fiber optic sensor with a U-shaped sensing probe functionalized with an antibody against E. coli serotype O55 was employed for E. coli detection resulting in a LOD of 103 cfu/mL for an assay duration of 10 minutes per sample [111]. Upon exposure of the sensor to bacteria solutions, the output signal decreased with time due to the attachment of the bacteria that increased the refractive index value close to the probe.
Several fiber optic immunosensors employing labels have been also reported for bacteria detection. Thus, tapered fiber tips have been used for detection of Salmonella in culture medium [112] and E. coli O157:H7 in ground beef [113] with LODs of 104 and 103 cfu/mL, respectively. The first employed silica fibers with tapered tips that were modified with mercaptosilane to facilitate the covalent bonding of an anti-Salmonella antibody, while a second antibody labeled with a fluorescent dye was used as detection antibody. In the second report [113], polystyrene fibers were first coated with biotinylated bovine serum albumin and then reacted with streptavidin and biotinylated anti-E. coli antibody. A fluorescently labeled antibody was also used for detection. Polystyrene fibers were also integrated into a portable instrument commercialized under the name RAPTORTM. This instrument was used for the detection of S. typhimurium in rinse-water from sprouted alfalfa seeds through modification of the fibers first with streptavidin and then with a biotinylated antibody [114]. A second fluorescently labeled antibody was used for detection achieving a LOD of 105 cfu/mL. The RAPTOR™ biosensor has been also used to detect Enterococcus faecalis with a LOD of 5.0x10⁵ cells/mL [115], and L. monocytogenes with LODs ranging from 103 to 4.3x10³ cfu/mL [116,117,118]. In all cases, sandwich immunoassays were implemented with the exception of [117] where a fluorescently labeled aptamer (aptamer A8) specific for internalin A, an invasin protein of L. monocytogenes, was used for detection. A version of RAPTORTM that supported multiplexed determinations was applied for the detection of L. monocytogenes, E. coli O157:H7 and S. enterica in several meat products [119]. The LOD achieved were 50 cfu/mL for S. enterica and 103 cfu/mL for L. monocytogenes.
Fluorescence resonance energy transfer, i.e., the non-radiative energy transfer from a fluorescent donor molecule to an acceptor one when these two are in close proximity, has been also implemented for detection of S. typhimurium with an optical fiber tip sensor in ground beef sample [120]. The anti-Salmonella antibody was labelled with the donor fluorophore (AlexaFluor 546) and protein G was labeled with the acceptor fluorophore (Alexa Fluor 594). Upon binding of S. typhimurium to the antibody, the induced conformation changes reduced the distance between the donor and acceptor molecules, resulting in increase of emitted fluorescence achieving an LOD of 105 cfu/g of sample.
In recent years, fiber optic immunosensors based on surface modifications with nanomaterials show significant improvements compared to conventional fiber optic sensors regarding the speed and the sensitivity of the detection. For example, a fiber optic biosensor modified with zinc oxide (ZnO) nanorods for the detection of E. coli in water with a LOD of 103 cfu/mL was developed [121].
Fiber optic sensors in which the exposed fiber core has been coated with a gold layer to take advantage of the SPR phenomenon have been also used for bacteria detection. Such a sensor has been employed for the detection of Legionella pneumophila by a direct assay after modification of the fiber gold-covered area with 11-mercaptoundecanoic to allow the covalent bonding of an anti-L. pneumophila antibody [122]. A LOD of 10 cfu/mL was achieved for a direct assay that lasted 1 h. In another report, a fiber optic SPR sensor was modified with MoS2 nanosheets on which the specific antibodies were attached and a LOD of 94 cfu/mL for E. coli was achieved compared to 391 cfu/mL received from fibers without MoS2 nanosheets [123]. The reports regarding bacteria detection with fiber optic based immunosensors are summarized in Table 2.
3.1.3. Interferometric immunosensors
Interferometric immunosensors is another category of devices that have been implemented for the detection of different bacteria in food matrices. These sensors could detect refractive index changes down to 10-8 RIU and have demonstrated excellent analytical performance regarding the determination of analytes in complex matrices [124,125]. The most popular configurations of interferometric sensors are Mach-Zehnder (MZI) [125,126,127,128], Young (YI) [129], Hartman [130,131,132] and bi-modal interferometers [133,134].
In Mach-Zehnder interferometers, a waveguide splits into two arms, one that can detect the variations in the refractive index over its surface through a window in the cladding layer (sensing arm), and the other that is fully covered by the cladding layer and operates as reference (reference arm) [124,125]. The two arms combine again after some point to a single waveguide and the output light intensity is monitored. Biomolecular reactions taking place onto the sensing arm window change its surface refractive index and cause a phase difference between the light beams guided in the two arms. Thus, the output light is a cosine function of the input light. This means that the sensitivity to effective refractive index changes would be maximum at the quadrature points and minimum in the vicinity of the extrema. Regarding the geometrical characteristics of the transducer, most MZIs are symmetric, i.e., the sensing and the reference arms have equal length while asymmetric MZIs, i.e., MZIs with different length of the two arms, have been also explored. The majority of MZI-based detection systems implement monochromatic light sources, i.e., lasers, which complicate instrument miniaturization and development of portable systems; therefore broad-band light sources have been explored instead of lasers. To this direction, external broad-band light sources have been coupled to MZIs integrated on the substrate [126,127] or silicon light emitting diodes (LED) integrated onto the same silicon chip with planar silicon nitride waveguides have been implemented [125,127]. It should be noticed that the detection sensitivities in terms of refractive index achieved with these configurations were comparable to those of MZIs implementing lasers as light sources.
A Young interferometer (YI) consists also of a waveguide divided into two arms by means of a Y-junction. The critical difference between MZIs and YIs is that in the second case, the two waveguides do not combine again but the output light interferes in air and the “interferogram” created is depicted on a CCD array. Thus, in YIs the changes in the effective refractive index over the sensing arm due to binding reactions that cause the phase difference between the two interfering beams is recorded as a shift of the interference fringes [124]. There are considerably fewer reports of integrated YIs as compared to MZIs; nonetheless, it has been demonstrated that for a particular application YI-based sensors can be more sensitive than an SPR, a grating coupler or a commercially available reflectometric interference spectroscopy (RIfS) sensor.
Hartman interferometers are based on planar waveguides in which the two modes of light, TE and TM, propagate and interact with the adlayer on the same path [124]. Changes in the refractive index cause phase shifts of the two polarizations that are not equal, because the sensitivity of the two modes to refractive index changes differs.
Bimodal interferometers are the third and most recently developed category of interferometric sensors [124]. In a bimodal interferometer the transducer is a single waveguide with two different zones; the first supporting a single-mode and a second supporting two-modes (fundamental and first order modes). Those two modes interfere and propagate until they reach the waveguide's output. When refractive index changes occur at the waveguide surface, due to binding reactions, the interference pattern at the waveguide output also changes since the velocity with which the two modes propagate depends on the refractive index of the waveguide adlayer.
The first report for bacteria detection based on interferometric sensors was the immunochemical detection of S. typhimurium with a Hartman interferometer [130]. The sensor could detect 5x10⁸ cfu/mL of Salmonella in a direct assay that lasted 40 min. An integrated two-channel Hartman interferometer was also applied for the detection of S. typhimurium in spiked chicken rinse fluid [132]. Detection by direct binding of Salmonella cells to antibody modified waveguides was compared to a sandwich assay. Both configurations provided a LOD of 104 cfu/mL for assay duration of 10 min.
Mach-Zehnder interferometers (MZIs) have been also employed for bacteria detection. Thus, integrated onto silicon chips MZIs were modified with an antibody against L. monocytogenes following a chemical activation protocol specific for silicon nitride so as to limit antibody attachment to the sensing windows areas [126]. The protocol consisted of chip treatment with HF for creation of amine groups onto the silicon nitride followed by reaction with glutaraldehyde to enable covalent bonding of antibody through their free amine group. A LOD of 105 cfu/mL was achieved for a direct binding 15-min assay. In another report the MZIs waveguide was formed by patterning a photoresist layer deposited on a glass coverslip [127]. The immobilization of an antibody against E. coli was performed after modification of sensing arm with an aminosilane and subsequent activation with glutaraldehyde. The assay duration was 10 min and the LOD 106 cfu/mL. In another report, a chip integrating ten MZIs along with the respective silicon light emitting diodes was employed for the simultaneous detection of S. typhimurium and E. coli through a competitive immunoassay format [128]. The chip was activated with aminosilane and then the liposaccharides of S. typhimurium and E. coli were spotted onto the sensing arm windows of different MZIs of the chip and immobilized through physical adsorption. MZIs spotted with the blocking protein (bovine serum albumin) were used as reference sensors. For the assay, mixtures of calibrators or samples with the bacteria specific antibodies were run over the chip followed by reaction with biotinylated secondary antibodies and streptavidin for signal enhancement. Following this format, LODs of 40 cfu/mL for S. typhimurium and 110 cfu/mL in both water and milk were achieved for a 10-min assay [128].
Regarding Young interferometers there are no reports for detection of bacteria, although they have been employed for the immunochemical detection of viruses, and more specifically of herpes simplex virus type 1 (HSV-1) achieving a LOD of 850 particles/mL [129]. On the other hand, the label-free detection of B. cereus and E. coli with a bimodal interferometric immunosensor has been also reported [132]. The immobilization of antibodies was carried out either by physical adsorption of aminosilane modified chips or by covalent binding to chips modified with a carboxysilane after conversion of surface carboxyl groups to active ester groups. The device could detect 70 cfu/mL of B. cereus in 12.5 min and 40 cfu/mL of E. coli detection in 25 min. The same bimodal interferometric sensor was also applied for the detection of multidrug-resistance bacteria genes without amplification through a DNA hybridization assay [133]. Table 3 summarizes the application area and analytical performance of integrated interferometric sensors.
3.1.4. Grating coupled-based immunosensors
Grating coupler sensors are based on planar waveguides with a grating incorporated into the waveguide to enable coupling and transmission of the incident light in a manner dependent on the refractive index of the medium over the waveguide surface [42]. Thus, binding reactions that occur onto the waveguide surface can be monitored by determining the incident light in-coupling angle. In addition, since the binding reactions affect the transmitted light (through interaction with the evanescent wave field), the light out-coupling angle is also altered and can be also used to monitor the binding reactions. The second configuration is advantageous compared to the first one since there is no need for precision alignment of the light, leading thus to simpler experimental set-ups. Over the years, grating coupler sensors have been upgraded through the introduction of two-dimensional grating structures [135] or new configurations such as the wavelength interrogated optical sensor (WIOS) that implements two gratings for light in- and out-coupling to the waveguide [136] or the angle interrogated optical sensor that uses a MEMS micro-mirror to scan the angle of the incident light of the gratings [137]. All these novel configurations allowed the development of systems for multiplexed determinations of analytes. Gratings have been also combined with other evanescent wave-based biosensors such as interferometric [138], SPR [139], SPR imaging [140], optical fiber [141], and silicon microring resonators [142], in order to create more flexible and sensitive biosensors.
A reverse symmetry waveguide sensor with an integrated grating coupler has been applied for detection of E. coli K12 by monitoring the adhesion of bacteria cells onto the sensor surface, that has been modified with poly-L-lysine creating a protein layer with a positive charge so as to enable bacteria binding through electrostatic interactions, claiming a LOD of 60 cells/mm2 [143]. Optical fiber long-period grating (LPGs) sensors have been also used for detection of Staphylococcus aureus through modification of the fiber surface with ionic self-assembled multilayers that facilitated the covalent bonding of antibodies specific for penicillin-binding-protein 2a of methicillin resistant staphylococci. The sensor could discriminate between methicillin-resistant and methicillin-sensitive bacteria with a LOD of 102 cfu/mL for methicillin-resistant bacteria [144]. Similarly, a long-period fiber grating sensor modified with nanopitted polyelectrolyte coatings and antibody was implemented for detection of S. aureus with an LOD of 224 cfu/mL for a 30-min assay [145]. Another LPG immunosensing platform formed by two identical cascaded chirped long period gratings was applied for the detection of E. coli [146]. The sensor worked like a Mach-Zehnder interferometer due to the space between the two gratings and could detect E. coli in concentrations as low as 7 cfu/mL. Finally, a grating coupler based biosensing platform known as Optical Waveguide Lightmode Spectroscopy System (OWLS), commercialized by Microvacuum Ltd. (Microvacuum Ltd.; URL: http://www.owls-sensors.com/), has been applied for the label-free immunochemical detection of S.typhimurium [147] and L. pneumophila [148] in water following a direct binding assay format with LODs of 1.3×10³ and 1.3×10⁴ cfu/mL, respectively. Table 4 summarizes the application area and analytical performance of grating coupler-based sensors developed for bacteria detection.
3.1.5. Ring resonator-based immunosensors
Ring resonators rely on the coupling of light propagating along a linear waveguide, through the evanescent wave field, to a circular one on which propagates in the form of whispering-gallery modes. Any change in the refractive index in the proximity of the ring surface affects the spectral position of the whispering-gallery modes and changes the wavelength of the incident light for which resonance is achieved. As the light propagating in the ring can interact multiple times with the molecules on its surface, ring resonators are expected to provide the same performance (denoted by the Q factor) with that obtained from linear waveguides with many times longer length. Thus, by implementing ring resonators as transducers, smaller size devices as compared to linear waveguides and denser transducer arrays can be realized. Ring resonators can adopt the 2D format of a microdisk [149] or microring [150], but also the 3D format of a microtoroid [151]. Toroids are claiming higher Q factors than the planar resonators and therefore, higher detection sensitivity is expected. Sensors based on microring resonators have been also explored with regard to bacteria detection. Detection of E. coli with a microring resonator sensor has been reported and the relatively high LOD of 105 cfu/mL was ascribed to suboptimal functionalization of resonators with bacteria-binding antibodies (Figure 9) [152].
Finally, a whispering gallery mode optical microdisk resonator was modified with the phage protein LysK, an endolysin from the staphylococcal phage K that binds strongly to staphylococci and used to detect S. aureus with a LOD of 5×10⁶ cfu/mL [153].
3.2. Reflectrometric immunosensors
Reflectometric sensors rely on monitoring shifts in the interference spectrum due to binding reactions taking place on a stack of materials with different refractive indices. The illumination sources usually employed are white light sources.
A commercially available RIfS-based biosensing device was used to detect L. pneumophila by monitoring either the direct capture of bacteria cells via electrostatic interaction onto the chip surface or through a sandwich assay [154]. The device performance was compared to that of SPR and a LOD of 1x10⁵ cfu/mL was determined in both cases. A white light reflectance spectroscopy based immunosensor exhibited a better performance regarding the rapid and sensitive detection of S. typhimurium in drinking water (Figure 10) [155]. The sensor chip consisted of a Si die with a thin SiO2 layer on top and S. typhimurium detection was performed through a competitive immunoassay format between bacteria in the sample and the immobilized onto chip Salmonella liposaccharide. A LOD of 320 cfu/mL was achieved for an assay duration of 15 min.
Porous silicon has been also employed as substrate for detection of bacteria through Reflectance spectroscopy. Thus, the label-free detection of E. coli K12 was achieved using a sensor based on a nanostructured oxidized porous silicon thin film [156,157]. The sensor surface was functionalized with specific antibodies against E. coli through aminosilanization and activation of surface amine groups with bis(N-succinimidyl)carbonate for coupling of antibodies via their free amine groups [156,157]. The LOD determined was about 104 cells/mL and the assay was completed in 30 min. An optimization of the same sensor, in which a different surface modification was followed (Figure 11), resulted in a LOD of 103 cells/mL in water for an assay of 45 min [158]. In this case, after aminosilanization, the surface was functionalized with glutaraldehyde to introduce aldehyde groups through which streptavidin was bound onto the surface to facilitate immobilization of biotinylated anti-bacteria specific antibodies.
Another biosensor developed for bacteria detection on porous silicon substrates involved surface modification with a hydrogel made of polyacrylamide to which biotinylated specific monoclonal antibodies were immobilized onto streptavidin covalently bound to surface after appropriate chemical functionalization [159]. A detection limit in the range of 103–105 cell/mL was determined for direct bacteria binding for 30 min. Furthermore, for the direct detection of E. coli, a biosensor based on blockage of nanopores created by etching of Si chip was presented achieving a detection limit of 103 cfu/mL [160]. More specifically, when E. coli cells were trapped into the chip nanopores, a decrease of effective optical thickness was recorded. Thus, by monitoring the change of effective optical thickness value, it was possible to quantitatively determine the cells captured in the nanopores via indirect Fourier Transformed Reflectometric Interference Spectroscopy.
Finally, an interferometric reflectance imaging system was employed for the label-free detection of E. coli [161]. The bacteria specific antibody was spotted onto a SiO2/Si chip modified with a polymer and after incubation for 2 h with the bacteria solutions the bound cells were counted using a low-magnification optical set-up accompanied by an appropriate software. Based on experimental data, an extrapolated LOD of 2.2 cfu/mL was calculated which is the lowest, so far, reported for direct bacteria detection.
3.4. Photoluminescence-based immunosensors
Photoluminesence (fluorescence and phosphorescence) is the phenomenon of light emission from a molecule that has been excited by adsorption of photons in the visible or UV region [162]. An optical immunosensor based on glass slides modified with TiO2 nanoparticles was developed exploiting the decrease in photoluminescence intensity of TiO2 nanoparticles modified with antibodies against S. typhimurium upon binding of bacteria from solutions with concentration in the range 103 to 105 cells/mL [163]. A fluorescent array biosensor prepared on soda lime glass substrate, which was employed as waveguide, was used for the detection of S. typhimurium through a sandwich immunoassay with fluorescently labeled antibodies. The LOD was 8x10⁴ cfu/mL and the assay duration 15 min [164]. This array biosensor was used to detect Shigella dysenteriae in buffer and chicken carcass wash and Campylobacter jejuni at concentrations as low as 4.9x10⁴ and 9.7x10² cfu/mL, respectively, by applying sandwich immunoassays that lasted 25 min [165]. The same sensor was applied to detect the bacterium Campylobacter jejuni following a 25-min sandwich immunoassay in a number of different food matrices with a LOD of 500 cells/mL [166]. Finally, the sensor was applied to detect Escherichia coli in less than 30 min in various spiked food matrices with LODs in the range 1-5×10⁴ cells/mL [167].
A homogeneous FRET immunosensor using antibodies conjugated to graphene oxide quantum dots and graphene oxide sheets was designed for detection of C. jejuni cells in food samples [168]. The graphene oxide quantum dots conjugated antibody interacted with the graphene oxide sheets through a π-π stacking leading to fluorescence quenching. When C. jejuni was selectively captured by the antibody, this interaction was disrupted and the fluorescence emission increased proportionally to concentration of bacteria in the sample. The assay was completed in 1.5 h and the LOD was 10 cfu/mL.

Table 6.
Photoluminescence-based immunosensors for bacteria detection.
| Analyte | Detectionprinciple | Assay type | Sample type | Assay duration | LOD | Ref.# |
|---|---|---|---|---|---|---|
| S. typhimurium | label-free | direct | buffer | <30 min | 103 cells/mL | [163] |
| S. typhimurium | fluorescence | sandwich | Poultrychicken excretal samples | 15 min | 8x10⁴ cfu/mL | [164] |
| Shigella dysenteriae C. jejuni | fluorescence | sandwich | buffer and chicken carcass | 25 min | 4.9x10⁴ cfu/mL9.7x102 cfu/mL | [165] |
| C. jejuni | fluorescence | sandwich | ground turkey sausage & hamcarnation nonfat dried milkvanilla fat free yogurt | 25 min | 500 cells/mL | [166] |
| Escherichia coli | fluorescence | sandwich | ground beefturkey sausage carcass washapple juice | 30 min | 1-5×10⁴ cells/mL | [167] |
| C. jejuni | homogeneous FRET | direct | poultry liver | 1.5 h | 10 cfu/mL | [168] |
3.5. Surface Enhanced Raman Scattering (SERS) -based immunosensors
SERS-based biosensors combine the Raman inelastic scattering phenomenon of incident laser light with signal enhancement provided from nanostructured noble metal substrates [169]. More specifically, the Raman signal of molecules adsorbed onto the SERS surfaces is enhanced by a factor of 104–108 due to the strong electromagnetic field generated on the surface of these substrates. This enhanced scattering phenomenon results in characteristic peaks due to the vibrational modes of the molecules, which provide a fingerprint unique to each molecule. Thus, in SERS-based bioanalysis, the target molecules can either be detected directly after their attachment to the nanostructured surfaces (Figure 12a), through their binding to surface-anchored recognition elements, such as antibodies (Figure 12b) and through sandwich immunoassays employing SERS-active labels for signal enhancement (Figure 12c) [170,171,172,173]. SERS active labels or tags are prepared by conjugating the analyte-specific antibodies to nanoparticles along with Raman reporter molecules, which are low-molecular weight moieties with strong and distinguishable Raman signals. All these approaches have been implemented for bacteria detection through SERS.
Knauer et al. developed direct label-free SERS-based immunochemical methods for the detection of L. pneumophila and S. typhimurium in a single run [174], and of E. coli [175] as well. Regarding the simultaneous determination of S. typhimurium and L. pneumophila, glass substrates were modified with an epoxy-silane and then reacted with a diamine-polyethylene glycol to introduce amine groups onto the surfaces, which are then implemented for the covalent bonding of antibodies specific against the two bacteria by spotting at different areas of the substrate. After bacteria binding, the surfaces were incubated with an Ag colloid preparation that aggregated onto the immobilized bacteria creating “hot spots” which provided strong Raman signal. The assay lasted 65 min and the LODs achieved were 106 and 108 cells/mL for L. pneumophila and S. typhimurium, respectively [174]. For E. coli detection, the antibody modified substrates were combined with a flow-through system enabling detection of E. coli strains in concentrations down to 4.3×10³ cfu/mL in water samples of 100 mL [175]. A LOD of 10 cfu/mL was achieved for E. coli O157:H7 when a SERS-based non-competitive immunoassay using a combination of antibody-modified magnetic particles and gold nanoparticles modified with an anti-bacterium antibody and a SERS tag molecule [176]. At first the bacteria solution was incubated with the antibody-labelled magnetic nanoparticles and after magnetic separation they were incubated with the SERS-tagged antibody-modified gold nanoparticles. The immunocomplexes formed were separated from free antibodies using a membrane filter on which the Raman was determined [176]. A similar immunoassay format was applied to the simultaneous detection of E. coli O157:H7 and S. aureus with LODs of 10 and 25 cfu/mL, respectively [177]. In this case, magnetic beads and SERS active gold nanoparticles functionalized with specific antibody pairs against each bacterium were used and the simultaneous determination was based on the use of a different SERS tag for each bacterium. After formation of immunocomplexes in liquid phase, a magnetic field was applied and the Raman signals from the two different tags quantified [177]. In another report, the capture antibodies were immobilized on magnetite-gold nanoparticles to enable separation and concentration of the E. coli O157 cells from the liquid, and then were reacted with gold nanoparticles modified with antibodies and Raman tags [178]. This method provided rapid separation and detection (less than one hour) of E. coli achieving a LOD of 102 cfu/mL. A similar approach was applied for the isolation and detection of multiple pathogenic bacteria through the implementation of lectin functionalized silver coated magnetic nanoparticles to bind and separate bacteria prior to reaction with SERS-tagged silver nanoparticles functionalized with antibodies specific for each one of the targeted bacteria. Thus, E. coli, S. typhimurium, and methicillin-resistant S. aureus isolation and detection were achieved at concentrations as low as 10 cfu/mL [179]. Gold-coated magnetic nanoparticles (gold coated MnFe2O4 nanoparticles) were conjugated with antibodies against S. aureus and used as SERS tags as well as for bacteria capture and separation resulting in an assay with LOD of 10 cfu/mL [180]. Spherical and rod-shaped gold nanoparticles modified with Raman tags and an antibody against E. coli were compared as labels in a sandwich immunoassay with capture antibody immobilized onto a gold-coated glass slide [181]. The LODs determined using the gold nanorods and the spherical gold nanoparticles as labels were 4 and 5 cfu/mL, respectively. Rod-shaped gold covered magnetic nanoparticles modified with an antibody against E. coli have been also investigated as labels in a liquid phase assay for detection of E. coli at concentrations as low as LOD 35 cfu/mL [182]. The difference in the LOD of this report compared to the previous one that used the same label [181] was attributed to lower capture efficiency of magnetic gold nanorod particles as compared to the gold-coated glass slide surface. Thus, when the same group implemented gold-coated magnetic spherical nanoparticles modified with an anti-E. coli antibody in combination with rod shaped gold nanoparticles modified with Raman tags and an anti-E. coli antibody, a LOD of 8 cfu/mL was achieved [183]. In another detection approach, SERS was combined with a microfluidic dielectrophoresis device to detect Salmonella enterica serotype Choleraesuis and Neisseria lactamica [184]. The SERS labels employed were silica-coated dye-induced aggregates of a small number of gold nanoparticles, denoted as nanoaggregate-embedded beads, and were modified with antibodies specific for each bacterium to allow their online detection with an LOD of 70 cfu/mL. SERS detection was also combined with lateral flow strip biosensors. Thus, L. monocytogenes and S. typhimurium were simultaneously detected with a lateral flow sandwich immunoassay employing gold nanoparticles modified with a Raman tag and specific antibodies against each one of the targeted bacteria [185]. The LODs achieved were 75 cfu/mL for both bacteria and the strip assay was applied for bacteria detection in milk samples. Another lateral flow strip biosensor employing SERS labels combined with recombinase polymerase amplification (RPA) was applied for the simultaneous determination of S. enteritidis and L. monocytogenes [186]. The method made use of forward primers labeled with digoxin and fluorescein for S. enteritidis and L. monocytogenes, respectively, whereas the reverse primers were labeled with biotin. Thus, when the RPA product was applied to the sample pad, it was run along with gold nanoparticles modified with streptavidin and Raman tags towards the two test lines where antibodies against digitoxin and fluorescein have been spotted, resulting in the creation of the respective colored lines (Figure 13). The LODs achieved were 27 and 19 cfu/mL for S. enteritidis and L. monocytogenes, respectively [186]. The same approach was employed to detect Escherichia coli O157:H7 with an LOD of 5x10⁴ cfu/mL in milk, chicken breast, and beef [187].
In Table 7 the data regarding bacteria detection with SERS-based biosensors are presented.
4. Conclusions and outlook
This review has outlined the principles and applications of antibody-based optical sensors in the detection of food pathogenic bacteria. Although there is an abundance of relative publications, there seems that very few of the available sensing principles have been exploited for the detection of bacteria in real food samples. Thus, although fiber optic sensors employing fluorescent labels have been the first to be implemented for bacteria detection in food samples, the great majority of references, especially the most recent ones, rely on SPR sensors. The reason for that relies probably on the availability of different instruments based on the SPR detection principle, some of which are commercially available. Nevertheless, the LODs achieved in most of the cases ranged from 103-105 cfu/mL, which are considered high for direct application to food analysis and they should be combined with a sample enrichment procedure that adds a few hours to the total time required from sampling to answer. There are a few reports however that report LODs of a few or a few tens of cfu/mL [66,95,97,103,104,105], from which only one is performed in a standard benchtop SPR instrument [66], and two others with a commercially available portable SPR instrument (SPREETA™) [95,97], which is not currently in the market. The first two reports were based on direct binding assays for label-free detection of targeted bacteria [66,95], whereas in the third, gold magnetic particles were employed as labels to drop the LOD to 3 cfu/mL [97]. The rest of the reports implement the localized SPR (LSPR) principle either in the form of gold nanoparticles [103,104] or in the form of nanostructured gold film [105]. In addition to higher detection sensitivity, LSPR is also considered more easily adaptative to portable low-cost devices and it remains to be seen what would be done to this direction in the near future. Regarding the majority of fiber optic based immunosensors the LODs achieved for bacteria detection also ranged from 103-105 cfu/mL. LODs of less than 100 cfu/mL were achieved only when fibers were combined with SPR via covering their sensing area with a gold film or gold nanoparticles or films of other materials (e.g., MoS2 nanosheets) [122,123]. Since, fiber optic experimental set-up can be also reduced in size and cost, the combination with SPR might also be proved a viable solution for portable devices in the future. Integrated interferometers, particularly in the form of MZIs [128] and bimodal interferometers [133] have shown adequate sensitivity for bacteria detection (LODs in the range of a few tens of cfu/mL) combined with short assay times and great potential for multiplexed determinations. There seem also to be the most promising candidate to the direction of portable devices suitable for point-of-need determinations. On the other hand, microring resonators or microtoroids, despite their claimed high detection sensitivity, are the optical transducers less frequently employed for bacteria detection, whereas the few reports existing present LODs non competitive to other types of optical biosensors [152,153]. The same seems to be true for most of the immunosensors based on grating couplers for which there is only one report with a LOD of a few cfu/mL in which an optical fiber grating device has been implemented [144]. Immunosensors based on reflectance spectroscopy have also demonstrate the potential for detection of bacteria at concentrations as low as 2.2 cfu/mL [161], whereas, the assay was performed in a 24-well plate with the IRIS chip placed at the bottom of each well and lasted over 2 h. A more compact system based on reflectance spectroscopy achieved an LOD of 320 cfu/mL with a 15-min assay, allowing the detection of bacteria in food samples after a short pre-enrichment step (3-4 h) [155]. The most impressive performance regarding the percentage of reports that mention LODs of less than 100 cfu/mL present the immunosensors based on SERS [176,177,178,179,180,181,182,184,185,186]. However, with the exception of two reports where Raman spectroscopy is combined with a lateral flow immunoassay [182,184] for which the assay duration was less than 30 min, most sensors requited more than 1 h to complete the assay.
Regarding the assay type implemented for bacteria detection with optical immunosensors, although direct binding onto antibody-modified transducers has been widely used, it has been rarely led to high detection sensitivity combined with short assay time. Thus, competitive or non-competitive immunoassay formats have been employed to increase detection sensitivity and/or decrease assay duration. This might complicate a bit the development of portable devices since it requires the integration of optical sensors with microfluidic modules, pumps and valves which will provide for the automated execution of the assay steps. In addition, this integration should be performed in such a way that it will not increase either the device size or the cost.
To the direction of developing portable devices based on optical transducers, the tools offered by the continuously evolving smartphone gadgets, either as light sources or for the detection of optical signal or the ability to run the instrument software in such a device, process the data, and transfer them wirelessly to central facilities, are considered a significant asset.
Although, the current technological limitations are more than certain that they will be surpassed in the near future, there are some aspects of optical immunosensors that need to further addressed prior to their application for bacteria detection at the point-of-need. For example, the study of relevant literature reveals that the sensitive bacteria detection with immunochemical techniques is often challenging due to lack of appropriate antibodies. Thus, in many instances, optical immunosensors have been developed using in-house produced antibodies that are not widely available. Even, if antibodies with appropriate binding characteristics for the specific and sensitive detection of a particular bacterium are commercially available, their suitability for detection of bacteria in processed foods has to be investigated since the structure of bacteria epitopes could change dramatically when the food has been processed at certain conditions of temperature or pH. In addition, in many instances antibodies cannot discriminate viable from non-viable cells providing false positive results.
Despite the above-mentioned limitations of optical immunosensors for bacteria detection, they remain one of our best hopes for sensitive portable devices that would be available at affordable prices with low operation costs so as to find wide application in food industry, retailers, and food-safety control departments in order to ensure the safety of our food.
Author Contributions
Conceptualization, D.K. and M.A; writing—original draft preparation, D.K., M.A. and P.P.; writing—review and editing, M.A., P.P. and S.K.; funding acquisition, M.A., P.P, and S.K. All authors have read and agreed to the published version of the manuscript.
Funding
This research has been co-financed by the European Regional Development Fund of the European Union and Greek national funds through the Operational Program Competitiveness, Entrepreneurship and Innovation, under the call RESEARCH–CREATE–INNOVATE (project code: Τ2ΕΔΚ-01934/FOODSENS), and European Union’s Horizon 2020 Research and Innovation program through the Marie Sklodowska-Curie grant agreement No 101007299 (SAFEMILK).
Institutional Review Board Statement
Not applicable.
Data Availability Statement
No new data were created or analyzed in this study. Data sharing is not applicable to this article.
Conflicts of Interest
The authors declare no conflict of interest.
References
- World Health Organization. Foodborne Diseases. Available online: https://www.who.int/health-topics/foodborne-diseases#tab=tab_1 (accessed on 18 June 2023).
- World Health Organization. The Top 10 Causes of Death. Available online: https://www.who.int/news-room/fact-sheets/detail/the-top-10-causes-of-death (accessed on 18 June 2023).
- World Health Organization. Estimating the Burden of Foodborne Diseases: A Practical Handbook for Countries; World Health Organization: Geneva, 2021. [Google Scholar]
- Addis, M.; Sisay, D. A review on major food borne bacterial illnesses. J. Trop. Dis. 2015, 3, 1000176. [Google Scholar]
- Madigan, M.; Martinko, J.; Stahl, D.; Clark, D.P. Brock Biology of Microorganisms, 13th ed.; Benjamin Cummings: CA, USA, 2012; pp. 1022–1042. [Google Scholar]
- Zourob, M.; Elwary, S.; Turner, A. Principles of Bacterial Detection: Biosensors, Recognition receptors and Microsystems, 1st ed.; Springer Science+Business Media, LLC: NY, USA, 2008. [Google Scholar]
- Saravanan, A.; Kumar, P.S.; Hemavathy, R.V.; Jeevanantham, S.; Kamalesh, R.; Sneha, S.; Yaashikaa, P.R. Methods of detection of food-borne pathogens: A review. Environ. Chem. Lett. 2021, 19, 189–207. [Google Scholar] [CrossRef]
- Gracias, K.S.; McKillip, J.L. A review of conventional detection and enumeration methods for pathogenic bacteria in food. Can. J. Microbiol. 2004, 50, 883–890. [Google Scholar] [CrossRef]
- Zhao, X.; Lin, C.W.; Wang, J.; Oh, D.H. Advances in rapid detection methods for foodborne pathogens. J. Microbiol. Biotechnol. 2014, 24, 297–312. [Google Scholar] [CrossRef]
- Wang, Y.; Salazar, J.K. Culture-independent rapid detection methods for bacterial pathogens and toxins in food matrices. Compr. Rev. Food Sci. Food Safety 2016, 15, 183–205. [Google Scholar] [CrossRef]
- Garrido-Maestu, A.; Tomás Fornés, D.; Prado Rodríguez, M. The use of multiplex real-time PCR for the simultaneous detection of foodborne bacterial pathogens. In Foodborne Bacterial Pathogens: Methods and Protocols; Bridier A. Ed.; Springer Science+Business Media, LLC: NY, USA, 2019; Volume 1918, pp. 35–45. [Google Scholar]
- Lee, N.; Kwon, K.Y.; Oh, S.K.; Chang, H.J.; Chun, H.S.; Choi, S.W. A multiplex PCR assay for simultaneous detection of Escherichia coli O157:H7, Bacillus cereus, Vibrio parahaemolyticus, Salmonella spp., Listeria monocytogenes, and Staphylococcus aureus in Korean ready-to-eat food. Foodborne Pathog. Dis. 2014, 11, 574–580. [Google Scholar] [CrossRef]
- Liu, Y.; Cao, Y.; Wang, T.; Dong, Q.; Li, J.; Niu, C. Detection of 12 common food-borne bacterial pathogens by Taq Man real-time PCR using a single set of reaction conditions. Front. Microbiol. 2019, 10, 222. [Google Scholar] [CrossRef]
- Magliulo, M.; Simoni, P.; Guardigli, M.; Michelini, E.; Luciani, M.; Lelli, R.; Roda, A. A rapid multiplexed chemiluminescent immunoassay for the detection of Escherichia coli O157:H7, Yersinia enterocolitica, Salmonella typhimurium, and Listeria monocytogenes pathogen bacteria. J. Agric. Food Chem. 2007, 55, 4933–4939. [Google Scholar] [CrossRef]
- Cavaiuolo, M.; Paramithiotis, S.; Drosinos, E.H.; Ferrante, A. Development and optimization of an ELISA based method to detect Listeria monocytogenes and Escherichia coli O157 in fresh vegetables. Anal. Methods 2013, 5, 4622–4627. [Google Scholar] [CrossRef]
- Zhu, L.; He, J.; Cao, X.; Huang, K.; Luo, Y.; Xu, W. Development of a double-antibody sandwich ELISA for rapid detection of Bacillus cereus in food. Sci. Rep. 2016, 6, 16092. [Google Scholar] [CrossRef]
- Hochel, I.; Slavíčková, D.; Viochna, D.; Škvor, J.; Steinhauserová, I. Detection of Campylobacter species in foods by indirect competitive ELISA using hen and rabbit antibodies. Food Agric. Immunol. 2007, 18, 151–167. [Google Scholar] [CrossRef]
- Rohde, A.; Hammerl, J.A.; Boone, I.; Jansen, W.; Fohler, S.; Klein, G.; Dieckmann, R.; Al Dahouk, S. Overview of validated alternative methods for the detection of foodborne bacterial pathogens. Trend Food Sci. Technol. 2017, 62, 113–118. [Google Scholar] [CrossRef]
- Law, J.W.F.; Mutalib, N.S.A.; Chan, K.G.; Lee, L.H. Rapid methods for the detection of foodborne bacterial pathogens: Principles, applications, advantages and limitations. Front. Microbiol. 2014, 5, 770. [Google Scholar] [CrossRef] [PubMed]
- Khansili, N.; Rattu, G.; Krishna, P.M. Label-free optical biosensors for food and biological sensor applications. Sens. Actuator B 2018, 265, 35–49. [Google Scholar] [CrossRef]
- Qiao, Z.; Fu, Y.; Lei, C.; Li, Y. Advances in antimicrobial peptides-based biosensing methods for detection of foodborne pathogens: A review. Food Control 2020, 112, 107116. [Google Scholar] [CrossRef]
- Thévenot, D.R.; Toth, K.; Durst, R.A.; Wilson, G.S. Electrochemical biosensors: Recommended definitions and classification. Biosens. Bioelectron. 2001, 16, 121–131. [Google Scholar] [CrossRef]
- Morales, M.A.; Halpern, J.M. Guide to selecting a biorecognition element for biosensors. Bioconjugate Chem. 2018, 29, 3231–3239. [Google Scholar] [CrossRef]
- Wu, Q.; Zhang, Y.; Yang, Q.; Yuan, N.; Zhang, W. Review of electrochemical DNA biosensors for detecting food borne pathogens. Sensors 2019, 19, 4916. [Google Scholar] [CrossRef]
- Ansari, N.; Yazdian-Robati, R.; Shahdordizadeh, M.; Wang, Z.; Ghazvini, K. Aptasensors for quantitative detection of Salmonella typhimurium. Anal. Biochem. 2017, 533, 18–25. [Google Scholar] [CrossRef]
- Tawil, N.; Sacher, E.; Mandeville, R.; Meunier, M. Surface plasmon resonance detection of E. coli and methicillin-resistant S. aureus using bacteriophages. Biosens. Bioelectron. 2012, 37, 24–29. [Google Scholar] [CrossRef]
- Wen, T.; Wang, R.; Sotero, A.; Li, Y. A portable impedance immunosensing system for rapid detection of Salmonella typhimurium. Sensors 2017, 17, 1973. [Google Scholar] [CrossRef] [PubMed]
- Viswanathan, S.; Rani, C.; Ho, J.A.A. Electrochemical immunosensor for multiplexed detection of food-borne pathogens using nanocrystal bioconjugates and MWCNT screen-printed electrode. Talanta 2012, 94, 315–319. [Google Scholar] [CrossRef] [PubMed]
- Fulgione, A.; Cimafonte, M.; Della Ventura, B.; Iannaccone, M.; Ambrosino, C.; Capuano, F.; Proroga, Y.T.R.; Velotta, R.; Capparelli, R. QCM-based immunosensor for rapid detection of Salmonella typhimurium in food. Sci. Rep. 2018, 8, 16137. [Google Scholar] [CrossRef] [PubMed]
- Ye, Y.; Guo, H.; Sun, X. Recent progress on cell-based biosensors for analysis of food safety and quality control. Biosens. Bioelectron. 2019, 126, 389–404. [Google Scholar] [CrossRef]
- Templier, V.; Roux, A.; Roupioz, Y.; Livache, T. Ligands for label-free detection of whole bacteria on biosensors: A review. TrAC – Trend Anal. Chem. 2016, 79, 71–79. [Google Scholar] [CrossRef]
- Chakraborty, M.; Hashmi, M.S.J. An overview of biosensors and devices. Ref. Mod. Mater. Sci. Mater. Eng. 2017. [Google Scholar] [CrossRef]
- Dong, J.; Zhao, H.; Xu, M.; Maa, Q.; Ai, S. A label-free electrochemical impedance immunosensor based on AuNPs/PAMAM-MWCNT-Chi nanocomposite modified glassy carbon electrode for detection of Salmonella typhimurium in milk. Food Chem. 2013, 141, 1980–1986. [Google Scholar] [CrossRef]
- Lin, Y.H.; Chen, S.H.; Chuang, Y.C.; Lu, Y.C.; Shen, T.Y.; Chang, C.A.; Lin, C.S. Disposable amperometric immunosensing strips fabricated by Au nanoparticles-modified screen-printed carbon electrodes for the detection of foodborne pathogen Escherichia coli O157:H7. Biosens. Bioelectron. 2008, 23, 1832–1837. [Google Scholar] [CrossRef]
- Mathelié-Guinlet, M.; Cohen-Bouhacina, T.; Gammoudi, I.; Martin, A.; Béven, L.; Delville, M.H.; Grauby-Heywang, C. Silica nanoparticles-assisted electrochemical biosensor for the rapid, sensitive and specific detection of Escherichia coli. Sens. Actuator B 2019, 292, 314–320. [Google Scholar] [CrossRef]
- Chen, S.H.; Wu, V.C.H.; Chuang, Y.C.; Lin, C.S. Using oligonucleotide-functionalized Au nanoparticles to rapidly detect foodborne pathogens on a piezoelectric biosensor. J. Microbiol. Method 2008, 73, 7–17. [Google Scholar] [CrossRef]
- Kalograiaki, I.; Euba, B.; Proverbio, D.; Campanero-Rhodes, M.A.; Aastrup, T.; Garmendia, J.; Solís, D. Combined bacteria microarray and quartz crystal microbalance approach for exploring glycosignatures of nontypeable Haemophilus influenzae and recognition by host lectins. Anal. Chem. 2016, 88, 5950–5957. [Google Scholar] [CrossRef] [PubMed]
- Ma, F.; Rehman, A.; Liu, H.; Zhang, J.; Zhu, S.; Zeng, X. Glycosylation of quinone-fused polythiophene for reagentless and label-free detection of E. coli. Anal. Chem. 2015, 87, 1560–1568. [Google Scholar] [CrossRef] [PubMed]
- Yoo, S.M.; Lee, S.Y. Optical biosensors for the detection of pathogenic microorganisms. Trend Biotechnol. 2016, 34, 7–25. [Google Scholar] [CrossRef] [PubMed]
- Dudak, F.C.; Boyaci, I.H. Rapid and label-free bacteria detection by surface plasmon resonance (SPR) biosensors. Biotechnol. J. 2009, 4, 1003–1011. [Google Scholar] [CrossRef]
- Bhunia, A.K. Biosensors and bio-based methods for the separation and detection of foodborne pathogens. Adv. Food Nutr. Res. 2008, 54, 1–44. [Google Scholar]
- Chen, C.; Wang, J. Optical biosensors: An exhaustive and comprehensive review. Analyst 2020, 145, 1605–1628. [Google Scholar] [CrossRef]
- Angelopoulou, M.; Kakabakos, S.; Petrou, P. Label-free biosensors based onto monolithically integrated onto silicon optical transducers. Chemosensors 2018, 6, 52. [Google Scholar] [CrossRef]
- Sanvicens, N.; Pastells, C.; Pascual, N.; Marco, M.P. Nanoparticle-based biosensors for detection of pathogenic bacteria. TrAC - Trend Anal. Chem. 2009, 28, 1243–1252. [Google Scholar] [CrossRef]
- Wang, X.D.; Wolfbeis, O.S. Fiber-optic chemical sensors and biosensors (2008-2012). Anal. Chem. 2013, 85, 487–508. [Google Scholar] [CrossRef]
- Benito-Peña, E.; Valdés, M.G.; Glahn-Martínez, B.; Moreno-Bondi, M.C. Fluorescence based fiber optic and planar waveguide biosensors. A review. Anal. Chim. Acta 2016, 943, 17–40. [Google Scholar] [CrossRef]
- Taitt, C.R.; Anderson, G.P.; Ligler, F.S. Evanescent wave fluorescence biosensors: Advances of the last decade. Biosens. Bioelectron. 2016, 76, 103–112. [Google Scholar] [CrossRef] [PubMed]
- Vashist, S.K.; Luppa, P.B.; Yeo, L.Y.; Ozcan, A.; Luong, J.H.T. Emerging technologies for next-generation Point-of-Care testing. Trend Biotechnol. 2015, 33, 692–705. [Google Scholar] [CrossRef] [PubMed]
- Gauglitz, G. Direct optical detection in bioanalysis: An update. Anal. Bioanal. Chem. 2010, 398, 2363–2372. [Google Scholar] [CrossRef]
- Luan, E.; Shoman, H.; Ratner, D.M.; Cheung, K.C.; Chrostowski, L. Silicon photonic biosensors using label-free detection. Sensors 2018, 18, 3519. [Google Scholar] [CrossRef]
- Lee, D.; Hwang, J.; Seo, Y.; Gilad, A.A.; Choi, J. Optical immunosensors for the efficient detection of target biomolecules. Biotechnol. Bioproc. Eng. 2018, 23, 123–133. [Google Scholar] [CrossRef]
- Huertas, C.S.; Calvo-Lozano, O.; Mitchell, A.; Lechuga, L.M. Advanced evanescent-wave optical biosensors for the detection of nucleic acids: An analytic perspective. Front. Chem. 2019, 7, 724. [Google Scholar] [CrossRef] [PubMed]
- Gauglitz, G.; Nahm, W. Observation of spectral interferences for the determination of volume and surface effects of thin films. Fresenius J. Anal. Chem. 1991, 341, 279–283. [Google Scholar] [CrossRef]
- Rothmund, M.; Schütz, A.; Brecht, A.; Gauglitz, G.; Berthel, G.; Gräfe, D. Label free binding assay with spectroscopic detection for pharmaceutical screening. Fresenius J. Anal. Chem. 1997, 359, 15–22. [Google Scholar] [CrossRef]
- Bleher, O.; Schindler, A.; Yin, M.X.; Holmes, A.B.; Luppa, P.B.; Gauglitz, G.; Proll, G. Development of a new parallelized, optical biosensor platform for label-free detection of autoimmunity-related antibodies multiplex platforms in diagnostics and bioanalytics. Anal. Bioanal. Chem. 2014, 406, 3305–3314. [Google Scholar] [CrossRef]
- Schwartz, M.P.; Alvarez, S.D.; Sailor, M.J. A Porous SiO2 interferometric biosensor for quantitative determination of protein interactions: Binding of protein A to immunoglobulins derived from different species. Anal. Chem. 2007, 79, 327–334. [Google Scholar] [CrossRef]
- Tsang, C.K.; Kelly, T.L.; Sailor, M.J.; Li, Y.Y. Highly stable porous silicon-carbon composites as label-free optical biosensors. ACS Nano 2012, 6, 10546–10554. [Google Scholar] [CrossRef] [PubMed]
- Mun, K.S.; Alvarez, S.D.; Choi, W.Y.; Sailor, M.J. A Stable, label-free optical interferometric biosensor based on TiO2 nanotube arrays. ACS Nano 2010, 4, 2070–2076. [Google Scholar] [CrossRef] [PubMed]
- Petrou, P.S.; Ricklin, D.; Zavali, M.; Raptis, I.; Kakabakos, S.E.; Misiakos, K.; Lambris, J.D. Real-time label-free detection of complement activation products in human serum by White Light Reflectance Spectroscopy. Biosens. Bioelectron. 2009, 24, 3359–3364. [Google Scholar] [CrossRef] [PubMed]
- Tsounidi, D.; Koukouvinos, G.; Petrou, P.; Misiakos, K.; Zisis, G.; Goustouridis, D.; Raptis, I.; Kakabakos, S.E. Rapid and sensitive label-free determination of aflatoxin M1 levels in milk through a White Light Reflectance Spectroscopy immunosensor. Sens. Actuator B 2019, 282, 104–111. [Google Scholar] [CrossRef]
- Koukouvinos, G.; Petrou, P.; Goustouridis, D.; Misiakos, K.; Kakabakos, S.; Raptis, I. Development and bioanalytical applications of a White Light Reflectance Spectroscopy label-free sensing platform. Biosensors 2017, 7, 46. [Google Scholar] [CrossRef]
- Kurihara, Y.; Takama, M.; Masubuchi, M.; Ooya, T.; Takeuchi, T. Microfluidic reflectometric interference spectroscopy-based sensing for exploration of protein-protein interaction conditions. Biosens. Bioelectron. 2013, 40, 247–251. [Google Scholar] [CrossRef]
- Fratamico, P.M.; Strobaugh, T.R.; Medina, M.B.; Gehring, A.G. Detection of Escherichia coli 0157:H7 using a surface plasmon resonance biosensor. Biotechnol. Technique 1998, 12, 571–576. [Google Scholar] [CrossRef]
- Jyoung, J.-Y.; Hong, S.H.; Lee, W.; Choi, J.W. Immunosensor for the detection of Vibrio cholerae O1 using surface plasmon resonance. Biosens. Bioelectron. 2006, 21, 2315–2319. [Google Scholar] [CrossRef]
- Oh, B.K.; Kim, Y.K.; Lee, W.; Bae, Y.M.; Lee, W.H.; Choi, J.W. Immunosensor for detection of Legionella pneumophila using surface plasmon resonance. Biosens. Bioelectron. 2003, 18, 605–611. [Google Scholar] [CrossRef]
- Waswa, J.W.; Debroy, C.; Irudayaraj, J. Rapid detection of Salmonella Enteritidis and Escherichia Coli using surface plasmon resonance biosensor. J. Food Proc. Eng. 2006, 29, 373–385. [Google Scholar] [CrossRef]
- Bokken, G.C.A.M.; Corbee, R.J.; Van Knapen, F.; Bergwerff, A.A. Immunochemical detection of Salmonella group B, D and E using an optical surface plasmon resonance biosensor. FEMS Microbiol. Lett. 2003, 222, 75–82. [Google Scholar] [CrossRef] [PubMed]
- Subramanian, A.; Irudayaraj, J.; Ryan, T. Mono and dithiol surfaces on surface plasmon resonance biosensors for detection of Staphylococcus aureus. Sens. Actuator B 2006, 114, 192–198. [Google Scholar] [CrossRef]
- Subramanian, A.; Irudayaraj, J.; Ryan, T. A Mixed self-assembled monolayer-based surface plasmon immunosensor for detection of E. coli O157:H7. Biosens. Bioelectron 2006, 21, 998–1006. [Google Scholar] [CrossRef] [PubMed]
- Oh, B.K.; Lee, W.; Kim, Y.K.; Lee, W.H.; Choi, J.W. Surface plasmon resonance immunosensor using self-assembled protein G for the detection of Salmonella paratyphi. J. Biotechnol. 2004, 111, 1–8. [Google Scholar] [CrossRef] [PubMed]
- Vaisocherová-Lísalová, H.; Víšová, I.; Ermini, M.L.; Špringer, T.; Song, X.C.; Mrázek, J.; Lamačová, J.; Scott Lynn, N.; Šedivák, P.; Homola, J. Low-fouling surface plasmon resonance biosensor for multi-step detection of foodborne bacterial pathogens in complex food samples. Biosens. Bioelectron. 2016, 80, 84–90. [Google Scholar] [CrossRef]
- Masdor, N.A.; Altintas, Z.; Tothill, I.E. Surface plasmon resonance immunosensor for the detection of Campylobacter jejuni. Chemosensors 2017, 5, 16. [Google Scholar] [CrossRef]
- Poltronieri, P.; De Blasi, M.D.; D’Urso, O.F. Detection of Listeria monocytogenes through real-time PCR and biosensor methods. Plant Soil Environ. 2009, 55, 363–369. [Google Scholar] [CrossRef]
- Linman, M.J.; Sugerman, K.; Cheng, Q. Detection of low levels of Escherichia coli in fresh spinach by surface plasmon resonance spectroscopy with a TMB-based enzymatic signal enhancement method. Sens. Actuator B 2010, 145, 613–619. [Google Scholar] [CrossRef]
- Makhneva, E.; Farka, Z.; Skládal, P.; Zajíčková, L. Cyclopropylamine plasma polymer surfaces for label-free SPR and QCM immunosensing of Salmonella. Sens. Actuator B 2018, 276, 447–455. [Google Scholar] [CrossRef]
- Taylor, A.D.; Yu, Q.; Chen, S.; Homola, J.; Jiang, S. Comparison of E. coli O157:H7 preparation methods used for detection with surface plasmon resonance sensor. Sens. Actuator B 2005, 107, 202–208. [Google Scholar] [CrossRef]
- Waswa, J.; Irudayaraj, J.; DebRoy, C. Direct detection of E. coli O157:H7 in selected food systems by a surface plasmon resonance biosensor. LWT - Food Sci. Technol. 2007, 40, 187–192. [Google Scholar] [CrossRef]
- Mazumdar, S.D.; Hartmann, M.; Kämpfer, P.; Keusgen, M. Rapid method for detection of Salmonella in milk by surface plasmon resonance (SPR). Biosens. Bioelectron. 2007, 22, 2040–2046. [Google Scholar] [CrossRef]
- Leonard, P.; Hearty, S.; Quinn, J.; O’Kennedy, R. A generic approach for the detection of whole Listeria monocytogenes cells in contaminated samples using surface plasmon resonance. Biosens. Bioelectron. 2004, 19, 1331–1335. [Google Scholar] [CrossRef]
- Wang, Y.; Ye, Z.; Si, C.; Ying, Y. Subtractive inhibition assay for the detection of E. coli O157:H7 using surface plasmon resonance. Sensors 2011, 11, 2728–2739. Sensors 2011, 11, 2728–2739. [Google Scholar] [CrossRef] [PubMed]
- Wang, D.B.; Bi, L.J.; Zhang, Z.P.; Chen, Y.Y.; Yang, R.F.; Wei, H.P.; Zhou, Y.F.; Zhang, X.E. Label-free detection of B. anthracis spores using a surface plasmon resonance biosensor. Analyst 2009, 134, 738–742. [Google Scholar] [PubMed]
- Skottrup, P.D.; Nicolaisen, M.; Justesen, A.F. Towards on-site pathogen detection using antibody-based sensors. Biosens. Bioelectron. 2008, 24, 339–348. [Google Scholar] [CrossRef]
- Skottrup, P.; Nicolaisen, M.; Justesen, A.F. Rapid determination of Phytophthora infestans sporangia using a surface plasmon resonance immunosensor. J. Microbiol. Method 2007, 68, 507–515. [Google Scholar] [CrossRef]
- Skottrup, P.; Hearty, S.; Frøkiær, H.; Leonard, P.; Hejgaard, J.; O’Kennedy, R.; Nicolaisen, M.; Justesen, A.F. Detection of fungal spores using a generic surface plasmon resonance immunoassay. Biosens. Bioelectron. 2007, 22, 2724–2729. [Google Scholar] [CrossRef]
- Kang, C.D.; Cao, C.; Lee, J.; Choi, I.S.; Kim, B.W.; Sim, S.J. Surface plasmon resonance-based inhibition assay for real-time detection of Cryptosporidium parvum oocyst. Water Res. 2008, 42, 1693–1699. [Google Scholar] [CrossRef]
- Leonard, P.; Hearty, S.; Wyatt, G.; Quinn, J.; O’Kennedy, R. Development of a surface plasmon resonance-based immunoassay for Listeria monocytogenes. J. Food Protect. 2005, 68, 728–735. [Google Scholar] [CrossRef]
- Oh, B.K.; Lee, W.; Chun, B.S.; Bae, Y.M.; Lee, W.H.; Choi, J.W. The fabrication of protein chip based on surface plasmon resonance for detection of pathogens. Biosens. Bioelectron. 2005, 20, 1847–1850. [Google Scholar] [CrossRef] [PubMed]
- Taylor, A.D.; Ladd, J.; Yu, Q.; Chen, S.; Homola, J.; Jiang, S. Quantitative and simultaneous detection of four foodborne bacterial pathogens with a multi-channel SPR sensor. Biosens. Bioelectron. 2006, 22, 752–758. [Google Scholar] [CrossRef] [PubMed]
- Morlay, A.; Duquenoy, A.; Piat, F.; Calemczuk, R.; Mercey, T.; Livache, T.; Roupioz, Y. Label-free immuno-sensors for the fast detection of Listeria in Food. Measurement 2017, 98, 305–310. [Google Scholar] [CrossRef]
- Chen, J.; Park, B. Label-free screening of foodborne Salmonella using surface plasmon resonance imaging. Anal. Bioanal. Chem. 2018, 410, 5455–5464. [Google Scholar] [CrossRef]
- Park, B.; Wang, B.; Chen, J. Label-free immunoassay for multiplex detections of foodborne bacteria in chicken carcass rinse with surface plasmon resonance imaging. Foodborne Pathog. Dis. 2021, 18, 202–209. [Google Scholar] [CrossRef]
- Boulade, M.; Morlay, A.; Piat, F.; Roupioz, Y.; Livache, T.; Charette, P.G.; Canva, M.; Leroy, L. Early detection of bacteria using SPR imaging and event counting: Experiments with Listeria monocytogenes and Listeria innocua. RSC Advances 2019, 9, 15554–15560. [Google Scholar] [CrossRef]
- Wei, D.; Oyarzabal, O.A.; Huang, T.S.; Balasubramanian, S.; Sista, S.; Simonian, A.L. Development of a surface plasmon resonance biosensor for the identification of Campylobacter jejuni. J. Microbiol. Method 2007, 69, 78–85. [Google Scholar] [CrossRef]
- Meeusen, C.A.; Alocilja, E.C.; Osburn, W.N. Detection of E. coli O157:H7 using a miniaturized surface plasmon resonance biosensor. Transact. ASAE 2005, 48, 2409–2416. [Google Scholar] [CrossRef]
- Dudak, F.C.; Boyaci, I.H. Development of an immunosensor based on surface plasmon resonance for enumeration of Escherichia coli in water samples. Food Res. Int. 2007, 40, 803–807. [Google Scholar] [CrossRef]
- Lan, Y.-B; Wang, S.-Z; Yin, Y.-G.; Hoffmann, W.C.; Zheng, X.-Z. Using a surface plasmon resonance biosensor for rapid detection of Salmonella typhimurium in chicken carcass. J. Bionic Eng. 2008, 5, 239–246. [Google Scholar] [CrossRef]
- Torun, Ö.; Hakki Boyaci, I.; Temür, E.; Tamer, U. Comparison of sensing strategies in SPR biosensor for rapid and sensitive enumeration of bacteria. Biosens. Bioelectron. 2012, 37, 53–60. [Google Scholar] [CrossRef] [PubMed]
- Tokel, O.; Yildiz, U.H.; Inci, F.; Durmus, N.G.; Ekiz, O.O.; Turker, B.; Cetin, C.; Rao, S.; Sridhar, K.; Natarajan, N.; et al. Portable microfluidic integrated plasmonic platform for pathogen detection. Sci. Rep. 2015, 5, 9154. [Google Scholar] [CrossRef] [PubMed]
- Nguyen, H.H.; Yi, S.Y.; Woubit, A.; Kim, M. A portable surface plasmon resonance biosensor for rapid detection of Salmonella typhimurium. Appl. Sci. Converg. Technol. 2016, 25, 61–65. [Google Scholar] [CrossRef]
- Choi, J.; Lee, J.; Son, J.; Choi, J. Noble metal-assisted surface plasmon resonance immunosensors. Sensors 2020, 20, 1003. [Google Scholar] [CrossRef] [PubMed]
- Lopez, G.A.; Estevez, M.C.; Soler, M.; Lechuga, L.M. Recent advances in nanoplasmonic biosensors: Applications and lab-on-a-chip integration. Nanophotonics 2017, 6, 123–136. [Google Scholar] [CrossRef]
- Fu, J.; Park, B.; Zhao, Y. Limitation of a localized surface plasmon resonance sensor for Salmonella detection. Sens. Actuator B 2009, 141, 276–283. [Google Scholar] [CrossRef]
- Song, L.; Zhang, L.; Huang, Y.; Chen, L.; Zhang, G.; Shen, Z.; Zhang, J.; Xiao, Z.; Chen, T. Amplifying the signal of localized surface plasmon resonance sensing for the sensitive detection of Escherichia coli O157:H7. Sci. Rep. 2017, 7, 1–8. [Google Scholar] [CrossRef]
- Yaghubi, F.; Zeinoddini, M.; Saeedinia, A.R.; Azizi, A.; Samimi Nemati, A. Design of localized surface plasmon resonance (LSPR) biosensor for immunodiagnostic of E. coli O157:H7 using gold nanoparticles conjugated to the chicken antibody. Plasmonics 2020, 15, 1481–1487. [Google Scholar] [CrossRef]
- Wang, Y.; Knoll, W.; Dostalek, J. Bacterial pathogen surface plasmon resonance biosensor advanced by long range surface plasmons and magnetic nanoparticle assays. Anal. Chem. 2012, 84, 8345–8350. [Google Scholar] [CrossRef]
- Sharma, H.; Mutharasan, R. Review of biosensors for foodborne pathogens and toxins. Sens. Actuator B 2013, 183, 535–549. [Google Scholar] [CrossRef]
- Rijal, K.; Leung, A.; Shankar, P.M.; Mutharasan, R. Detection of pathogen Escherichia coli O157:H7 at 70 cells/mL using antibody-immobilized biconical tapered fiber sensors. Biosens. Bioelectron. 2005, 21, 871–880. [Google Scholar] [CrossRef] [PubMed]
- Wiejata, P.J.; Shankar, P.M.; Mutharasan, R. Fluorescent sensing using biconical tapers. Sens. Actuator B 2003, 96, 315–320. [Google Scholar] [CrossRef]
- Yu, W.; Lang, T.; Bian, J.; Kong, W. Label-free fiber optic biosensor based on thin-core modal interferometer. Sens. Actuator B 2016, 228, 322–329. [Google Scholar] [CrossRef]
- Bharadwaj, R.; Sai, V.V.R.; Thakare, K.; Dhawangale, A.; Kundu, T.; Titus, S.; Verma, P.K.; Mukherji, S. Evanescent wave absorbance based fiber optic biosensor for label-free detection of E. coli at 280 nm wavelength. Biosens. Bioelectron. 2011, 26, 3367–3370. [Google Scholar] [CrossRef]
- Wandemur, G.; Rodrigues, D.; Allil, R.; Queiroz, V.; Peixoto, R.; Werneck, M.; Miguel, M. Plastic optical fiber-based biosensor platform for rapid cell detection. Biosens. Bioelectron. 2014, 54, 661–666. [Google Scholar] [CrossRef]
- Zhou, C.; Pivarnik, P.; Auger, S.; Rand, A.; Letcher, S. A compact fiber-optic immunosensor for Salmonella based on evanescent wave excitation. Sens. Actuator B 1997, 42, 169–175. [Google Scholar] [CrossRef]
- Geng, T.; Uknalis, J.; Tu, S.I.; Bhunia, A.K. Fiber-optic biosensor employing Alexa-Fluor conjugated antibody for detection of Escherichia coli O157:H7 from ground beef in four hours. Sensors 2006, 6, 796–807. [Google Scholar] [CrossRef]
- Kramer, M.F.; Lim, D.V. A rapid and automated fiber optic-based biosensor assay for the detection of Salmonella in spent irrigation water used in the sprouting of sprout seeds. J. Food Protect. 2004, 67, 46–52. [Google Scholar] [CrossRef]
- Leskinen, S.D.; Lim, D.V. Rapid ultrafiltration concentration and biosensor detection of Enterococci from large volumes of Florida recreational water. Appl. Environ. Microbiol. 2008, 74, 4792–4798. [Google Scholar] [CrossRef]
- Geng, T.; Morgan, M.T.; Bhunia, A.K. Detection of low levels of Listeria monocytogenes cells by using a fiber-optic immunosensor. Appl. Environ. Microbiol. 2004, 70, 6138–6146. [Google Scholar] [CrossRef]
- Ohk, S.H.; Koo, O.K.; Sen, T.; Yamamoto, C.M.; Bhunia, A.K. Antibody-aptamer functionalized fibre-optic biosensor for specific detection of Listeria monocytogenes from food. J. Appl. Microbiol. 2010, 109, 808–817. [Google Scholar] [CrossRef] [PubMed]
- Nanduri, V.; Kim, G.; Morgan, M.T.; Ess, D.; Hahm, B.K.; Kothapalli, A.; Valadez, A.; Geng, T.; Bhunia, A.K. Antibody immobilization on waveguides using a flow–through system shows improved Listeria monocytogenes detection in an automated fiber optic biosensor: RAPTORTM. Sensors 2006, 6, 808–822. [Google Scholar] [CrossRef]
- Ohk, S.H.; Bhunia, A.K. Multiplex fiber optic biosensor for detection of Listeria monocytogenes, Escherichia coli O157: H7 and Salmonella enterica from ready-to-eat meat samples. Food Microbiol. 2013, 33, 166–171. [Google Scholar] [CrossRef] [PubMed]
- Ko, S.; Grant, S.A. A Novel FRET-based optical fiber biosensor for rapid detection of Salmonella typhimurium. Biosens. Bioelectron. 2006, 21, 1283–1290. [Google Scholar] [CrossRef]
- Fallah, H.; Asadishad, T.; Parsanasab, G.M.; Harun, S.W.; Mohammed, W.S.; Yasin, M. Optical fiber biosensor toward E-coli bacterial detection on the pollutant water. Eng. J. 2021, 25, 1–8. [Google Scholar] [CrossRef]
- Lin, H.Y.; Tsao, Y.C.; Tsai, W.H.; Yang, Y.W.; Yan, T.R.; Sheu, B.C. Development and application of side-polished fiber immunosensor based on surface plasmon resonance for the detection of Legionella pneumophila with halogens light and 850 nm-LED. Sens. Actuators A 2007, 138, 299–305. [Google Scholar] [CrossRef]
- Kaushik, S.; Tiwari, U.K.; Pal, S.S.; Sinha, R.K. Rapid detection of Escherichia coli using fiber optic surface plasmon resonance immunosensor based on biofunctionalized molybdenum disulfide (MoS2) nanosheets. Biosens. Bioelectron. 2019, 126, 501–509. [Google Scholar] [CrossRef]
- Kozma, P.; Kehl, F.; Ehrentreich-Förster, E.; Stamm, C.; Bier, F.F. Integrated planar optical waveguide interferometer biosensors: A comparative review. Biosens. Bioelectron. 2014, 58, 287–307. [Google Scholar] [CrossRef]
- Makarona, E.; Petrou, P.; Kakabakos, S.; Misiakos, K.; Raptis, I. Point-of-need bioanalytics based on planar optical interferometry. Biotechnol. Adv. 2016, 34, 209–233. [Google Scholar] [CrossRef]
- Sarkar, D.; Gunda, N.S.K.; Jamal, I.; Mitra, S.K. Optical biosensors with an integrated Mach-Zehnder interferometer for detection of Listeria monocytogenes. Biomed. Microdev. 2014, 16, 509–520. [Google Scholar] [CrossRef]
- Mathesz, A.; Valkai, S.; Újvárosy, A.; Aekbote, B.; Sipos, O.; Stercz, B.; Kocsis, B.; Szabó, D.; Dér, A. Integrated optical biosensor for rapid detection of bacteria. Optofluid. Microfluid. Nanofluid. 2016, 2, 15–21. [Google Scholar] [CrossRef]
- Angelopoulou, M.; Petrou, P.; Misiakos, K.; Raptis, I.; Kakabakos, S. Simultaneous detection of Salmonella typhimurium and Escherichia coli O157:H7 in drinking water and milk with Mach–Zehnder interferometers monolithically integrated on silicon chips. Biosensors 2022, 12, 507. [Google Scholar] [CrossRef]
- Ymeti, A.; Greve, J.; Lambeck, P. V.; Wink, T.; Van Novell, S.W.F.M.; Beumer, T.A.M.; Wijn, R.R.; Heideman, R.G.; Subramaniam, V.; Kanger, J.S. Fast, ultrasensitive virus detection using a Young interferometer sensor. Nano Lett. 2007, 7, 394–397. [Google Scholar] [CrossRef]
- Schneider, B.H.; Edwards, J.G.; Hartman, N.F. Hartman interferometer: Versatile integrated optic sensor for label- free, real-time quantification of nucleic acids, proteins, and pathogens. Clin. Chem. 1997, 43, 1757–1763. [Google Scholar] [CrossRef] [PubMed]
- Seo, K.H.; Brackett, R.E.; Hartman, N.F.; Campbell, D.P. Development of a rapid response biosensor for detection of Salmonella typhimurium. J. Food Protect. 1999, 62, 431–437. [Google Scholar] [CrossRef] [PubMed]
- Nagel, T.; Ehrentreich-Förster, E.; Singh, M.; Schmitt, K.; Brandenburg, A.; Berka, A.; Bier, F.F. Direct detection of Tuberculosis infection in blood serum using three optical label-free approaches. Sens. Actuator B 2008, 129, 934–940. [Google Scholar] [CrossRef]
- Maldonado, J.; González-Guerrero, A.B.; Domínguez, C.; Lechuga, L.M. Label-free bimodal waveguide immunosensor for rapid diagnosis of bacterial infections in cirrhotic patients. Biosens. Bioelectron. 2016, 85, 310–316. [Google Scholar] [CrossRef]
- Maldonado, J.; González-Guerrero, A.B.; Fernández-Gavela, A.; González-López, J.J.; Lechuga, L.M. Ultrasensitive label-free detection of unamplified multidrug-resistance bacteria genes with a bimodal waveguide interferometric biosensor. Diagnostics 2020, 10, 845. [Google Scholar] [CrossRef] [PubMed]
- Grego, S.; McDaniel, J.R.; Stoner, B.R. Wavelength interrogation of grating-based optical biosensors in the input coupler configuration. Sens. Actuator B 2008, 131, 347–355. [Google Scholar] [CrossRef]
- Adrian, J.; Pasche, S.; Diserens, J.M.; Sánchez-Baeza, F.; Gao, H.; Marco, M.P.; Voirin, G. Waveguide interrogated optical immunosensor (WIOS) for detection of sulfonamide antibiotics in milk. Biosens. Bioelectron. 2009, 24, 3340–3346. [Google Scholar] [CrossRef] [PubMed]
- Kehl, F.; Etlinger, G.; Gartmann, T.E.; Tscharner, N.S.R.U.; Heub, S.; Follonier, S. Introduction of an angle interrogated, MEMS-based, optical waveguide grating system for label-free biosensing. Sens. Actuator B 2016, 226, 135–143. [Google Scholar] [CrossRef]
- Kozma, P.; Hamori, A.; Cottier, K.; Kurunczi, S.; Horvath, R. Grating coupled interferometry for optical sensing. Appl. Phys. B 2009, 97, 5–8. [Google Scholar] [CrossRef]
- Teotia, P.K.; Kaler, R.S. Multilayer with Periodic Grating Based High Performance SPR Waveguide Sensor. Opt. Commun. 2017, 395, 154–158. [Google Scholar] [CrossRef]
- Marusov, G.; Sweatt, A.; Pietrosimone, K.; Benson, D.; Geary, S.J.; Silbart, L.K.; Challa, S.; Lagoy, J.; Lawrence, D.A.; Lynes, M.A. A microarray biosensor for multiplexed detection of microbes using grating-coupled surface plasmon resonance imaging. Environ. Sci. Technol. 2012, 46, 348–359. [Google Scholar] [CrossRef] [PubMed]
- Davies, E.; Viitala, R.; Salomäki, M.; James, S.W.; Tatam, R.P. Optical fibre long-period grating sensors: Characteristics and application. Meas. Sci. Technol. 2003, 14, R49. [Google Scholar]
- Shi, W.; Wang, X.; Zhang, W.; Yun, H.; Lin, C.; Chrostowski, L.; Jaeger, N.A.F. Grating-coupled silicon microring resonators. Appl. Phys. Lett. 2012, 100, 121118. [Google Scholar] [CrossRef]
- Horváth, R.; Pedersen, H.C.; Skivesen, N.; Selmeczi, D.; Larsen, N.B. Optical waveguide sensor for on-line monitoring of bacteria. Opt. Lett. 2003, 28, 1233. [Google Scholar] [CrossRef]
- Bandara, A.B.; Zuo, Z.; Ramachandran, S.; Ritter, A.; Heflin, J.R.; Inzana, T.J. Detection of methicillin-resistant Staphylococci by biosensor assay consisting of nanoscale films on optical fiber long-period gratings. Biosens. Bioelectron. 2015, 70, 433–440. [Google Scholar] [CrossRef]
- Yang, F.; Chang, T.L.; Liu, T.; Wu, D.; Du, H.; Liang, J.; Tian, F. Label-free detection of Staphylococcus aureus bacteria using long-period fiber gratings with functional polyelectrolyte coatings. Biosens. Bioelectron. 2019, 133, 147–153. [Google Scholar] [CrossRef]
- Kaushik, S.; Tiwari, U.; Nilima, *!!! REPLACE !!!*; Prashar, S.; Das, B.; Sinha, R.K. Label-free detection of Escherichia coli bacteria by cascaded chirped long period gratings immunosensor. Rev. Sci. Instr. 2019, 90, 025003. [Google Scholar] [CrossRef]
- Kim, N.; Park, I.S.; Kim, W.Y. Salmonella detection with a direct-binding optical grating coupler immunosensor. Sens. Actuator B 2007, 121, 606–615. [Google Scholar] [CrossRef]
- Cooper, I.R.; Meikle, S.T.; Standen, G.; Hanlon, G.W.; Santin, M. The rapid and specific real-time detection of Legionella pneumophila in water samples using optical waveguide lightmode spectroscopy. J. Microbiol. Method 2009, 78, 40–44. [Google Scholar] [CrossRef]
- Lee, S.; Chan Eom, S.; Soo Chang, J.; Huh, C.; Yong Sung, G.; Shin, J.H. A silicon nitride microdisk resonator with a 40-nm-thin horizontal air slot. Opt. Exp. 2010, 18, 11209–11215. [Google Scholar] [CrossRef]
- De Vos, K.; Bartolozzi, I.; Schacht, E.; Bienstman, P.; Baets, R. Silicon-on-insulator microring resonator for sensitive and label-free biosensing. Opt. Exp. 2007, 15, 7610–7615. [Google Scholar] [CrossRef] [PubMed]
- Armani, D.K.; Kippenberg, T.J.; Spillane, S.M.; Vahala, K.J. Ultra-high-Q toroid microcavity on a chip. Nature 2003, 421, 925–928. [Google Scholar] [CrossRef]
- Ramachandran, A.; Wang, S.; Clarke, J.; Ja, S.J.; Goad, D.; Wald, L.; Flood, E.M.; Knobbe, E.; Hryniewicz, J. V.; Chu, S.T.; Gill, D.; Chen, W.; King, O.; Little, B.E. A universal biosensing platform based on optical micro-ring resonators. Biosens. Bioelectron. 2008, 23, 939–944. [Google Scholar] [CrossRef] [PubMed]
- Ghali, H.; Chibli, H.; Nadeau, J.L.; Bianucci, P.; Peter, Y.A. Real-time detection of Staphylococcus aureus using whispering gallery mode optical microdisks. Biosensors 2016, 6, 20. [Google Scholar] [CrossRef]
- Merkl, S.; Vornicescu, D.; Dassinger, N.; Keusgen, M. Detection of whole cells using reflectometric interference spectroscopy. Phys. Status Solidi A 2014, 211, 1416–1422. [Google Scholar] [CrossRef]
- Angelopoulou, M.; Tzialla, K.; Voulgari, A.; Dikeoulia, M.; Raptis, I.; Kakabakos, S.E.; Petrou, P. Rapid detection of Salmonella typhimurium in drinking water by a White Light Reflectance Spectroscopy immunosensor. Sensors 2021, 21, 2683. [Google Scholar] [CrossRef] [PubMed]
- Massad-Ivanir, N.; Shtenberg, G.; Tzur, A.; Krepker, M.A.; Segal, E. Engineering nanostructured porous SiO2 surfaces for bacteria detection via “direct cell capture”. Anal. Chem. 2011, 83, 3282–3289. [Google Scholar] [CrossRef]
- Massad-Ivanir, N.; Shtenberg, G.; Segal, E. Optical detection of E. coli Bacteria by Mesoporous Silicon Biosensors. J. Vis. Exp. 2013, 6–13. [Google Scholar]
- Massad-Ivanir, N.; Shtenberg, G.; Raz, N.; Gazenbeek, C.; Budding, D.; Bos, M.P.; Segal, E. Porous silicon-based biosensors: Towards real-time optical detection of target bacteria in the food industry. Sci. Rep. 2016, 6, 38099. [Google Scholar] [CrossRef] [PubMed]
- Massad-Ivanir, N.; Shtenberg, G.; Segal, E. Advancing nanostructured porous Si-based optical transducers for label free bacteria detection. Adv. Exp. Med. Biol. 2012, 733, 37–45. [Google Scholar]
- Tang, Y.; Li, Z.; Luo, Q.; Liu, J.; Wu, J. Bacteria detection based on its blockage effect on silicon nanopore array. Biosens. Bioelectron. 2016, 79, 715–720. [Google Scholar] [CrossRef] [PubMed]
- Zaraee, N.; Kanik, F.E.; Bhuiya, A.M.; Gong, E.S.; Geib, M.T.; Lortlar Ünlü, N.; Ozkumur, A.Y.; Dupuis, J.R.; Ünlü, M.S. Highly sensitive and label-free digital detection of whole cell E. coli with interferometric reflectance imaging. Biosens. Bioelectron. 2020, 162, 112258. [Google Scholar]
- Reardon, K.F.; Zhong, Z.; Lear, K.L. Environmental applications of photoluminescence-based biosensors. In Optical Sensor Systems in Biotechnology; Rao, G., Volume, Editor, Eds.; Springer: Berlin Heidelberg, Germany, 2009; Volume 116, pp. 99–123. [Google Scholar]
- Viter, R.; Tereshchenko, A.; Smyntyna, V.; Ogorodniichuk, J.; Starodub, N.; Yakimova, R.; Khranovskyy, V.; Ramanavicius, A. Toward development of optical biosensors based on photoluminescence of TiO2 nanoparticles for the detection of Salmonella. Sens. Actuator B 2017, 252, 95–102. [Google Scholar] [CrossRef]
- Taitt, C.R.; Shubin, Y.S.; Angel, R.; Ligler, F.S. Detection of Salmonella enterica serovar typhimurium by using a rapid, array-based immunosensor. Appl. Environ. Microbiol. 2004, 70, 152–158. [Google Scholar] [CrossRef]
- Sapsford, K.E.; Rasooly, A.; Taitt, C.R.; Ligler, F.S. Detection of Campylobacter and Shigella Species in Food Samples Using an Array Biosensor. Analytical Chemistry 2004, 76, 433–440. [Google Scholar] [CrossRef]
- Sapsford, K.E.; Ngundi, M.M.; Moore, M.H.; Lassman, M.E.; Shriver-Lake, L.C.; Taitt, C.R.; Ligler, F.S. Rapid detection of foodborne contaminants using an array biosensor. Sens. Actuators B 2006, 113, 599–607. [Google Scholar] [CrossRef]
- Shriver-Lake, L.C.; Turner, S.; Taitt, C.R. Rapid detection of Escherichia coli O157:H7 spiked into food matrices. Anal. Chim. Acta 2007, 584, 66–71. [Google Scholar] [CrossRef]
- Dehghani, Z.; Mohammadnejad, J.; Hosseini, M.; Bakhshi, B.; Rezayan, A.H. Whole cell FRET immunosensor based on graphene oxide and graphene dot for Campylobacter jejuni detection. Food Chem. 2020, 309, 125690. [Google Scholar] [CrossRef] [PubMed]
- Wang, Z.; Zong, S.; Wu, L.; Zhu, D.; Cui, Y. SERS-activated platforms for immunoassay: Probes, encoding methods, and applications. Chem. Rev. 2017, 117, 7910–7963. [Google Scholar] [CrossRef] [PubMed]
- Mosier-Boss, P.A. Review on SERS of bacteria. Biosensors 2017, 7, 51. [Google Scholar] [CrossRef] [PubMed]
- Zhou, X.; Hu, Z.; Yang, D.; Xie, S.; Jiang, Z.; Niessner, R.; Haisch, C.; Zhou, H.; Sun, P. Bacteria detection: From powerful SERS to its advanced compatible techniques. Adv. Science 2020, 7, 2001739. [Google Scholar] [CrossRef]
- Qu, L.L.; Ying, Y.L.; Yu, R.J.; Long, Y.T. In situ food-borne pathogen sensors in a nanoconfined space by surface enhanced Raman scattering. Microchim. Acta 2021, 188, 201. [Google Scholar] [CrossRef] [PubMed]
- Xie, X.; Pu, H.; Sun, D.W. Recent advances in nanofabrication techniques for SERS substrates and their applications in food safety analysis. Crit. Rev. Food Sci. Nutr. 2018, 58, 2800–2813. [Google Scholar] [CrossRef]
- Knauer, M.; Ivleva, N.P.; Liu, X.; Niessner, R.; Haisch, C. Surface-enhanced Raman scattering-based label-free microarray readout for the detection of microorganisms. Anal. Chem. 2010, 82, 2766–2772. [Google Scholar] [CrossRef]
- Knauer, M.; Ivleva, N.P.; Niessner, R.; Haisch, C. A flow-through microarray cell for the online SERS detection of antibody-captured E. coli bacteria. Anal. Bioanal. Chem. 2012, 402, 2663–2667. [Google Scholar] [CrossRef]
- Cho, I.H.; Bhandari, P.; Patel, P.; Irudayaraj, J. Membrane filter-assisted surface enhanced Raman spectroscopy for the rapid detection of E. coli O157:H7 in ground beef. Biosens. Bioelectron. 2015, 64, 171–176. [Google Scholar] [CrossRef]
- Bai, X.; Shen, A.; Hu, J. A sensitive SERS-based sandwich immunoassay platform for simultaneous multiple detection of foodborne pathogens without interference. Anal. Method 2020, 12, 4885–4891. [Google Scholar] [CrossRef]
- Najafi, R.; Mukherjee, S.; Hudson, J.; Sharma, A.; Banerjee, P. Development of a rapid capture-cum-detection method for Escherichia coli O157 from apple juice comprising nano-immunomagnetic separation in tandem with surface enhanced Raman scattering. Int. J. Food Microbiol. 2014, 189, 89–97. [Google Scholar] [CrossRef] [PubMed]
- Kearns, H.; Goodacre, R.; Jamieson, L.E.; Graham, D.; Faulds, K. SERS detection of multiple antimicrobial-resistant pathogens using nanosensors. Anal. Chem. 2017, 89, 12666–12673. [Google Scholar] [CrossRef] [PubMed]
- Wang, J.; Wu, X.; Wang, C.; Rong, Z.; Ding, H.; Li, H.; Li, S.; Shao, N.; Dong, P.; Xiao, R.; Wang, S.-Q. Facile synthesis of Au-coated magnetic nanoparticles and their application in bacteria detection via a SERS method. ACS Appl. Mater. Interface 2016, 8, 19958–19967. [Google Scholar] [CrossRef] [PubMed]
- Tamer, U.; Boyaci, I.H.; Temur, E.; Zengin, A.; Dincer, I.; Elerman, Y. Fabrication of magnetic gold nanorod particles for immunomagnetic separation and SERS application. J. Nanopart. Res. 2011, 13, 3167–3176. [Google Scholar] [CrossRef]
- Temur, E.; Boyaci, I.H.; Tamer, U.; Unsal, H.; Aydogan, N. A Highly Sensitive detection platform based on surface-enhanced Raman scattering for Escherichia coli enumeration. Ana.l Bioanal. Chem. 2010, 397, 1595–1604. [Google Scholar] [CrossRef]
- Guven, B.; Basaran-Akgul, N.; Temur, E.; Tamer, U.; Boyaci, I.H. SERS-based sandwich immunoassay using antibody coated magnetic nanoparticles for Escherichia coli enumeration. Analyst 2011, 136, 740–748. [Google Scholar] [CrossRef]
- Lin, H.Y.; Huang, C.H.; Hsieh, W.H.; Liu, L.H.; Lin, Y.C.; Chu, C.C.; Wang, S.T.; Kuo, I.T.; Chau, L.K.; Yang, C.Y. On-line SERS detection of single bacterium using novel SERS nanoprobes and a microfluidic dielectrophoresis device. Small 2014, 10, 4700–4710. [Google Scholar] [CrossRef]
- Wu, Z. Simultaneous detection of Listeria monocytogenes and Salmonella typhimurium by a SERS-based lateral flow immunochromatographic assay. Food Anal. Method 2019, 12, 1086–1091. [Google Scholar] [CrossRef]
- Liu, H.-B; Du, X.-J.; Zang, Y.-X.; Li, P.; Wang, S. SERS-based lateral flow strip biosensor for simultaneous detection of Listeria monocytogenes and Salmonella enterica serotype enteritidis. J. Agr. Food Chem. 2017, 65, 10290–10299. [Google Scholar] [CrossRef]
- Liu, H.-B.; Chen, C.-Y.; Zhang, C.-N.; Du, X.-J.; Li, P.; Wang, S. Functionalized AuMBA@Ag nanoparticles as an optical and SERS dual probe in a lateral flow strip for the quantitative detection of Escherichia coli O157:H7. J. Food Sci. 2019, 84, 2916–2924. [Google Scholar] [CrossRef]
Figure 1.
(a) Schematic of a biosensor. (b) The different categories of biosensors.
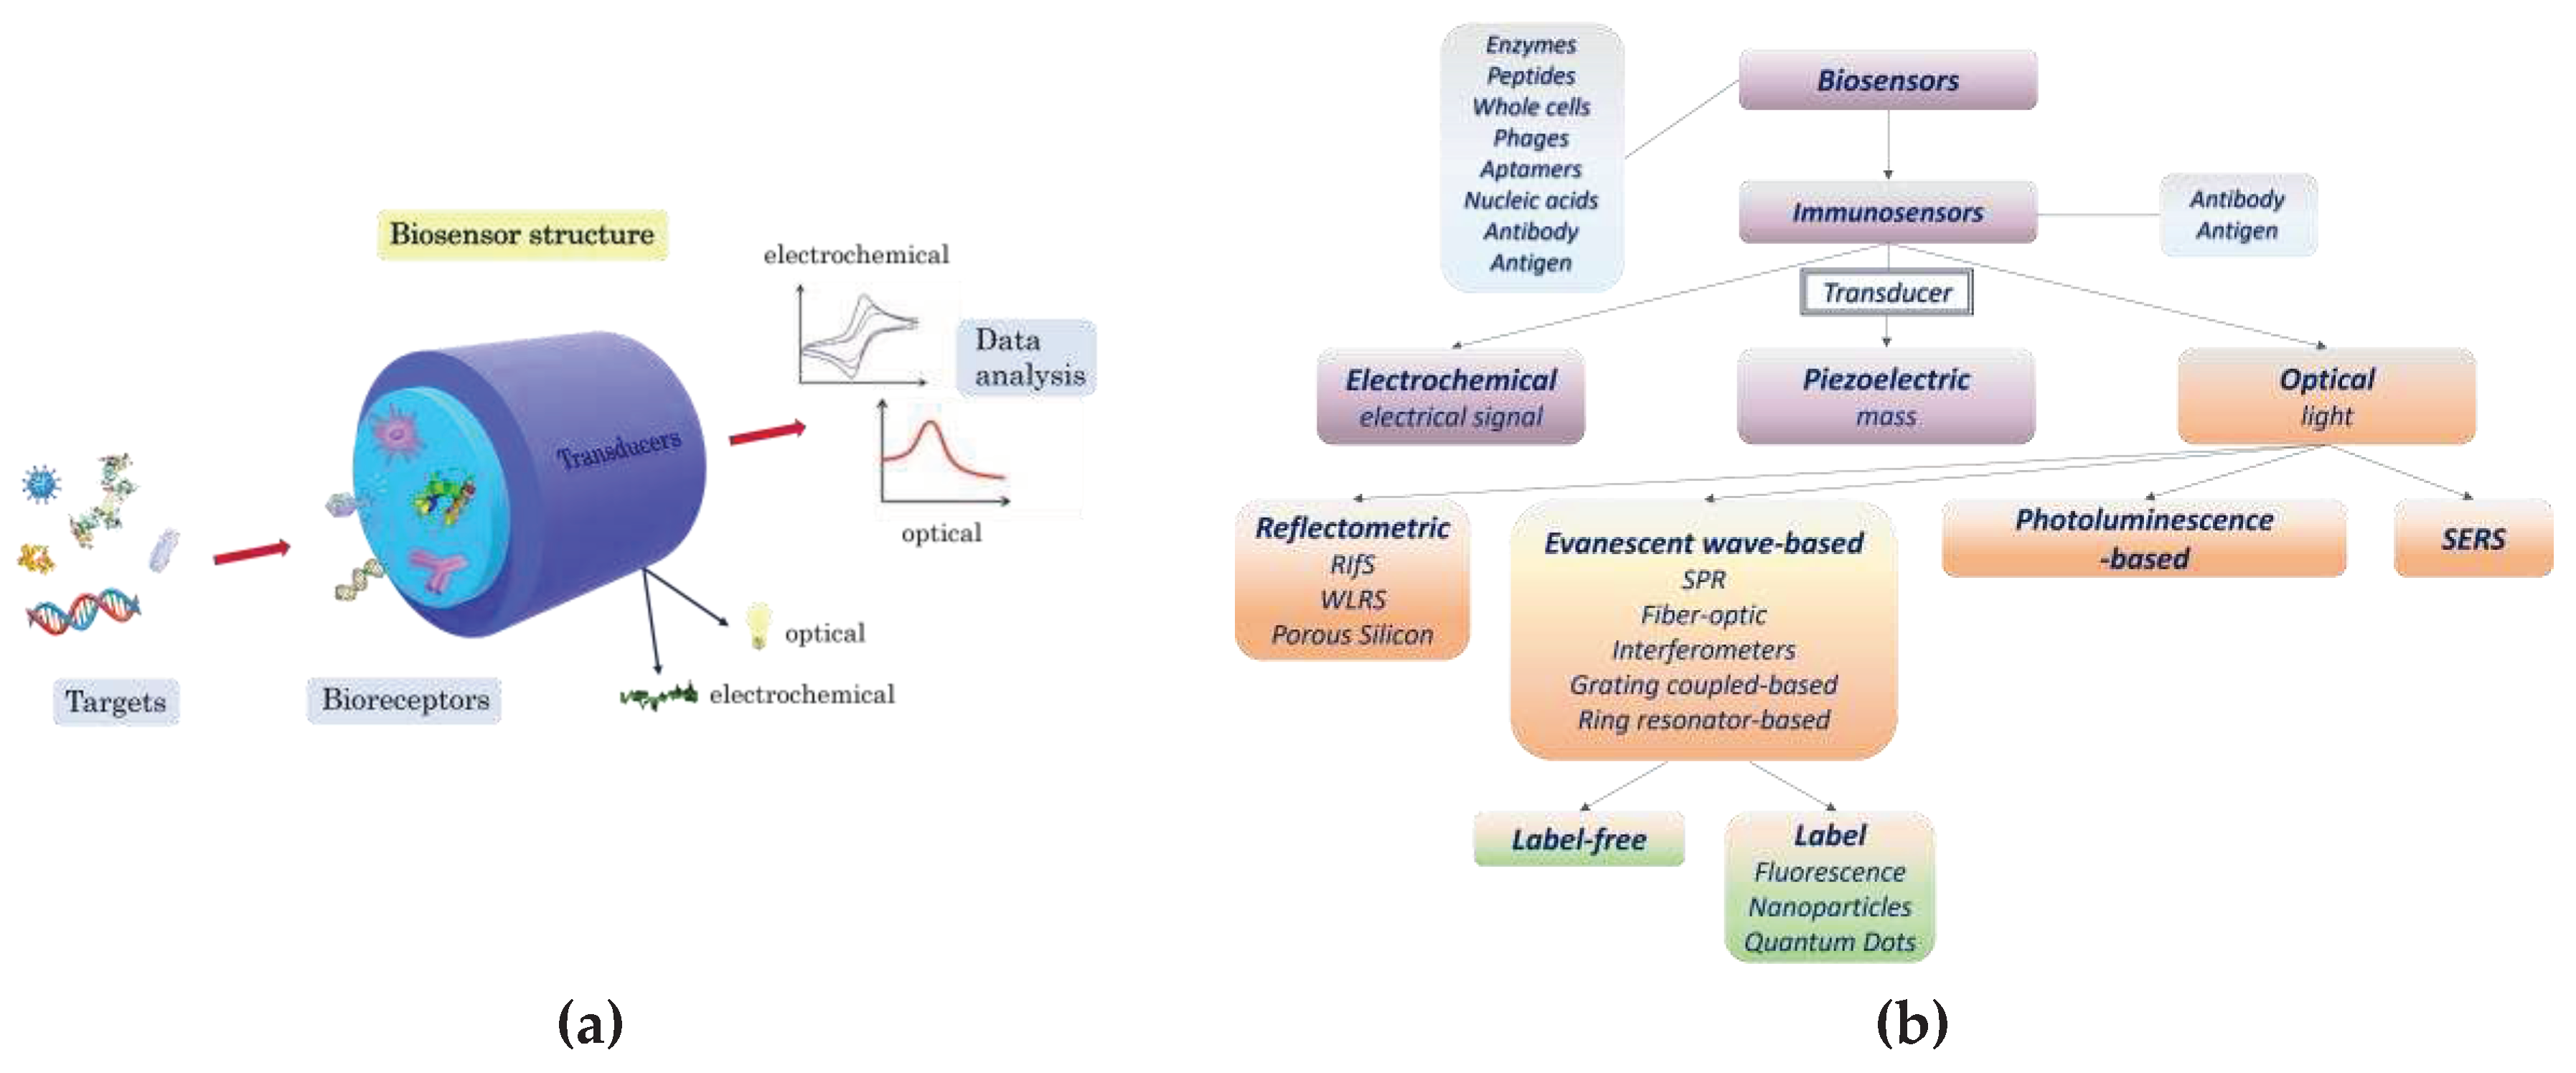
Figure 2.
Schematic presentation of different immunoassay formats applied to optical immunosensors.
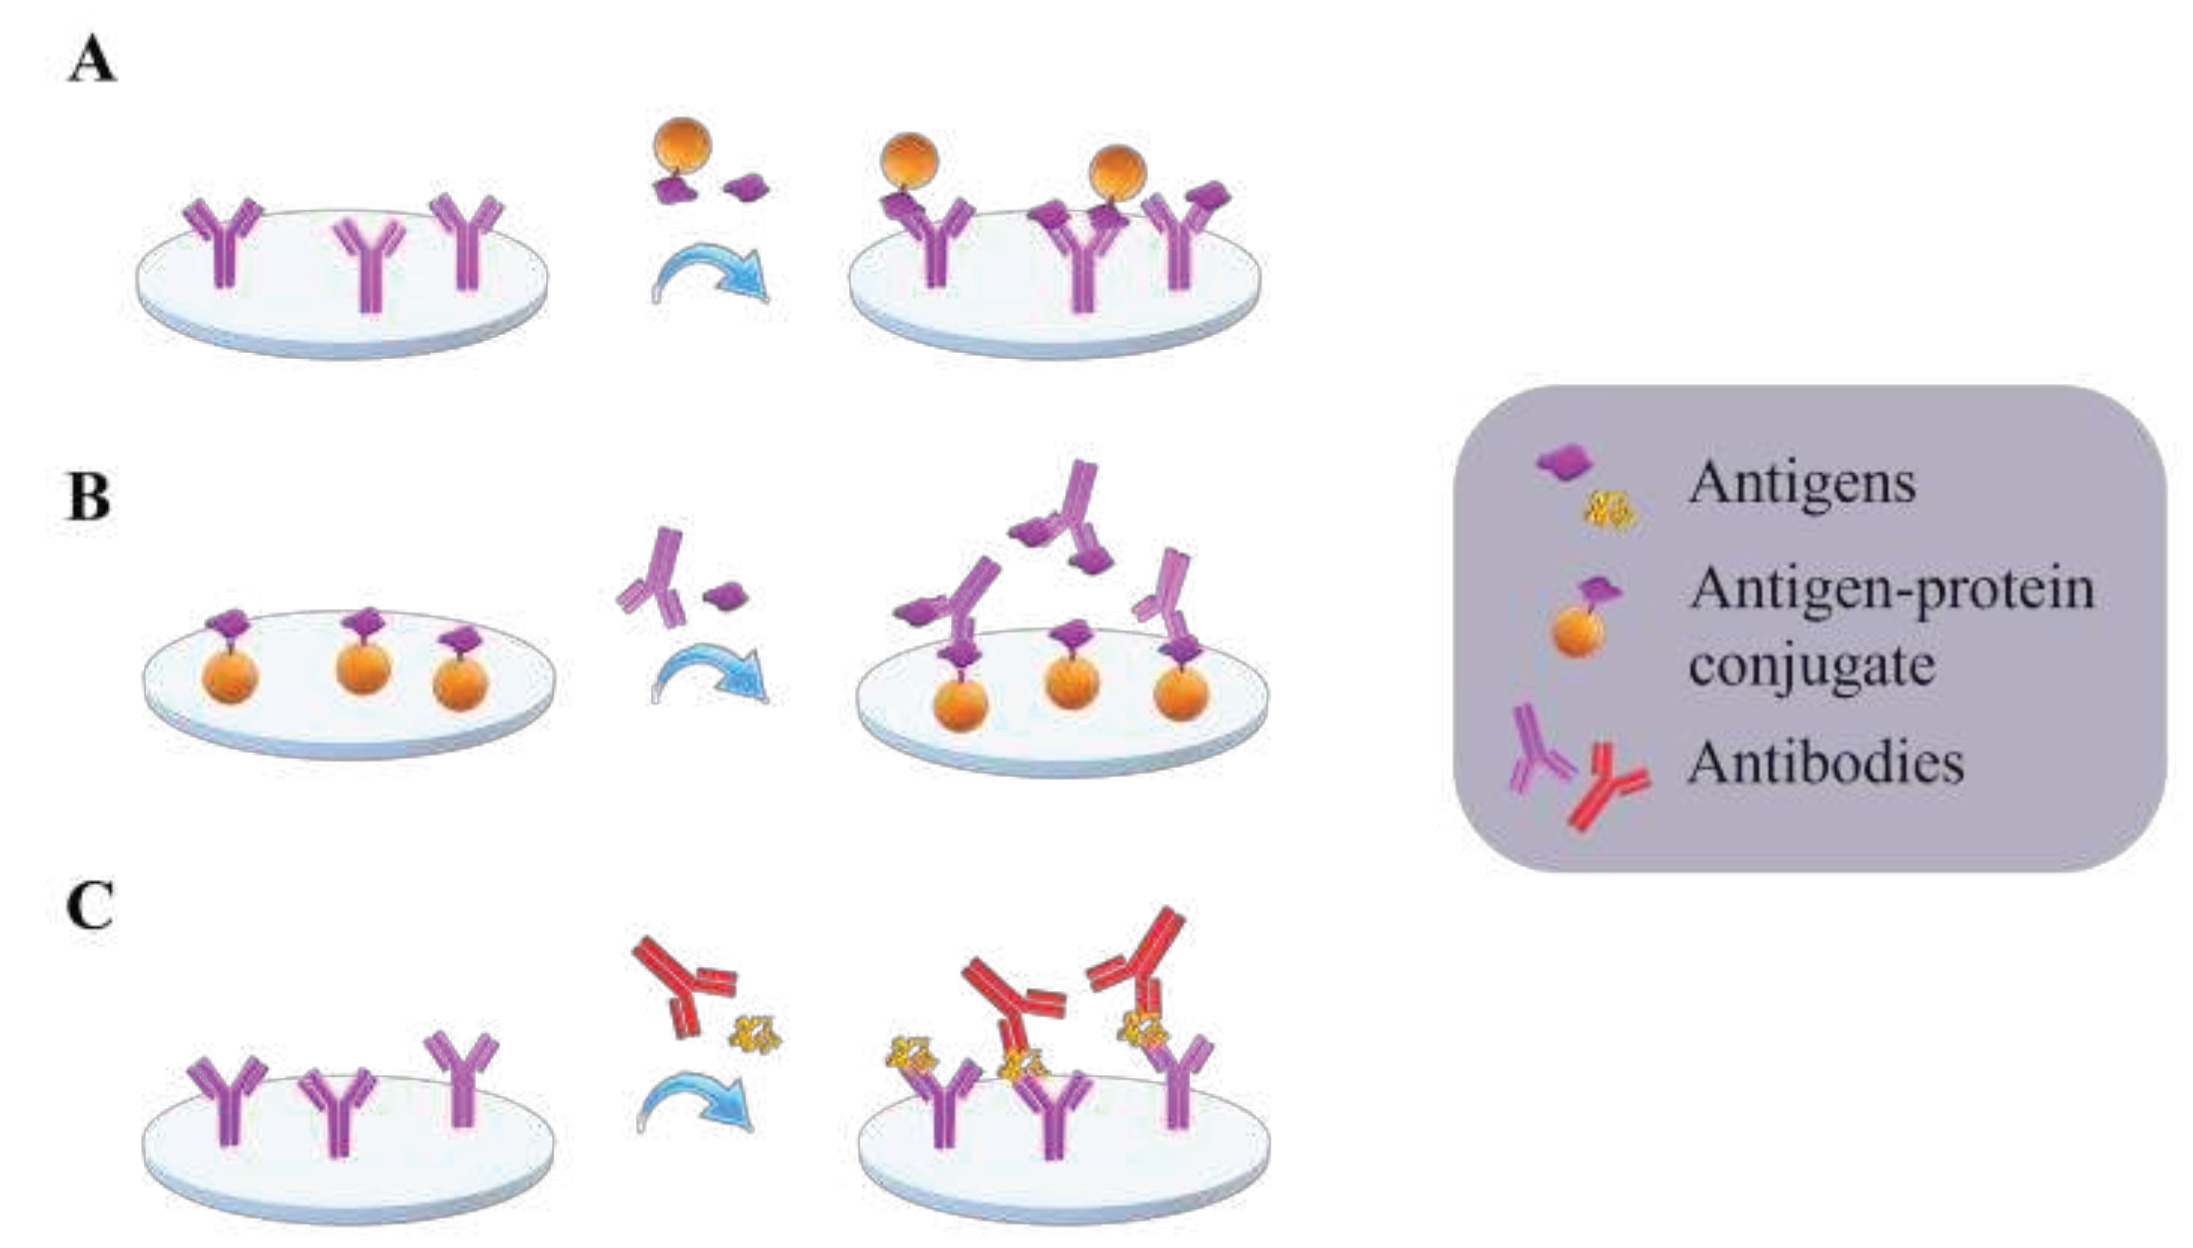
Figure 3.
Schematic of the evanescent field sensing principle.
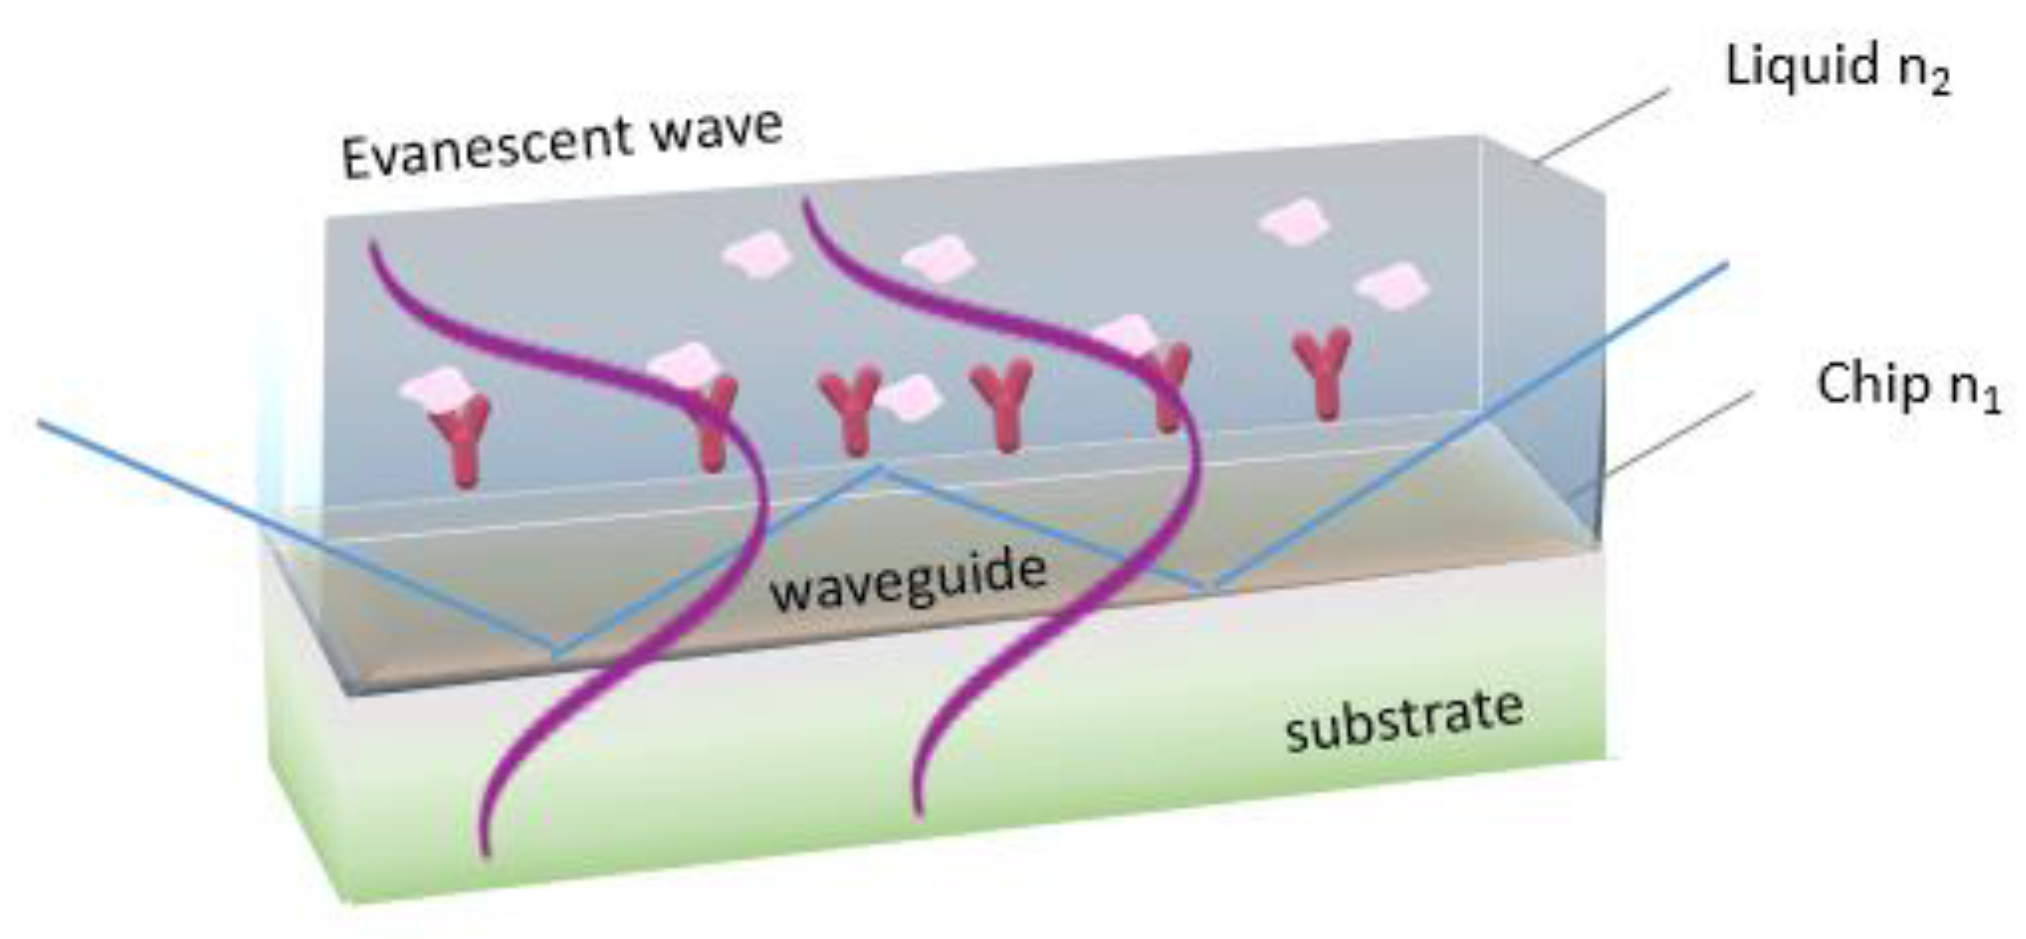
Figure 4.
Schematic presentation of basic conformations of refractometric label-free optical transducers including SPR and localized SPR, grating coupler waveguides, interferometers, ring resonators, and photonic crystals.
Figure 4.
Schematic presentation of basic conformations of refractometric label-free optical transducers including SPR and localized SPR, grating coupler waveguides, interferometers, ring resonators, and photonic crystals.
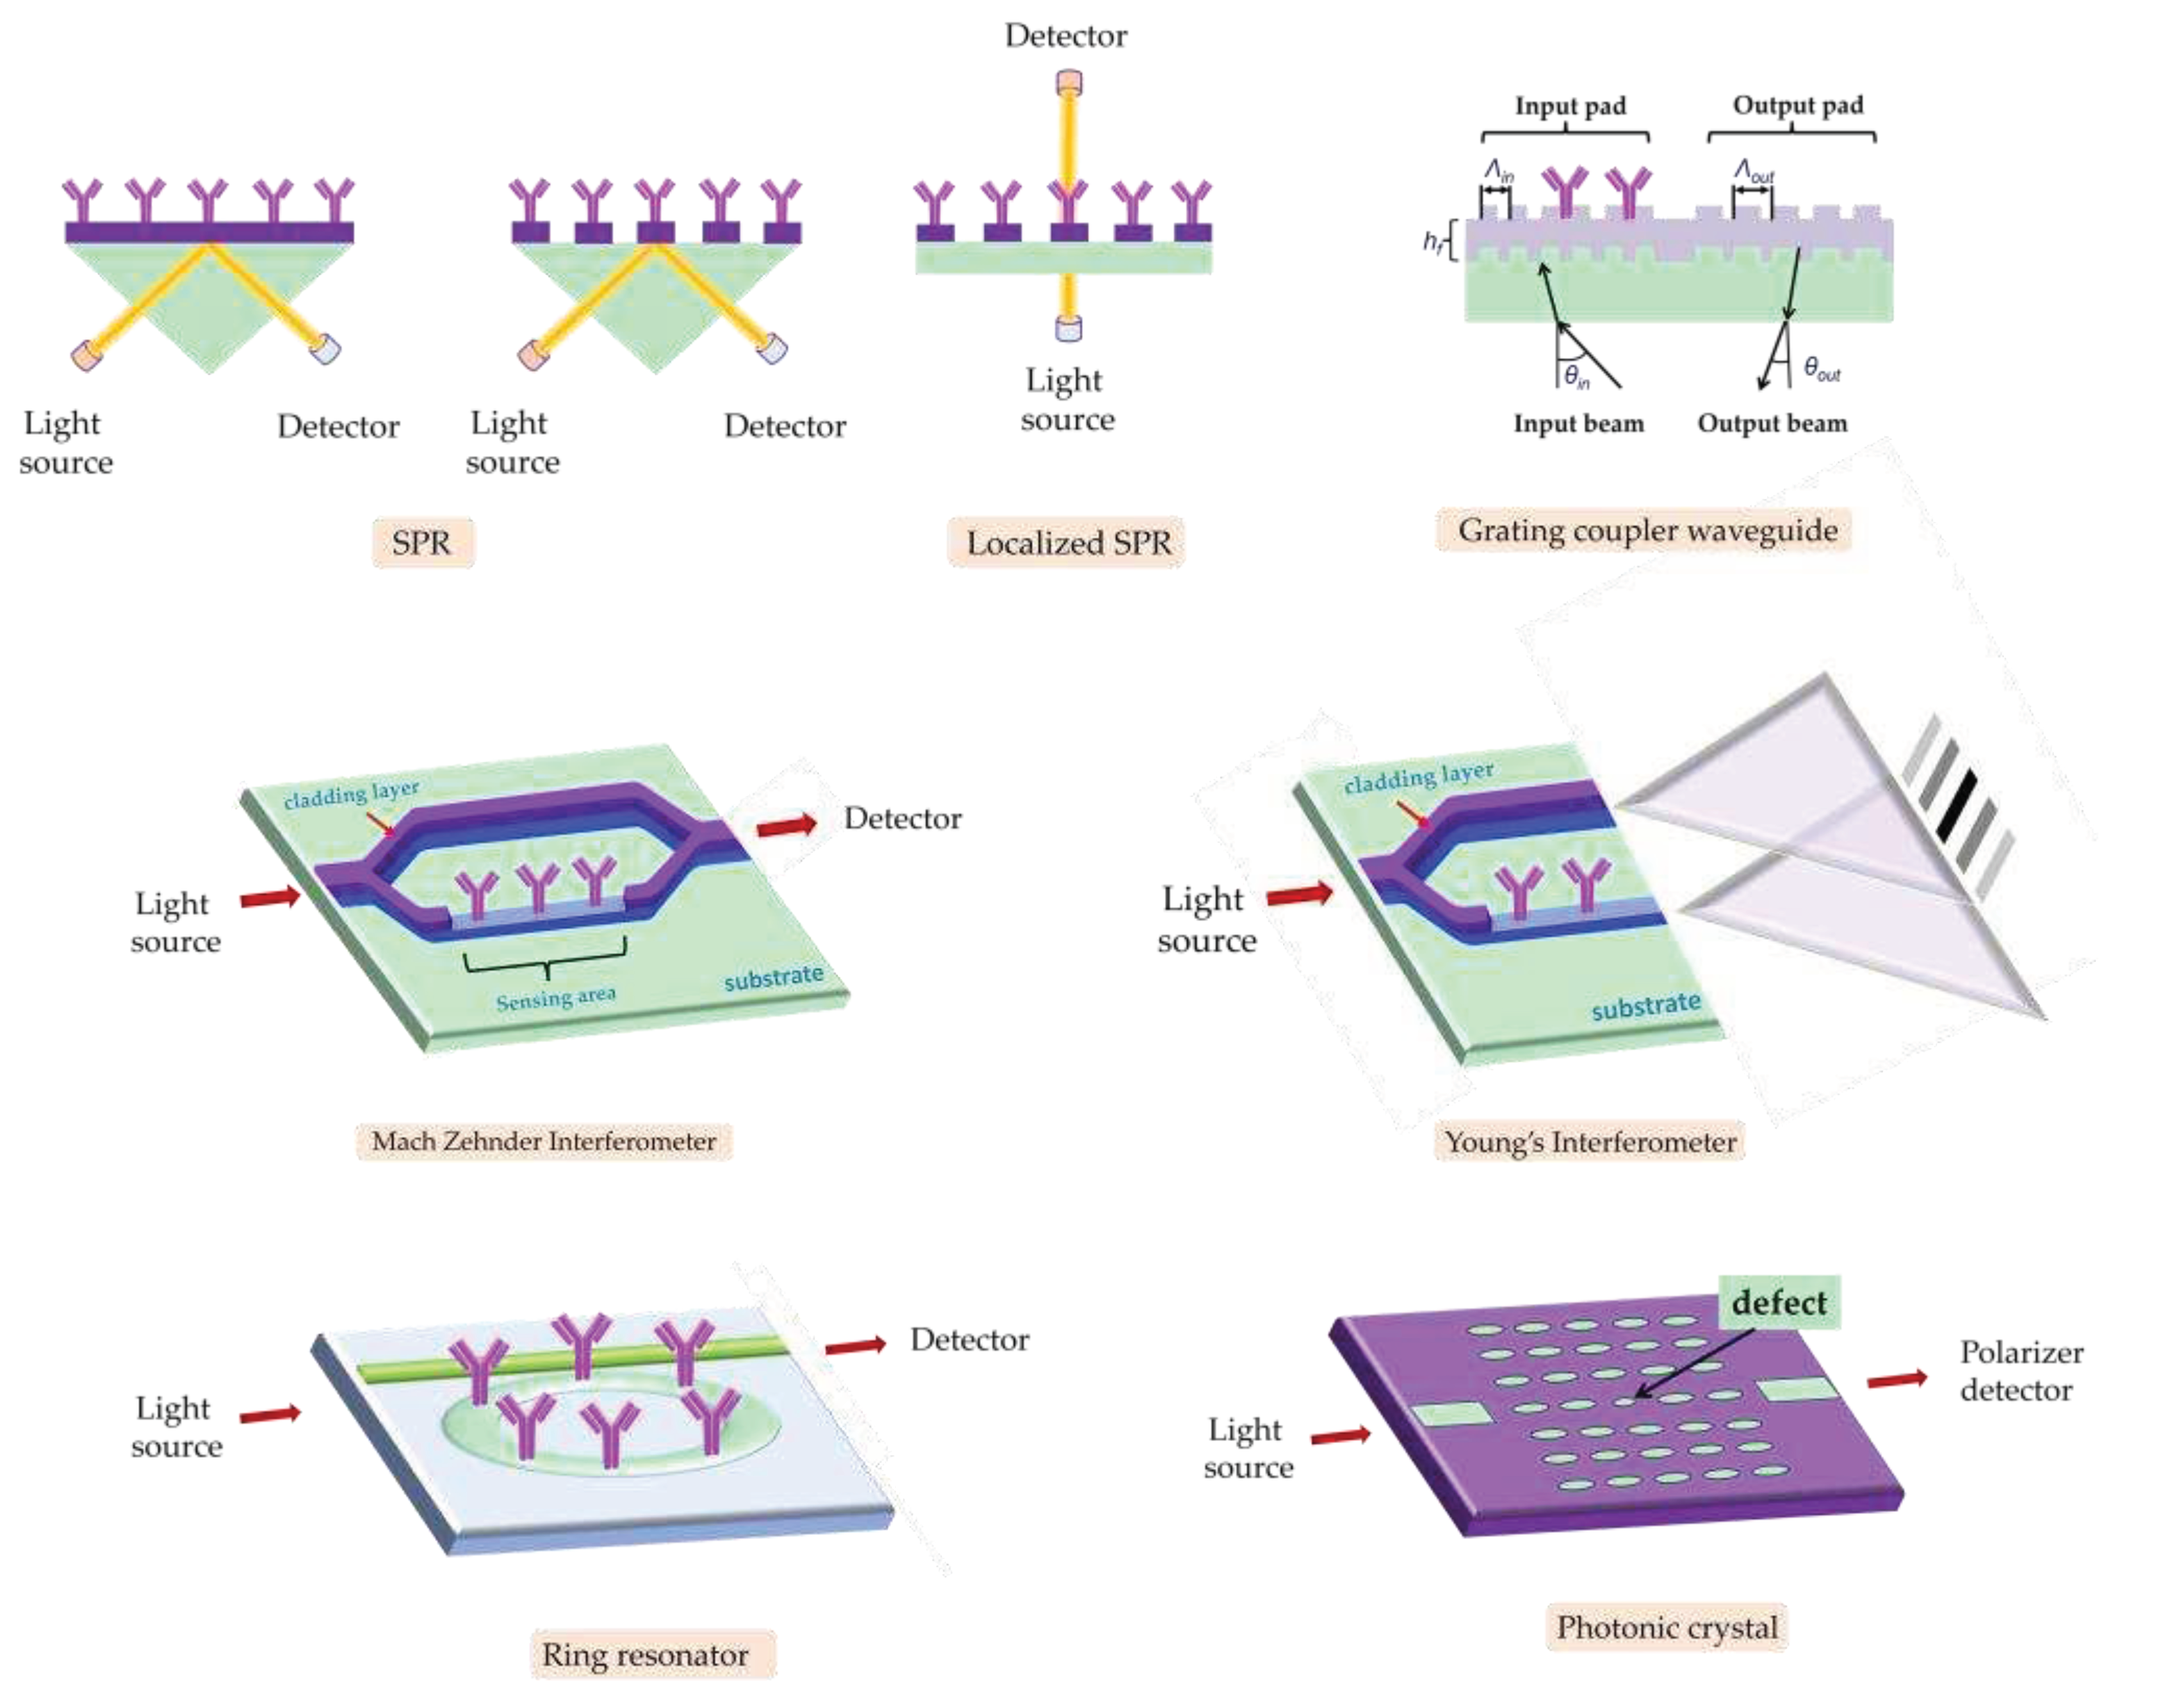
Figure 5.
SPR response during the binding of a bacteria-specific antibody onto the biosensor surface followed by capturing of bacteria to the immobilized antibody.
Figure 5.
SPR response during the binding of a bacteria-specific antibody onto the biosensor surface followed by capturing of bacteria to the immobilized antibody.
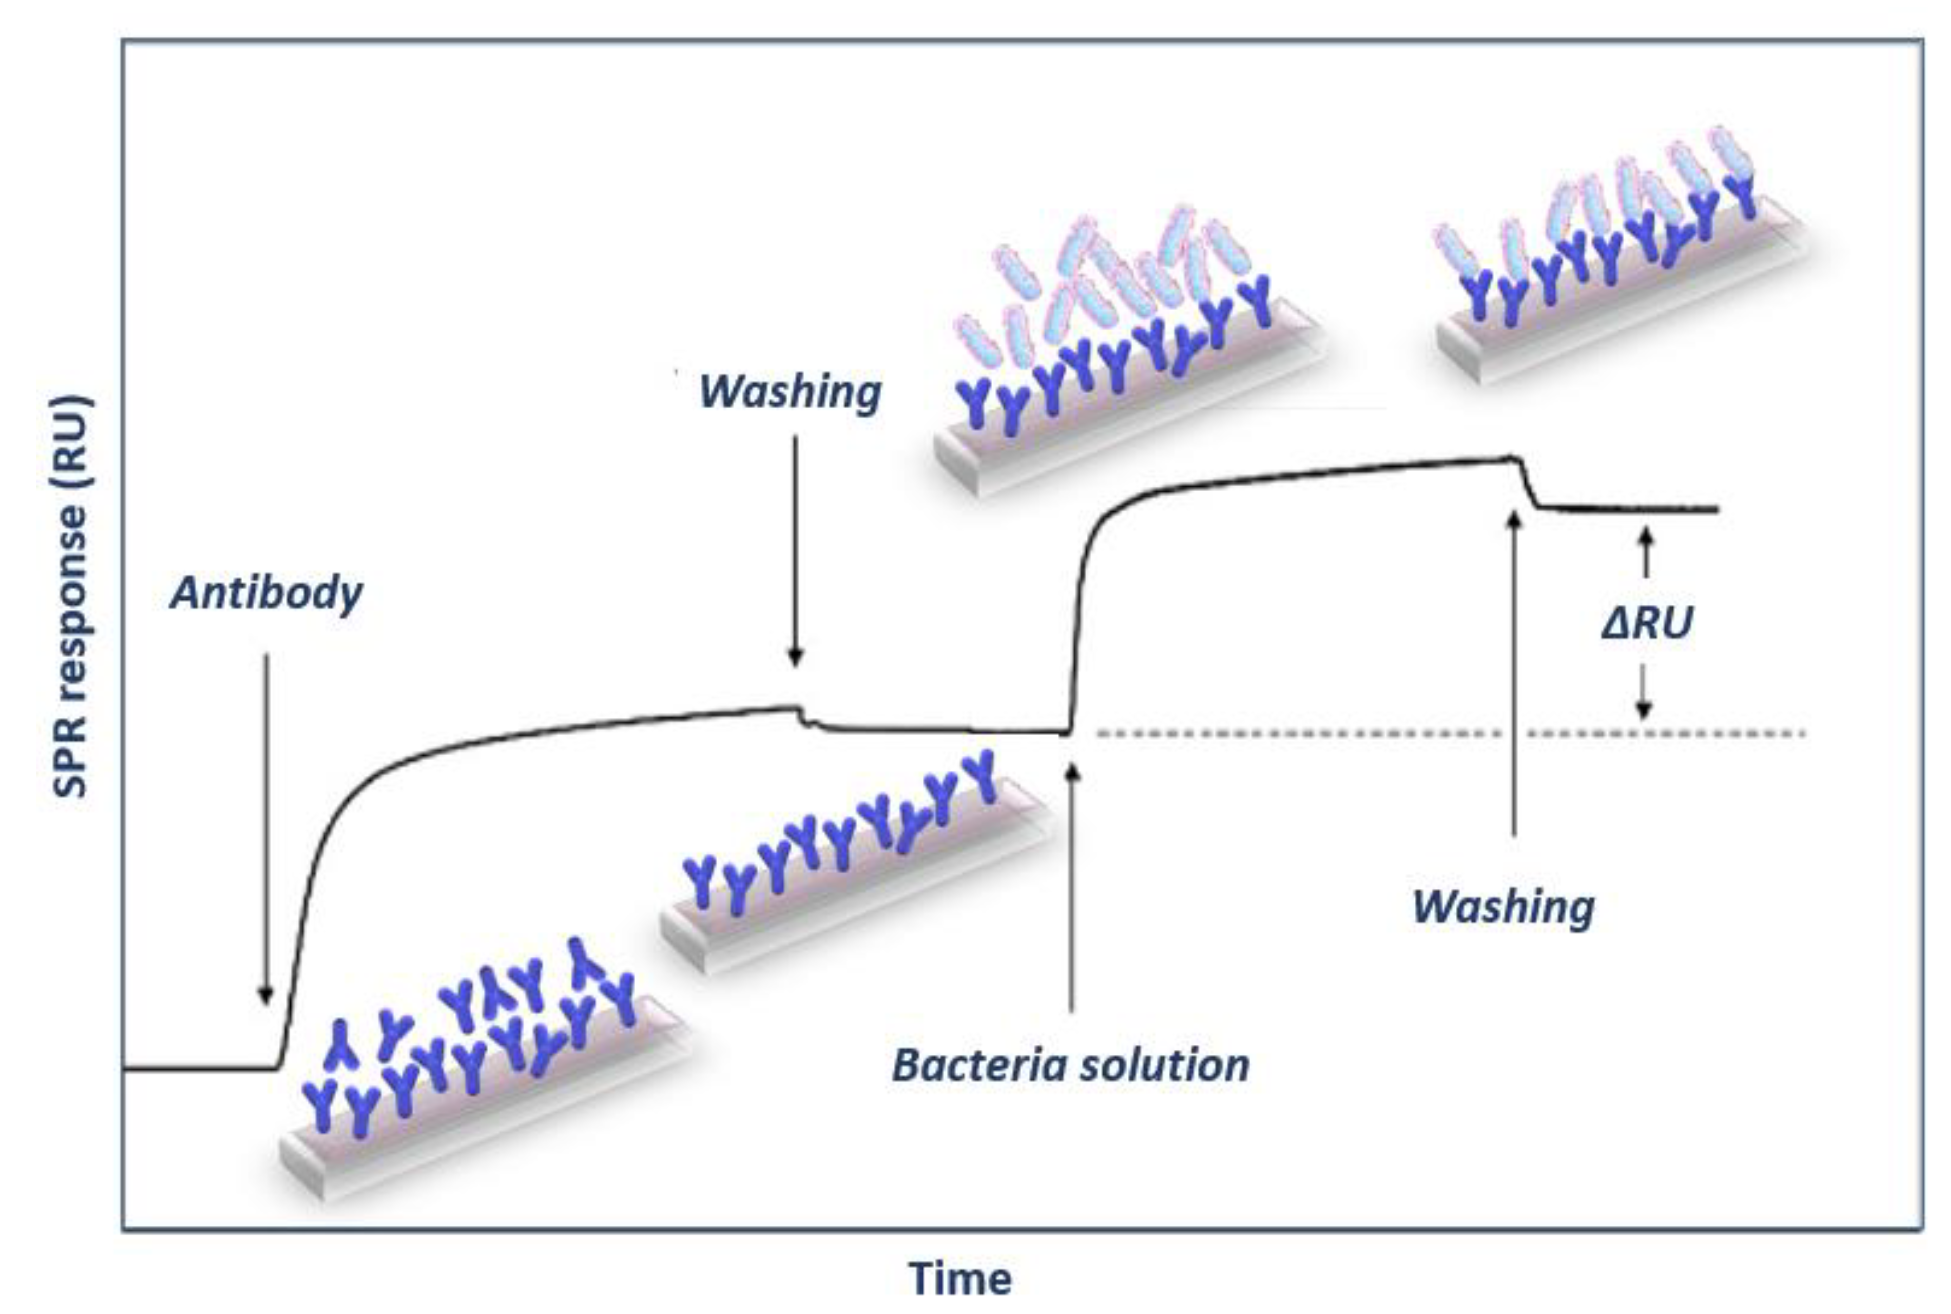
Figure 6.
Schematic of resolution-optimized prism-based SPR imaging apparatus [92]. Copyright 2019. Reproduced with permission from the Royal Society of Chemistry.
Figure 6.
Schematic of resolution-optimized prism-based SPR imaging apparatus [92]. Copyright 2019. Reproduced with permission from the Royal Society of Chemistry.
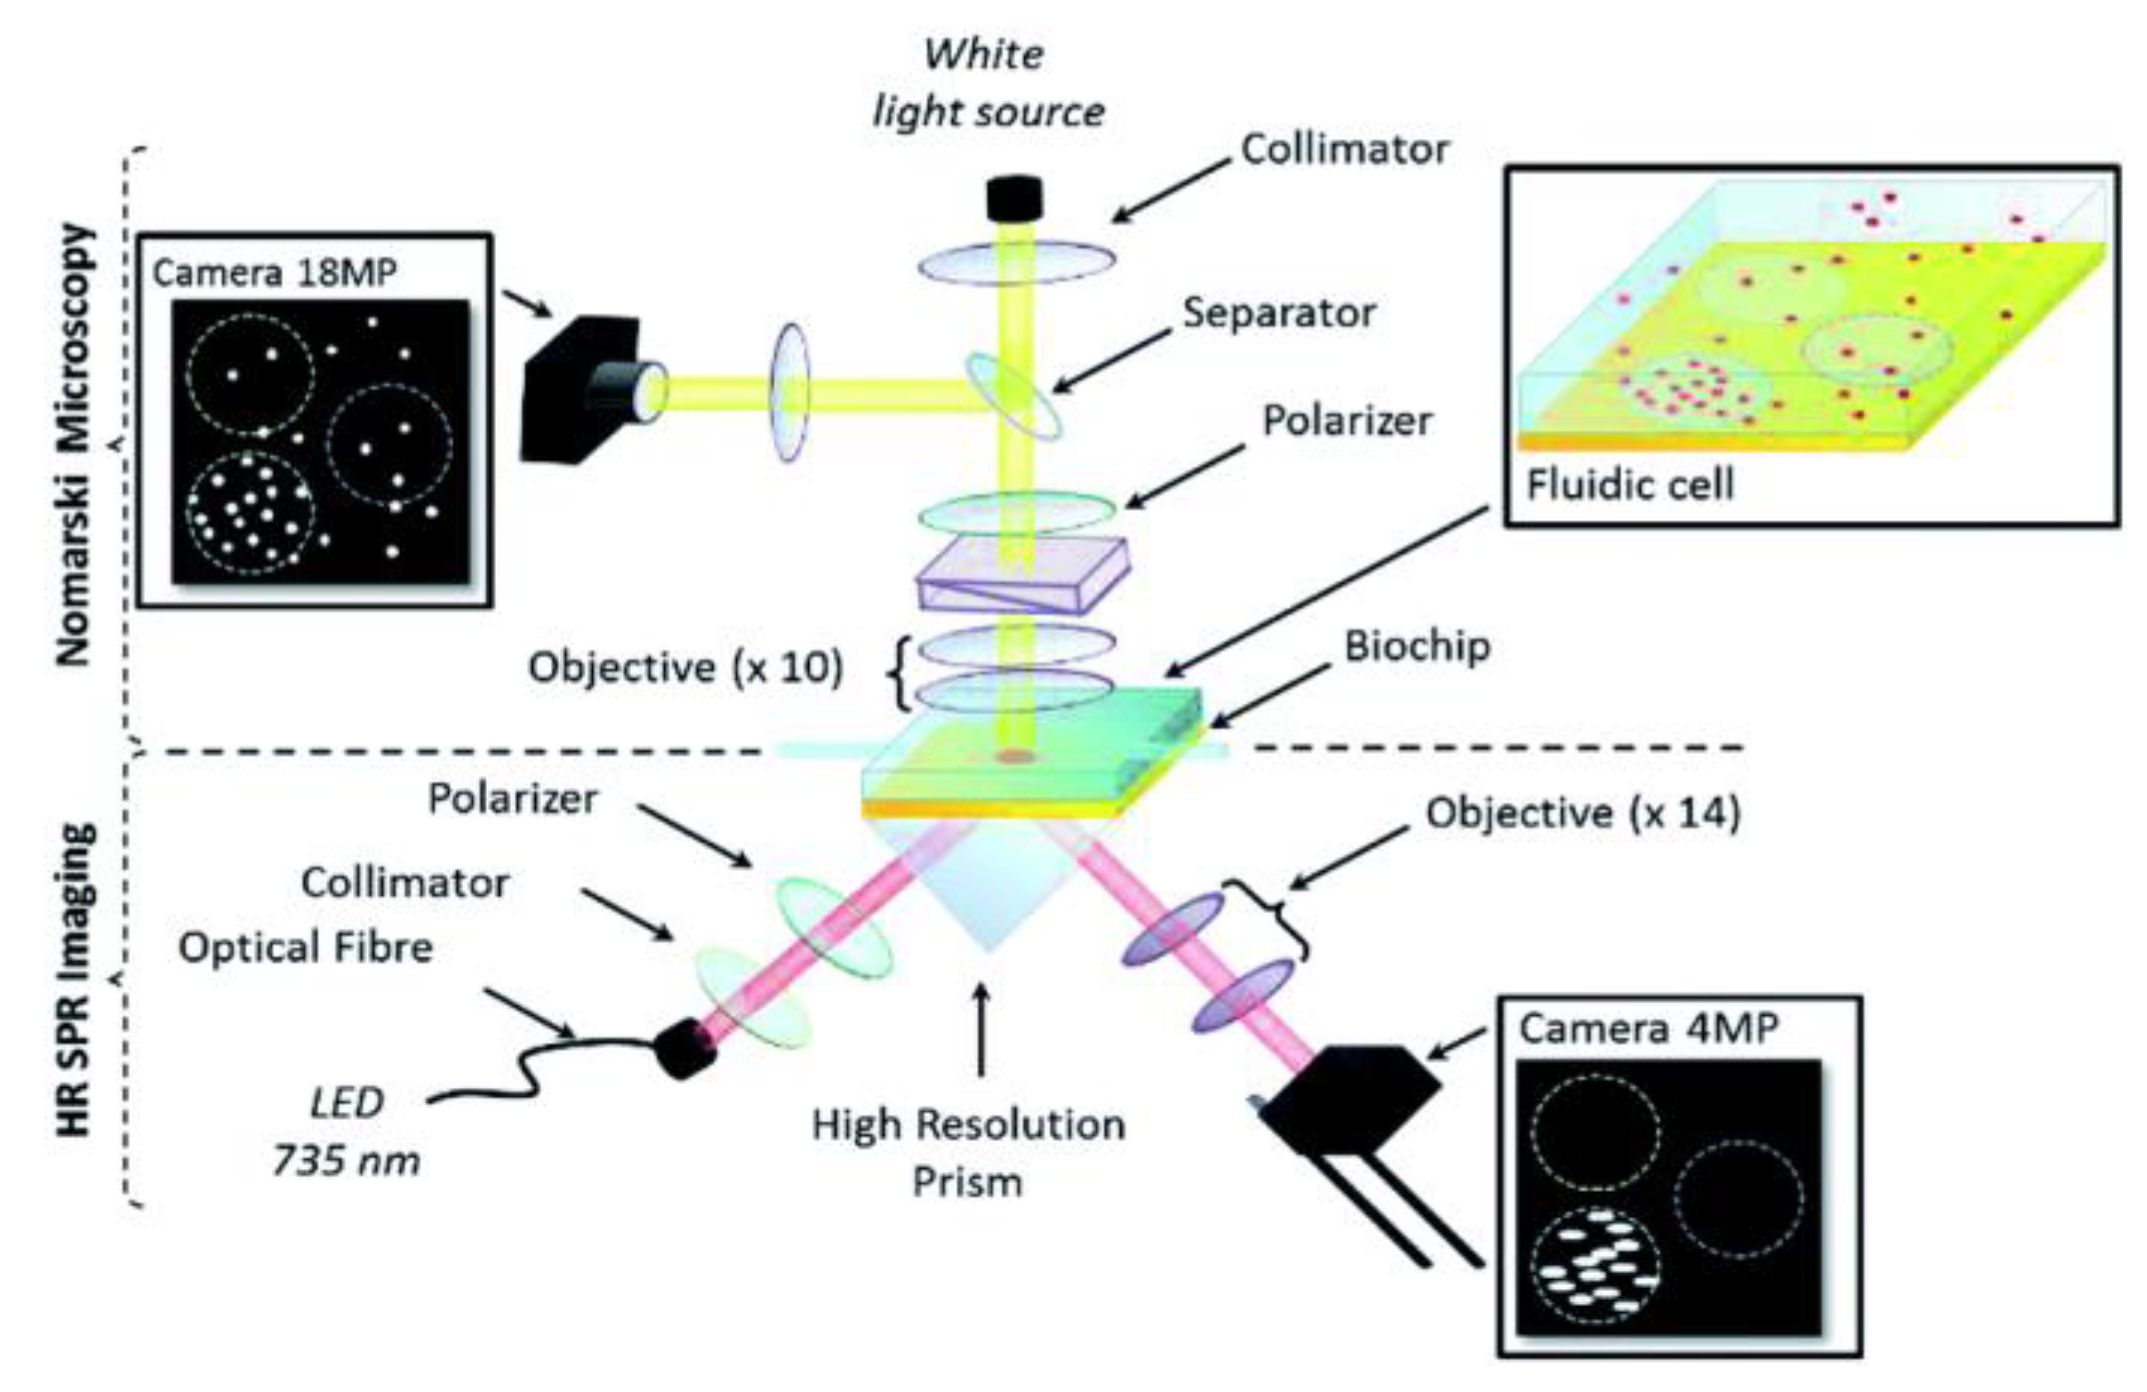
Figure 7.
Main configurations of fiber optic sensors: (a) de-cladded optical fiber, (b) tapered optical fiber, (c) tapered tip and (d) U-shape optical fiber probe.
Figure 7.
Main configurations of fiber optic sensors: (a) de-cladded optical fiber, (b) tapered optical fiber, (c) tapered tip and (d) U-shape optical fiber probe.
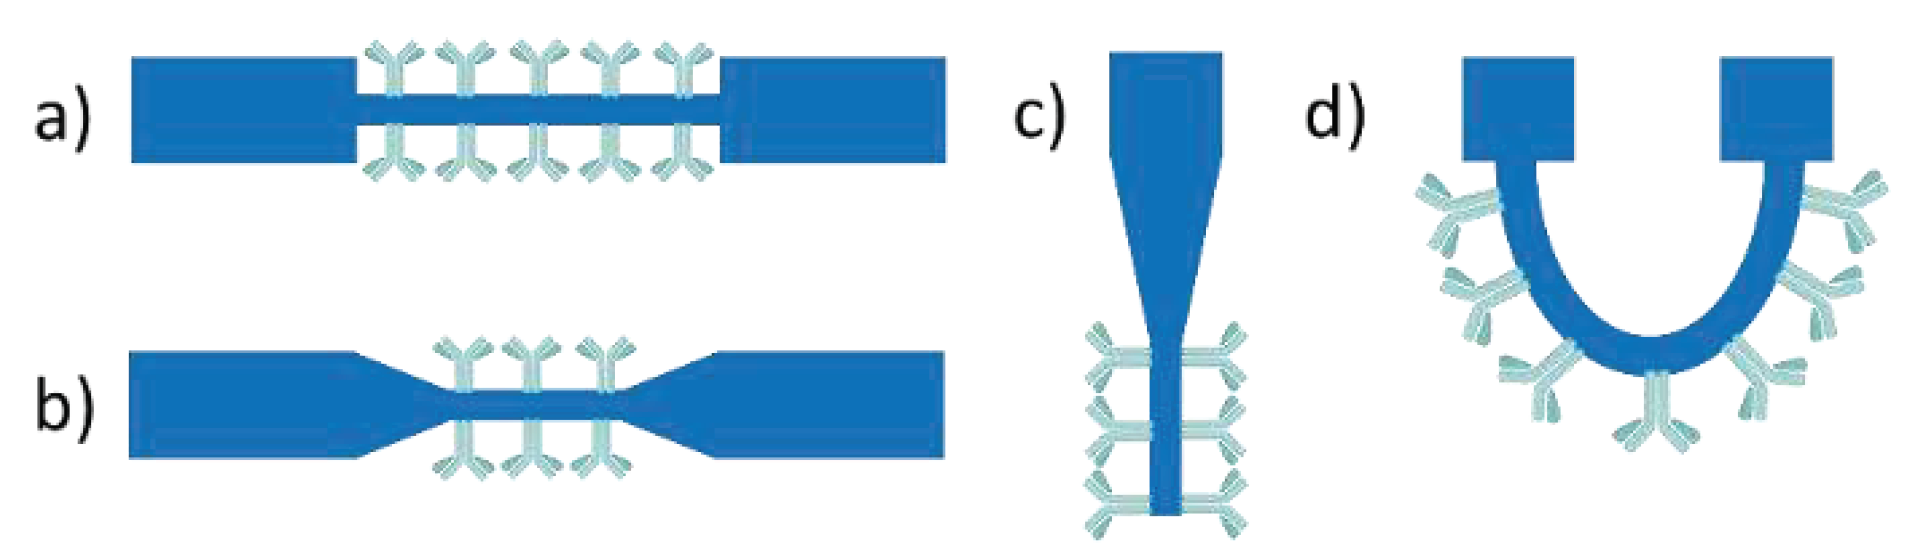
Figure 8.
The operation of an interferometric immunosensor is based on the specific binding of the target molecule or bacteria to the antibody modified sensing arm of the interferometer. When the targeted analyte binds to the surface, a refractive index change takes place, resulting in phase difference between the propagating mode in the sensing and reference arm, leading in a light intensity change at the output [127]. Copyright 2015. Reproduced with permission from De Gruyter.
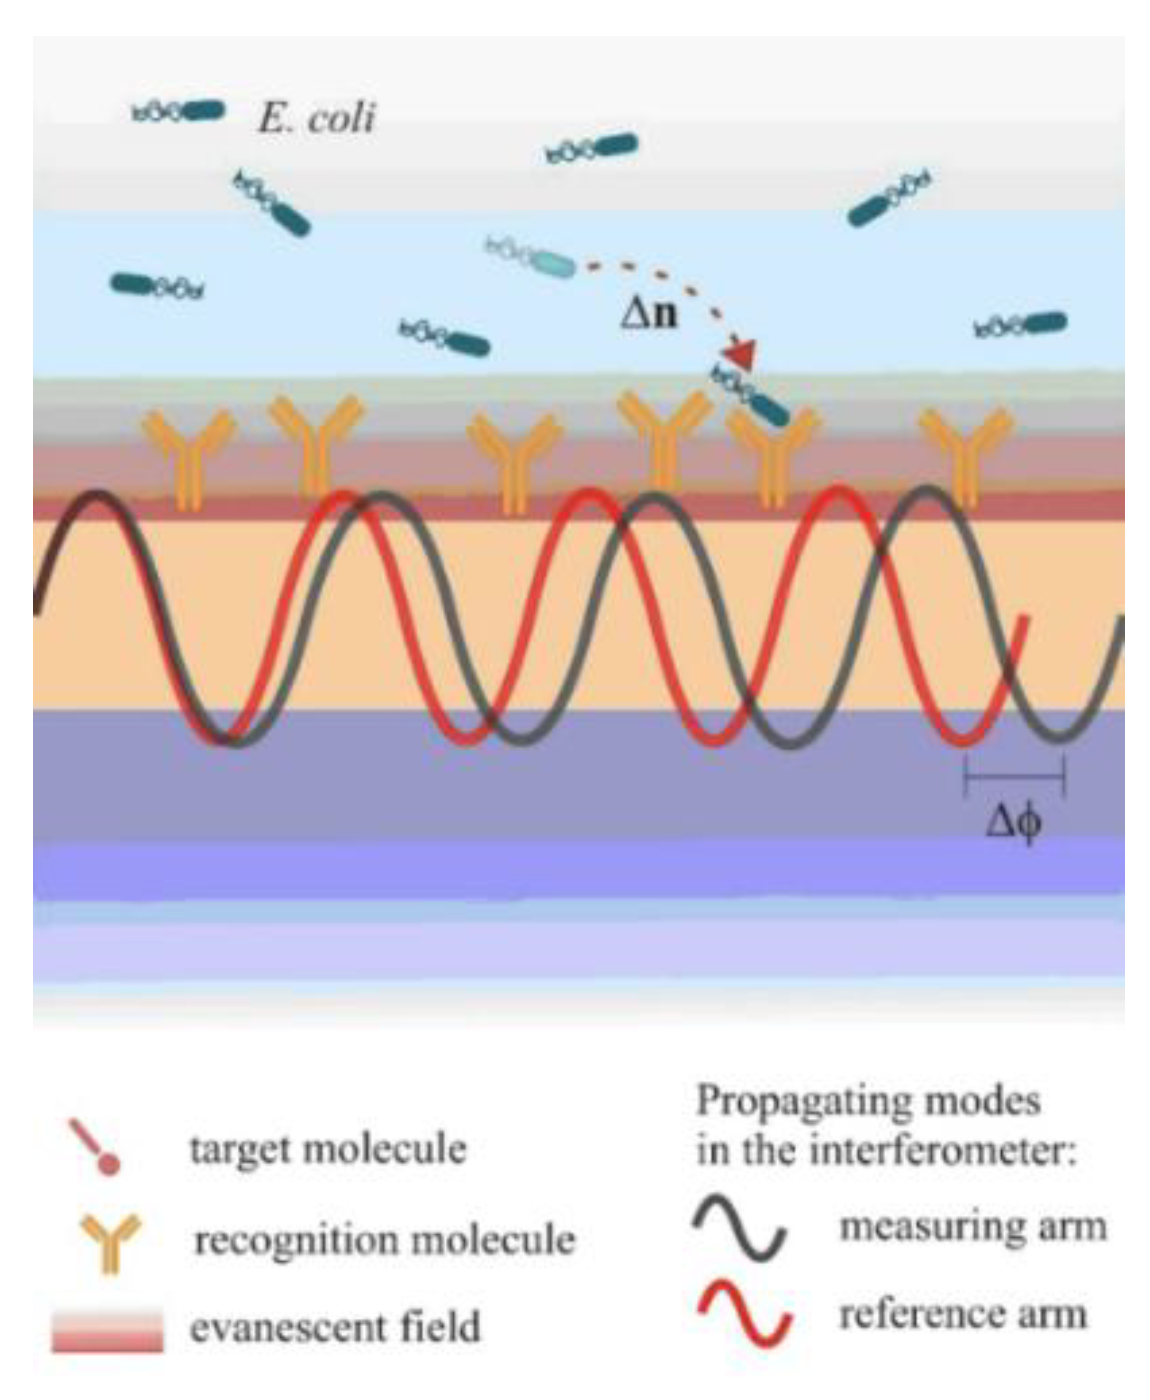
Figure 9.
Scanning electron micrographs of a small section of test and control micro-rings on a resonator chip, showing specific bacterial binding at 2200x magnification [152]. Copyright 2007. Reproduced with permission from Elsevier B.V.
Figure 9.
Scanning electron micrographs of a small section of test and control micro-rings on a resonator chip, showing specific bacterial binding at 2200x magnification [152]. Copyright 2007. Reproduced with permission from Elsevier B.V.
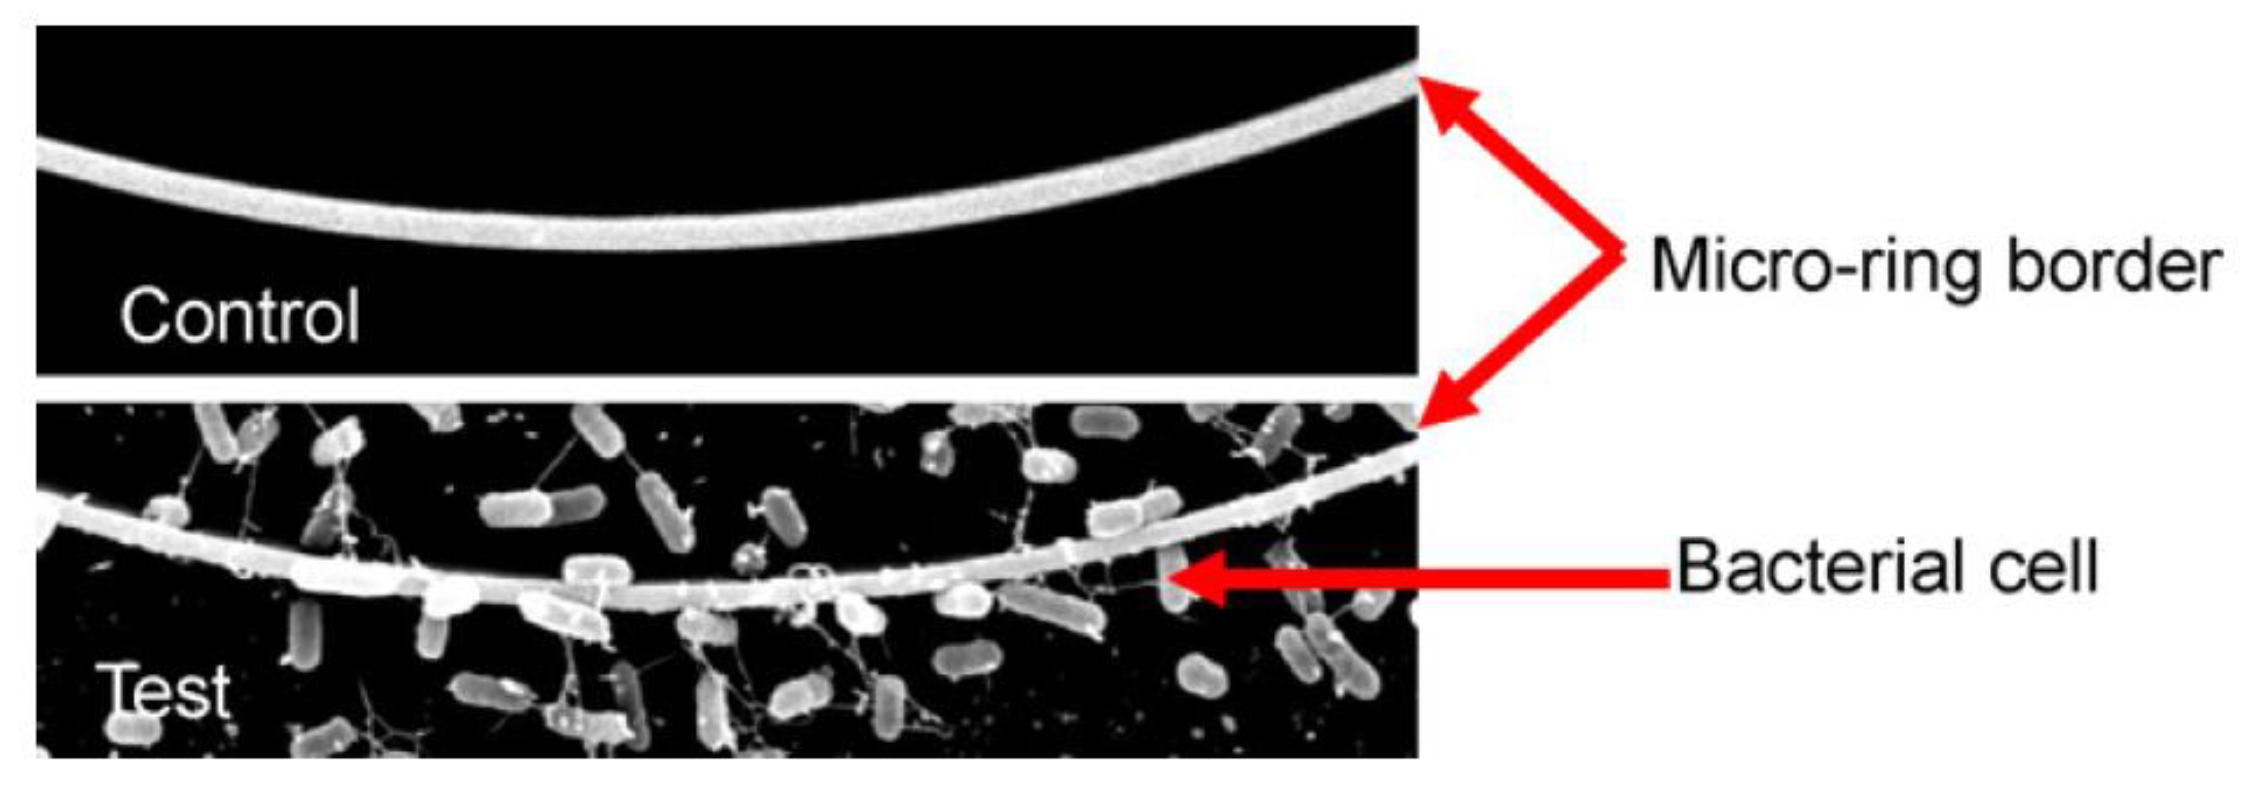
Figure 10.
Illustration of the white light reflectance spectroscopy (WLRS) optical setup and sensing principle [155]. Copyright 2021. Reproduced with permission from MDPI.
Figure 10.
Illustration of the white light reflectance spectroscopy (WLRS) optical setup and sensing principle [155]. Copyright 2021. Reproduced with permission from MDPI.
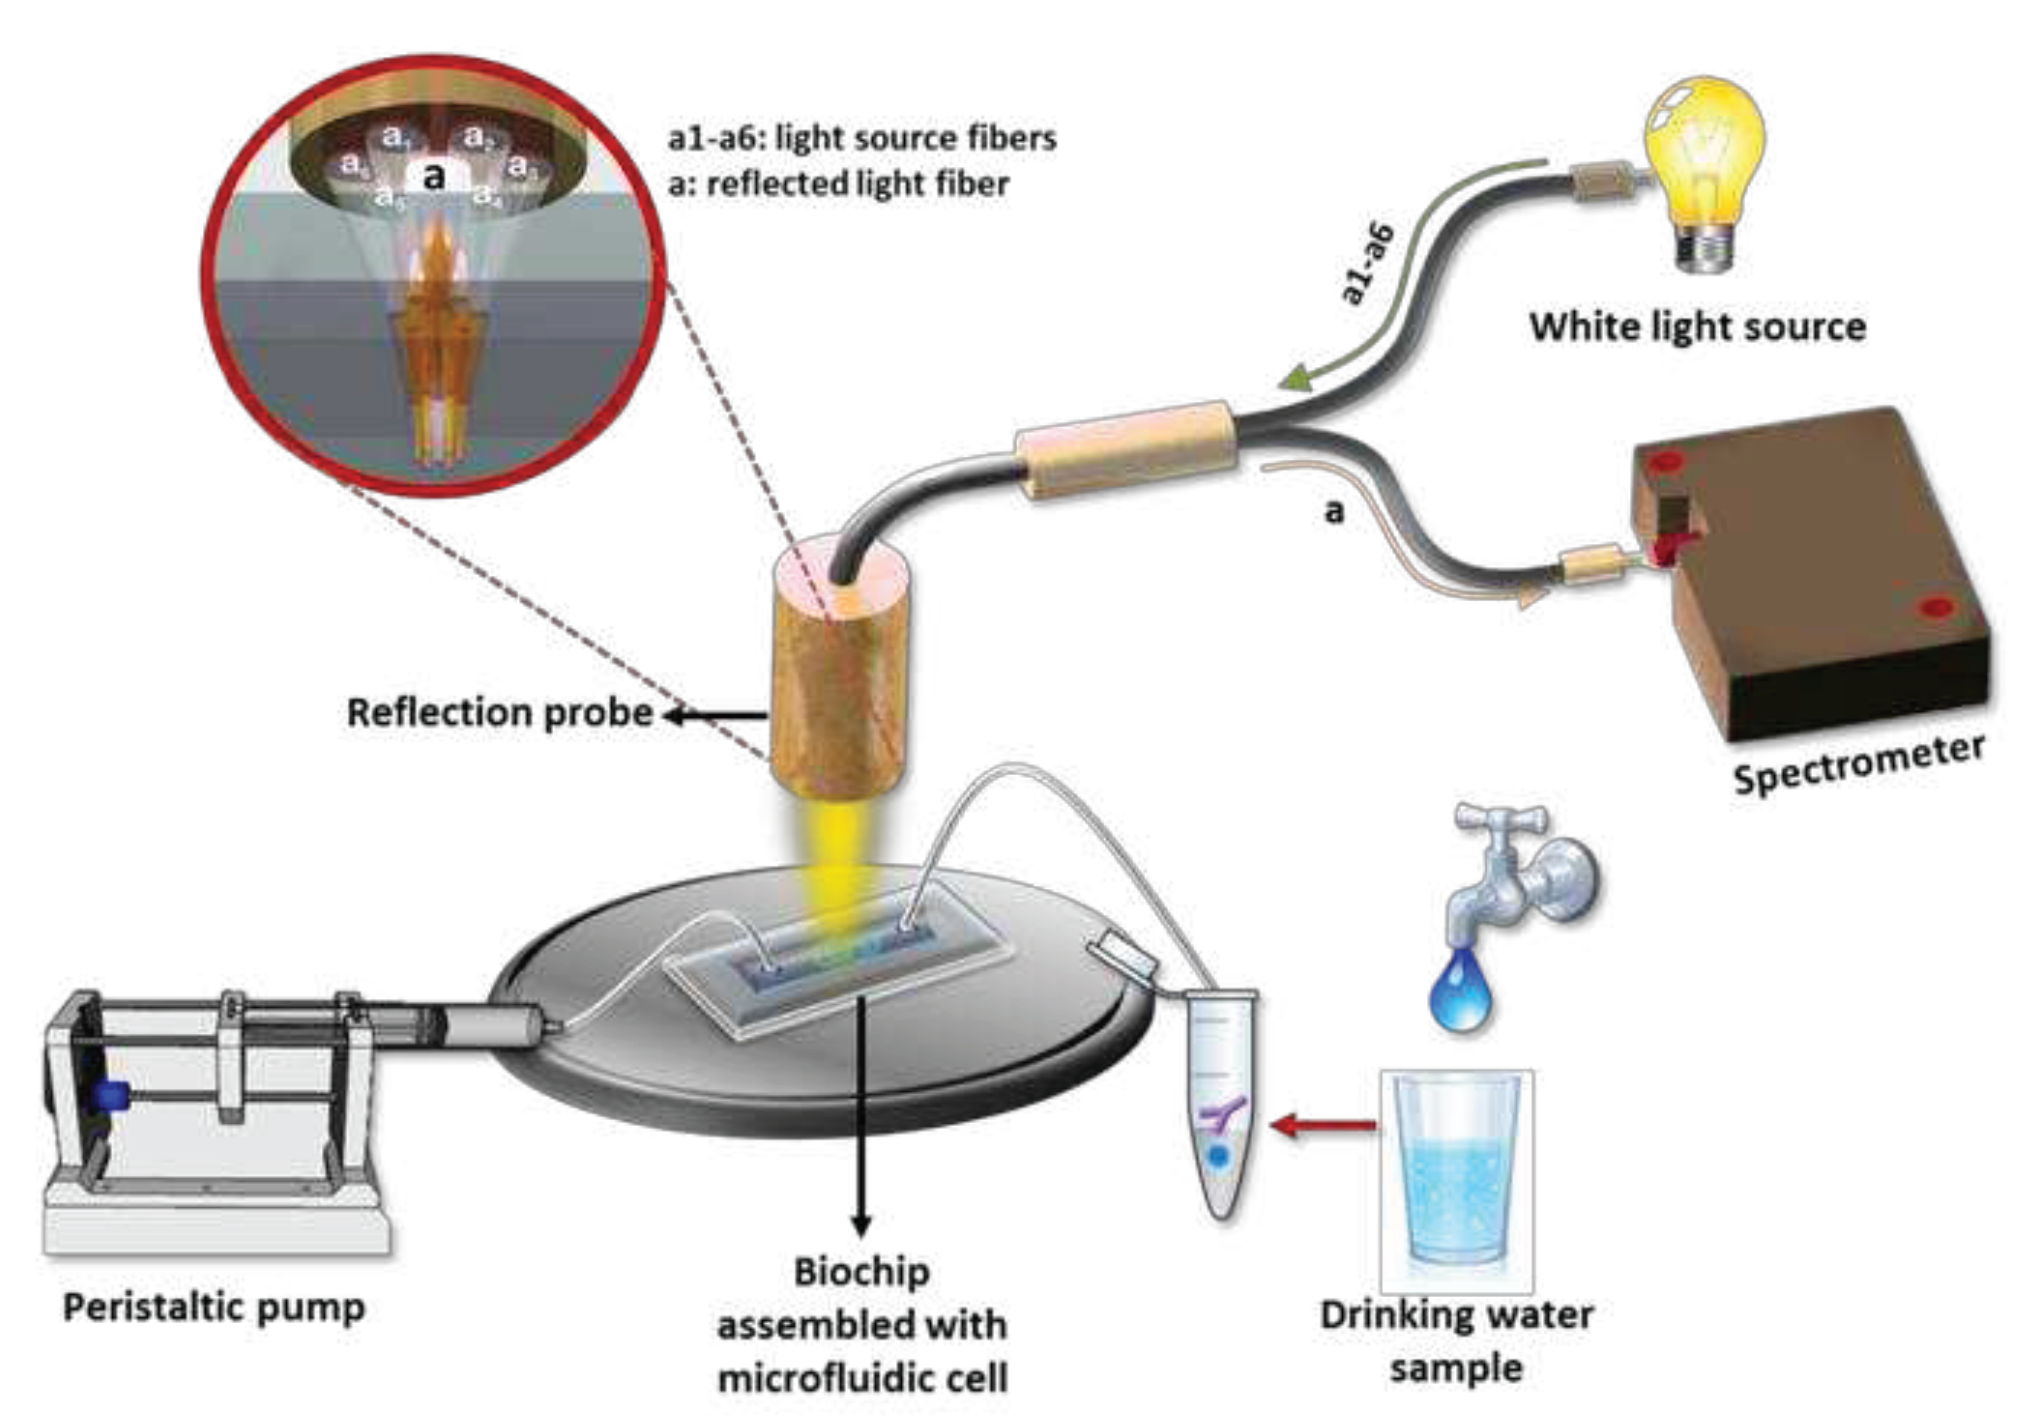
Figure 11.
(a) A top-view high-resolution scanning electron microscope image of a typical PSiO2 film with typical pores in the range of 60–100 nm. (b) Schematic representation of the steps followed to bio-functionalize the PSiO2 surface with IgG, including: (I) 3-aminopropyl-triethoxysilane modification, (II) reaction of amine-terminated PSiO2 with one of the aldehyde groups of the cross-linker glutaraldehyde, (III) grafting of streptavidin onto the aldehyde-terminated surface, (IV) conjugation of biotinylated-IgG (E. coli) via biotin-streptavidin binding [158]. Copyright 2016. Reproduced with permission from Springer Nature.
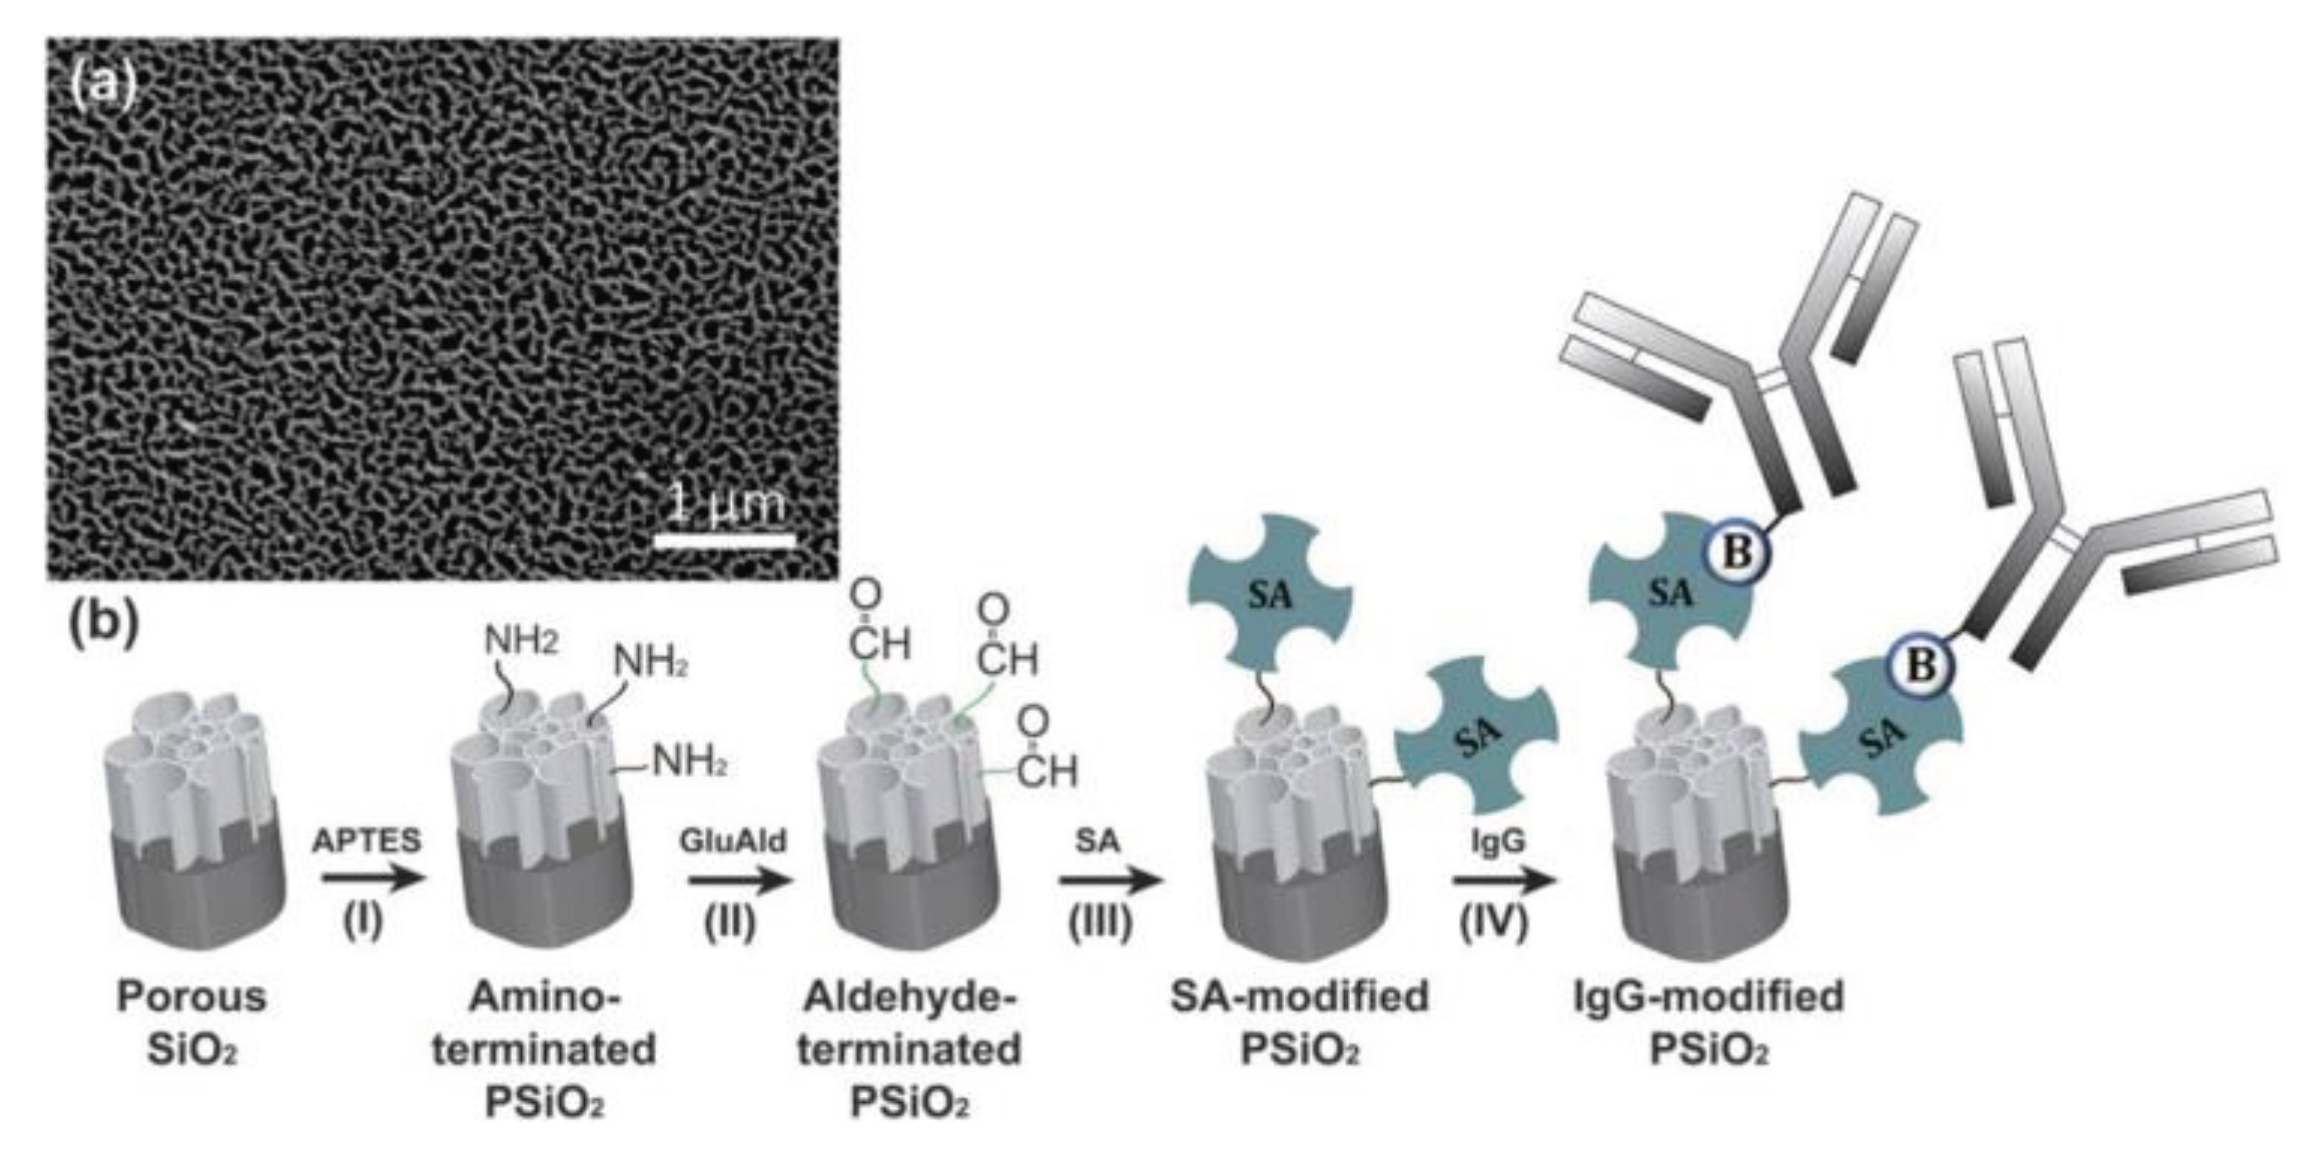
Figure 12.
Schematic illustration of SERS-based approaches for (a) direct, (b) immunochemical, or (c) label-based detection with SERS tags.
Figure 12.
Schematic illustration of SERS-based approaches for (a) direct, (b) immunochemical, or (c) label-based detection with SERS tags.
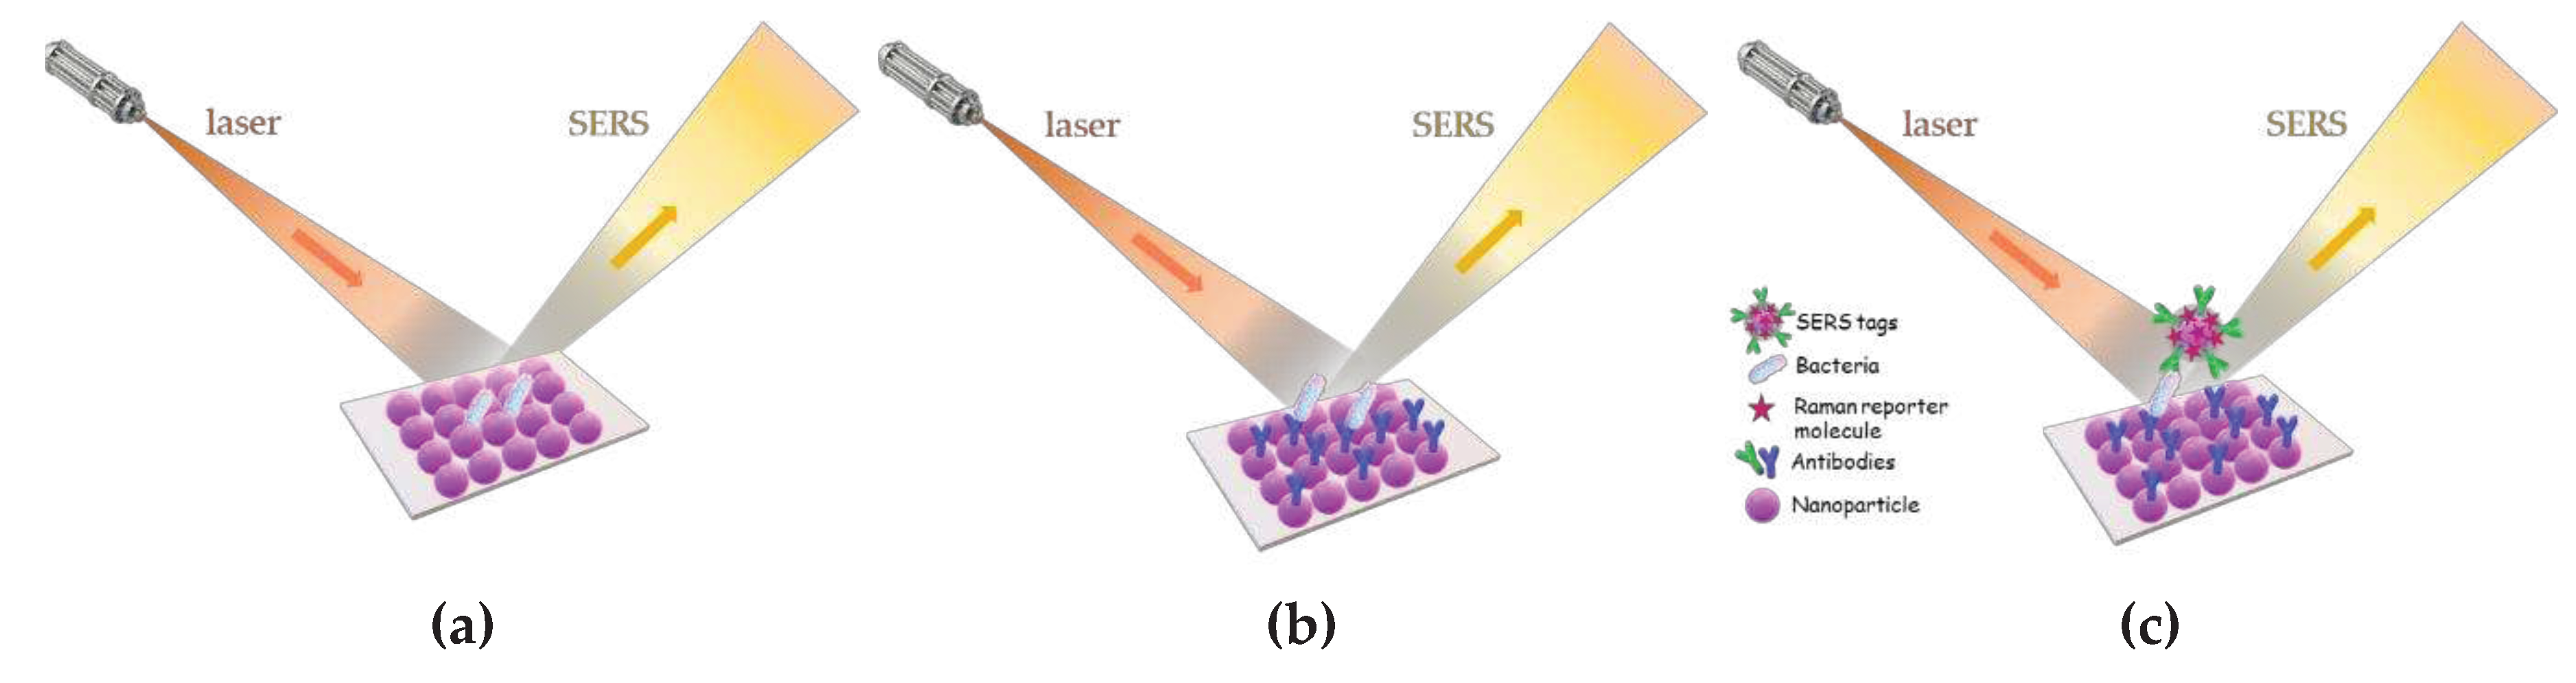
Figure 13.
a) Schematic illustration of: (A) preparation of gold nanoparticles modified with streptavidin and Raman tags (MBA), and (B) the multiplex lateral flow SERS assay. b) (A) Results from lateral flow strips for the simultaneous detection of S. enteritidis (test line 1) and L. monocytogenes (test line 2). Test lines could be observed by naked eye at a concentration of 1.9 × 10² cfu/mL of L. monocytogenes and 2.7 × 10² cfu/mL of S. Enteritidis. The SERS signal of the test lines could be detected at a concentration of 1.9 × 101 cfu/mL of L. monocytogenes and 2.7 × 101 cfu/mL of S. Enteritidis. (B) Specificity of the lateral flow strip assay against three L. monocytogenes and three S. enteritidis bacteria [186]. Copyright 2017. Reproduced with permission from the American Chemical Society.
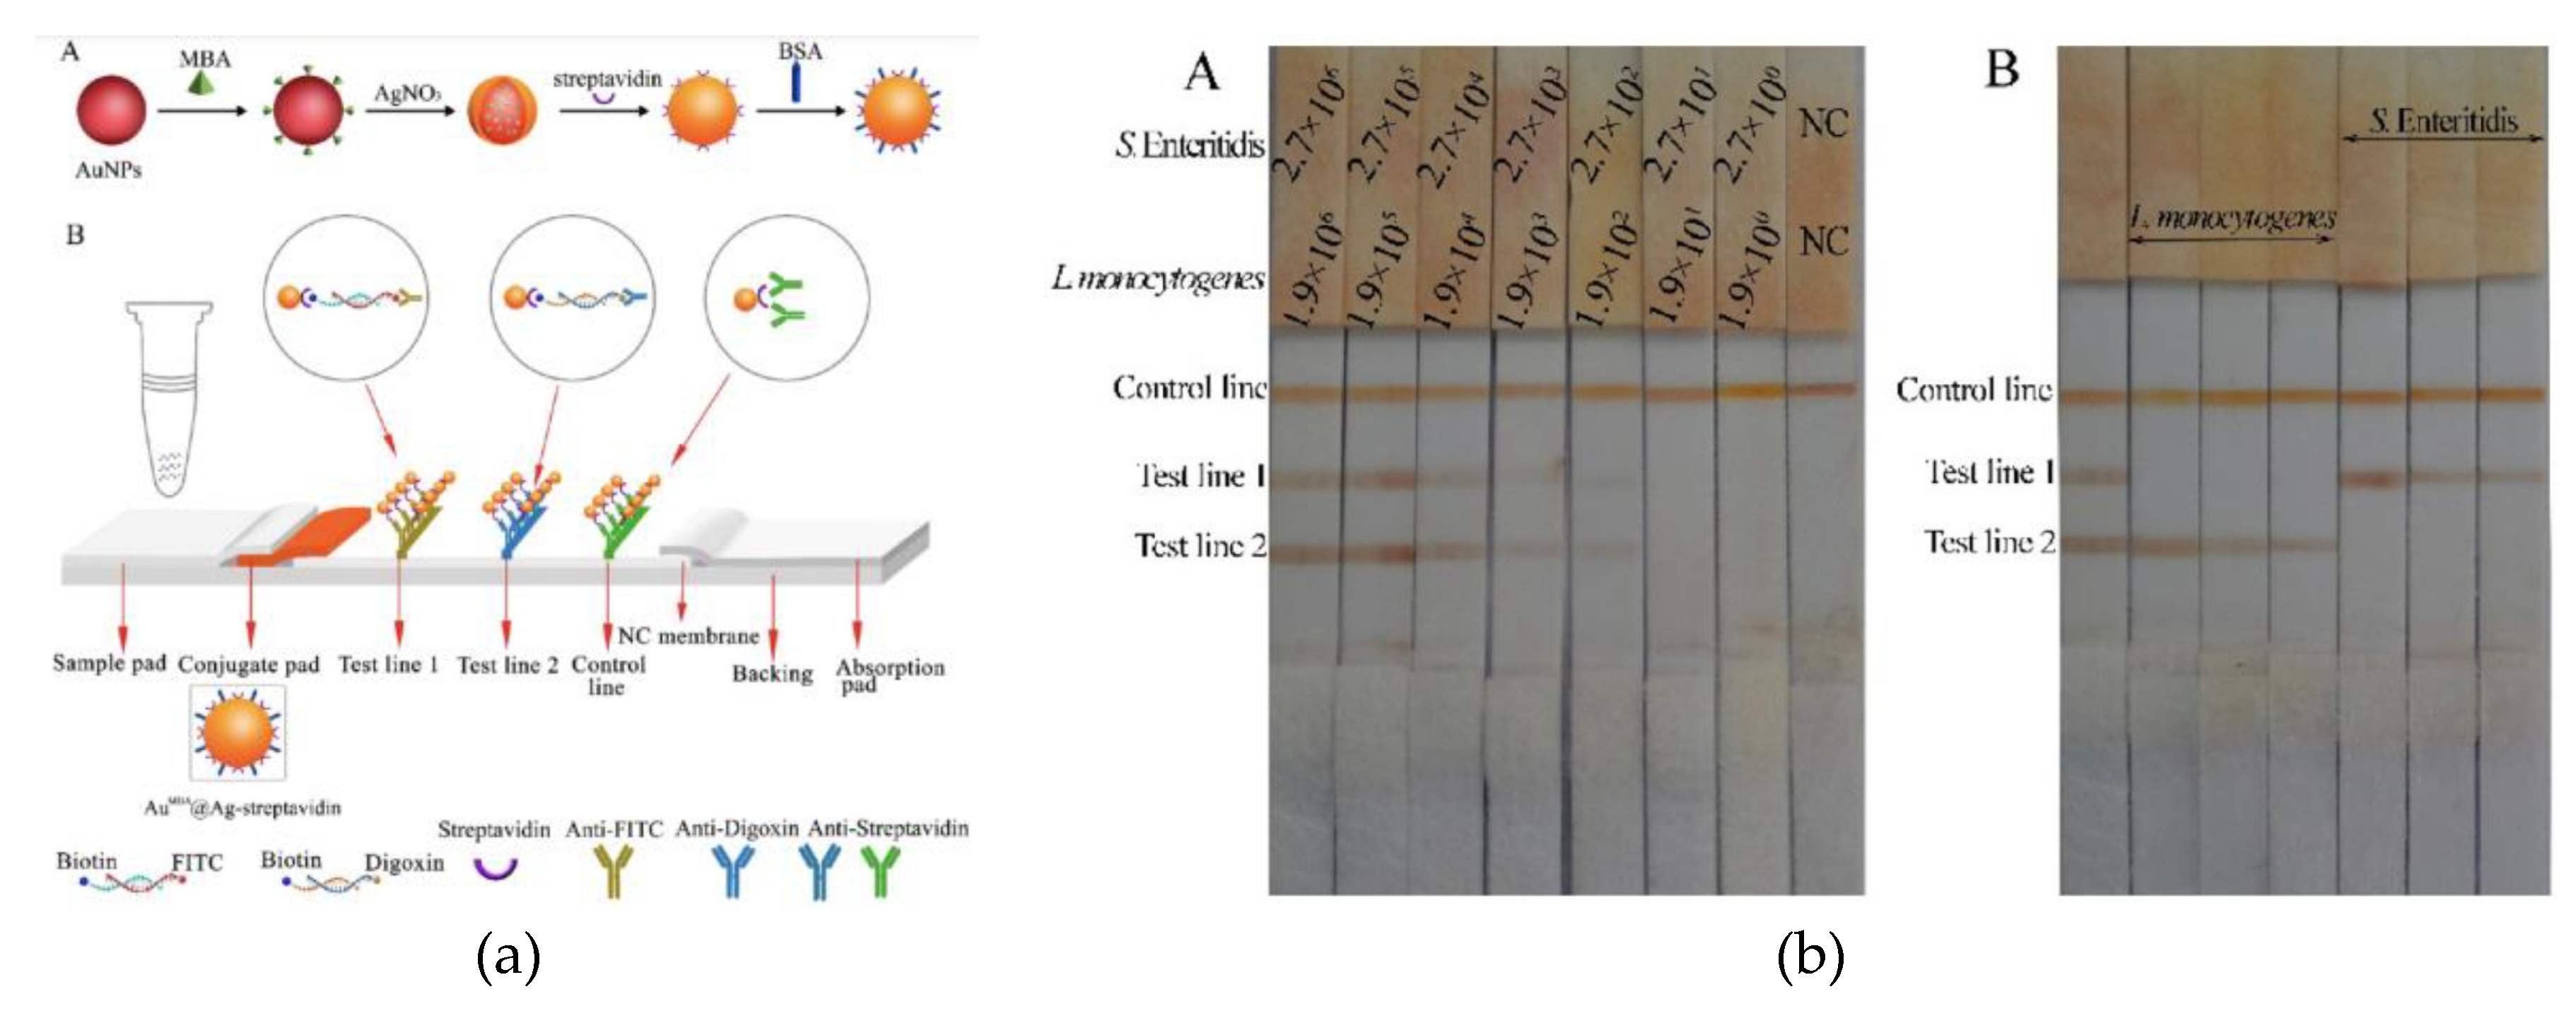
Table 1.
SPR-based immunosensors for bacteria detection.
| Analyte | Detectionprinciple | Assay type | Sample type | Assay duration | LOD | Ref.# |
|---|---|---|---|---|---|---|
| E. coli O157:H7 | SPR | sandwich | buffer | 20 min | 107 cfu/mL | [63] |
| V. cholera O1 | SPR | direct | buffer | - | 105 cfu/mL | [64] |
| L. pneumophila | SPR | direct | buffer | - | 105 cfu/mL | [65] |
| E. coli | SPR | direct | milk | 5-7 min | 23 cfu/mL | [66] |
| S . enteritidis | 25 cfu/mL | |||||
| S. typhimurium/ Enteritidis mixture | SPR | sandwich | buffer | ~10 min | 1.7x10³ cfu/mL | [67] |
| S. aureus | SPR | sandwich | buffer | <2 h | 105 cfu/mL | [68] |
| E. coli O157:H7 | SPR | direct/sandwich | buffer | <8 min | 103 cfu/mL | [69] |
| S. paratyphi | SPR | direct | buffer | 20 min | 102 cfu/mL | [70] |
| E. coli O157:H7 Salmonella sp. | SPR | sandwich with biotinylated detection antibody and streptavidin labeled with gold nanoparticles | hamburger/cucumber | ~1 h | 57/17 cfu/mL7.4x103/11.7x103 cfu/mL | [71] |
| C. jejuni | SPR | direct | buffer | <7 min | 8×10⁶ cfu/mL | [72] |
| sandwich with biotinylated detection antibody and streptavidin labeled with gold nanoparticles | 4×10⁴ cfu/mL | |||||
| L. monocytogenes | SPR | sandwich with gold-labelled secondary antibody | buffer | ~35 min | 102 cfu/mL | [73] |
| E. coli | SPR | sandwich with detection antibody labeled with peroxidase + TMB substrate | fresh spinach | ~2 h | 104 cfu/mL | [74] |
| S. typhimurium | SPR | direct | buffer | 10 min | 105 cfu/mL | [75] |
| E. coli O157:H7 | SPR | sandwichdirect | detergent-lysed samples | 50 min20 min | 104 cfu/mL106 cfu/mL | [76] |
| sandwichdirect | heat-killed samples | 50 min20 min | 105 cfu/mL 107 cfu/mL | |||
| sandwichdirect | untreated samples | 50 min20 min | 106 cfu/mL108 cfu/mL | |||
| E. coli O157:H7 | SPR | direct | milkapple juice ground beef | 30 min | 102-103 cfu/mL | [77] |
| S. typhimurium | SPR | sandwich | milk | 1 h | 1.25x10⁵ cfu/mL | [78] |
| L. monocytogenes | SPR | subtractive inhibition | buffer | <30 min | 105 cells/mL | [80] |
| E. coli O157:H7 | SPR | subtractive inhibition | buffer | <2 h | 3.0x10⁴ cfu/mL | [81] |
| direct | 5 min | 3.0x10⁵ cfu/mL | ||||
| B. anthracis spores | SPR | subtractive inhibition | buffer | 40 min | 104 cfu/m | [82] |
| Phytophthora infestans | SPR | subtractive inhibition | buffer | 75 min | 2.2x10⁶ cfu/mL | [83] |
| Puccinia striiformis | SPR | subtractive inhibition | buffer | 45 min | 3.1x10⁵ cfu/mL | [84] |
| C. parvum oocysts | SPR | subtractive inhibition | water | 30 min | 102 oocysts/mL | [85] |
| L. monocytogenes | SPR | inhibition | bufferchocolate milk | 30 min | 2x10⁵ cfu/mL | [86] |
| S. typhimuriumE. coli O157:H7Yersinia enterocolitica L. pneumophila | SPR imaging | direct | buffer | - | 105 cfu/mL | [87] |
| L. monocytogenes | SPR imaging | direct | buffer apple juice | 30 min | 3.5x10³ cfu/mL | [88] |
| E. coli O157:H7 | 1.4x10⁴ cfu/mL | |||||
| C. jejuni | 1.1x10⁵ cfu/mL | |||||
| S. typhimurium | 4.4x10⁴ cfu/mL | |||||
| L. monocytogenes | SPR imaging | direct | letuse | 30 min | 107 cfu/mL | [89] |
| S. typhimurium | SPR imaging | direct | chicken carcass rinse | ~20 min | 7.6x10⁶ cfu/mL | [90] |
| buffer | 2.1x10⁶ cfu/mL | |||||
| Salmonella spp. Shiga-toxin producing Escherichia coli L. monocytogenes | SPR imaging | direct | chicken carcass rinse | 106 cfu/mL | [91] | |
| L. monocytogenesL. innocua | SPR imaging | direct | buffer | 7 h | 2×10² cfu/mL | [92] |
| C. jejuni | Portable SPR | direct | buffer | <30 min | 103 cfu/mL | [93] |
| broiler meat | ||||||
| E. coli O157:H7 | Portable SPR | direct | buffer | 35 min | 8.7x10⁶ cfu/mL | [94] |
| E. coli | Portable SPR | direct | water | ~17 min | 90 cfu/mL | [95] |
| S. typhimurium | Portable SPR | direct | chicken carcass | 3 min | 106 cfu/mL | [96] |
| E. coli | SPR | direct | lake, river, puddle & tap water | 20 min | 3 cfu/mL | [97] |
| E. coli | Portable SPR | direct | buffer | 20 min | 106 cfu/mL | [98] |
| S. aureus | ||||||
| S. typhimurium | Portable SPR | direct | buffer | <1 h | 107 cfu/mL | [99] |
| E. coli O157:H7 | LSPR | direct | buffer | 80 min | 10 cfu/mL | [103] |
| E. coli O157:H7 | LSPR | direct | buffer | <2 h | 10 cfu/mL | [104] |
| E. coli O157:H7 | Portable SPR | direct | buffer | 20 min | 50 cfu/mL | [105] |
Table 2.
Fiber optic sensors for bacteria detection.
| Analyte | Detection principle | Assay type | Sample type | Assay duration | LOD | Ref.# |
|---|---|---|---|---|---|---|
| E. coli | fiber opticfluorescence | direct | buffer | 1 h | 103 cfu/mL | [110] |
| E. coli | fiber optic | direct | 10 min | 104 cfu/mL | [111] | |
| Salmonella | fiber opticfluorescence | sandwich | buffer | 1.0 h | 104 cfu/mL | [112] |
| E. coli O157:H7 | fiber optic fluorescence | sandwich | ground beef | 2.5 h | 103 cfu/mL | [113] |
| S. typhimurium | plastic fiber optic fluorescence | sandwich | sprouted alfalfa seeds rinse water | ~30 min | 105 cfu/mL | [114] |
| E. faecalis | plastic fiber optic fluorescence | indirect | ambient water | 2.5 h | 105 cfu/mL | [115] |
| L. monocytogenes | plastic fiber optic fluorescence | sandwich | buffer hot dog bologna | 2.5 h | 4.3x10³ cfu/mL | [116] |
| L. monocytogenes | plastic fiber opticfluorescence | sandwich | meat products | 4.0 h | 103 cfu/mL | [117] |
| L. monocytogenes | plastic fiber optic fluorescence | sandwich | frankfurter | 12 min | 5×10⁵ cfu/mL | [118] |
| L. monocytogenes | plastic fiber opticfluorescence | sandwich | beefchickenturkey | 4.0 h | 103 cfu/mL | [119] |
| E. coli O157:H7 | ||||||
| S. enterica | ||||||
| S. typhimurium | FRET-basedoptical fiber | direct | buffer | 5 min | 103 cells/mL | [120] |
| ground pork | 105 cfu/g | |||||
| E. coli | fiber optic with gold layer and ZnO nanorods | direct | water | 3 s | 103 cfu/mL | [121] |
| L. pneumophila | fiber optic SPR | direct | buffer | <30 min | 10 cfu/mL | [122] |
| E. coli O157:H7 | fiber optic SPR | direct | drinking water | ~15 min | 94 cfu/mL | [123] |
Table 3.
Bacteria detection with integrated interferometric immunosensors.
| Analyte | Detection principle | Assay type | Sample type | Assay duration | LOD | Ref.# |
|---|---|---|---|---|---|---|
| S. typhimurium | Hartmaninterferometer | direct | buffer | 40 min | 5x10⁸ cfu/mL | [130] |
| S. typhimurium | Hartmaninterferometer | sandwich& direct | buffer | 10 min | 104 cfu/mL | [132] |
| chicken carcass | ||||||
| L. monocytogenes | MZIfluorescence | sandwich | buffer | 1.15 h | 105 cfu/mL | [126] |
| E. coli | MZI | direct | buffer | 10 min | 106 cfu/mL | [127] |
| S. typhimurium E. coli | MZI | competitive with biotinylated secondary antibodies and streptavidin | watermilk | 10 min | 40 cfu/mL 110 cfu/mL | [128] |
| E. coli | Bimodal interferometer | direct | buffer | 25 min | 40 cfu/mL | [133] |
| B. cereus | 12.5 min | 70 cfu/mL |
Table 4.
Grating coupler-based sensors for bacteria detection.
| Analyte | Detection principle | Assay type | Sample type | Assay duration | LOD | Ref.# |
|---|---|---|---|---|---|---|
| Escherichia coli K12 | grating coupler | direct | buffer | 1 h | 1.6x10⁴ cfu/mL | [143] |
| S. aureus | long-period fibergratings | direct | buffer | 1 h | 102 cfu/mL | [144] |
| S. aureus | long-period fibergratings | direct | buffer | 30 min | 224 cfu/mL | [145] |
| Escherichia coli | long-period fibergratings | direct | buffer | 12 min | 7 cfu/ml | [144] |
| S. typhimurium | OWLS | direct | buffer | 30 min | 1.3x10³ cfu/mL | [147] |
| L. pneumophila | OWLS | direct | water | 25 min | 1.3x10⁴ cfu/mL | [148] |
Table 5.
Bacteria detection with reflectrometric immunosensors.
| Analyte | Detection principle | Assay type | Sample type | Assay duration | LOD | Ref.# |
|---|---|---|---|---|---|---|
| L. pneumophila | RIfS | directsandwich | buffer | 30 min60 min | 1x10⁵ cfu/mL | [154] |
| S. typhimurium | WLRS | competitive | drinking water | 15 min | 320 cfu/mL | [155] |
| E. coli K12 | reflectance spectroscopy on porous silicon | direct | buffer | 30 min | 104 cells/mL | [156] |
| E. coli | reflectance spectroscopy on porous silicon | direct | buffer | 30 min | 104 cells/ml | [157] |
| E. coli | reflectance spectroscopy on porous silicon | direct | water | 45 min | 103 cells/mL | [158] |
| E. coli | reflectance spectroscopy on porous silicon | direct | buffer | 30 min | 103 cells/mL | [159] |
| E. coli | Fourier Transformed Reflectometric Interference Spectroscopy | direct | buffer | 40 min | 103 cfu/mL | [160] |
| E. coli | reflectance spectroscopyimaging | direct | tap water | 2 h | 2.2 cfu/mL | [161] |
Table 7.
SERS-based immunosensors for bacteria detection.
| Analyte | Detection principle | Assay type | Sample type | Assay duration | LOD | Ref.# |
|---|---|---|---|---|---|---|
| L. pneumophilaS. typhimurium | SERS | direct | water | 65 min | 106 cfu/mL108 cfu/mL | [174] |
| E. coli O157:H7 | SERS | direct | water | >60 min | 4.3x10³ cfu/mL | [175] |
| E. coli O157:H7 | SERS | sandwich | ground beef | ~2 h | 10 cfu/mL | [176] |
| E. coliS. aureus | SERS | sandwich | bottled water milk | ~2h | 10 cfu/mL25 cfu/mL | [177] |
| E. coli O157 | SERS | sandwich | apple juice | <1 h | 102 cfu/mL | [178] |
| E. coliS. typhimurium methicillin-resistantS. aureus | SERS | sandwich | buffer | >30 min | 10 cfu/mL | [179] |
| S. aureus | SERS | sandwich | buffer | - | 10 cells/mL | [180] |
| E. coli K12 | SERS | sandwich | buffer | <2 h | 4 cfu/mL | [181] |
| E. coli | SERS | sandwich | buffer | 70 min | 35 cfu/mL | [182] |
| E. coli | SERS | sandwich | water | 70 min | 8 cfu/mL | [183] |
| Salmonella enterica serotype CholeraesuisNeisseria lactamica | SERS | direct | buffer | <2 h | 70 cfu/mL | [184] |
| L. monocytogenesS. typhimurium | LFIA SERS | sandwich | milk | 10 min | 75 cfu/mL | [185] |
| S. enteritidis/L. monocytogenes | LFIA SERS | sandwich | bufferchicken breastbeefmilk | 30 min | 27/19 cfu/mL35/29 cfu/mL35/22 cfu/mL31/36 cfu/mL | [186] |
| E. coli O157:H7 | LFIA SERS | sandwich | milkchicken breast beef | 15 min | 5x10⁴ cfu/mL | [187] |
Disclaimer/Publisher’s Note: The statements, opinions and data contained in all publications are solely those of the individual author(s) and contributor(s) and not of MDPI and/or the editor(s). MDPI and/or the editor(s) disclaim responsibility for any injury to people or property resulting from any ideas, methods, instructions or products referred to in the content. |
© 2023 by the authors. Licensee MDPI, Basel, Switzerland. This article is an open access article distributed under the terms and conditions of the Creative Commons Attribution (CC BY) license (http://creativecommons.org/licenses/by/4.0/).
Copyright: This open access article is published under a Creative Commons CC BY 4.0 license, which permit the free download, distribution, and reuse, provided that the author and preprint are cited in any reuse.


