Submitted:
27 June 2023
Posted:
28 June 2023
You are already at the latest version
Abstract
This paper presents the results of the study of carbon films deposited on substrates of quartz, mica and silicon by the method of electron paramagnetic resonance (EPR). This study has identified the dependences of the intensities of the EPR signal, the g- factor, and the line width on the temperature of carbon films on various substrates with perpendicular and parallel arrangement of the sample plane relative to the orientation of the magnetic field are presented. The results of this study show that the dependence of the line width on temperature measurements does not change under both conditions for recording the EPR spectra. The research has also shown that with increasing temperature, the normalized intensity of the EPR signal line increases when carbon is deposited on various substrates (quartz, mica, and silicon) by the method of plasma decomposition of a mixture of CH4 and H2.
Keywords:
electron paramagnetic resonance
; carbon films
; magnetic field
; paramagnetic property
; intensity of signal
; various substrates
1. Introduction
Recently, researchers have shown an increased interest in the development of technologies for applying thin carbon films on various materials. The morphology, structure, phase composition, and physical properties of thin films directly depend on the method of their preparation. To obtain such films, various types of substrates are selected, for example, such as quartz, glass, crystalline and monocrystalline silicon, etc. Depending on the synthesis temperature, localized carbon can be represented both in the amorphous state and in the nanocrystalline state. The EPR method is a powerful tool for studying carbon nanotubes. A major advantage of this method is that it allows us to detection of unpaired electrons even at very low concentrations in samples, without destroying or modifying them, and at the same time characterizes their energy states or localization. Electron paramagnetic resonance (ESR) is a widely used method for study- ing carbon nanostructures [1,2,3,4,5,6,7,8,9]. In work [10] are presented EPR studies of carbon films obtained by laser-plasma deposition using graphite targets of various types. In this work have been studied the influence of the degree of structural perfection of a graphite target and thermal stimulation of the substrate on the structure of deposited carbon films by the laser-plasma method. In the EPR spectra, carbon films have revealed the presence of single signals detected at room temperature for all studied samples. The signal was still under non-saturating conditions at 100 mW. Consequently, the observed paramagnetic centers are associated primarily with imperfect-type defects. Films are characterized and deposited on a “cold” substrate using targets of various graphite by a wide of single linewidth (ΔH ~ 15 G) with a g-factor of 2.0011. The observed line is somewhat for py- rolytic graphite (ΔH = 10G), and the g-factor is 2.0022. This value is close to the g-factor of a free electron, which is typical of diamond materials. A linewidth of g-factor of 2.0011 wasn't previously observed for carbon materials. Heating the substrate to 500 K leads to a noticeable (several times) narrowing of the lines in the EPR spectra for all types of targets (cathodes). In this case, the value of the g-factor increases for films obtained using graphite targets (cathodes). In works [11,12], the EPR spectra samples where the graphite considered as cathode an ion source. Weakly asymmetric is a singlet in which the lin- ewidth with width between the extremes of the derivative 12-14 Gs with a g-factor of 2.010.
This result is typical for polycrystalline graphite’s, which have an imperfect struc- ture containing π-electron traps in the valence band [13]. The EPR spectra are also singlet weakly asymmetric lines for carbon in different states (black coals, soot, activated carbon, thin amorphous a-C films obtained by different methods). They have a smaller width (3-4Gs) and another g-factor equal to 2.0027 ± 0.0002 [14]. The EPR spectrum of a carbon film has a complex shape, which was obtained by deposition of vacuum-arc graphite erosion products in the anode chamber of an ion source onto a glass substrate. Computer simulation has shown that this spectrum can be represented as a superposition of two lines. One of them is a wide line with g=2.0052 ± 0.0002 (20 Gs) and the other is narrower with g=2.0030 ± 0.0002 (5 G).
Wagoner [15] investigated the electron spin resonance in quite perfect single crystals of graphite clearly establish that the resonance arises from mobile charge carriers. The temperature dependence of the g-factor in a graphite monocrystal was studied by X-band EPR at 90–300 K temperature range [16]. In this paper given a generalization of McClure equation for the g=g(T) data description which is based on the assumption that (mixing coefficient of the π bond) is temperature dependent.
The EPR spectrum of the carbon film is a narrow singlet line with g=2.0034.Wagoner [15] investigated the electron spin resonance in quite perfect single crystals of graphite clearly establish that the resonance arises from mobile charge carriers. The temperature dependence of the g-factor in a graphite monocrystal was studied by X-band EPR at 90–300 K temperature range [16]. In this paper given a generalization of McClure equa- tion for the g=g(T) data description which is based on the assumption that a (mixing co- efficient of the p bond) is temperature dependent. The EPR line in crystalline graphite has electronic conductivity and it is character- ized with a highly anisotropic g-factor. According to [17], g-factors have g||=2.0050 and g⊥=2.0026 at room temperature. It is highly dependent on temperature and impurities. Future studies on the current topic are therefore recommended. Data from authors studies suggest that the line with g=2.0052 can be attributed to the presence of graphite microcrystallites in the deposited film with some averaged g-factor. The main goal of the current study was to measure and determine the temperature dependence of the EPR signal of thin carbon films deposited on substrates of quartz, mica, and silicon on the annealing temperature.
2. Materials and Methods
Films were obtained on an AX5200S – ECR equipped with a microwave radiator for plasma excitation firms of by Seki Technotron Corp. A darkish color carbon films are formed on various substrates (quartz, mica and silicon) during plasma decomposition of a mixture of CH4 and H2 and carbon deposition. In our case, the time of deposition of carbon on the substrate with the formation of a film was 2 hours on excited of plasma in a mixture of СН4+Н2+Аr at a pressure of 3,8×10⁻²Torre. The microwave power supplied to the chamber was 540 W, and the reflected power was 84W, the leakage into the chamber of СН4 and Н2 was the same and equal to 20 cm3/min. Samples were measure on a Jeol JES-FA200 spectrometer with sensitivity of 5×10⁹ spin /sample. In the text of the article is indicated the temperature of the preliminary processing of the samples. Meas- urements were carried out at room temperature at a frequency of 9450 MHz and a mag- netic field of 336 ± 10 mT. The g-factor of the sample was determined using known pa- rameters of the manganese line. The temporary stability of the spectrometer is 10-6.
The resonator of the spectrometer is cylindrical. The sample is placed in the center of the resonator. A spectrometer feature is that the manganese sample is located outside the resonator, but under the influence of a scattered microwave field. This allows it to be used to calibrate the parameters of recorded operating spectra. Its g-factor is stable when measuring the spectrum of a working sample.
EPR spectroscopy of the sample as the secondary bivalent manganese ions in the lattice is often used a magnesium oxide (Mn2+ in MgO). As a reference sample were used Mn2 + ions in MgO. The signal from the sample under investigation was recorded be- tween the 3rd and 4th components of the six-coil spectrum from Mn2+. A sample with size 3x5 mm placed in a vial of special glass that did not give an EPR signal. The EPR spec- trum of this sample consists of six EPR lines, between the 3rd and 4th components, which are usually recorded spectra of the studied sample. ESR analysis of the third line, as well as all other lines of divalent manganese spectrum shows that the line connecting its maximum and a minimum, there are no bends. This line is perfectly straight.
An ESR signal appeared within certain limits of changing parameters of when per- forming on resonance conditions the magnetic field. The EPR spectrum gave printing after detection. A major advantage of EPR is that the given data values of the g-factor of manganese allow them to be used to determine the experimental data of the line be- tween these two components of manganese. It is known that the g- factor enters into the resonance condition ∆E= gμBβH (μBβ - the Bohr Magneton) and determines the position of the line in the EPR spectrum. A free electron does not have an orbital momentum and equal to g= 2.0023. The values of the g-factors are close to the indicated value of ions in the S-state. Small changes in this value (the g-factor is usually recorded with an accuracy of 4–5 decimal places) indicate some changes in the local surroundings of the center. EPR measurement was carried out on 20 sprayed samples at temperatures of from 0 0C (in- itial) to of 800 0C. Overall, these measuring were twenty samples at both arrangement of plane of sample relative the orientation of the magnetic field..
3. Results
Figure 1 shows raw date carbon film on substrate of mica at temperature 400 0C. The measurement of samples this approach is that the sample under study is located in the resonator, which the manganese of the sample is located outside the main volume (in a scattered Super High Frequency field). Its phase differs from the influence of this field from the Super high frequency of the phase the signal of in the resonator itself. As a known qualitative methods offer an effective way of measurement of samples with Mn2 + in MgO were selected for its reliability and validity. As a result, the signal from the sample and from manganese have opposite phases. In this spectrometer, the sample of Mn2 + in MgO is in the scattered microwave field outside the resonator, and therefore the phases of the investigating sample in the resonator and the sample Mn2 + in MgO are opposite. The EPR spectrum was calibrated according to a well-known standard, ac- cording to the works [18,19].
Figure 1 shows that the relation between the values determined by areas of 3:5 and 8:4 for carbon film on substrate of Mica at temperature of sputtering 400 0C. Thus sug- gests that the resulting thin carbon film is due to three components. The parameters of the EPR spectra of a carbon film on a mica substrate are as follows: on of the caption to picture presented magnitude of the area has g=2.00412-2.00420, which is typical of the EPR spectrum of graphene and its compounds. The second area is g-factor equal to g=2.0031. With such a g-factor of carbon components can be caused by carbon nanotubes. The third component of the carbon film has a g-factor equal to 2.00118 ÷ 2.00164 depend on the angle of rotation of the sample in a magnetic field. Thus indicates the presence of carbon film consisting of various forms of graphite with some degree of crystallites [20,21].
The results of measuring the EPR spectra of these the samples are presented in Figure 2, Figure 3 and Figure 4 and Table 1 and Table 2.
The measurement was taken at a perpendicular arrangement of the plane of sample rel- ative to the orientation of the magnetic field. These spectra have significant implications for the understanding, how interpreted f all spectra of paramagnetic features measure EPR.
Figure 2a, b shows the temperature dependences of the intensities of the EPR signal of a carbon film on substrates of quartz, mica, and silicon with the sample plane perpen- dicular and parallel to the orientation of the magnetic field. It can be seen from the figure that, the amplitude of the EPR signal noticeably decreases with a change in temperature from room temperature to 250-300°C, and then increases with increasing temperature for all samples.
The temperature dependences of the intensity of the EPR signal of the carbon film on different substrates show that with increasing temperature, the signal grows non-uniformly with the formation of intermediate maxima in both orientations of the sample plane relative to orientation of the magnetic field.
As shown in Figure 2a,b that EPR signal has one of characteristic temperature re- gion. The temperature growth of EPR signals in the samples under study was observed in the range of T= 400–7000С, when measuring in a parallel arrangement of the sample plane relative to the direction of the magnetic field (figure 2b). In both orientations of meas- urements of the EPR lines are significantly reduced at temperatures above 7500C. It turned out that the temperature behavior of the EPR signal with a perpendicular and parallel arrangement of the sample plane relative to the orientation of the magnetic field is almost the same. This means that EPR signal belongs to the same paramagnetic cen- ter, characterized by g = 2.00322-2.00323 at T=7500С. Typically, carbon films have a rather complex structural composition. Mostly, it includes of graphene-like formations, nano- tubes of various parameters, graphite’s of different organizations and their oxides.
Figure 3 shows the temperature dependences of the linewidth of EPR of a carbon film on the substrates of quartz, mica and silicon at the perpendicular and parallel ar- rangement of the relative to the orientation the sample plane of the magnetic field.
It's known [22] that the linewidth of the EPR line strongly depends on the micro- wave power, temperature, and modulation amplitude of a magnetic field. The linewidth of the carbon film on quartz and mica does not change with increasing temperature.
Generally, this means that the influence of the microwave power and the amplitude of the modulation of the magnetic field on the behavior of the EPR signal of the manifest itself in the same way. This indicates that the centers have the same relaxation times, which may be associated with one local environment of the centers, or with their identi- cal dynamic properties [20]. In addition, temperature measurements do not change under both conditions of registration of the EPR spectra.
At the same time, the linewidth of the carbon film from silicon at a temperature of 200-300°C decreases and, this is remain unanswered at present. A high concentration of paramagnetic centers leads to temperature memory effects, which indicates a high level of deposition of carbon films. There is a strong interaction between polarons, due to their high concentration.There is also a high probability of transformation between polarons and bipolarons [10], which can significantly affect the relaxation of spins (polarons) and their environment. Table 2 shows the dependence of the g-factor of EPR signal on the temperature of carbon films on different substrates at perpendicular arrangement of plane of sample relative the orientation of the and parallel magnetic field.
The research has also shown that at measuring both orientations of the magnetic field dependence of the EPR signal for silicon has a jumplike form. This means that an unpaired electron is localized on a non-carbon atom and deviations at temperatures of 3000С (g⊥≈2.00249 and g||≈2.00221), at 4500С (g⊥≈2.00225 and g||≈2.00221) and at 5500С (g||≈2.00281). These deviations of the g-factors (g|| and g⊥) in both orientations of the measurement strongly depend on the impurities of the samples [15].
The investigation of this registration has shown that with an increase in temperature of the carbon film from quartz and mica, the g-factor growths in comparison the carbon film from silicon at parallel arrangement of plane of sample relative of the orientation of the magnetic field. Generally, this means that the organic radicals with insignificant concentrations are almost isotropic and differ only slightly [23-24]. The g-factor (g⊥≈2.00238) decreases at a temperature of 450°C with measuring perpendicular to the position of the sample plane relative to the magnetic field of the carbon film on mica.
At the same time, the g-factor (g⊥≈2.00364) shows an increase at the temperature of 5500С. This circumstance allows us to conclude that g-factor fluctuations aren't random, but are manifestations of a change in the surroundings of the average of statically radical or a broken C–C bond. It means that occurs local magnetization or local demagnetization at an external constant magnetic field is applied to the sample and the magnetic component of the microwave radiation in the resonator [24,25]. Figure 4a,b shows t normalized intensity per 1 gram of sample, and the EPR line monotonically increases with growth temperature. The change indicates the shape of the EPR signal line with increasing temperature of carbon deposition on various substrates (quartz, mica, and silicon) during plasma decomposition of a mixture of CH4 and H2.
4. Conclusion
The results of this investigation show that the dependences of the pa- rameters of the EPR signal the carbon film on various substrates have been studied (intensities, line widths, g-factor and normalized intensity of the EPR line) at the sample plane perpendicular and parallel to the orientation of the magnetic field. The temperature dependences of the intensity of the EPR signal of the carbon film on different substrates show that with increasing temperature, the signal grows non-uniformly with the for- mation of intermediate maxima in both orientations of the sample plane relative to the orientation of the magnetic field. In both orientations of measurements of EPR lines are significantly reduced at temperatures above 7500C. This study has found that with increasing temperature, the width of the carbon film line on quartz and mica does not change. The results show that the centers have the same relaxation times, which may be associated with one local environment of the centers, or with their identical dynamic properties. This study has identified as the temperature rises to 7500С, the normalized amplitude intensity of the EPR signal monotonically increases in all samples during carbon deposition of on various substrates (quartz, mica and silicon).
Author Contributions
Conceptualization, B.A.B. and Yu.A.R.; software, B.A. B.; validation and formal analysis, Yu.A.R. and A.S.S.; investigation D.O.M. and B.A.R.; writing—original draft preparation, B.A.B. and Yu.A.R.; writing—review and editing D.O.K., D.E.A. and B.D.; visualization, B.A.R. and Y.K.; supervision, B.A.R. All authors have read and agreed to the published version of the manuscript.
Funding
The work was supported by a grant from the Ministry of Education of the Republic ofKazakhstan: BR18574141 “Comprehensive multi-purpose program for improving energy efficiency and resource saving in the energy sector and mechanical engineering for the industry of Kazakhstan”.
Data Availability Statement
Not applicable.
Conflicts of Interest
The authors declare no conflict of interest.
References
- Ulyanov E.V., Suslova K.I., Maslakov A.V., Funov N. N., Kuznetsova P. K., Savilov S.V. Paramagnetic response of carbon natubes: temperature dependencies. A. N. Journal of Physical Chemistry, 2022, 96, 822-827.
- Ivanoska-Dacikj A. , Bogoeva-Gaceva G., Valić S. ESR spectroscopy as a new method to analyze the synergy between two different nanofillers dispersed in an elastomer matrix. Polymer Testing. 2019, 73, 293-299. [CrossRef]
- Ziatdinov A.M., Saenko N. S., Skrynik P. G. Oxid Grafena and his thermally restored nanostructured derivatives: receipt and comprehensive study of properties. The magazine of inorganic chemistry, 2020, 65, 1, 131-144.
- Ryabikin Yu. A., Baitimbetova B.A., Serikkanov A.S. Paramagnetic properties of carbon films on a quartz substrate. Vestnik KazNRTU. 2019, 5, 209-212.
- Semenikhin P.V., Ionov A.N., Nikolaev M.N. Electronic spinal resonance of multi -layer graphene, synthesized with polystyrene. Letters to the Journal of Technical Physics, 2020, 46, 4.21-26.
- Tampieri F., Barbon A. Resolution of EPR Signals in Graphene-based Materials from Few Layers to Nanographites. Frontiers in Magnetic Resonance. 2018, 31, 36-66. [CrossRef]
- Semenikhin P.V., Ionov A.N., Nikolaev M.N. Electronic spinal resonance of multi -layer graphene, synthesized with polystyrene. Letters to the Journal of Technical Physics, 2020, 46, 4.21-26.
- Voznyakovsky A.A., Voznyakovsky A.P., Kidalov S.V.,. Osipov V.Yu. The structure and paramagnetic properties of graphene nanoplastin obtained by the method of self -playing high -temperature synthesis from biopolymers. Journal of structural chemistry. 2020. 61, 5, 869 – 878.
- Minaev N.V., Gromov O.I., Golubeva E.N., Vorobyov A. Kh., Bagratashvili V. N. High pressure reactor for registration of electronic paramagnetic resonance spectra in supercritical carbon dioxide. Experiment devices and techniques, 2019, 2, 151-153.
- Krzyminiewski R., Dobosz B., Schroeder G., Kurczewska J. ESR as a monitoring method of the interactions between TEMPO- functionalized magnetic nanoparticles and yeast cells. Scientific Reports. 2019, 9, 18733. [CrossRef]
- Márkus B. G., Gmitra M., Dóra B., Csősz G., Fehér T., Szirmai P., Náfrádi B., Zólyomi V., Forró1 L., Fabian J. Ultralong 100 ns spin relaxation time in graphite at room temperature. Nature Communications. 2023, 1, 2831. [CrossRef]
- Bogomoleva L.D., Nemov A.S. Nemov A.S. Issledovanie uglerodnich plenok, poluchaemich c pomochu vakumno-dugovogo ionnogo istochnika c graphitovim katodom. Prikladnaya physica. 2006, 3, 94-97.
- Banszerus L. B. Hecker K., Möller S., Icking E., Watanabe K. , Taniguchi T., Volk C. Spin relaxation in a single-electron graphene quantum dot. Nature communications.2022, 13,3637. [CrossRef]
- Ryabikin Yu. A., Baitimbetova B.A., Ryabikin Yu.A, Mansurov Z.A.. Study of graphene formed in the atmosphere of vapors of aromatic hydrocarbons. Russian Physics Journal. 2015, 58, 394-398.
- Wagoner G. Spin resonance of charge carriers in graphite. Physical Review. 1960, 118, 647-653. [CrossRef]
- Stankowski J., Waplak S., Bednarski W. The anisotropy and temperature dependence of g-factor in graphite. Solid State Communications. 2000, 115, 489–491. [CrossRef]
- Savchenko D.A., Каssiba A. et all. Sintes i issledovanie gibridnich nanomaterialov so structuroi yadro-obolochko (SiC/polimer) metodom EPR. Journal of Nanosystemy, nanomateriali, nanotechnology. 2010. 8, 287-303. [CrossRef]
- Ryabikin Yu.A., Zashkvara O.V., Denisova A.A., Melikhov V.D. Investigation of the irradiated intermetallic compound Mn5Zn21 by electron paramagnetic resonance. Physics of metals and metal science. 2010, 67, 65-72. [CrossRef]
- Ryabikin Yu.A., Zashkvara O.V., Melichov V.D. Magnetic Resonance in Intermetallide Сo5Zn21 and Mn3Zn21. Hong-Kong Springer 1997, 20-24 January, 636-644.
- Baitimbetova B.A., Ryabikin Yu.A., Mansurov Z.A. Production of carbon films, incoming graphene and nanotubes by magnetron sputtering vapors in naphthalene. Reports of NAS RK. 2015, 304, 5-11.
- Аltchuler S.А., Kosirev B.M. Spectroscopic investigation of thermal treatment of doped polypyrrole. Phys. Chem. 2000, 14, 3283-3291.
- Cabala R., Skarda J., Potje-kamloth K. Spectroscopic investigation of thermal treatment of doped polypyrrole. Phys. Chem. Chem. Phys. 2000, 14, 3283-3291.
- Poklonskaya O.N.Electronnyi spinovyi resonance obluchennich neitronami polikristalicheskich CVD-almasov: sostayanie spinovogo stekla. Vestnik BGU. 2013, 2, 60-65.
- Baytimbetova B. A., Ryabikin Yu. A., Mukashev B. N. Study of paramagnetic properties of graphene structures obtained from pure graphite in organic reagents exposed to ultrasound. 2021, 2, 209–215. Baitimbetova B. A. Correction Russian Physics Journal, 2021 December, 8.
- Макаrova Т.L. Phy. Tverdogo tela. 2004. 38, 641-664.
Figure 1.
The raw data of carbon film on the substrate of mica at temperature 4000C. The measurement of perpendicular arrangement of plane of sample relative the orientation of the magnetic field 1-2 – signal of Mn, 3-8 – signals of sample and EPR characteristics, 6 - signal of center.
Figure 1.
The raw data of carbon film on the substrate of mica at temperature 4000C. The measurement of perpendicular arrangement of plane of sample relative the orientation of the magnetic field 1-2 – signal of Mn, 3-8 – signals of sample and EPR characteristics, 6 - signal of center.
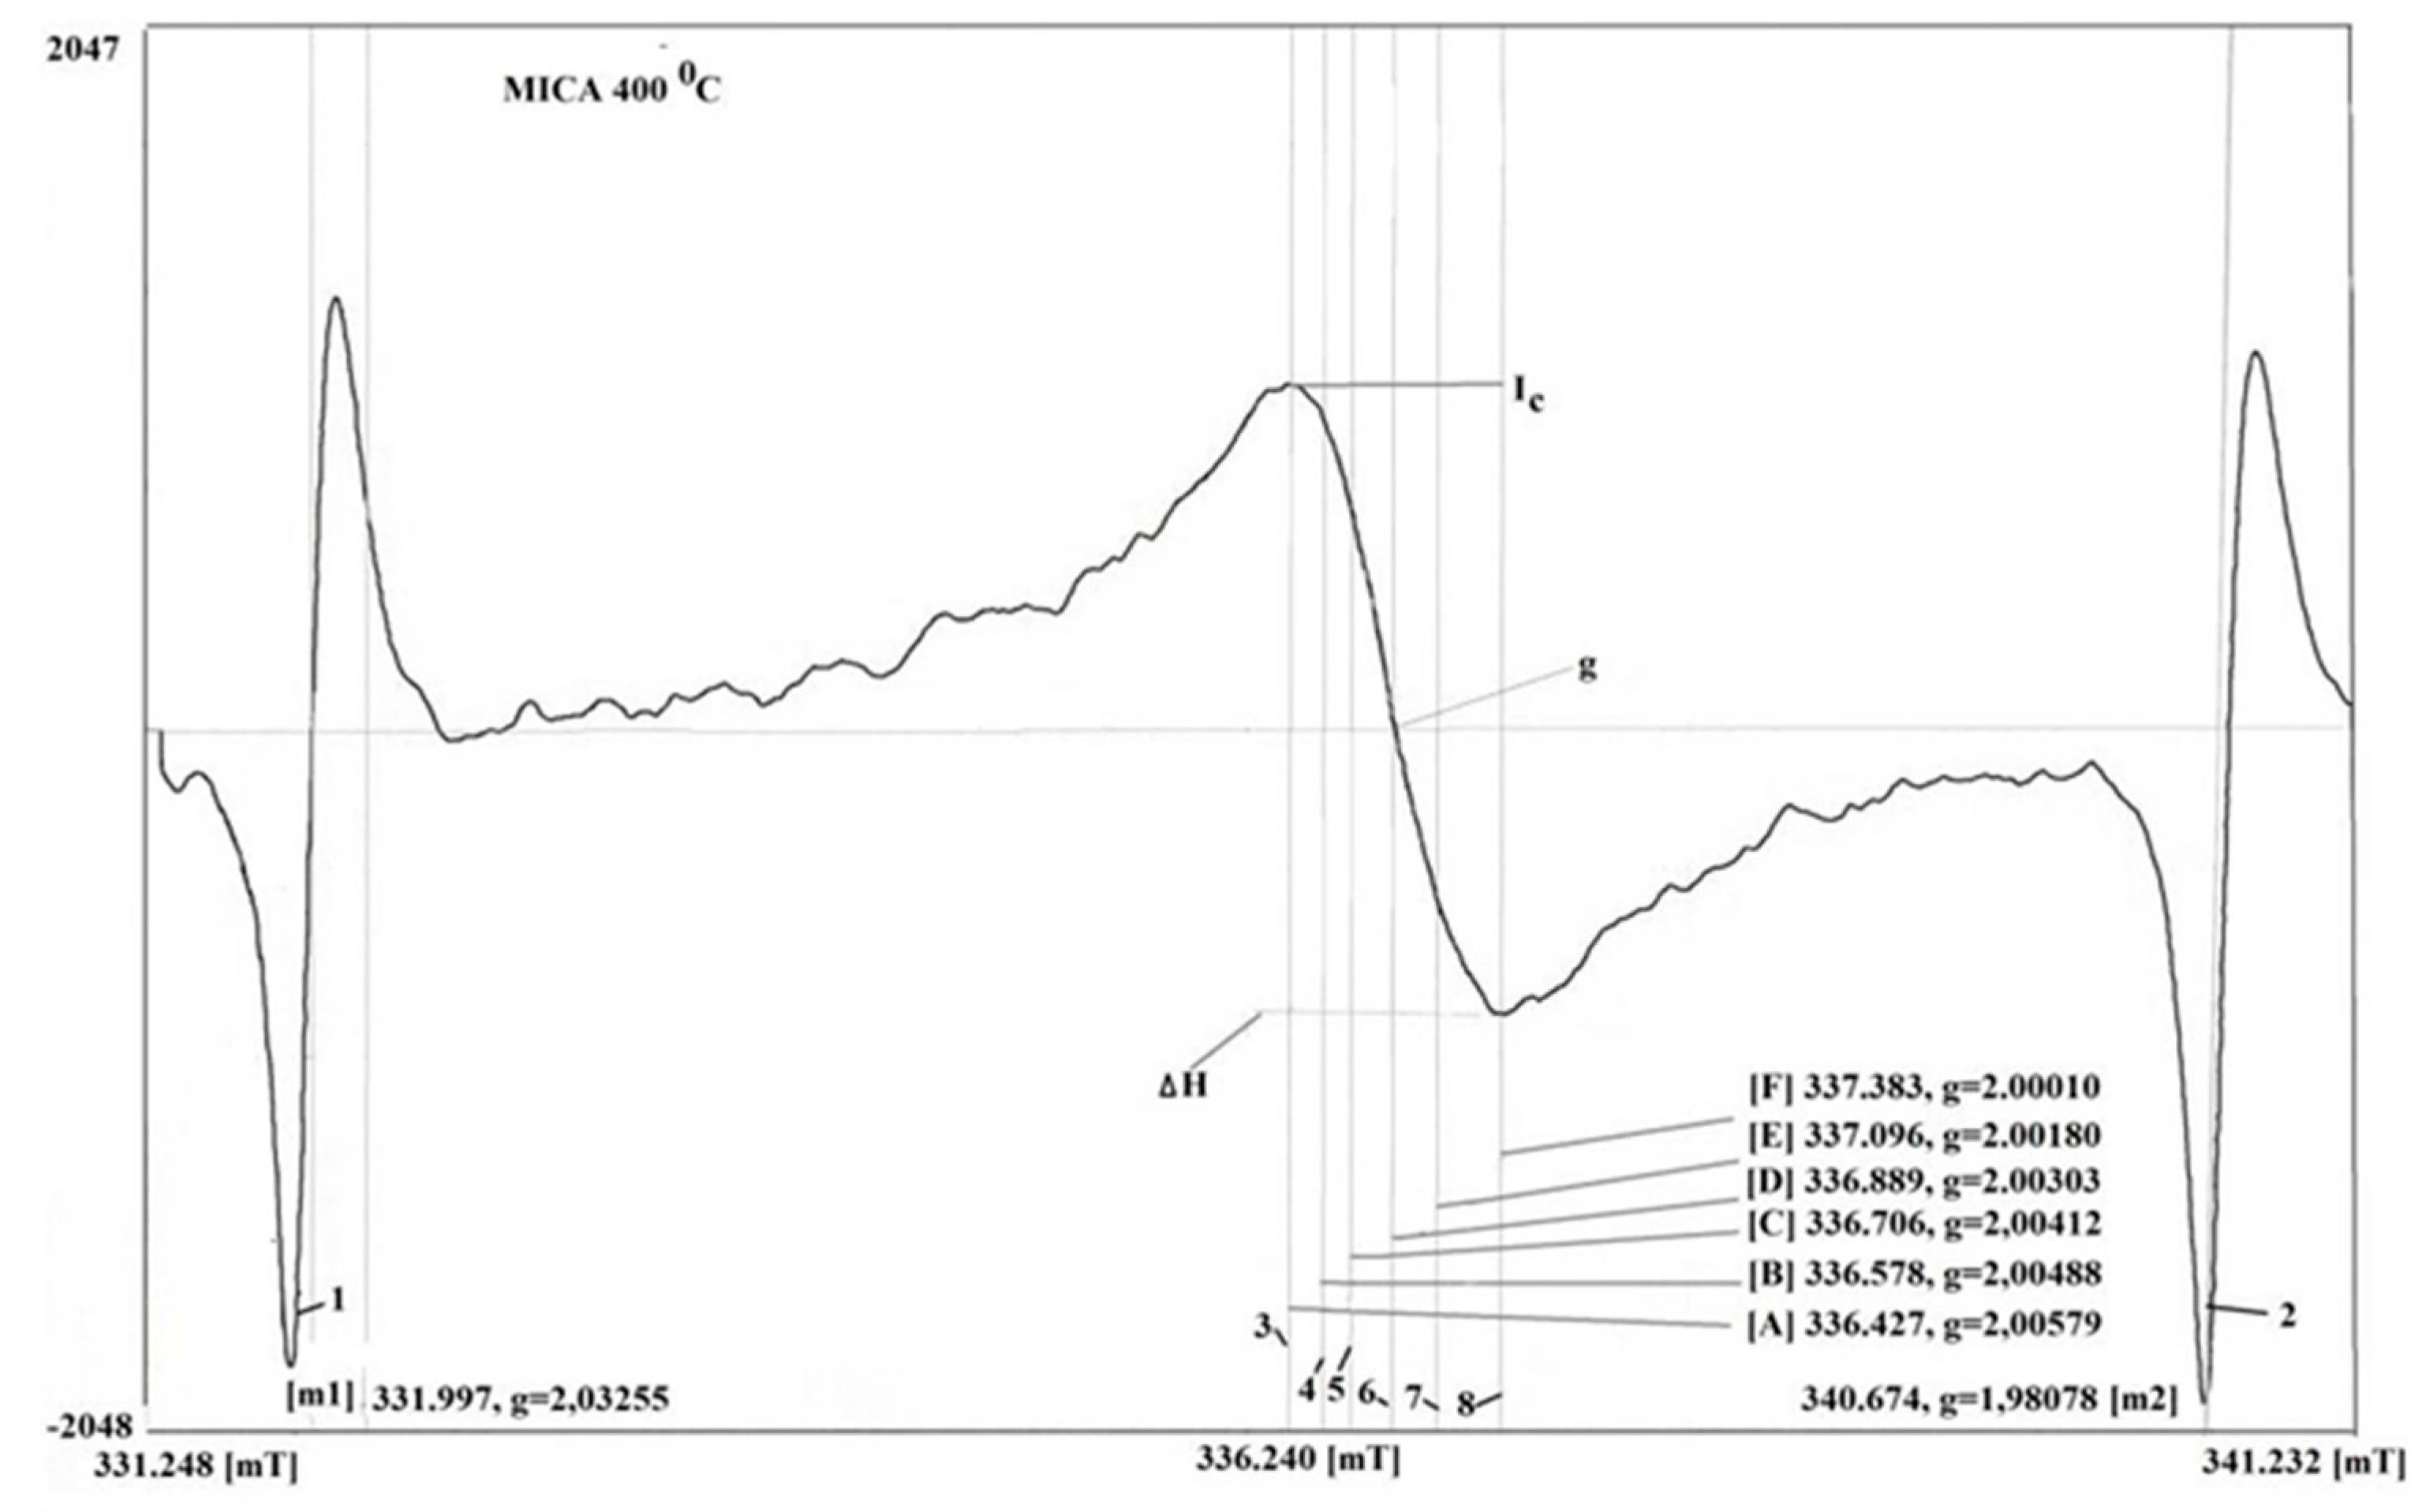
Figure 2.
The dependence of the intensity of the EPR signal on the temperature of carbon films on different substrates: (a) at the perpendicular arrangement of plane of a sample relative to the orientation of the magnetic field, (b) at a parallel arrangement of the plane of the sample relative of the orientation of the magnetic field.
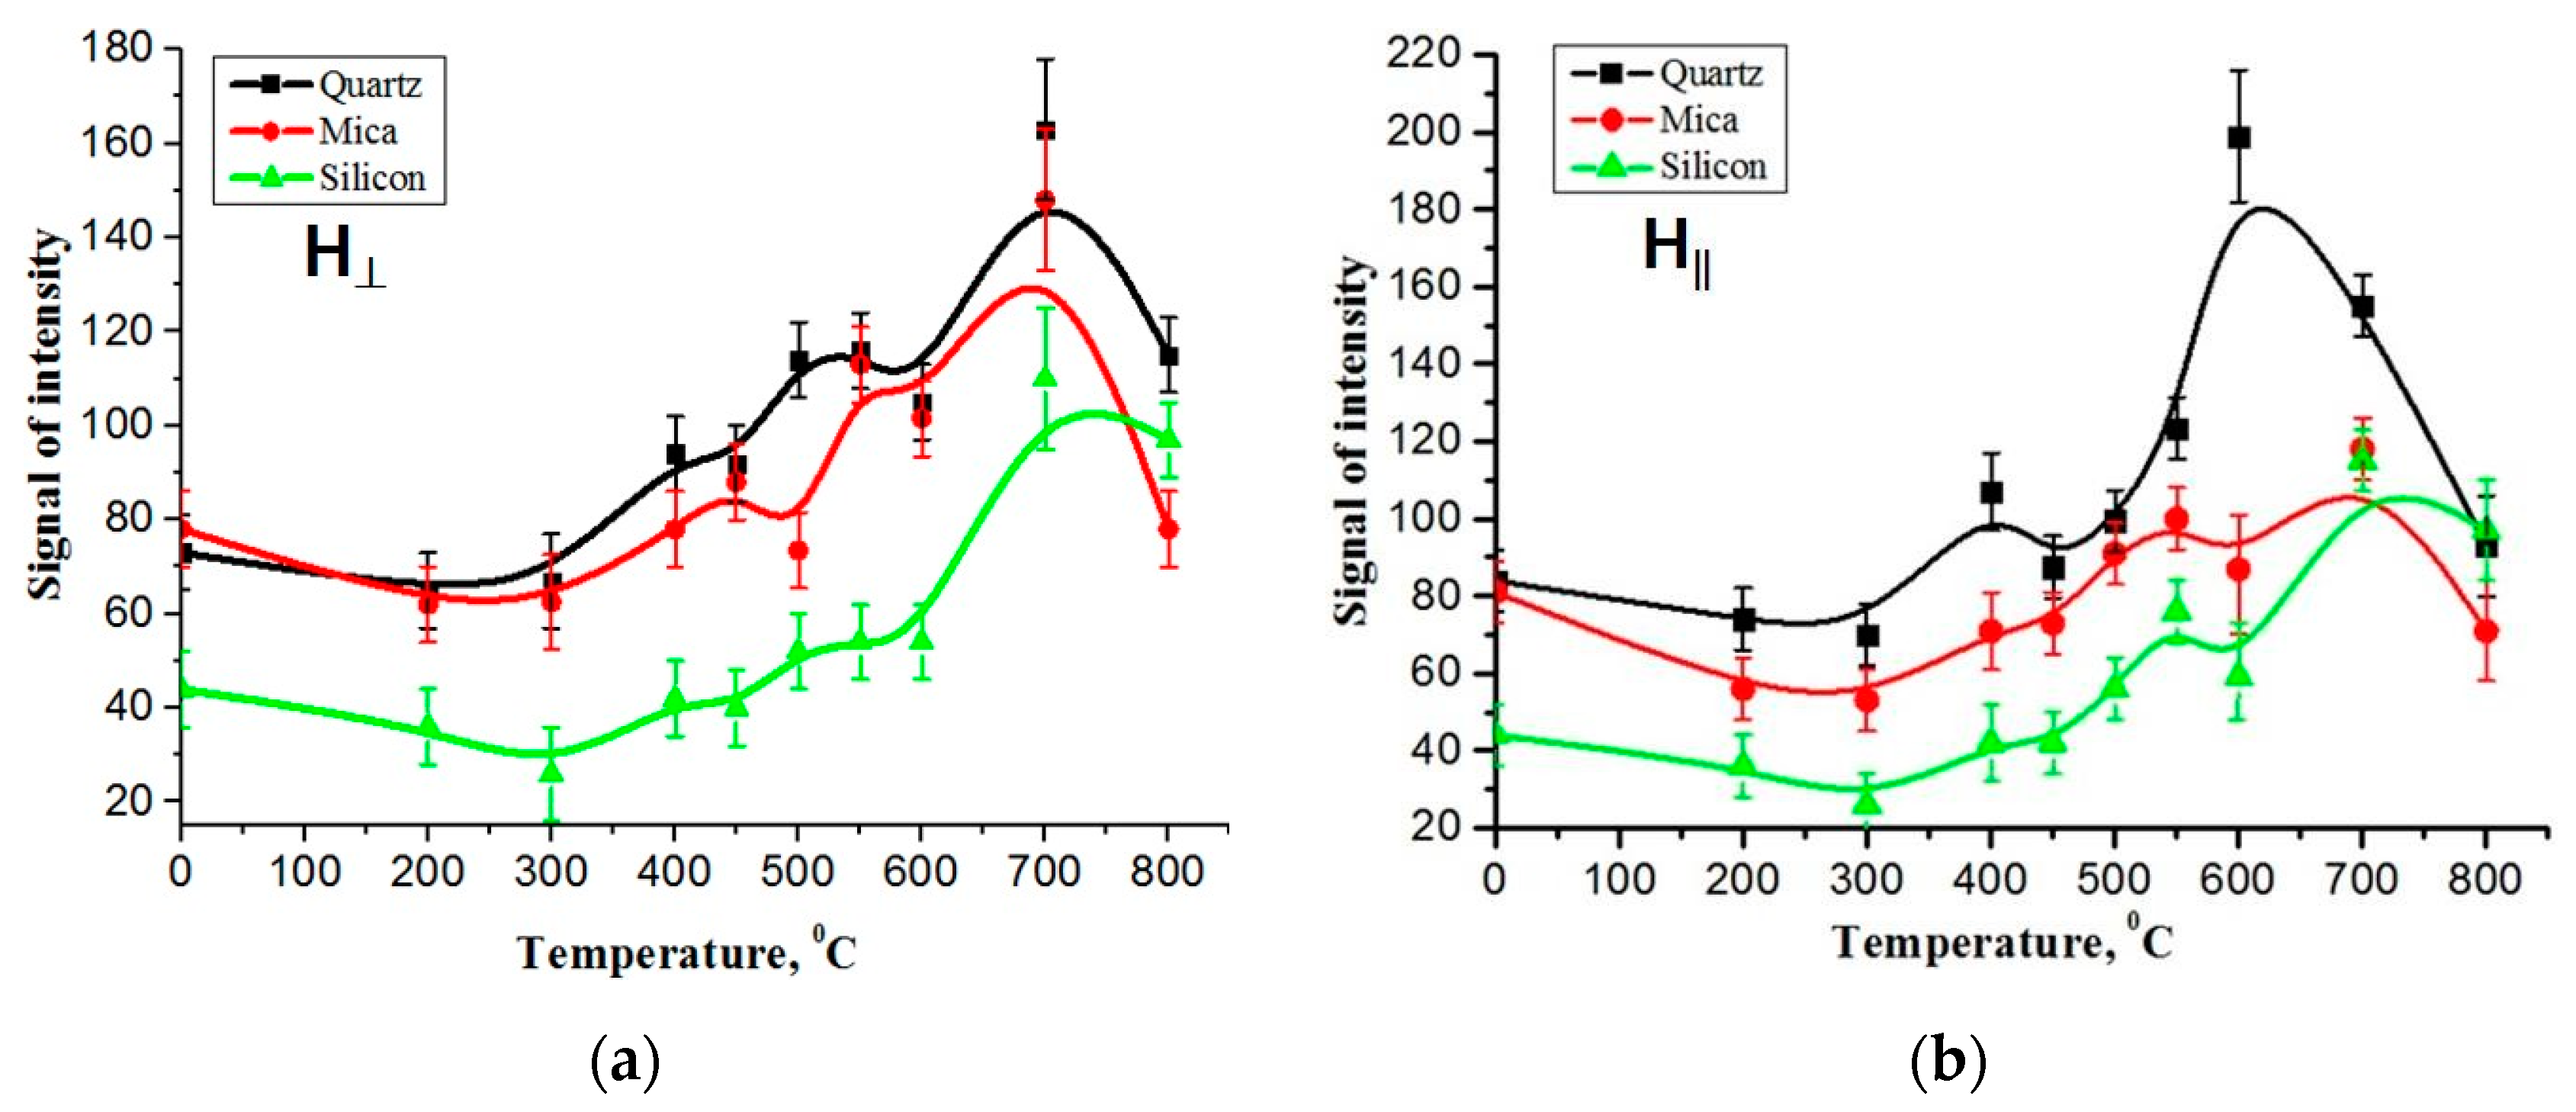
Figure 3.
The dependence of the linewidth of the EPR signal on the temperature of carbon films on different substrates: (a) at the perpendicular arrangement of the plane of the sample relative to the orientation of the magnetic field, (b) at the parallel arrangement of the plane of the sample relative to the orientation of the magnetic field.
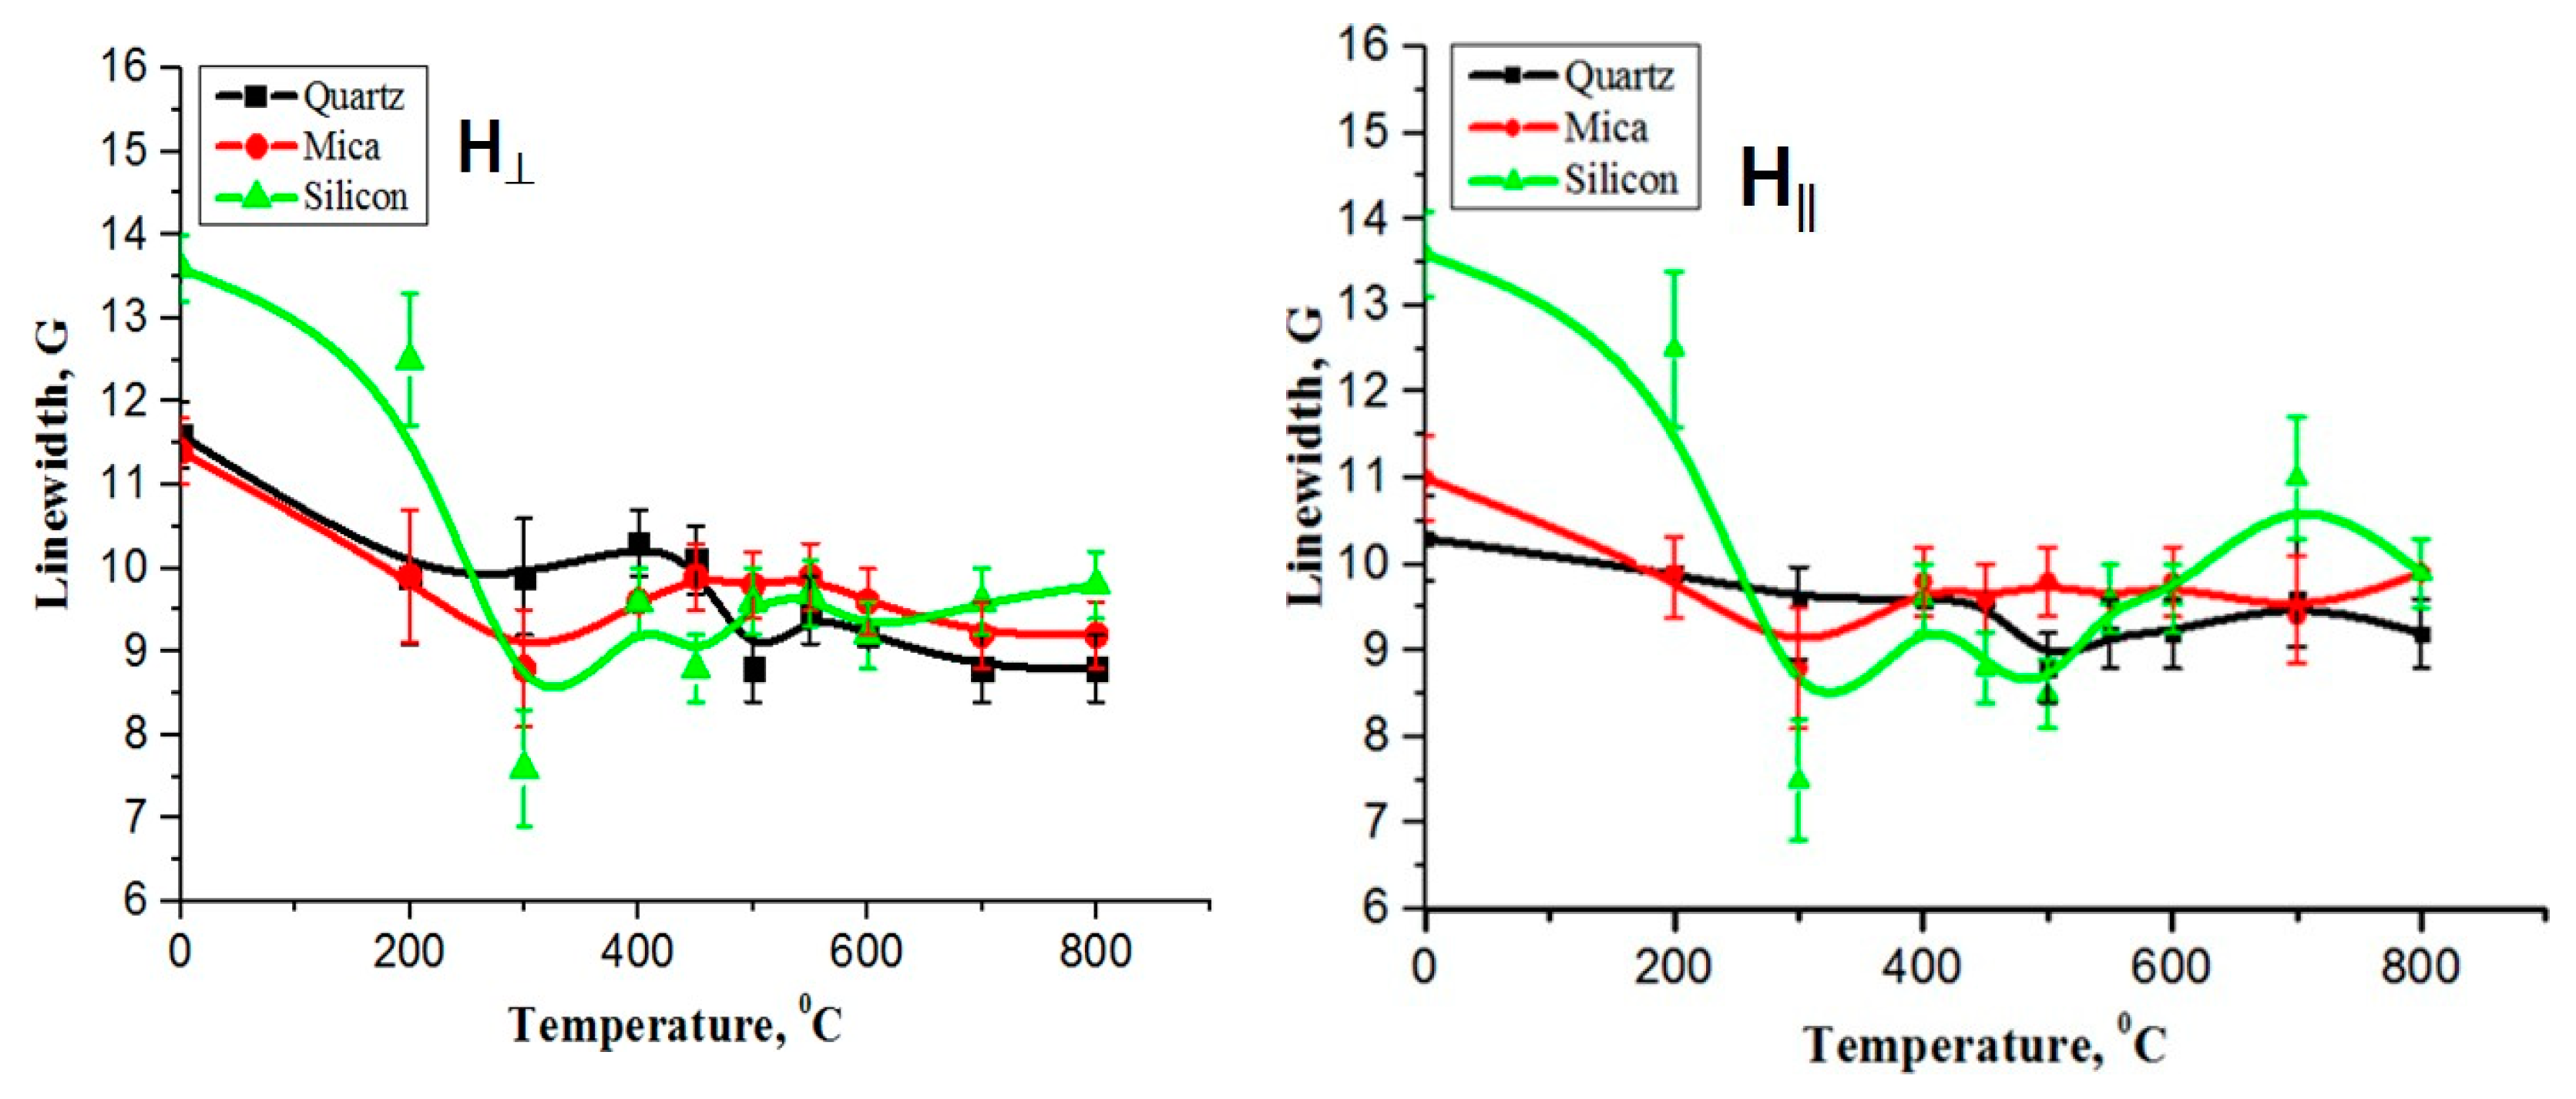
Figure 4.
The dependence of the normalized intensity of EPR signal on the temperature of carbon films on different substrates: (a) at the perpendicular arrangement of the plane of the sample relative to the orientation of the magnetic field, (b) at the parallel arrangement of the plane of the sample relative to the orientation of the magnetic field.
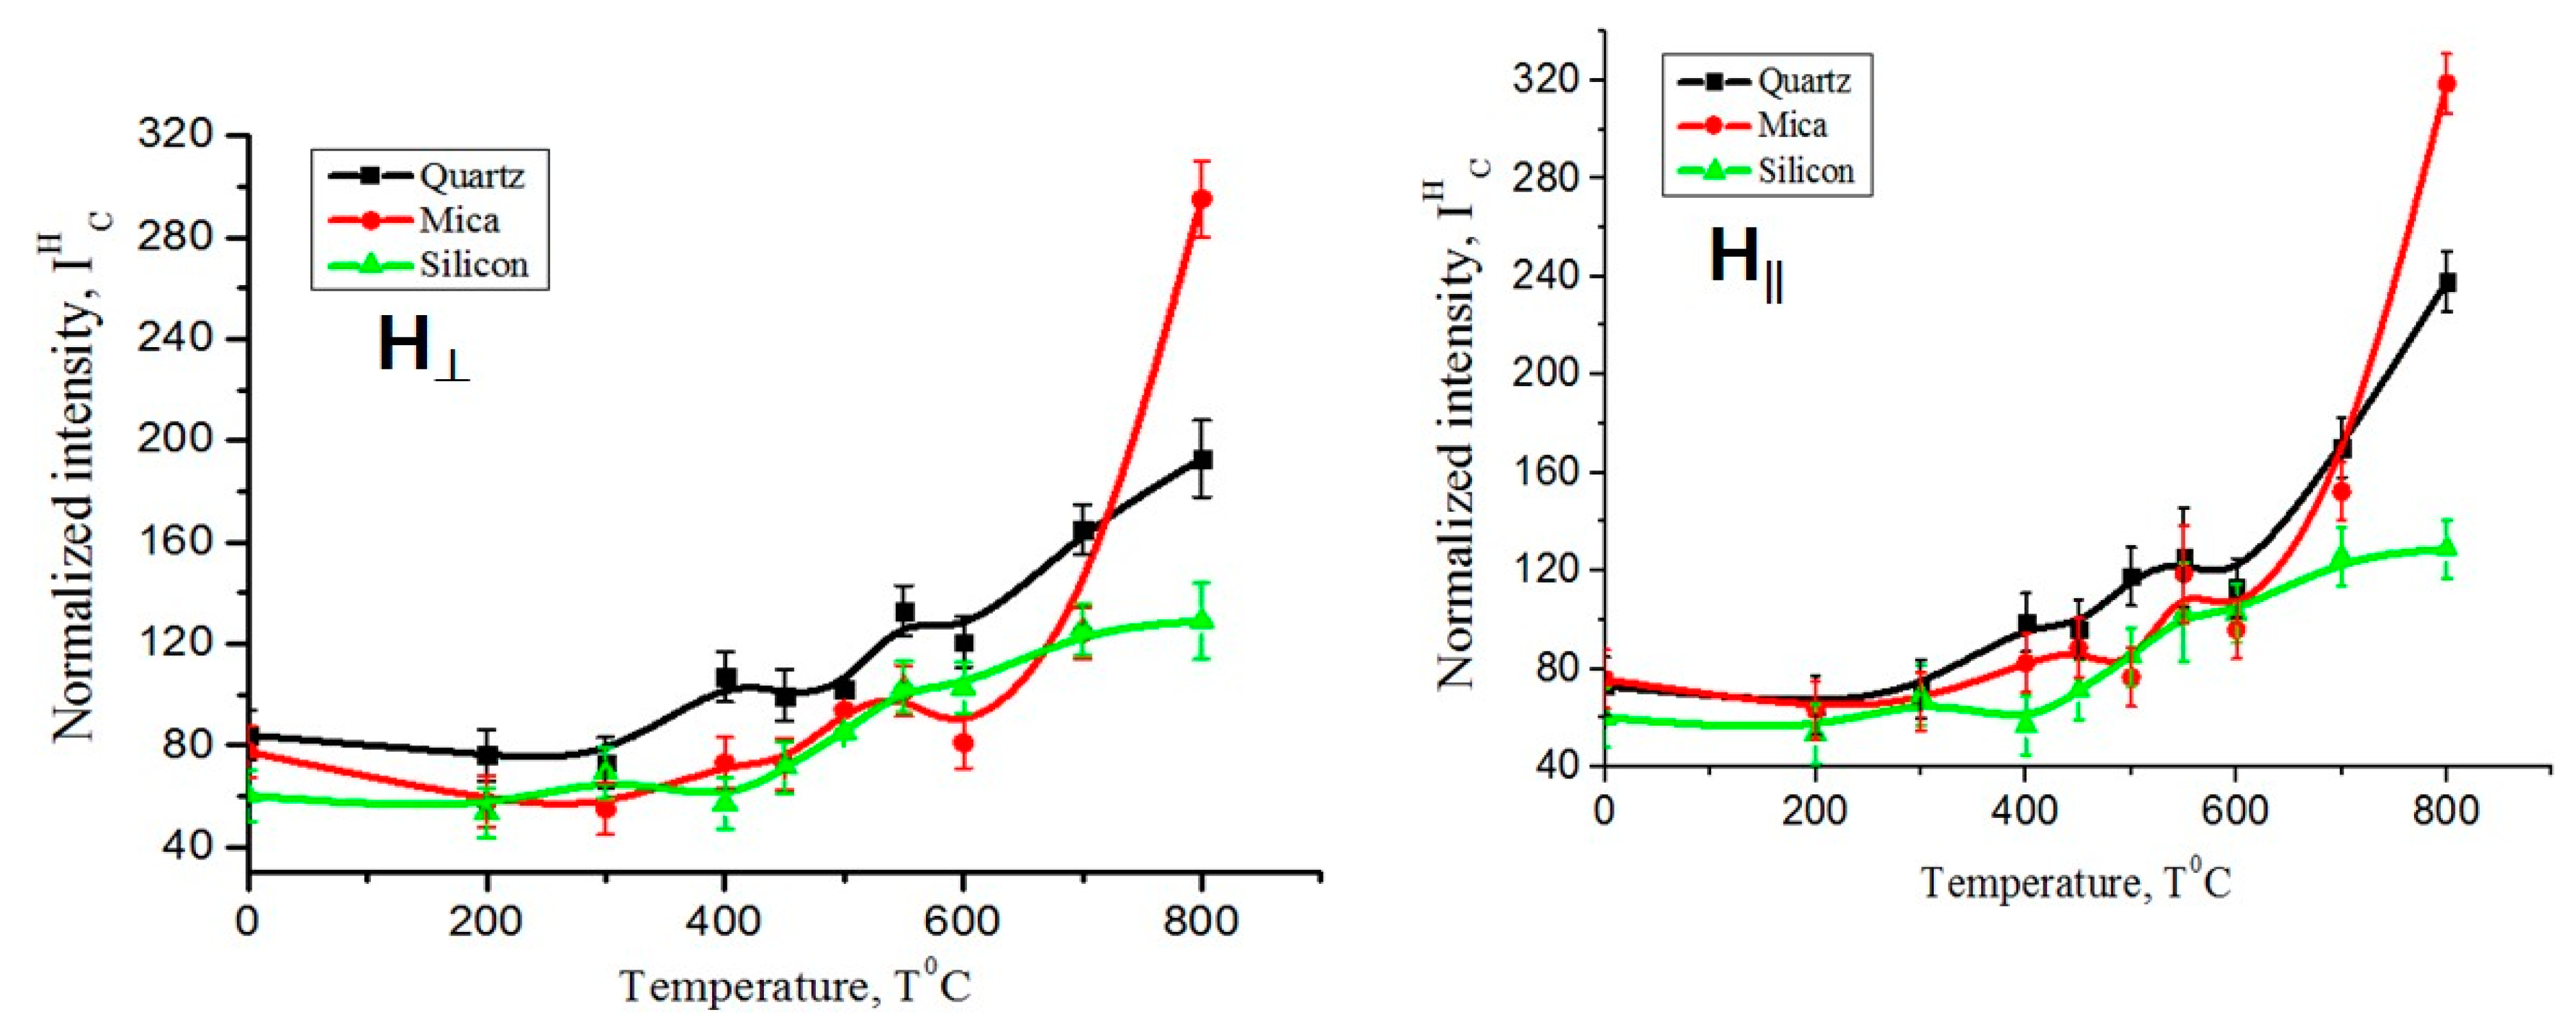

Table 1.
The parameters of the EPR spectra of a carbon film on a mica substrate.
| No | Н, mT | g-factor | No | Н, mT | g-factor |
| 1 | 331.997 | 2.03255 | 5 | 336.706 | 2.00412 |
| 2 | 340.674 | 1.98078 | 6 | 336.889 | 2.00303 |
| 3 | 336.427 | 2.00579 | 7 | 337.096 | 2.00180 |
| 4 | 336.578 | 2.00488, | 8 | 337.383 | 2.00010 |
Table 2.
Parameters of the g-factor at different arrangement of sample of carbon films on various substrates.
Table 2.
Parameters of the g-factor at different arrangement of sample of carbon films on various substrates.
| g||- - factor of spectra | g⊥- factor of spectra | |||||
| T, 0С | Quartz | Mica | Silicon | Quartz | Mica | Silicon |
| 0 | 2.00283 | 2.00279 | 2.00264 | 2.00287 | 2.00293 | 2.00264 |
| 200 | 2.00292 | 2.00293 | 2.00249 | 2.00291 | 2.00319 | 2.00249 |
| 300 | 2.00304 | 2.00297 | 2.00221 | 2.00301 | 2.00293 | 2.00221 |
| 400 | 2.00324 | 2.00303 | 2.00257 | 2.00292 | 2.00288 | 2.00257 |
| 450 | 2.00311 | 2.00292 | 2.00278 | 2.00303 | 2.00238 | 2.00225 |
| 500 | 2.00302 | 2.00293 | 2.00294 | 2.00302 | 2.00303 | 2.00237 |
| 550 | 2.00326 | 2.00313 | 2.00281 | 2.00318 | 2.00313 | 2.00364 |
| 600 | 2.00319 | 2.00306 | 2.00304 | 2.00292 | 2.00326 | 2.00304 |
| 700 | 2.00329 | 2.00332 | 2.00303 | 2.00304 | 2.00322 | 2.00306 |
| 800 | 2.00327 | 2.00301 | 2.00303 | 2.00327 | 2.00292 | 2.00303 |
Disclaimer/Publisher’s Note: The statements, opinions and data contained in all publications are solely those of the individual author(s) and contributor(s) and not of MDPI and/or the editor(s). MDPI and/or the editor(s) disclaim responsibility for any injury to people or property resulting from any ideas, methods, instructions or products referred to in the content. |
© 2023 by the authors. Licensee MDPI, Basel, Switzerland. This article is an open access article distributed under the terms and conditions of the Creative Commons Attribution (CC BY) license (http://creativecommons.org/licenses/by/4.0/).
Copyright: This open access article is published under a Creative Commons CC BY 4.0 license, which permit the free download, distribution, and reuse, provided that the author and preprint are cited in any reuse.


