
Submitted:
19 April 2023
Posted:
20 April 2023
You are already at the latest version
Abstract
In this work, we report manganese phthalocyanine (MnPc) films obtained by ultrasonic spray-pyrolysis technique at 40°C deposited on glass substrate subjected to thermal annealing at 100 °C and 120°C. The MnPc films were characterized by UV/Vis spectroscopy, Raman spectroscopy, X-Ray Diffraction (XRD) and Scanning Electron Microscopy (SEM). The absorption spectra of the MnPc films were studied in a wavelength range from 200 to 850 nm, where the characteristic bands of a metallic phthalocyanine known as B and Q bands were observed in this range of the spectrum. The optical energy band (Eg) was calculated by the Tauc equation. It was found that for these MnPc films, the Eg has the values of 4.41, 4.46 and 3.58 eV corresponding to as deposited, annealing 100°C and 120°C, respectively. The Raman spectra of the films showed their characteristic vibrational modes of the MnPc films. In X-ray diffractograms of these films, the characteristic diffraction peaks of a metallic phthalocyanine are observed, presenting a monoclinic phase. SEM images of these films were studied in cross section obtaining thicknesses of 2, 1.2 and 0.3 μm to as deposited, annealing 100°C and 120°C, successively. Also, in the SEM images of these films, both the average particle sizes ranging from 4 to 0.041 µm and the average diameter from 4.8 to 0.091 μm were obtained. The results agree with those reported in the literature for MnPc films deposited with other techniques.
Keywords:
Manganese phthalocyanine (MnPc)
; Ultrasonic spray pyrolysis
; UV/Vis
; Raman
; XRD
; SEM
1. Introduction
Metal phthalocyanines (MPcs) belong to the group of organic compounds, which are usually formed by carbon-carbon and carbon-hydrogen bonds [1,2,3,4,5]. Metal phthalocyanines are a type of molecules studied in different fields due to their good physical and chemical properties [3,5,6,7,8] and for their chemical inertness and thermal stability which led to researchers explore the technological utility of metallic phthalocyanines in fields such as: industrial dyes, catalysts, gas diffusion electrodes, organic photoconductors, photovoltaic solar cells, organic light emitting devices, nonlinear optics, data storage optics, electro photography, near infrared absorbers, photodynamic therapy, among others [5,6,7,8,9].
Metal phthalocyanine organic semiconductor exhibits interesting optical characteristics due to its ring structure [10]. The MPc shows two characteristic bands one of them called B Band (known as Soret Band) and the other one is called Q Band (known as α Band in porphyrin [10]). The latter is characterized by π→π* transitions from HOMO (Higher Energy Molecular Orbitals Occupied by electrons) to LUMO (Lower Energy Molecular Orbitals unoccupied by electrons) [11,12] and in the case of the B band it is known by deeper π→π* transitions in the UV/Vis spectrum [12].
The MPc can be deposited in the form of thin films. Thin films are layers of thin materials that grow from atoms or molecules that impinge on the surface of a substrate [13,14]. Thin films range in thickness from a few nanometers to a few hundred micrometers [13] and can be deposited by different techniques [15]. The techniques for depositing thin films can be divided into chemical methods or physical methods, according to the nature of the deposit, the most commonly used methods are: Physical Vapor Deposition (PVD) which are thermal evaporation deposition, pulsed laser deposition, molecular beam epitaxy and Sputtering; Chemical Vapor Deposition (CVD) which are organic metal CVD, low pressure CVD, atmospheric pressure CVD and plasma enhanced CVD; Solution Based Chemical (SBC) which are chemical bath deposition, sol-gel, spin coating, dip coating, screen printing and ultrasonic spray pyrolysis [15].
In chemical methods, precursor compounds are used, usually salts of some metallic element, and it is desired that these precursors react chemically on the substrate to be coated [15]. In physical methods, the material to be deposited is initially in powder form and when some type of energy is applied to it, whether mechanical, electrochemical or thermodynamic, the material is removed from the target and is then deposited on the substrate [15]. It is worth mentioning that physical methods require the use of low pressures through vacuum generation to ensure proper deposition and are therefore more expensive compared to chemical methods [15]. Chemical bath and ultrasonic spray-pyrolysis are the simplest and cheapest chemical techniques, due to their simplicity [15,16]. The ultrasonic spray-pyrolysis is an easy process to handle. It can be used to deposit over large areas, in addition to the fact that the deposit temperature is very low. It can be utilized for deposits on flexible materials, in this process it is possible to use a wide variety of precursors, besides the cost of this process is low respect to other techniques. Additionally it does not include a control of high-pressure process. This process has the capability of growing multilayer structures and can have the freedom to calibrate deposition variables such as: deposition temperature, deposition substrate, precursor composition and concentration and solvent composition. In this context, we report in this research the obtaining of MnPc films which were deposited by ultrasonic Spray-Pyrolysis at low temperatures. These films were analyzed with different characterization techniques (UV/Vis, Raman, XRD and SEM) to know their optical, morphological, and structural properties. It expected that these films may applied in the field of optoelectronic devices.
2. Experimental work
Synthesis of MnPc films
Manganese phthalocyanine II was purchased from Sigma Aldrich at 90% purity and was used as solute for the preparation of the solution with ethanol (J.T.Baker) used as a solvent. The reagents were used without any further purification.
Baku BK 2000 ultrasonic bathtub was used to enhance the homogeneous mixing of the solution in the form of suspension. Corning glasses were used as substrates for depositing the MnPc films and a thermal grill (Chemat Technology, model TW-4H) was used for thermal annealing of the MnPc films.
To obtain the manganese phthalocyanine II (MnPc II) films, manganese phthalocyanine II and ethanol were used, where a solution of MnPc and ethanol with a concentration of 0.13 g/ml was made. The solution was placed in the ultrasonic system at a temperature of 50 °C. The films were deposited on a thermal grill for a time of 30 min on a conventional Corning glass substrate at a deposition temperature (TD) of 40 °C (sample labeled as A1). The films were then thermally annealed on the thermal grill to remove impurities at a temperature (Tr) considering two values, namely: at 100 °C for 1hr (A21) and at 120 °C for 2hrs (A22).
Characterization of the films
A Varian (Agilent) Cary 5000 wide range UV-VIS-NIR system (with a PbS mart detector, measuring range from 175 nm to 3300 nm) was used to characterize the grown films. Absorption spectra were measured at normal incidence in a spectral range from 200 to 850 nm. Raman spectra were measured in a range from 400 to 1800 cm−1 on a Horiba-JOBIN YVON MicroRaman system, model LabRAM-HR, with a Helium-Neon laser at 632.8 nm. The diffractograms of the MnPc films were measured by an X-ray diffractometer, model D2 Phaser, Bruker brand, with a Bragg-Brentane geometry, Cu 1.54184 tube [Aº], LYNXEYE detector. The measuring range of 2θ is from 0 to 60° and the sample measurement was horizontally. SEM images of the MnPc films were measured by an Ultra-High Resolution Scanning Electron Microscope JSM-7800F Schottky Field Emission Scanning Electron Microscope (JEOL). Cross-sectional measurements were performed for the MnPc films and μm-scale images were obtained.
3. Results and discussion
Figure 1a shows the UV-Vis spectrum of the MnPcs films. As can be seen, the absorbance spectra of the samples A1 and A21 are stronger than of the A22 film, besides they exhibit the characteristic B band around of 261 nm, 263 and 224 nm. The decrease in the intensity of the B-band absorption peak of the A22 sample around of 224 nm is due to the orbital overlap of the phthalocyanine ring and the central metal ion [11,17]. On the other hand, the three samples exhibit the band Q which lies at 740 nm showing a weak intensity for the three films [11,17]. Another band is presented at 352 nm, it is a characteristic band of the MnPc. It is known that the ultraviolet-visible (UV-vis) absorption spectra of metallic phthalocyanines are the result of their widely conjugated π electrons and the overlapping orbitals of the central metal ion. The B-band is associated with the central metal arising from the π-d [18] transitions.
The optical band gap (Eg) of the samples was determined from the UV/Vis spectra using the Tauc [10] equation (Equation (1)):
where α = Absorption coefficient, h = Planck’s const., v = incident radiation frequency, C1 = proportionality constant, Eg = bandgap energy of the material and n = power whose value depends on the electronic transition presented by the material (MnPc presents a direct allowed transition for which n = 0.5 [10]).
(αhv)1/n = C1(hv − Eg)
The Tauc extrapolation diagram for the abscissa gives the value of the optical band gap (Eg) [10]. Figure 1b shows an example to obtain the forbidden band of the MnPc films, it corresponds to the A21 sample for which Eg = 4.4461 eV. The obtained remaining values of the MnPc films are as follows: Eg = 4.41 eV (A1) and Eg = 3.58 eV (A22), we point out that all these values are very close to those reported in the literature [10,19,20,21,22].
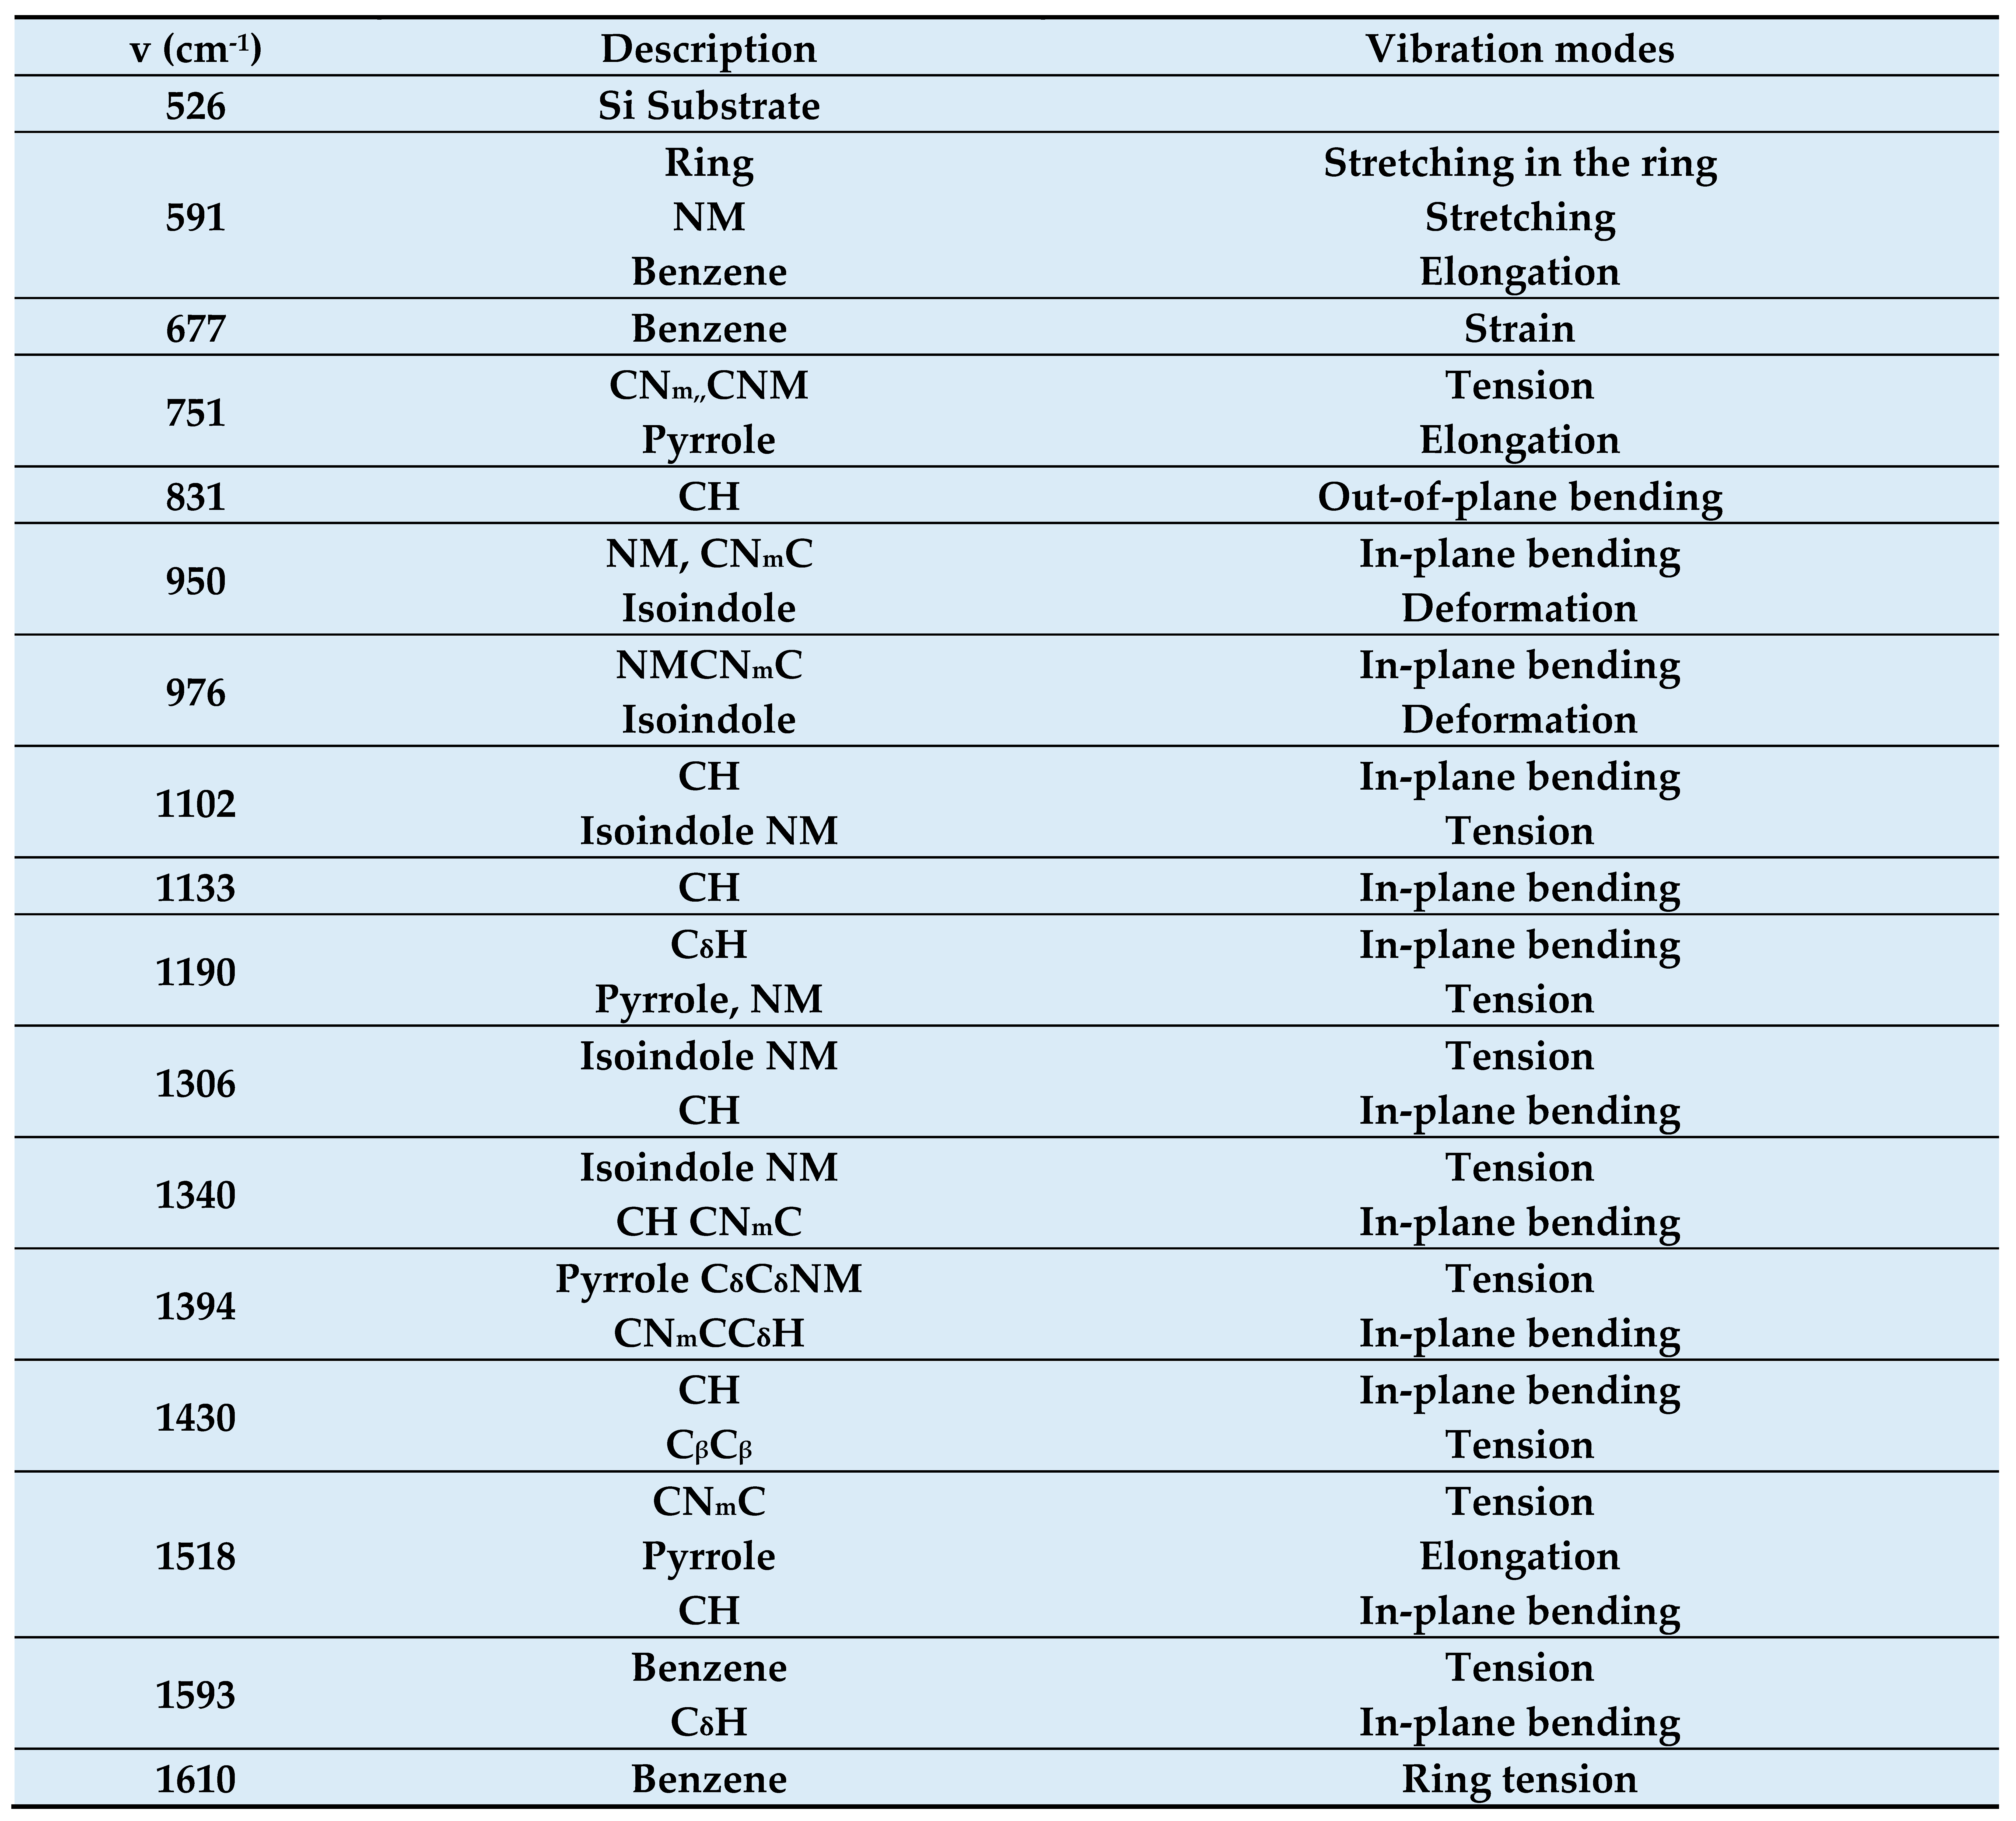
On the other hand, Figure 2 displays the Raman spectra of the MnPn films, so considering this information we generate Table 1 which lists the wavenumbers and vibrational modes found in the Raman spectra, each vibrational mode is described according to its molecule type, and such frequency vibrational mode is like that reported in the literature. The spectra (Figure 2) show the rings or benzenes of the metal phthalocyanine in the ranges of 677 cm−1 (benzene-strain), 1593 cm−1 (benzene, CδH-strain, in-plane bending), 1610 cm−1 (benzene-ring strain). Ring-metal bonding is observed in the ranges 591 cm−1 (ring, NM, benzene-ring-strain, elongation, elongation), 751 cm−1 (CNmCNM, pyrrole-strain, elongation), 950 cm−1-1102 cm−1 (NM, CNmC-in-plane bending, Isoindol-strain, CH-in-plane bending, Isoindol NM-strain), 1190 cm−1-1394 cm−1 (CδH-in-plane bending, pyrrole NM-strain, isoindol NM-strain, CH-in-plane bending, CH CNmC-in-plane bending, pyrrole CδCδNM-strain, CNmCCδH-in-plane bending), 1518 cm−1 (CNmC-strain, pyrrole-elongation, CH-in-plane bending); molecules around the inner ring and externally occur in the ranges of 831 cm−1 (CH-out-of-plane bending), 1133 cm−1 (CH-in-plane bending) and 1430 cm−1 (CH-in-plane bending, CβCβ-strain) [23]. Variations of intensities of the vibrational modes show that annealing process realized on the MnPc films causes a reordering in the molecular structure on the films.
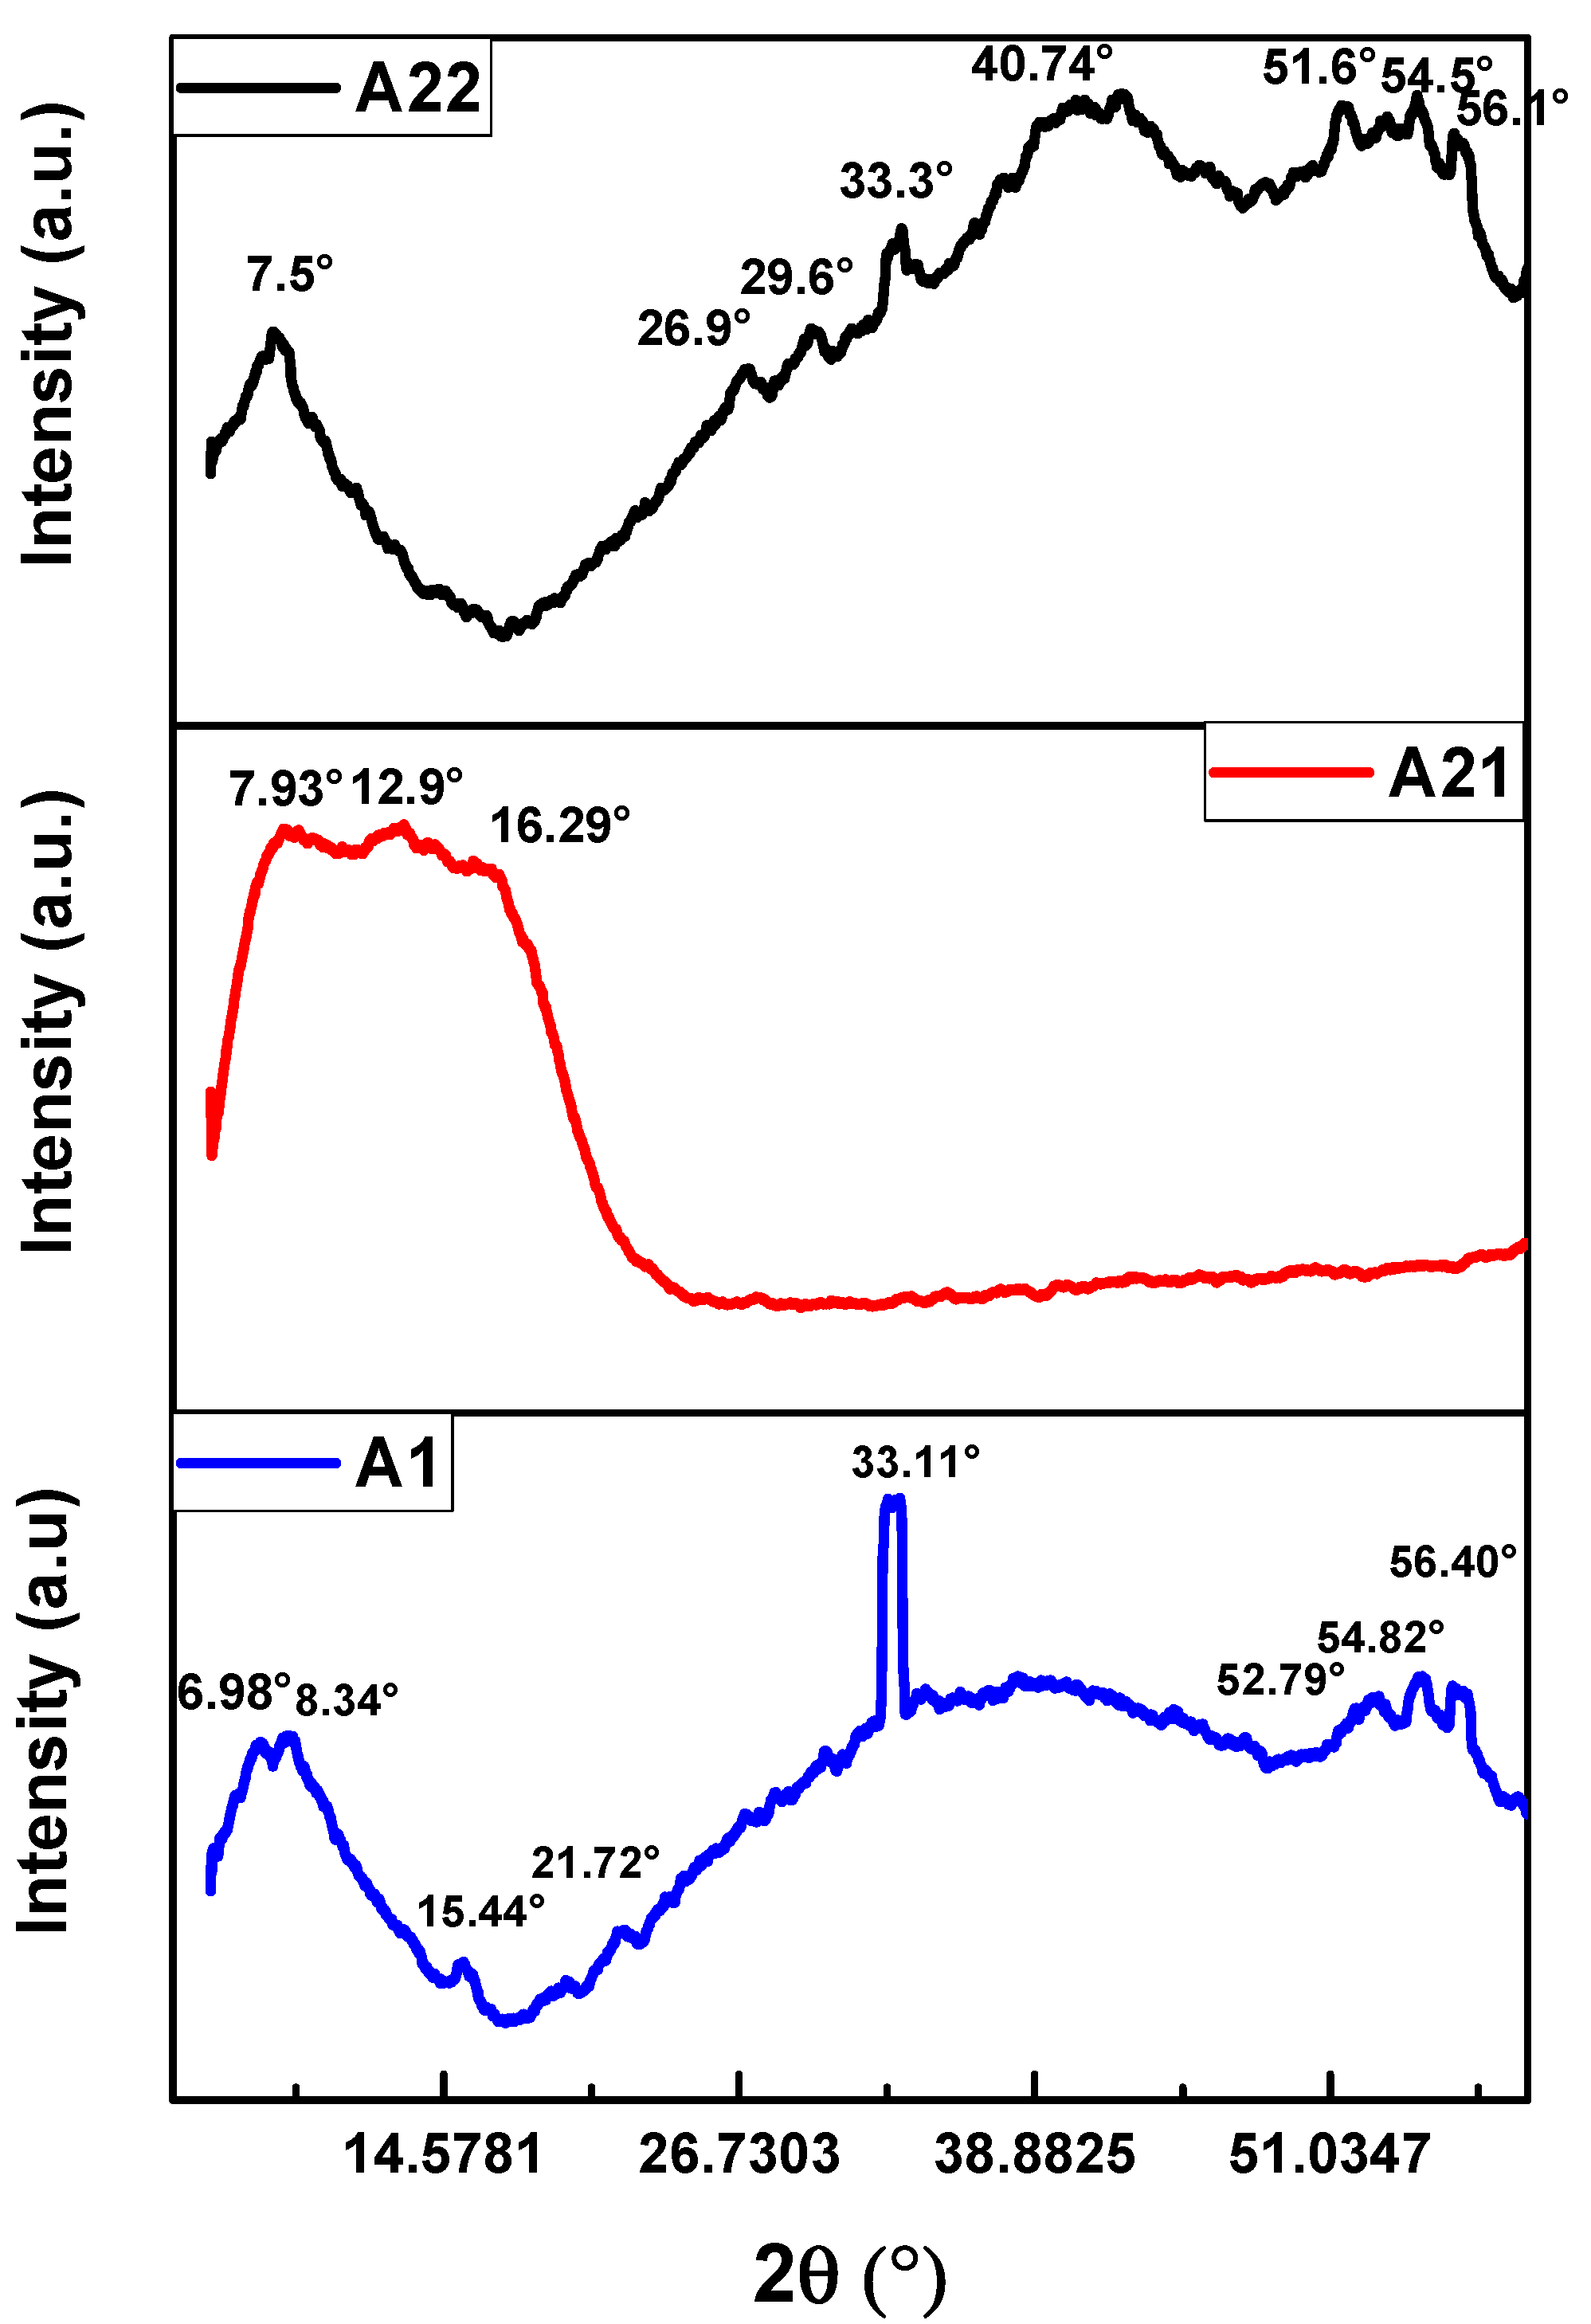
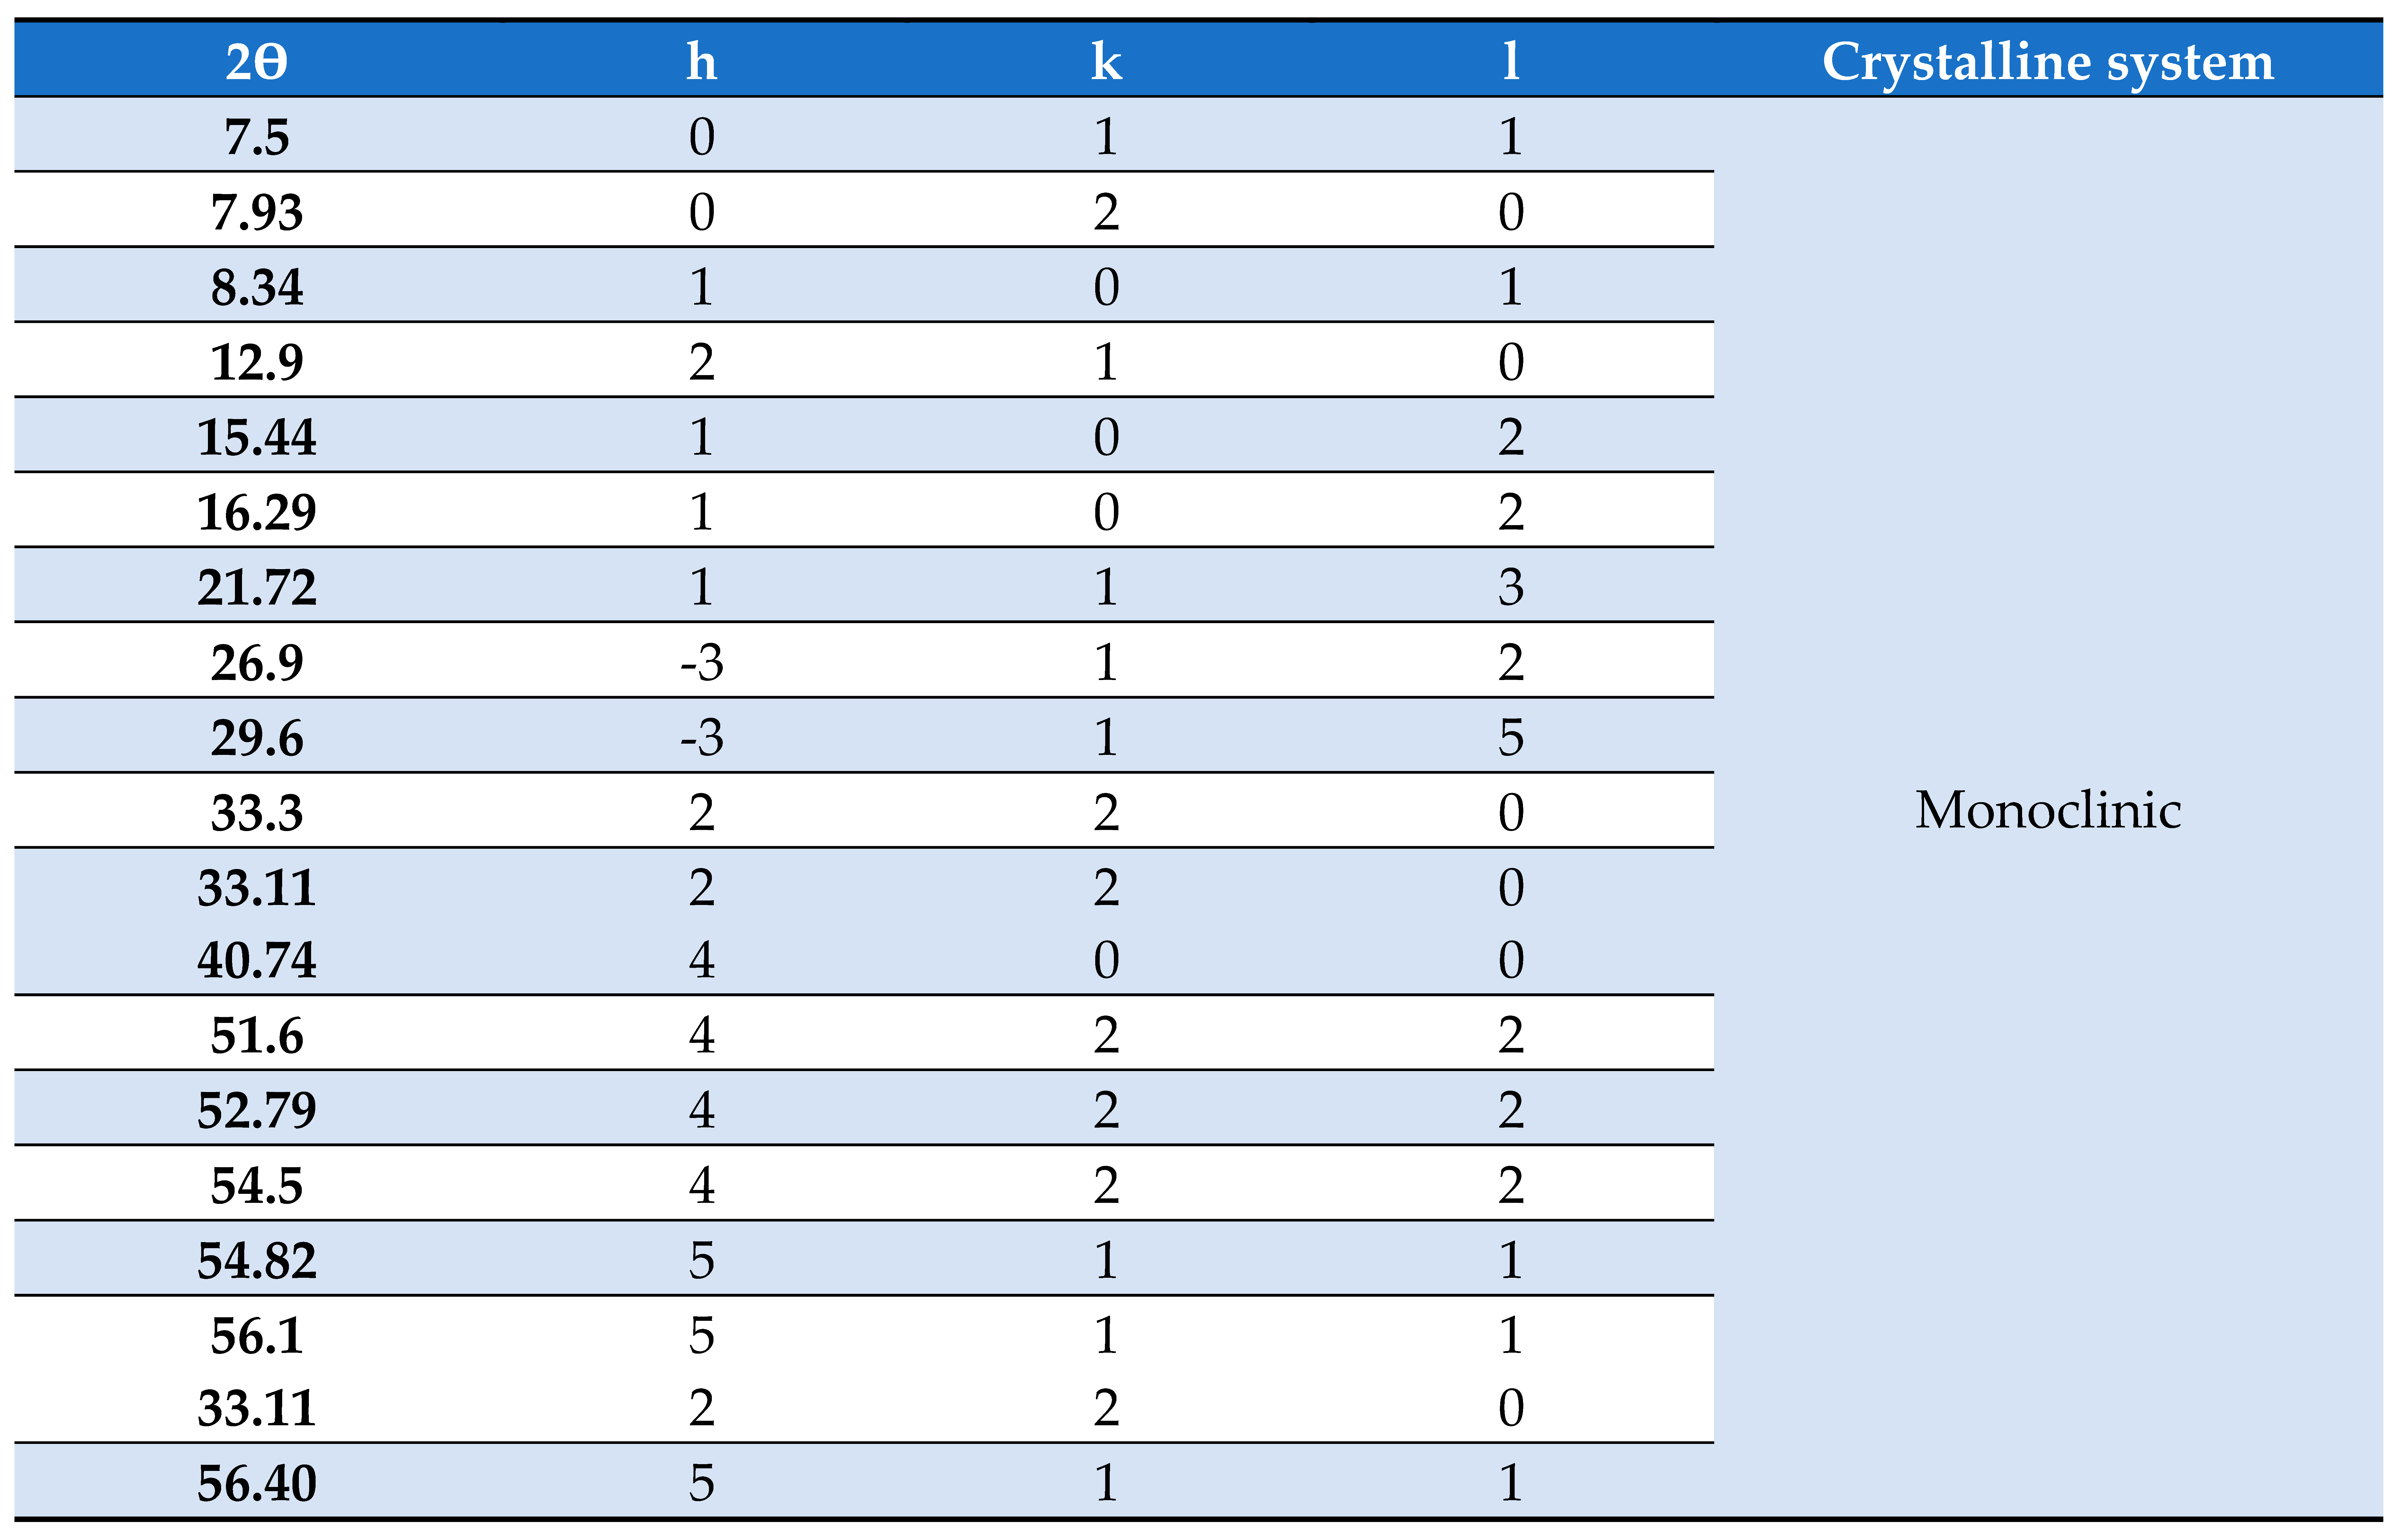
The X-ray diffraction patterns of the MnPc films are shown in Figure 3. The diffractograms show the characteristic diffraction peaks for the monoclinic phase of the MnPc films, this characteristic phase found is confirmed by both crystallographic cards and the reports found in the literature [24,25,26,27,28,29,30,31]. The monoclinic phase is found in the vast majority of metallic phthalocyanines where it is considered a dominant phase [32,33]. All diffraction peaks present the same phase, as listed in Table 2. An outstanding characteristic observed in the diffraction patterns is that the peaks are broad tending to an amorphous behavior. The annealing process applied to the MnPc films modified the diffraction peaks as it is observed in the XRD diffraction patterns.
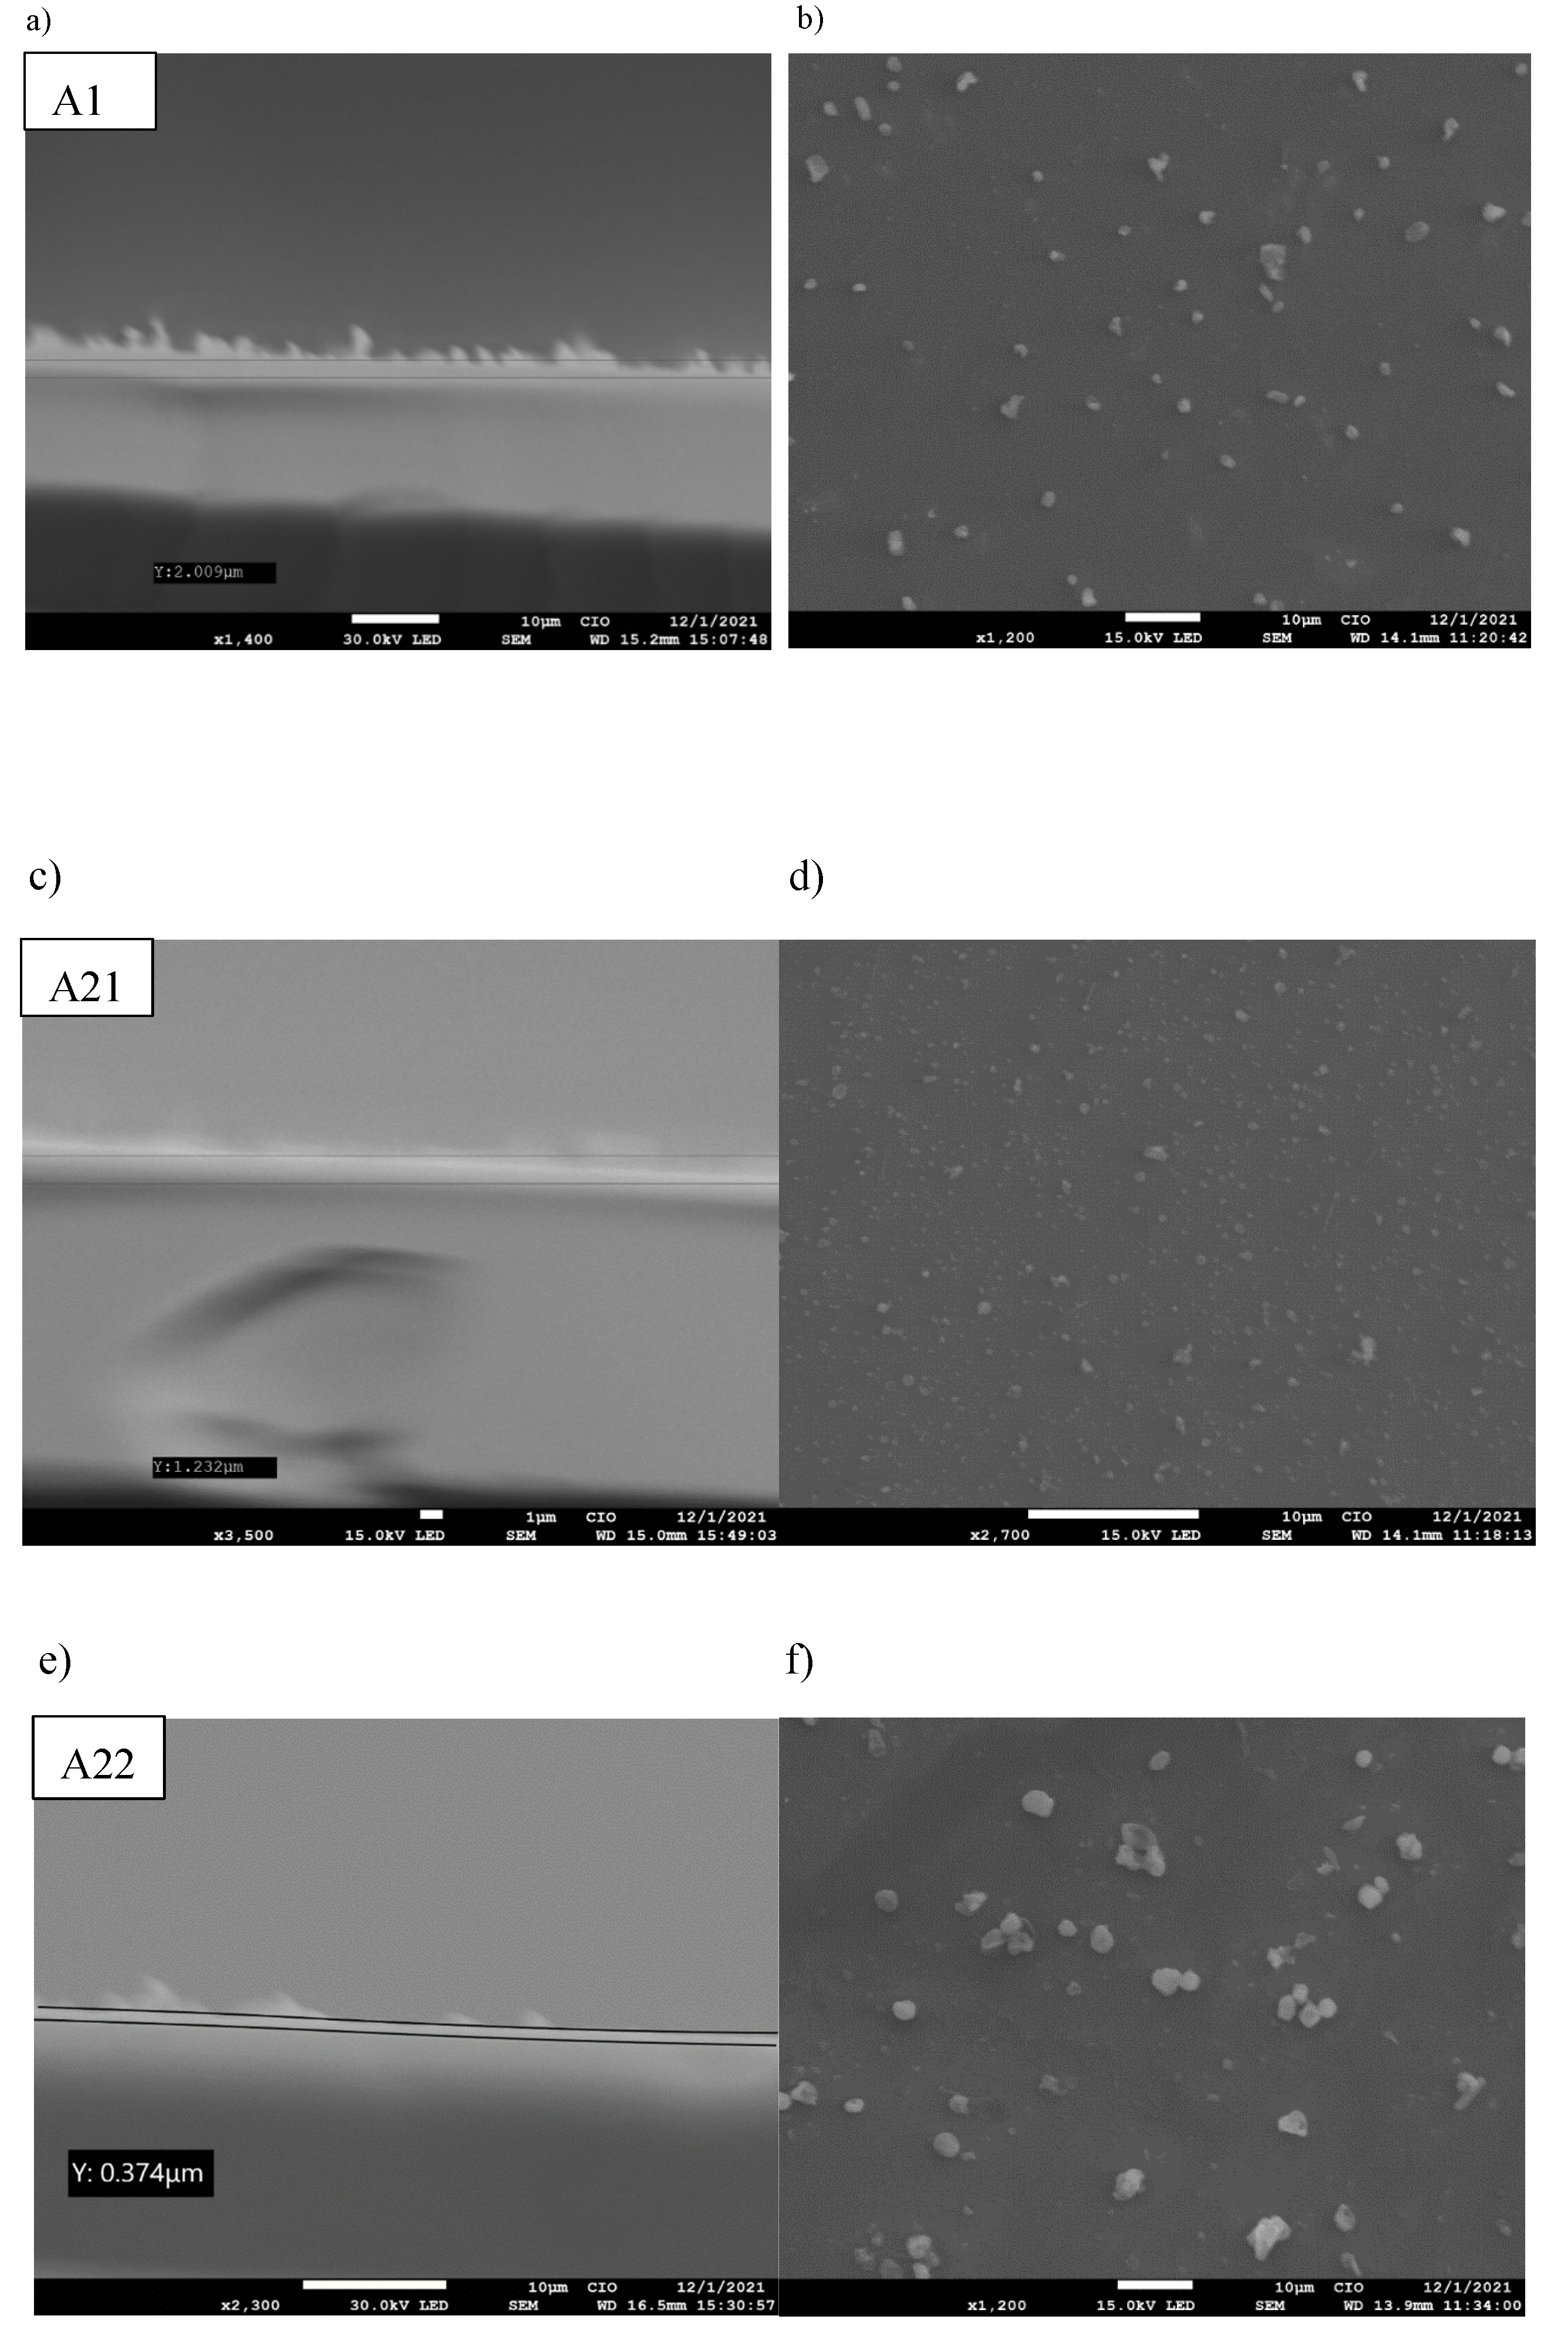
On the others hand, the morphology of the MnPc films was determined by SEM images. Figure 4a,c,e show the cross-sectional SEM images for each film, from these images it is estimated the thickness of such films obtaining the values of 2.009 µm, 1.232 µm, and 0.374 µm for samples A1, A21 and A22, respectively.
The films obtained by ultrasonic spray pyrolysis have a uniform thickness and it is possible to have a good control of their thickness, which allows them to be used in different applications.
Additionally, Figure 4b,d,f show the surface morphology of the MnPc films. The average particle sizes for samples A1, A21 and A22 are 0.169 µm, 1.77 µm and 2.204 µm, respectively. They possess a diameter of approximated values in the ranges, 1.016 µm-4.76 µm, 0.018 µm-1.23 µm and 1 µm-5.79 µm for the MnPc films (A1, A21, A22). The SEM images show circular or spherical particles and some of them accumulate to form aggregates with several spherical particles, forming larger clusters.
Figure 4.
(a,c,e) SEM images (cross section) of MnPc films A1,A21, A22 and (b,d,f) SEM images of the surface of the MnPc films A1, A21 and A22.
Figure 4.
(a,c,e) SEM images (cross section) of MnPc films A1,A21, A22 and (b,d,f) SEM images of the surface of the MnPc films A1, A21 and A22.
4. Conclusions
The MnPc films were obtained from easily handled precursors at a low temperature of 40 °C (A1), which after annealing at 100 °C (A21) and 120 °C (A22) their optical, structural, and compositional properties were modified, as well as these films present thicknesses of 2.009 µm, 1.232 µm and 0.374 µm. In the UV/Vis spectra, the characteristic bands Q and B were obtained at the positions of 740 nm and 263 nm, respectively. From the Raman spectra, the characteristic vibrational modes of an MnPc, and its characteristic molecules identified according to their vibrational modes were obtained. XRD diffractograms showed its crystallographic structure and its characteristic planes of such structure in the monoclinic phase. SEM images showed their morphological characteristics of small clusters dispersed on a uniform film deposited below these clusters or particles, the average particle size was obtained for samples A1, A21 and A22, obtaining the values of 2.319 µm, 0.041µm and 4.465 µm, respectively. Particle diameters were also determined to be approximately 0.72 µm-4.5 µm, 0.091 µm-0.045 µm and 0.91 µm-4.8 µm, respectively.
Acknowledgments
We would like to thank Dr. Alfredo Benítez Lara for allowing us to perform UV/Vis, XRD, SEM measurements at the CIO (Optical Research Center), Dr. Laura Elvira Serrano de la Rosa from the IFUAP Central Laboratory, BUAP for allowing us to perform Raman measurements, Dr. José A. Luna López from CIDS, BUAP for allowing us to use his laboratories for this project.
References
- Mcmurry, J. Polímeros Sintéticos y Biodegradables: Propiedades Físicas; Vol 7a edición; 2008. [Google Scholar]
- Autino, J.C.; Romanelli, G.P.; Ruiz, D.M. Introducción a La Química Orgánica. 2020. [Google Scholar]
- Liu, Z.T.; Kwok, H.S.; Djurišić, A.B. The optical functions of metal phthalocyanines. J. Phys. D: Appl. Phys. 2004, 37, 678–688. [Google Scholar] [CrossRef]
- Sevim, A.M.; Yenilmez, H.Y.; Aydemir, M.; Koca, A.; Bayir, Z.A. Synthesis, electrochemical and spectroelectrochemical properties of novel phthalocyanine complexes of manganese, titanium and indium. Electrochimica Acta 2014, 137, 602–615. [Google Scholar] [CrossRef]
- Bayliss, S.M.; Heutz, S.; Rumbles, G.; Jones, T.S. Thin film properties and surface morphology of metal free phthalocyanine films grown by organic molecular beam deposition. Phys. Chem. Chem. Phys. 1999, 1, 3673–3676. [Google Scholar] [CrossRef]
- Ziminov, A.V.; Ramsh, S.M.; Terukov, E.I.; Trapeznikova, I.N.; Shamanin, V.V.; Yurre, T.A. Correlation dependences in infrared spectra of metal phthalocyanines. Semiconductors 2006, 40, 1131–1136. [Google Scholar] [CrossRef]
- Harbeck, S.; Mack, H. Experimental and Theoretical Investigations on the IR and Raman Spectra for CuPc and TiOPc. University of Tübingen, 2013; 1–19. [Google Scholar]
- Zhu, J.; Shen, Y.; Gu, F.; Tao, J.; Zhang, J. Optical and photoelectric properties of manganese(II) phthalocyanine epoxy derivative. Mater. Lett. 2007, 61, 3086–3088. [Google Scholar] [CrossRef]
- Liu, Z.; Zhang, X.; Zhang, Y.; Jiang, J. Theoretical investigation of the molecular, electronic structures and vibrational spectra of a series of first transition metal phthalocyanines. Spectrochim. Acta Part A: Mol. Biomol. Spectrosc. 2007, 67, 1232–1246. [Google Scholar] [CrossRef]
- Hamam, K.J.; Alomari, M.I. A study of the optical band gap of zinc phthalocyanine nanoparticles using UV–Vis spectroscopy and DFT function. Appl. Nanosci. 2017, 7, 261–268. [Google Scholar] [CrossRef]
- Sen, P.; Zeki Yildiz, S. Substituted manganese phthalocyanines as bleach catalysts: synthesis, characterization and the investigation of de-aggregation behavior with LiCl in solutions. Res. Chem. Intermed. 2019, 45, 687–707. [Google Scholar] [CrossRef]
- Günsel, A.; Kandaz, M.; Yakuphanoglu, F.; Farooq, W.A. Extraction of electronic parameters of organic diode fabricated with NIR absorbing functional manganase phthalocyanine organic semiconductor. Synth. Met. 2011, 161, 1477–1482. [Google Scholar] [CrossRef]
- Sin, S. Técnicas de depósito y caracterización de películas delgadas. 2009, (Cvd). 6–22. [Google Scholar]
- Sobre, I.; Anuncio, E. Thin Films. Available online: https://nanocienciainforma.files.wordpress.com/2012.jpg.
- Nieto, K. Propiedades físicas de películas nanoestructuradas de semiconductores CdS, In2S3 y CdSe obtenidas por la técnica de baño químico. Cent Investig y Estud Av. 2018, 1, 100. [Google Scholar]
- Albella, J.M. Propiedades Y Aplicaciones.
- Günsel, A.; Kandaz, M.; Yakuphanoglu, F.; Farooq, W.A. Extraction of electronic parameters of organic diode fabricated with NIR absorbing functional manganase phthalocyanine organic semiconductor. Synth. Met. 2011, 161, 1477–1482. [Google Scholar] [CrossRef]
- Cranston, R.R.; Lessard, B.H. Metal phthalocyanines: thin-film formation, microstructure, and physical properties. RSC Adv. 2021, 11, 21716–21737. [Google Scholar] [CrossRef] [PubMed]
- Seoudi, R.; El-Bahy, G.S.; El Sayed, Z.A. Ultraviolet and visible spectroscopic studies of phthalocyanine and its complexes thin films. Opt. Mater. 2006, 29, 304–312. [Google Scholar] [CrossRef]
- Meng, L.; Wang, K.; Han, Y.; Yao, Y.; Gao, P.; Huang, C.; Zhang, W.; Xu, F. Synthesis, structure, and optical properties of manganese phthalocyanine thin films and nanostructures. Prog. Nat. Sci. Mater. Int. 2017, 27, 329–332. [Google Scholar] [CrossRef]
- Günsel, A.; Kocabaş, S.; Bilgiçli, A.T.; Güney, S.; Kandaz, M. Synthesis, photophysical and electrochemical properties of water–soluble phthalocyanines bearing 8-hydroxyquinoline-5-sulfonicacid derivatives. J. Lumin. 2016, 176, 387–396. [Google Scholar] [CrossRef]
- Erdoğmuş, A.; Akinbulu, I.A.; Nyokong, T. Synthesis and electrochemical properties of new cobalt and manganese phthalocyanine complexes tetra-substituted with 3,4-(methylendioxy)-phenoxy. Polyhedron 2010, 29, 2352–2363. [Google Scholar] [CrossRef]
- Marshell, J. FT Raman spectrum and band assignments for metal–free phthalocyanine (H2Pc). Mater. Sci. Res. India 2010, 7, 221–224. [Google Scholar] [CrossRef]
- Neamtu, M.; Nadejde, C.; Brinza, L.; Dragos, O.; Gherghel, D.; Paul, A. Iron phthalocyanine-sensitized magnetic catalysts for BPA photodegradation. Sci. Rep. 2020, 10, 1–12. [Google Scholar] [CrossRef]
- Tackley, D.R.; Smith, W.E. Phthalocyanines: structure and vibrations. 2001. [Google Scholar] [CrossRef]
- Abood, M.A.; Ai-essa, I.M. The effect of conductive polymer on the Structural and Surface Morphology Analysis of NiPcTs:PEDOT:PSS Blend. 2017, 104, 45814–45817. [Google Scholar]
- Hussein, M.T.; Aadim, K.A.; Hassan, E.K. Structural and Surface Morphology Analysis of Copper Phthalocyanine Thin Film Prepared by Pulsed Laser Deposition and Thermal Evaporation Techniques. Adv. Mater. Phys. Chem. 2016, 06, 85–97. [Google Scholar] [CrossRef]
- Touka, N.; Benelmadjat, H.; Boudine, B.; Halimi, O.; Sebais, M. Copper phthalocyanine nanocrystals embedded into polymer host: Preparation and structural characterization. J. Assoc. Arab. Univ. Basic Appl. Sci. 2013, 13, 52–56. [Google Scholar] [CrossRef]
- Feng, X.; Ding, X.; Chen, L.; Wu, Y.; Liu, L.; Addicoat, M.; Irle, S.; Dong, Y.; Jiang, D. Two-dimensional artificial light-harvesting antennae with predesigned high-order structure and robust photosensitising activity. Sci. Rep. 2016, 6, 1–13. [Google Scholar] [CrossRef] [PubMed]
- Mahmood, J.; Ahmad, I.; Jung, M.; Seo, J.-M.; Yu, S.-Y.; Noh, H.-J.; Kim, Y.H.; Shin, H.-J.; Baek, J.-B. Two-dimensional amine and hydroxy functionalized fused aromatic covalent organic framework. Commun. Chem. 2020, 3, 1–7. [Google Scholar] [CrossRef]
- El-Nahass, M.M.; Atta, A.A.; El-Sayed, H.E.A.; El-Zaidia, E.F.M. Structural and optical properties of thermal evaporated magnesium phthalocyanine (MgPc) thin films. Appl. Surf. Sci. 2008, 254, 2458–2465. [Google Scholar] [CrossRef]
- Liu, G.; Liu, S.; Lu, Q.; Sun, H.; Xiu, Z. BiVO4/cobalt phthalocyanine (CoPc) nanofiber heterostructures: Synthesis, characterization and application in photodegradation of methylene blue. RSC Adv. 2014, 4, 53402–53406. [Google Scholar] [CrossRef]
- Ji, X.; Zou, T.; Gong, H.; Wu, Q.; Qiao, Z.; Wu, W.; Wang, H. Cobalt phthalocyanine nanowires: Growth, crystal structure, and optical properties. Cryst. Res. Technol. 2016, 51, 154–159. [Google Scholar] [CrossRef]
Figure 1.
(a) Absorbance spectra of the MnPc films for samples A1, A21 and A22 and (b) determination of the forbidden energy band of the MnPc film (A21) obtained by the Tauc equation.
Figure 1.
(a) Absorbance spectra of the MnPc films for samples A1, A21 and A22 and (b) determination of the forbidden energy band of the MnPc film (A21) obtained by the Tauc equation.
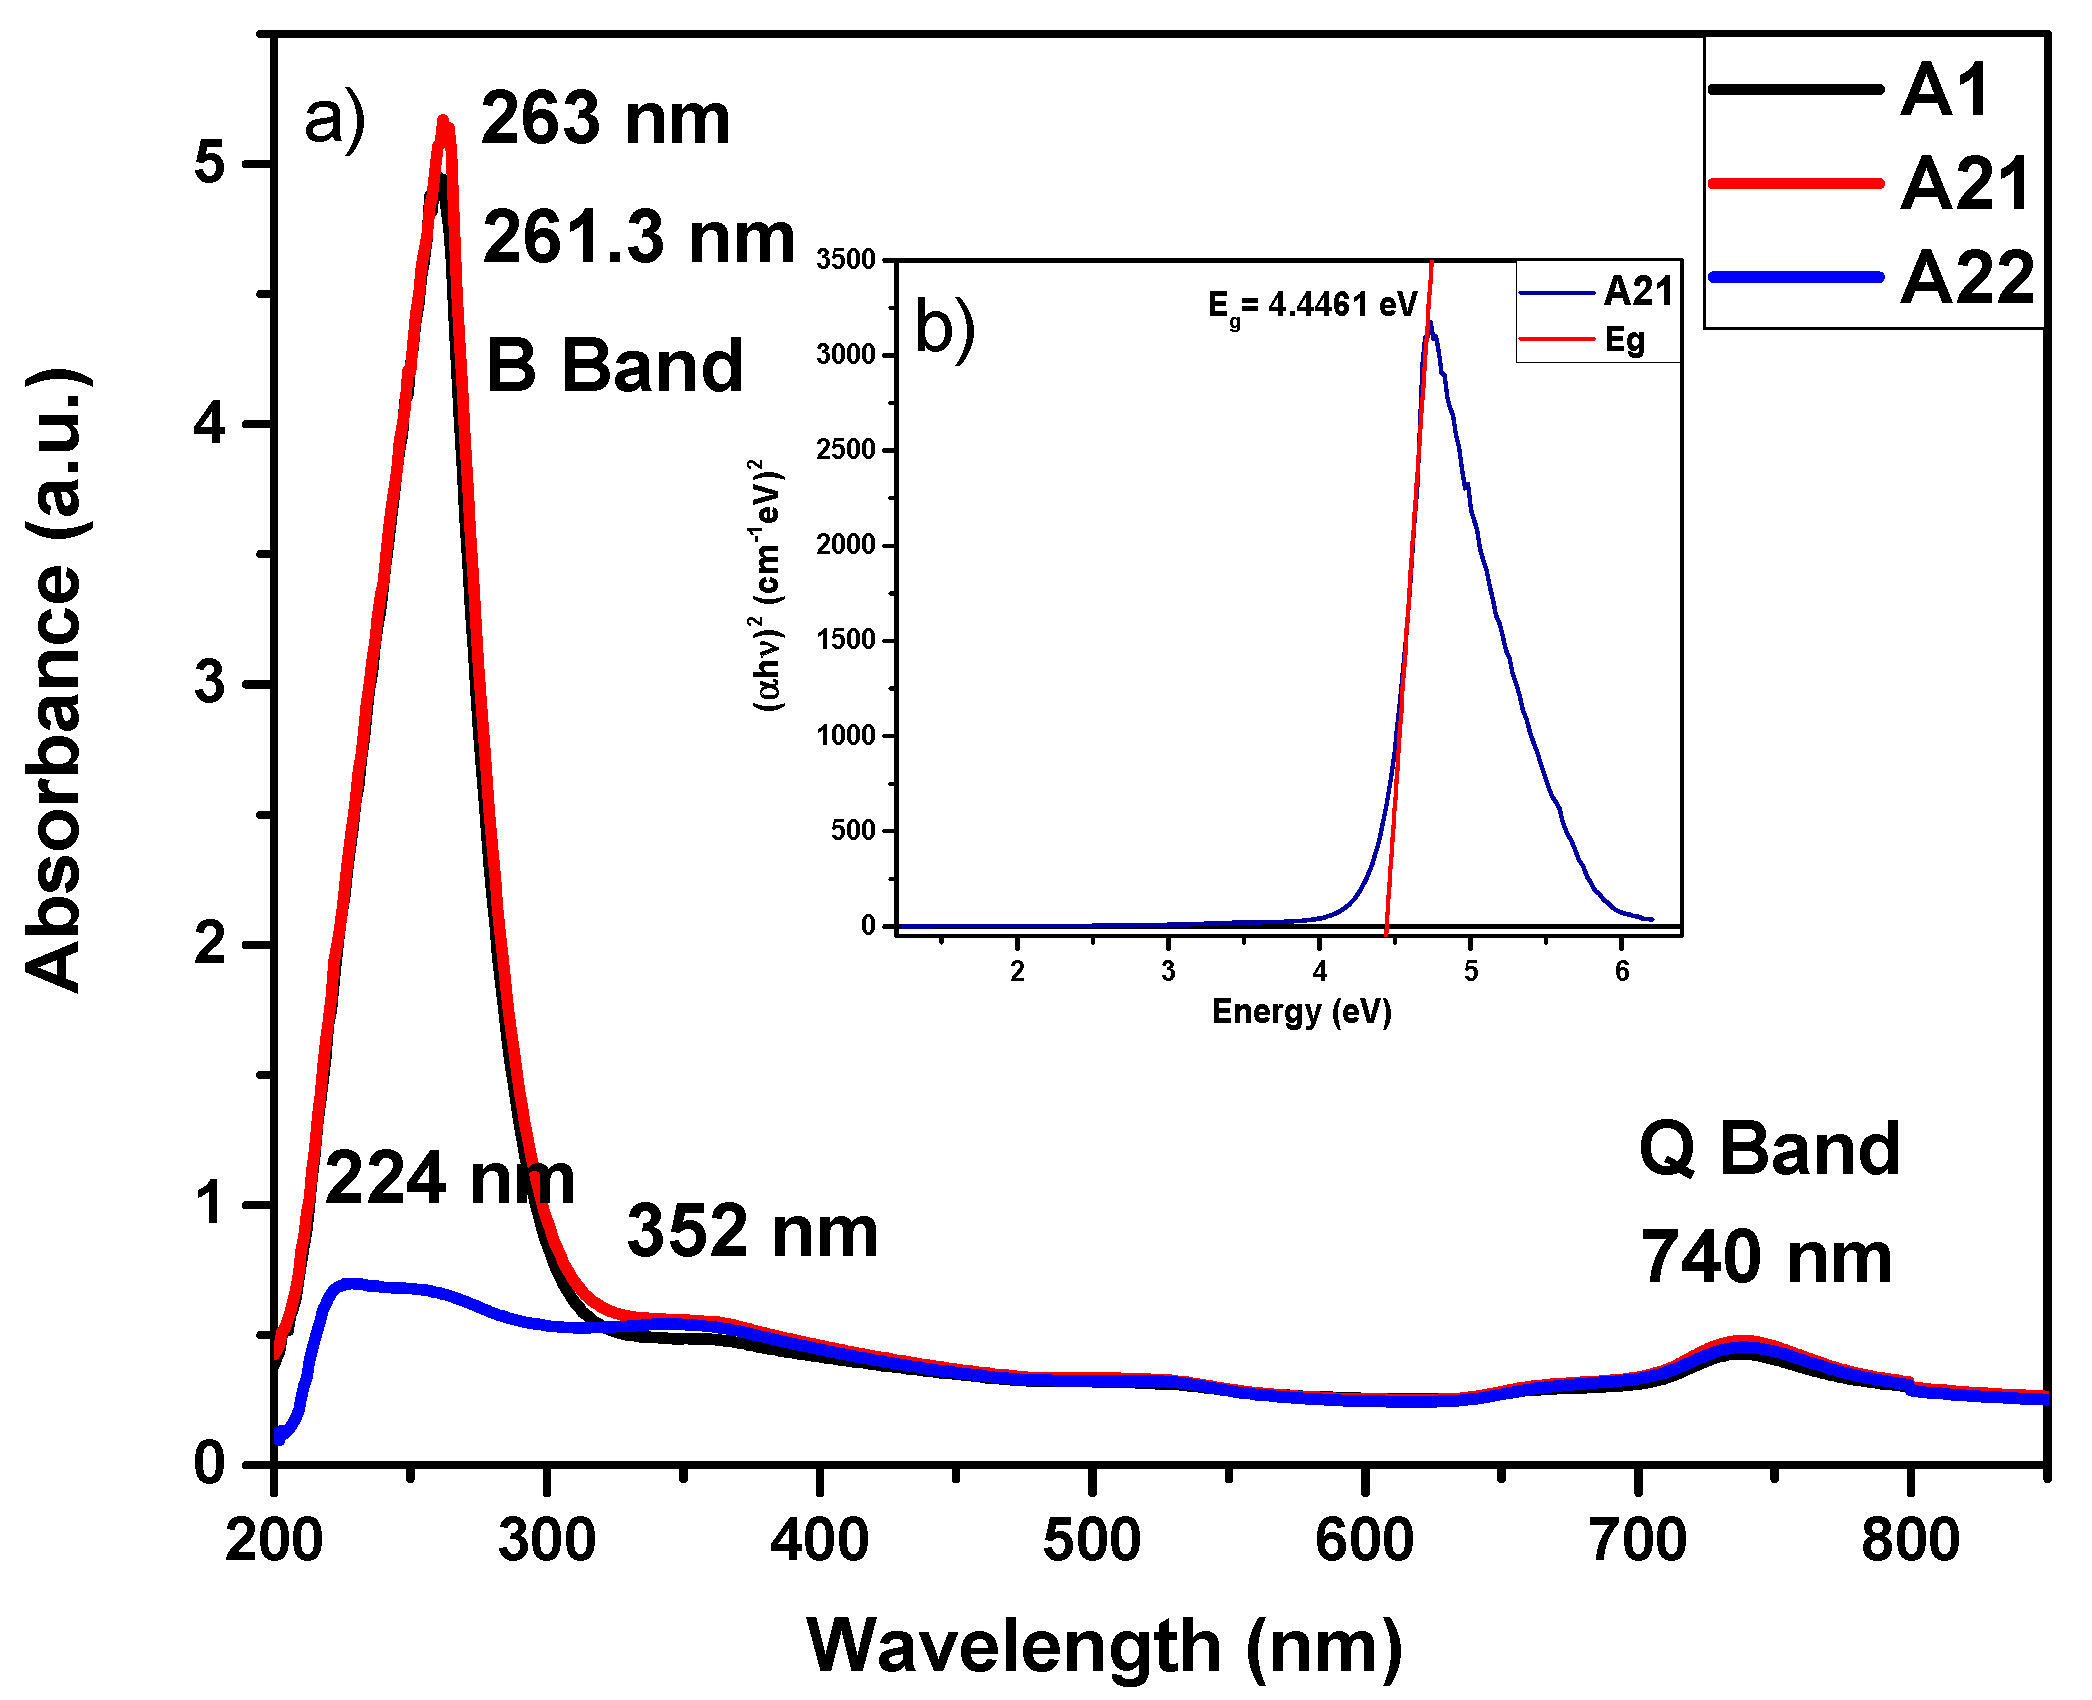
Figure 2.
Raman spectra of MnPc films for samples A1, A21 and A22.
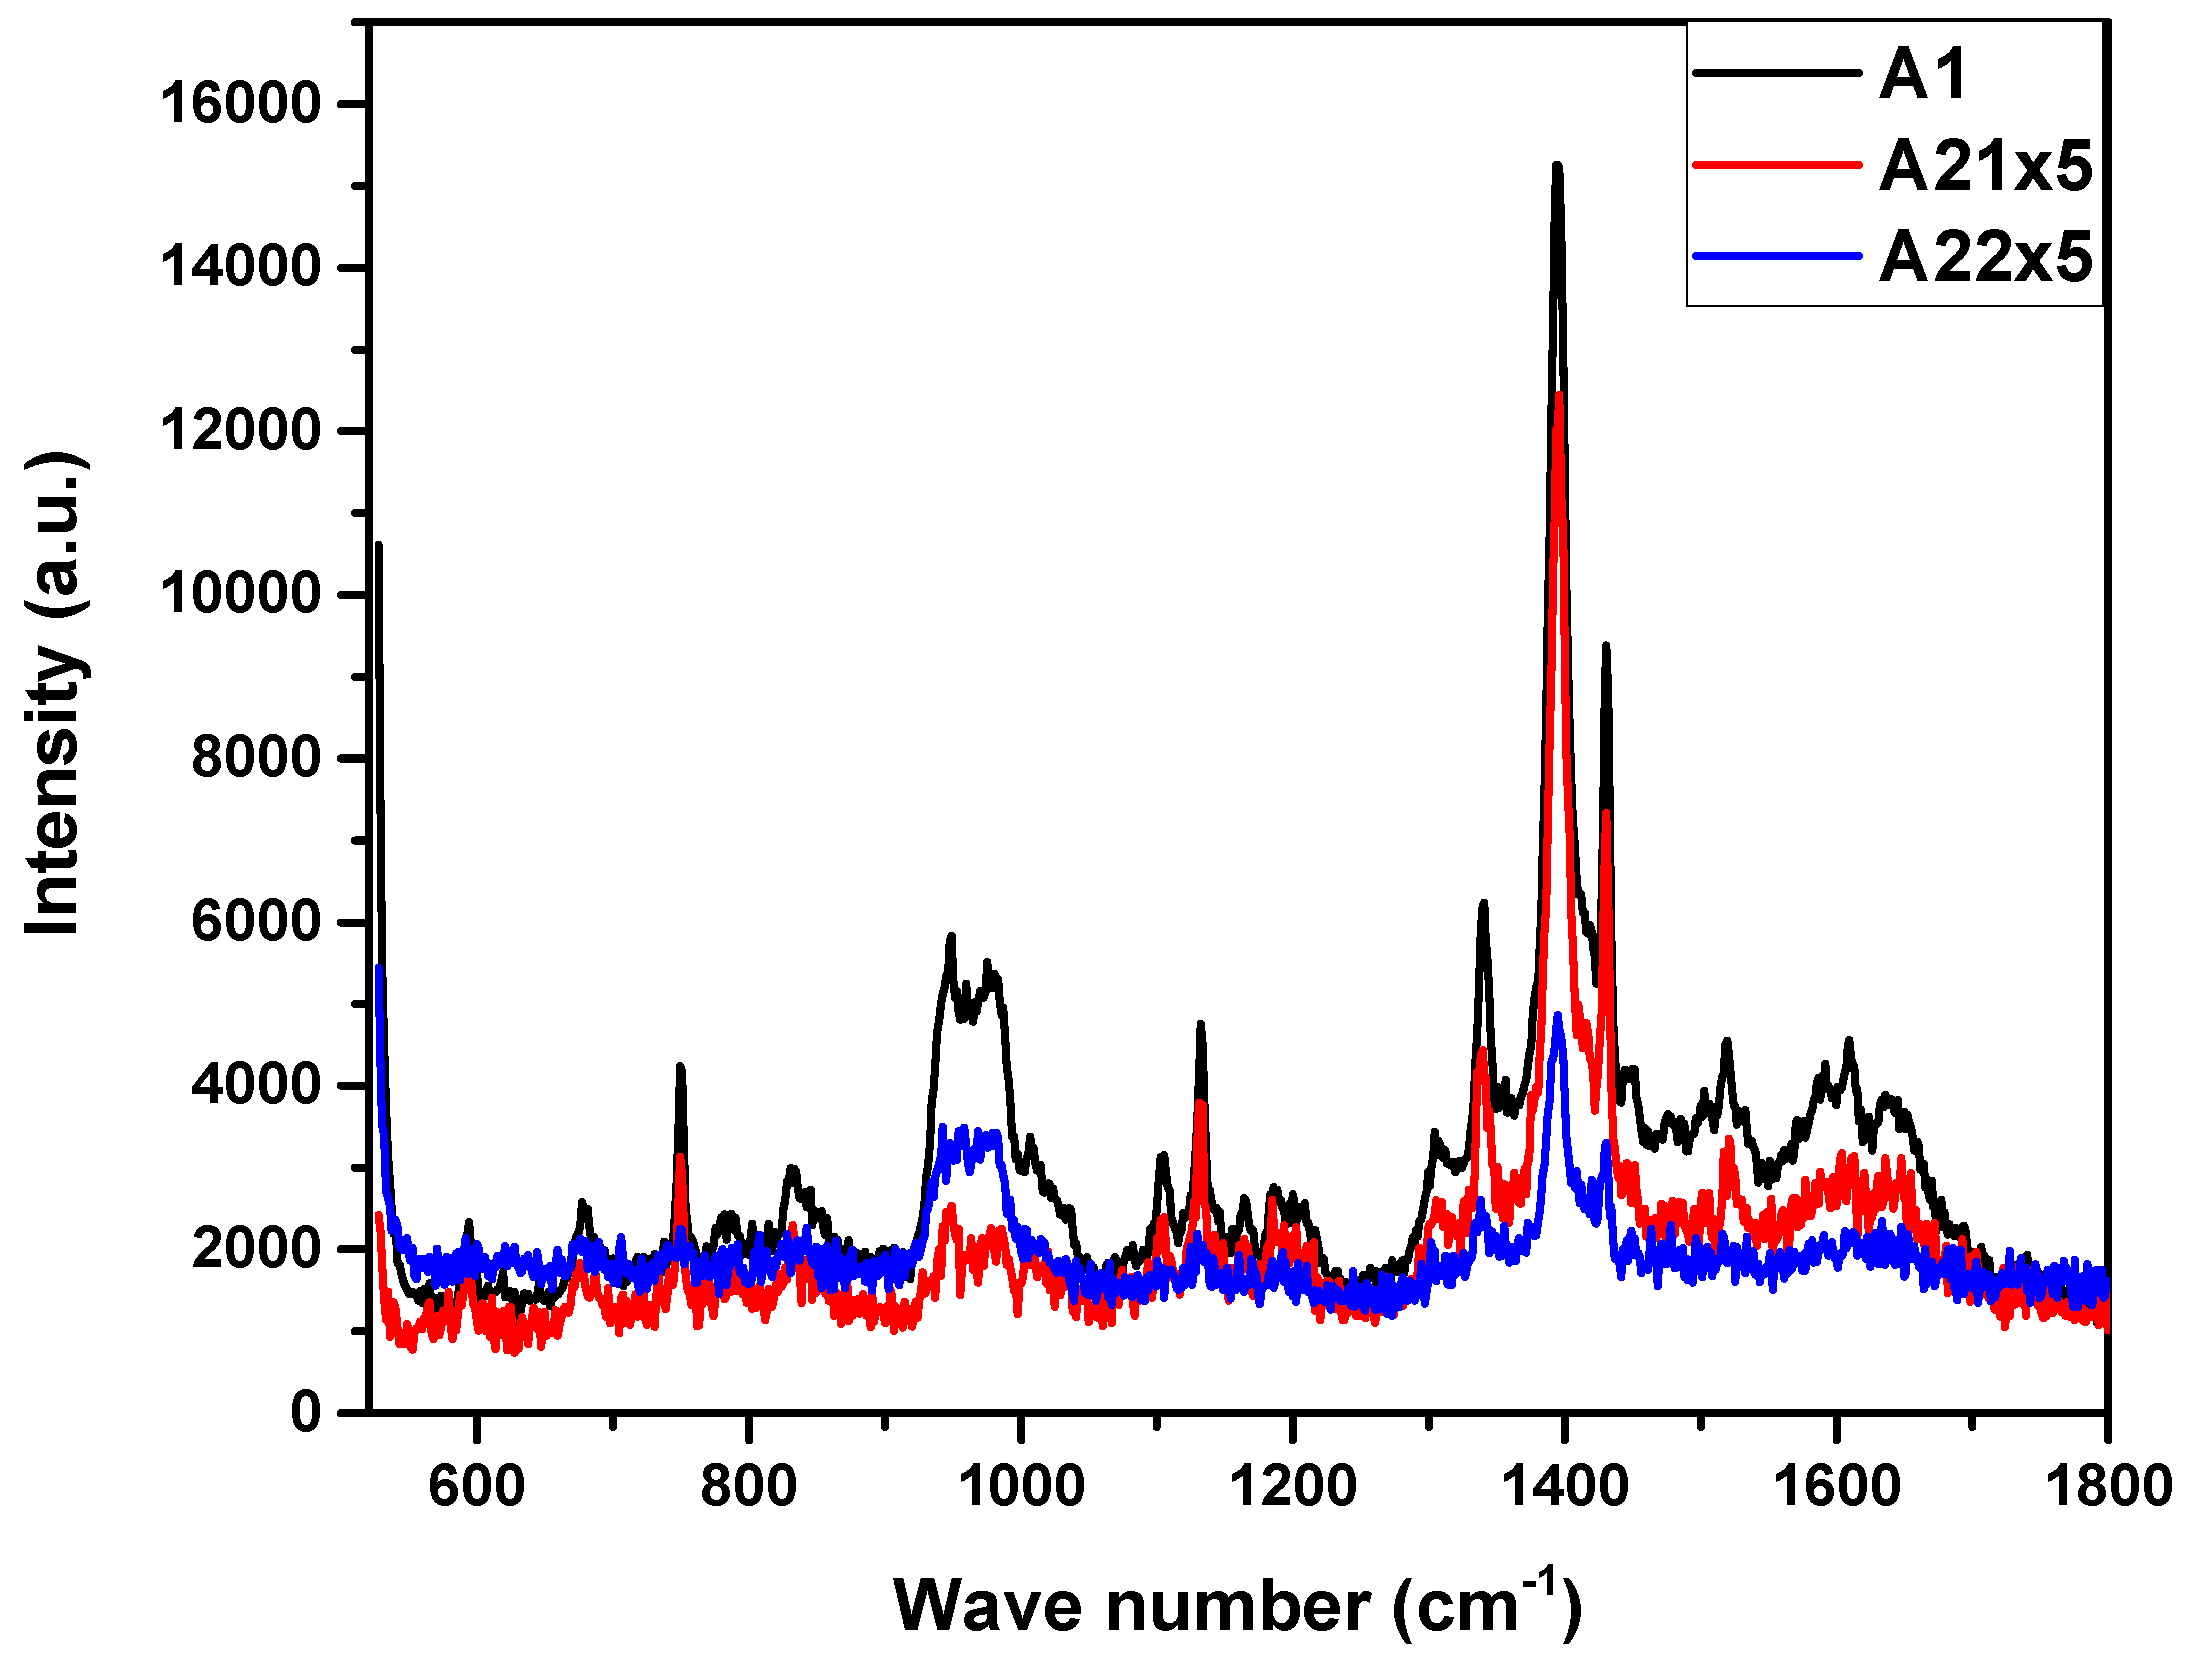
Figure 3.
Diffractograms of MnPc films.

Disclaimer/Publisher’s Note: The statements, opinions and data contained in all publications are solely those of the individual author(s) and contributor(s) and not of MDPI and/or the editor(s). MDPI and/or the editor(s) disclaim responsibility for any injury to people or property resulting from any ideas, methods, instructions or products referred to in the content. |
© 2023 by the authors. Licensee MDPI, Basel, Switzerland. This article is an open access article distributed under the terms and conditions of the Creative Commons Attribution (CC BY) license (http://creativecommons.org/licenses/by/4.0/).
Copyright: This open access article is published under a Creative Commons CC BY 4.0 license, which permit the free download, distribution, and reuse, provided that the author and preprint are cited in any reuse.


