Submitted:
27 June 2023
Posted:
28 June 2023
You are already at the latest version
Abstract
The merge areas of freeway work zones include relatively significant safety hazards that have continuously led to urgent safety issues to be solved by the management departments. In order to make up for the cumbersome process of independent identification of rear-end collision and lane change collision on complex road sections, an appropriate identification method of traffic conflicts in the merge area of freeway work zone was explored, this study collected vehicle running tracking data from the merge areas of multiple work zones, using an unmanned aerial vehicle video technique. Based on an inter-frame difference method and the principle of a spatio-temporal context visual tracking algorithm, the vehicles were detected and tracked, and the coordinate data of the vehicles in continuous motion were parsed using MATLAB extension tools. Based on the behavior characteristics of vehicle conflict avoidance, a new identification method for evading severe traffic conflicts is proposed according to the initial velocity, acceleration and accident rate of section traffic. Then, a statistical analysis was performed on the spatial distribution characteristics of the traffic conflicts in typical merge areas. The impacts of the road conditions in work zones, vehicle factors, and traffic flow factors on the traffic conflicts were analyzed. A binomial logistic model was established to identify the main influencing factors. The results show that in the merge area of the freeway work zone, there are serious traffic conflicts between vehicles in the following two situations: (Ⅰ) v∈[7,13.5] m/s and a∈[-3.96,-0.65]m/s2; and (Ⅱ) v∈[13.5,24.3] m/s, and a∈[-3.96,-1.57] m/s2. The probabilities of serious traffic conflicts in the first and last 25 m of the merge area are greater than those in the other sections. The smaller the space between the upstream work zone and the merge area, the greater the probability of serious traffic conflicts between vehicles. When the average vehicle speed is relatively high, the probability of serious conflicts is the highest, i.e., by a multiple of 5.95 from the baseline. Moreover, the probability of serious conflicts between vehicles is higher for larger vehicles, i.e., 4.765 times that for small vehicles. The research results can serve as a reference for freeway management departments to improve the safety levels of merge areas during road work. For example, the probability of serious conflicts can be effectively reduced by setting up reasonable speed limit signs in the work zone, increasing the spacing between work zone and merge area, and appropriately diverting large vehicles.
Keywords:
expressway work zone
; merge area
; traffic conflict
; evasive traffic conflict
; logistic model
1. Introduction
With continuously increasing vehicle ownership, the road capacities of some freeways can no longer meet the traffic demands of vehicles, and there comes an urgent need for reconstruction and expansion. During the reconstruction and expansion period, the construction personnel, construction machinery, and safety protection facilities constitute a dangerous traffic environment (Osman et al., 2019). This environment severely interferes with the driving of vehicles, leading to more prominent traffic safety problems in work zones. Thus, traffic safety research in work zones is particularly important. In traditional traffic safety research, traffic accident data are widely used for safety evaluations and improvements of traffic facilities. At present, the traffic accident data for freeways in China during periods of reconstruction and expansion have not been recorded completely, or accumulated sufficiently. Such shortcomings have resulted in low data availability, making it necessary to find alternatives for traffic accident data. The traffic conflict technique (TCT)—as a non-accident statistical technique (Guangquan et al., 2011)—has been used increasingly in research on freeway safety evaluation due to its small observation area, high reliability, short period, large samples, and other advantages (Li et al., 2016; Zheng et al., 2014).
Traffic conflict identification methods serve as the basis for research on traffic conflicts. The Commonly used traffic conflict identification indicators are generally divided into four categories: speed conflict indicators, time conflict indicators, distance conflict indicators, and other conflict indicators. Speed conflict indicators are mostly used to determine the severity of traffic conflicts. Zhu et al. considered the initial velocity and mass of a vehicle, and determined serious conflicts from the perspective of energy conversion (Zhu et al., 2020). Bagdadi proposed an indicator for the severity of traffic conflicts based on a vehicle's speed, acceleration, and mass (Bagdadi and Omar, 2013). The time conflict indicators (such as time to collision (TTC) and post-encroachment time (PET)) (El-Basyouny and Sayed, 2013) (Zheng et al., 2019), distance conflict indicators (such as the proportion of stopping distance (PSD)) (Gettman and Head, 2003), and other conflict indicators (such as the deceleration rate to avoid crash (DRAC or DR)) (Essa and Sayed, 2019), are used for specific types of traffic conflicts. For example, TTC, PSD, and DRAC are only applicable to rear-end conflicts, and PET is only applicable to lane-changing conflicts. To compensate for the drawback that the rear-end and lane-changing conflicts must be identified separately, some scholars have recently proposed new conflict indicators, such as the time difference to collision (TDTC) (Patel et al., 2018) and T2 (Laureshyn et al., 2010), which opens up the exploration of the comprehensive recognition method for various types of conflicts. However, such indicators only identify traffic conflicts in small fixed areas in terms of the proximity of time and distance, without considering the severity of traffic conflicts. Laureshyn et al. integrated two important dimensions, namely the proximity of accidents and severity of conflict consequences, and established a traffic conflict indicator denoted "Dealt-V." When analyzing conflicts between left-turning vehicles and straight-moving vehicles, they found that this indicator performed well for serious traffic conflicts (Laureshyn et al., 2017). In a freeway merge area, vehicles shift gears and change lanes frequently, resulting in a large number of long-distance and mixed lane-changing and rear-end conflicts. When considering the severity of conflicts, existing traffic conflict identification methods must identify rear-end and lane-changing conflicts separately, which requires a relatively complex operation process. Therefore, this study focused on the special traffic scenario of a merge area, and proposed an identification method for avoiding traffic conflicts based on the interval initial velocity and acceleration. The proposed method can identify rear-end and lane-changing conflicts simultaneously, while also considering the severity of conflicts. Moreover, it can be effectively used to study the spatial distribution characteristics of traffic conflicts.
Scholars both at home and abroad have conducted traffic conflict research in merge areas using previously studied traffic conflict indicators. Qi and Zhao analyzed the safety impact of using a signalized control strategy at work zone merge points (Qi et al., 2017). They found that signalized control could effectively reduce lane-changing conflicts, but increased the probability of rear-end conflicts. Li et al. applied a traffic conflict technique and defined hourly composite risk indexes (HCRIs) based on the traffic accident data. The relationships between the HCRIs and influencing factors were studied by establishing a multivariate regression model (Li et al., 2016). By considering the vehicle movement information and vehicle size, Ma et al. built a traffic conflict identification model based on a PET algorithm in the merge area, and verified the validity of the model (Yan-Li et al., 2018). Rong et al. generated traffic conflicts using VISSIM simulation models, and studied the relationships between the simulated and observed conflicts through a Spearman rank correlation coefficient. Based on the results, they proposed a method for safety assessments in freeway merge areas (Fan et al., 2013). Studies on traffic conflicts in work zones are helpful to improve the safety status of work zones, but the identification of rear-end collision and lane change conflict is complicated, and the effectiveness and accuracy of traffic conflict simulation also need to be studied. In addition, the road conditions and traffic conditions in merge area of freeway work zone are more complex than those in the normal merge area. At present, there is a lack of traffic conflict research for the special scene of merge area in work zone, which is not only because there is no unified traffic conflict indicator applicable to the merge areas but also because of the limitations in the data collection conditions and data processing techniques.
In terms of traffic conflict data acquisition, a commonly used method is the location observation method. A roadside camera can only record vehicle data at the cross-section, where the scope of the research is limited. However, data collection using unmanned aerial vehicle (UAV) videos can realize continuous multi-section data collection simultaneously and provide higher accuracy; therefore, these are beneficial for conducting more in-depth research (Ho et al., 2015). In terms of video data processing, the traditional manual data processing method is subjective, has low data accuracy, and collects relatively few conflict data types. However, an automatic video processing technique can effectively compensate for the shortcomings of manual processing (Xing et al., 2019). Dong et al. adopted an adaptive Gaussian mixture background model and combined it with an inter-frame difference method (Dong et al., 2020). By taking full advantage of the model’s adaptability to environmental changes, they detected vehicles entering a video shooting area. Zhang et al. proposed a visual tracking algorithm based on the spatio-temporal context, which has proven to be very effective. The video technology is becoming increasingly mature (Zhang et al., 2014). Moreover, a large number of studies have provided technical support for obtaining accurate and valid results based on real-time vehicle running tracking data (Hossain and Muromachi, 2013).
In this study, a UAV video technique was adopted to collect vehicle running tracking data in work zone merge areas of the Jiqing Freeway. Vehicles were detected and tracked based on the inter-frame difference method and the principle of the spatio-temporal context visual tracking algorithm. Based on the characteristic that the interval acceleration of vehicles will change after avoiding traffic conflicts, and then considering the initial interval velocity of vehicles to identify traffic conflicts in merge area, this method can simplify and integrate the identification process of multi-type traffic conflicts because it ignores the conflict evolution process. According to the correlation between serious traffic conflicts and traffic accidents, serious traffic conflicts are identified. On this basis, the spatial distribution characteristics of the traffic conflicts were statistically analyzed, and a binomial logistic model was established and validated. The impacts of traffic flow factors, road factors, and vehicle factors in the work zone on the risk(s) of vehicle conflicts were explored.
The first section of this paper introduces the research background, and reviews domestic and foreign studies from three aspects: traffic conflict indicators, merge area traffic conflicts, and conflict data collection and processing. The second section mainly describes the processes of data collection using the UAV and video data processing. The third section introduces the theory of avoidant traffic conflict identification, along with the conflict influencing factors and conflict risk logistical model. The fourth section presents the research results and analyzes the reasons therefor, and the fifth section provides discussion and conclusions.
2. Data
2.1. Unmanned aerial vehicle data collection
Our research team used a UAV to collect traffic conflict data on the Jiqing Freeway from January 13 to January 21, 2018. In this experiment, the selected sites for merge area data collection were five merge areas located at K257 + 700, K258 + 260, and K176 + 500. The mainline design speed was 100 km/h, and the speed limit during construction was 80 km/h. The data collection scene for the merge area is shown in Figure 1.

Table 1.
Data Collection.
| Collection Time | Including the morning peak from 8:00 to 9:00, the evening peak from 16:00 to 17:00, and the flat peaks from 10:00 to 11:00 and 15:00 to 16:00. |
| Collection Site | K176 + 500, K258 + 260, and K132 + 300. |
| Collected Data Amount | A total of six hours of data were collected; after data sorting, 56,825 frames with complete data were retained. |
The experimental device used in this experiment was DJI’s PHANTOM 4 PRO UAV, which can provide videos with 4K ultra-high-definition and 30 frames per second (fps). This device can hover and shoot with a good high-altitude field of view. Compared with traditional cameras, there are no shooting angle or occlusion issues, and the shooting range is larger, providing evident advantages. This vehicle data collection method also provides rich data extraction with a relatively low cost, as well as other advantages (Meng et al., 2017). This UAV has a maximum flight altitude of 500 m, maximum flight time of 30 minutes, and maximum video resolution of 4K/60P. It is also possible to use GPS positioning. In the experiment, the UAV shot videos from a static hovering state; the flying height was between 350 and 450 m. From calculations based on the angle of view of the UAV lens, the shooting range was approximately 600 to 700 m (length)/300 to 350 m (width). The accuracy of the captured video was 0.2 m, meeting the accuracy requirements. If the shooting height was lower, the accuracy was even better. Compared with traditional data collection methods, the UAV video shooting approach could collect the data of all vehicles in a certain area, which was convenient for identifying vehicle running tracks, and exhibited better continuity.
2.2. Video data processing
At present (both at home and abroad), approaches to video identification of traffic conflicts through vehicle running tracks mainly adopt an automatic video data analysis system based on OpenCV (i.e., "open source computer vision", an existing open-source tracking tool). This system contains a variety of computer vision algorithms, and has been widely used in computer vision processing (Xing et al., 2019). According to the inter-frame difference method and principle of the spatio-temporal context visual tracking algorithm, this study detected vehicle information (including the vehicle’s X-coordinate, Y-coordinate, speed in the X direction, speed in the Y direction, and length) in each frame of a video using MATLAB extension tools. The video data processing flow is illustrated in Figure 2.
1) Vehicle detection
The vehicle detection mainly employed an adaptive hybrid Gaussian background model combined with the inter-frame difference method. The model’s adaptability to environmental changes was given full play, and vehicles entering the video shooting area were detected (Dong et al., 2020).
The height difference of a freeway road surface is negligible relative to the height of a UAV. When a UAV is collecting videos at a high altitude, it is disturbed by the airflow, which can cause the video images to shake, making the subsequent images gradually deviate from the initial image. Therefore, it is necessary to use the first image as a reference to register subsequent images. This way, the vehicle will be tracked in the same coordinate system, and a continuous running track of the vehicle will be identified. There are many methods for image registration. In this study, a method based on feature point matching was adopted. Although the speed was relatively slow, this technique is very mature, and provided a good effect (Lu et al., 2011).
2) Vehicle tracking
After the image was registered, the polygon area and start and end sections of the road were selected, and each detected vehicle was labeled and tracked. Traditional vehicle tracking algorithms include the feature point-based tracking algorithm (vision point tracker) and histogram-based tracking algorithm (vision histogram-based tracker) (Fu and Zhu, 2011). However, when using the former algorithm, the number of vehicles will continue to decrease during the tracking process. In addition, the former algorithm is not appropriate to apply when the object is relatively small and has an excessive number of feature points, and the vehicle size may change. When using the latter algorithm, the tracking target can be excessively small; moreover, the vehicle size is not fixed, and continues to grow. Given the traffic flow characteristics of the collected road sections, this study used a spatio-temporal context visual tracking algorithm (Zhang et al., 2014); this algorithm had a good tracking effect, and could maintain the initial vehicle size. The tracking effect is shown in Figure 3. The numbers in the figure denote the serial numbers of the identified vehicles.
3. Methods
3.1. Avoidant conflict identification
For vehicles traveling in the same lane, if the vehicle in front suddenly decelerates or the vehicle behind suddenly accelerates (such that the speed of the vehicle behind exceeds that of the vehicle in front), then a rear-end conflict will occur between the vehicles. During a lane-changing process, if the driving speed of a vehicle is not properly controlled, the vehicle may have a lane-changing conflict with one or more vehicles in the target lane. In the merging area, vehicles frequently decelerate and change lanes, resulting in a large number of rear-end and lane-changing conflicts between vehicles.
Before the occurrence of vehicle conflicts, the presence of conflicts between vehicles can be determined according to the temporal and spatial relationships between the vehicles. The conflicts identified by this approach are called predictive conflicts. Once conflicts occur between vehicles, the drivers employ conflict avoidance behaviors. From such avoidance behaviors, the conflict states of vehicles can be identified; the identified conflicts are referred to as "avoidant conflicts." Predictive conflicts can predict the future states of a vehicle; they are mostly used in vehicle safety warnings, to remind drivers to take conflict-avoidance behaviors. However, in predictive conflicts, rear-end and lane-changing conflicts have to be identified separately, and the identification indicators do not consider the severity of the conflicts. Avoidant conflicts are more focused on the consequences of vehicle conflicts, and are not predictive. However, from the results of the conflict, the safety statuses of vehicles can be assessed more accurately. Common conflict indicators used both at home and abroad include TTC (El-Basyouny and Sayed, 2013), PET (Zheng et al., 2019), PSD (Gettman and Head, 2003), DRAC (Essa and Sayed, 2019), TDTC (Patel et al., 2018), and T2 (Laureshyn et al., 2010). These indicators identify traffic conflicts from the perspectives of time, distance, and acceleration, and they are all predictive conflict identification indicators. However, in the interflow merge area, the road conditions are more complicated than ordinary conditions, and vehicles exhibit long-distance lane-changing and following behaviors. It is rather challenging to use predictive conflict indicators to identify conflicts in such road sections. If the avoidant conflict identification method is adopted, the lane-changing and rear-end conflicts can be identified simultaneously, based on determining the conflicts from the avoidance behaviors of the vehicles. The identification process is simpler, and the severity of the conflict can also be considered.
The conflict avoidance behaviors of vehicles include acceleration and deceleration, as well as lane changes. For different conflicts, the driver will behave differently. Hou et al. determined that a speed difference has a strong correlation with traffic accidents. An excessive speed difference is an important cause of traffic accidents (Hou et al., 2010). Guo et al. argued that the traditional traffic safety assessment (based on the speed difference) was flawed, as it did not consider the speed change rate of each vehicle, and could overestimate the safety levels of road elements (Tangyi et al., 2011). It is more scientific to use the speed change rate (i.e., acceleration) of a vehicle to assess the safety of the vehicle. This is because the longitudinal acceleration of a vehicle can describe its acceleration and deceleration behaviors, and the lateral acceleration can describe its steering behavior. Thus, it can be said that acceleration can better explain the driving behaviors (Rui and Xichan, 2019). One engineering psychology concept states that when the acceleration of a vehicle exceeds a certain range, the driver will feel discomfort, leading to tension, fear, and other negative effects. In addition, when normal drivers encounter conflicts of different intensities, they will adopt different degrees of accelerating or braking behaviors.
The severity of traffic conflicts is also related to the speed of the vehicles. Assuming that a vehicle is driving at a uniform speed in a merge area, it is known from the kinematic equation (Equation (1)) that when and are determined, for a different , the value of will also be different. In other words, even at the same acceleration, the severities of vehicle conflicts will vary with different initial velocities. Zhu et al. considered the initial velocity and mass of a vehicle, and determined serious conflicts from the perspective of energy conversion (Zhu et al., 2020). Bagdadi proposed a measurement indicator for the severity of traffic conflicts based on a vehicle's speed, acceleration, and mass (Bagdadi and Omar, 2013). These studies all show that the severity of the conflict is strongly related to the initial speed of the vehicle.
In the above equation, is the acceleration, is the length of the driving section, is the initial velocity, and is the final velocity.
Therefore, both the initial velocity and acceleration should be considered when identifying avoidant conflicts. Owing to the large area of the merge section in this study, it was divided into several statistical intervals to consider the initial velocity and average acceleration (i.e., to avoid acceleration and deceleration existing in the same statistical interval), so as to enhance the persuasiveness of the conclusions. In this study, the interval length L was 25 m. This is because, under normal conditions, a driver’s braking reaction time is 0.3 to 1.0 s, and will gradually decrease as the vehicle speed increases (Ji-er et al., 2014; Li et al., 2014). In a case where the mainline speed limit is 80 km/h, the driving distance of the driver within the maximum reaction time is 22.2 m. Accordingly, for the convenience of statistics, the interval length (L) of 25 m was used in this study. As shown in Figure 4, with the nose of the merge junction as the starting cross-section, the merge area was divided into several cross-sections, at a spacing of 25 m. According to this approach, at a time point , the speed of the vehicle is when it reaches cross-section i. In the process of driving from the starting cross-section to cross-section 1, the interval initial velocity is , and the interval acceleration is the arithmetic mean of the acceleration. For the second interval, the initial velocity is , and the calculation principle for the interval acceleration is the same. In a similar manner, the initial velocity and acceleration can be obtained for the vehicle in each interval.
Subsequently, the K-means clustering method was used to classify the interval initial velocity and acceleration values into different combinations of initial velocities and accelerations. A certain combination was then designated as the threshold for a serious conflict, and the serious conflict rate for different merge areas was solved for using Equation (2). Based on the traffic accident data, the traffic accident rates in different merge areas were determined using Equation (3). The Pearson correlation coefficient between the serious conflict rate and traffic accident rate in the merge area was analyzed. An initial velocity and acceleration combination with a relatively high correlation (Pearson coefficient greater than 0.8) was regarded as the serious conflict threshold (as serious conflicts are usually similar to traffic accidents).
Here, is the accident rate collected from each interval (times/km·pcu), M is the number of traffic accidents per unit time (instances), L is the length of the data collection interval (km), and Q is the average hourly traffic volume of each interval (pcu).
In the above equation, is the serious conflict rate of the interval (times/km·pcu), is the number of serious conflicts that occurred per unit time (instances), and L and Q represent the same quantities as in Equation (2).
3.2. Impact analysis of severe traffic conflicts
3.2.1. Influencing factors
During the reconstruction and expansion of a freeway, the driving of vehicles in the merge area is greatly disturbed. According to the severity of conflicts, vehicles in the merge area can be divided into two situations: yi = 1 (there are serious conflicts) and yi = 0 (there is no serious conflict), where i denotes the number of the vehicle. The presence of serious conflicts in a traffic flow is affected by many factors. In terms of road conditions, different distances between an upstream work zone and merge area can have different impacts on the merging of vehicles; in addition, whether the roadside is under construction, whether the acceleration lane in the merge area is compressed, etc., will all have different levels of impact on vehicles driving in the merge area. In terms of traffic flow factors, the hourly traffic volume, average speed, average speed standard deviation of the mainline and the ramp, etc., will have corresponding impacts on the vehicle merging process. For each vehicle, the vehicle type, average vehicle speed, speed standard deviation, and most unfavorable acceleration (i.e., the maximum absolute value of the acceleration) will all affect the driving safety. In terms of traffic facilities, there is no difference between facilities because they are arranged in accordance with standards and norms, making it difficult to analyze the causes. Therefore , this study selected the following influencing factors, as listed in Table 2.
3.2.2. Binomial logistic model
The binomial logistic model is a disaggregate model. Some scholars believe that it can provide improved performance relative to traditional models (Shi and Abdel-Aty, 2015; Wu et al., 2018). It is widely used for probability estimation, and can be divided into three types: the binomial logistic model, multinomial logistic model, and ordinal logistic model.
In this study, based on the severity of the potential consequences of the conflict, vehicles in the merge area were divided into two situations: yi = 1 (there is a potentially serious conflict) and yi = 0 (there is no potential serious conflict), where i denotes the vehicle number. The probability that the vehicle was at a certain state was expressed as P(yi). Judging from the dependent variable category, it was more appropriate to use the binomial logistic model. The model can effectively estimate the probability of the vehicle state, P(yi), which can be expressed as follows:
In the above equation, g(yi) is calculated as follows:
Here, is an influencing factor for the potential serious conflicts between the vehicles, B0 is a constant term, and represents the natural logarithm of the ratio between the probability that an individual vehicle has a potential serious conflict and the probability that the vehicle has no serious conflict when the influencing factor = 0. is a variable coefficient, and denotes the logarithmic value of the odds ratio of inducing potential serious and non-serious conflicts when changes.
4. Results and Analysis
In this study, the data of five merge areas (at K132 + 300, K176 + 500, and K258 + 260) of the Jiqing Freeway were selected for identifying serious conflicts and establishing a logistic regression model, so as to explore the factors influencing the conflict risk in work zone merge areas.
4.1. Identification results of severe traffic conflicts
The data of the five merge areas were analyzed statistically using the Statistical Package for the Social Sciences (SPSS). The obtained classification results for the interval initial velocity and acceleration are listed in Table 3. The initial velocity and acceleration for a certain interval were designated as the threshold for a serious conflict. The Pearson coefficients of the corresponding serious conflict and traffic accident rates were calculated, as shown in Table 4. There were six combinations with a Pearson coefficient greater than 0.8 (denoted by ** in Table 4); i.e., there were serious conflicts between the vehicles whose interval initial velocities and accelerations were within the ranges of these six combinations. In summary, the threshold ranges for the serious conflicts were obtained as follows: (Ⅰ) m/s and m/s2; and (Ⅱ) m/s, and m/s2 . When the vehicle is running at low speed, if it slows down suddenly, there is serious traffic conflict between the vehicle and other vehicles. When the vehicle is running at high speed, the large deceleration also indicates that the vehicle has serious traffic conflict. The main reason for this situation is that in expressway work zones, vehicles will keep low speed and drivers have better speed conditions to avoid traffic conflicts. Only when there is serious conflict with other vehicles, drivers will take emergency deceleration behavior. On the contrary, in the process of high speed driving, strong deceleration behavior has potential safety hazards. Therefore, normal drivers will only take strong deceleration behavior when encountering serious traffic conflicts.
4.2. Distribution of traffic conflicts
1) Overall vehicle conflict distribution
When a vehicle has a serious conflict in a certain section of the merging area, it is considered as a vehicle in serious conflict. The statistical results for the conflicts in all of the merging areas are shown in Table 5.
2) Conflict distribution at different intervals
During the reconstruction and expansion of the expressway, it is very common to compress the acceleration lane in the merge area due to the construction needs, and the traffic safety problem in this special merge area is very prominent. The spatial distribution analysis of the traffic conflicts was mainly focused on this scenario. Taking the K176+500 merge area as an example, the acceleration lane of the merge area was compressed during construction; it had a total length of 100 m after compression. The vertical section corresponding to the nose of the merge junction was used as the starting section, and the merge area was divided into 25 m intervals. The average hourly distributions of the traffic conflicts in the four intervals are shown in Figure 6. As shown, the percentages of serious conflicts in the first and last intervals of the merge area (Intervals 1 and 4) are relatively higher. Overall, the percentage of serious conflicts tends to initially decrease, and then increase. The percentage of serious conflicts in Interval 4 is the highest, at 34.61%, followed by Interval 1, at 32.45%. The percentages of serious conflicts in Interval 2 and 3 are very close, at 21.3% and 22.63%, respectively.
To further analyze the spatial distributions of the traffic conflicts in the merge areas, the running tracks of vehicles within two minutes in the merge areas of K176 + 500 were plotted (the negative direction of the Y-axis in the figure is the driving direction of the vehicle), as shown in Figure 7. The mainline consisted of two lanes, where the lane close to the median strip was defined as the inside lane, and the other lane was the outside lane. It was found that most vehicles changed to the inside lane in Interval 1, and the vehicles on the ramp mainly drove in the outside lane of the mainline when they merged into Interval 4. Moreover, if the vehicle ran at a constant speed, its running track would be a straight line. Most of the vehicle running tracks showed a reduced slope in Interval 4, indicating the deceleration behaviors of the vehicles. In summary, the vehicles showed evident conflict-avoidance behaviors in Intervals 1 and 4, indicating conflicts occurred frequently in Intervals 1 and 4; this is consistent with the conclusion illustrated in Figure 8.
The traffic conflicts in the merge areas are shown in Figure 6 and Figure 7. As the acceleration lane of the merging area was severely compressed, many vehicles had not fully accelerated in the merge area, and were forced to merge into the mainline at the end of the merge area. In such cases, there were serious traffic conflicts between vehicles at the end of the merge area. Some vehicles entered the acceleration lane and merged into the mainline before they were fully accelerated, resulting in evident speed differences from the mainline vehicles just entering the merge area, thereby causing serious conflicts. These two situations led to a relatively large percentage of serious traffic conflicts at both the beginning and end of the merge area.
4.3. Logistic model results
4.3.1. Variable correlation analysis
This study considered a total of 12 influencing factors. There could also be correlations between each influencing factor. Therefore, a correlation analysis between the independent variables was required before establishing the model, as highly correlated influencing factors could not be simultaneously used as independent variables in the model. In this way, the cumulative error caused by repeated independent variables could be reduced, ensuring the simplicity and portability of the model.
The statistical results for the factors with relatively high correlations are shown in Table 6. The best factor was selected among the factors showing relatively high correlations, to help improve the persuasiveness of the model results. The final parameter selection results for the model are shown in Figure 8 (the variables marked in yellow needed to be removed). The five removed variables were FRQ (hourly traffic volume on the ramp), FMvstd (standard deviation of the average speed of the mainline traffic), FRvstd (standard deviation of the average speed of the ramp traffic), IFc (whether the acceleration lane is compressed), and IFw (whether the roadside is under construction). The eight variables of FMQ (hourly traffic on the mainline), FMV (average speed of the mainline traffic), FRV (average speed of the ramp traffic), Ctype (vehicle type), V(i) (average speed of an individual vehicle), Vstd(i) (standard deviation of the average speed of an individual vehicle), amax(i) (the most unfavorable acceleration of an individual vehicle), and L (the distance between the upstream work zone and the merge area) were selected as the final independent variables for the model.
4.3.2. Variable discretization
The binomial logistic model is a discrete probability model, and requires all variables to be discrete. Variable discretization can eliminate the negative impacts of some extreme variable values on the model, making the model results more applicable. In this study, the K-mean clustering method was adopted to discretize continuous variables. The interflow merge areas selected in this study were 45, 120, 240, 300, and greater than 300 m from the upstream work zones, respectively. The variables could thus be discretized at different spacings, i.e., small, medium, and large distances. The values of all independent variables after discretization are shown in Table 7.
4.3.3. Model result analysis
SPSS 21.0 was used to fit the binomial logistic model. As the selected variables contained multinomial variables, they had to be set as dummy variables when establishing the binomial logistic model. The parameters V(i) = 1, FMQ = 1, amax(i) = 1, L = 1, and Ctype= 0 were respectively used as the reference group, and the model fitting results are listed in Table 8.
It can be seen that the model fitting process eliminated three variables, namely Vstd(i) (standard deviation of the speed of an individual vehicle), FMV (average speed of the mainline traffic), and FRV (average speed of the ramp traffic). The variables remaining in Table 6 all have significant impacts on the risk of conflict. Among them, β is the regression coefficient, OR is the odds ratio, the variable with OR > 1 is a risk variable, and the variable with OR < 1 is a protective variable.
When V(i) = 2, OR = 0.443, and when V(i) = 3, OR = 5.954, indicating that when the other conditions remained unchanged, the occurrence probability of a serious conflict at V(i) = 2 is 0.443 times that at V(i) = 1; and the probability of a serious conflict at V(i) = 3 is 5.954 times that at V(i) = 1. These results also show that as the average speed continues to increase, the probability of serious conflicts first decreases, and then increases. The causes were determined as follows. First, there is no minimum speed for vehicles in a freeway work zone. When a conservative driver is driving at a low speed, if there is a vehicle behind or a vehicle from the ramp overtaking the slow vehicle, it will have a relatively high probability of experiencing a serious conflict. If the vehicle increases its speed appropriately, the occurrence of this phenomenon can be reduced; i.e., the probability of serious conflicts can be reduced. In contrast, when the speed of a vehicle in the work zone is excessively high, the probability of serious conflicts will increase significantly (as per common sense).
The conditions of FMQ = 2 and FMQ = 3 respectively correspond to OR values of 1.72 and 0.801, and β values of 0.542 and -0.221. As the traffic volume of the mainline increases, the probability of serious conflict initially increases, and then decreases. This is because, under a condition of free flow, as the traffic volume increases, the probability of serious conflicts between vehicles will significantly increase. When the traffic volume increases to a certain level, the traffic flow will slow down, and thus the probability of serious conflicts will decrease.
For the most unfavorable accelerations of the vehicle at amax(i) = 2 and amax(i) = 3, the corresponding β values are -3.323 and -20.509, respectively. However, the significance at amax(i) = 3 is 0.998 (> 0.05), i.e., its effect on the dependent variable is not significant; whereas at amax(i) = 2, the significance is 0 (< 0.05) and the corresponding OR value is 0.036, indicating that amax(i) is a protective variable. In addition, when amax(i) = 1 or 2 (acceleration is less than zero, the vehicle is decelerating), the smaller the deceleration, the smaller the probability of serious conflict.
Similarly, the vehicle type Ctype has a corresponding OR value of 4.765, indicating that this variable is a risk variable; i.e., the probability of serious conflicts between large vehicles is 4.765 times that between small and medium vehicles. The distance L between the upstream work zone and merge area has corresponding OR values of 0.971 and 0.556, respectively. As the distance between the work zone and the merge area increases, the probability of serious conflicts continues to decrease, and can be reduced to 55.6% of the probability of serious conflicts corresponding to the minimum distance. In a mixed traffic flow, owing to differences in vehicle performance between large and small vehicles, there are significant speed differences. Also, the deceleration process of a large vehicle is slower than that of a small vehicle, resulting in a greater probability of serious conflicts. The closer the work zone is to the merge area, the larger the interference will be to the driver. Therefore, the distance between the work zone and merge area should be controlled. If necessary, a detour route can be constructed to avoid the work zone, thereby reducing the interference from construction work.
A comprehensive comparison of the OR values shows that in the work zone, when the average vehicle speed is high, the probability of serious conflicts is the greatest, i.e., 5.95 times the original probability. Large vehicles have the second-largest probability of conflicts, which is 4.765 times that of small and medium vehicles. This requires a freeway management department to set up reasonable speed limit signs in the work zone and appropriately divert large vehicles, such that the speed of traffic and passages of large vehicles through the work zone can be reduced. Using this approach, it is possible to reduce the probability of serious traffic conflicts and ensure vehicle safety during construction.
4.3.4. Model validation
The model was tested from two perspectives. The Omnibus test of model coefficients hypothesizes that it is meaningless to include the variables in the model. In the Omnibus test results for the model coefficients given in Table 9, the significance of the model is 0 (less than 0.05), and the null hypothesis is rejected. This indicates that including the variables in the model has statistical significance.
The Hosmer and Lemeshow test hypothesizes that the model fits well. In the Hosmer and Lemeshow test results given in Table 10, the significance is 1 (greater than 0.05), and the null hypothesis is accepted. This indicates that the model has a good overall fit.
5. Conclusions and Discussion
In this study, a UAV technique was used to collect vehicle running tracking data in work zone merge areas. Based on the inter-frame difference method and the principle of a spatio-temporal context visual tracking algorithm, vehicles were detected and tracked, and the states of vehicles were parsed using MATLAB extension tools and the Python language. Based on the traffic conflict results, avoidant conflicts were identified by considering the conflict-avoidance behaviors of vehicles. According to the vehicles' interval initial velocities, interval accelerations, and the collected traffic accident rate, the correlations between the serious conflict rate and traffic accident rate were analyzed, the threshold for a serious conflict was resolved, and the spatial distribution characteristics of traffic conflicts were statistically analyzed. A binomial logistic model was established to study the impacts of traffic flow factors, road factors, and vehicle factors in the work zone on the risk of vehicle conflicts. The impact levels of different factors on the risk of conflicts were analyzed through a comparison of OR values. The main conclusions are as follows:
1) Based on video data of vehicles collected using an UAV, the running tracking information of the vehicles was parsed, conflict states of vehicles in merge areas were studied, and spatial distribution characteristics of traffic conflicts in merge areas were analyzed. This is an effective approach to achieving the goals of traffic conflict research.
2) From the perspective of the conflict-avoidance driving behaviors of vehicles, the correlations between the serious conflict rate and traffic accident rate were analyzed using the Pearson coefficient method, based on the interval initial velocity and acceleration of the vehicles. The analysis shows that vehicles in the freeway merge areas will have serious traffic conflicts in the following two situations: (Ⅰ) m/s and m/s2; and (Ⅱ) m/s, and m/s2.
3) From the spatial distribution characteristics of the traffic conflicts and running tracks of vehicles in the merge areas, the percentages of serious traffic conflicts in the first 25 m and last 25 m of the merge area are 32.45% and 34.61%, respectively, i.e., higher than in the other sections. Moreover, the running tracks of vehicles will change significantly in these two intervals.
4) A binomial logistic model was established by considering the road conditions in the work zone. It was found that the smaller the distance between the upstream work zone and merge area, the greater the probability of serious traffic conflicts. As the average vehicle speed increases, the probability of serious traffic conflicts initially decreases, and then increases; however, as the hourly traffic volume on the mainline increases, it first increases, and then decreases. From the comparison of the OR value of each factor, it is found that when the average vehicle speed is high, the probability of serious conflict is the greatest, at 5.95 times that of the original probability. Large vehicles have the second-largest probability of experiencing serious conflicts, at 4.765 times that of a small vehicle.
This study fills the research vacancy of the special traffic scene of the merge area in freeway work zones. Based on the running tracks of vehicles and close examination of the traffic accidents, this study evaluated the conflict states of vehicles from the perspective of the conflict-avoidance behaviors of vehicles, which provides a new method for the identification of traffic conflicts in merge area and a new idea for the study of traffic conflicts in complex scenes similar to merge area. The spatial distribution characteristics of the traffic conflicts in work zone merge areas were revealed. The factors influencing traffic conflicts in work zone merge areas were analyzed. A theoretical basis was provided for reasonably setting the locations of work zones and speed limits, as well as for appropriately diverting large vehicles (especially in stages with increasing freeway reconstruction and expansion), thereby ensuring traffic safety in the merge areas during construction.
Of course, there remain many issues to be explored further. This study considered the impacts of road conditions, individual vehicle factors, and traffic flow factors in work zones on the traffic conflicts during the reconstruction and expansion period, but did not consider the impacts of factors such as drivers and road facilities. In addition, the effectiveness of the avoidant conflict identification method still requires further research. In future studies, additional avoidant conflict identification methods can be proposed for different scenarios, thereby forming a more complete system for avoidant conflict identification.
Acknowledgments
The work described in this paper was fully supported by a grant from the Major State Basic Research Development of the National Natural Science Foundation of China (No. 71771183).
References
- Bagdadi, O. Estimation of the severity of safety critical events. Accid. Anal. Prev. 2013, 50, 167–174. [Google Scholar] [CrossRef] [PubMed]
- Dong, E.; Han, B.; Jian, H.; Tong, J.; Wang, Z. Moving target detection based on improved Gaussian mixture model considering camera motion. Multimedia Tools Appl. 2020, 79, 7005–7020. [Google Scholar] [CrossRef]
- El-Basyouny, K.; Sayed, T. Safety performance functions using traffic conflicts. Saf. Sci. 2013, 51, 160–164. [Google Scholar] [CrossRef]
- Essa, M.; Sayed, T. Full Bayesian conflict-based models for real time safety evaluation of signalized intersections. Accid. Anal. Prev. 2019, 129, 367–381. [Google Scholar] [CrossRef] [PubMed]
- Fan, R.; Yu, H.; Liu, P.; Wang, W. Using VISSIM simulation model and Surrogate Safety Assessment Model for estimating field measured traffic conflicts at freeway merge areas. IET Intell. Transp. Syst. 2013, 7, 68–77. [Google Scholar] [CrossRef]
- Fu, X.S.; Zhu, J. Research on Moving Vehicle Detection and Tracking Algorithm Based on Video Image. Key Eng. Mater. 2011, 467-469, 1488–1492. [Google Scholar] [CrossRef]
- Gettman, D.; Head, L. Surrogate Safety Measures from Traffic Simulation Models. Transp. Res. Rec. J. Transp. Res. Board 2003, 1840, 104–115. [Google Scholar] [CrossRef]
- Guangquan, Lu, Bo, Cheng, Seigo, Kuzumaki, Bingsong, Mei, 2011. Relationship between road traffic accidents and conflicts recorded by drive recorders. Traffic Injury Prevention4, 320-326.
- Ho, D.-T.; Grøtli, E.I.; Sujit, P.B.; Johansen, T.A.; Sousa, J.B. Optimization of Wireless Sensor Network and UAV Data Acquisition. J. Intell. Robot. Syst. 2015, 78, 159–179. [Google Scholar] [CrossRef]
- Hossain, M.; Muromachi, Y. A real-time crash prediction model for the ramp vicinities of urban expressways. IATSS Res. 2013, 37, 68–79. [Google Scholar] [CrossRef]
- Hou, D.; Han, J.; Sun, X.; He, Y. Study on the Relationship between Speed Difference and Crash Rate on Freeway. ICCTP 2010 2010, 354–359. [Google Scholar] [CrossRef]
- Ji-er, L.V. , Liu-hua, Z., Rong-sen, Z., Yan-fang, W., 2014. Effects of driver's reaction time on safe driving. Journal of Transportation Systems Engineering & Information Technology14, 80-86.
- Laureshyn, A.; De Ceunynck, T.; Karlsson, C.; Svensson. ; Daniels, S. In search of the severity dimension of traffic events: Extended Delta-V as a traffic conflict indicator. Accid. Anal. Prev. 2017, 98, 46–56. [Google Scholar] [CrossRef]
- Laureshyn, A. , Svensson, A., Se, Eacute, H., N, C., 2010. Evaluation of traffic safety, based on micro-level behavioural data: Theoretical framework and first implementation. Accident Analysis & Prevention42, 1637-1646.
- Li, L. , Zhu, X., Ma, Z., 2014. Driver brake reaction time under real traffic risk scenarios. Qiche Gongcheng/automotive Engineering36, 1225-1229.
- Li, S.; Xiang, Q.; Ma, Y.; Gu, X.; Li, H. Crash Risk Prediction Modeling Based on the Traffic Conflict Technique and a Microscopic Simulation for Freeway Interchange Merging Areas. Int. J. Environ. Res. Public Heal. 2016, 13, 1157. [Google Scholar] [CrossRef] [PubMed]
- Lu, G.; Yan, J.; Kou, Y.; Zhang, J. Image registration based on criteria of feature point pair mutual information. IET Image Process. 2011, 5, 560–566. [Google Scholar] [CrossRef]
- Meng, L.; Han, W.X.; Ke, S. Traffic Conflict Identification Technology of Vehicle Intersection Based on Vehicle Video Trajectory Extraction. Procedia Comput. Sci. 2017, 109, 963–968. [Google Scholar] [CrossRef]
- Osman, M. , Mishra, S., Paleti, R., Golias, M., 2019. Impacts of work zone component areas on driver injury severity(Article). Journal of Transportation Engineering Part A: Systems145, 4019032.
- Patel, M.R. , Shukla, R.N., Golakiya, H.D., 2018. Study of interaction between pedestrian and vehicle at undesignated urban mid-block section. International Research Journal of Engineering and Technology5, 4.
- Qi, Y.; Zhao, Q. Safety impacts of signalized lane merge control at highway work zones. Transp. Plan. Technol. 2017, 40, 577–591. [Google Scholar] [CrossRef]
- Rui, L. , Xichan, Z., 2019. Acceleration distribution characteristics of the driver and its application. Journal of Automotive Safety and Energy16, 101-103.
- Shi, Q.; Abdel-Aty, M. Big Data applications in real-time traffic operation and safety monitoring and improvement on urban expressways. Transp. Res. Part C: Emerg. Technol. 2015, 58, 380–394. [Google Scholar] [CrossRef]
- Tangyi, Guo, Yingshun, Liu, Jian, Lu, 2011. Levels of safety at freeway exits: evaluations on the basis of individual speed difference. Transportation Research Record47, 10-18.
- Wu, Y.; Abdel-Aty, M.; Cai, Q.; Lee, J.; Park, J. Developing an algorithm to assess the rear-end collision risk under fog conditions using real-time data. Transp. Res. Part C: Emerg. Technol. 2018, 87, 11–25. [Google Scholar] [CrossRef]
- Xing, L.; He, J.; Abdel-Aty, M.; Cai, Q.; Li, Y.; Zheng, O. Examining traffic conflicts of up stream toll plaza area using vehicles’ trajectory data. Accid. Anal. Prev. 2019, 125, 174–187. [Google Scholar] [CrossRef] [PubMed]
- Yan-Li, M.A. , Shou-Ming, Q.I., Hao-Tian, W.U., Fan, L.Y., 2018. Traffic conflict identification model based on post encroachment time algorithm in ramp merging area. Journal of Transportation Systems Engineering & Information Technology18, 142-148.
- Zhang, K.; Zhang, L.; Liu, Q.; Zhang, D.; Yang, M.-H. Fast visual tracking via dense spatio-temporal context learning. In Proceedings of the European Conference on Computer Vision (ECCV), Zurich, Switzerland, 6–7 September 2014; pp. 127–141. [Google Scholar]
- Zheng, L.; Sayed, T.; Essa, M. Validating the bivariate extreme value modeling approach for road safety estimation with different traffic conflict indicators. Accid. Anal. Prev. 2019, 123, 314–323. [Google Scholar] [CrossRef]
- Zheng, L.; Ismail, K.; Meng, X. Traffic conflict techniques for road safety analysis: open questions and some insights. Can. J. Civ. Eng. 2014, 41, 633–641. [Google Scholar] [CrossRef]
- Zhu, S.; Jiang, R.; Wang, H.; Zou, H.; Wang, P. Review of research on traffic conflict techniques. China Journal of Highway and Transport 2020, 33, 15–33. [Google Scholar]
Figure 1.
(a) Data acquisition site of Jiqing high-speed construction area interflow merge area (K176 + 500); (b) Unmanned aerial vehicle (UAV) data collection site.
Figure 1.
(a) Data acquisition site of Jiqing high-speed construction area interflow merge area (K176 + 500); (b) Unmanned aerial vehicle (UAV) data collection site.
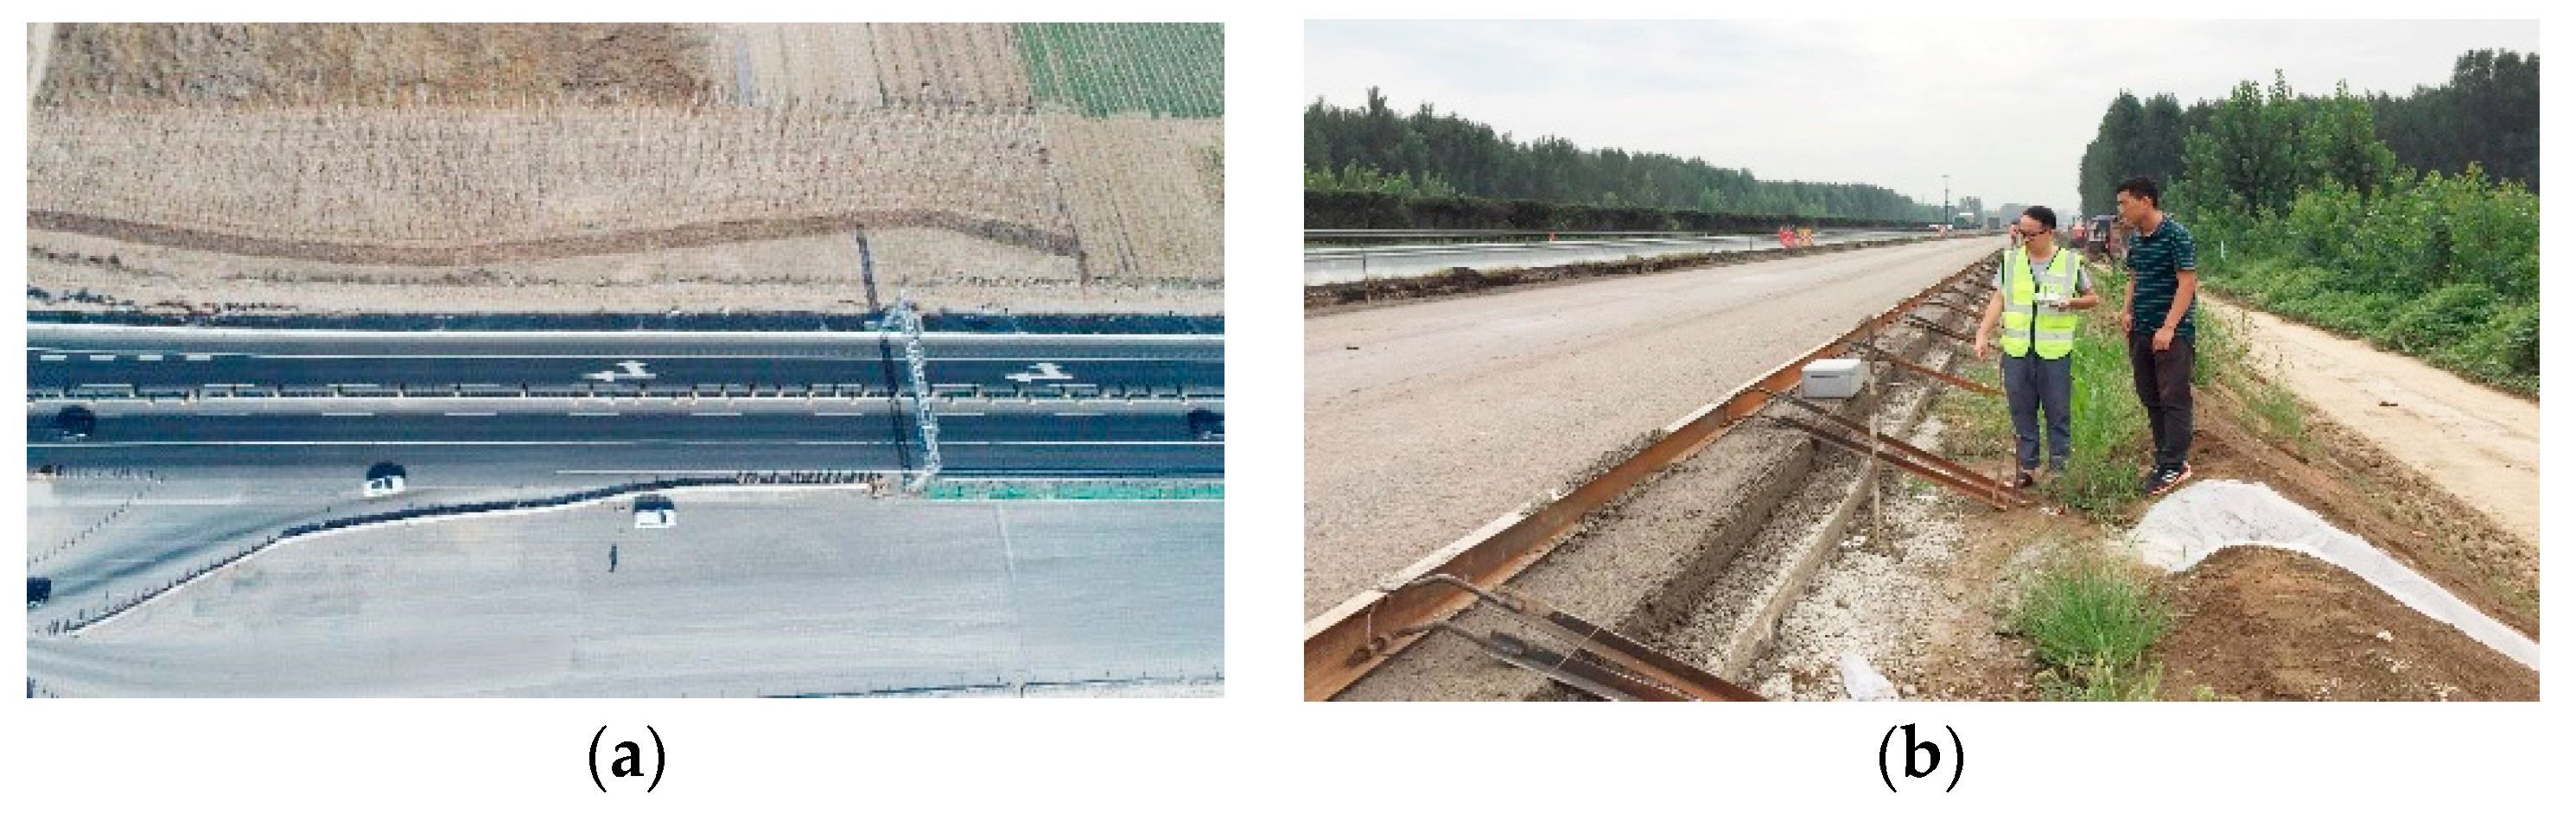
Figure 2.
Video data processing flow.
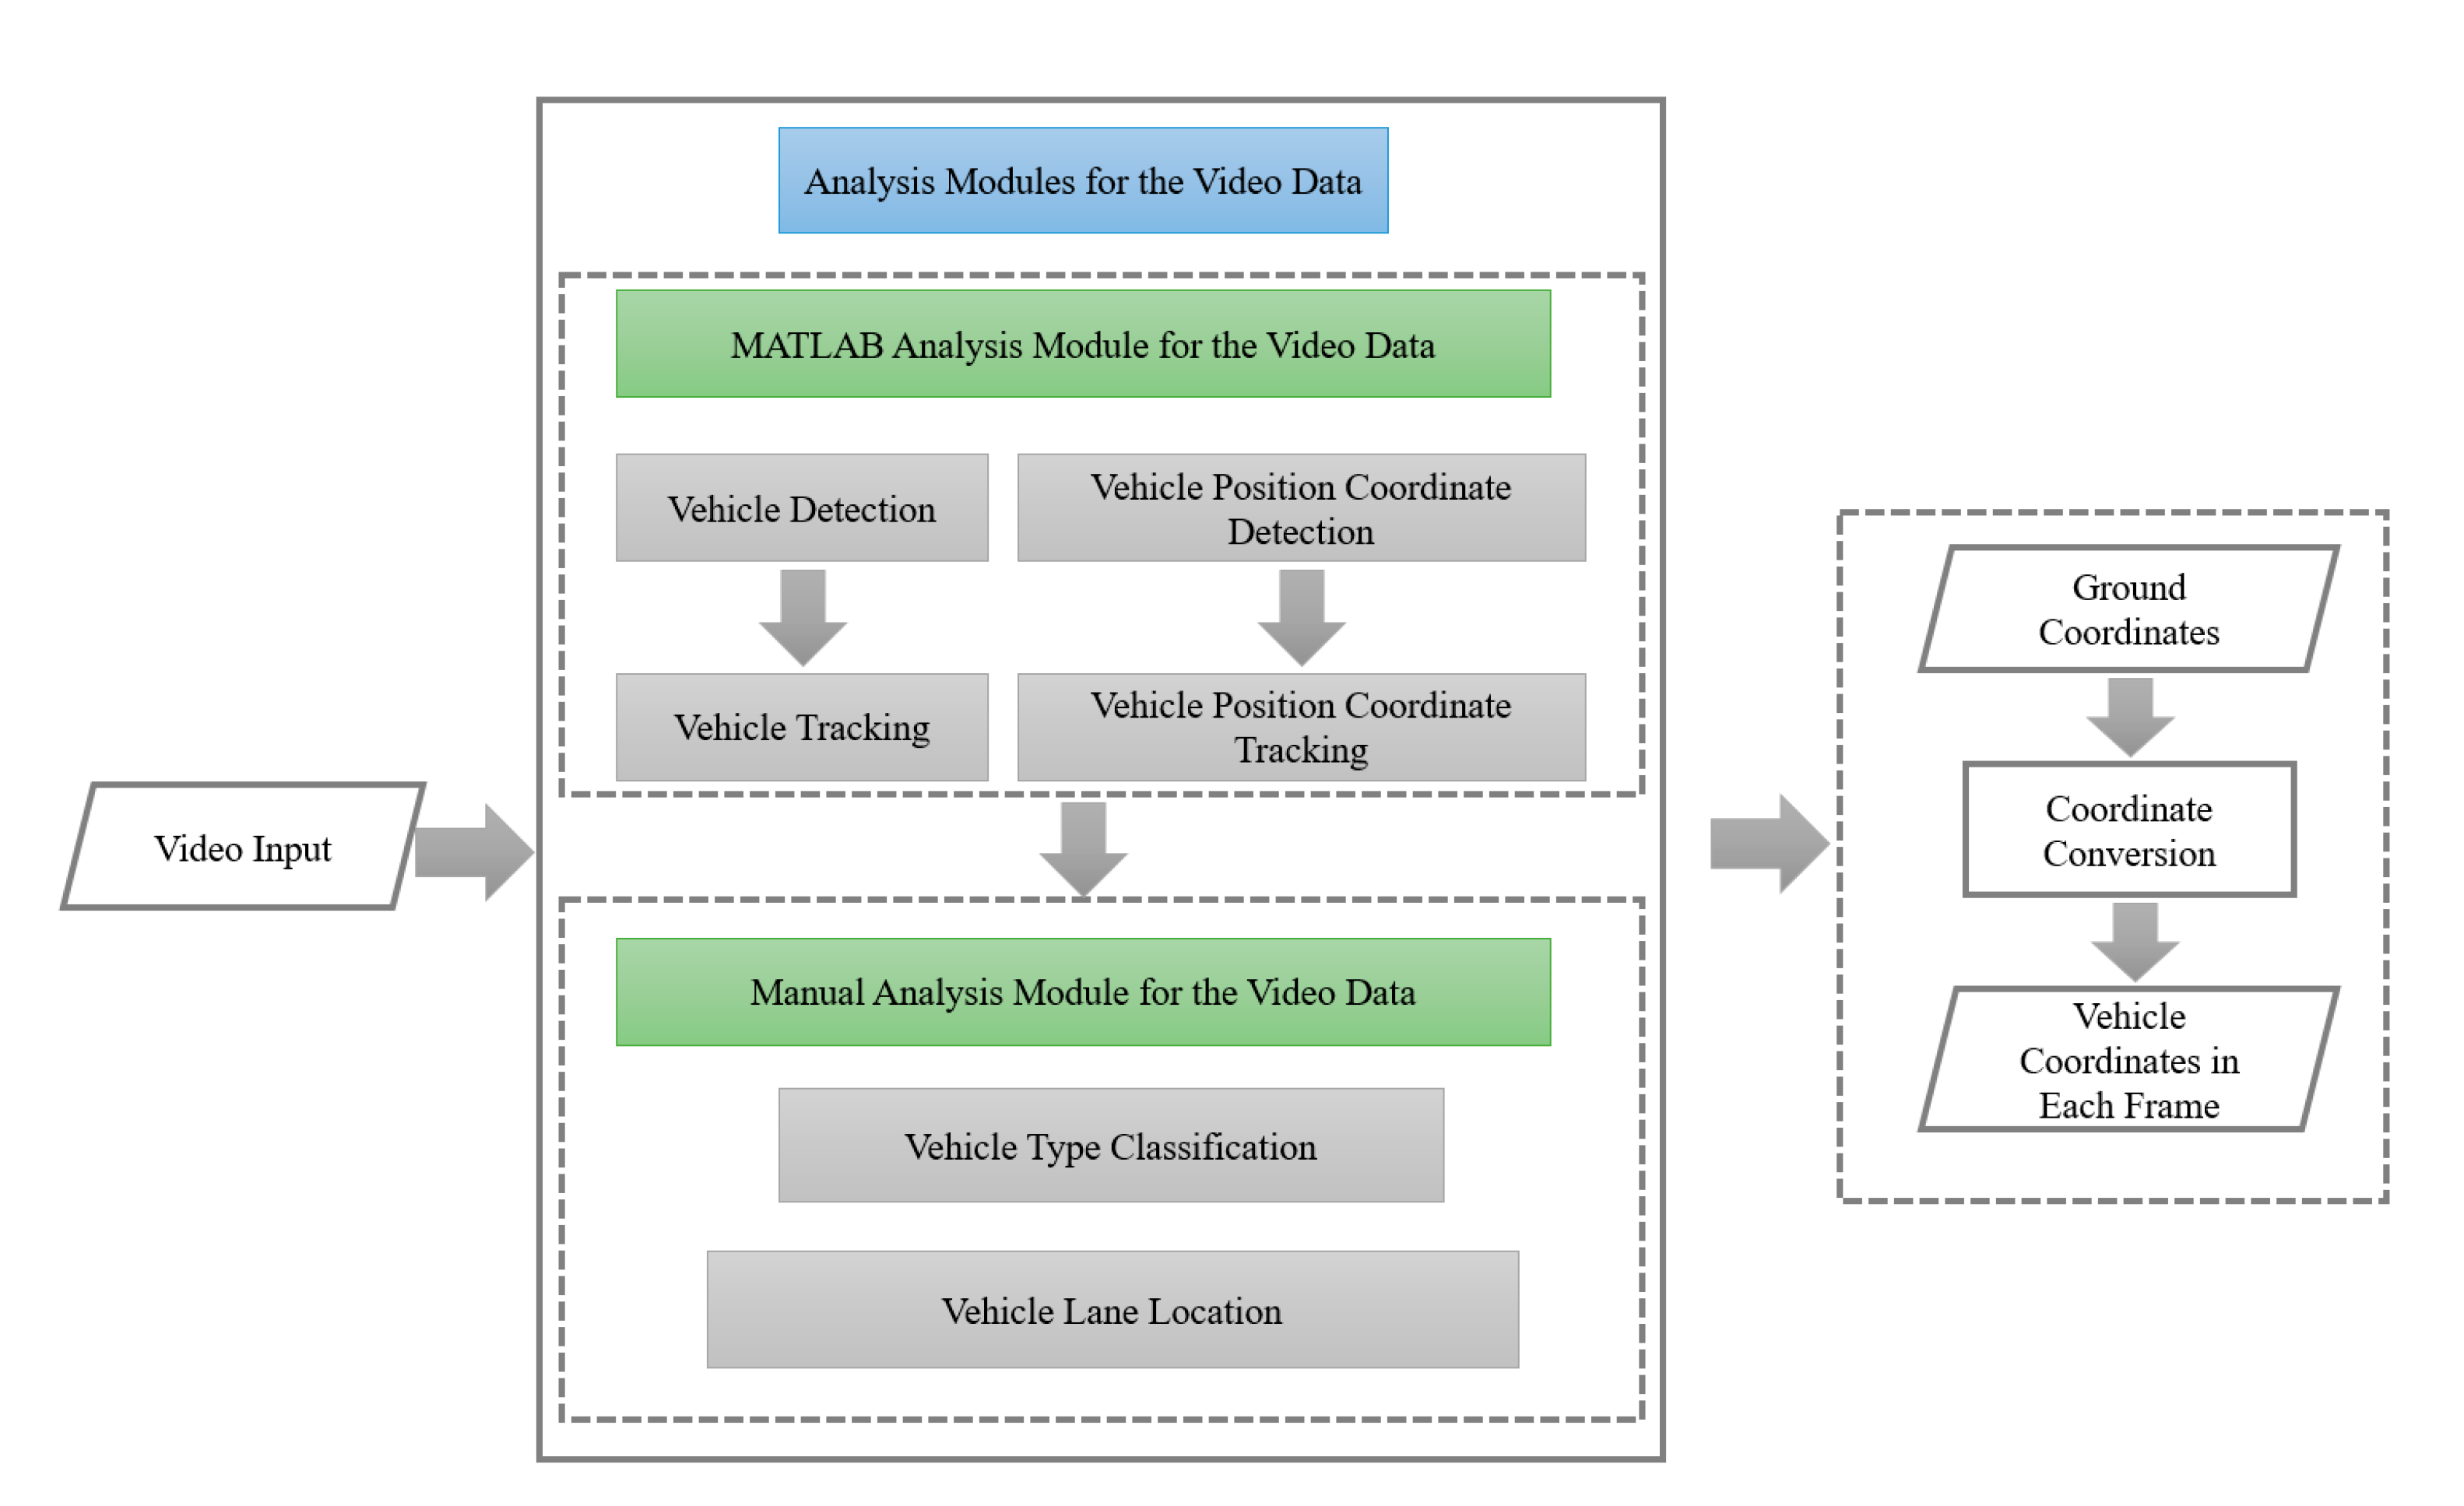
Figure 3.
Vehicle tracking effect.
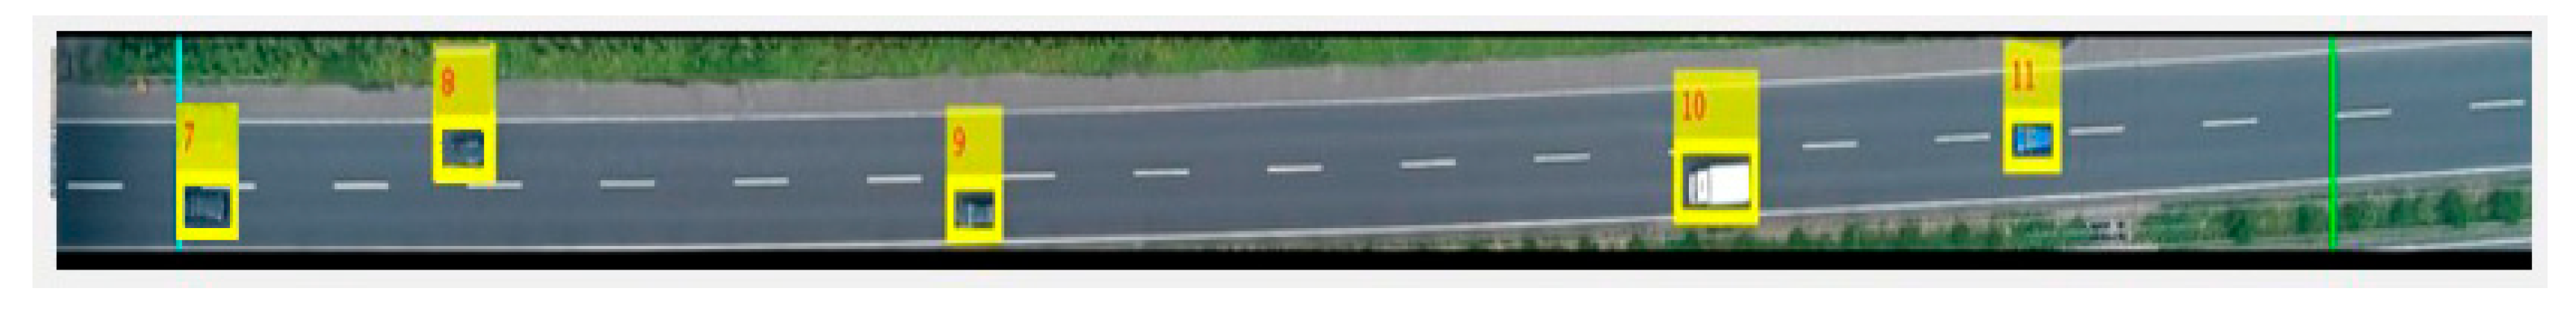
Figure 4.
Statistical interval division.

Figure 5.
Distance between upstream work zone and the merge area.
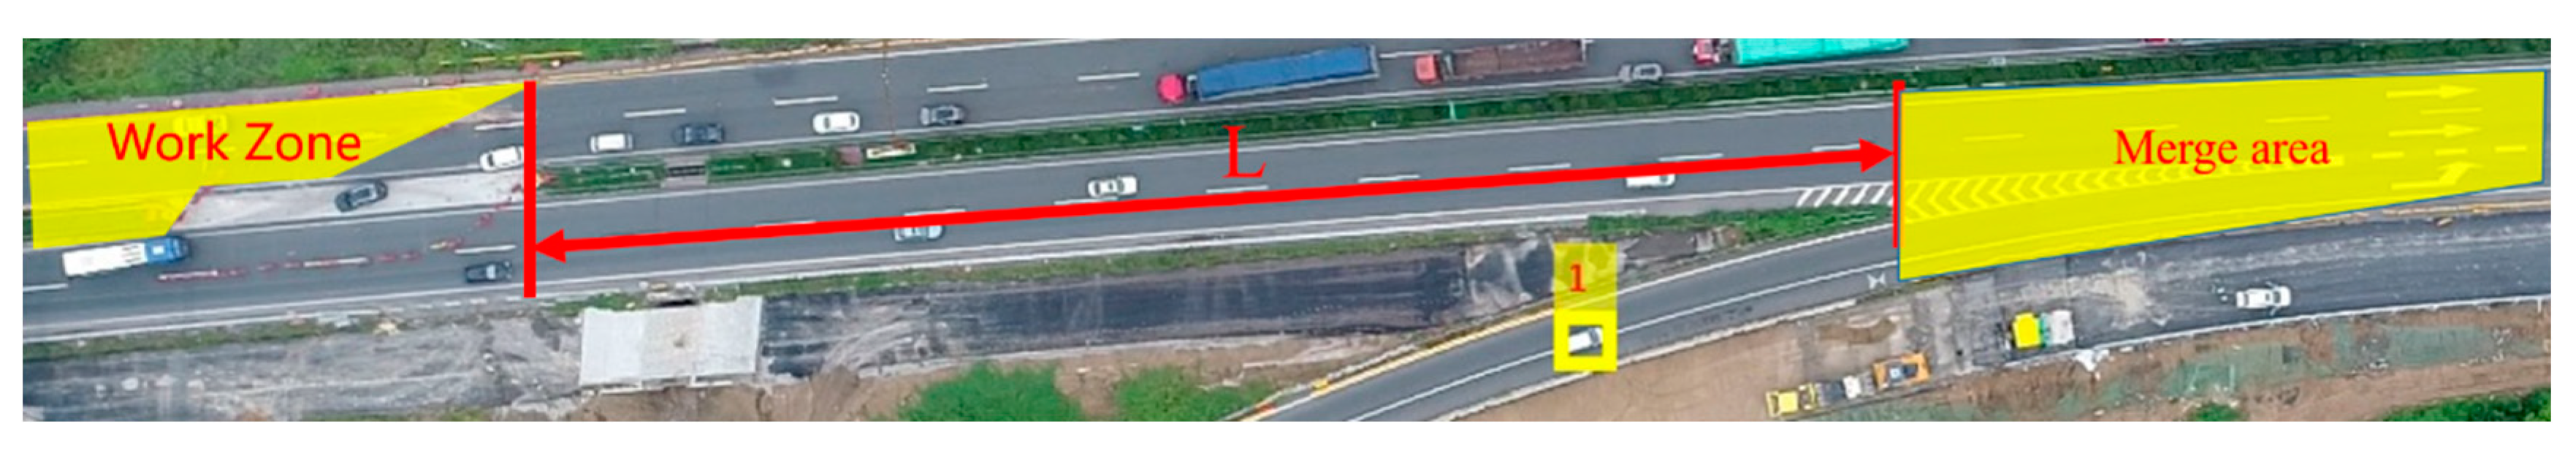
Figure 6.
Traffic conflict distribution in K176 + 500 merge areas.
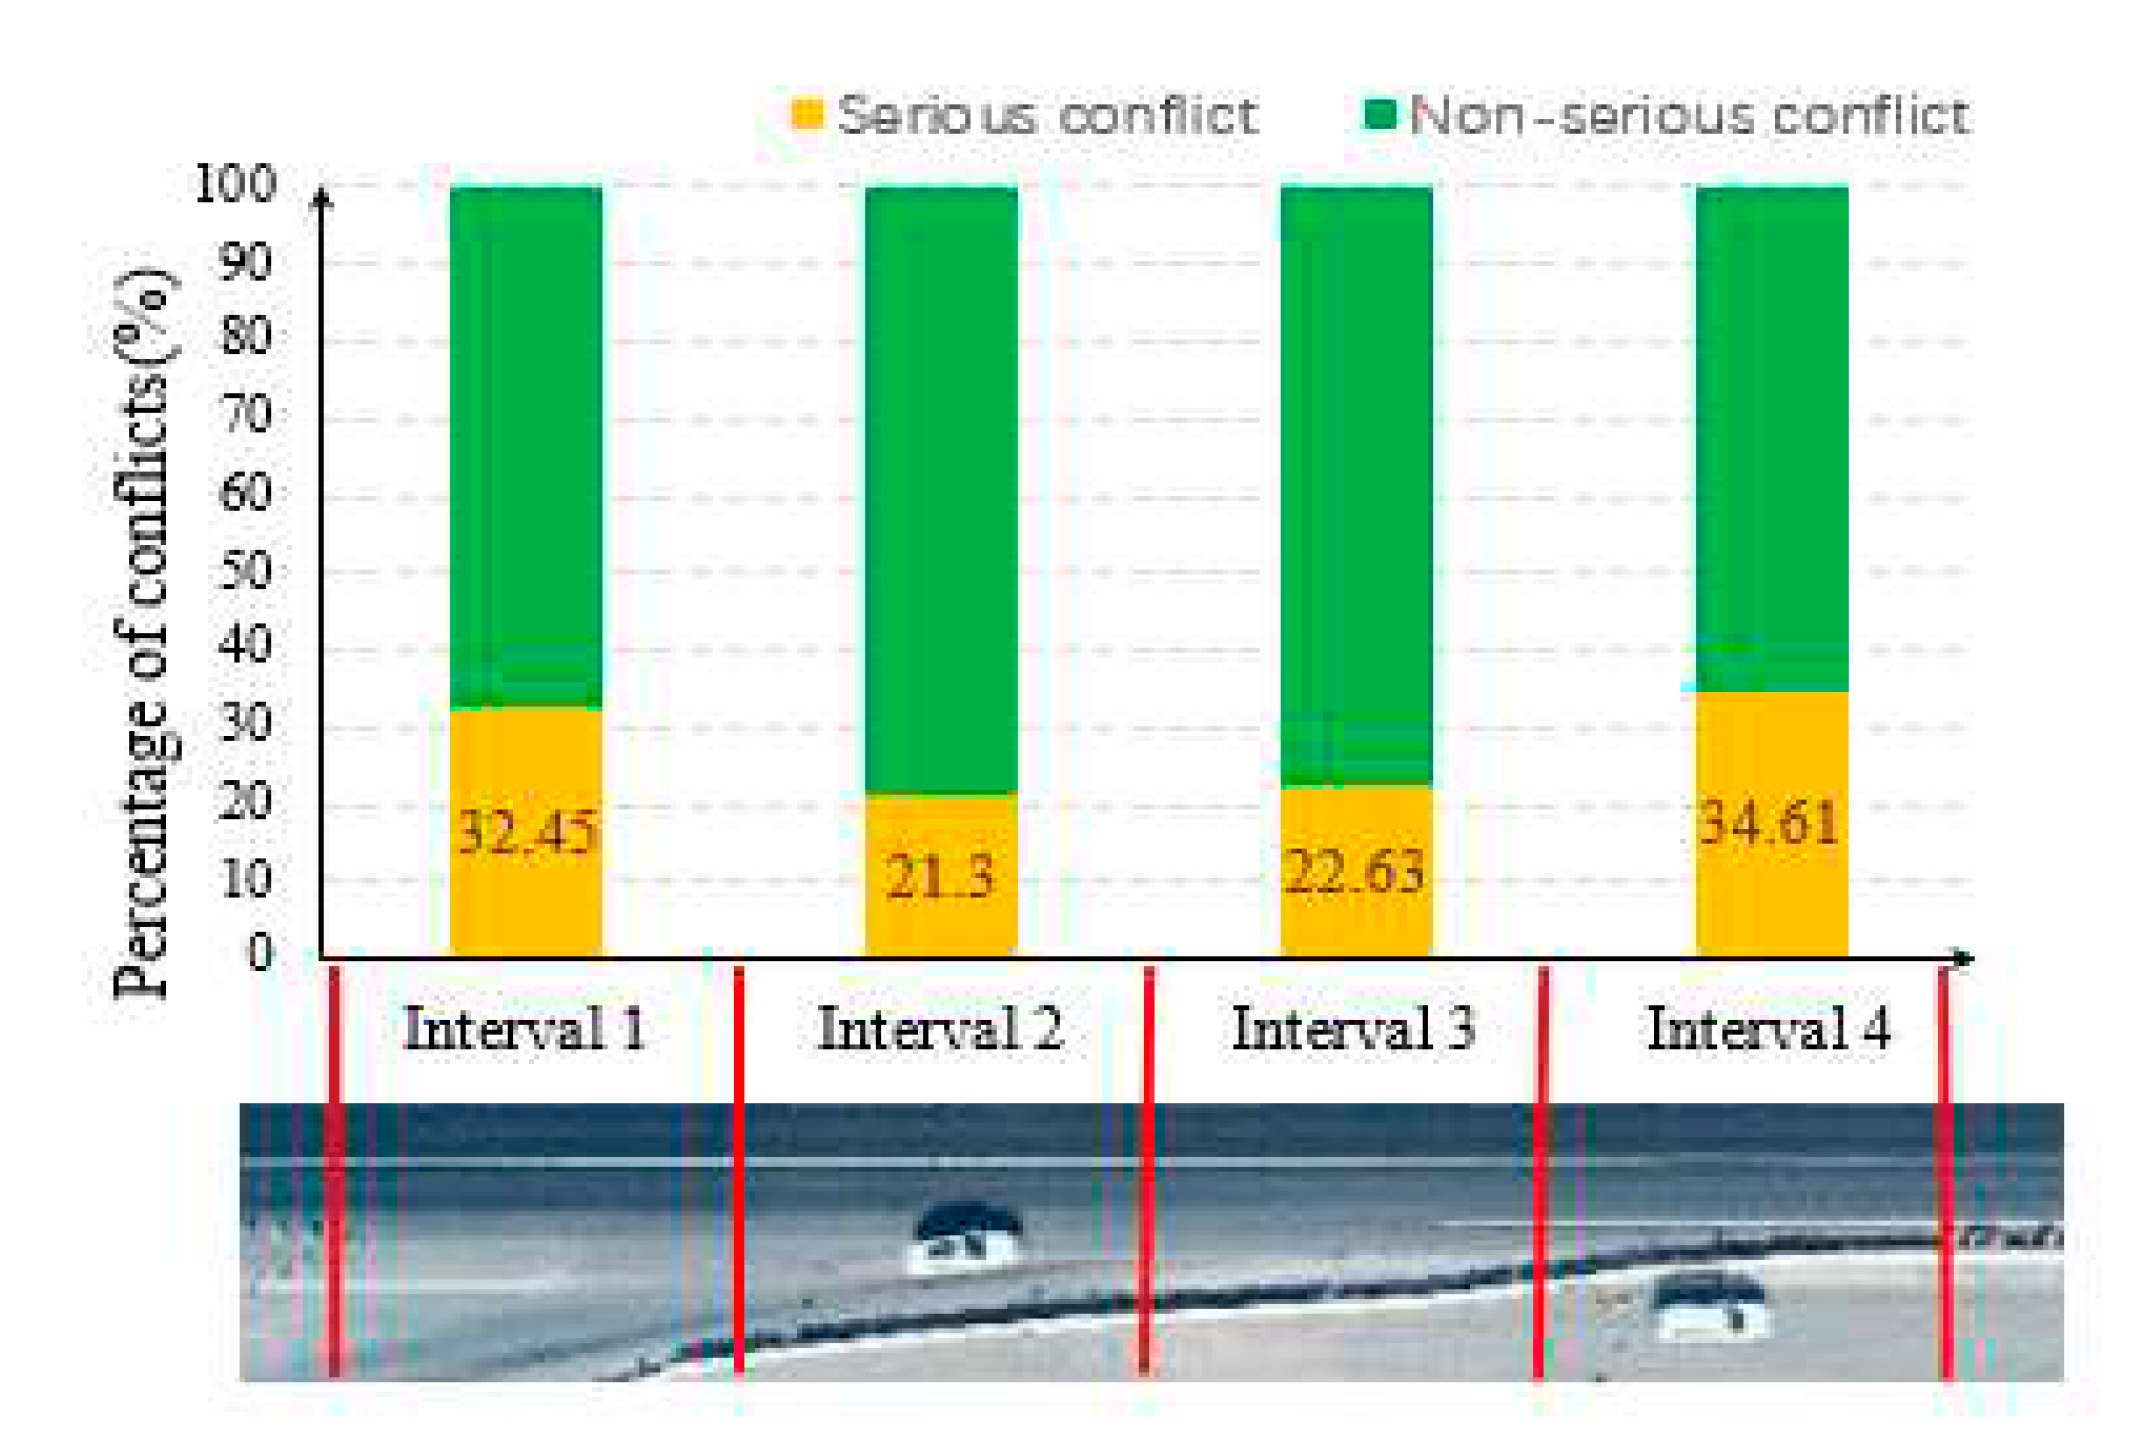
Figure 7.
Vehicle running track in K176 + 500 merge areas.
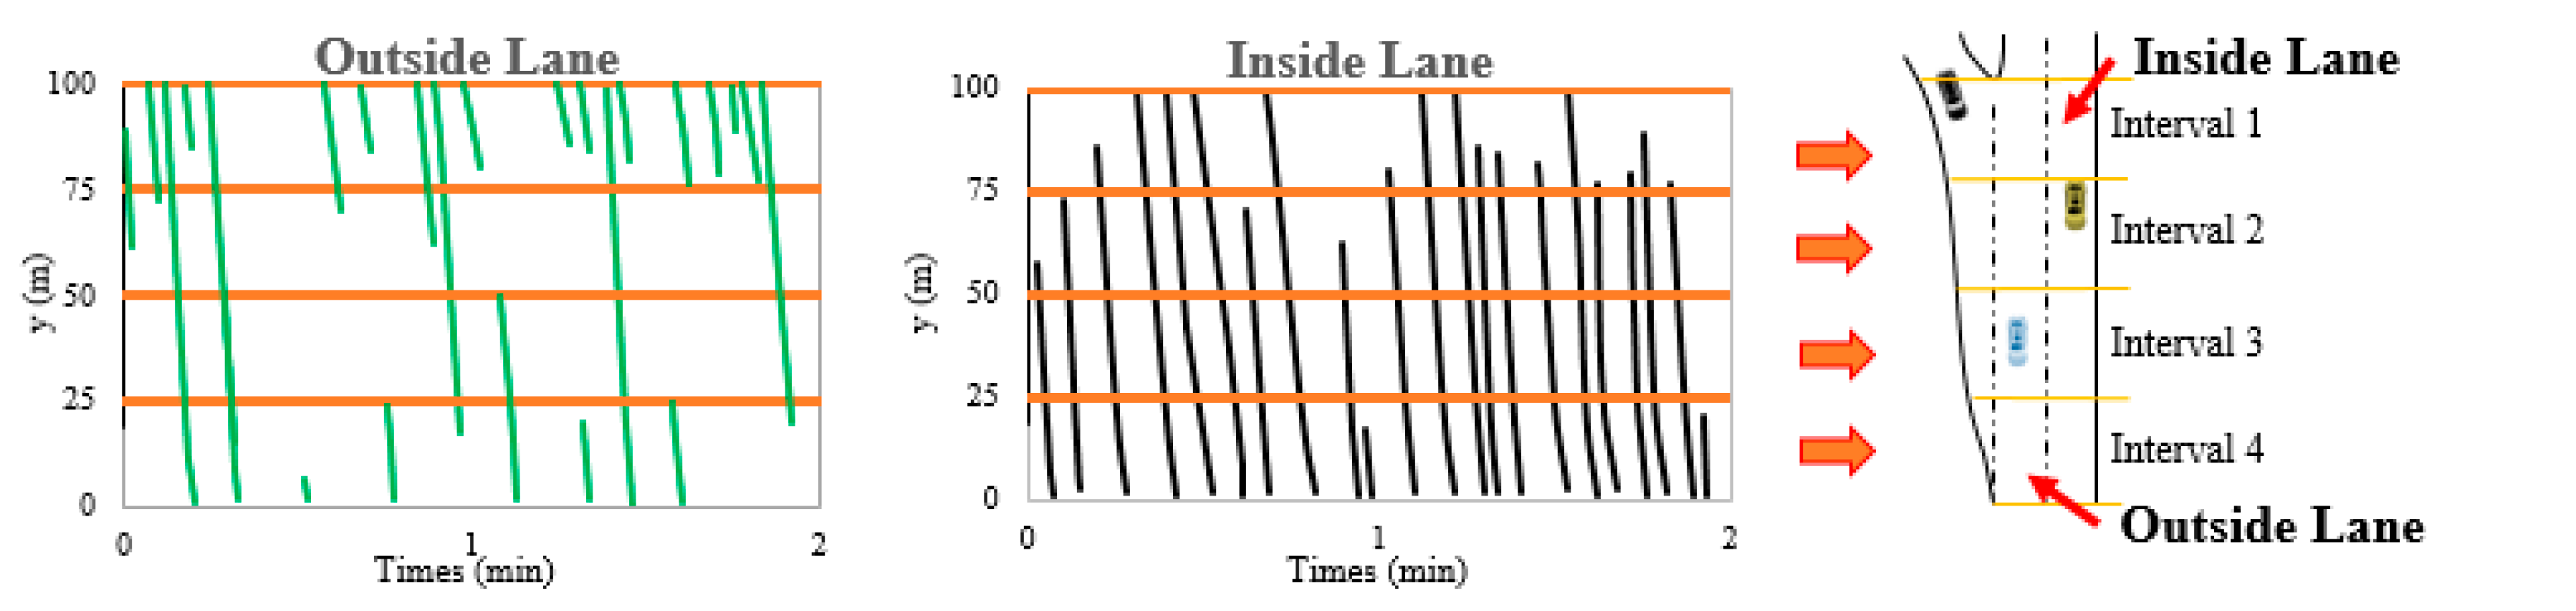
Figure 8.
Model parameter selection.
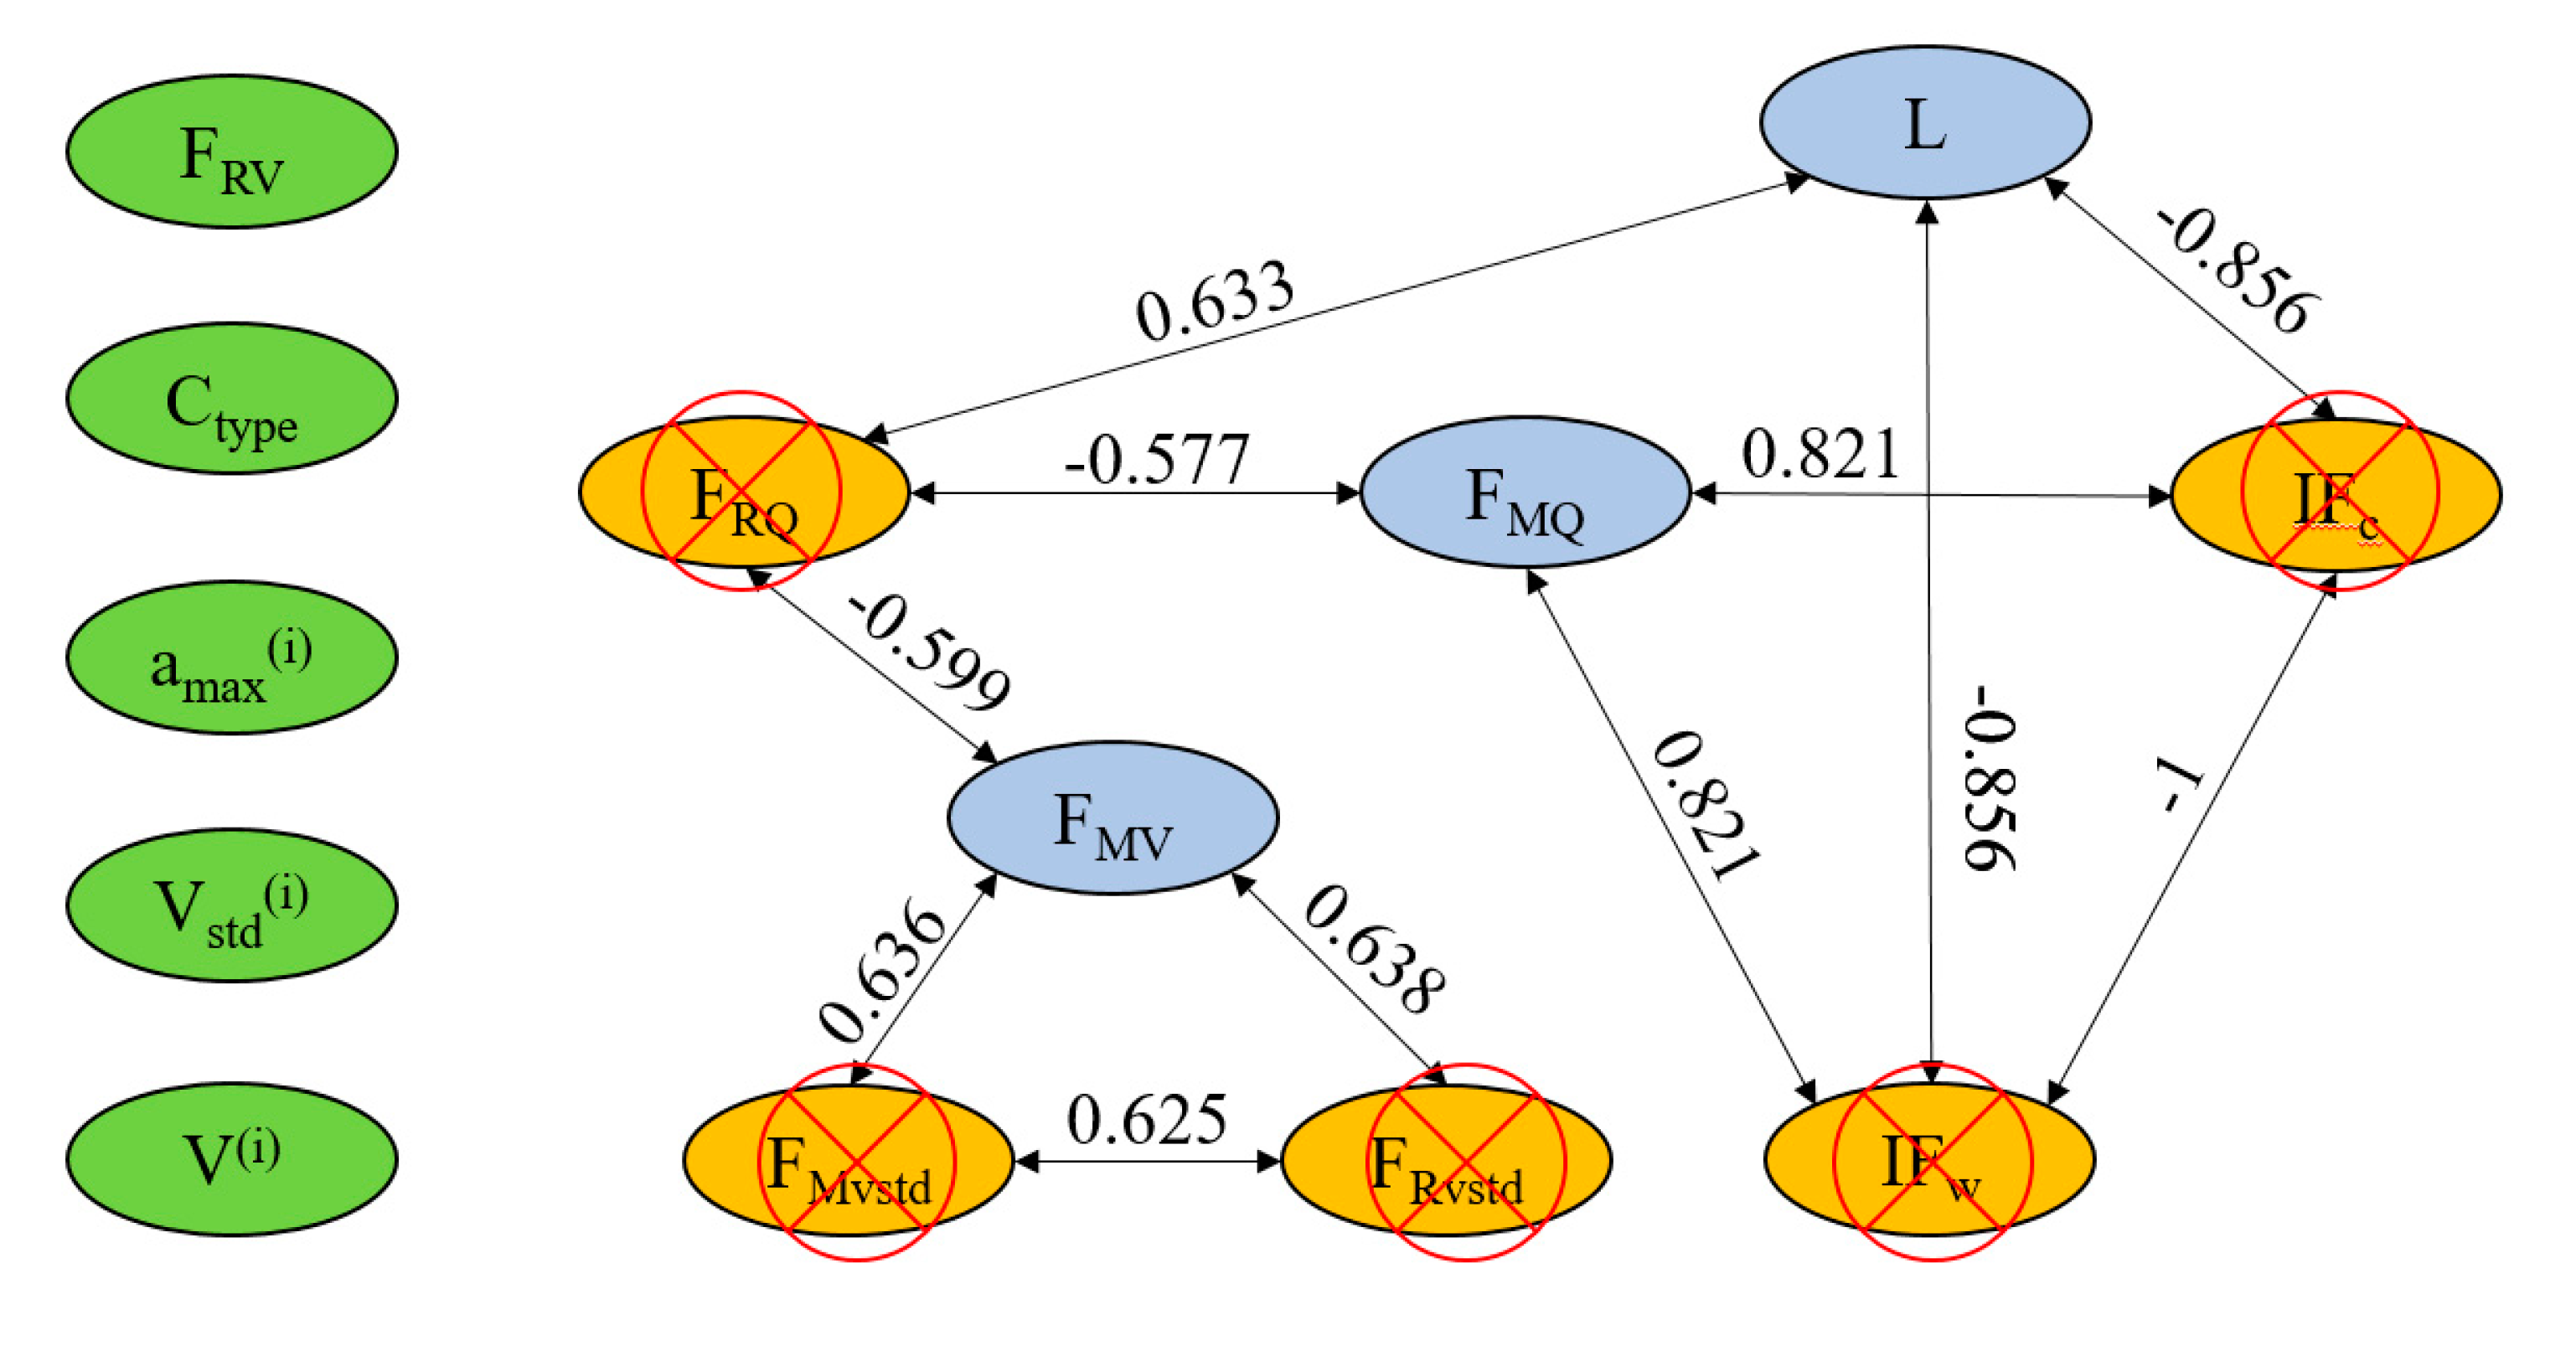
Table 2.
Influencing factors of traffic conflicts.
| Category | Variable | Variable Explanation |
|---|---|---|
| Traffic flow factors | FMQ | Hourly traffic volume on the mainline, veh/h |
| FRQ | Hourly traffic volume on the ramp, veh/h | |
| FMvstd | Average speed standard deviation of the mainline traffic, m/s | |
| FRvstd | Average speed standard deviation of the ramp traffic, m/s | |
| FMV | Average speed of the mainline traffic, m/s | |
| FRV | Average speed of the ramp traffic, m/s | |
| Road factor | L | Distance between the upstream work zone and the merge area (Figure 5), m |
| IFw | Whether there is construction on the outside of the merge area | |
| IFc | Whether the length of the acceleration lane in the merge area is compressed (whether it is shorter than before construction) | |
| Individual vehicle factor | Ctype | Vehicle type |
| V(i) | Average speed of the vehicle, m/s | |
| Vstd(i) | Standard deviation of the continuous driving speed of the vehicle, m/s | |
| amax(i) | The most unfavorable acceleration of the vehicle (acceleration corresponding to the maximum absolute value of the vehicle acceleration), m/s2 |
|
| Target variable | yi | Whether there are serious conflicts when the vehicles are driving in the merge area |
Table 3.
Classification results of initial velocity and acceleration.
| Initial velocity classification | Initial velocity (m/s) | Acceleration classification | Acceleration (m/s2) |
|---|---|---|---|
| Interval 1 | [7,13.5) | Interval 1 | [-3.96,-1.57) |
| Interval 2 | [13.5,17.6) | Interval 2 | [-1.57,-0.65) |
| Interval 3 | [17.60,21.10) | Interval 3 | [-0.65,0.04) |
| Interval 4 | [21.10,24.30) | Interval 4 | [0.04,0.84) |
| Interval 5 | [24.30,30.30] | Interval 5 | [0.84,3.15] |
Table 4.
Serious conflict rate and traffic accident rate Pearson coefficient under each combination.
Table 4.
Serious conflict rate and traffic accident rate Pearson coefficient under each combination.
| Initial velocity (m/s) | Acceleration (m/s2) | Pearson coefficient | Initial velocity (m/s) | Acceleration (m/s2) | Pearson coefficient |
|---|---|---|---|---|---|
| [7,13.5) | [-3.96,-1.57) | 0.812** | [13.5,17.6) | [-3.96,-1.57) | 0.823** |
| [7,13.5) | [-1.57,-0.65) | 0.877** | [13.5,17.6) | [-1.57,-0.65) | 0.563 |
| [7,13.5) | [-0.65,0.04) | 0.267 | [13.5,17.6) | [-0.65,0.04) | 0.532 |
| [7,13.5) | [0.04,0.84) | 0.245 | [13.5,17.6) | [0.04,0.84) | 0.573 |
| [7,13.5) | [0.84,3.15] | 0.214 | [13.5,17.6) | [0.84,3.15] | 0.861** |
| [17.60,21.10) | [-3.96,-1.57) | 0.806** | [21.10,24.30) | [-3.96,-1.57) | 0.511 |
| [17.60,21.10) | [-1.57,-0.65) | 0.612 | [21.10,24.30) | [-1.57,-0.65) | 0.643 |
| [17.60,21.10) | [-0.65,0.04) | 0.422 | [21.10,24.30) | [-0.65,0.04) | 0.512 |
| [17.60,21.10) | [0.04,0.84) | 0.476 | [21.10,24.30) | [0.04,0.84) | 0.332 |
| [17.60,21.10) | [0.84,3.15] | (0.221) | [21.10,24.30) | [0.84,3.15] | 0.324 |
| [24.30,30.30] | [-3.96,-1.57) | 0.614 | [24.30,30.30] | [0.04,0.84) | 0.253 |
| [24.30,30.30] | [-1.57,-0.65) | 0.322 | [24.30,30.30] | [0.84,3.15] | 0.298 |
| [24.30,30.30] | [-0.65,0.04) | 0.106 |
Table 5.
Overall vehicle conflict distribution (vehicles).
| Number of vehicles in serious conflict (vehicles). | Number of vehicles in non-serious conflict (vehicles) | Total number of vehicles (vehicles) | Proportion of vehicles in serious conflict (%) |
|---|---|---|---|
| 816 | 1552 | 2368 | 34.46 |
Table 6.
Correlation of variables (high correlation).
| Variable | FRQ | FMV | FMvstd | FRvstd | IFc | IFw | L | |||||||||
|---|---|---|---|---|---|---|---|---|---|---|---|---|---|---|---|---|
| Hourly traffic on the mainline (FMQ) |
Correlation | -.577 | .821 | -.821 | ||||||||||||
| significance (two-tailed) | .000 | .000 | .000 | |||||||||||||
| Hourly traffic volume on the ramp (FRQ) |
Correlation | -.599 | .633 | |||||||||||||
| significance (two-tailed) | .000 | .000 | ||||||||||||||
| Average speed of the mainline traffic (FMV) |
Correlation | .636 | .638 | |||||||||||||
| significance (two-tailed) | .000 | .000 | ||||||||||||||
| Standard deviation of the average speed of the mainline traffic (FMvstd) | Correlation | .625 | ||||||||||||||
| significance (two-tailed) | .000 | |||||||||||||||
| Whether the acceleration lane is compressed (IFc) |
Correlation | -1.000 | -.856 | |||||||||||||
| significance (two-tailed) | 0.000 | .000 | ||||||||||||||
| Whether the roadside is under construction (IFw) |
Correlation | .856 | ||||||||||||||
| significance (two-tailed) | .000 | |||||||||||||||
Table 7.
Values of independent variables after discretization.
| Variable type | Variable | Discrete value | Discretization discriminant |
|---|---|---|---|
| Individual vehicle variables | Vehicle Type | 0 | Small or medium-sized vehicle |
| Ctype | 1 | Large vehicle | |
| Average speed of an individual vehicle V(i) (m/s) |
1 | [6,15.5) | |
| 2 | [15.5, 21.6) | ||
| 3 | [21.6,33] | ||
| Standard deviation of the average speed of an individual vehicle Vstd(i) (m/s) |
1 | [0,1.85) | |
| 2 | [1.85,5) | ||
| 3 | [5,8] | ||
| The most unfavorable acceleration of an individual vehicle amax(i) (m/s2) |
1 | [-4.5,-2.3) | |
| 2 | [-2.3,0.2) | ||
| 3 | [0.2,3] | ||
| Traffic flow variables | Hourly traffic on the mainline FMQ (veh/h) |
1 | [820,900) |
| 2 | [900,1000) | ||
| 3 | [1000,1120] | ||
| Average speed of the mainline traffic FMV (m/s) |
1 | [12,14) | |
| 2 | [14,17) | ||
| 3 | [17,21] | ||
| Average speed of the ramp traffic FRV (m/s) |
1 | [8,10) | |
| 2 | [10,14) | ||
| 3 | [14,18] | ||
| Road condition variables | Distance between the upstream work zone and the merge area L | 1 | Small |
| 2 | Medium | ||
| 3 | Large | ||
| Dependent variables | Whether there is a risk of serious conflict yi |
0 | Non-serious conflict |
| 1 | Serious conflict |
Table 8.
Model fitting results (excluding excluded variables).
| Variable | β | S.E. | Wald | Degree of freedom | Significance | Odds ratio (OR) | |
|---|---|---|---|---|---|---|---|
| V(i) = 1 | 8.504 | 2 | .000 | ||||
| V(i ) = 2 | -0.814 | 0.868 | .880 | 1 | .048 | 0.443 | |
| V(i) = 3 | 1.783 | 0.729 | 5.990 | 1 | .000 | 5.954 | |
| FMQ = 1 | 7.210 | 2 | .000 | ||||
| FMQ = 2 | 0.542 | 0.278 | 3.812 | 1 | .000 | 1.720 | |
| FMQ = 3 | -.221 | 0.113 | 3.854 | 1 | .000 | 0.801 | |
| amax(i) = 1 | 15.607 | 2 | .000 | ||||
| amax(i) = 2 | -3.323 | 0.841 | 15.607 | 1 | .000 | 0.036 | |
| amax(i) = 3 | -20.509 | 798.820 | .000 | 1 | .998 | 0.000 | |
| Ctype | 1.561 | 0.734 | 4.531 | 1 | .033 | 4.765 | |
| L = 1 | 4.000 | 2 | .000 | ||||
| L = 2 | -.029 | 0.022 | 1.803 | 1 | .000 | 0.971 | |
| L = 3 | -.587 | 0.360 | 2.656 | 1 | .000 | 0.556 | |
| Constant | -3.909 | 0.600 | 42.449 | 1 | .000 | 0.020 |
Table 9.
Omnibus test of model coefficients.
| Chi-square | Degree of freedom | Significance | |
|---|---|---|---|
| Step (T) | 4.634 | 1 | .031 |
| Block | 1101.623 | 11 | .000 |
| Model | 1101.623 | 11 | .000 |
Table 10.
Hosmer and Lemeshow tests.
| Step (T) | Chi-square | Degree of freedom | Significance |
|---|---|---|---|
| 6 | .223 | 6 | 1.000 |
Disclaimer/Publisher’s Note: The statements, opinions and data contained in all publications are solely those of the individual author(s) and contributor(s) and not of MDPI and/or the editor(s). MDPI and/or the editor(s) disclaim responsibility for any injury to people or property resulting from any ideas, methods, instructions or products referred to in the content. |
© 2023 by the authors. Licensee MDPI, Basel, Switzerland. This article is an open access article distributed under the terms and conditions of the Creative Commons Attribution (CC BY) license (http://creativecommons.org/licenses/by/4.0/).
Copyright: This open access article is published under a Creative Commons CC BY 4.0 license, which permit the free download, distribution, and reuse, provided that the author and preprint are cited in any reuse.


