
Submitted:
27 June 2023
Posted:
28 June 2023
You are already at the latest version
Abstract
Conducting an accurate hydrological water balance at the regional and country-wide scales is paramount to assessing available water resources and adequately allocating them. One of the main components of these balances is the anthropogenic recharge of groundwater either intentionally, through managed aquifer recharge (MAR), or unintentionally, where infiltration from dams and dykes can play a significant role. In Spain, proper management of water resources is critical due to the arid to semiarid conditions prevalent in most of the territory and the relevance of water resources for maintaining a robust agricultural sector. Spanish Previous work has estimated country-wide recharge from MAR at 150-280 Mm3/year. Recently, water authorities have pointed out that, according to hydrological water balances, the total volume from "unintentional recharge" from water courses may exceed 500 Mm3/year. The present research aims to present a new inventory of transverse structures in Spain and use it to estimate country-wide unintentional recharge. The inventory, compiled by the Spanish Ministry for the Ecological Transition and the Demographic Challenge, has more than 26,000 structures and includes construction characteristics, which allow for estimating the wet perimeter and the infiltration area. Structural data from the inventory was crossed through map algebra with thematic layers, such as lithology, permeability, the digital elevation model, the average groundwater levels, etc., in a GIS environment to arrive at the objective. Different analytical formulas to compute infiltration from small dams and dykes were also employed. The resulting volume of unintentional recharge from transverse structures in Spain is about 800 Mm3/year. This quantity can help close the hydrological balance at the national and river basin levels. Furthermore, this figure provides an order of magnitude for anthropogenic recharge at a national scale, which is difficult to obtain.
Keywords:
Managed Aquifer Recharge
; artificial recharge
; unintentional recharge
; transverse dams
; dykes
; infiltration
; Spain
1. Introduction
Aquifers can be anthropically recharged intentionally or unintentionally. Unintentional aquifer recharge can occur via diverse processes such as percolation through dams, irrigation returns, leakage from sewer and water supply systems, and wastewater disposal, among others. Intentional aquifer recharge is conducted through a variety of methods that entail infiltrating water through permeable surfaces, the vadose zone or directly into aquifer through injection systems [1]. This sort of intentional recharge is often called managed aquifer recharge (MAR) or artificial recharge.
The amount of anthropogenic recharge can be a considerable component of the hydrological balance and make up a large percentage of the annual recharge of a region, or even a country.
In Spain, a country where water stress is tangible across many surface and groundwater bodies, regional water budgets are of paramount importance to properly manage and allocate water resources. In this context, there have been various attempts to estimate the contribution from dams of various sizes (also referred here as transverse structures and dykes) and MAR systems to groundwater recharge.
Apart from a few large-scale operational schemes located in the regions of Castile and Leon and Catalonia [1], most of the large-scale MAR implementations in Spain have been built with an experimental character. According to the DINAMAR project [1,2], the total volume of water infiltrated in Spain through MAR (considering 32 schemes) and a preliminary inventory of nearly 800 dykes is 380 Mm3/year [1,3,4,5]. During the 2020 CONAMA conference, the Spanish water authorities estimated this figure at about 500 Mm3/year [3]. Other references suggest a lower figure in the order of 50 Mm³/year [6]. Other sources calculated the recharge from MAR and dykes and dams in urban and forested areas, aimed to flood mitigation and groundwater recharge, at 350 Mm³/year [7] and 380 Mm³/year [1,2,7]. The infiltration through the bottom of large dams, which in the Spanish territory exceed 1,400 [8,9,10], is not included in these estimations, and could result in a recharge of about 800 Mm3/year [3].
Given the relatively small recharge volume that MAR represents compared to other sources of unintentional recharge [1,3,7], the mismatch in the figure above is attributed predominantly to the difference in the number of transversal structures considered, and the methodologies employed.
This article has two main objectives: (1) to present the inventory of transverse structures created by the Spanish Ministry for the Ecological Transition and the Demographic Challenge (MITERD); and (2), to provide a calculation of the (un)managed aquifer recharge caused by cross-cutting river structures, such as dykes and small dams over the peninsular Spanish territory.
To the first end, the transversal structure inventory conducted by the MITERD is presented and described [11,12,13], exploring the methodology employed to construct the database, the information provided for each transversal structure and the level of accuracy involved in the determination of such information. To achieve the second objective, a GIS-based approach relying in various information layers is applied.
This analysis does not imply that recharge from dykes and dams is considered an intentional mechanism to increase groundwater storage, and therefore, can be regarded as MAR, but rather such additional recharge constitutes a secondary effect [14].
The results from this research should help disseminating the result from the Spanish Inventory of water course structures; contribute to closing knowledge gaps concerning anthropogenic recharge in Spain; providing a methodology to estimate recharge from a large number of structures (dykes and small dams) at the regional level; and ultimately, provide figures to better allocate and manage water resources.
2. Methodology
The methodology of this article has been subdivided into two sections. In the first one the background and some of the information pertaining to the transverse structure inventory is provided. The second part deals with the estimation of unintentional recharge.
2.1. Inventory of transverse structures
2.1.1. Theory of river channel transverse structures
Rivers channel works are frequently used in hydrological and forestry restoration efforts [11] to reduce the effect of torrential precipitation by preventing floods [12,15]. These works are also aimed at adjusting and controlling the effects of water flows. For instance, they can act on the river bed and banks, preventing the formation of flows with high concentrations of solids and high density, caused by erosion and sedimentation of materials [15,16,17].
River channel works can be either longitudinal or transverse. Longitudinal works are built in torrential watercourses for lateral erosion defence, landslide containment, and flood defence. They have a very limited effect on water retention and infiltration into aquifers [18]. Transverse structures are the most suitable solution to deal with sediment transport, erosion, and flooding processes in torrential watercourses with massive transport of materials, erosion of banks, and destabilisation of adjacent massifs [15,17,18]. These structures are also the best choice when the objective is to retain water.
The technical literature separates "dyke” from "weir", or small dam. The former term is employed for cross-cutting structures, designed predominantly to respond to issues associated with the retention of solid flows and the consolidation of slopes and beds of water channels, such as torrents, ravines and wadis [18,19,20]. The latter term, weir, or small dam, involves impounding water for diverse purposes.
As long as the reservoir basin that they originate stays unlanded, the dam effect causes the dammed water to slow down the rate at which sediment arrives, resulting in the stagnation of coarser sediments and a decrease in the solid proportion of the discharge flow. This has an essential effect on the type of clogging that accumulates at the bottom and constitutes an impediment to water infiltration [21]. The deposits that occur form a siltation that raises the bed of the channel until it reaches the compensation slope, which is always lower than the natural channel´s slope [22]. The compensation slope is formed when the sieve size composition of the bed and the stream flow is equalised, compensating for the solid volumes entering and leaving the siltation [20].
Raising the riverbed leads to a lower slope of the embankment, which reduces its velocity and, consequently, its capacity for dragging and erosion. The embankment wedge attached to the construction site also consolidates [23].
Dykes can be further categorised into consolidation and retention dykes. Consolidation dykes (Figure 1) serve the purpose of decreasing river channel erosion and stabilising the slope. Retention dykes (Figure 2) are built to retain solid or liquid flows. In the first case, i.e., to retain solid flows, they are known as closed or semi-hollow dykes, and, when aimed at retaining water, they are either detention or recharge dykes [24]. The dykes for retention play a special role in lamination and (un)intentional aquifer recharge [20,25,26].
Longitudinal works are used in torrential watercourses as lateral erosion defence works, landslide containment works, and flood defence works. They have a scant or null effect on water infiltration into aquifers [18,25].
The main difficulties of this type of work arise from the analysis and forecasting of phenomena related to sediment transport, its influence on the stability of the modified channel, both in terms of the extent of this influence [17], its evolution over time [18,26], and finally, the "anthropic" seepage variation [1,4,27,28].
In addition to these processes, dams can also contribute to infiltrating water into aquifers by increasing water retention times, working as infiltration basins [15,16,17]. The rate at which recharge proceeds is conditioned by factors such as the wet perimeter, the water stage, and the riverbed grain size distribution. As long as the dam reservoir preserves its volumetric capacity, the dam decreases the water sediment load, slows down the sediment delivery rate, and results in the deposition of fine sediments, a process commonly known as siltation, resulting in a low-permeability layer or clogging layer that decreases infiltration rates [21]. The low-permeability layer raises the channel bed up to the compensation slope [22], which forms when the grain size distribution of the river bed and the stream are equalised and there is a balance between the solid fraction entering and leaving the siltation layer [20,22].
2.1.2. inventory of transverse structures. Background and methology
In 2019, the Spanish Ministry for the Ecological Transition and the Demographic Challenge (MITERD) requested Tragsatec to conduct and digitalise the first inventory of dykes and transverse structures in watercourses in the peninsular Spanish territory (excluding the islands) [11,27,28].
Most of these transversal structures were constructed by former institutions for forest protection and agricultural development (ICONA and IRYDA, respectively) in the 50s and 60s [31], leaving aside the big dams. The documents concerning their construction were scattered across numerous libraries. The construction of the inventory relied on information from some of these documents; the photointerpretation of orthophotos from the National Aerial Orthophotography Plan (PNOA), satellite photography from Google Earth, and panoramic images at street level from Google Street View; and field visits, to corroborate ground truth satellite and remote information.
After three years of intense work, the inventory was consolidated, and the resulting number of transverse structures, i.e., 27,680 units, proved that a preliminary estimation of 8,000 [13] underestimated the reality [27,28].
The inventory and the related GIS information have been publicly available online on different websites (Table 1).
An interactive tool at MITERD's geoportal shows the transverse structures' location (Link provided in Table 1). There are links to download the actual inventory in shape file and KMZ formats and documentation about the transverse structures' attributes
2.2. Estimation of recharge from transverse structures.
2.2.1. General approach
The calculation of groundwater recharge from transversal structures is based on the following information sources: UTM grids to be sampled [31], the national lithological map [33], Spain's surface permeability map [33], design information from the new inventory of transversal structures in Spain [11,23,34,35], and other layers that contain relevant information, such as the DINA-MAR hydro-geoportal [36,37].
Equation 1 is the general formula employed to compute infiltration from transverse structures.
Where WAi is the wetted area, Kvi is the vertical hydraulic conductivity, Ccfi is the clogging correction factor, and GWLcfi is the groundwater level correction factor of the ith transversal structure. The next subsection describes the methodologies used to estimate each variable in Equation 1.
2.2.2. Wetted area (AWi)
The long-term average wetted area from transverse structures has been estimated through design characteristics obtained from the inventory of transverse structures.
The geodatabase [34] includes a layer of the National Flood Zone Mapping System (in Spanish, SNCZI-IPE) [38], with additional cross-cutting obstacles, such as minor vertical jumps, piped crossings, and crossings over faces.
Two methods to estimate the AWi variable have been tested.
The first is the formula by Mozzi et al. [39], devised to estimate the recharge from check dams in India. According to these authors, the wetted area can be computed through Equation 2 and Equation 3.
Where Asurf is the water surface, Ws is the structure width, Hs is the structure's height, θ is the stream gradient, and α is the river bank slope. All the necessary input data except the slope were available in the inventory [11]. The stream gradient for each construction was calculated from the 1-meter resolution DTM PNOA-IGN [40], as the average of the upstream and downstream slopes (Figure 3).
Different examples were conducted to check the reliability of the calculation.
An alternative method to approximate WA is proposed. This method considers a simplified equation (4) based on the backwater length and width.
If a transverse structure misses this data, the average wet area from well-defined structures has been assigned. i.e., 6,914.87 m2.
An obstacle with a jump height of more than 10 metres is considered a large dam and included in a specific inventory [9,27]. Dimensions above 3 m height cause sufficiently large backwaters [28]. Both dimensions are not always available to apply the calculation. Therefore, other data had to be taken into account to check the magnitude of the effect of each weir in concrete and the average width, and depth of the channel before the backwater created by the obstacle.
Only 4,171 transverse structures (out of 27,685) count with complete design and backwater dimensions data that were confirmed in the field.
3.3. Estimation of Kv
As groundwater recharge through surface structures is mainly driven by gravity, vertical hydraulic conductivity (Kv) is the required parameter to estimate the recharge from a surface water body into a shallow aquifer.
The methodology to obtain values of Kv at every transverse structure consists of the following steps: 1) assign the predominant lithology to every transverse structure; 2) use this lithology to designate permeability values; and 3) use standard anisotropy coefficients to estimate the vertical hydraulic conductivity.
First, the predominant lithology at every transverse structure has been determined as the lithology from the Spanish lithostratigraphic map with the highest cover percentage within a buffer zone [32] (Figure 4). The buffer zone was defined using the length of the wet perimeter. In case this value was missing, the average was employed.
Subsequently, the assigned lithologies have been translated into horizontal permeability values using Spain's surface permeability map at a scale of 1:200,000 [34]. This map qualitatively displays lithostratigraphic units' permeability, establishing five categories: very high, high, medium, low, and very low permeability. In addition, the map considers seven large groups of lithologies: carbonate, granular, quaternary granular, volcanic, meta-granular, igneous, and evaporitic.
For each permeability category, the average of the range of typical hydraulic conductivity values reported by Terzaghi and Peck [41], and Bendixen et al. [42] were assigned, resulting in the categorisation in Table 2.
3.5. Groundwater level correction factor (GWLcfi)
According to Bouwer and Rice [43], the infiltration rate below a structure aimed to infiltrate variates as a function of the depth until the groundwater level underneath. Consequently, an additional correction factor considering the groundwater level depth has been applied. The correction factor selected is 1.05 if the groundwater table depth is > 25 meters deep. This factor is purely bibliographic [43,47].
3.6. Clogging Correction Factor (Ccfi)
Clogging layers often decrease the vertical hydraulic conductivity of river beds and can control infiltration rates completely, sometimes acting as a bottleneck [40,43] that renders the underlying hydrogeological configuration irrelevant [46]. Consequently, the infiltration from transverse structures in riverbeds can depend considerably on the hydraulic impedance of the clogging layer [47], often composed of structure-less loams, sands and clays.
The clogging correction factor varies considerably in the hydrogeological literature. There are average values of about 0.75 that consider different types of clogging (e.g., physical and gas clogging) and are based on fieldwork conducted in sites with different lithologies, including alluvial and mudstone formations [48,49]. There are also more conservative correction factors of 0.5 [49,50] that account for different types of clogging, such as leakage, efficiency reduction of the structures, meteorological factors, etc. [50]. Clogging correction factors of about 0.8 have also been estimated for specific MAR systems (e.g., Aquifer Storage and Recovery (ASR) [51]). A study on check dams in SE Spain found a factor of 0.73-0.78 [52].
To consider the diverse types of lithologies involved in this research, the Dutch protocol 11001 approach [53] has been utilised. This protocol (Equation 5) was initially designed for injection wells and boreholes. Thus, it includes factors such as the number of full operation hours, the specific obstruction rate, and the modified fouling index (MFI).
Where vinf is the infiltration velocity (m/hour), K is the original material hydraulic conductivity (m/day); vverstopping is the standard value for each lithology (m/j), which is often a constant value of 0.1; MFI is the modified fouling index (s/L2), which habitually is assigned a value of 2 [54]; and ueq is the number of total operation hours (h/j) [54, appendix 4].
The resulting clogging factors for each lithology are presented in Table 4. These factors depend on the predominant sediments in the clogging layer (gravel, grit, loam, sand and clay), structure, compaction degree, and gas entrainment (vverstopping). This index refers specifically for infiltration boreholes and wells, not for surface recharge devices. From now on, special attention is paid on extreme values: a conservative correction factors of 0.5, usual for volcanic materials, and another, rather lax, 0.8, more frequently cited in the references [51,52].
4. Results and Discussion
4.1. Analysis of the database.
The public database consists of 27,680 structures represented as points in a shape file (shp) (Figure 5). Each point has 33 attributes [11,29]. An additional database on longitudinal structures along river channels is available on the Internet [15,27]. It has not been discussed, as it is rather irrelevant to the main research question.
The document published by Tragsatec entitled "Data model and storage of information contained in the inventory of transverse barriers and longitudinal defence works" [28], describes the design and content of the database in full detail. The following is a description of its structure, focusing on the general interest attributes and those relevant to the calculations conducted.
The "ObsTrans" layer contains a unique alphanumeric identifier for each structure (autoUID), and a series of identifying codes, which are shown in Table 4.
The type of obstacle is specified in column "TIPO_INFR" through the abbreviations and in the proportions shown in Figure 6. Vertical jumps, crossing with roads, and step over a wall are the most predominant.
Given the uncertainty in the methods employed to classify the structures, namely, satellite imagery, each structure in the database has a "CIERTO" attribute, which determines the degree of certainty in the type of structure assigned (Figure 7).
The "REVISIONES" column specifies whether a structure has been visited in the field and provides the visit date (FECHA REVISION).
The "TRANSGENERALES" table includes two identifiers for each structure, an alphanumeric code (AutoUID), and a code based on the type of structure and water body (ID_CLAVE). This table also includes the code of the surface water body (CODMAS), the code of the hydromorphological section (TRAMO_COD), the Autonomous Community (NOM_CCAA), the province (NOM_PROV), the municipality (NOM_MUNICI), coordinates, and name of the river (NOM_RIO) structure location. The river basin where the structure is located is specified in column "DEMARCACIO" and follows the "EUUMCODE" nomenclature. The number of transverse structures within each major Spanish River basin is presented in Figure 8. The majority of structures are located in central and northern eastern Spain, in basins such as the Duero, Júcar, Ebro, Tajo and Miño-Sil.
The attribute "EXIS_PASO" indicates if the structure has a fish ladder (yes/no), or a lateral diversion (deviation) (Figure 9).
The following columns in the database specify the origin of the information (ORIGEN), whether it was present in previous databases (BBDD_CONF) [27], whether it has been modified in any way (MOD_IMPRESS), and the name of the structure, if any.
The "TRANSTECNICOS" table includes identification data that assigns a main use (USO_P) among 22 options (Figure 10). The main uses are road crossing (10,317 structures), and irrigation-related (3,664 structures).
In certain cases, secondary uses of the infrastructure, conservation quality, construction year, concession date (if applicable), and type of passage are also reported. The construction date is important to estimate the clogging accumulation (in general, the oldest, the more clogged the river bed) and the structural fatigue (the oldest the structure, the greater the amount of stored sediment and the greater the confining pressure).
Another table, "EFECTO BARRERA" (barrier effect), contains information about the design and construction of the transverse structures. The main information is shown in Table 5. Approximately 20% of entries (4,171 structures out of 27,685) contain all the parameters in this table (Figure 11). The "EFECTO BARRERA" table includes most of the constructive data of particular relevance for the target of the study plus environmental aspects.
This information is complemented with attributes concerning the existence of a side channel in the structure (yes, no or unknown), grating, crossing device, the difficulty of ascent at the foot of the structure, call effect, whether there is significant turbulence, the roughness of the face, slopes or changes of gradient, absence of a clear gradient of velocity in the dammed area, passage through turbines, mills or falls of more than 10 m, accessibility of the channel to the downstream crossing device, call effect on the ascent, lift well at the foot of the structure, and accessibility of the crossing device to the upstream channel, among others.
Very relevant to this research is the attribute "COLMATACION", indicating if the structure is clogged (yes or no).
4.3. Estimation of unintentional recharge from transverse structures and validation
Two methods have been used to estimate the wetted area at each transverse structure.
The simplified formula proposed results in a mean wetted area of 6,914.87 m2, which is closer to field observations and a total recharge that ranges between 812.5 Mm3/year (applying the conservative clogging correction factor x0.5), and 1,218.8 Mm3/year (using the less restrictive clogging correction factor x0.8).
The formula by Mozzi et al. [39] yields a mean wetted area of 19,747.4 m2, and a total unintentional recharge of 2,716.8 and 1,901.8 Mm3/year, applying respectively the clogging correction factors.
These values are in the same order of magnitude as previous estimations. Nonetheless, the calculated volumes considerably exceed previous estimations by the Water General Directorate of the Spanish Ministry (500 Mm3/year, according to own estimations [3]). It is also significantly above the DINAMAR project's figure, 380 Mm3/year [4], considering the combined recharge of operative MAR systems and a limited inventory of about 800 transverse structures [1,2,4]. Therefore, the value obtained using the conservative clogging factor (i.e., 812.5 Mm3/year) is the closest to previous estimations.
These values are also contrasted with the SIMulación Precipitación-Aportación (SIMPA) quasi-distributed hydrological model (SIMulation Precipitation-Input), developed by CEDEX [29,31] for the Ministry of Ecological Transition. Its latest version (the period between hydrological years 1980/81-2017/18) has gridded Spain into approximately 2,000,000 square cells of 500 m on each side, and computes the hydrological balance, resulting in a series of published maps displaying precipitation (PRE), potential evapotranspiration (ETP), actual evapotranspiration (ETR), soil moisture (HUM), infiltration (INF), surface runoff (ASP), groundwater runoff (ASB), and runoff (AES), or total input (APN) [29].
According to the SIMPA model, the river network recharges more than 800 Mm3/year. This model considers direct infiltration from watercourses, and includes infiltration from large transverse structures, which do not include the structures in the inventory presented (see validation chapter).
The figure for the total recharge in Spain from river courses is 1,946 Mm3 [31]. In this respect, the percentage of infiltration from transverse structures ranges between 41.75% and 62.63%, not so far from the authors' 0.5 and 0.8 correction factors. An identical Ccf between 0.50 and 0.80 has also been found in a reference [39] for check dams in India. It is worth noticing that errors of different signs cancel each other out.
Values are also compared to the HEC-RAS modeling of watercourses for the Southeast of the Iberian Peninsula using HEC-RAS modeling on watercourses [52]. The variations in the flow rate through river stretches with an influent behaviour provide information about the infiltration rate from both the bottom and the banks. The model performance was therefore validated against the observed measurements in the semiarid conditions of the SE of Spain (see validation chapter). The HEC-RAS model at the regional scale for SE Spain [52, pages 991-993] found a Ccf between 0.73 and 0.78 for areas around check-dams, which are not far from the estimations through SIMPA, and in the present research.
5.1. Sensitivity analysis
Changes in the parameters considered have relatively little impact on the infiltration rates.
Calculations using the simplified methodology proposed by the authors reflect mean values for the wetted area, which is a factor in close correlation with precipitation, runoff and meteorological variables.
Determining the vertical permeability for each lithology below each transverse structure relies upon methods of general acceptance. Hydrogeological parameters variation is far from being a heavyweight factor for the infiltrated volume, due to the basic statistical rule that defects on one side, counterbalance excesses on the other. Permeability ranges are a classical figure found in the literature since at least 1967 [41], with slight or no modifications since then [42]. Consequently, Kv has a moderate influence on infiltration volumes, and thus, it is not a critical variable.
The anisotropy coefficient is a parameter with wide ranges of variation in the references, having even three orders of magnitude, e.g. for volcanic rocks. It is dependent on the lithologies and relies on the homogeneity and isotropy of the aquifer.
Algebra mapping operations conducted in ARC/GIS are secure to guarantee the certainty of the results.
The accumulation of clogging at the bottom of the wetted area is the factor with the greatest influence on the final weight. Corrections factors met in the references have been obtained, in general, for local or regional conditions.
Mozzi et al. [39] discussed the impact of clogging layers. They mention that as impedance reaches 100 days (30 cm of silt with a hydraulic conductivity of 0.003 m/day), infiltration is reduced between 20%-50% for check dams in India. This range is consistent with the results of the proposed simplified formula.
Regional data may represent an important limitation when extrapolating results to the scale of one country. Future studies on correction factors determined by the composition and development of clogging processes under different environmental conditions would be necessary.
Other factors, such as the catchment area surface, and runoff coefficient, depending on the geometry of the area, have also been reported as low-impact variables [39].
After different tests varying the correction factor in the database, the main conclusion is that Ccf is the parameter more sensitive to the final result. Any reasonable variation of the input parameters hardly modifies the computed value 812.52 Mm3/year, and 1,218.79 Mm3/year, as the final result for the infiltrated volume from dykes and small dams in peninsular Spain.
Limitations and factors to consider in future estimations
- The estimation could be enhanced considering the following factors:
- The meteorological variability can modify the wetted perimeters of the transversal structures.
- Considering the geometrical configuration of the wetted area through using the slopes around the structures to constrain the wetted area.
- The clogging factor could be further improved by considering the year of construction of the structures, assigning a higher value to older structures.
- The mean water table, which can constrain recharge.
- The moisture conditions of the basin
6. Conclusions
Sites across the Mediterranean are facing similar water stress problems, according to standardised groundwater level indexes for the Mediterranean region [55]. Water resources are becoming increasingly scarcer due to drought and water demand, particularly for irrigation.
MAR is at the forefront of two diverging stresses in the Mediterranean rural context. On the one hand, and following [56], groundwater resources are increasingly scarcer under unsustainable abstractions and drought. According to these authors, groundwater is key to sustaining irrigation where the rural exodus to urban centres poses the threat of declining populations. Within this context, MAR can play an important role in this issue by taking advantage of untapped water resources and buffering variable precipitation and stream flows.
Transverse structures result in considerable and, in most cases, unintentional recharge of aquifers. A new GIS-based calculation has been presented for the Spanish peninsula territory, and the recharged volume ranges between 812.5 - 1,218.8 Mm3/year. The lower range value is more realistic, as it matches the water balances for the Spanish territory according to PHCs, the third stage, CEDEX calculations, which estimated 500 Mm3/year [30], and regional modeling calculus [52].
The volume infiltrated into the aquifers from transverse structures (unintentionally and excluding large dams [9]) exceeds by more than four times the volume from MAR systems in Spain (about 200 Mm3/year [1]).
Additional meteorological and clogging data, and specific corrections, should be included in the future to refine the initial estimation.
Patents. Not applicable.
Supplementary Materials
The following supporting information can be downloaded at: https://sig.mapama.gob.es/geoportal/.
Author Contributions
Conceptualisation, Enrique Fernández Escalante; methodology, Enrique Fernández Escalante; validation, all; formal analysis, Enrique Fernández Escalante, José David Henao Casas; investigation, all; resources, all; data curation, Enrique Fernández, Carles Moreno; writing—original draft preparation, Enrique Fernández and José David Henao Casas; writing—review and editing, all; visualisation, all; supervision, Enrique Fernández Escalante; project administration, María Dolores Maza Vera (transverse structures) and Enrique Fernández Escalante (MARSoluT); funding acquisition, Enrique Fernández Escalante.
Funding
The research leading to these results has received funding from the European Union's Horizon 2020 research and innovation program under the Marie Skłodowska-Curie grant agreement no 814,066 (Managed Aquifer Recharge Solutions Training Network - MARSoluT).
Data Availability Statement
Not applicable.
Acknowledgments
The authors thank the Water General Directorate of the MITERD for allowing access to the database with the inventory of transverse structures, especially to Javier Sánchez, Víctor Arqued and Luis Martínez; to the Spanish Geological Survey (IGME) for permitting to consult the unpublished data of the Spanish permeability map. The authors also thank IAH-MAR Commission members, who kindly provided information about (un)intentional recharge appraisal methods.
Conflicts of Interest
The authors declare no conflict of interest. The funders had no role in the design of the study; in the collection, analyses, or interpretation of data; in the writing of the manuscript; or in the decision to publish the results.
References
- DINA-MAR (2010). DINA-MAR: La gestión de la recarga de acuíferos en el marco del desarrollo sostenible. Desarrollo tecnológico (management aquifer recharge in the framework of sustainable development. Technological development). Grafinat, Madrid, Spain. ISBN 978-84-614-5123-4. Editor: Fernández Escalante, E.
- Fernández Escalante, E., San Miguel Fraile, Mª A. y Sánchez Serrano, F. (2014). El hidrogeoportal DINA-MAR. Aplicación en soporte GIS para determinar zonas susceptibles de aplicar técnicas de recarga gestionada en España. Boletín Geológico y Minero, 125 (3): 341-368 ISSN: 0366-0176. https://aguas.igme.es/Boletin/2014/125_3/9_%20Articulo%206.pdf.
- Arqued Esquía, VM. (2020). Nuevos planes hidrológicos de cuenca. Novedades en la política del agua y nuevo ciclo de planificación hidrológica y gestión de riesgos (ST 31) (New river basin management plans. Novelties in water policy for the new cycle on water planning and risk management, technical session 31). CONAMA2020, Madrid. http://www.conama.org/conama/download/files/conama2020/STs%202020/5505_ppt_VArqued.pdf.
- Fernández Escalante, E.; Gil, R.C.; San Miguel Fraile, M.Á.; Serrano, F.S. (2014). Economic Assessment of Opportunities for Managed Aquifer Recharge Techniques in Spain Using an Advanced Geographic Information System (GIS). Water 2014, 6, 2021-2040. https://doi.org/10.3390/w6072021.
- MAPAMA (2008). Gestión de la recarga de acuíferos: su implicación en la lucha contra la desertificación. Tipologías y dispositivos de recarga artificial. https://www.miteco.gob.es/es/biodiversidad/temas/desertificacion-restauracion/0904712280144db8_tcm30-152640.pdf.
- IGME (2000). Identificación de acciones y programación de actividades de recarga artificial de acuíferos en las cuencas intercomunitarias. Eds. Sahún, B, and Mudillo, JM.
- MIMAM (2000). Libro Blanco del Agua en España (White book of the water in Spain). ISBN: 84-8320-219-0. https://www.miteco.gob.es/es/agua/temas/planificacion-hidrologica/water-in-spain_tcm30-527170.pdf.
- MITECO (2020). Libro Digital del Agua /water´s digital book). https://www.miteco.gob.es/eu/agua/temas/planificacion-hidrologica/sia-/infolibrodigital.aspx.
- Large dams inventory. Viewer with diverse thematic coverages. https://sig.mapama.gob.es/geoportal/index.html?services=60005&herramienta=ServiceTree&dir=Agua|Inventario%20de%20Presas%20y%20Embalses.
- MITECO (2018). Inventario de grandes presas de España (Spain´s dams inventory). https://www.miteco.gob.es/es/cartografia-y-sig/ide/descargas/agua/inventario-presas-embalses.aspx.
- MITECO (2020). Inventario de barreras transversales de España (Spain´s transverse obstacles inventory). https://www.miteco.es/app/descargas/descargafichero.aspx?f=iot.zip.
- MITECO (2018). Análisis de resultados de la caracterización de estructuras transversales potenciales para el paso de fauna identificadas en un muestreo en infraestructuras lineales de transporte de España, año 2018. SILCO Estadística y Aplicaciones Ambientales SL. https://www.miteco.gob.es/es/biodiversidad/temas/ecosistemas-y-conectividad/estruct_poten_fauna_tcm30-485847.pdf.
- MITERD (2022). Public thematic coverages for Spain. https://www.miteco.gob.es/es/cartografia-y-sig/ide/descargas/agua/default.aspx.
- Henao Casas, JD., Fernández Escalante, E., Ayuga Téllez, F., Standen, K., Costa, L., Monteiro, JP., Vlassopoulou, A., Kallioras, A., Caligaris, E., Rossetto, R., Rudnik, G., Kurtzman, D., Sapiano, M. and Wefer-Roehl, A. (2023). Report on the performance of optimal MAR designs. MARSOLut, deliverable 4-4, 2023. www.marsolut-itn.eu.
- MITECO (2021). La corrección de cauces torrenciales: obras transversales y longitudinales (Correction of torrential watercourses: transverse and longitudinal works). https://www.miteco.gob.es/es/biodiversidad/temas/desertificacion-restauracion/restauracion-hidrologico-forestal/rhf_caracteristicas_correcion_cauces.aspx.
- Fernández Escalante, E. (2018). Third Lecture of the Short Course on Managed Aquifer Recharge Systems and Water Harvesting Techniques. MAR passive and intermittent systems as an adaptation mechanism to climate change. Examples. Legal framework. MAYA project. University of Sassari, Italy. https://youtu.be/vRxHFDNvGDs.
- Nicolás Rodríguez, J. (2001). Restauración hidrológico-forestal de la cuenca del torrente de Arás. Grupo TRAGSA-TRAGSATEC. Madrid. 221 pp. DL. M-39692-2001.
- MITECO (2022). Plan Nacional de actuaciones prioritarias en materia de restauración hidrológico-forestal, control de la erosión y defensa contra la desertificación. https://www.miteco.gob.es/es/biodiversidad/temas/desertificacion-restauracion/restauracion-hidrologico-forestal/rhf_plan_restauracion.aspx.
- Closas, A. and Molle, F. (2016). Groundwater governance in the Arab World – Taking Stock and addressing the challenges. IWMI project report 1. https://www.iwmi.cgiar.org/archive/wle/project/groundwater-governance-arab-world-taking-stock-and-addressing-challenges/index.html.
- Mintegui, JA.; Fábregas, S.; Robredo, JC. and Huelin, P. (2016). Evaluación de los efectos de la restauración hidrológico-forestal en la atenuación de los riesgos naturales en las cuencas de montaña: aplicación en el Pirineo aragonés. Lucas Mallada N.º 18, Artículos, Páginas 311-378. SSN 0214-8315 ISSN-e 2445-060X. http://revistas.iea.es/index.php/LUMALL.
- Fernández Escalante AE, Calero Gil R, Villanueva Lago M, San Sebastian Sauto J (2016). Managed Aquifer Recharge to Combat Groundwater Overexploitation at the Los Arenales Site, Castilla y León, Spain. MARSOL, Madrid, Spain. http://marsol.eu/35-0-Results.html.
- Fernández Escalante, E. (2018). Lecture 2: Second Lecture of the Short Course on Managed Aquifer Recharge Systems and Water Harvesting Techniques. MAR as a climate change adaptation mechanism, and MAR in semiarid and arid areas. MAYA project. University of Sassari, Italy. https://youtu.be/nSX5d2CBNw8.
- MITECO (2021). Realización de un inventario de obras de defensa frente a inundaciones, impacto sobre hidromorfología y análisis de impacto del cambio climático (Inventory of flood defence works, impact on hydromorphology and climate change impact analysis). https://www.miteco.gob.es/ca/agua/temas/delimitacion-y-restauracion-del-dominio-publico-hidraulico/estrategia-nacional-restauracion-rios/Plan-PIMA-ADAPTA-inventario-obras-defensa-inundaciones.aspx.
- Schneider C, Laizé CLR, Acreman MC, Flörke M (2013). How will climate change modify river flow regimes in Europe? Hydrol Earth Syst Sci 17:325–339. https://doi.org/10.5194/hess-17-325-2013. [CrossRef]
- González-Hidalgo J, Brunetti M, de Luis M (2010). Precipitation trends in Spanish hydrological divisions, 1946–2005. Clim Res 43:215–228. https://doi.org/10.3354/cr00937. [CrossRef]
- MAPAMA (2020). La corrección de cauces torrenciales: obras transversales y longitudinales (Correction of torrential watercourses: transverse and longitudinal works). https://www.miteco.gob.es/es/biodiversidad/temas/desertificacion-restauracion/restauracion-hidrologico-forestal/rhf_caracteristicas_correcion_cauces.aspx.
- MAPAMA (2020). Geoportal MAPAMA. https://sig.mapama.gob.es/geoportal/, including its manual for the identification of pressures and impact analysis in surface water; and the annexed CIS-Guidance-IMPRESS document, Chapter 2. https://www.miteco.gob.es/es/agua/publicaciones/impress_tcm30-214065.pdf.
- Tragsatec (2022). Modelo de datos inventario. Modelo de datos y almacenamiento de la información contenida en el inventario de barreras transversales y de obras longitudinales de defensa (Data model and storage of information contained in the inventory of transverse barriers and longitudinal defence works).
- CEDEX (2020). Evaluación de recursos hídricos en régimen natural en España, 1940/41 – 2017/18. (Assessment of natural water resources in Spain, 1940/41 – 2017/18). https://www.miteco.gob.es/es/agua/temas/evaluacion-de-los-recursos-hidricos/evaluacion-recursos-hidricos-regimen-natural/ and https://www.miteco.gob.es/es/agua/temas/evaluacion-de-los-recursos-hidricos/cedex-informeerh2019_tcm30-518171.pdf.
- BOE (1981). Real Decreto 1444/1981, de 22 de mayo, sobre actuación de los Institutos Nacionales de Reforma y Desarrollo Agrario (IRYDA) y para la Conservación de la Naturaleza (ICONA) en los programas extraordinarios del Gobierno para combatir el desempleo agrario (action by the National Institutes for Agrarian Reform and Development (IRYDA) and for Nature Conservation (ICONA) in the Government's extraordinary programmes to combat agricultural unemployment.). BOE-A-1981-16139. https://vlex.es/vid/institutos-iryda-conservacion-icona-254471858.
- CEDEX (2014). Encomienda de gestión al CEDEX para la realización de trabajos de asistencia técnica de la dirección general de calidad y evaluación ambiental y medio natural (2014-2016). Actuación nº 8: Actividades de preparación: recopilación de información, definición del modelo de datos y selección de las cuadrículas UTM a muestrear. Informe A8T1, nº 51-414-5-002 Madrid, Spain. https://www.miteco.gob.es/es/biodiversidad/temas/ecosistemas-y-conectividad/modelo-datos-estructuras-conectividad_tcm30-195883.pdf.
- IGME (2021). Mapa litoestratigráfico de España a escala 1/200.000. (Lithostratigraphycal map of Spain, scale 1:200,000). https://igme.maps.arcgis.com/home/webmap/viewer.html?webmap=3dc3fcb142594d6e821c5f645b16ffa1#!
- IGME (2010). Mapa de permeabilidades de España (Permeability map of Spain) https://catalogo.igme.es/geonetwork/srv/spa/catalog.search#/metadata/espigmepermeabilidades200continuodigital20100805637842.
- MITERD (2022). Inventario de obras longitudinales de protección frente a inundaciones. Memoria. (Longitudinal defence construction inventory. Memory). Geoportal MITERD. https://sig.mapama.gob.es/Docs/PDFServicios/ZI_IOL.pdf.
- MITERD (2022). Acceso al inventario de obras longitudinales de protección frente a inundaciones (longitudinal defence construction inventory access). https://www.miteco.gob.es/es/agua/temas/gestion-de-los-riesgos-de-inundacion/planes-gestion-riesgos-inundacion/Acceso-Inventario-obras-de-proteccion-frente-a-inundaciones.aspx.
- Tragsa (2020). Hidrogeoportal DINA-MAR (DINA-MAR Hydro-geoportal). https://sjc-arcgis.tragsatec.es/portal/apps/webappviewer/index.html?id=d43af99e5b0e4ca8b89a8bc41902545d.
- Tragsa (2020). Visor Hidrogeoportal DINA-MAR. Manual de usuario (user´s manual). https://dinamar.tragsa.es/file.axd?file=/PDFS/Visor%20Hidrogeoportal-manual%20de%20usuario.pdf.
- MITERD (2022). Sistema Nacional de zonas inundables (SNCZI-IPE), National Flood Zone Mapping System, general cartography. https://sig.mapama.gob.es/snczi/index.html?herramienta=Presas.
- Mozzi G, Pavelic P, Alam MF, Stefan C, and Villholth KG (2021). Hydrologic Assessment of Check Dam Performances in Semiarid Areas: A Case Study From Gujarat, India. Front. Water 3:628955. [CrossRef]
- IGN (2021). Plan Nacional de Ortofotografía Aérea. Plan Nacional de Observación del Territorio (PNOA-IGN MDT 1 m); National Aerial Orthophotography Plan. National Plan for Territory Observation (PNOA-IGN DTM 1 m). https://pnoa.ign.es/web/portal/pnoa-lidar/tercera-cobertura.
- Terzaghi, K. and Peck, RB. (1967). Technology & Engineering. 752 pages. Ed. John Wiley & Sons. New York.
- Bendixen, TW; Hershbergeb, MF, and Slater, S. (USDA). 1994. A basis for classifying soil permeabilities. Journal of Agricultural Research, Vol. 77, nº. 5.
- Bouwer, H., and Rice, R. C. (1989). Effect of water depth in groundwater recharge basins on infiltration. J. Irrig. Drain. Eng. 115, 556–567. [CrossRef]
- Chapuis, RP and Gill, DE. (1989). Hydraulic anisotropy of homogeneous soils and rocks: influence of the densification process. April 1989. Bulletin of Engineering Geology and the Environment, 39(1):75-86. [CrossRef]
- Sridhar, G, Robinson, RG and Karpurapu, R. (2017). Horizontal Coefficient of Consolidation from Inward and Outward Flow Tests. Proceedings of the Institution of Civil Engineers Ground Improvement. 171(3):1-31. DOI: 10.1680/jgrim.17.00056. [CrossRef]
- . [CrossRef]
- Bouwer, 1969. Bouwer, H. (1969). Theory of seepage from open channels. Advanced Hydrosciences 5, 121–172. doi: 10.1016/B978-1-4831-9936-8.50008-8. [CrossRef]
- Fernández Escalante E (2015). Practical Management to Minimise the Effects of Clogging in Managed Aquifer Recharge Wells at Two Sites in the Guadiana Basin, Spain. J Hydrol Eng 20. https://doi.org/10.1061/(ASCE)HE.1943-5584.0001047. [CrossRef]
- Fernández Escalante, E.; Henao Casas, J.D.; San Sebastián Sauto, J.; Calero Gil, R. (2022). Monitored and Intentional Recharge (MIR) A Model for Managed Aquifer Recharge (MAR) Guideline and Regulation Formulation. Water 2022, 14, 3405. https://doi.org/10.3390/w14213405.
- MITERD (2021). Plan Nacional de Depuración, Saneamiento, Eficiencia, Ahorro y Reutilización - Plan DSEAR (National plan for purification, sanitation, efficiency, savings and reuse - DSEAR Plan). Ministerio de la Transición Ecológica y el Reto Demográfico.
- Versteeg P, Peña K, Gallegos J, and Fernández-Escalante E (2021). Urban Waterbuffer Zorrilla, Valladolid. Pilot project for managed aquifer recharge and rainwater recovery for irrigation. Field Factors report, 2021. https://www.fieldfactors.com/case-studies/urban-waterbuffer-zorrilla-stadium-in-valladolid-spain.
- Martín-Rosales, W., Gisbert, J., Pulido-Bosch, A., Vallejos, A., and Fernández-Cortés, A. (2007). Estimating groundwater recharge induced by engineering systems in a semiarid area (southeastern Spain). Environmental Geology 52, 985–995. doi: 10.1007/s00254-006-0541-5.
- SIKB (2014). Ontwerp, realisatie en beheer van het ondergrondse deel van bodemenergiesystemen. Dutch protocol 11001 https://www.sikb.nl/doc/BRL11000/Protocol_11001_v_2_0_20141002.pdf.
- Schippers J. C. & Verdouw J. (1980). The modified fouling index, a method of determining the fouling characteristics of water. Desalination 32, pg 137-148.
- Bloomfield JP, Marchant BP (2013). Analysis of groundwater drought building on the standardised precipitation index approach. Hydrol Earth Syst Sci 17:4769–4787. [CrossRef]
- Brauns B, Cuba D, Bloomfield JP, et al (2020). The Groundwater Drought Initiative (GDI): Analysing and understanding groundwater drought across Europe. Proc IAHS 383:297–305. https://doi.org/10.5194/piahs-383-297-2020. All links accessed on 13/06/2023. [CrossRef]
- Web accesses.
- IAH. Commission on Managing Aquifer Recharge. International Association of Hydrogeologists. https://recharge.iah.org. Accessed 13/06/2023.
- MARSOLUT project web site. Marsolut-itn.eu. Accessed 13/06/2023.
- Spanish Groundwater Action Plan https://www.miteco.gob.es/es/agua/participacion-publica/Plan_Accion_Aguas_Subterraneas_2023_2030.aspx. Accessed 13/06/2023.
- www.dinamar.tragsa.es. Accessed 13/06/2023.
- Wikipedia (2008). Recarga artificial. https://es.wikipedia.org/wiki/Recarga_artificial_de_acu%C3%ADferos. Accessed 13/06/2023.
Figure 1.
Consolidation dyke. Válor River, Granada, Spain. Source: TRAGSATEC.
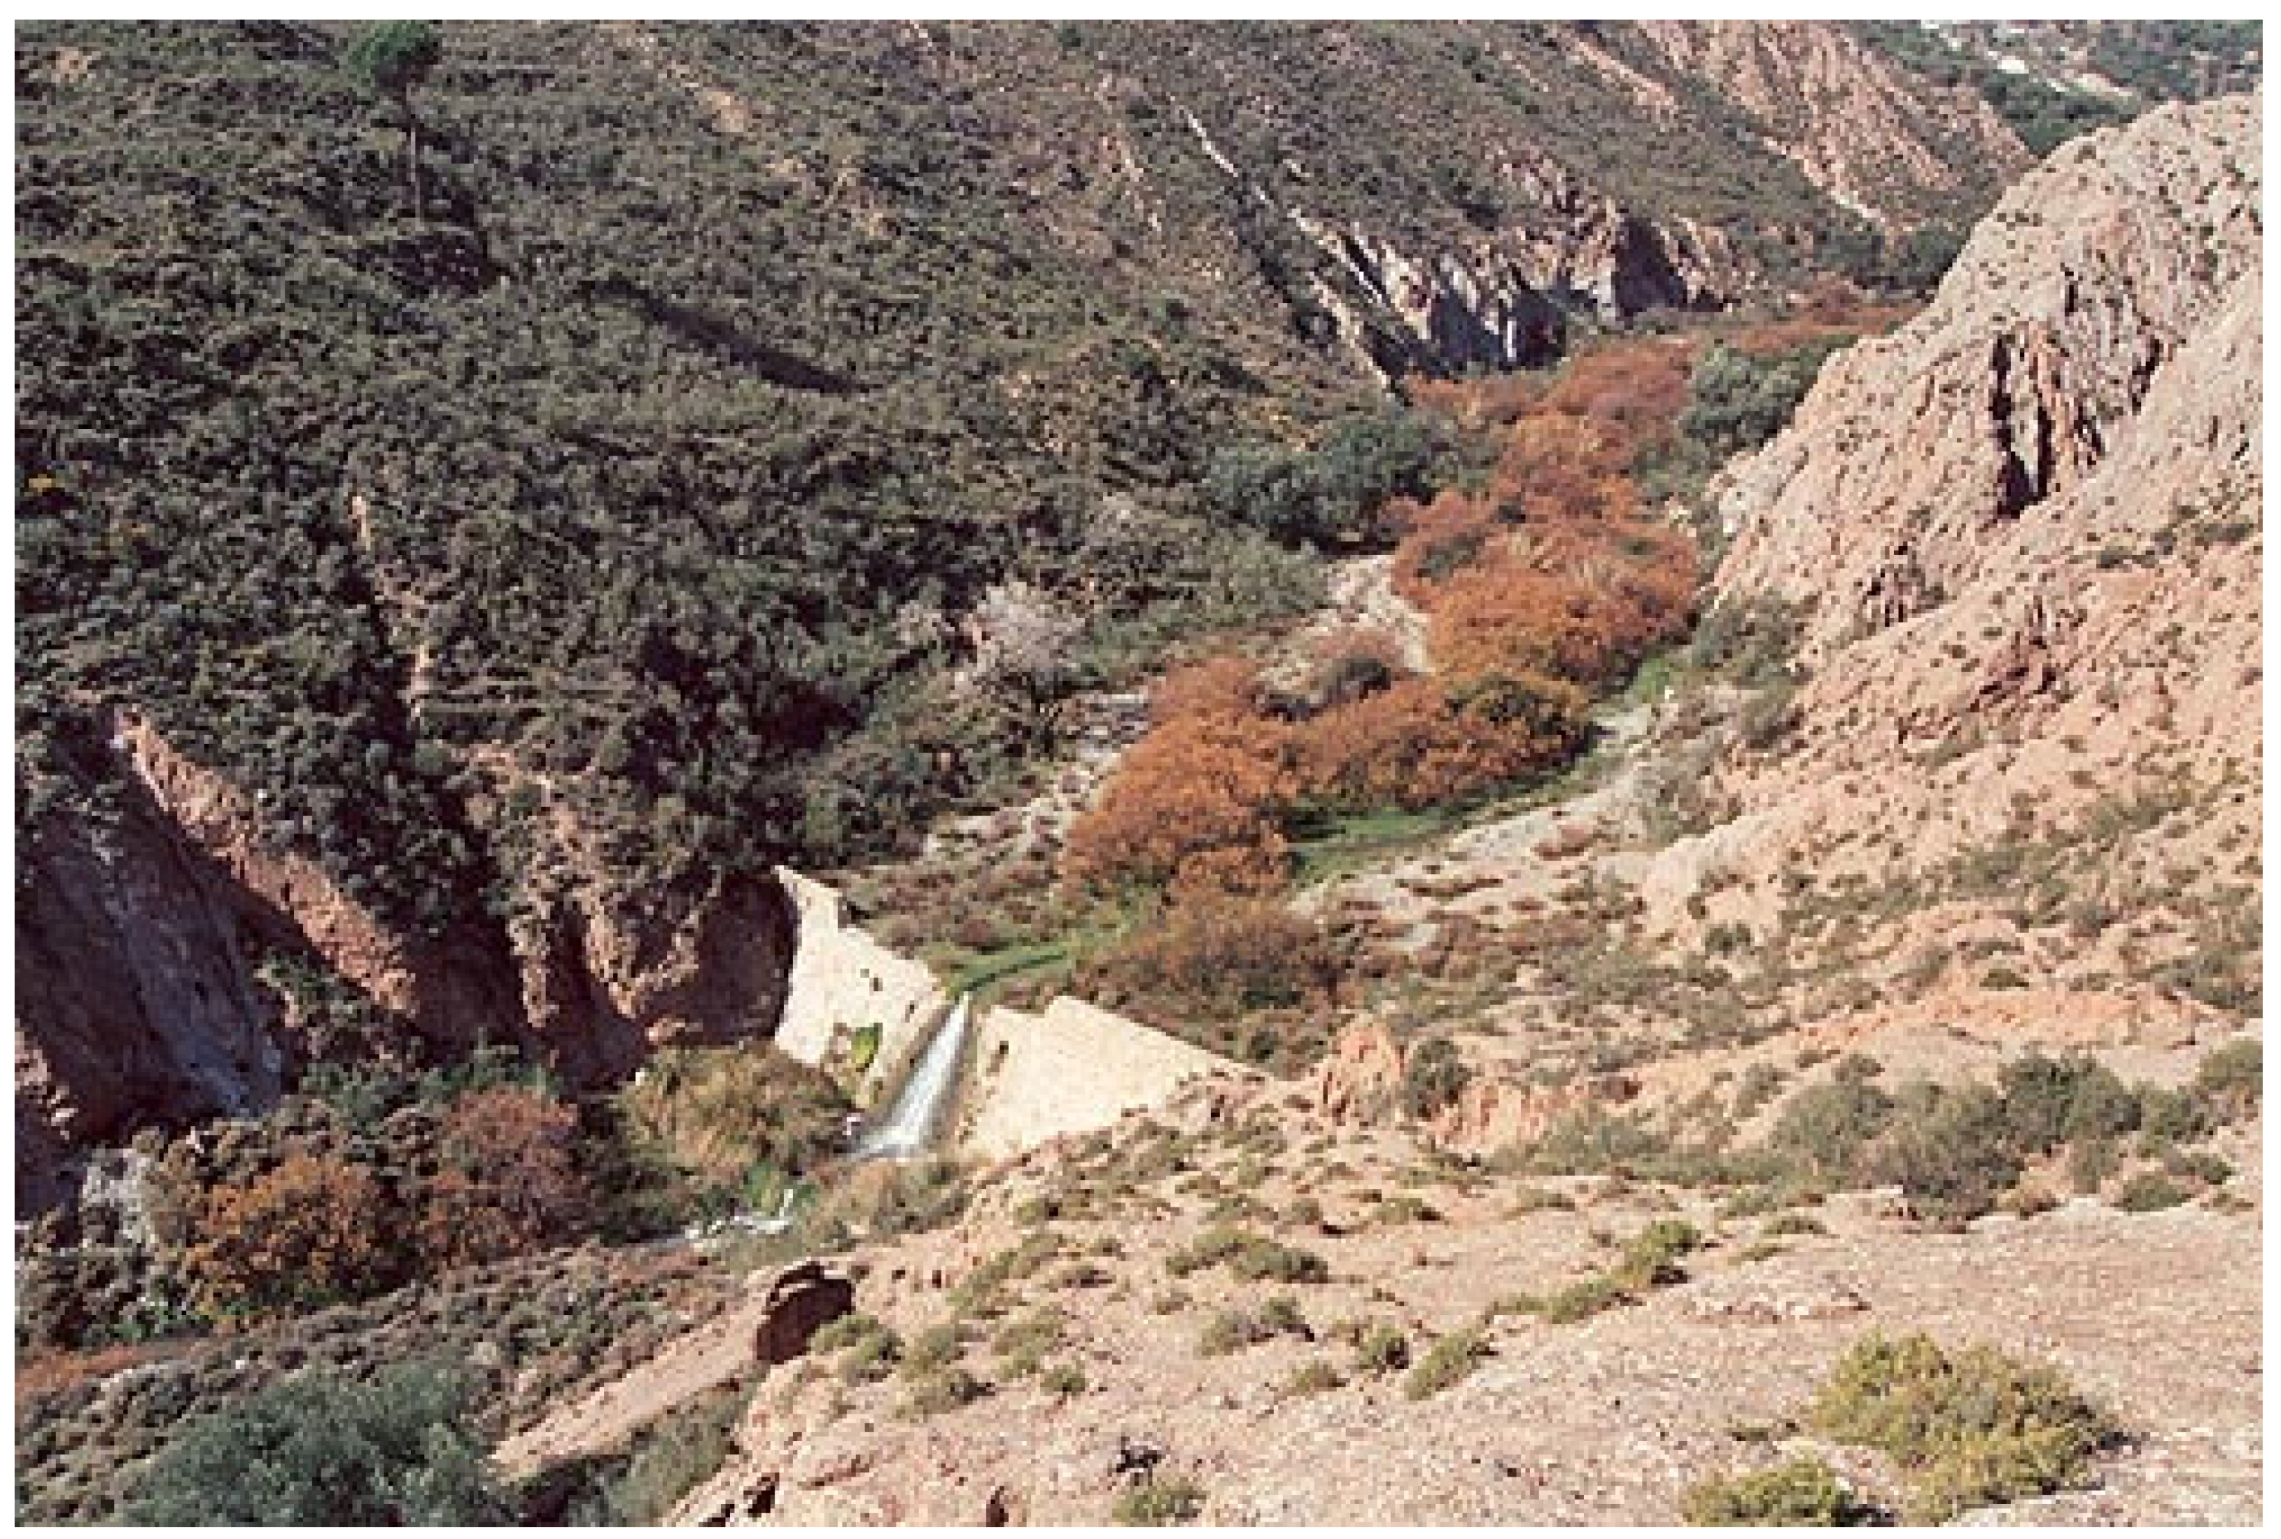
Figure 2.
Retention dyke. Santa Cruz de la Zarza, Toledo, Spain. Source: TRAGSA.
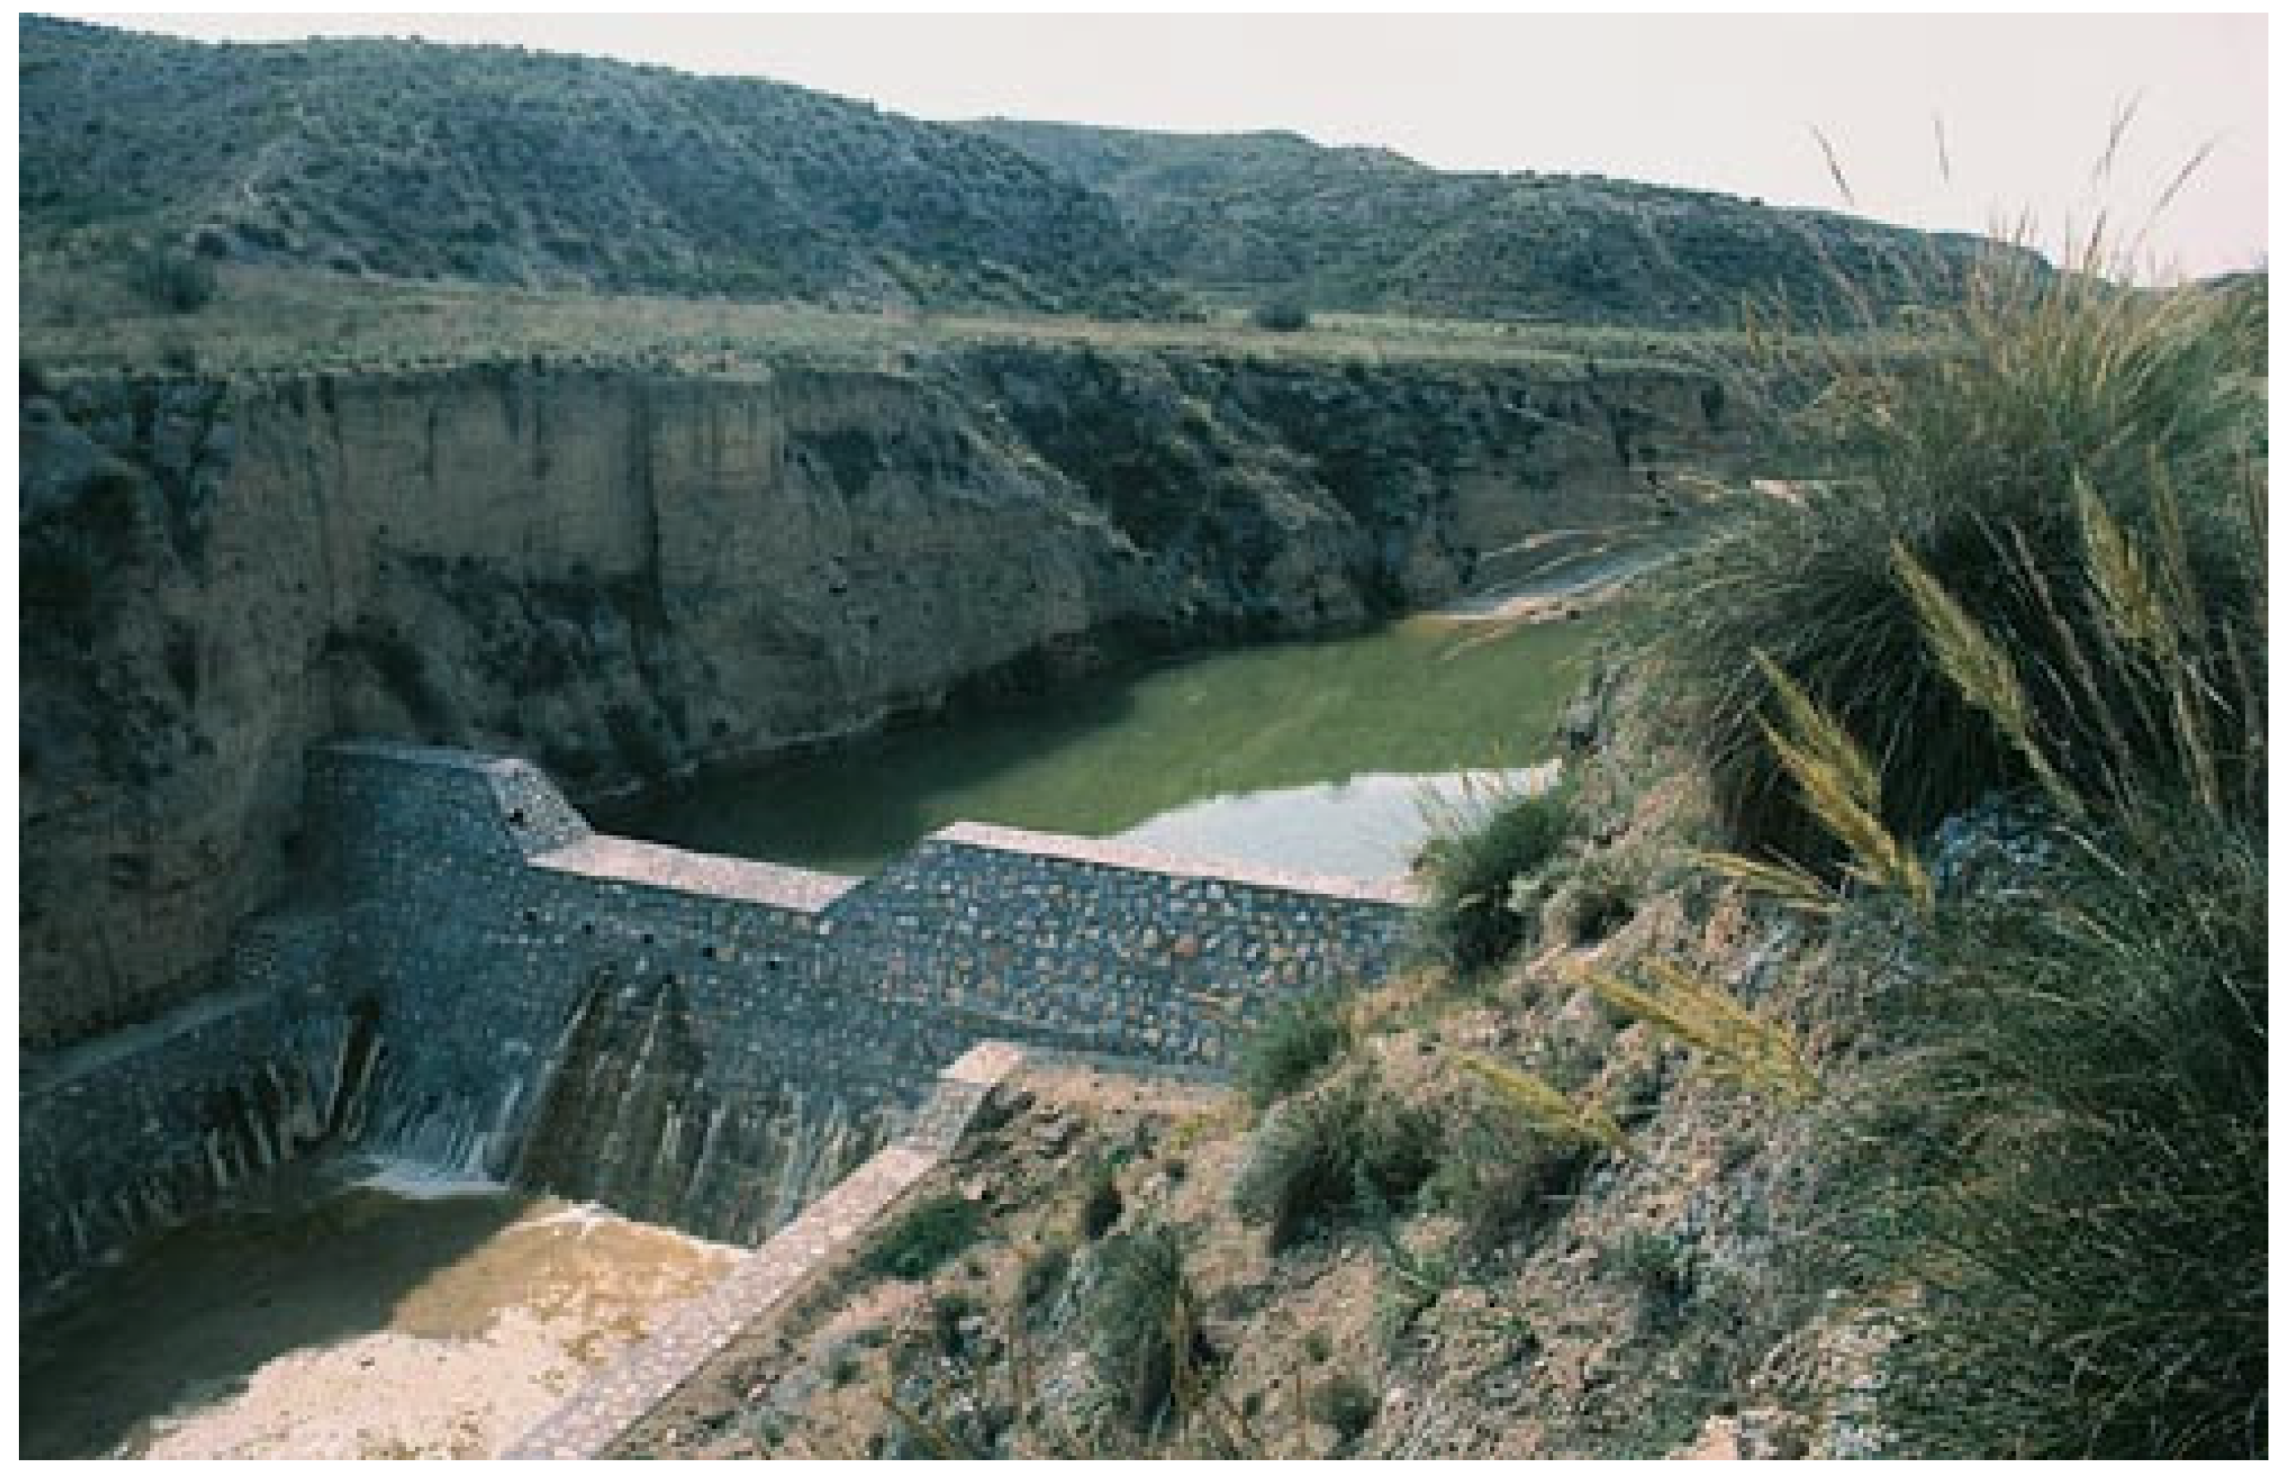
Figure 3.
Example for a slope calculation from the PNOA´s DTM [40], 1 m pixel size.
Figure 3.
Example for a slope calculation from the PNOA´s DTM [40], 1 m pixel size.
Figure 4.
Example of buffer zones for various transverse structures in an area.
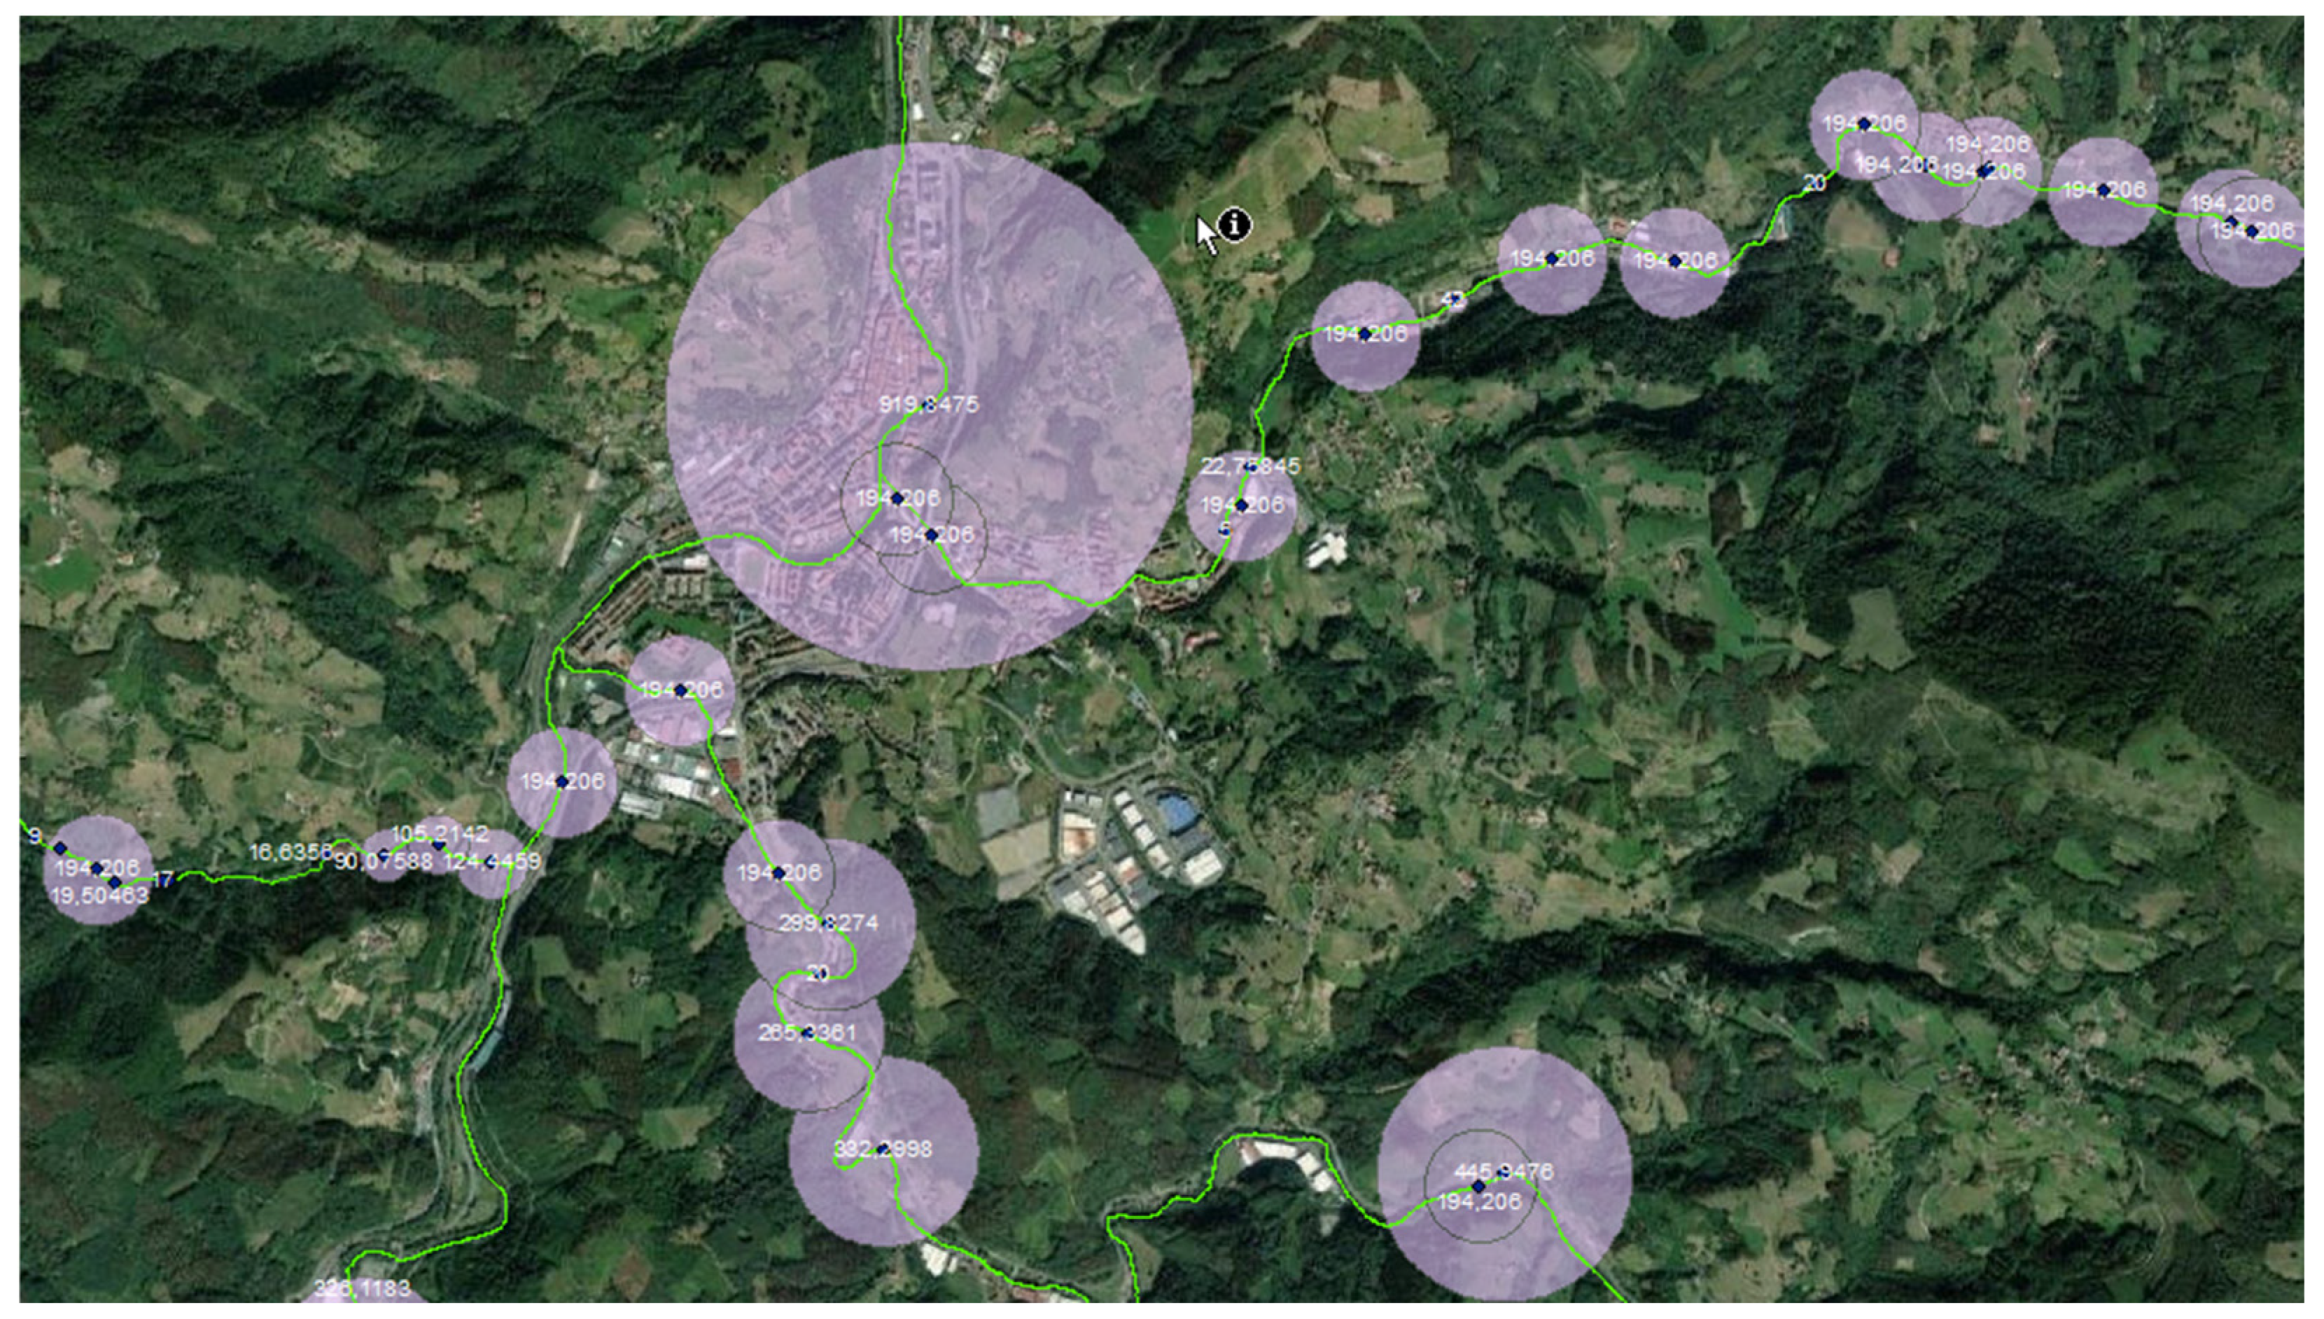
Figure 5.
Inventoried transverse structures in Spain from the publicly available shape file [11] (Table 1).
Figure 5.
Inventoried transverse structures in Spain from the publicly available shape file [11] (Table 1).
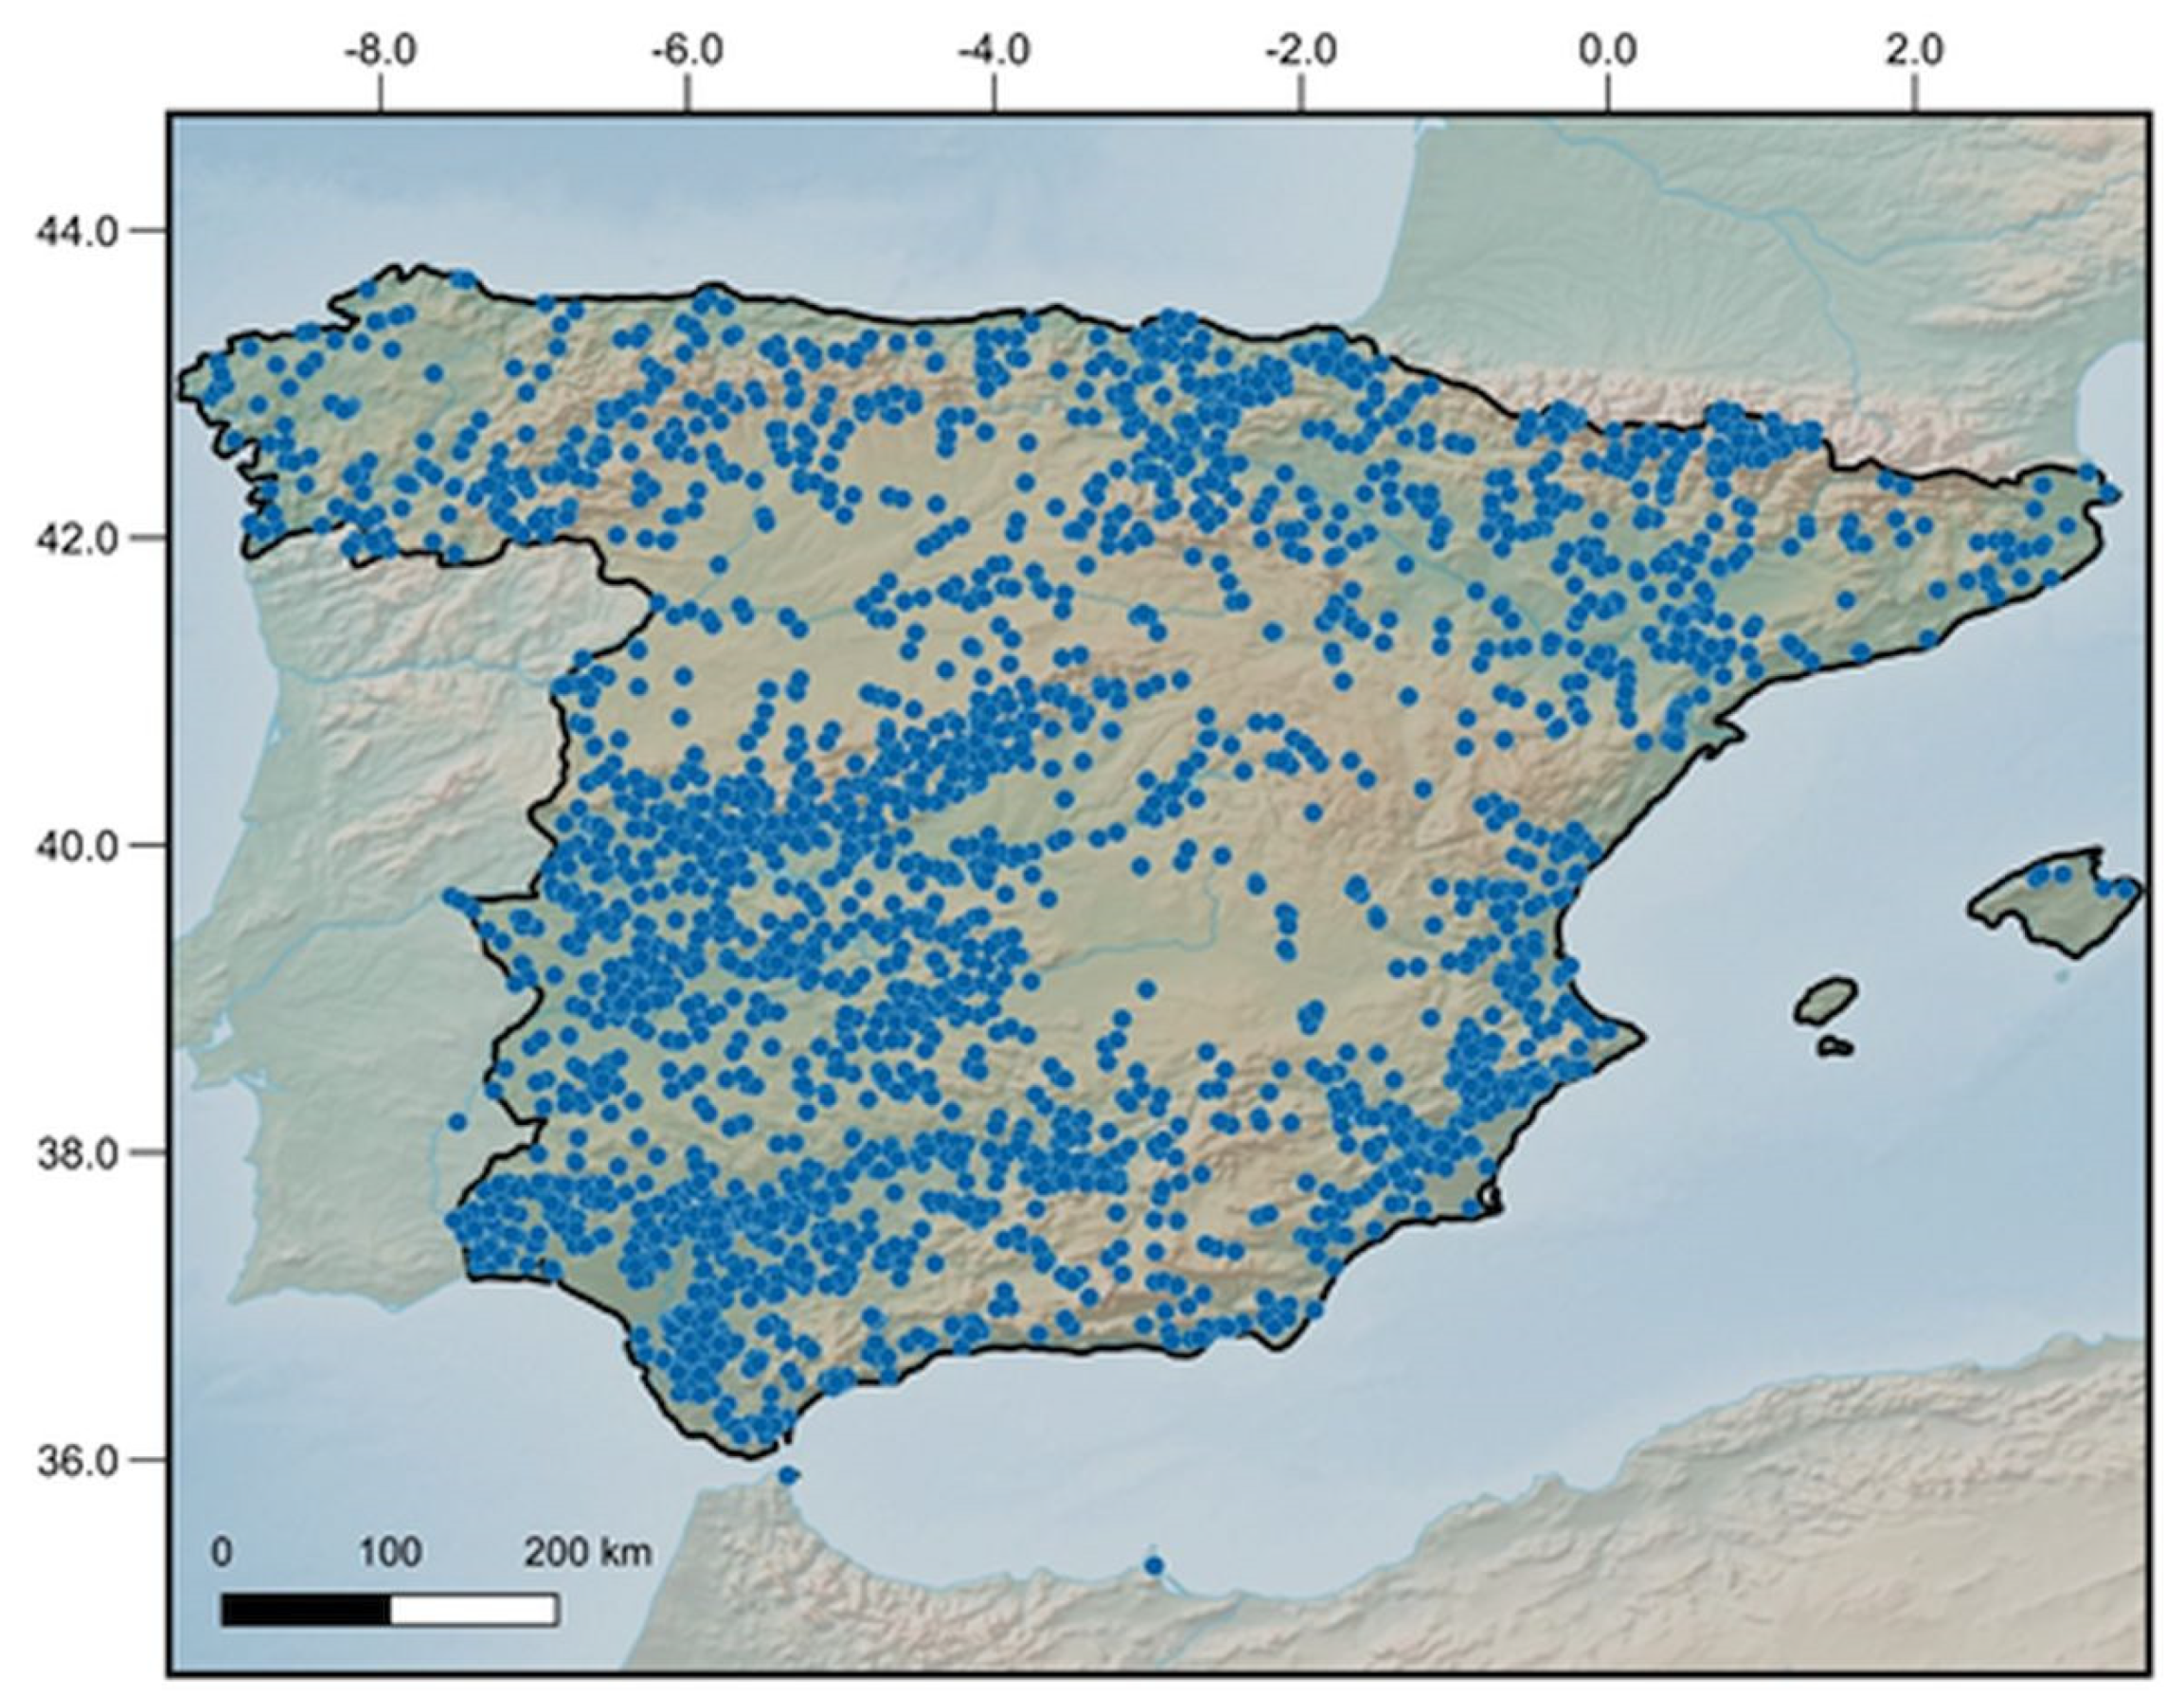
Figure 6.
Distribution of the type of transverse structure.
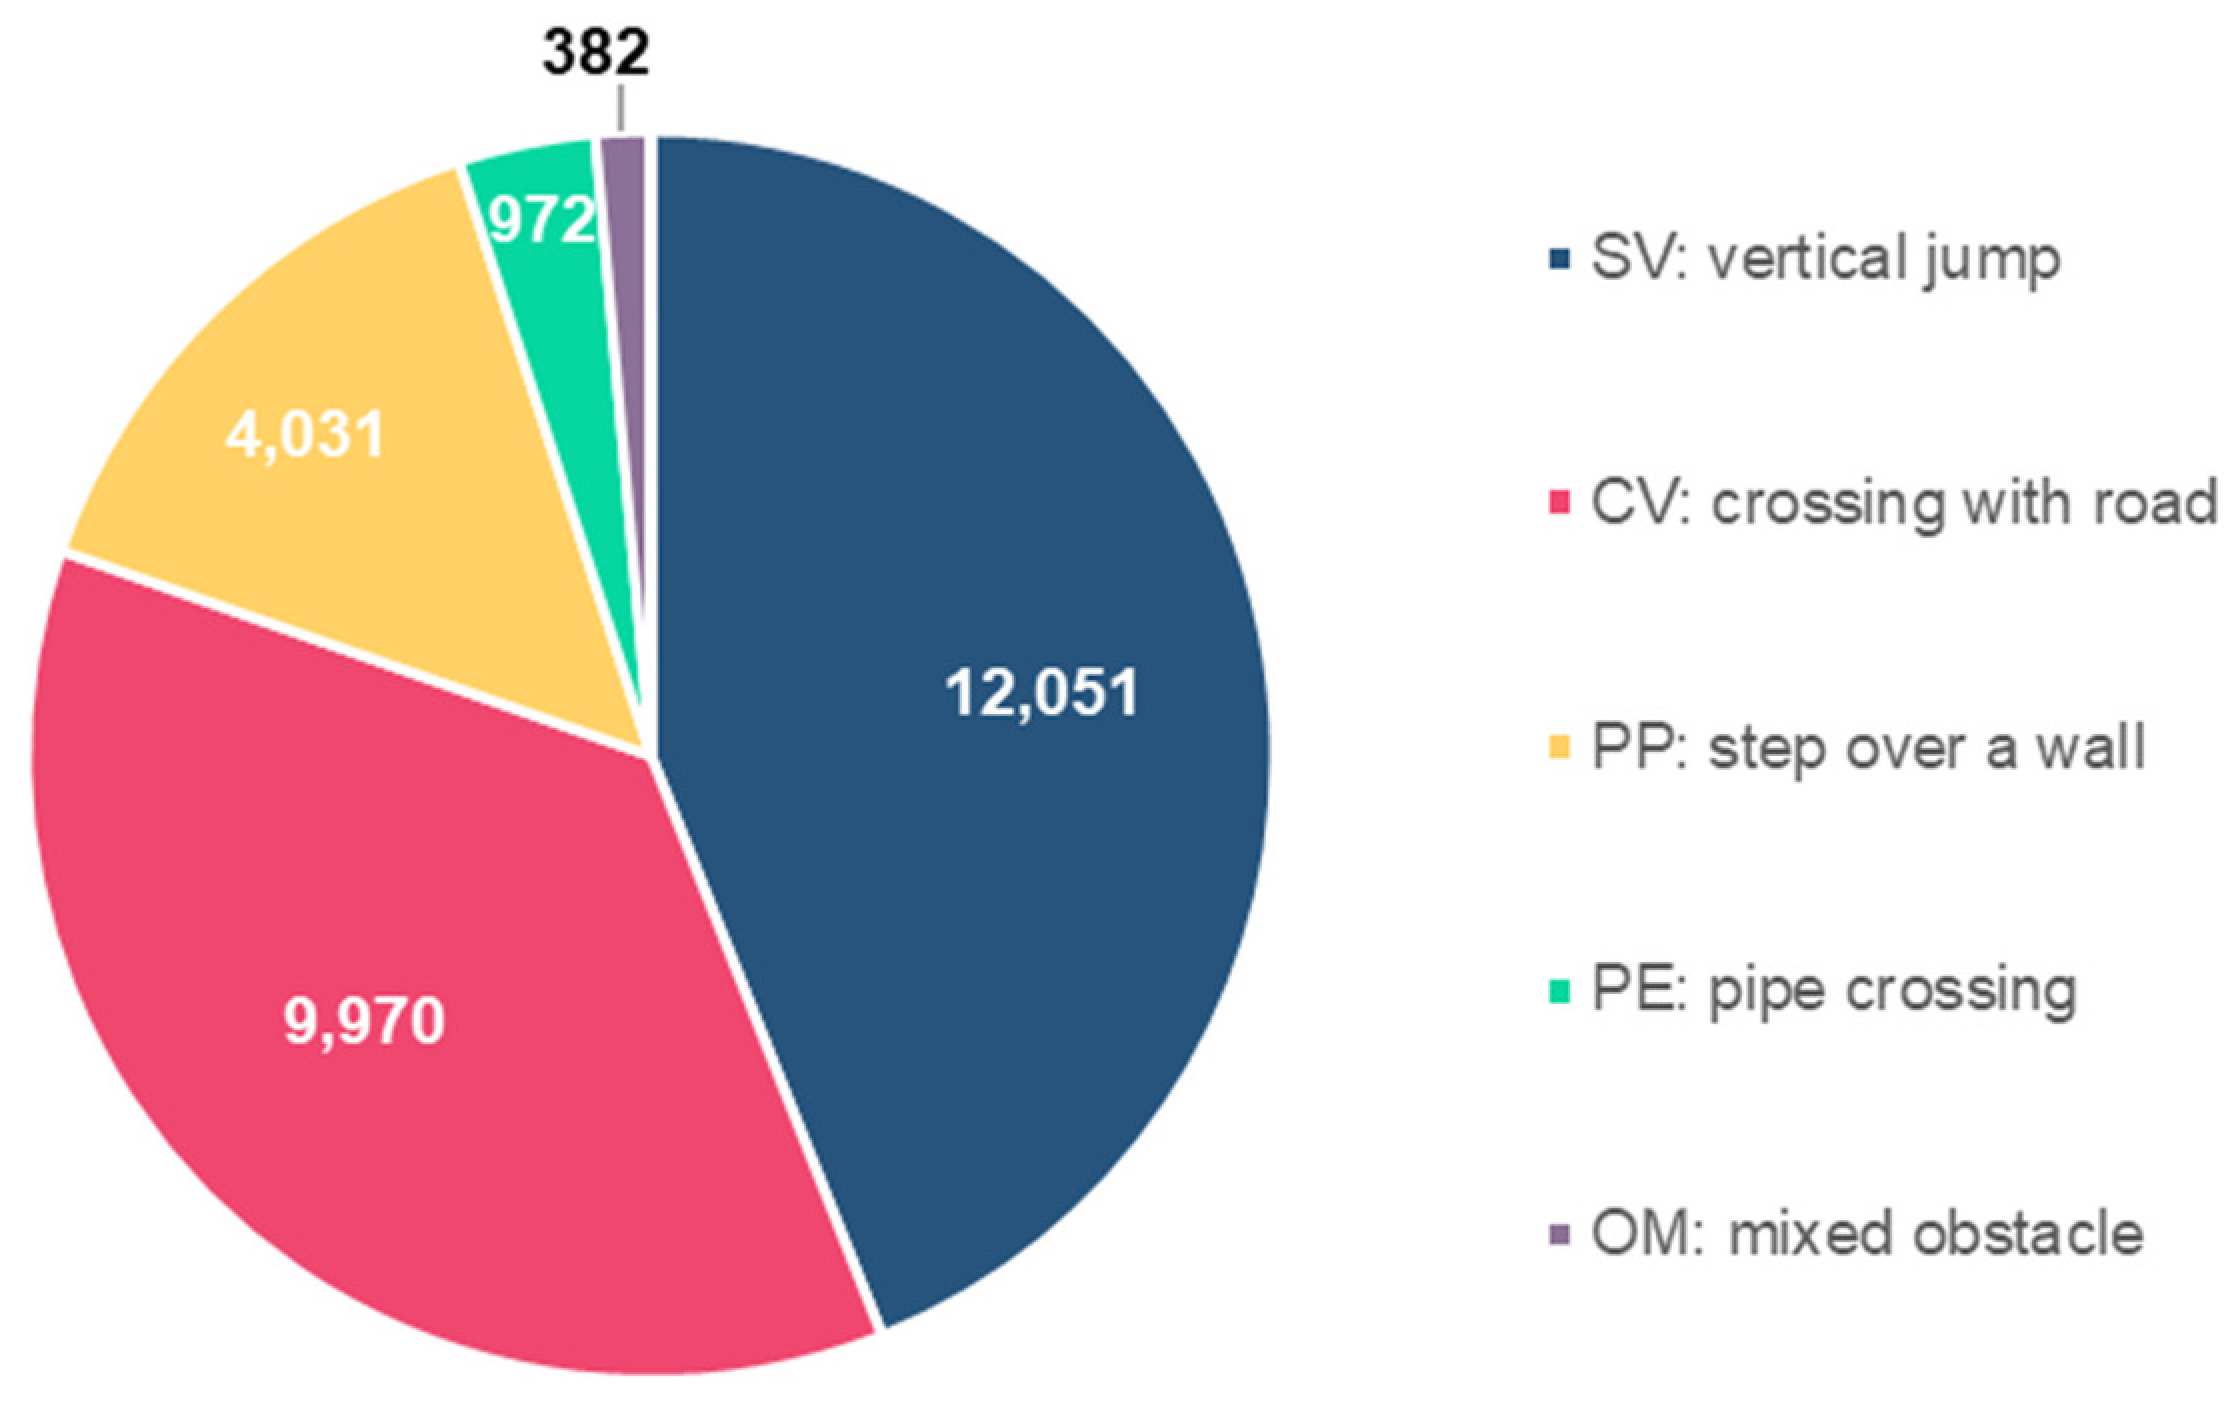
Figure 7.
Degree of certainty of the actual location and existence of each transverse structure.
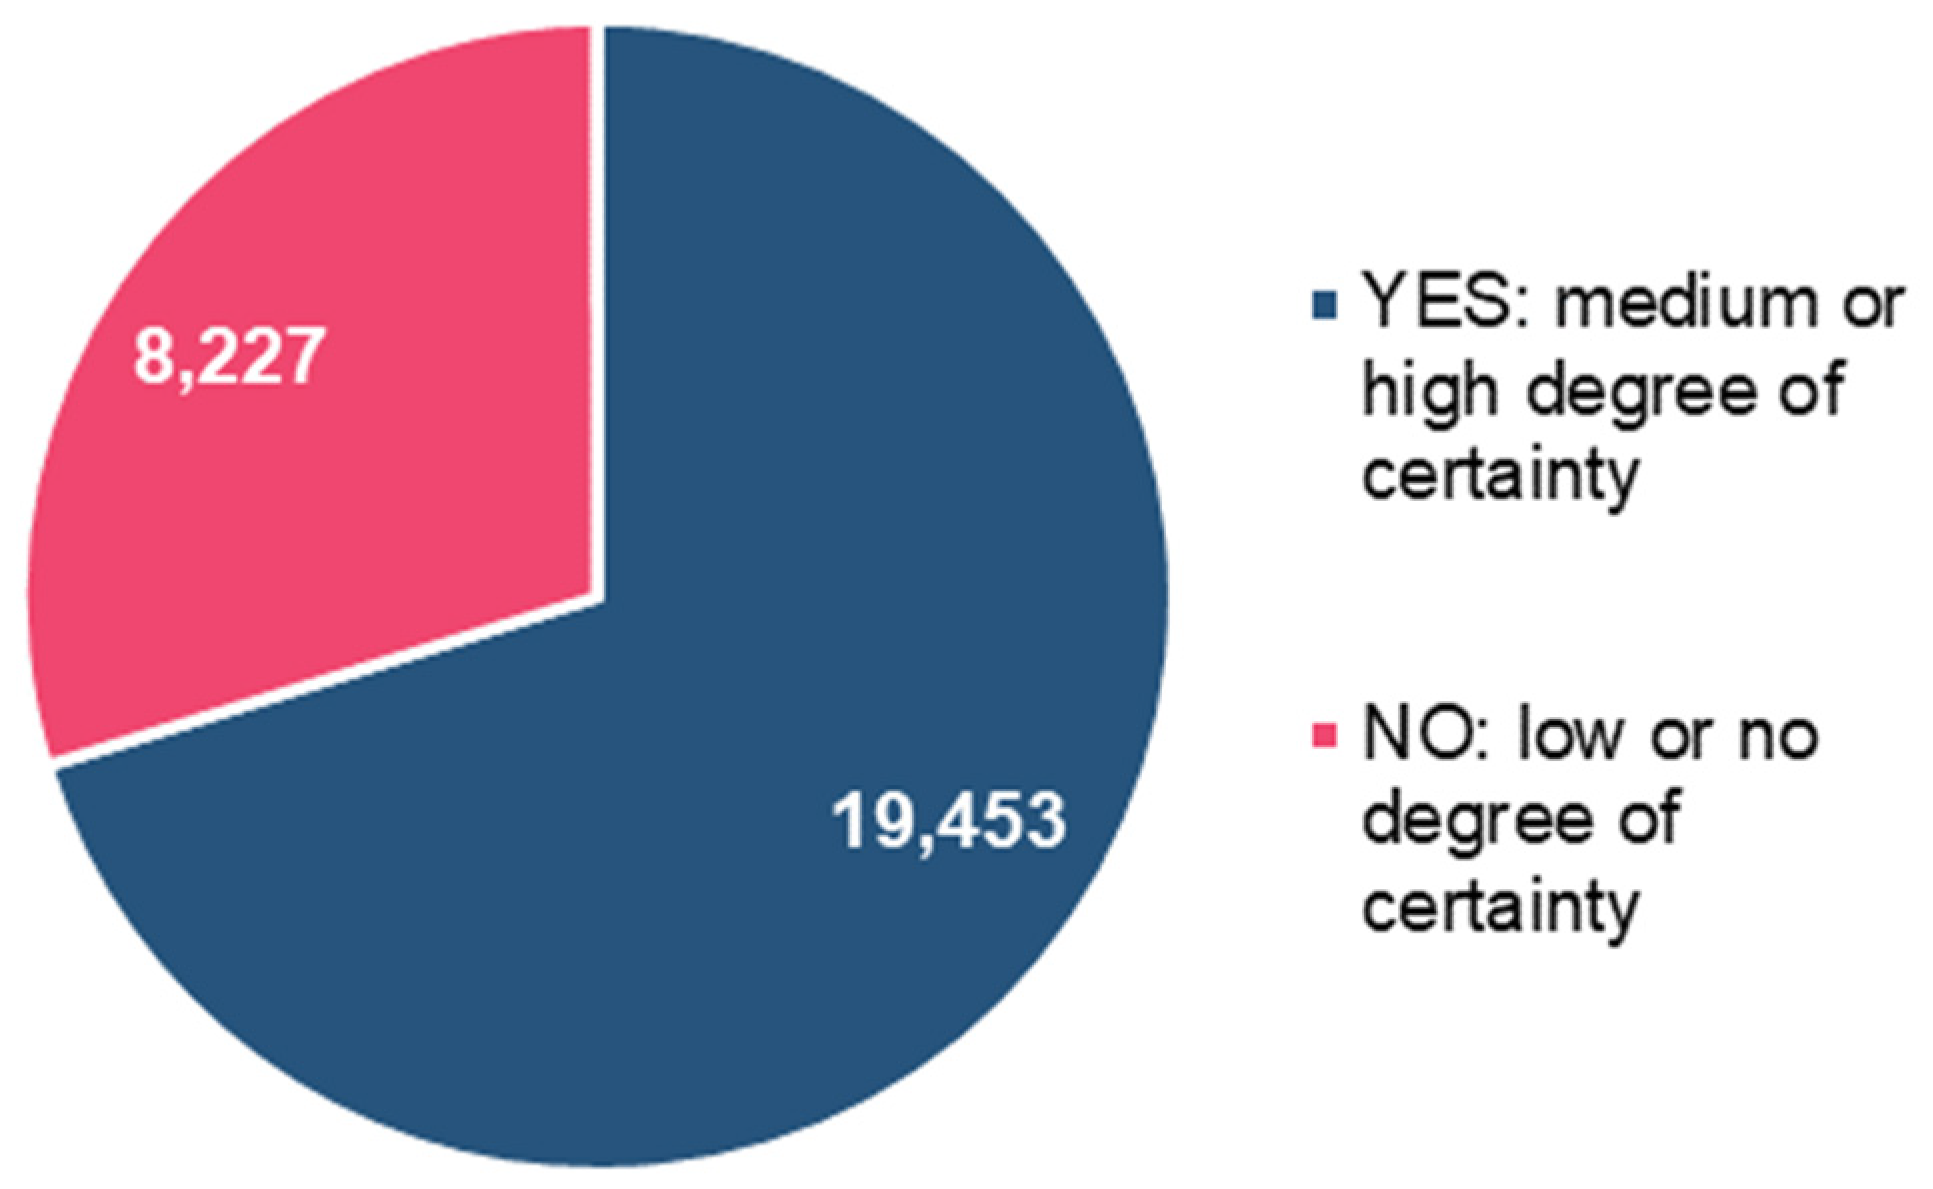
Figure 8.
Distribution of the transverse structures into major river basins.
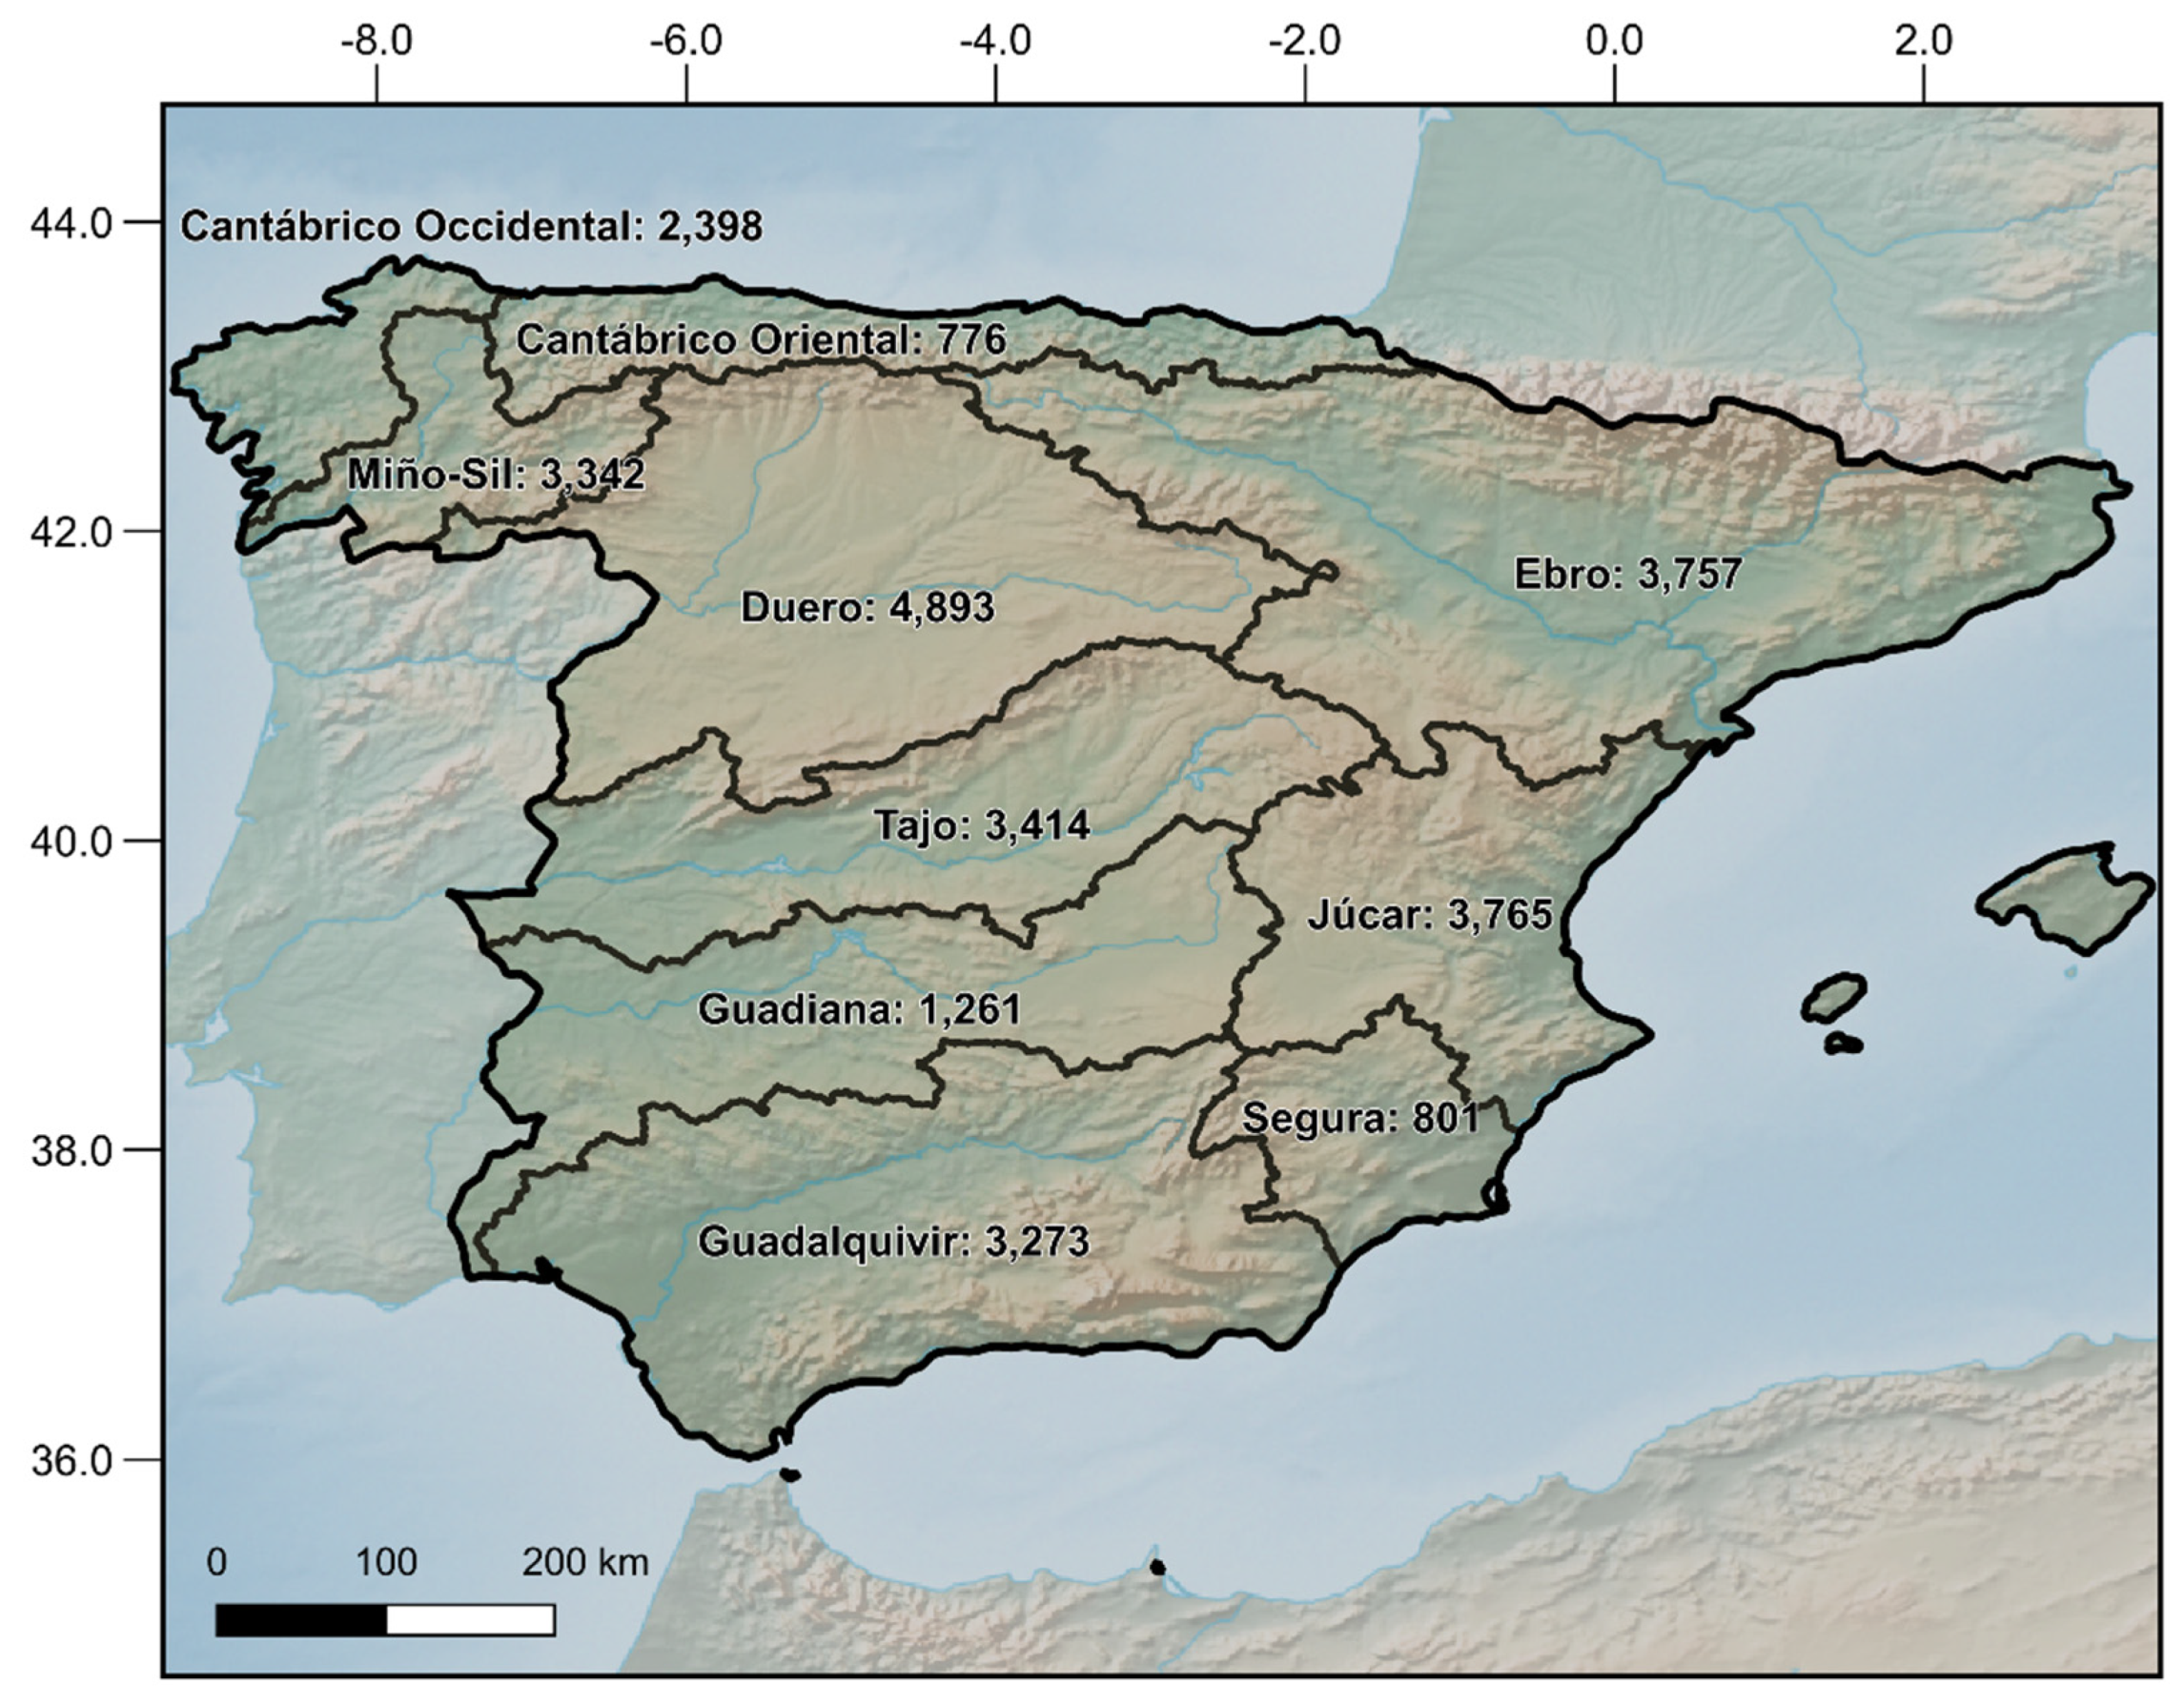
Figure 9.
Distribution of transverse structures with and without fish ladder of with a deviation.
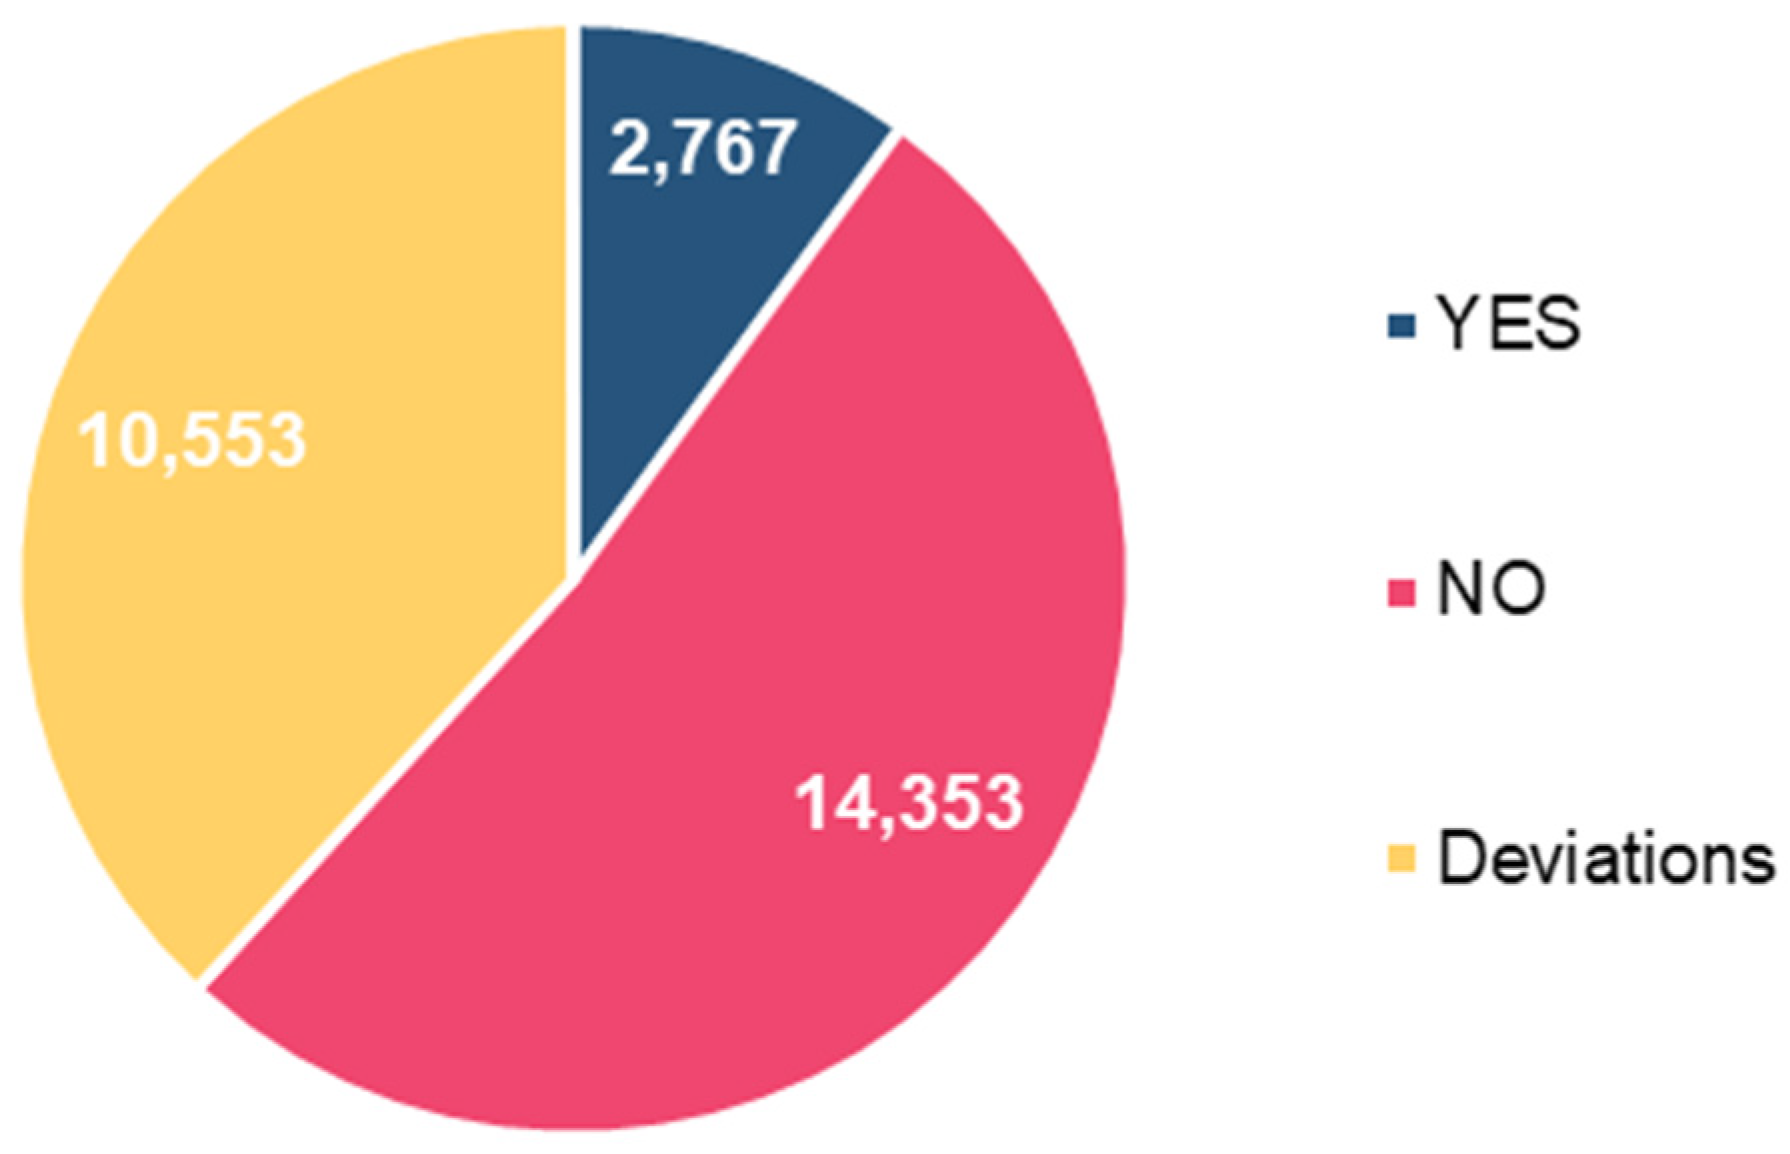
Figure 10.
Distribution of the main use of the structures.
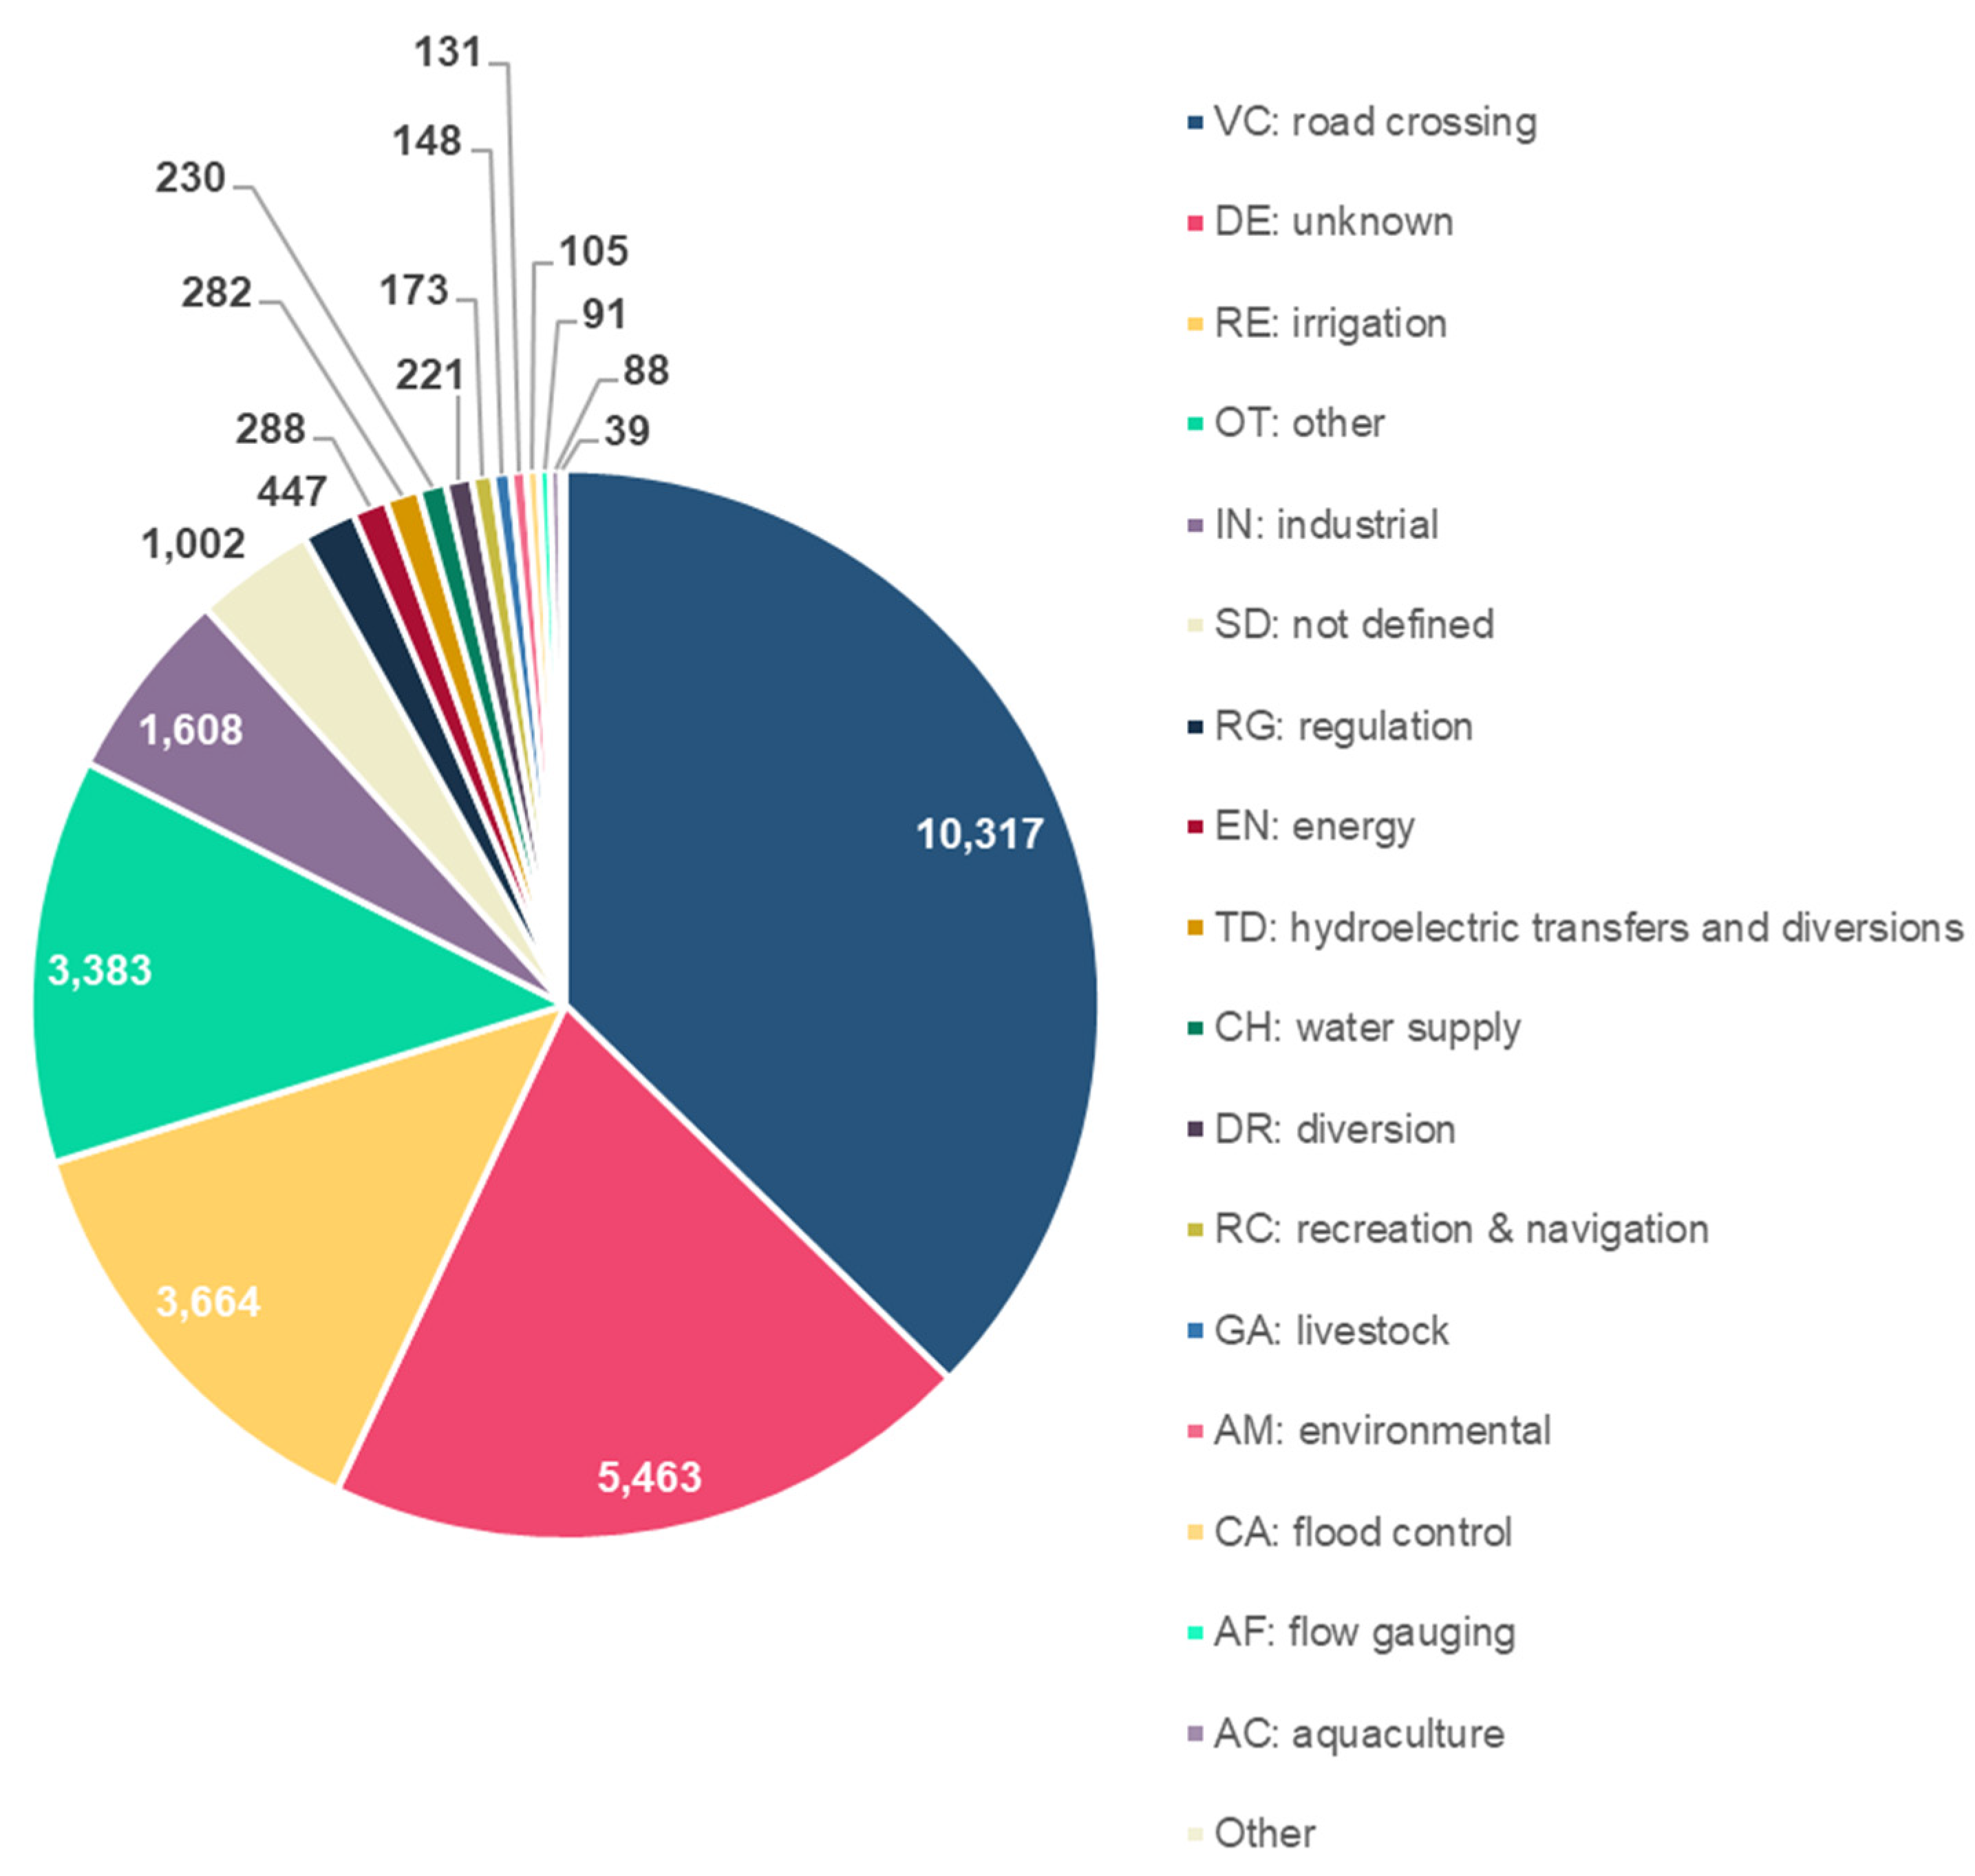
Figure 11.
Availability of construction data for transverse structures.
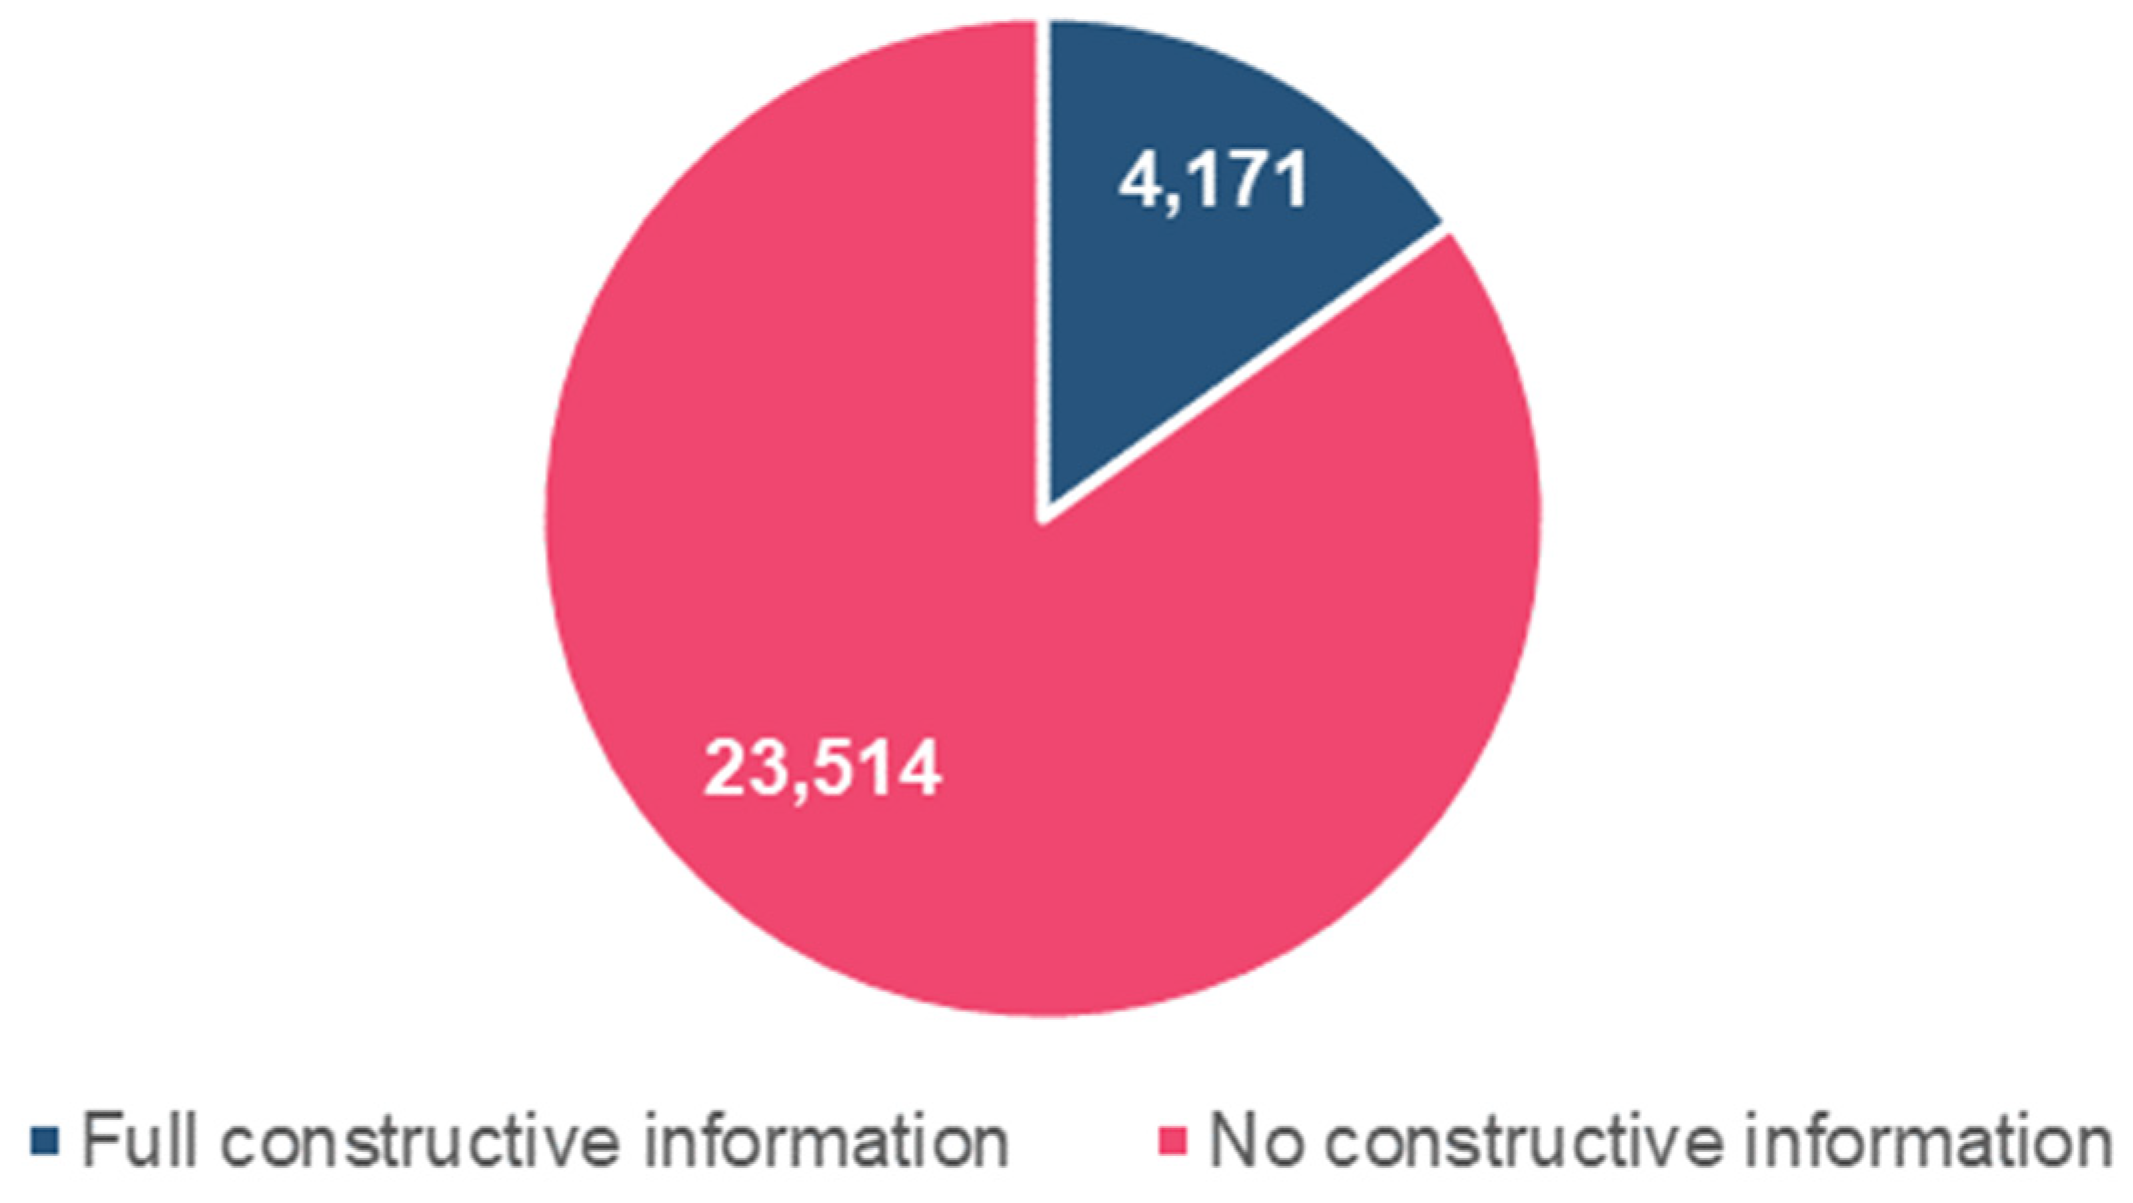

Table 1.
Link to the websites that present the results of the inventory of dykes, dams, and water obstacles in water courses. All websites were accessed on 13/06/2023.
Table 1.
Link to the websites that present the results of the inventory of dykes, dams, and water obstacles in water courses. All websites were accessed on 13/06/2023.
| Theme | Website |
| Dykes and dams | https://www.miteco.gob.es/es/cartografia-y-sig/ide/descargas/agua/inventario-presas-embalses.aspx |
| Transverse obstacles | https://www.miteco.es/app/descargas/descargafichero.aspx?f=iot.zip |
| Viewer with diverse thematic coverages | https://sig.mapama.gob.es/geoportal/index.html?services=60005&herramienta=ServiceTree&dir=Agua|Inventario%20de%20Presas%20y%20Embalses |
| MITERD's geoportal | https://sig.mapama.gob.es/geoportal/ |
Table 2.
Correlation between the permeability categories and the horizontal hydraulic conductivity (K). The last column shows the number of structures within each category.
Table 2.
Correlation between the permeability categories and the horizontal hydraulic conductivity (K). The last column shows the number of structures within each category.
| Category | K (m/day) | Number of structures in the category |
| Very low | 0.02 | 1,167 |
| Low | 0.07 | 11,666 |
| Medium | 1.02 | 3,113 |
| High | 4.5 | 7,265 |
| Very high | 6 | 4,469 |
Table 3.
Anisotropy coefficient and clogging correction factor (Ccf) for each categorised lithologies in which the structures have been built. Kh: horizontal hydraulic conductivity; and Kv: vertical hydraulic conductivity.
Table 3.
Anisotropy coefficient and clogging correction factor (Ccf) for each categorised lithologies in which the structures have been built. Kh: horizontal hydraulic conductivity; and Kv: vertical hydraulic conductivity.
| Lithology | Number of transverse structures | Anisotropy coefficient (Kv/Kh) | Clogging correction factor (Ccf) |
| Granular | 3,004 | 0.1 | 0.75 |
| Karstic | 2,134 | 1 | 0.80 |
| Alluvial | 16,139 | 0.01 | 0.65 |
| Metamorphic | 4,014 | 0.0001 | 0.30 |
| Volcanic | 23 | 0.01 | 0.50 |
| Evaporitic | 25 | 0.5 | 0.60 |
| Intrusive | 2,341 | 0.01 | 0.6 |
Table 4.
Attributes describing general information about the transverse structures' public database [11].
Table 4.
Attributes describing general information about the transverse structures' public database [11].
| Code | Description |
| CODMAS | Code of the involved Surface Water Body. |
| COD_COD | Hydro-morphological section code. |
| codMuni | Postal code of the municipality where the obstacle is located. |
| OBST | Transverse obstacle. |
| NN | Order number of the obstacle, according to its position in the Surface Water Body, from upstream to downstream. |
| COORD_X AND COORD_Y | Transverse structure's X and Y coordinates (ETRS89). |
Table 5.
Code and description of the design and construction information in the "EFECTO BARRERA" table.
Table 5.
Code and description of the design and construction information in the "EFECTO BARRERA" table.
| Code | Description |
|---|---|
| H_TOTAL | Total height of the construction site, from crest to foundation. |
| H_SALTO | Height of the fall from the sheet of water to its crest. It may coincide with the total height of the obstacle, depending on the flow conditions. |
| PROF_POZA | Depth of the rising pool at the foot of the obstacle. |
| LONG_COR | Length of the infrastructure at the crest. |
| ANCHO_COR | Width of infrastructure at the crest. |
| H_AGUA_COR | Water depth on the crest. |
| V_ AGUA | Water velocity at the crest, inside pipe or canal, depending on obstacle. |
| H_ AGUA_TUB | Water draught in passage pipe. |
| PENDIENTE | The slope of the facing (%). |
| H_ AGUA _PAR | Water draught on facing. |
| DIST_COR | Distance from the foot of the construction site to the crown of the crest. |
| LONG_REM | Length of backwater created by the structure. |
| ANCH_REM | Width of the backwater created by the structure. |
| PROF_REM | Depth of backwater created by structure. |
| ANCHO_PREM | Average width of the channel before the backwater created by the structure. |
| PROF_PREM | Mean channel draught before the backwater created by the structure. |
Disclaimer/Publisher’s Note: The statements, opinions and data contained in all publications are solely those of the individual author(s) and contributor(s) and not of MDPI and/or the editor(s). MDPI and/or the editor(s) disclaim responsibility for any injury to people or property resulting from any ideas, methods, instructions or products referred to in the content. |
© 2023 by the authors. Licensee MDPI, Basel, Switzerland. This article is an open access article distributed under the terms and conditions of the Creative Commons Attribution (CC BY) license (http://creativecommons.org/licenses/by/4.0/).
Copyright: This open access article is published under a Creative Commons CC BY 4.0 license, which permit the free download, distribution, and reuse, provided that the author and preprint are cited in any reuse.


