
Submitted:
26 June 2023
Posted:
27 June 2023
You are already at the latest version
Abstract
Given the significant role of the Ningxia Urban Agglomeration along the Yellow River in reshaping the urban network and promoting coordinated development in the upper Yellow River region of China, this paper takes enterprise flow as the explicit manifestation of the regional urban network. Based on the data of registered enterprises from 2005 to 2021, combined with the interlocking network model, social network analysis method, and spatial panel econometric model, this paper interprets the evolution of the regional urban network structure and its influencing mechanisms through the different types of enterprise flow. The results indicate the following: (1) The external network is primarily focused on outflow investments towards North China, East China, and Northwest China. The overall inflow sources form a multi-origin structure dominated by North China and East China. The Jinfeng and Xingqing serve as core hubs for enterprise exports in the external network and destinations for incoming enterprises. However, in the Productive manufacturing connections, a spatial organizational pattern driven by multiple cities has formed. (2) In the internal network, a concentric connection structure centered around the Jinfeng and Xingqing has formed. The Productive service connections are relatively active, while the Productive manufacturing connections are relatively concentrated between the Jinfeng, Xingqing, Ningdong, and Lingwu. However, there is an imbalance in the spatial connections within the urban agglomeration network and an incomplete hierarchical system of network nodes. (3) In the external network, the main feature is the absorption of external elements to foster development momentum. In the internal network, the Jinfeng and Xingqing serve as contact and radiation sources, influencing various nodes. However, their driving capacity is weak. (4) The market demand and coordinated development both demonstrate significant promoting effects on the connections within the external and internal networks. The sluggish adjustment and transformation of regional industrial structure have resulted in a temporary negative inhibitory effect on the development of transformation. The negative impact of urban investment activities and the positive impact of government management are reflected within the internal network. (5) The improvement of urban management and service functions, as well as external borrowing, can promote the connection in different network. However, the borrowing economic activity can have a negative impact in different networks. (6) Industrial agglomeration can promote enterprises connections in different networks and generate significant spatial spillover effects.
Keywords:
enterprise flow
; urban network structure
; influencing mechanisms
; the Ningxia Urban Agglomeration along the Yellow River
1. Introduction
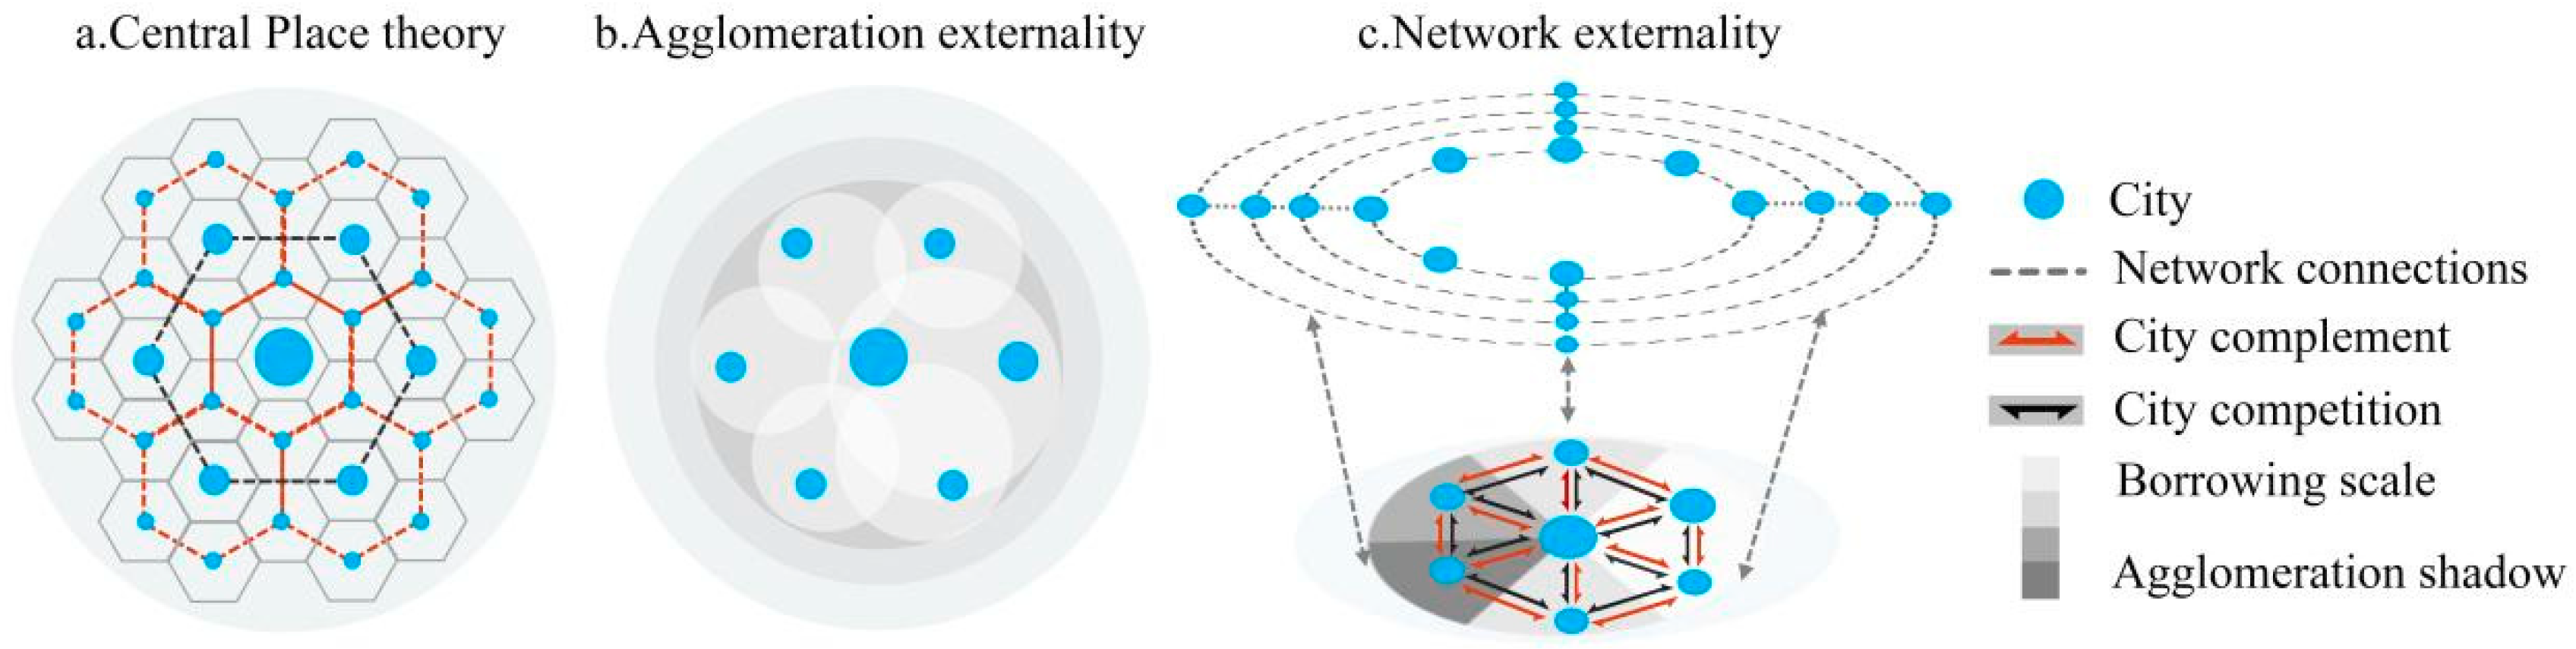
The emergence of central place theory has dominated the ideological framework of urban systems research for a long time. However, since the mid to late 20th century, with the accelerated flow of various factors, it has reshaped the global urban spatial pattern and challenged the logic paradigm of the original space. In this context, Alonso first proposed the concept of borrowing scale to elucidate the interaction of urban networks (Alonso W, 1973). Subsequently, Friedmann (Friedmann J, 1986) and Sassen (Sassen S, 1991) put forward hypotheses of world cities and global cities respectively, establishing the theoretical foundation for the study of urban networks. The theory of flow space proposed by Castells further extends the concept of flow from virtual space to geographical space (Castells M, 1996), marking a shift in the paradigm of urban research from hierarchical diffusion to multidimensional networks. From the central place theory and agglomeration externalities to network externalities, the research focus of urban network has also shifted from urban hierarchy and agglomeration effects to network externalities that transcend geographic boundaries (Lin Bingquan et al., 2018) (Figure 1). In geographical space, on the one hand, the flow space integrates cities of different hierarchies, which promotes symbiotic and interconnected development. On the other hand, bidirectional complementarity and competitive behaviors between cities are reshaping the inter-regional structure. The evolution of urban network structures is jointly dominated by spatiality and flow. This has inspired scholars to conduct urban network research from multiple perspectives, including enterprises, knowledge, innovation, transportation, and more (Cheng Yuhong and Su Xiaomin, 2021).
Figure 1.
The evolution from central place theory to network externality.
In the process of urban networking, enterprises break geographical barriers through market-oriented activities such as cross-city investments, joint ventures, and branch establishments, enriching the intercity interactions. The network constructed based on enterprise connections naturally becomes the explicit representation of urban networks, sparking a research trend in exploring the dynamic networks of cities through the multi-location organizational patterns of enterprises. Among them, the pioneering research is led by scholars such as Taylor, Derudder, and the GaWC group, who take APS enterprises as an example to translate enterprise connections into intercity connections (Taylor P J, 2001; Derudder B and Taylor P J, 2005; Derudder B et al., 2010; Taylor P J et al., 2014). They utilize the Interlocking network model (INM) to analyze the formation, flow, and spatial characteristics of urban networks, thereby promoting the evolution and development of the enterprise translation model. These two scholars also proposed the Central flow theory in their subsequent research (Derudder B and Taylor P J, 2018). The interaction between flow and spatiality is a key focus of research on enterprise flow, where one aspect involves analyzing the regional urban spatial structure (Hall P and Pain K, 2006; Lüthi S et al., 2010; Li T et al., 2018) and agglomeration effects (Bentlage M and Thierstein A, 2011) based on the analysis of enterprise flow connections. On the other hand, it explores how "flow" connects regional or global cities into a unified whole (Hoyler M, 2011; Krätke S, 2014; Das S P, 2023), and the role of cities in the flow networks (Sigler T et al., 2021). Inspired by the research of the GaWC group, scholars continue to conduct urban network studies based on advanced producer services, and explore urban networks at different spatial scales, such as investigating the relationship between global-scale transnational corporate production networks and urban networks (Fuller C and Phelps N A, 2018), the spatial and non-spatial factors influencing the formation of global city-regions (Martinus K and Sigler T J, 2018), or the centrality characteristics of metropolitan flow at the urban scale (Waiengnier M et al., 2020). On the other hand, they expand their research to examine the internal dynamics of cities under different industry connections (Scholvin S et al., 2019) or the process of integration into the global urban network (Indraprahasta G S and Derudder B, 2019). Simultaneously, they deepening the quantitative methods and foundational theory research on enterprise flow, such as complementing the INM model’s response at various spatial scales (Lüthi S et al., 2018) and exploring patterns of geographical centrality under enterprise flow (Ozuduru B H et al., 2021).
In addition, Chinese scholars have primarily focused their research on all-industry enterprises and productive service industries. Their research has been focused on a national scale (Wu Kang et al., 2015) or specific regions such as the Guangdong-Hong Kong-Macao Greater Bay Area (Zhang X, 2018; Xiong Yao and Huang Li, 2019; Qiu Yanqing et al., 2021), the Yangtze River Basin (Ye Lei and Duan Xuejun, 2016; Wang Yanru and Gu Renxu, 2019; Zhang Xueliang et al., 2021), and the Northeastern China (Ma Liya et al., 2019; Wang Li et al., 2021). They mainly utilize the INM to translate enterprise service values into urban connectivity matrices or quantify ownership structures as relational matrices. They utilize methods such as social network analysis, multiple regression analysis, and spatial econometric models to analyze the mechanisms of urban network evolution. The research filed has also expanded from focusing on the changes in the internal network to the evolution of the external-internal network (Chong Z and Pan S, 2020). It has shifted from studying flow to examining the interaction between flow and spatiality (Wu K and Yao C, 2021). Furthermore, the research focus has shifted from studying regional networks to analyzing the integration process of networks at different scales (Pan F et al., 2018a). Additionally, aspects such as corporate collaboration networks (Zhang X et al., 2018), service recipients (Pan F et al., 2018b), equity investments (Gao Peng et al., 2021), transaction activities (Hu Guojian et al., 2021), and more into the research scope, thereby deepening the exploration of urban network externalities under the enterprise flows. However, due to limitations in data availability and the distribution of large enterprises, previous studies have focused primarily on developed or relatively developed regions in the central and eastern regions of China, while the western regions have been relatively neglected. Additionally, a sole consideration of the number of enterprises, total branches, or investment relationships can easily overlook certain partial chains among enterprises. Furthermore, most research has tended to focus on the evolution of internal networks under the enterprise flows, while the study of the flow dynamics between internal and external networks has been relatively insufficient.
The Yellow River Basin is an important region for ecological protection in China. Since the proposal of the strategy for ecological protection and high-quality development, it has become a focal area for geographers. In terms of urban studies in the Yellow River Basin, scholars primarily focus on the Production-Living-Ecological Space of the basin (Yin Dengyu et al., 2023), the spatial structure of urban agglomerations (Chen Xiaofei et al., 2021), network connectivity characteristics (Zhao Jinli et al., 2022), the coupled relationship between ecological protection and development (Liu Linke et al., 2021), and other related topics. However, there are significant differences in economic connections in this region, and it exhibits a spatial differentiation pattern of "Downstream region > Midstream region > Upstream region" (Wang Ruili et al., 2021). The upstream region have looser connections and stronger administrative divisions (Chen Xiaoning et al., 2021). Research on the urban network connections in the Yellow River Basin primarily focuses on the entire basin scale or the downstream region and midstream region, with limited research specifically focused on upstream regions.
The Ningxia Urban Agglomeration along the Yellow River, as one of the urban agglomerations in the upstream region of Yellow River, plays an intermediary role in connecting the upstream region and midstream region due to its geographical location. In addition, this region holds a strategic position in China’s energy development, while it also bears the important responsibilities of ecological civilization development, manufacturing industry strategic position, and the construction of a leading area for ecological protection and high-quality development in the Yellow River Basin. In the era of high-quality development, China will promote new urbanization with 19 urban agglomerations as the fulcrum. The trend of urban connection networks at multiple scales is increasingly prominent, with cross-regional spatial integration of various production factors and the coordinated development of cities taking the lead (Lu Jun and Mao Wenfeng, 2020; Tao M et al., 2020). As a relatively underdeveloped region in China, the upstream region of Yellow River plays a significant role in the high-quality development. The coordinated development among cities in the urban agglomerations and with external regions has important implications. Understanding the evolution of urban network structures and spatial influencing mechanisms of regional urban agglomerations under the factors flow can provide important guidance for enhancing urban connectivity, cooperation, and coordinated development. Therefore, this paper takes the Ningxia Urban Agglomeration along the Yellow River as the research object and uses enterprise flows as an example. Based on the branch-investment relationship, with the INM model to construct directed weighted matrices for the external and internal networks. By combining social network analysis method, this paper analyzes the structural characteristics of urban networks under different flow scenarios. Furthermore, it utilizes spatial panel econometric models to analyze the influence mechanisms of different factors on external and internal network connections.
2. Study Area, Data and Methods
2.1. Study Area
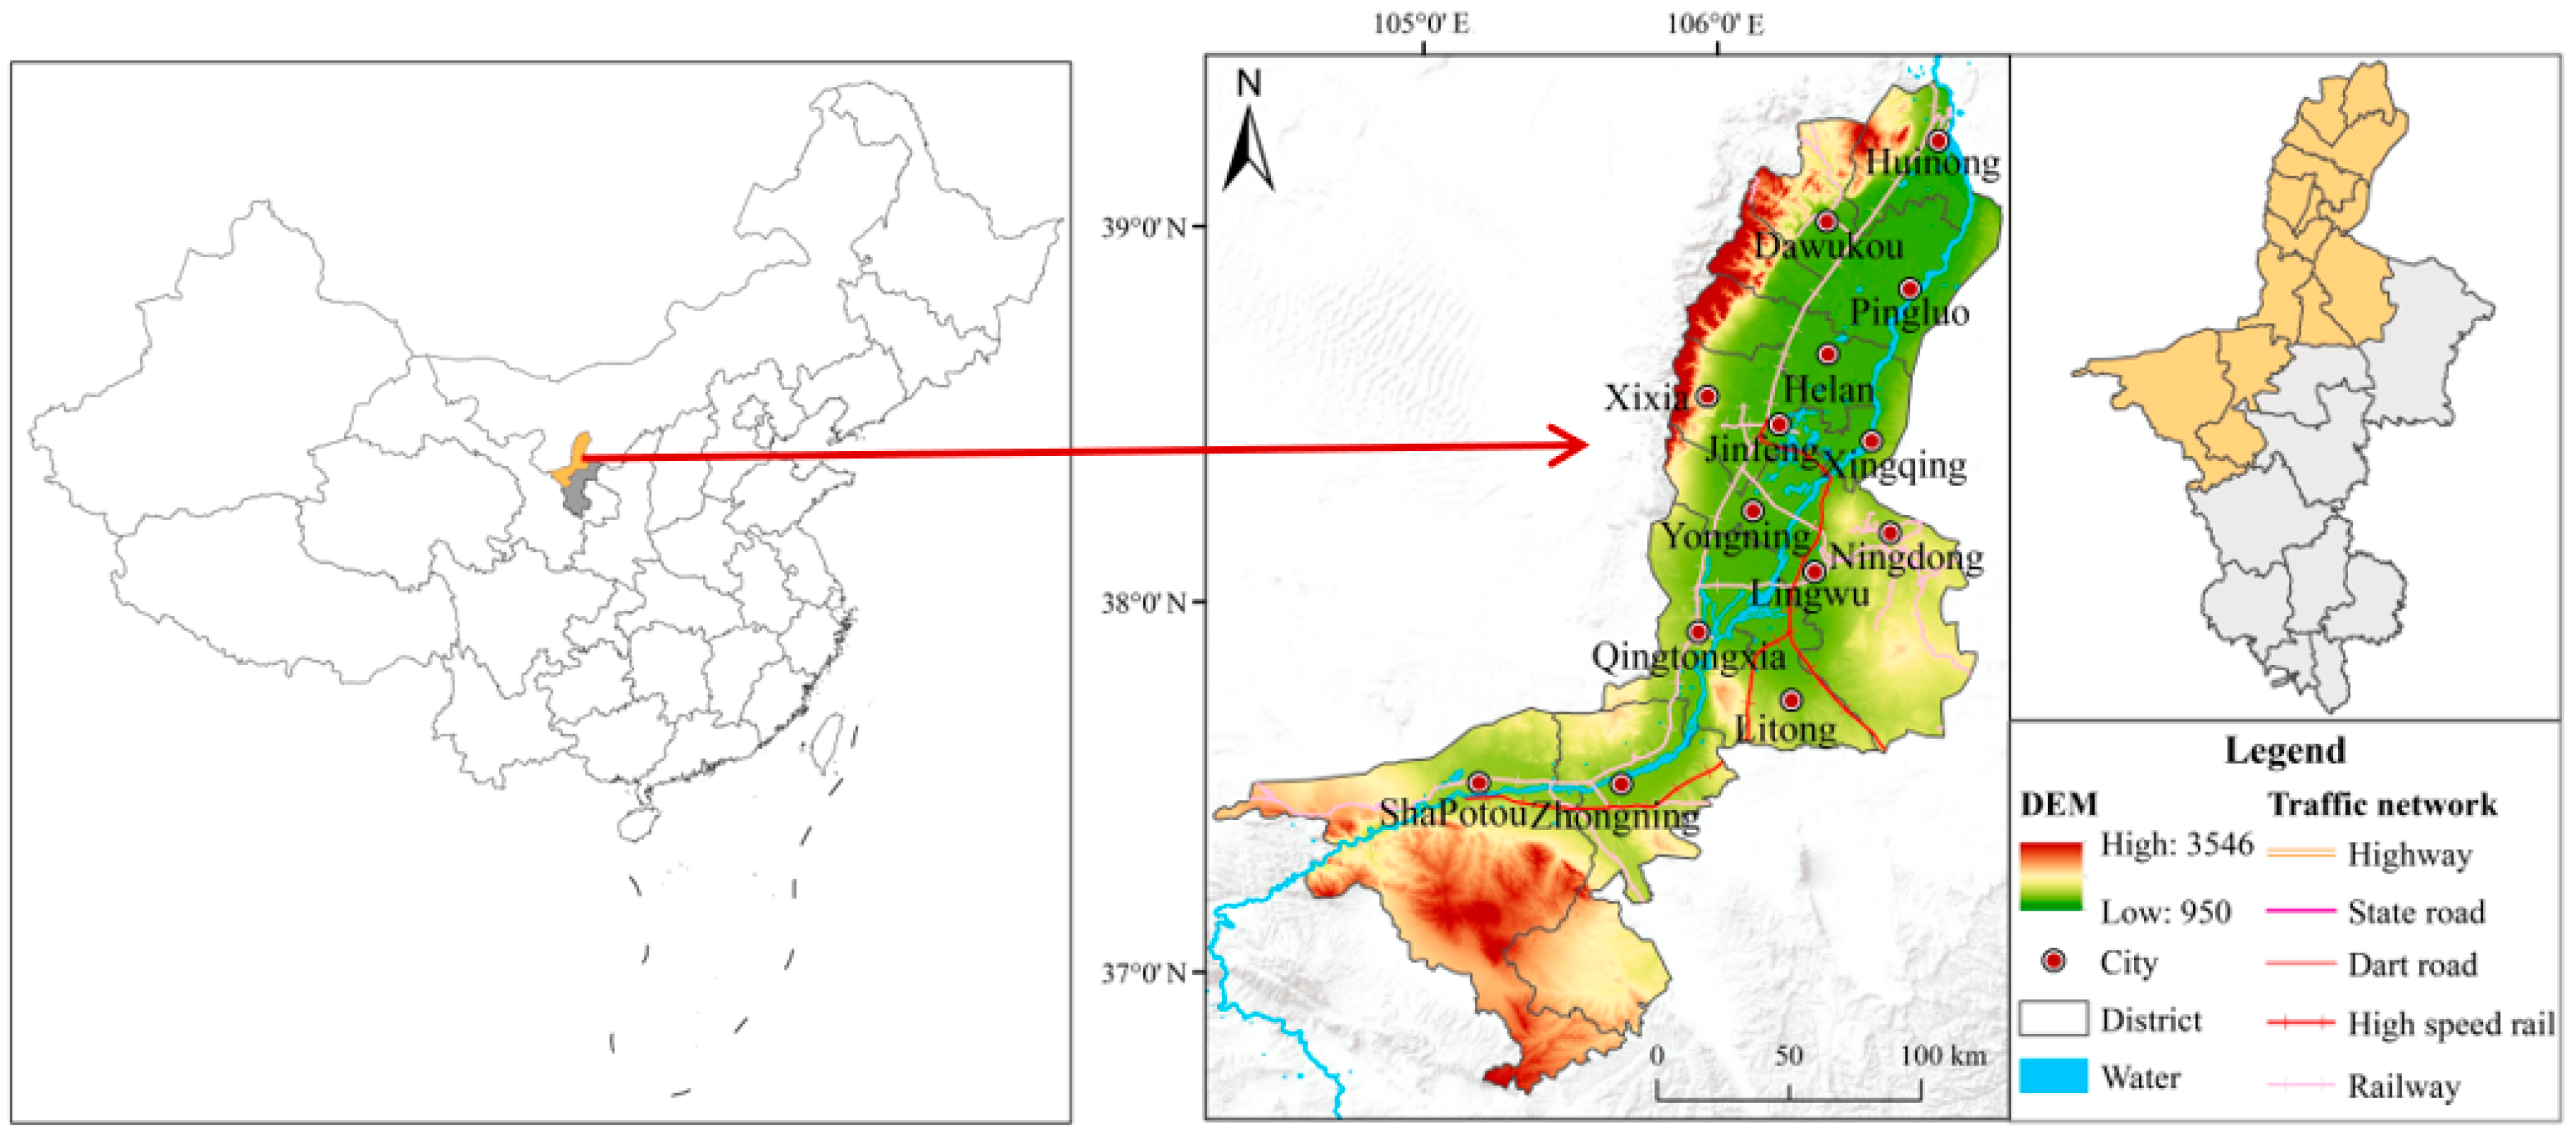
The Ningxia Urban Agglomeration along the Yellow River is located in the oasis area of the northern part of Ningxia Hui Autonomous Region, encompassing the Weining Plain and Yinchuan Plain in the upstream of Yellow River (104°22′E~107°50′E, 36°43′N~39°22′N) (Figure 2). According to the Development Plan for Ningxia Along the Yellow River Economic Zone City Belt, the Ningxia Urban Agglomeration along the Yellow River consists of 13 counties (as shown in Figure 1), including Jinfeng (JFQ), Xingqing (XQQ), Xixia (XXQ), Yongning (YNX), Helan (HLX), Lingwu (LWS), Litong (LTQ), Qingtongxia (QTX), Dawukou (DWK), Huinong (HNQ), Pingluo (PLX), Shapotou (SPT), and Zhongning (ZNX). It covers a total area of 22,700 km², accounting for approximately 44% of the entire region. Considering that the Ningdong Energy and Chemical Base (ND) is an important concentration area for corporate headquarters in the region, it is included in the overall network analysis when analyzing urban network connections. However, due to the limitation of relevant data availability, in analyzing spatial influence mechanisms, it is incorporated into the Lingwu at the county level.
Figure 2.
Location of the Ningxia Urban Agglomeration along the Yellow River.
2.2. Study Data
This paper initially collected business registration data from the Tianyancha platform for 2005-2021. Through spatial geocoding, industry classification, and filtering based on time utility, a total of 289,909 valid enterprises were obtained. Each data entry includes information such as registered capital, company type, time utility, industry affiliation, and spatial coordinates. At the same time, referring to China’s ’National Economic Industry Classification, the 20 industries were reclassified into four types: Living service industry, Productive service industry, Productive manufacturing industry, and other industries (Table 1). The social statistical data are sourced from the Ningxia Statistical Yearbook and various local social and economic statistical bulletins. The Night light data are sourced from the DMSP_OLS and NPP_VIIRS series data of the NASA. The NPP_VIIRS data is transformed into a fitted DMSP (2012-2020) dataset through calibration and fitting processes, and then combined with the DMSP (2005-2020) dataset.
2.3. Research Methods
2.3.1. Enterprise connections value assessment
After screening, there were a total of 38,158 enterprises with branch-investment relationships in the Ningxia Urban Agglomeration along the Yellow River during the study period. Simply considering the number of enterprises, total branches, or investment relationships can easily overlook certain chains among enterprises. Due to limitations in data attributes and comprehensive consideration of inter-enterprise connections, this paper constructs a standard system for valuing enterprises based on four aspects: Registered capital, Innovation potential, Openness atmosphere, and Capital utilization (Table 2). Among them, Registered capital to some extent reflects the basic operational scale and project capacity of the enterprises. The Chinese Private Enterprises 500, Fortune China 500 list, and high-tech enterprises typically exhibit strong research and development capabilities, sustained investment in research and development, and innovation efficiency. Given that foreign-controlled or joint ventures from Hong Kong, Macau, and Taiwan can to some extent reflect the regional policy environment and the ability to utilize foreign investment, and that enterprises can enhance their interaction with external markets and create a favorable open atmosphere through their relationships with foreign capital during the process of engaging with foreign investment. Listed companies, corporate groups, and state-owned enterprises have strong capital, financing capabilities, and operational abilities. They possess significant advantages in Capital utilization.
2.3.2. Enterprise Interlocking Network Model
Drawing on the principles of graph theory, cities are treated as nodes, and the branch-investment connections between cities’ enterprises are assigned as edge weights. By constructing a directed weighted matrix using the enterprise interlocking network model, the directionality and weightage of urban network connections are represented. Subsequently, based on the spatial scale of external and internal network connections, a network of enterprise connections is constructed among the 14 cities within the Ningxia Urban Agglomeration along the Yellow River and with other provinces outside the region. The spatio-temporal dynamics of urban network connections are analyzed from the perspectives of external and internal network. The calculation formula for the enterprise interlocking network model is as follows.
In the equation, CS(i) represents the urban connectivity of the external or internal network of city i. Vij represents the enterprise connection value between the investing company or parent company in city i and the contacting institution or branch in city j, while Vji represents the reverse case (i ≠ j). vai and vaj represent the assigned values of registered capital for the investing company or parent company and the contacting institution or branch. Since the registered capital of the enterprise considers both the parent and subsidiary companies, it is calculated by multiplying the assigned values of registered capital for the parent and subsidiary companies and then dividing the result by 5. This ensures that the evaluation of this indicator carries equal importance as other factors. vbi examines whether the investment target or branch institution belongs to China’s Top 500 Enterprises or High-tech Enterprises, considering the innovation potential of the company. vci examines whether the investment target or branch institution belongs to foreign-invested, Hong Kong, Macau, or Taiwan joint ventures, considering the company’s openness and business environment. vdi examines whether the investment target or branch institution belongs to listed companies, enterprise groups, or state-owned enterprises, considering the company’s capital utilization capability.
2.3.3. Social network analysis method
Due to the advantage of social network analysis method in depicting the interactive characteristics of network nodes, this paper selects the indicators of urban connectivity, and dominant connection direction (Table 3) to comprehensively measure the structural features of urban networks under enterprise relationships. Among them, the urban connectivity measures the position of cities in different networks, while the dominant connection direction reflects the symmetry of interactions between cities.
2.3.4. Spatial panel econometric model
(1) Spatial weight matrix. This paper constructs two types of spatial weight matrices. The first type is the geographic distance weight matrix, which is calculated based on the driving distance between each city obtained from the Amap (a Chinese mapping service). It is constructed using the reciprocal of the driving distance (Formula (3)). The second type of economic distance weight matrix is constructed based on the inverse of the per capita GDP difference between cities (Formula (4)). And the formulas are as follows.
where Dij represents the driving distance between city i and j, and , are the average per capita GDP of city i and j.
(2) Spatial Dubin Model (SDM). To improve the accuracy of the regression results, this paper estimates the SAR (Spatial Autoregressive), SEM (Spatial Error), and SDM (Spatial Durbin) models that consider spatial effects for estimation. These models are compared with LM (Lagrange Multiplier) and LR (Likelihood Ratio) results. The findings indicate that the regression effects are relatively better in the SDM model. Furthermore, a Wald test is conducted to compare the models, and the P-value for the SDM model is significant at the 1% level, suggesting that the SDM model cannot be reduced to SAR or SEM models. Finally, a Hausman test is performed, and the test results show that the P-value is less than 0.05, failing to reject the null hypothesis. Therefore, in this paper, the SDM model with two-way fixed effects is chosen to investigate the influence mechanisms of external network connections and internal network connections. Considering the lagged effect of macro urban development on enterprises and its influence on the construction of enterprise network connections, the independent variables are lagged by one period. The formula is as follows.
In the equation: Yi,t represents the total connectivity value of external and internal networks for each node. Xi,t-1 represents the various influencing factors of city i in year t-1. ρ is the spatial lag regression coefficient, which indicates the external and internal network connectivity of neighboring cities influences the external and internal network connectivity of the focal city. γ is the coefficient of spatial lagged regression for the independent variable. μi represents spatial fixed effects. λt represents time fixed effects. εi,t is the spatial autocorrelation error term. Wij is the spatial weight matrix. Wijln(Yi,t) represents the ln(Yi,t) of city i on the ln(Yi,t) of neighboring cities. Wijln(Xi,t-1) represents the ln(Xi,t-1) of city i on the ln(Xi,t-1) of neighboring cities.

Table 1.
Classification of enterprises.
| Original category | Quantity | Categorization | Original category | Quantity | Categorization |
| Education | 3146 | Living service industry (127142) |
Transportation, Storage, and Postal services | 8190 | Productive service industry (84433) |
| Residential services, Repairs, and Other services | 8590 | Information transmission, Software, and Information technology services | 12008 | ||
| Accommodation and Catering | 5356 | Finance | 3792 | ||
| Wholesale and Retail | 105278 | Real Estate | 7230 | ||
| Culture, Sports and Entertainment | 3856 | Rental and Business services | 39391 | ||
| Health and Social work | 916 | Scientific research and Technical services | 13822 | ||
| Mining industry | 1739 | Productive manufacturing industry (30221) |
Agriculture | 20708 | Other industries (47663) |
| Manufacturing | 26210 | Construction | 25199 | ||
| Production and supply of Electricity, Heat, Gas, and Water | 2272 | Water resources, Environmental, and Public facilities management | 1492 | ||
| —— | Public administration, Social security, and Social organizations | 264 | |||
Note: The industry type of the enterprise refers to the National Economic Industry Classification (GB/T 4754-2017).
Table 2.
The assignment standard system of enterprise.
| Classification | Criteria for Classification | Valuation |
| Registered capital (Unit: 10,000 yuan) (va) |
Registered capital of the enterprise ∈ [0, 10) | 1 |
| Registered capital of the enterprise ∈ [10, 100) | 2 | |
| Registered capital of the enterprise ∈ [100, 1000) | 3 | |
| Registered capital of the enterprise ∈ [1000, 10000) | 4 | |
| Registered capital of the enterprise ∈ [10000, ∞] | 5 | |
| Innovation potential (vb) |
Company belongs to China’s Top 500 Private Enterprises, or Fortune China 500, or High-tech Enterprises. | 5 |
| Openness atmosphere (vc) |
The company belongs to foreign-invested or joint ventures with Hong Kong, Macau and Taiwan. | 5 |
| Capital utilization (vd) |
The company belongs to listed companies or enterprise groups or state-owned enterprises. | 5 |
Table 3.
Research methods and definitions of related indicators for urban network structure.
| Research Indicators | Research Methods | Meaning of Indicators |
| Urban connectivity | Taking the ratio of the node CS(i) to the maximum value in the same year, we obtain the relative level of inflow (i) and the relative level of outflow (i) within the internal network of city i. α and β are undetermined weights, with a default value of 0.5. The urban connectivity in the external network is also calculated using this formula. | |
| Dominant connections direction | represents the relative out-degree of a city in the network, indicating the city’s radiating capacity. represents the relative in-degree of a city in the network, indicating the city’s agglomeration capacity. N represents the number of cities. NSIi represents the dominant connections’ direction index of city i. |
3. Evolutionary characteristics of enterprise flow structure
Research on urban networks from the perspective of enterprise flows has mainly focused on the Productive service industry. However, the Ningxia Urban Agglomeration along the Yellow River is an important region for receiving the transfer of manufacturing industries from central and eastern China. The urban network connections formed under the flows of Productive service industry and Productive manufacturing industry exhibit differences. Therefore, this paper primarily conducts a spatiotemporal dynamic analysis of regional urban network connections, focusing on the overall connections, Productive service industry connections, and Productive manufacturing industry connections. The study aims to describe the homogeneity and heterogeneity of urban network connections.
3.1. The enterprise flow connections in the external network
3.1.1. The enterprise outflow connections in the external network
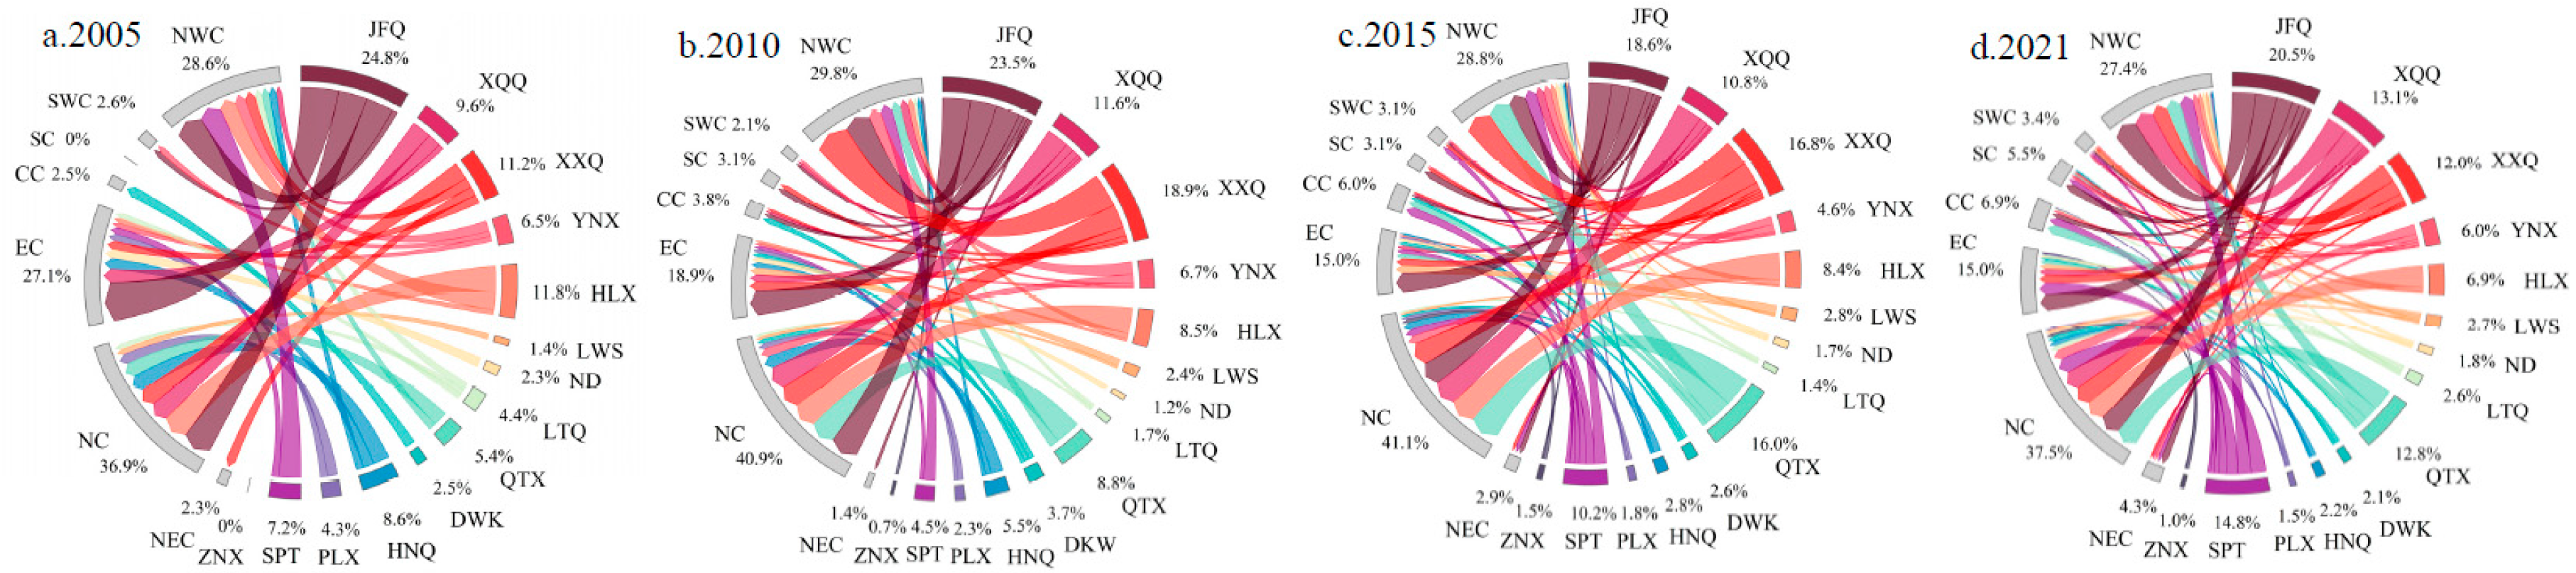
Using Origin software to visualize the enterprises outflow connections in the external network, and comparing the changes at four time points, namely 2005, 2010, 2015, and 2021. Regarding the evolution of the overall pattern of enterprise outflow connections (Figure 3), the Ningxia Urban Agglomeration along the Yellow River exhibits a spatial organizational structure characterized by a single-polar outflow investment sources and a diversified inflow of investment recipients. From the perspective of outflow investment sources, the core area consisting of Jinfeng and Xingqing maintains an outflow proportion of over 50%, dominating the discourse power in the regional outflow investment scenario. In comparison to the core area, the external connectivity of Xixia, Litong, and Huinong is relatively weakened. With outflow investments from energy companies, the outflow proportion of Shapotou has increased from 2.9% to 5.5%. The changes in other nodes are not significant. In terms of investment destination selection, the proportion of enterprise outflow to North China, East China, and Northwest China remains above 70%, especially with the outflow proportion to East China increasing from 18.2% to 23.7%. Among them, Beijing, Inner Mongolia, Shanghai, Shandong, Jiangsu, Shaanxi, Gansu, and Guangdong are the main investment destinations for enterprises in the Ningxia Urban Agglomeration along the Yellow River.
Comparing the outflow patterns of Productive service industry and Productive manufacturing industry (Figure 4, Figure 5), the evolution of enterprise outflow in the Productive service industry is generally consistent with the overall outflow pattern of regional enterprises. However, significant differences can be observed in the case of the Productive manufacturing industry. On one hand, the outflow sources are becoming more diversified, with the external investment activities of regional manufacturing enterprises gradually shifting from being dominated by Jinfeng, Xingqing, Xixia, Qingtong, and Shapotou. On the other hand, the proportion of outflow to the East China region has decreased from 27.1% to 15.0%, while investments in the North China region and the Northwest China region continue to dominate.
Figure 3.
The evolution of enterprise overall outflow in the external network. Note: Because of the small amount of data in Taiwan, Hong Kong and Macau, these regions are not included, and all the following are the same. In addition, Northeast China is NEC, North China is NC, East China is EC, Central China is CC, South China is SC, Southwest China is SWC, Northwest China is NWC.
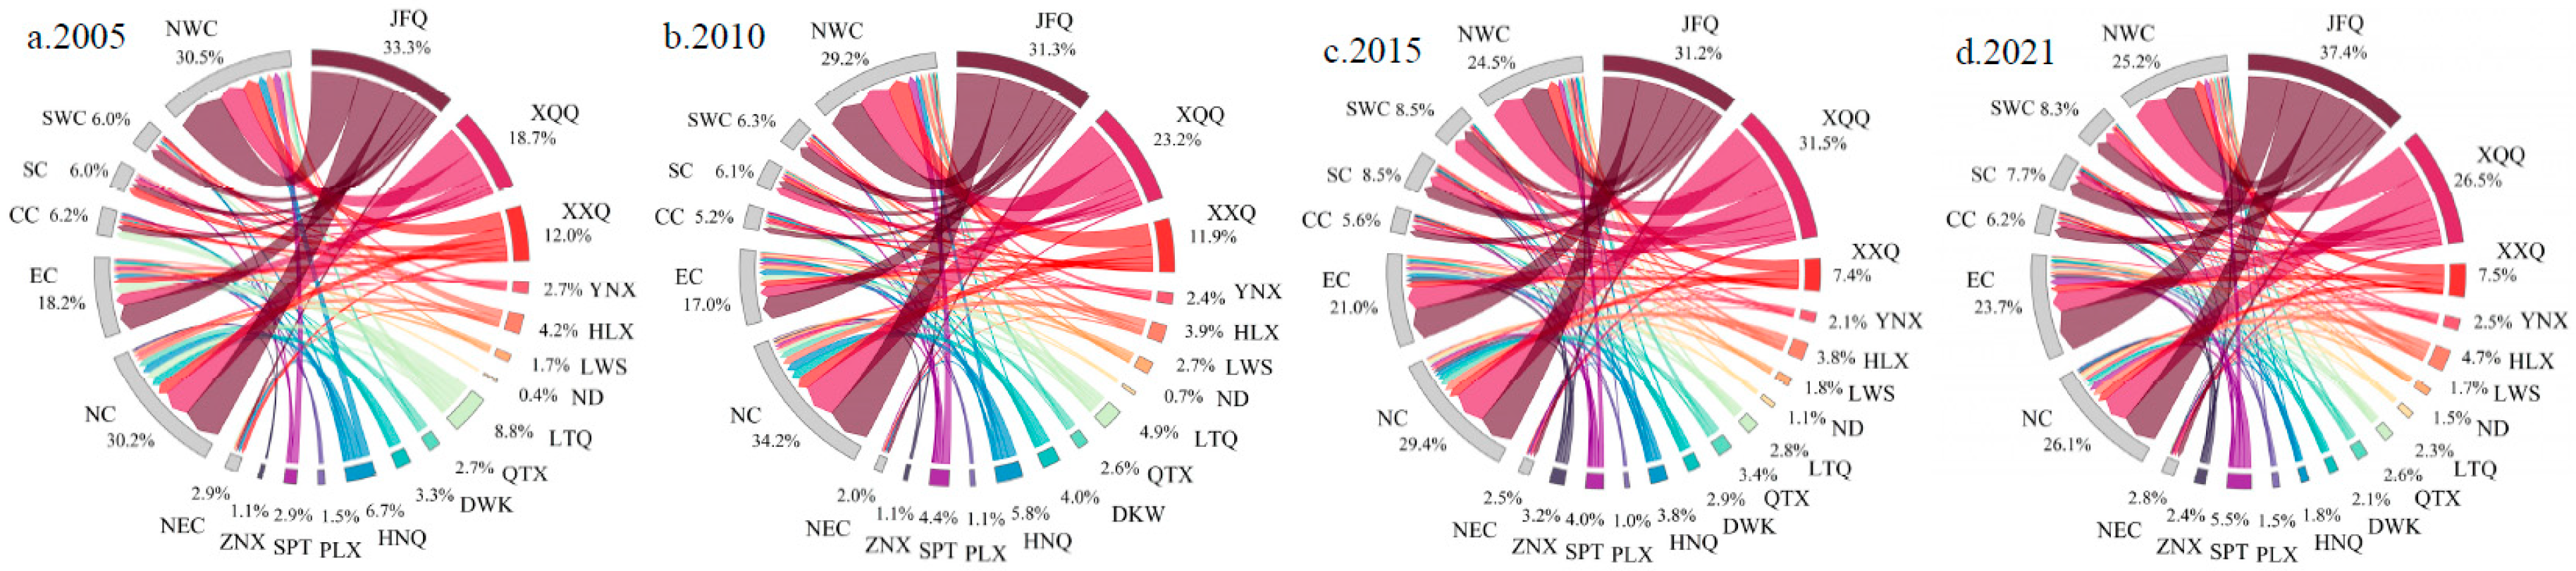
Figure 4.
The evolution of enterprise outflow of Production service industry in the external network.
Figure 4.
The evolution of enterprise outflow of Production service industry in the external network.
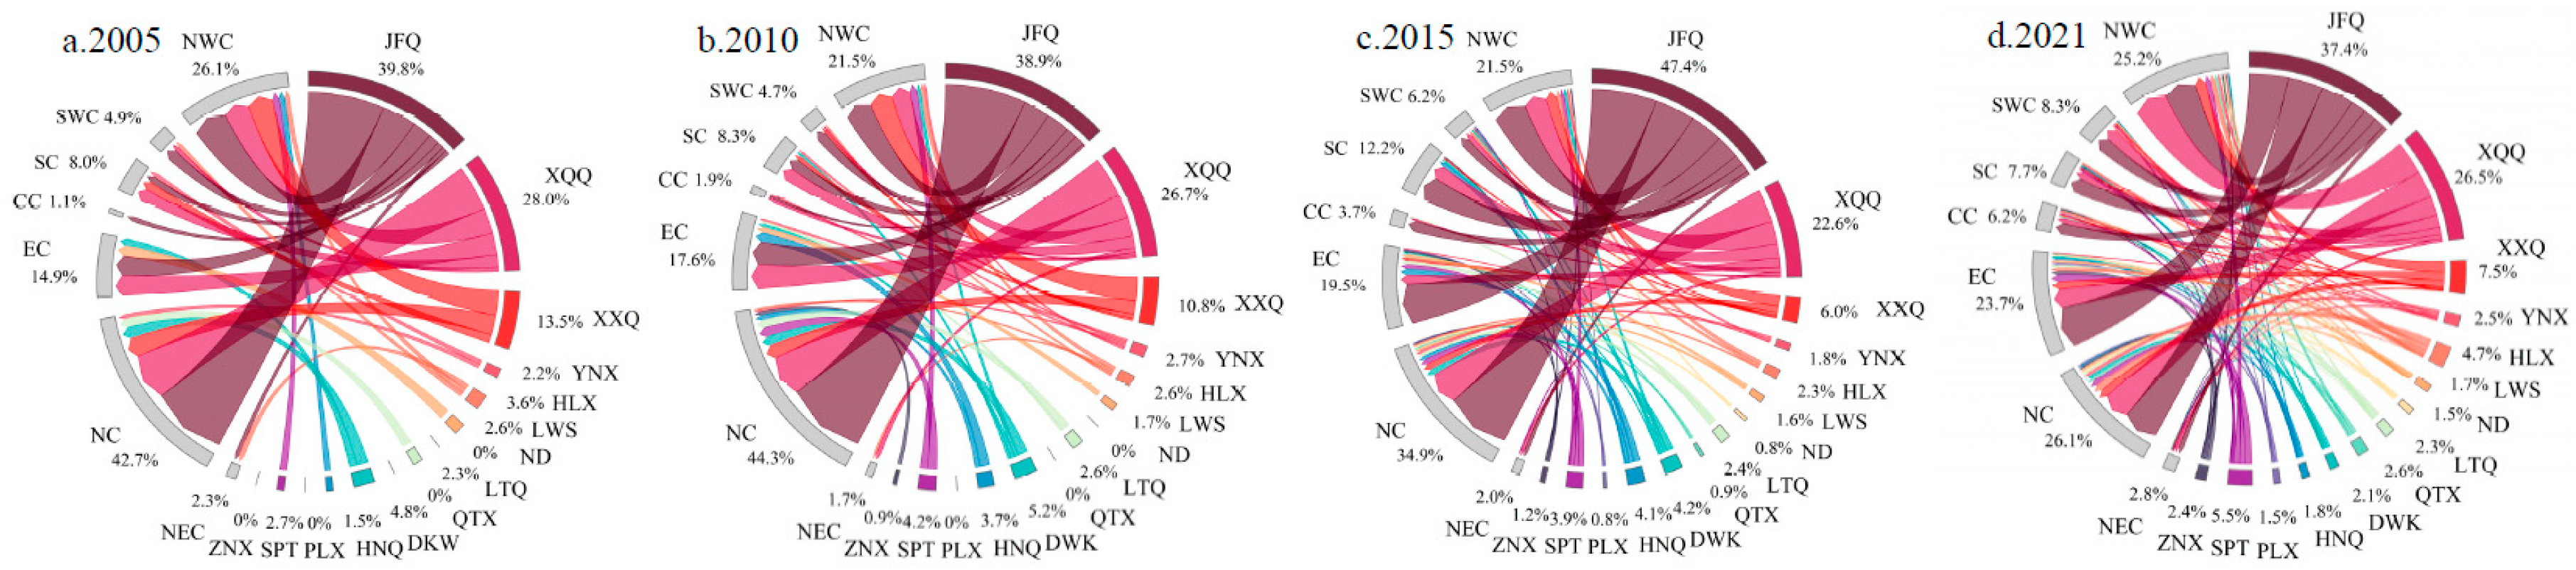
Figure 5.
The evolution of enterprise outflow of Productive manufacturing industry in the external network.
Figure 5.
The evolution of enterprise outflow of Productive manufacturing industry in the external network.
3.1.2. The enterprises inflow connections in the external network
Regarding the evolution of enterprises overall inflow pattern in the external network (Figure 6), it is found that the inflow of external network enterprises have formed a spatial pattern of diversified inflow sources and concentrated inflow destinations. From the perspective of inflow sources, from 2005 to 2021, the inflow proportion of North China decreased from 87.4% to 56.5%, while the proportion of East China increased from 4.7% to 19.7%. The inflow proportions of Central China, South China, Southwest China, and Northwest China also increased to 3.4%, 8.4%, 3.9%, and 7.0% respectively. The changes of Northeast China were relatively small. On the whole, the inflow sources formed a multi-source structure dominated by North China and East China.
In the evolution of inflow destinations, the most significant change is the increase in the inflow proportion to JinFeng from an initial 8.1% to 24.0%. The inflow proportion of Xingqing, has remained relatively stable at around 25%. The inflow proportions of other areas are small and relatively weak in changes. Overall, a spatial pattern of enterprise inflow aggregation has formed, with JinFeng and Xingqing as the core areas.
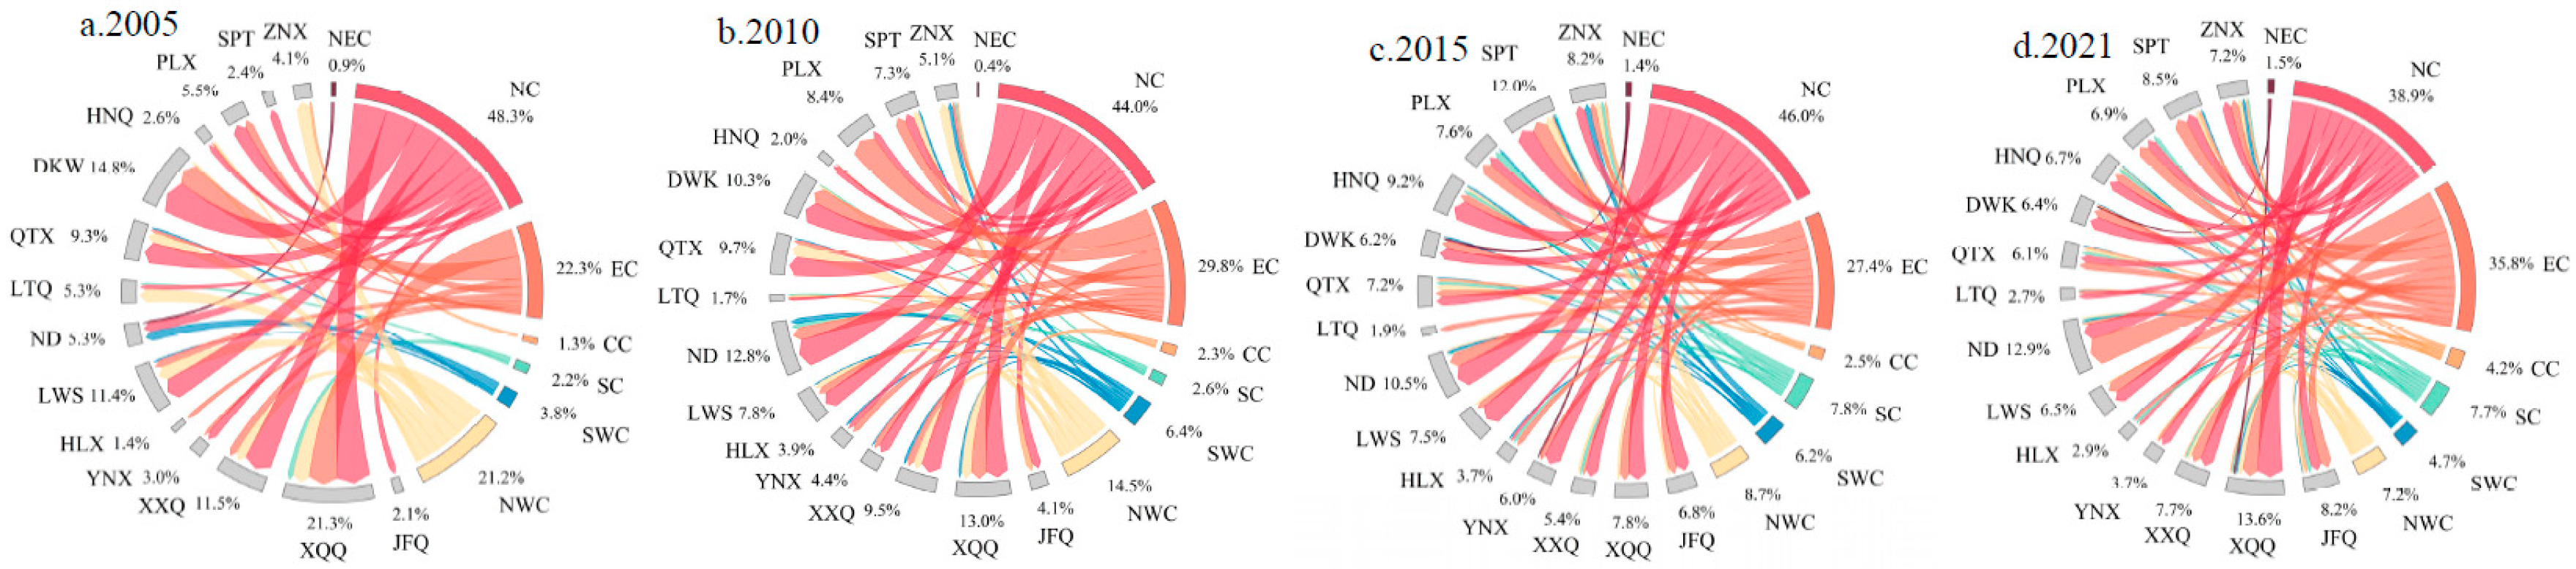
When comparing the inflow patterns of Productive service industry and Productive manufacturing industry (Figure 7, Figure 8), the inflow pattern of Productive service industry follows the evolution of enterprises overall inflow. However, in the case of Productive manufacturing industry, the dominant inflow destinations are not exclusively from North China. The inflow proportion of North China and Northwest China has decreased from 48.3% and 21.2% to 38.9% and 7.2%, respectively. In contrast, the inflow proportion of East China and South China has increased from 22.3% and 2.2% to 35.8% and 7.7%, respectively. Overall, the inflow sources exhibit a spatial organizational structure controlled jointly by North China and East China. Due to factors such as the industrial transformation and upgrading, the decline of traditional manufacturing industries (such as coal, thermal power, petrochemicals, etc.), and the adjustment of internal manufacturing base layouts, the enterprises inflow has evolved from being primarily directed towards Xingqing, Xixia, Lingwu, Qingtongxia, and Dawukou to a spatial organizational pattern driven by multiple cities. Among them, the inflow proportions of Ningdong and Xingqing have exceeding 10%.
Figure 6.
The evolution of enterprise overall inflow in the external network.
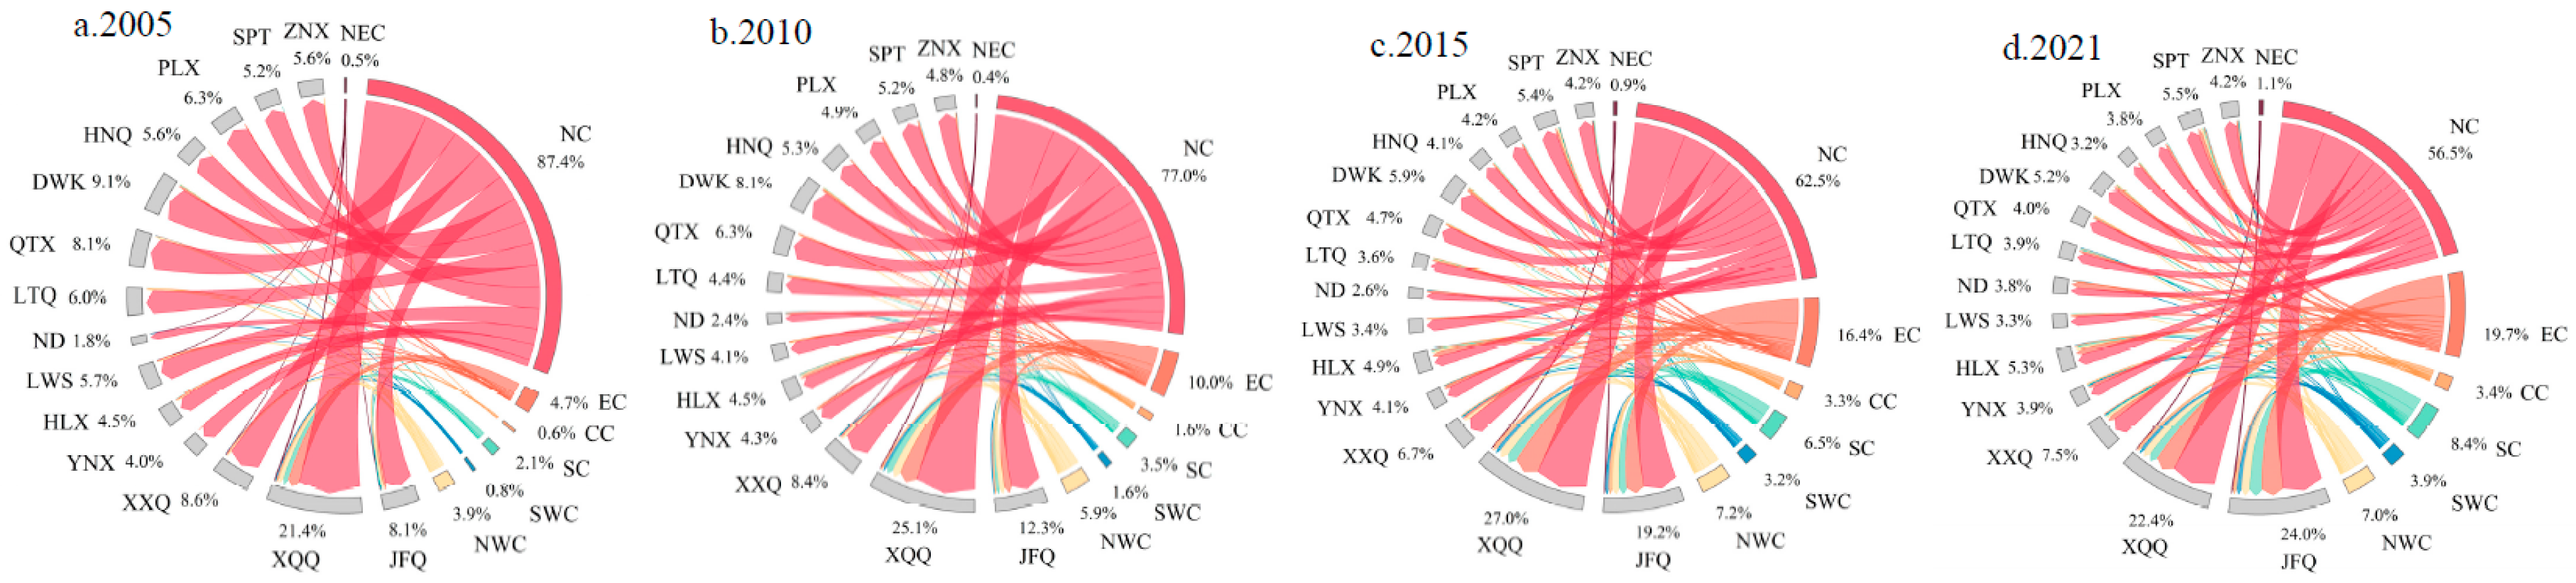
Figure 7.
The evolution of enterprise inflow of Production service industry in the external network.
Figure 7.
The evolution of enterprise inflow of Production service industry in the external network.
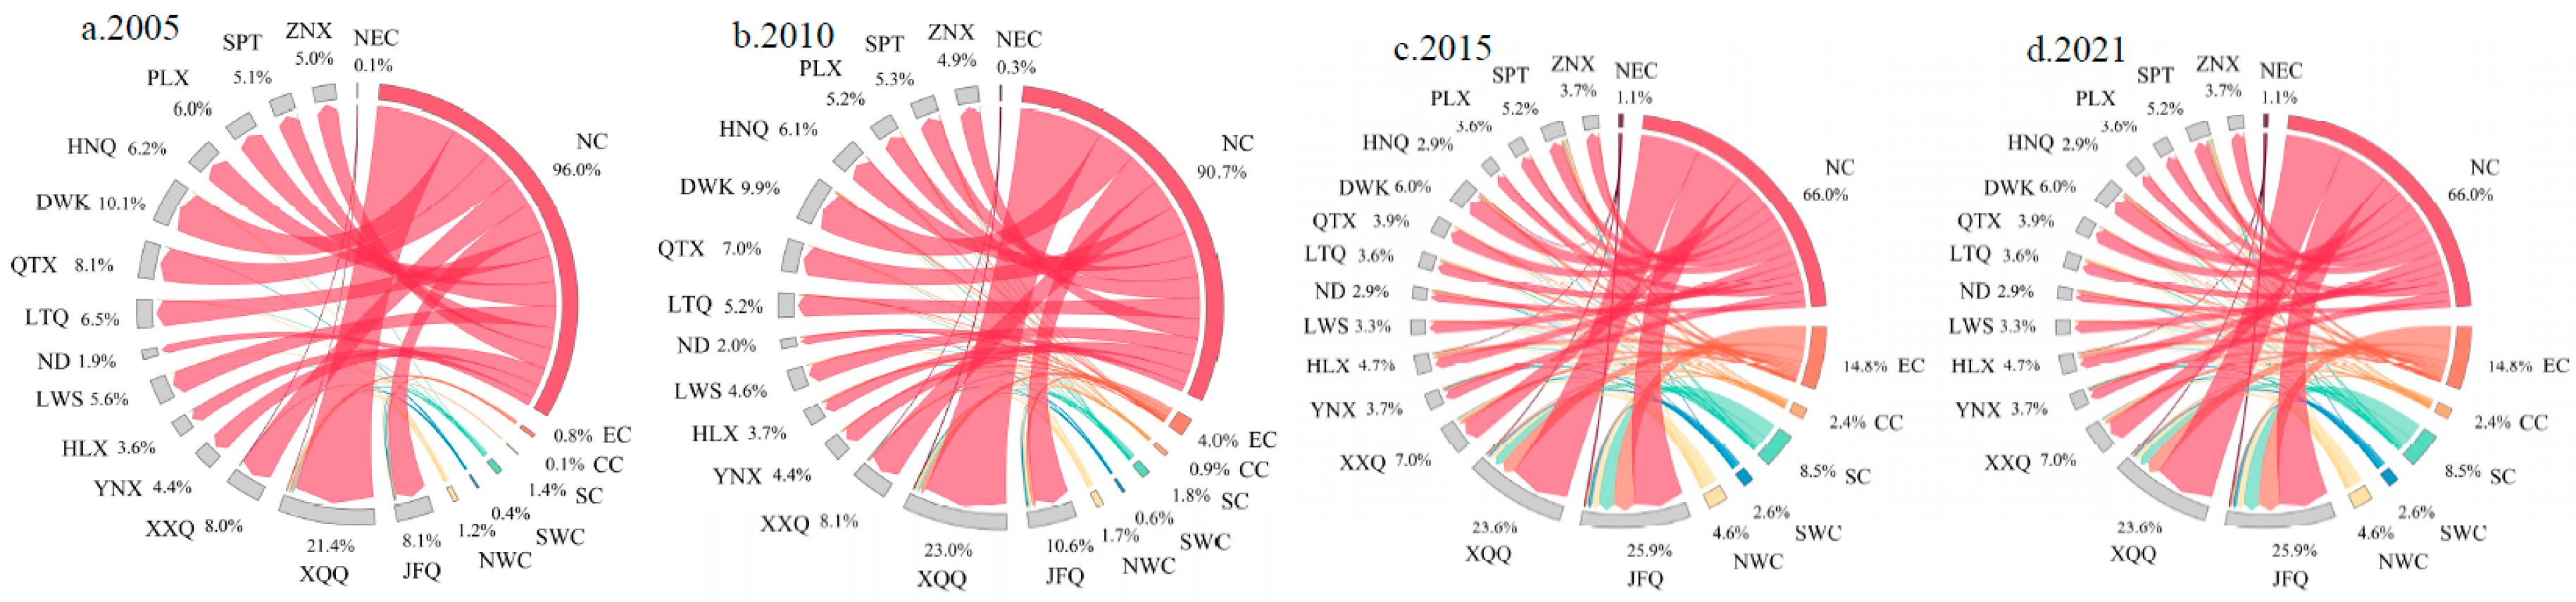
Figure 8.
The evolution of enterprise inflow of Production manufacturing industry in the external network.
Figure 8.
The evolution of enterprise inflow of Production manufacturing industry in the external network.
3.2. The enterprises flow connections in the internal network
To objectively depict the evolution of enterprise flows within the internal network, an equal interval method was used to categorize the internal network connectivity and urban connectivity. Looking at the evolution of internal network enterprises’ overall flows (Figure 9), a concentric connectivity structure has been formed with Jinfeng and Xingqing at its core. And the interconnections between urban nodes have been strengthening. The strong connection and stronger connection, initially limited to the areas between Jinfeng and Xingqing, have evolved into a diamond-shaped spatial pattern characterized by strong interactions among Jinfeng, Xingqing, Xixia, Yongning, and Helan. By 2021, on one hand, the internal network connectivity structure has evolved from Level IV-1/ Level III-1/ Level II-1/ Level I-11 to Level IV-4/ Level III-1/ Level II-8/ Level I-1. The internal network connectivity of Jinfeng, Xingqing, Xixia, and Helan have reached Level IV, forming a radiating network structure with these four areas as the core. On the other hand, the overall spatial network connectivity is unbalanced, with the radiating influence of Jinfeng and Xingqing mainly to the surrounding cities, failing to exert positive driving effects on the northern and southern regions. As a result, the development gap between the urban nodes in these regions and the core nodes is gradually widening. In addition, apart from maintaining active connections with the core nodes, the communication between other adjacent nodes is weak. Overall, the structure exhibits spatial polarization characteristics and an imperfect hierarchical system, with the strong influence of core nodes confined in the core district.
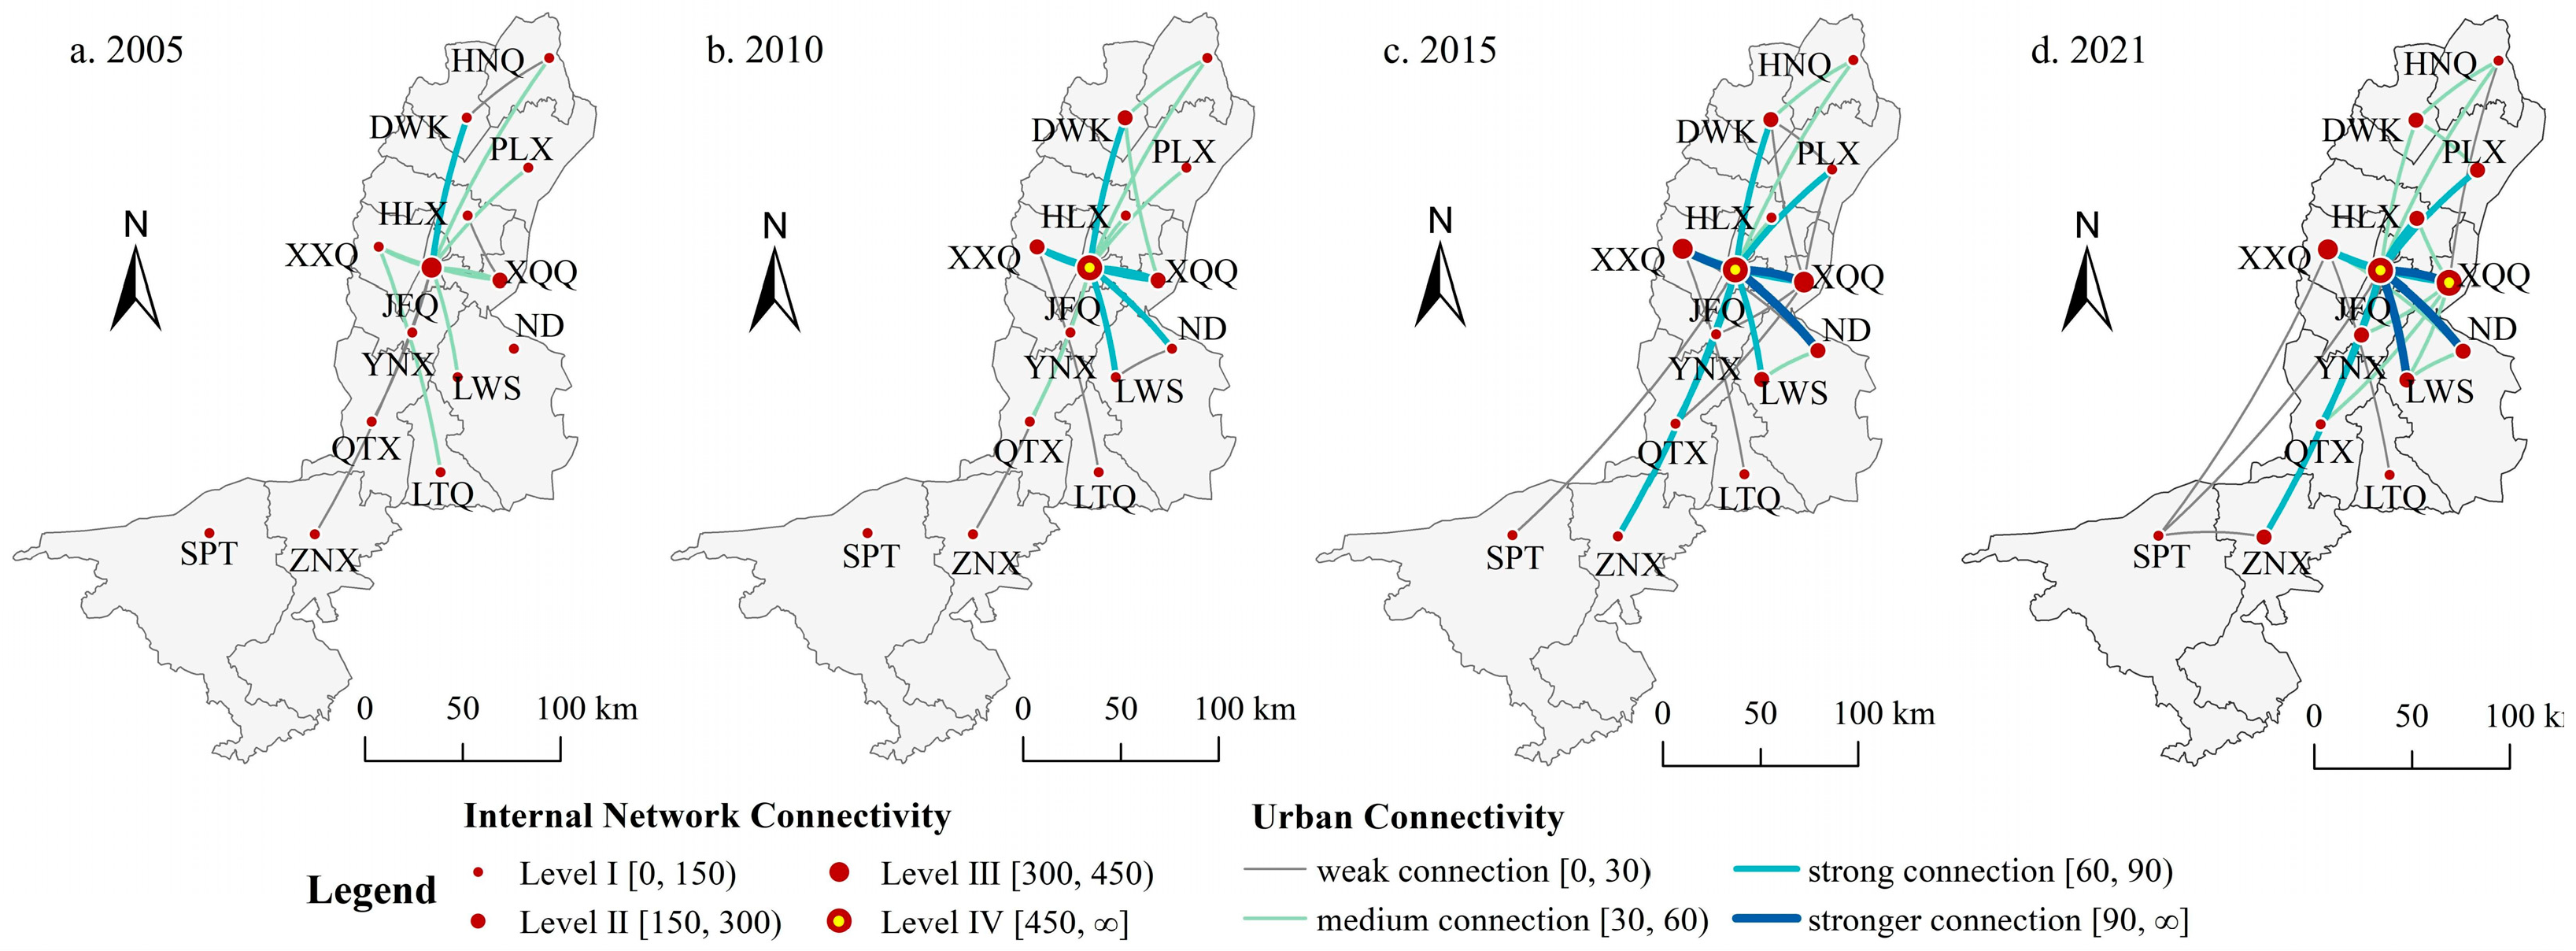
The enterprise flow in the Productive service industry is relatively active (Figure 10). The internal network connectivity structure has evolved from Level IV-0/ Level III-2/ Level II-0/ Level I-12 to Level IV-2/ Level III-4/ Level II-7/ Level I-1. The radiation impact of JinFeng and Xingqing has spread to the northern and southern regions, and it has also driven the upgrade of internal network connectivity in Xixia, Helan, Dawukou, and Zhongning. However, in the Productive manufacturing industry (Figure 11), the enterprise flow is relatively concentrated, and the internal network connectivity structure has evolved from Level IV-0/ Level III-1/ Level II-1/ Level I-12 to Level IV-2/ Level III-1/ Level II-7/ Level I-4. The strong connection and stronger connection have shifted from the early stage between JinFeng and Dawukou to between JinFeng, Xingqing, Ningdong, and Lingwu. The Production manufacturing has further concentrated the productive functions towards the eastern manufacturing bases, strengthening the flow of important manufacturing enterprises in the internal network.
Figure 9.
The spatial pattern of enterprise overall flow in the internal network.
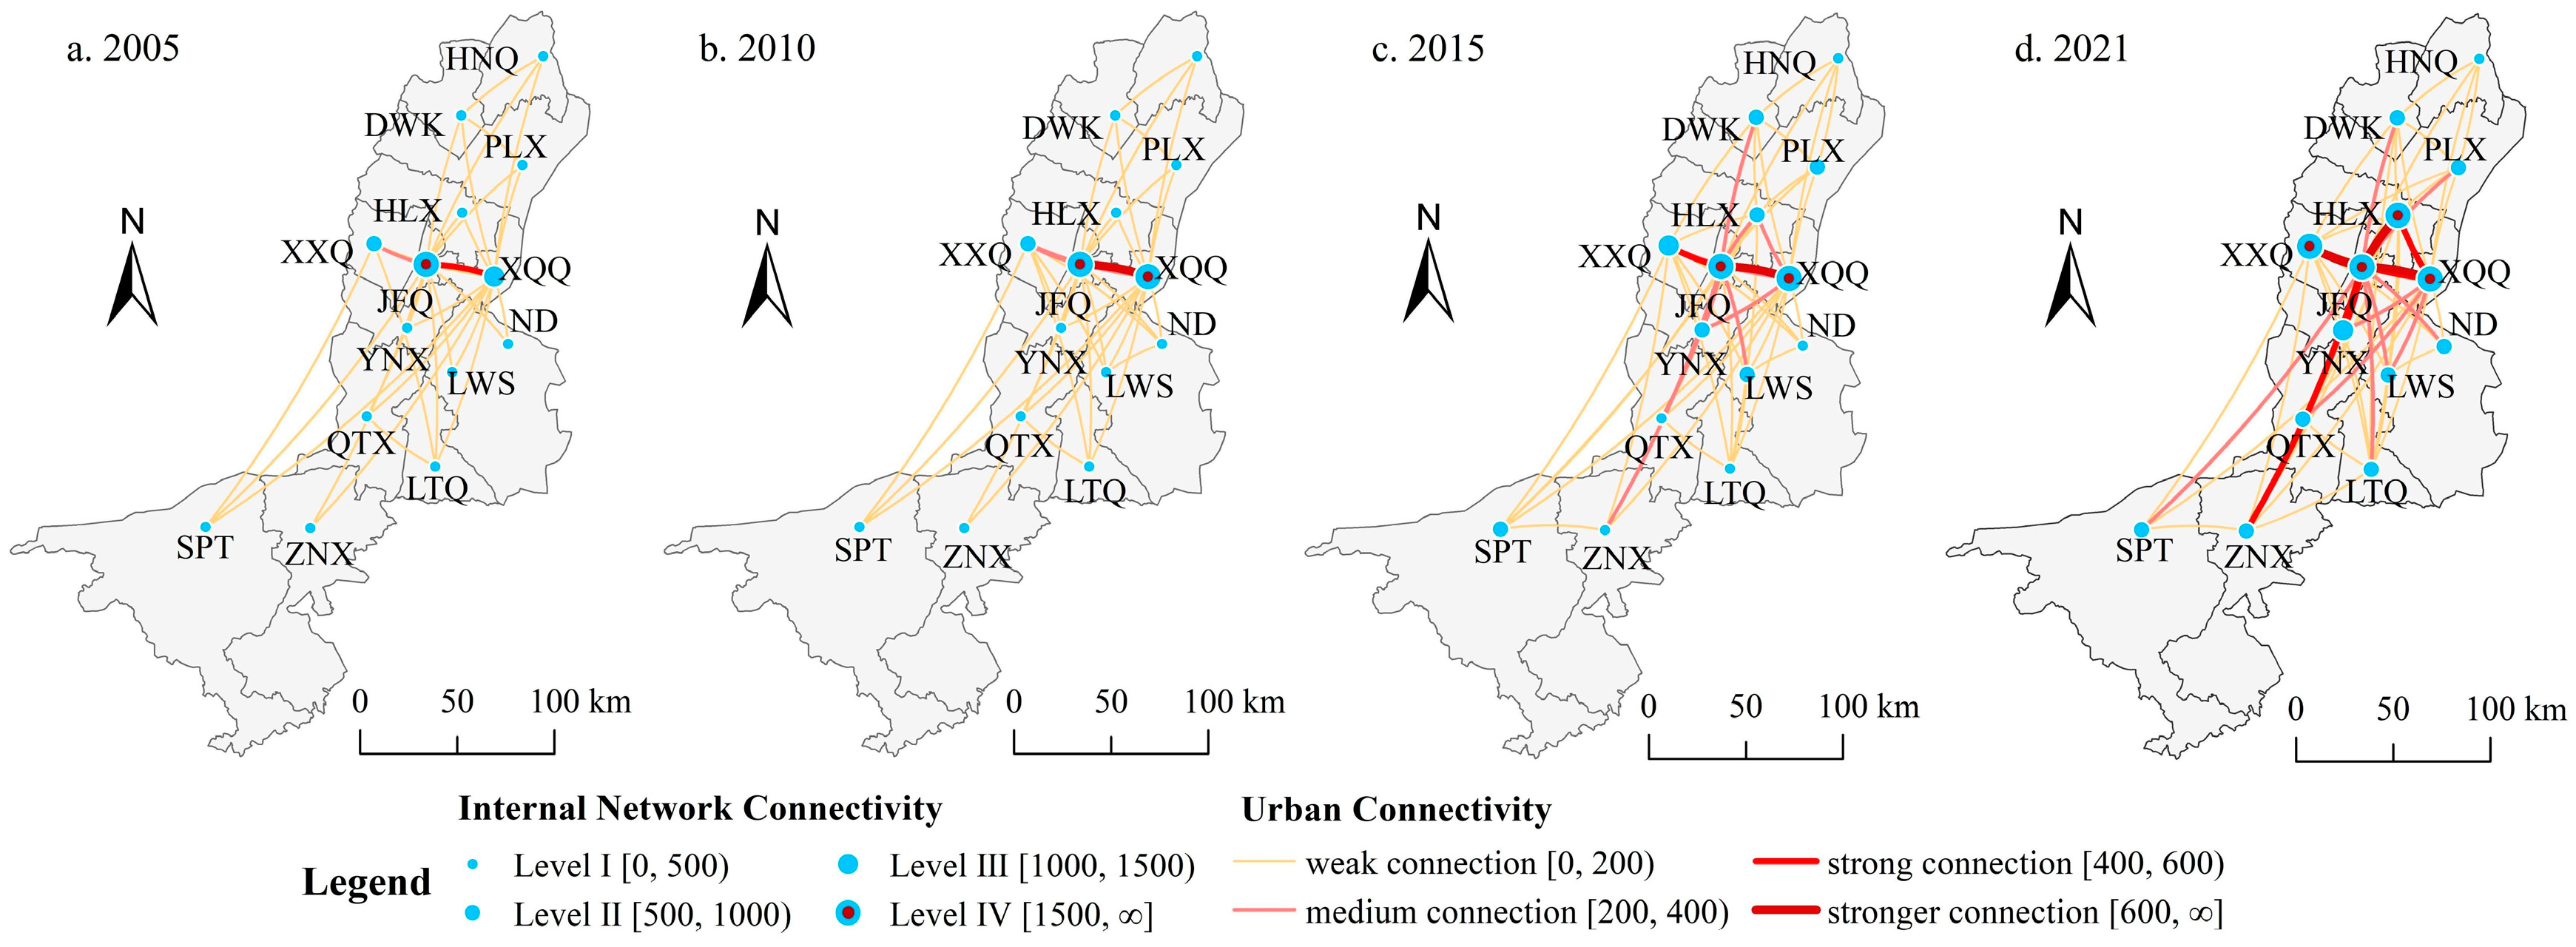
Figure 10.
The spatial pattern of enterprise overall flow of Production service industry in the internal network.
Figure 10.
The spatial pattern of enterprise overall flow of Production service industry in the internal network.
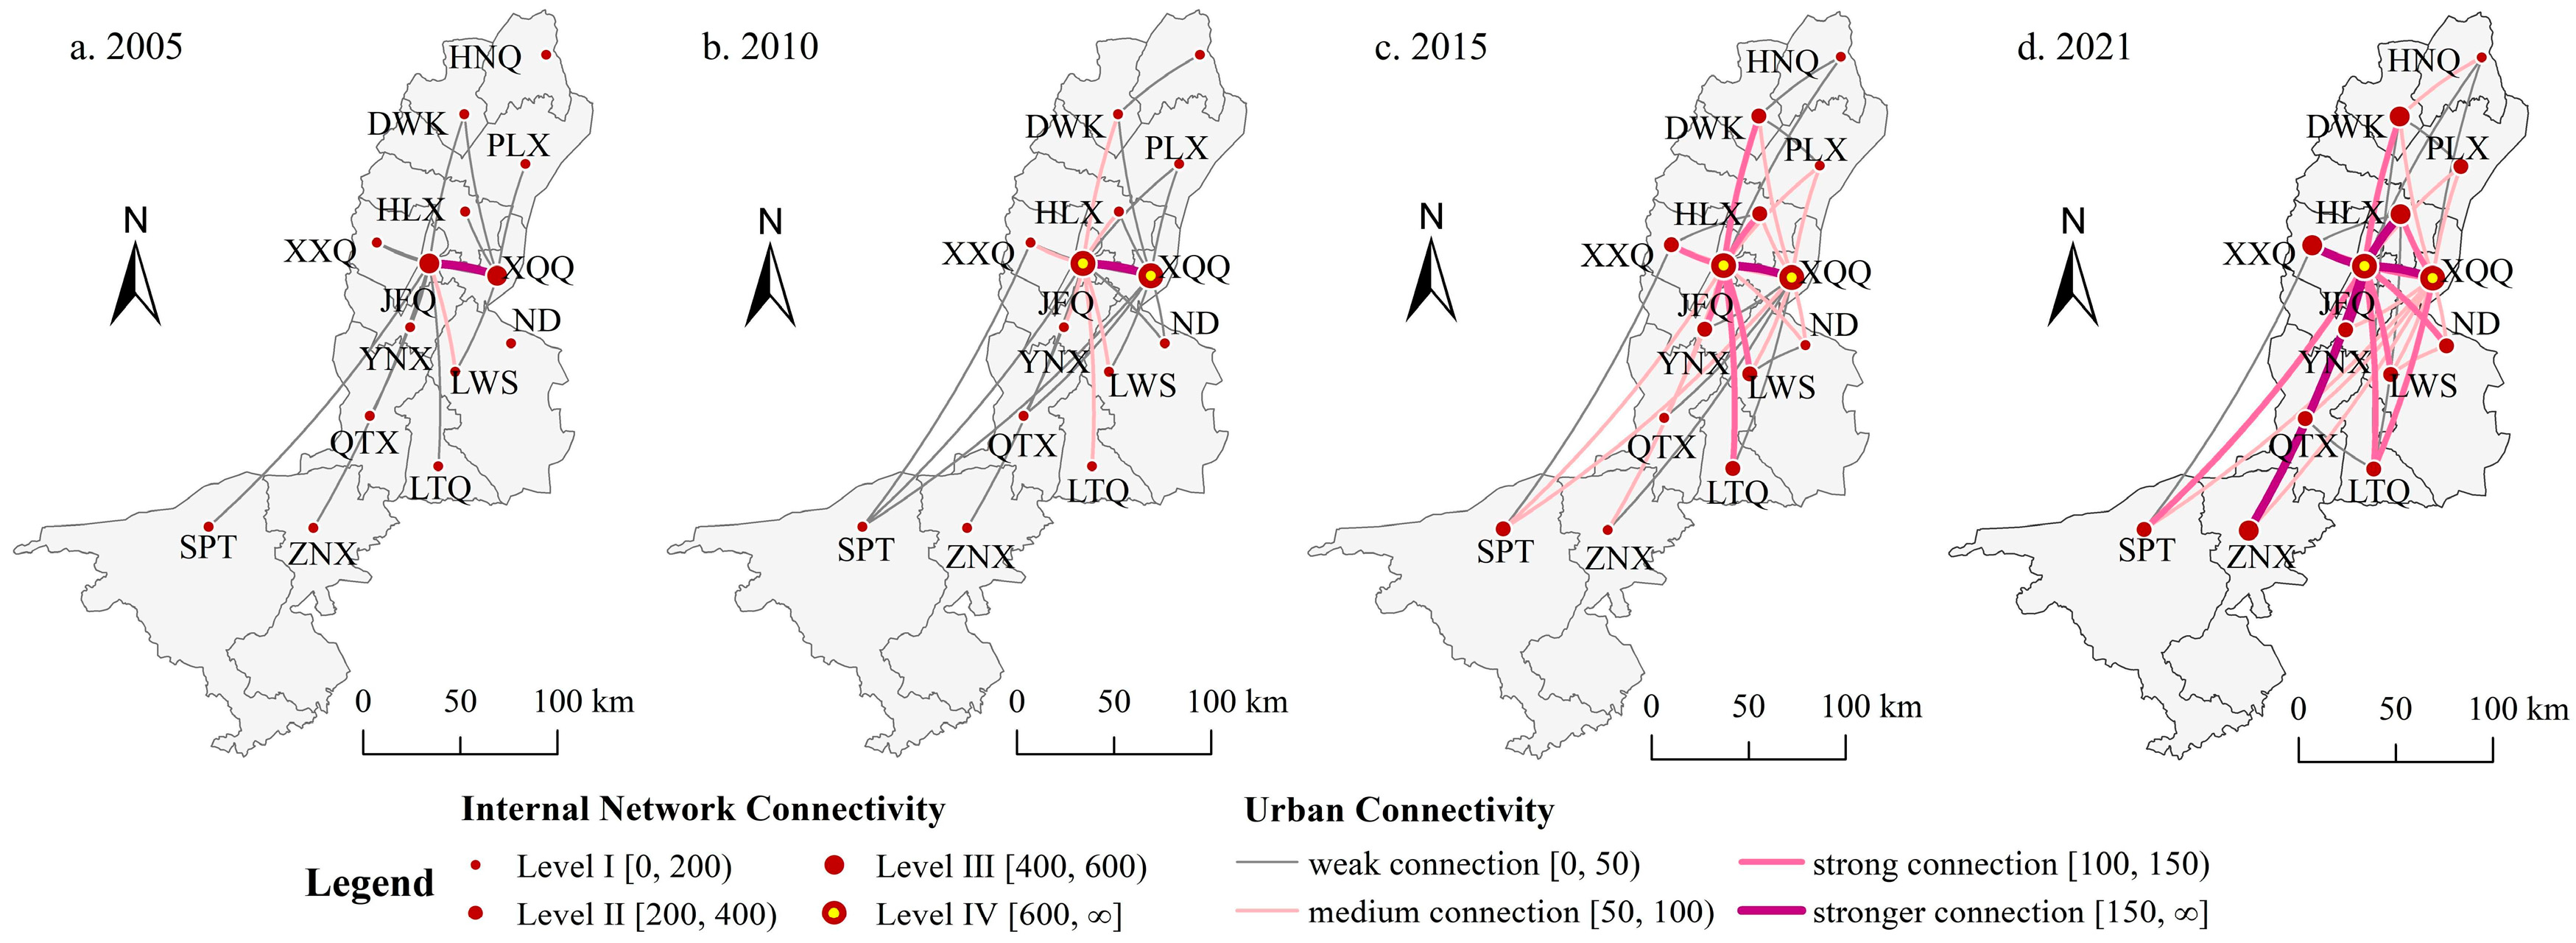
Figure 11.
The spatial pattern of enterprise overall flow of Production manufacturing industry in the internal network.
Figure 11.
The spatial pattern of enterprise overall flow of Production manufacturing industry in the internal network.
3.3. The enterprises flow connections in the internal network
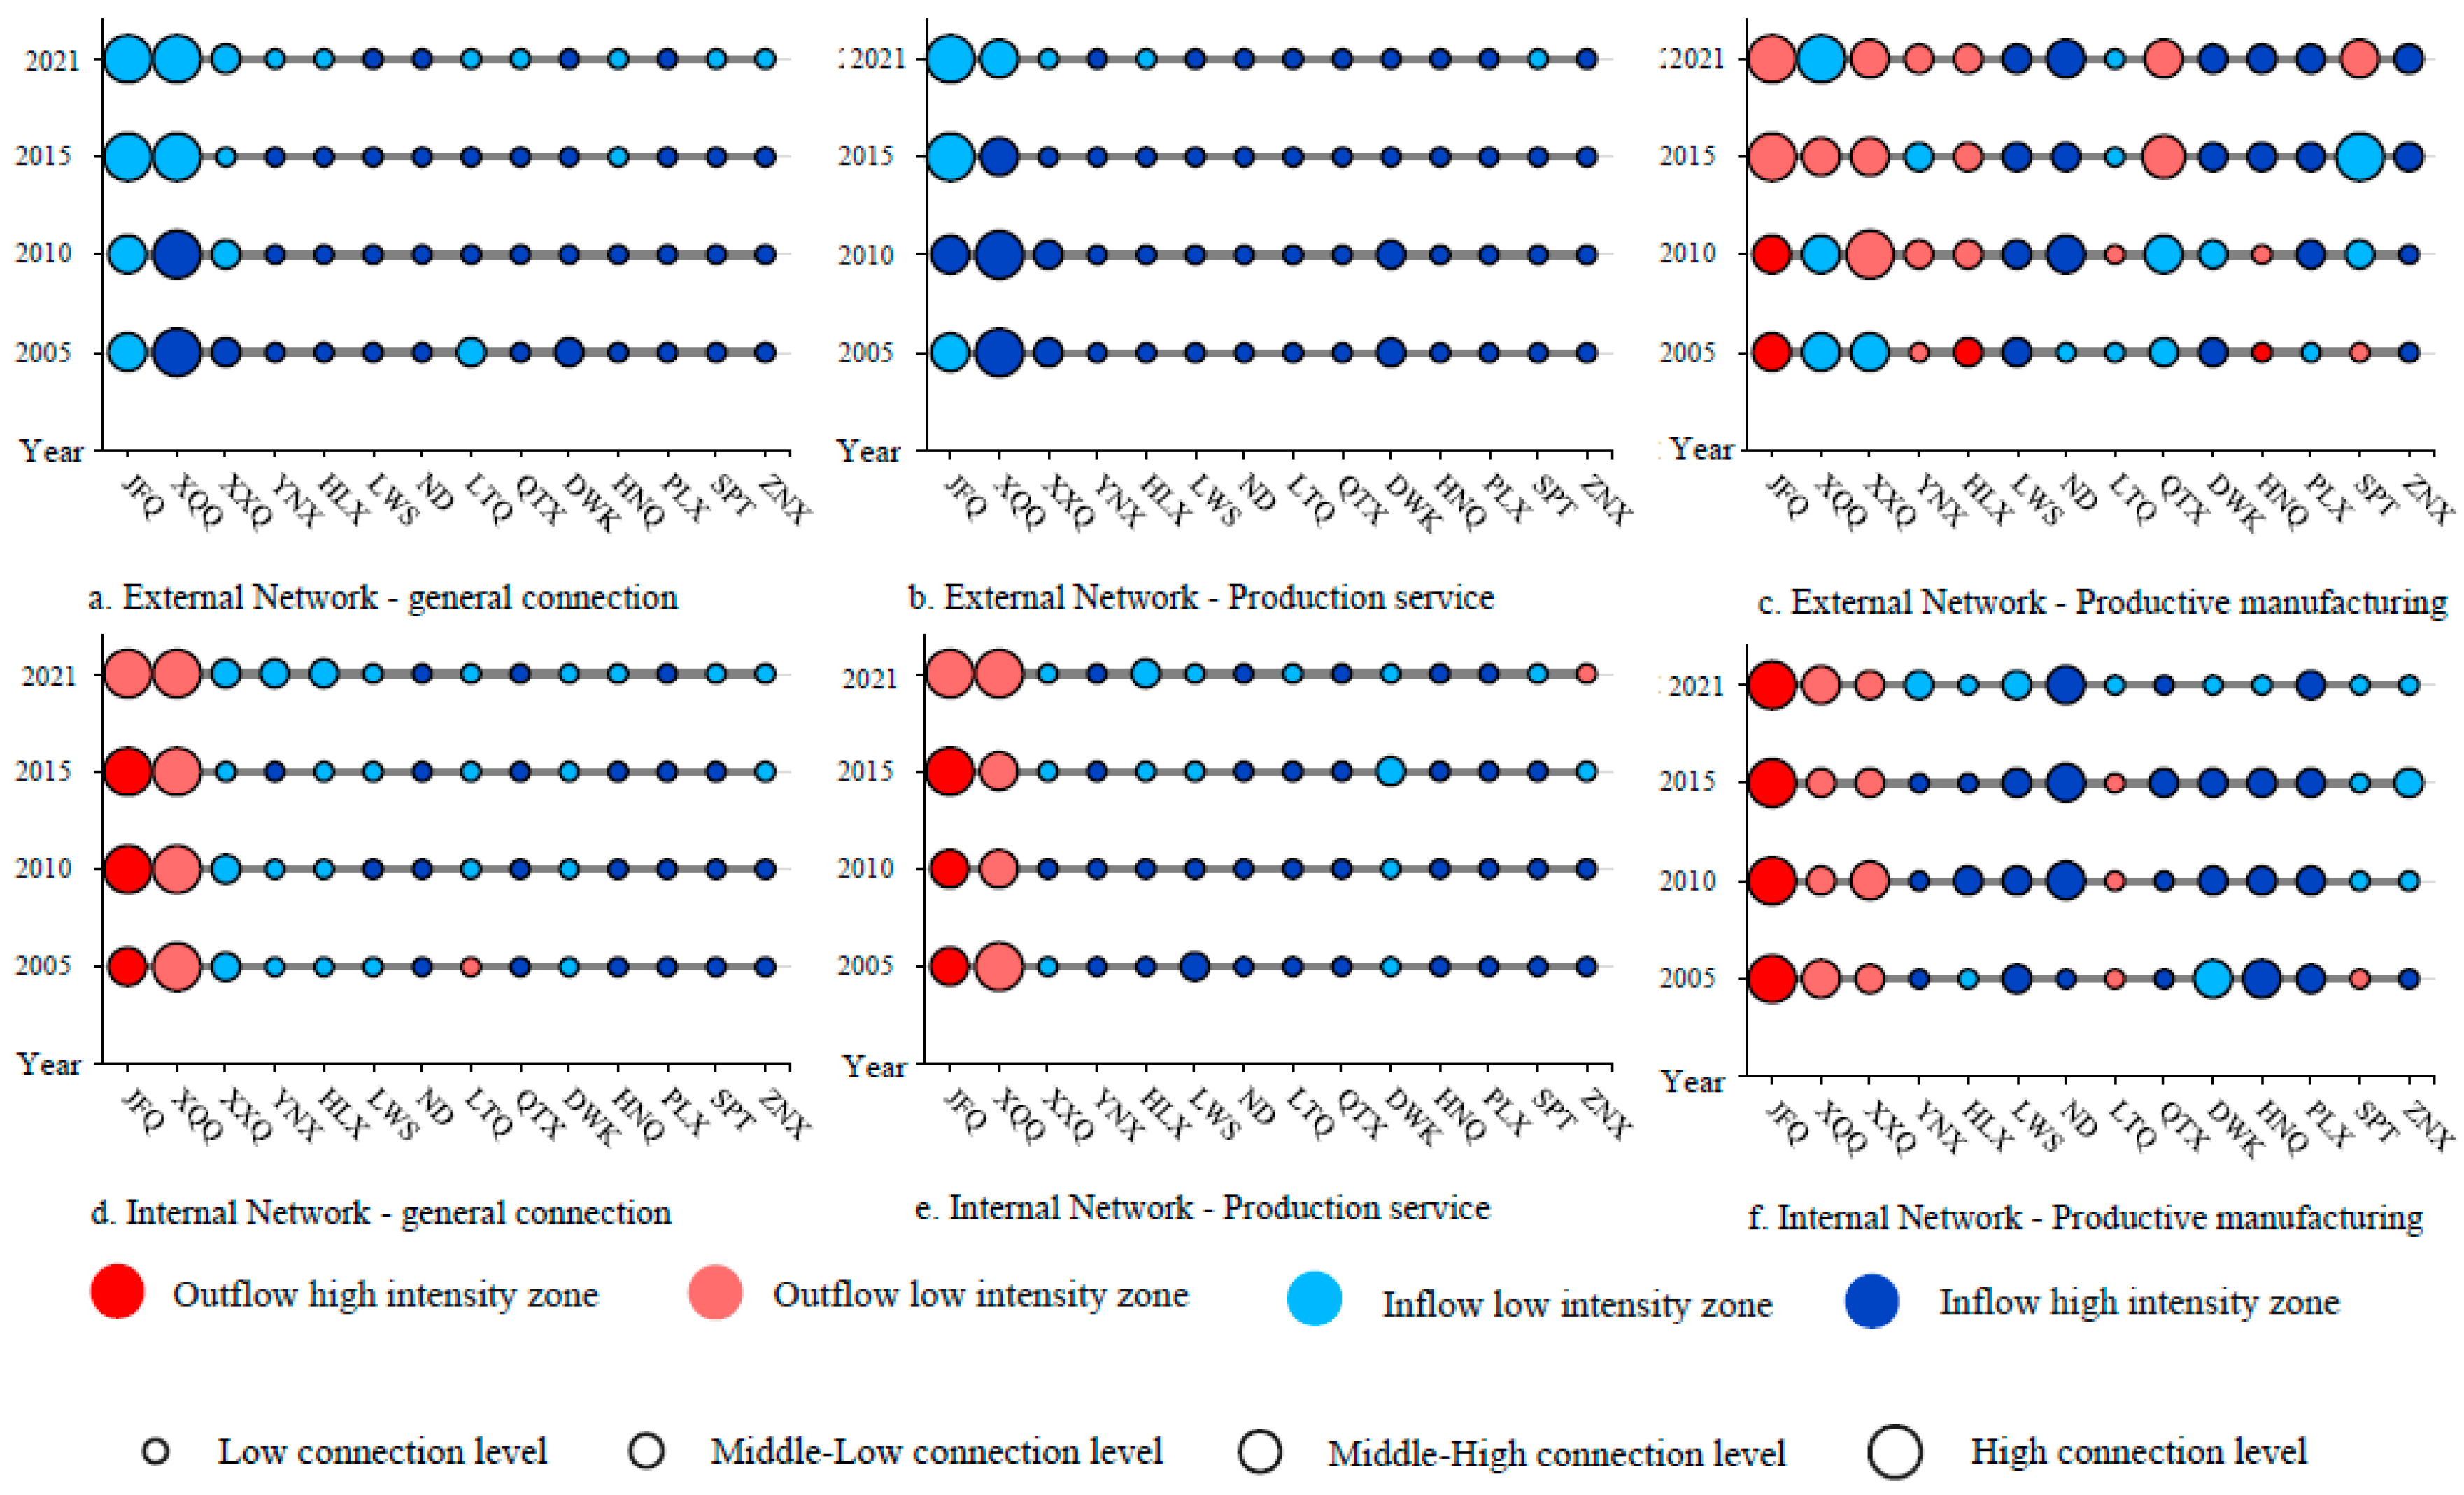
The dominant connections direction and the urban connectivity for each node in the external-internal network were calculated (Figure 12). The dominant connections direction is classified into Outflow high intensity zone (NSIi∈[0, 0.5)), Outflow low intensity zone (NSIi∈[0.5, 1.0)), Inflow low intensity zone (NSIi∈[1.0, 1.5)), and Inflow high intensity zone (NSIi∈[1.5, 2.0)). The urban connectivity is classified into Low connection level (Ii∈[0, 0.5)), Middle-Low connection level (Ii∈[0.5, 1.0)), Middle-High connection level (Ii∈[1.0, 1.5)), and High connection level (Ii∈[1.5, 2.0)).
In the external network, the Ningxia Urban Agglomeration along the Yellow River is still in the early stage of development, with the absorption of external elements to cultivate development momentum. In terms of overall connectivity and connectivity of Production service industry, cities are in a state of net inflow, with the attractiveness of Jinfeng and Xingqing far ahead. The urban connectivity of both cities are mainly in the High connection level or Middle-High connection level. The network node connectivity structure in the Productive manufacturing industry exhibits a diverse organizational pattern. While cities enhance their own production and manufacturing capabilities by absorbing external manufacturing elements, they also achieve enterprise outflow through industrial integration. For example, such as Jinfeng, Xixia, Yongning, Helan, Qingtongxia, and Shapotou have transitioned to the Inflow low intensity zone through industry connections.
In the internal network, Jinfeng and Xingqing have always been the radiating sources in the regional network and exert influence on various nodes, but their driving capacity is weak. The division of production management and manufacturing functions has prompted manufacturing enterprises to establish their management departments in Jinfeng and Xingqing, while locating their production departments in Yongning, Lingwu, Ningdong, and Pingluo. This strengthens the control of core cities over other cities in urban connection. Regarding the nodes in a net inflow state, there are two types. The first type is those that maintain considerable exchanges with the core nodes and achieve an upgrade in connectivity (such as Yongning, Helan, and Ningdong). The second type is those that have been in the periphery of internal network connections for a long time, primarily in the Low connection level (such as Huinong, Dawukou, Litong, Qingtongxia, Shapotou, and Zhongning).
Figure 12.
The dominant connections’ direction and urban connectivity of network nodes.
4. Analysis of the influence mechanism of enterprises flow
4.1. Selecting model variables
4.1.1. Social-economic variables
Regarding social-economic variables, regional market demand is an important driving force for promoting cross-domain and cross-city connections for businesses. It includes supply-side innovation demand driven by the development laws of the industry itself, and demand-side innovation demand driven by consumers’ aspirations for a better life. Government management has a significant impact on the development of businesses and reflects the business environment in the region through its management over society. Urban investment activities reflect the intensity of internal urban construction and demonstrate the attractiveness of internal activities to external businesses. The transformational development represents the extent of industrial transformation and adjustment of production structure, which directly affects the construction and strength of relevant business networks. Coordinated development reflects the coordination between urban and rural regions, and the balance or imbalance between regions influences the spatial choices for business layout. So this paper selects urban investment activities (Investment), government management (GOV), market demand (Demand), transition development (Transition), and coordinated development (Coordinate) as the fundamental variables to explore the influence mechanism of external network connections (ProCon) and internal network connections (CityCon) in the Ningxia Urban Agglomeration along the Yellow River (Table 4).
Table 4.
Explanation of related control variables.
| Variables | Description |
| Investment | Reflecting the intensity of internal urban construction, it is (the ratio of regional fixed asset investment / GDP). |
| GOV | Reflecting the intensity of government management over urban development, it is (the local government fiscal expenditure / GDP). |
| Demand | Reflecting the domestic demand of the city, it is (the total social retail sales / GDP). |
| Transition | Reflecting the adjustment of urban production structure, indicators such as energy consumption per unit of GDP, water consumption per unit of GDP, and construction land use per unit of GDP are selected, and the transformation development index is calculated using the entropy method. |
| Coordinate | Reflecting the coordinated development between regions, indicators such as regional income coordination, regional consumption coordination, urban-rural income coordination, and urban-rural consumption coordination are selected (Li Zhejin and Liu Qiang, 2021), and the coordination development index is calculated using the entropy method. |
4.1.2. Borrowing scale variables
Apart from the flow of factors driving the restructuring of regional economic patterns, the borrowing scale is also an important reason for changes in regional economic patterns. The scale effect formed by the agglomeration of economic factors towards core cities strengthens their network power, which enabling small and medium-sized cities to borrow the scale effect of core cities, thereby influencing the construction and expansion of regional network connections. Among them, the Borrowing advanced functions (BroFun) reflects the radiation of urban management and production service functions, the Borrowing economic activity (BroEco) reflects the economic activity spillover in cities, and the Borrowing population (BroPop) reflects the possibility of population flow between cities. The calculation formulas are as follows.
In the formula: BroScalei,t = (BroPopi,t, BroEcoi,t, BroFuni,t). Tij represents the geographical distance between city i and city j. Scalej,t represents the borrowing indicator of city j in the t year. Among them, the Pop represents the total population of city j; the Eco represents the night light density of city j; the Fun is calculated as (the number of Productive service enterprises in city j / the number of Productive manufacturing enterprises in city j) / (the total number of Productive service enterprises in the entire region / the total number of Productive manufacturing enterprises in the entire region)
4.1.3. Geographic spatial agglomeration variable
While enterprises flow emphasizes the factors flow within a city, industrial agglomeration reflects the geographic spatial agglomeration of production factors in a city. These two factors mutually influence each other. Therefore, this paper selects the industrial agglomeration index (Agglomeration) to explore the relationship between spatiality and flow. Given that the commonly used indicator for measuring industrial agglomeration is location entropy, this paper uses location entropy to measure the coordinated agglomeration of Productive service industry and Productive manufacturing industry. The calculation formula is as follows.
In the formula: i = 1, 2, ..., 13, LQP represents the location entropy of Productive manufacturing industry, LQS represents the location entropy of Productive service industry, CC represents the coordinated agglomeration index of Productive manufacturing industry and Productive service industry. epi represents the number of Productive manufacturing enterprises in city i. esi represents the number of Productive service enterprises in city i. ep represents the total number of Productive manufacturing enterprises in the Ningxia Urban Agglomeration along the Yellow River. es represents the total number of Productive service enterprises in the Ningxia Urban Agglomeration along the Yellow River. Ei represents the total number of enterprises in city i, and E represents the total number of enterprises in the Ningxia Urban Agglomeration along the Yellow River.
4.2. Analysis of estimation results
To examine the influence mechanism of advanced function and economic performance on urban network connection, this paper incorporates both factors into the independent variable system. Considering the possibility of a nonlinear effect of economic performance on different network connections, the squared of lnEco is introduced for comparative validation. In order to verify the credibility of the results and the robustness of the model, this paper presents the estimation results of SDM with geographic distance matrix and economic distance matrix (Table 5). It can be seen that the spatial lag coefficients of SDM models for CityCon and ProCon are significantly positive. This indicates that the network connectivity of a city under enterprise flow is influenced by the network connectivity of surrounding cities, further confirming the significant presence of spatial spillover effects in the urban network connection of the Ningxia Urban Agglomeration along the Yellow River.
Comparing the estimation results of the models, both lnFun and lnBroFun are significantly positive at the 1% level. This indicates that the enhancement and diffusion of urban management and service function can optimize the regional production service environment, stimulate internal enterprises flow, and enhance attractiveness to external enterprises. In the internal network connectivity, lnEco is significantly positive at the 1% level, while (lnEco)2 is significantly negative at the 1% level. This suggests that the improvement in economic performance within a certain range can promote the development of urban network connectivity. However, under the scenario of internal network imbalanced development, further improvement in economic performance would magnify the agglomeration shadow effect of core cities on other cities, exhibiting an inverted "U-shaped" relationship. However, it shows a "U-shaped" relationship in the external network connectivity. This is because the Ningxia Urban Agglomeration along the Yellow River belongs to a typical resource-based city region, and the mid-term industrial restructuring and green development transformation have disrupted the traditional industrial development pattern and challenged the existing perceptions. This has also caused temporary negative impacts on urban network connectivity. For example, lnTransition shows a significant negative impact, which serves as a supplementary explanation for this phenomenon. However, the overall regional green development will align with the layout of new external industries, promoting the derivation and expansion of new enterprise connections. Similarly, in the context of significant disparities in regional urban development and differentiated connectivity, peripheral cities find it difficult to borrow the economic performance of core cities. However, core cities will continue to attract the developmental elements of peripheral cities and cast an agglomeration shadow over them. The significant negative effect of Borrowing economic activity at the 1% level also indicates that an imbalanced development pattern has a negative impact.
Regarding the influence mechanism of other factors, market demand and coordinated development demonstrate significant promoting effects. On one hand, as the region is in the primary stage of development, there is great potential for local market growth. Economic development demand plays a crucial role in facilitating regional enterprises flow. On the other hand, coordinated development facilitates the realization of a balanced spatial development pattern in the region. This serves as an important prerequisite for promoting equalized flows within the regional network. Furthermore, in the internal network connectivity, the impact of urban investment activities is significantly negative. This is due to the relatively limited direction of internal network connectivity and the imperfect structure of connections. Under an imbalanced development pattern, the driving effect of urban investment activities is confined within the city itself, thereby restraining the enterprise flow within the region. The significant positive impact of government regulation indicates that efficient government management activities can improve the urban business environment, which is beneficial for attracting investments from other cities.
Table 5.
Regression results of the SDM models on urban network connection.
| Variables | CityCon | ProCon | ||||||
| GD weigh | ED weigh | GD weigh | ED weigh | GD weigh | ED weigh | GD weigh | ED weigh | |
| lnFun | 0.246*** | 0.336*** | 0.302*** | 0.405*** | ||||
| (0.089) | (0.089) | (0.075) | (0.071) | |||||
| lnEco | 2.740*** | 3.054*** | -1.762*** | -1.548*** | ||||
| (0.607) | (0.579) | (0.506) | (0.457) | |||||
| (lnEco)2 | -0.474*** | -0.523*** | 0.321*** | 0.288*** | ||||
| (0.100) | (0.094) | (0.083) | (0.075) | |||||
| lnBroFun | 1.516*** | 1.512*** | 0.788*** | 0.847** | ||||
| (0.453) | (0.495) | (0.188) | (0.349) | |||||
| lnBroEco | -2.215*** | -2.352*** | -1.163*** | -1.056*** | ||||
| (0.766) | (0.789) | (0.333) | (0.278) | |||||
| lnBroPop | 0.277 | 0.279 | 0.402 | 0.255 | ||||
| (0.252) | (0.259) | (0.259) | (0.298) | |||||
| lnInvestment | -0.112*** | -0.102*** | -0.115*** | -0.094** | -0.091*** | -0.066** | -0.031 | -0.016 |
| (0.038) | (0.038) | (0.034) | (0.042) | (0.032) | (0.030) | (0.030) | (0.058) | |
| lnGOV | 0.113*** | 0.114*** | 0.107*** | 0.092** | 0.033 | 0.035 | -0.013 | -0.010 |
| (0.034) | (0.033) | (0.035) | (0.037) | (0.028) | (0.026) | (0.031) | (0.054) | |
| lnConsumption | 0.281*** | 0.283*** | 0.210*** | 0.263*** | 0.199*** | 0.202*** | 0.165*** | 0.153*** |
| (0.051) | (0.051) | (0.079) | (0.064) | (0.043) | (0.040) | (0.051) | (0.044) | |
| lnTransition | 0.011 | 0.022 | -0.149** | -0.153** | -0.095** | -0.082** | -0.161*** | -0.149*** |
| (0.052) | (0.053) | (0.072) | (0.073) | (0.044) | (0.042) | (0.042) | (0.056) | |
| lnCoordination | 0.217*** | 0.243*** | 0.086* | 0.060 | 0.224*** | 0.212*** | 0.214*** | 0.190*** |
| (0.065) | (0.067) | (0.048) | (0.072) | (0.054) | (0.053) | (0.058) | (0.045) | |
| ρ/θ | 0.013*** | 0.013*** | 0.012*** | 0.012*** | 0.009*** | 0.008*** | 0.010*** | 0.009*** |
| (0.001) | (0.001) | (0.002) | (0.002) | (0.001) | (0.001) | (0.001) | (0.002) | |
| Number | 208 | 208 | 208 | 208 | 208 | 208 | 208 | 208 |
| R2 | 0.378 | 0.462 | 0.278 | 0.280 | 0.811 | 0.794 | 0.117 | 0.141 |
Note: GD weigh is geographic distance weight matrix, ED weigh is economic distance weight matrix.Values in parentheses are standard deviations. ***, **, * indicate significant at the 1%, 5%, and 10% levels, respectively, and all the following are the same.
4.3. Spatial effect decomposition
Further decomposing the direct effect, indirect effect, and total effect of each explanatory variable on external-internal network connectivity in the SDM models (Table 6), the spatial effect mechanisms of each variable can be observed. The Borrowing advanced functions not only directly enhances the network connectivity within the city itself in the internal network, but also stimulates the network connectivity of surrounding cities in both the internal and external networks. However, under the scenario of imbalanced development, the Borrowing economic activity has a negative inhibitory effect on both the internal and external connectivity of the city itself and surrounding cities. Additionally, the Borrowing population tends to concentrate population resources in core cities, and the scarcity of labor force and talent affects the external network connectivity of surrounding cities. The driving effect of market demand is reflected in the direct effect within the internal network and the indirect effect within the external network. The negative impact of transformation and development is manifested in the direct effect within the internal network, and the indirect effect within the external network. Coordinated development directly promotes the connectivity of the city itself within both the internal and external networks. In the internal network connectivity, the negative effect of urban investment activities is obvious in the direct effect. A efficient government management not only enhances the city’s network connectivity but also generates positive spatial spillover effects.
Table 6.
Decomposed spatial effects of factors of urban network connection.
| Variables | CityCon | ProCon | ||||
| Direct effect | Indirect effect | Total effect | Direct effect | Indirect effect | Total effect | |
| lnBroFun | 1.214*** | 3.086** | 4.300*** | 0.502 | 4.213*** | 4.715*** |
| (0.361) | (1.398) | (1.665) | (0.372) | (1.473) | (1.500) | |
| lnBroEco | -1.590** | -6.167*** | -7.757*** | -0.942*** | -3.242* | -4.185** |
| (0.638) | (2.053) | (2.571) | (0.195) | (1.689) | (1.788) | |
| lnBroPop | 0.126 | 1.348 | 1.474* | 0.585 | -2.598*** | -2.013*** |
| (0.306) | (0.880) | (0.758) | (0.359) | (0.574) | (0.620) | |
| lnInvestment | -0.118*** | 0.038 | -0.080 | -0.035 | 0.134 | 0.099 |
| (0.033) | (0.170) | (0.165) | (0.051) | (0.166) | (0.188) | |
| lnGOV | 0.071** | 0.313*** | 0.384*** | -0.019 | 0.043 | 0.024 |
| (0.033) | (0.101) | (0.103) | (0.050) | (0.135) | (0.164) | |
| lnConsumption | 0.237*** | -0.163 | 0.074 | 0.099 | 0.926*** | 1.024*** |
| (0.085) | (0.354) | (0.336) | (0.063) | (0.249) | (0.269) | |
| lnTransition | -0.159** | 0.024 | -0.135 | -0.100** | -0.864*** | -0.964*** |
| (0.080) | (0.359) | (0.332) | (0.049) | (0.314) | (0.294) | |
| lnCoordination | 0.079* | 0.057 | 0.136 | 0.214*** | -0.007 | 0.208 |
| (0.061) | (0.222) | (0.200) | (0.048) | (0.228) | (0.219) | |
4.4. Geographical agglomeration effect
Based on socio-economic variables, this paper incorporates the industry agglomeration index and demonstrates its spatial effect mechanism on the enterprises flow in different network (Table 7). As shown in the table, industry agglomeration significantly promotes the enterprises flow within the internal and external networks. This positive effect is not only reflected in the direct effect within the internal network, but also generates spatial driving effects on the enterprises flow in surrounding cities. This also indicates that the enterprises flow tends to occur in regions where Productive service industry and Productive manufacturing industry develop in synergy, rather than in a single city. Driven by agglomeration development, the population, enterprises, and capital of the region further concentrate towards the core cities, forming a leading development pattern of dominant cities. The polarizing effect within the urban agglomeration weakens the gains brought by the diffusion effect. Under the continued strong suction effect and the imperfect urban network system, the rational allocation of regional production factors and the optimization of geographical agglomeration spatial patterns can effectively promote the enterprises flow in different networks. This reflects that the synergistic development among cities within the urban agglomeration is an important measure to facilitate urban network connectivity.
Table 7.
Decomposed spatial effects of factors of urban network connection.
| Variables | CityCon | ProCon | ||
| GD weigh | ED weigh | GD weigh | ED weigh | |
| lnAgglomeration | 0.958*** | 0.941*** | 0.375*** | 0.270** |
| (0.137) | (0.131) | (0.133) | (0.126) | |
| Direct effect | 0.778*** | 0.815*** | 0.185 | 0.130 |
| (0.200) | (0.203) | (0.228) | (0.223) | |
| Indirect effect | 2.623** | 3.427*** | 2.454* | 2.398 |
| (1.098) | (1.318) | (1.453) | (1.482) | |
| Total effect | 3.401*** | 4.241*** | 2.639* | 2.529* |
| (1.252) | (1.492) | (1.517) | (1.529) | |
| Other variable | Control | Control | Control | Control |
| ρ/θ | 0.012*** | 0.013*** | 0.012*** | 0.012*** |
| (0.001) | (0.001) | (0.002) | (0.001) | |
| Number | 208 | 208 | 208 | 208 |
| R2 | 0.007 | 0.002 | 0.485 | 0.404 |
5. Conclusions and Discussions
5.1. Conclusions
This paper aims to explore the evolution of urban network connection and the influence mechanism within the Ningxia Urban Agglomeration along the Yellow River from the perspective of enterprises flow. By translating enterprise connections into urban network connections, the paper analyzes the spatio-temporal dynamic characteristics of urban network connections in the external and internal networks. It utilizes SDM model to examine the influence mechanism of socio-economic factors, borrowing scale factors, and geographic agglomeration factors on the urban network connections. The conclusions are as follow.
- (1)
- With analysis of the spatial pattern evolution of external network connections through enterprise flows, the spatial organizational structure of Ningxia Urban Agglomeration along the Yellow River’s outflow investment demonstrates a trend of monopolar outflow from the investment sources and diversified inflows from various destinations. Jinfeng and Xingqing are the core hubs for regional enterprises investments, and the investments mainly flow towards North China, East China, and Northwest China. The overall inflow of enterprises has formed a multi-source structure, with North China as the dominant region and East China as the secondary region. A spatial pattern of enterprise inflow is formed in terms of overall connections and Productive service industry, with Jinfeng and Xingqing at its core. And a spatial organizational pattern driven by multiple cities is formed in the Productive manufacturing industry.
- (2)
- In the internal network, a connection structure centered around Jinfeng and Xingqing has been formed. However, the overall spatial network connections are imbalanced, and the hierarchical system of network nodes is incomplete. In different types of enterprise flows, on one hand, there is a relatively active flow of connections in the Productive service industry, and the driving capacity of core cities is beginning to emerge. On the other hand, the connections in the Productive manufacturing industry are relatively concentrated between Jinfeng, Xingqing, Ningdong, and Lingwu.
- (3)
- In terms of regional network structural characteristics, the external network primarily manifests as absorbing external elements to foster developmental momentum. In terms of overall connections and Productive service industry, each city is in a net inflow state, while in the Productive manufacturing industry, the network node connection structure presents a diversified organizational pattern and achieves a net outflow. In the internal network, Jinfeng and Xingqing serve as connection radiation sources and exert influence on each cities. However, their driving capacity is weak, the main manifestation is that the core nodes maintain a considerable communication with neighboring cities and promote the upgrading of their connection levels. And the radiation does not extend to peripheral cities, keeping them in a weak connectivity.
- (4)
- In terms of the role of socio-economic variables, market demand and coordinated development demonstrate significant promotion effects on both internal network connection and external network connection. The transformation and development exhibit significant negative impacts, which are attributed to the temporary negative effects caused by the inadequate adjustment and transition of industrial structure. The role of urban investment activities and the government management is reflected in the internal network connections. The uneven development pattern of cities restricts the driving effect of urban investment activities to the cities themselves. However, efficient government management is beneficial for creating a favorable business environment and generating positive spatial spillover effects.
- (5)
- In terms of the role of borrowing scale variables, the improvement of urban management and service functions, as well as external borrowing, can optimize the regional production service environment and promote enterprise connections among different network. In the scenario of imbalanced development within the internal network, improving economic activity will amplify the agglomeration shadow effect of core cities on other cities, and will have a negative impact on the enterprise connections in different networks. However, in the external network, economic activity exhibits a U-shaped relationship, which is the result of urban green development transformation and corresponds to the emergence of green industry enterprises.
- (6)
- In terms of the role of geographic spatial agglomeration variable, industrial agglomeration can significantly enhance the internal network connections of cities in different networks and exert spatial driving effects in surrounding cities. This reflects that a rational spatial distribution of production factors can effectively promote the enterprises flow in different networks, and the coordinated development of cities is an important foundation for regional urban network connections.
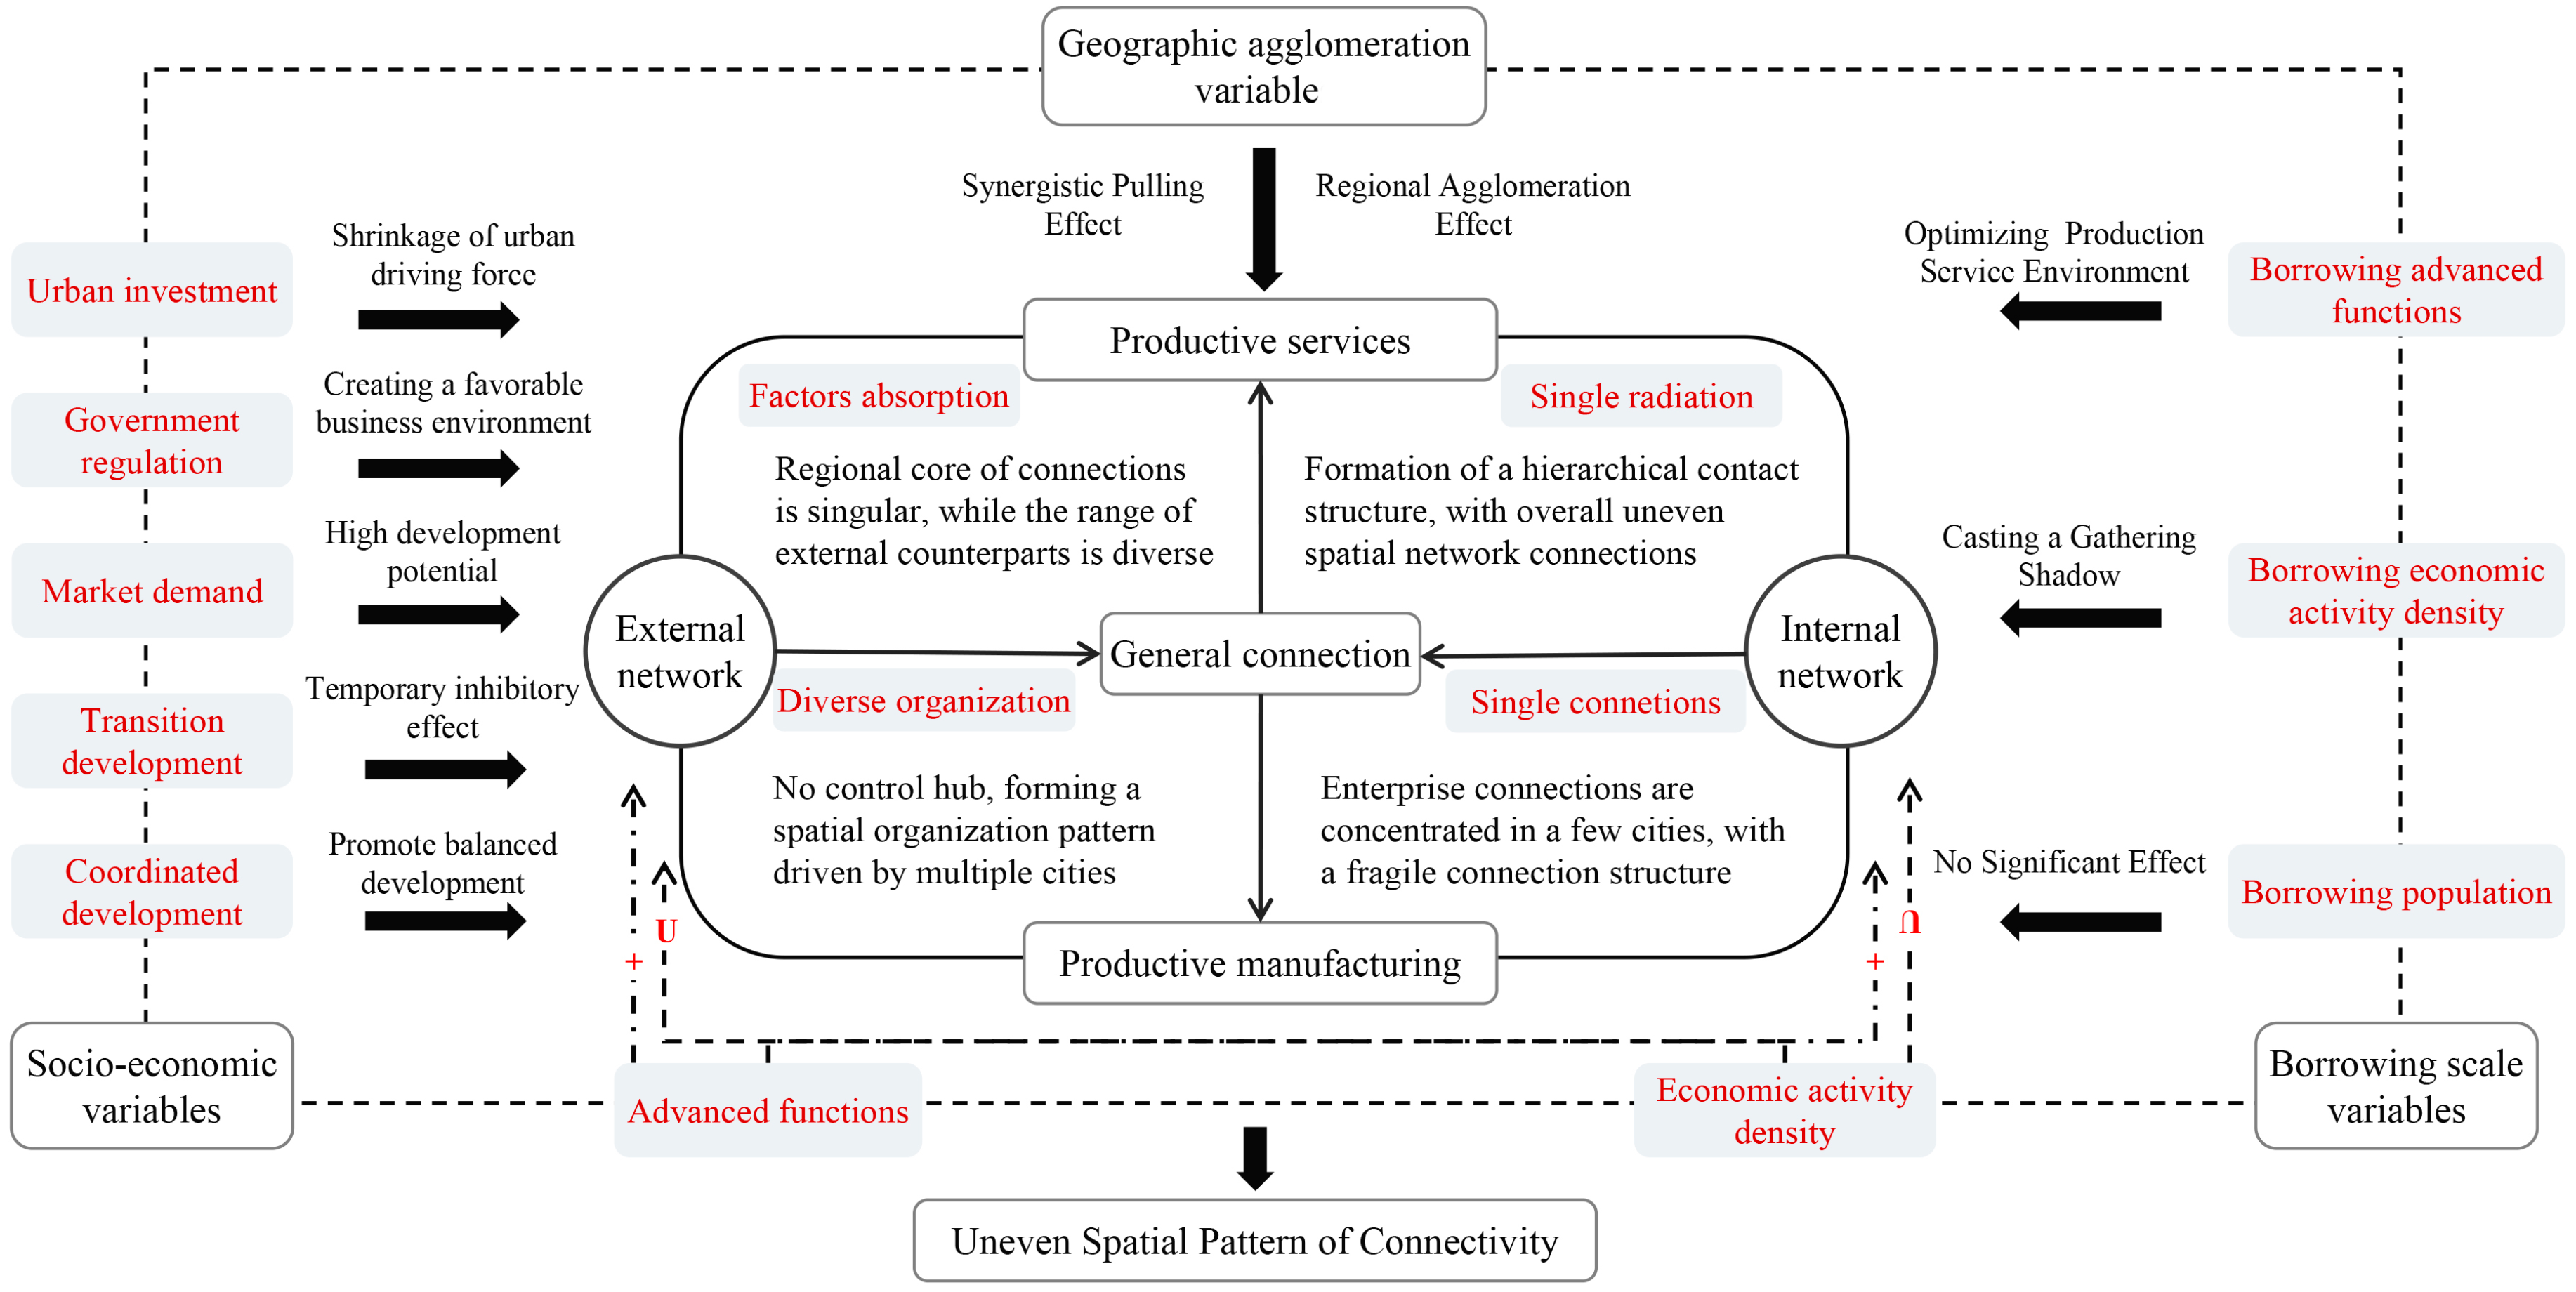
Figure 13.
The connections characteristics and influence mechanisms in the urban network of the Ningxia Urban Agglomeration along the Yellow River.
Figure 13.
The connections characteristics and influence mechanisms in the urban network of the Ningxia Urban Agglomeration along the Yellow River.
5.2. Discussions
With the high-quality development in the Yellow River Basin and execution of the dual-carbon strategy, there are more restrictive requirements being placed on the production of resource-based industries in the upstream areas of the Yellow River, and higher demands are also being made for industrial ecologicalization and coordinated development. In recent years, with the execution of strategies such as the Western Development, industrial transfer, and poverty alleviation, the improvement of infrastructure has enhanced the external connectivity of the Yellow River Basin. The flow of various factors has further integrated multiple regions into cross-regional spatial structures, and network externality have driven the restructuring of urban network spatial patterns, influencing the transformation of regional high-quality development. For the urban agglomerations in the upstream of the Yellow River Basin, facing constraints from geographical environment, significant internal development disparities, inadequate external connectivity, and challenges in industrial transformation, it is need to reexamine the interaction between flow and spatiality from a dynamic, regionally complementary, and networked perspective. This calls for a clear understanding of the regional urban network structure and the process of integration into the national market.
Based on the above research, the uneven urban network connection is the main characteristic of the Ningxia Urban Agglomeration along the Yellow River, and the significant regional development disparities serve as the underlying reality for the imbalanced spatial pattern of connectivity. Research on regions such as the Guangdong-Hong Kong-Macao Greater Bay Area (Xiong Yao and Huang Li, 2019) and the Yangtze River Delta region (Gao Peng et al., 2021) has demonstrated that dense, balanced, and multi-centered regional network connectivity serves as a prerequisite for promoting integrated development. In the future, as the development elements continue to be guided towards the Ningxia Urban Agglomeration along the Yellow River, the watershed-based geographical pattern should emphasize regional coordination and integrated development. From the perspective of network hubs, it is important to strengthen the service center positioning of Jinfeng and Xingqing, promote the internal radiance of service-oriented functions, and enhance external connectivity, thereby supporting the overall development of the urban agglomeration with the support of the Yinchuan Metropolitan Area. From the perspective of network structure, efforts should be made to improve the hierarchical structure of the network, cultivate and enhance the secondary core’s external radiance capacity in Shapotou, Dawukou, and Litong. By strengthening the spatial spillover effects of development elements through an orderly, balanced, and coordinated urban network system, a pivot can be established for the enhancement of spatial overflow effects of development elements. From the perspective of network nodes, it is important to emphasize the functional positioning of each node and highlight their distinctive development characteristics. In terms of network interactions, greater emphasis should be placed on complementary differences in factor flows with neighboring areas and strengthening bidirectional connections with core cities. From the perspective of network flows, it is important to enhance external connections with the Beijing-Tianjin-Hebei urban agglomeration, the Yangtze River Delta urban agglomeration, and the Guangdong-Hong Kong-Macao Greater Bay Area. This involves leveraging regional comparative advantages to attract investment from enterprises in different sectors and improving the attractiveness to medium and large-scale enterprises in the central and eastern regions of China. Internally, it is important to create a favorable business environment for the service industry and integrate manufacturing resources. This will further promote the flow of Productive service industry between adjacent cities, emphasizing differentiated development, and cooperative development of Productive manufacturing industry. Additionally, it is crucial to strengthen the positioning of Ningdong as a manufacturing hub.
Although this paper explores the evolution of the network structure and influence mechanisms of regional urban agglomeration in the upstream of the Yellow River from the perspective of enterprise flows, there exist significant disparities in development among different regions in the Yellow River Basin. It is important to understand the nature of the interactive relationships within different regions, as well as their interactions with neighboring urban agglomerations and other provinces. Furthermore, urban network connectivity exhibits heterogeneity in different industries, directions, and scales. This prompts subsequent research to deepen the analysis of the homogeneity and heterogeneity of urban network connectivity by examining it across different industries, directions, and scales. It is important to extract and summarize the main and branching structure characteristics of factor flows under different scenarios.
References
- Alonso, W. Urban zero population growth. Daedalus 1973, 109, 191–206. [Google Scholar]
- Bentlage, M.; Thierstein, A. Intra firm networks in the German knowledge economy: economic performance of German agglomerations from a relational perspective. European Regional Science Association 2011. [Google Scholar]
- Castells, M. The Rise of Network Society; Blackwell: Oxford, 1996. [Google Scholar]
- Chong, Z.; Pan, S. Understanding the structure and determinants of city network through intra-firm service relationships: The case of Guangdong-Hong Kong-Macao Greater Bay Area. Cities 2020, 103, 102738. [Google Scholar] [CrossRef]
- Chen, X.; Bai, Y.; Song, L.; et al. Comparative Analysis of Economic Link and Network Structure of the Four Urban Agglomerations in the Middle and Upper Yellow River Basin. Areal Research And Development 2021, 40, 18–23. (In Chinese) [Google Scholar] [CrossRef]
- Cheng, Y.; Su, X. Review on the urban network externalities. Progress in Geography 2021, 40, 713–720. [Google Scholar] [CrossRef]
- Chen, X.; Du, J.; Li, Y.; et al. The Structural Evolution And Influencing Factors of urban network in the Yellow River basin from The perspective of High-quality development. Human Geography 2023, 38, 87–96. (In Chinese) [Google Scholar] [CrossRef]
- Derudder, B.; Taylor, P.J. The cliquishness of world cities. Global Networks 2005, 5, 71–91. [Google Scholar] [CrossRef]
- Derudder, B.; Taylor, P.J.; Hoyler, M.; et al. Measurement and interpretation of connectivity of Chinese cities in world city network, 2010. Chinese Geographical Science 2013, 23, 261–273. [Google Scholar] [CrossRef]
- Derudder, B.; Taylor, P.J. Central flow theory: Comparative connectivities in the world-city network. Regional Studies 2018, 52, 1029–1040. [Google Scholar] [CrossRef]
- Das, S.P. City connectivity via global intra-firm linkages: An analysis of Indian cities. Journal of International Development 2023, 35, 312–330. [Google Scholar] [CrossRef]
- Friedmann, J. The world city hypothesis. Development and Change 1986, 17, 69–83. [Google Scholar] [CrossRef]
- Fuller, C.; Phelps, N.A. Revisiting the multinational enterprise in global production networks. Journal of Economic Geography 2018, 18, 139–161. [Google Scholar] [CrossRef]
- Gao, P.; He, D.; Ning, Y.; et al. Spatio-temporal dynamics and factors of urban investment linkage level in the Yangtze River Delta. Geographical Research 2021, 40, 2760–2779. (In Chinese) [Google Scholar] [CrossRef]
- Hall, P.; Pain, K. The polycentric metropolis: Learning from mega-city regions in Europe. Routledge 2006. [Google Scholar]
- Hoyler, M. External relations of German cities through intra-firm networks—A global perspective. Raumforschung und Raumordnung Spatial Research and Planning 2011, 69, 147–159. [Google Scholar] [CrossRef]
- Hu, G.; Lu, Y.; Wu, X.; et al. Study On The Urban Networkers Structure and its Changing Characteristics of The Yangtze River Economic Belt: based on Inter-Firm Linkages. Human Geography 2021, 36, 146–154. (In Chinese) [Google Scholar] [CrossRef]
- Indraprahasta, G.S.; Derudder, B. The geographically variegated connections of the Jakarta metropolitan area as produced by manufacturing firms. Growth and Change 2019, 50, 705–724. [Google Scholar] [CrossRef]
- Krätke, S. Global pharmaceutical and biotechnology firms’ linkages in the world city network. Urban Studies 2014, 51, 1196–1213. [Google Scholar] [CrossRef]
- Lüthi, S.; Thierstein, A.; Goebel, V. Intra-firm and extra-firm linkages in the knowledge economy: The case of the emerging mega-city region of Munich. Global networks 2010, 10, 114–137. [Google Scholar] [CrossRef]
- Li, T.; Zhou, R.; Zhang, Y.; et al. Measuring functional polycentricity of China’s urban regions based on the interlocking network model, 2006–15. Singapore Journal of Tropical Geography 2018, 39, 382–400. [Google Scholar] [CrossRef]
- Lin, B.; Gu, R.; Wang, J.; et al. From Agglomeration Externalities to Network Externalities of Crossing Borders: Frontier Progress of Agglomeration Economics. Urban Development Studies 2018, 25, 82–89. (In Chinese) [Google Scholar]
- Lüthi, S.; Thierstein, A.; Hoyler, M. The world city network: Evaluating top-down versus bottom-up approaches. Cities 2018, 72, 287–294. [Google Scholar] [CrossRef]
- Lu, J.; Mao, W. The Rise of Urban Network Eyxternalities: A New Mechanism for the High-quality Integrated Development of Regional Economy. Economist 2020, 2020, 62–70. (In Chinese) [Google Scholar] [CrossRef]
- Liu, L.; Liang, L.; Gao, P.; et al. Coupling relationship and interactive response between ecological protection and high-quality development in the Yellow River Basin. Journal of Natural Resources 2021, 36, 176–195. [Google Scholar] [CrossRef]
- Li, Z.; Liu, Q. Research on the impact of information flow on high-quality economic development and its spatial effects. Statistics & Decision 2021, 37, 97–100. (In Chinese) [Google Scholar] [CrossRef]
- Martinus, K.; Sigler, T.J. Global city clusters: Theorizing spatial and non-spatial proximity in inter-urban firm networks. Regional studies 2018, 52, 1041–1052. [Google Scholar] [CrossRef]
- Ma, L.; Xiu, C.; Feng, X. Urban Network Characteristics in the Three Provinces of the Northeastern China Based on Headquarter-affiliate Enterprises Connection. Scientia Geographica Sinica 2019, 39, 1129–1138. (In Chinese) [Google Scholar] [CrossRef]
- Ozuduru, B.H.; Webster, C.J.; Chiaradia, A.J.F. Associating street-network centrality with spontaneous and planned subcentres. Urban Studies 2021, 58, 2059–2078. [Google Scholar] [CrossRef]
- Pan, F.; Bi, W.; Liu, X.; et al. Exploring financial centre networks through inter-urban collaboration in high-end financial transactions in China. Regional Studies 2018a, 54, 162–172. [Google Scholar] [CrossRef]
- Pan, F.; He, Z.; Sigler, T.; et al. How Chinese financial centers integrate into global financial center networks: An empirical study based on overseas expansion of Chinese financial service firms. Chinese Geographical Science 2018b, 28, 217–230. [Google Scholar] [CrossRef]
- Qiu, Y.; Zhong, Y.; Liu, P.; et al. Research on the innovative network of Guangzhou,Dongguan and Shenzhen in the context of the Guangdong-Hong Kong-Macao Greater Bay Area development. City Planning Review 2021, 45, 31–41. (In Chinese) [Google Scholar]
- Sassen, S. The global city; Princeton University Press: USA, 1991. [Google Scholar]
- Scholvin, S.; Breul, M.; Diez, J.R. Revisiting gateway cities: Connecting hubs in global networks to their hinterlands. Urban Geography 2019, 40, 1291–1309. [Google Scholar] [CrossRef]
- Sigler, T.; Neal, Z.P.; Martinus, K. The brokerage roles of city-regions in global corporate networks. Regional Studies 2021, 57, 239–250. [Google Scholar] [CrossRef]
- Taylor, P.J. Specification of the world city network. Geographical analysis 2001, 33, 181–194. [Google Scholar] [CrossRef]
- Taylor, P.J.; Derudder, B.; Faulconbridge, J.; et al. Advanced producer service firms as strategic networks, global cities as strategic places. Economic Geography 2014, 90, 267–291. [Google Scholar] [CrossRef]
- Tao, M.; Huang, Y.; Tao, H. Urban network externalities, agglomeration economies and urban economic growth. Cities 2020, 107, 102882. [Google Scholar] [CrossRef]
- Wu, K.; Fang, C.; Zhao, M. The spatial organization and structure complexity of Chinese intercity networks. Geographical Research 2015, 34, 711–728. (In Chinese) [Google Scholar]
- Wang, Y.; Gu, R. The Spatial Structure and Evolution of Yangtze River Delta Urban Network:Analysis Based on Enterprise Connection. Urban Development Studies 2019, 26, 21–29. (In Chinese) [Google Scholar]
- Waiengnier, M.; Van Hamme, G.; Hendrikse, R. Metropolitan geographies of advanced producer services: Centrality and concentration in Brussels. Tijdschrift voor economische en sociale geografie 2020, 111, 585–600. [Google Scholar] [CrossRef]
- Wang, L.; Qi, D.; Liu, W.; et al. Analysis of Urban Network Relationship from the Perspective of listed parents and Subsidiary Enterprises —— A Case Study Liaoning Province. Resource Development & Market 2021, 37, 1186–1191. (In Chinese) [Google Scholar]
- Wu, K.; Yao, C. Exploring the association between shrinking cities and the loss of external investment: An intercity network analysis. Cities 2021, 119, 103351. [Google Scholar] [CrossRef]
- Wang, R.; Liu, Y.; Wang, C.; et al. Study on the economic connection and network structure evolution of the Yellow River Basin. World Regional Studies 2022, 31, 527–537. (In Chinese) [Google Scholar] [CrossRef]
- Xiong, Y.; Huang, L. Spatio-temporal evolution of urban network in the Guangdong-Hong Kong-Macao Greater Bay Area —— Based on listed company organization relations. World Regional Studies 2019, 28, 83–94. (In Chinese) [Google Scholar] [CrossRef]
- Ye, L.; Duan, X. City network structure of the Yangtze River Delta region based on logistics enterprise network. Progress in Geography 2016, 35, 622–631. (In Chinese) [Google Scholar] [CrossRef]
- Yin, D.; Yu, H.; Lu, Y.; et al. Spatial pattern evolution of territorial space and its effects on ecological response in the Yellow River Basin during 2000-2020 Transactions of the Chinese Society of Agricultural Engineering. Transactions of the Chinese Society of Agricultural Engineering 2023, 39, 217–228. (In Chinese) [Google Scholar] [CrossRef]
- Zhang, X. Multiple creators of knowledge-intensive service networks: A case study of the Pearl River Delta city-region. Urban Studies 2018a, 55, 2000–2019. [Google Scholar] [CrossRef]
- Zhang, X.; Li, Y.; Yuan, Y. Behind the scenes: The evolving urban networks of film production in China. Urban Geography 2018b, 39, 1510–1527. [Google Scholar] [CrossRef]
- Zhang, X.; Wu, S.; Xu, J. Evolution of the Urban Network Spatial Structure in Yangtze River Delta: Based on Enterprise Connections. Journal of Nantong University (Social Sciences Edition) 2021, 37, 33–42. (In Chinese) [Google Scholar]
- Zhao, J.; Zhang, X.; Ren, J.; et al. Spatial structure and influencing factors of urban network in the Yellow River Basin based on multiple flows. Scientia Geographica Sinica 2022, 42, 1778–1787. (In Chinese) [Google Scholar] [CrossRef]
Disclaimer/Publisher’s Note: The statements, opinions and data contained in all publications are solely those of the individual author(s) and contributor(s) and not of MDPI and/or the editor(s). MDPI and/or the editor(s) disclaim responsibility for any injury to people or property resulting from any ideas, methods, instructions or products referred to in the content. |
© 2023 by the authors. Licensee MDPI, Basel, Switzerland. This article is an open access article distributed under the terms and conditions of the Creative Commons Attribution (CC BY) license (http://creativecommons.org/licenses/by/4.0/).
Copyright: This open access article is published under a Creative Commons CC BY 4.0 license, which permit the free download, distribution, and reuse, provided that the author and preprint are cited in any reuse.


