
Submitted:
26 June 2023
Posted:
26 June 2023
You are already at the latest version
Abstract
Shape of supracondylar fracture of the humeral of pediatric patients is analysed with Procrustes method. XR–images of fractures are considered both in anterio-posterior (AP) view (66 images) and in a lateral (L) view (24 images). Applying Procrustes method for both views mean images are constructed and compared. Variability of shapes is quantified with a shape principal component analysis. Non-parametric tests (permutational and bootstrap) do not indicate statistical difference between Procrustes mean shapes in anterio-posterior and lateral projections. It is shown, however, that AP and L shapes of humeral fractures differ in their variability quantified by shape principal components.
Keywords:
supracondylar humeral fractures
; children
; statistical image analysis
; Procrustes method
1. Introduction
The ongoing advancements in technology and theoretical methodologies have propelled medical imaging to become an essential tool in contemporary medicine [1,2]. Among these imaging techniques, plain radiography, despite its simplicity and long-standing history, continues to hold a prominent position in the diagnosis and treatment of bone fractures, making it an indispensable preliminary diagnostic modality (Johnson, 2018). Plain radiographs are particularly valuable in the context of surgical interventions as they facilitate basic preoperative planning, including the classification of bone fractures and the determination of appropriate treatment approaches [3]. Consequently, radiography has gained significant attention within the field of orthopedic surgery [4].
The supracondylar fracture of the humeral stands as the predominant injury in the pediatric population [5], constituting approximately 16% of all fractures in children [6,7,8]. Furthermore, it accounts for more than 60% of all elbow fractures among children [9,10,11]. The primary mechanism of this fracture type typically involves an extension-type injury, which transpires when a child experiences a fall on an outstretched hand, with the elbow fully extended and an abduction occurring at the shoulder joint [12]. Remarkably, this specific subtype of supracondylar fracture constitutes a significant majority, representing approximately 97-99% of all cases [9,13,14,15,16]. In certain circumstances, the morphological characteristics of the injury displayed in medical images become of particular interest [17,18]. The shape of a fracture associated with an injury can serve as a valuable example. Understanding the specific characteristics of the fracture shape not only helps deduce the mechanism by which the injury occurred but also aids in treatment planning [19]. This inherent interest in studying fracture shapes stems from the natural desire to gain insights into injury mechanisms and optimize treatment strategies. Additionally, the growing importance of preoperative modeling for bone reconstruction further emphasizes the significance of fracture shape analysis [3].
Recognizing that every image represents a unique set of data, there is an ongoing endeavor to enhance specialists’ knowledge and expertise through the utilization of automated computer-based tools. These tools predominantly emerge from the data science community, aiming to provide support and augment the capabilities of medical professionals The application of statistical shape analysis in orthopedic problems [4,20,21,22,23] is driven by a compelling realization. On one hand, the shapes of fractures observed in radiological images originate from the same population. However, on the other hand, these shapes exhibit variations that are subject-specific, posing a challenge in accurately describing shape variability. To address this challenge, one of the objectives, formalized within the framework of statistics [24,25], is to construct a mean shape characterized by population-averaged parameters. Subsequently, the subject-specific variation of this mean shape can be investigated by considering random effects. A key characteristic of shape is its invariance to translation, rotation, and size transformations. To remove irrelevant shape features, the Procrustes model [26] has been proposed, leading to the development of Procrustes analysis, which involves matching configurations based on similarity measures.
2. Materials and Methods
We conducted a study involving 66 radiographic (XR) images captured in the anterio-posterior (AP) view and 24 images taken in the lateral (L) view of supracondylar fractures of the humeral in pediatric patients who were admitted to the Pediatric Trauma-Orthopedic Department. To analyze the shapes of these fractures, we employed Procrustes analysis, which allowed us to eliminate irrelevant shape features. Each fracture was described using a set of 10 scientific landmarks that were assigned by an expert. These landmarks were further encoded into a configuration matrix X, which was assumed to be invariant under location, rotation, and isotropic scaling (Euclidean similarity transformations) [27]. Procrustes matching [19,28,29], as summarized in Ref. [27] and applied in this study, involved registering all shapes (fractures) to their optimal positions by applying translation, rotation, and rescaling operations. This was achieved by minimizing the sum of squared Euclidean distances between the shapes. By doing so, we estimated the mean shape denoted as or the Procrustes mean shape [27]. Estimating the mean shape was complemented by determining the structure of shape variability.
To ensure the utilization of open-source and freely available computational tools, we made a deliberate choice for our study. The initial preparation of images was conducted using the Python ’skimage’ package. Scientific landmarks for each fracture were extracted from the XR images, as shown in (Figure 1), using the ’FigureCanvasBase.mpl-connect’ method from the Matplotlib library. Procrustes analysis was performed using the ’shapes R-package and the ’procGPA’ function [30]. The landmarks used in our analysis can be accessed through the Data Availability Statement provided below.
For cubic spline interpolation of mean shapes presented in (Figure 3), we utilized the "interpolate" module from the SciPy package. The PCA analysis shown in Figure 4) and (Figure 5) was conducted using the "shapepca" function from the aforementioned "shapes" R-package [27,30]. Statistical comparisons of mean shapes between the AP and L views were performed using non-parametric methods, employing permutations and bootstrapping techniques through the "resampletest" function available in the "shapes" R-package.
3. Results
Our dataset comprises a total of 66 XR images in the anterio-posterior (AP) view and 24 XR images in the lateral (L) view, as illustrated in Figure 1. In our analysis, we employ a set of "scientific landmarks" (as defined in Ref. [27]) that constitute the shape of a fracture, as depicted in Figure 1. Specifically, we select 10 landmarks for each fracture. This approach of using a relatively large number of landmarks helps to mitigate potential biases that may arise from an expert’s subjective selection of specific landmarks. Consequently, our strategy ensures a quasi-random and uniform selection of landmarks. By digitizing the shape of a fracture using these scientific landmarks, our objective is to construct and analyze the mean shape for both the anterio-posterior (AP) and lateral (L) projections.
3.1. Mean Shape of Humeral Fracture
Our initial objective is to construct a mean (typical) shape for humeral fractures in both the anterio-posterior (AP) and lateral (L) views. In formal terms, a shape, denoted as X, belongs to a shape space M, which is a subset of the real Cartesian product, i.e., , where represents the number of landmarks in each 2-dimensional image [27]. By identifying and selecting k = 10 scientific landmarks (as defined in Ref. [27]) from each XR image (66 in the AP view and 24 in the L view, as shown in Figure 1), we can construct a sample set of shapes, presented in the left panels of Figure 2, for both the AP and L views. The technical details of landmark extraction, utilizing Python’s "skimage" and Matplotlib tools, are summarized in the Methods section.
The observed differences in shapes, as shown in Figure 2, arise not only from the distinct characteristics of the corresponding fractures but also from technical factors and circumstances related to the radiographic imaging process. These differences can be attributed to variations in factors such as patient age or minor positional variations during the radiography procedure. However, it is crucial to note that all unwanted and artificial features in the analyzed XR images become irrelevant and can be disregarded with the application of the Procrustes method, as employed in this study, to construct the mean fracture shapes. The Procrustes mean shapes, derived from the analysis, are presented in the right panels of Figure 2.
The mean shapes of fractures in the AP and L views are compared in Figure 3. To enhance the visualization and facilitate further analysis, the Procrustes mean shapes are accompanied by cubic spline interpolation. This interpolation technique ensures mathematical continuity and enables the examination and discussion of shape features that require smoothness, such as the convexity of shapes, which can be assessed by analyzing the second derivative. From the observations in Figure 3, it can be inferred that the convexity of the mean shapes does not significantly depend on the projection (AP or L), with only minor local variations. To assess the statistical significance of the differences between the mean shapes in the AP and L views, there are specific methods, such as significance tests, that can be employed [27]. These tests allow for the determination of whether the mean shapes in the AP and L views are statistically similar or different.
In this particular case, it is unlikely that parametric methods would provide reliable results since the sets of landmarks rarely satisfy the normality assumptions. Therefore, non-parametric counterparts of standard statistical methods are more appropriate and were applied in our analysis. The non-parametric methods, based on permutations or bootstrap resampling, were used to compare the mean shapes in the AP and L projections. The results obtained from these methods indicate that there is no statistical difference between the mean shapes, i.e., there is no evidence, based solely on p-values, to reject the null hypothesis of .
The statistical tests employed in our analysis are non-parametric versions of Hotelling’s T-squared tests, as described in Ref. [27]. In particular, bootstrap resampling methods were used, which are less restrictive and provide results that are less sensitive to potential violations of the assumptions required for parametric methods. The calculations were performed using the "shapes" R-package [30] and the procedures described in the Methods section above.
3.2. Shape Variability: PCA
To provide a comprehensive description of the humeral fracture shapes, it is important to quantify their variability. A suitable measure for this purpose is the population covariance matrix of the coordinates calculated in the tangent space [27]. This tangent space, denoted as , is constructed for the shape space M with the pole at the projection , which represents the mean shape. In other words, the tangent space is the space tangent to the manifold M at the mean shape. The population covariance matrix:
where . in the tangent space captures the variability of shapes around the mean shape and provides valuable information about the shape distribution. It describes how shapes deviate from the mean shape in different directions and magnitudes. The calculation of the population covariance matrix in the tangent space is based on the landmarks’ coordinates of the shapes in the dataset. By analyzing the population covariance matrix, we can gain insights into the patterns and structure of shape variation. This information is crucial for understanding the range of possible shapes within the population and for further statistical analysis and modeling:
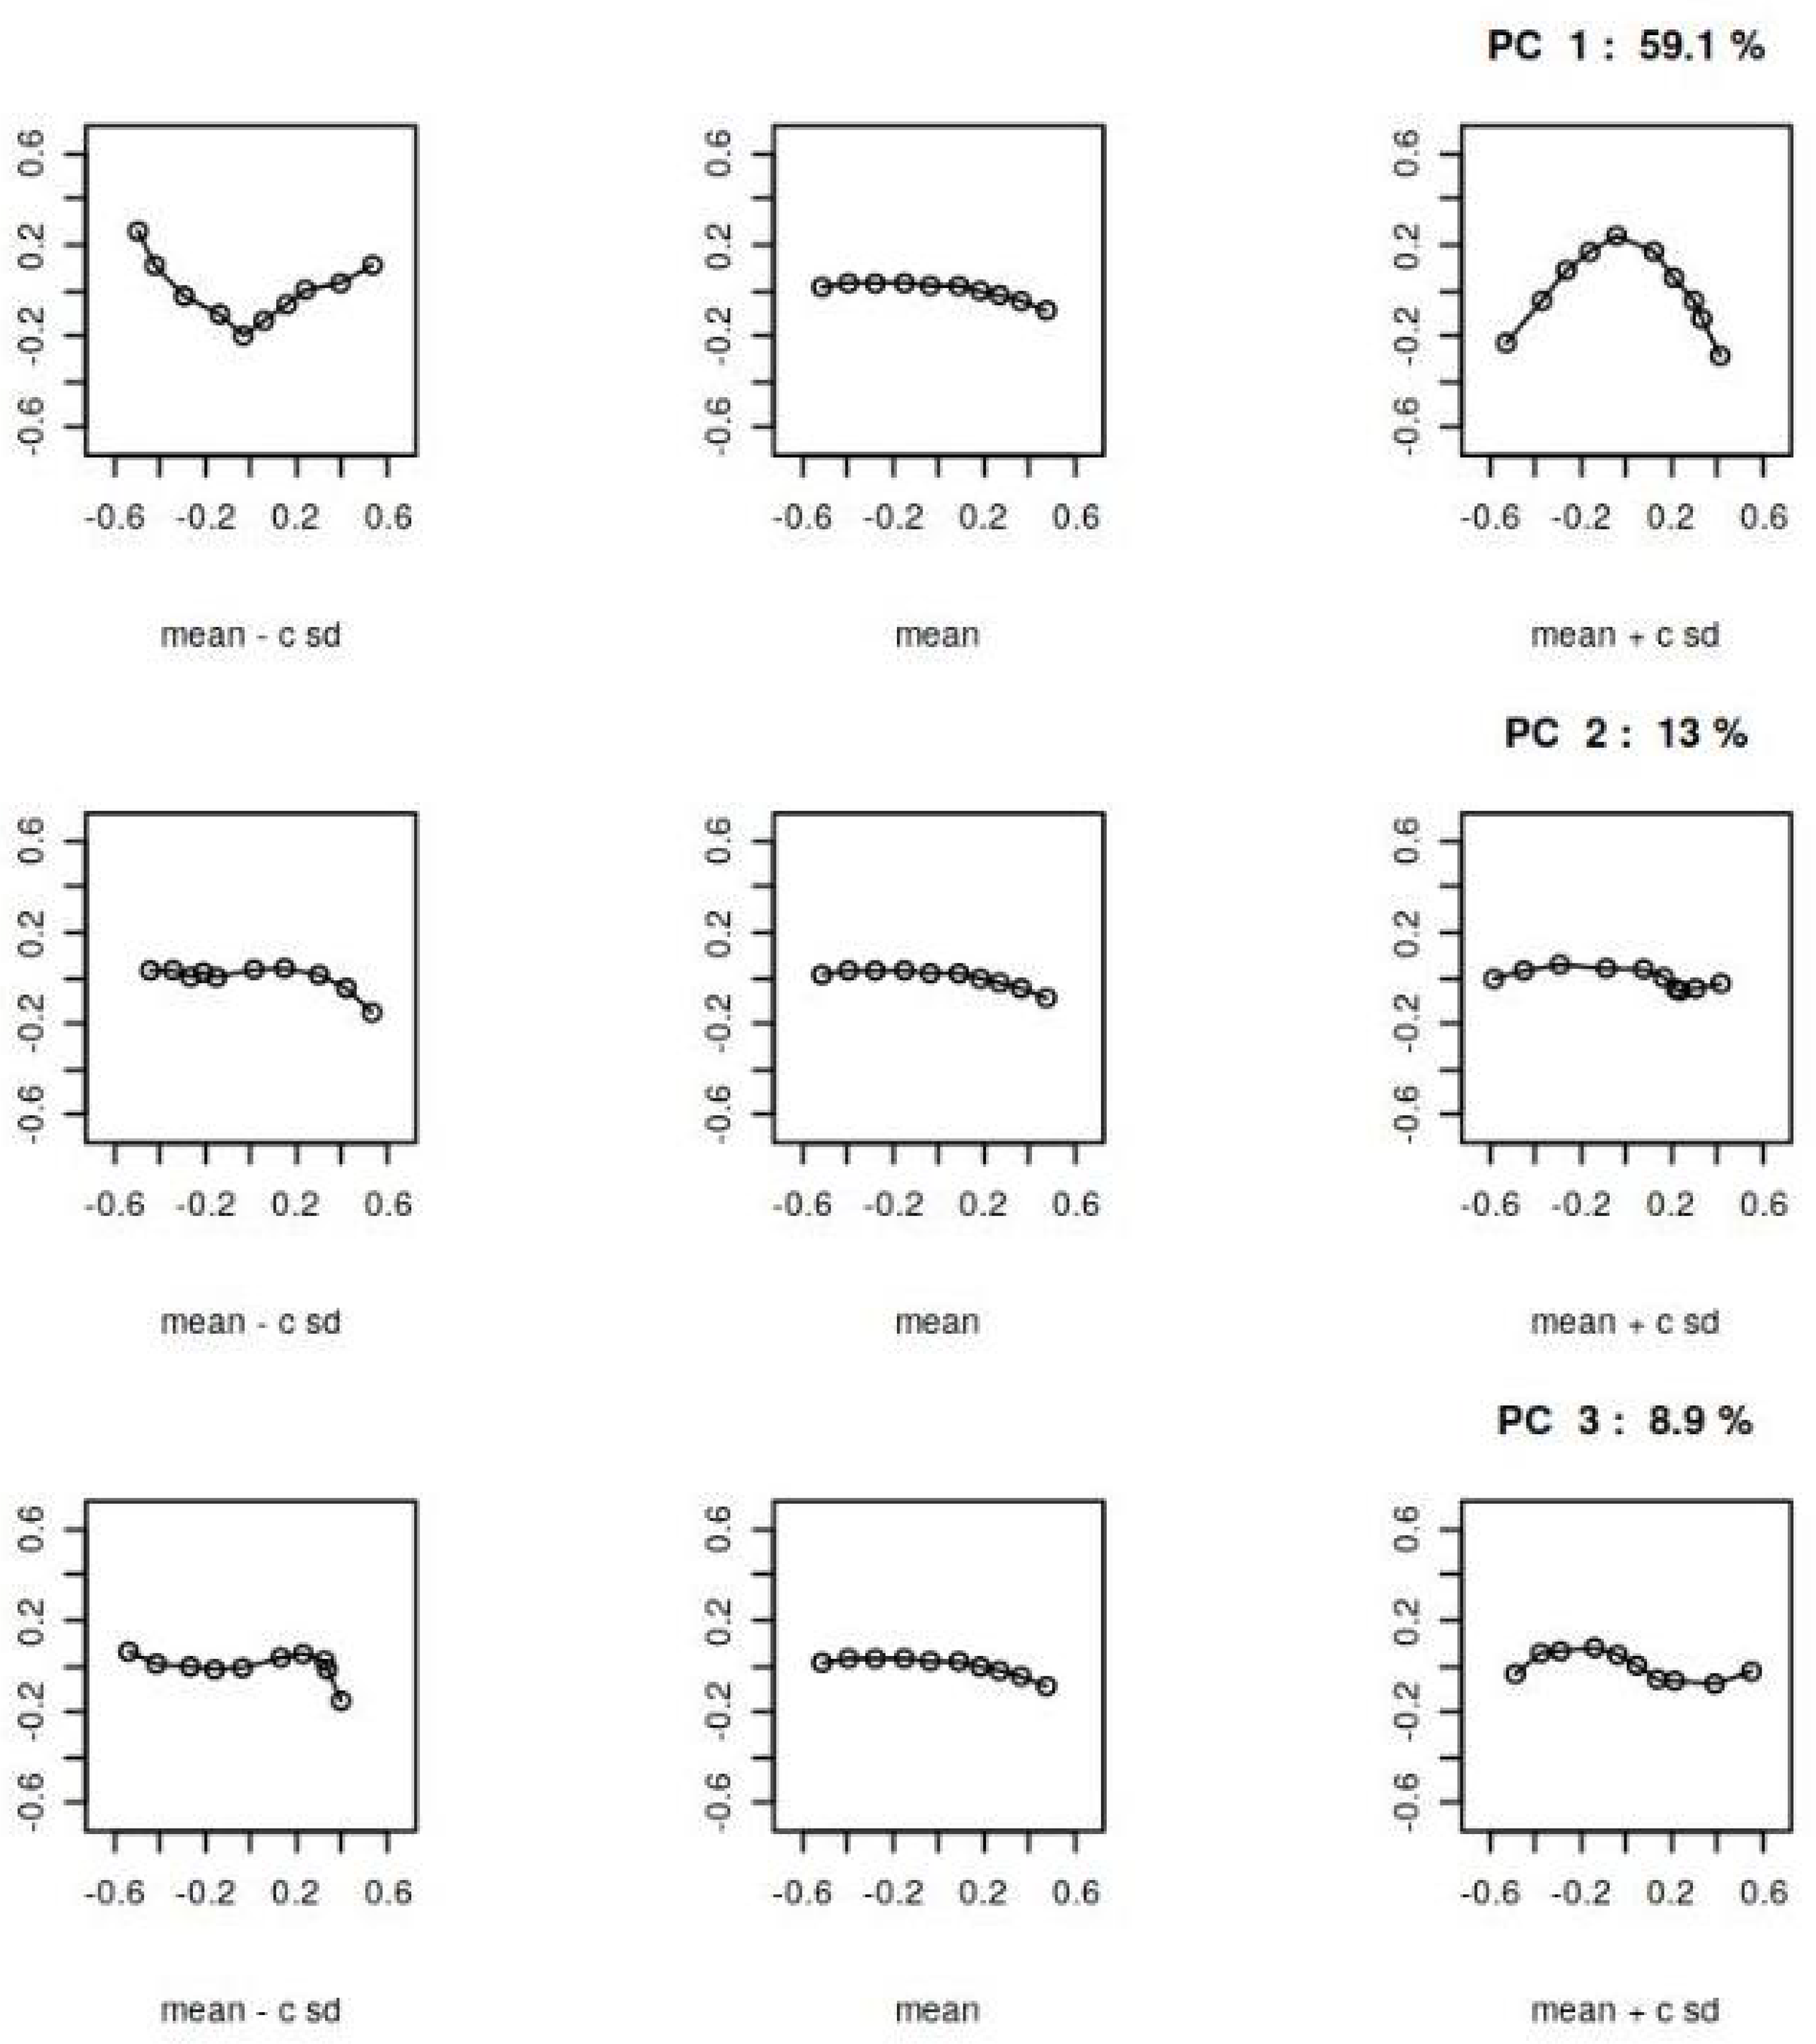
A standard method for analyzing shape variability is Principal Component Analysis (PCA), which allows us to identify the most significant features influencing the covariance matrix of the shapes. In our analysis, PCA was performed using the "shapes" R-package [30] as described in the Methods section. The results of the PCA for the AP and L views are presented in Figure 4 and Figure 5, respectively. These figures show the principal components of shape variability. It can be observed that for the AP view, the first three principal components account for 59.1%, 11%, and 9.8% of the variability in the mean shape, respectively. For the L view, the corresponding weights are 59.1%, 13%, and 8.8%.
Comparing the principal components between the AP and L views, it can be observed that the lower components (e.g., the second and third) have a stronger impact on the overall variability of the mean shape in the L view. Additionally, there is a qualitative difference in the third principal component between the AP and L views, as indicated by the last row of panels in Figure 4 and Figure 5.
These results suggest that while there is no statistical difference between the mean shapes in the AP and L projections, there are differences in the principal components that quantify their variability. This finding highlights the importance of considering not only the mean shape but also the higher-order modes of variation when comparing the two projections.
4. Discussion
We focused our study on a common pediatric injury known as supracondylar humeral fractures. These fractures pose a significant challenge in the preoperative assessment for surgeons, as the initial and often only available imaging modality is an X-ray image captured in both the anterio-posterior (AP) and lateral (P) projections. These images play a crucial role in determining the appropriate treatment strategy for the patient. By analyzing and interpreting the information provided by both the AP and lateral X-ray images, surgeons can gain insights into the nature and extent of the fracture. This allows them to make informed decisions regarding the surgical approach and plan the necessary interventions for optimal patient outcomes. The combination of information obtained from both projections is vital in developing an effective treatment strategy for supracondylar humeral fractures in pediatric patients.
In our study, we utilized Procrustes analysis, a powerful technique described in Ref. [27], to extract essential features of shape and eliminate irrelevant features that may obscure our understanding. We analyzed a dataset consisting of 66 anterio-posterior (AP) and 24 lateral (L) images of supracondylar humeral fractures. Each fracture was represented by a set of 10 scientific landmarks, which served as the sample set for Procrustes analysis. By applying Procrustes analysis, we were able to construct the Procrustes mean shapes of fractures for both AP and L projections. To enhance the visualization of these mean shapes, we employed cubic splines. Interestingly, the mean shapes in both AP and L projections exhibited similar features, regardless of the projection type. This observation was further supported by statistical analysis using a non-parametric version of the Hotelling’s T-square test, which indicated no significant difference between the mean shapes in the AP and L projections. However, when we examined the variability of the mean shapes, as quantified by the principal components of the covariance matrix, we observed a difference between the AP and L projections. This suggests that further differentiation of supracondylar humeral fracture shapes is possible by considering the principal components of shape variability.
In summary, our findings demonstrate that Procrustes analysis is effective in extracting the essential features of supracondylar humeral fractures. While the mean shapes in AP and L projections are similar, the variability of these shapes differs between the two projections, as revealed by the principal components of the covariance matrix.
Indeed, analyzing shapes in radiographic medical images using the Procrustes method provides valuable insights. One important aspect to consider is that the absolute values or sizes extracted from the images may not accurately represent real values due to random variations in scale caused by technical factors during imaging and variations in patient positioning. Instead of relying solely on absolute values, one can explore the relationships between values (ratios) or employ statistical modeling techniques to uncover typical properties of the analyzed shapes.
In the specific case of supracondylar humeral fractures in pediatric patients analyzed with the Procrustes technique, our results indicate that there is no statistical difference between the mean shapes in the anterio-posterior (AP) and lateral (L) views. This means that the typical or average information regarding the shape of a humeral fracture is consistent for both AP and L imaging. However, it is important to note that further analysis of shape variability reveals noticeable differences between the two views, particularly in the lower principal components of the covariance matrix (Equation (1)). These differences highlight the distinct variations in shape observed in different views and provide additional insights into the complexity and diversity of humeral fracture shapes.
By utilizing the Procrustes method and examining both the mean shapes and the variability of fractures, we gain a comprehensive understanding of the typical properties and variations present in this common injury. This knowledge can be valuable for medical professionals in diagnosing and treating supracondylar humeral fractures in pediatric patients.
The Procrustes method serves as an initial and fundamental step in the development of more advanced methods for statistical shape analysis. The Procrustes method allows for the alignment and comparison of shapes, which is essential for studying the variability and patterns in shape data.Building upon the Procrustes method, more sophisticated techniques such as mixed models can be employed to analyze shape data. Mixed models take into account the hierarchical structure of the data and can incorporate both fixed effects (such as treatment or imaging orientation) and random effects (such as individual-specific variations). These models provide a powerful framework for studying complex shape variations and understanding the underlying factors influencing shape changes. In the context of your work on supracondylar humeral fractures and 2D imaging in AP and L orientations, the findings can certainly support orthopedic treatment decisions in pediatric patients. By analyzing and comparing the shapes of fractures, clinicians can gain valuable insights into the biomechanics and patterns of injuries. This knowledge can aid in determining appropriate treatment strategies and optimizing patient outcomes.
Overall, the application of statistical shape analysis methods, including the Procrustes method and more advanced techniques like mixed models, can contribute to both clinical practice and biomechanical research, providing a deeper understanding of shape variations and their implications.
Author Contributions
Conceptualization, J.D. and R.T.; methodology, J.D.; software, J.D.; validation, R.T., and J.D.; formal analysis, R.T.; investigation, J.D.; resources, R.T.; data curation, J.D.; writing—original draft preparation, J.D. and R.T.; writing—review and editing, R.T. and J.D.; visualization, J.D.; supervision, R.T.. All authors have read and agreed to the published version of the manuscript.
Funding
This research received no external funding.
Informed Consent Statement
Informed consent was obtained from all subjects involved in the study.
Data Availability Statement
Data available in a publicly accessible repository that does not issue DOIs Publicly available datasets were analyzed in this study. This data can be found here: https://drive.google.com/drive/folders/1TdTrcPnoXigd6PpjGmZHz6ADjbY2q5AT?usp=drive_link
Conflicts of Interest
The authors declare no conflict of interest.
Abbreviations
| AP | posterior anterior |
| L | lateral |
| PCA | Prncipal component analysis |
References
- Azhari, H.; Kennedy, J.A.; Volokh, N.W.L. From Signals to Image; Springer Cham, 2020. [Google Scholar]
- Shukla, E.A.K. Medical Imaging Methods. Theory and Applications; CRC Press, 2021. [Google Scholar]
- Jiménez-Delgado, J.J.; Paulano-Godino, F.; PulidoRam-Ramírez, R.; Jiménez-Pérez, J.R. Computer assisted preoperative planning of bone fracture reduction: Simulation techniques and new trends. Medical Image Analysis 2016, 30, 30–45. [Google Scholar] [CrossRef]
- Klíma, O.; Madeja, R.; Španel, M.; Čuta, M.; Zemčík, P.; Stoklásek, P.; Mizera, A. Virtual 2D-3D Fracture Reduction with Bone Length Recovery Using Statistical Shape Models. Shape in Medical Imaging; Reuter, M., Wachinger, C., Lombaert, H., Paniagua, B., Lüthi, M., Egger, B., Eds.; Springer International Publishing: Cham, 2018; pp. 207–219. [Google Scholar]
- Tomaszewski, R.; Wozowicz, A.; Wysocka-Wojakiewicz, P. Analysis of Early Neurovascular Complications of Pediatric Supracondylar Humerus Fractures: A Long-Term Observation. BioMed Research International 2017, 2017, 2803790. [Google Scholar] [CrossRef]
- Li, Y.A.; Lee, P.C.; Chia, W.T.; Lin, H.J.; Chiu, F.Y.; Chen, T.H.; Feng, C.K. Prospective analysis of a new minimally invasive technique for paediatric Gartland type III supracondylar fracture of the humerus. Injury 2009, 40, 1302–1307. [Google Scholar] [CrossRef]
- Kazimoglu, C.; Çetin, M.; Şener, M.; Aguş, H.; Kalanderer, Ö. Operative management of type III extension supracondylar fractures in children. International Orthopaedics 2009, 33, 1089–1094. [Google Scholar] [CrossRef]
- Mulpuri, K.; Wilkins, K. The Treatment of Displaced Supracondylar Humerus Fractures: Evidence-based Guideline. Journal of Pediatric Orthopaedics 2012, 32. [Google Scholar] [CrossRef]
- Omid, R.; Choi, P.D.; Skaggs, D.L. Supracondylar Humeral Fractures in Children. JBJS 2008, 90. [Google Scholar] [CrossRef]
- Mazzini, J.P.; Martin, J.R.; Esteban, E.M.A. Surgical approaches for open reduction and pinning in severely displaced supracondylar humerus fractures in children: A systematic review. Journal of Children’s Orthopaedics 2010, 4, 143–152. [Google Scholar] [CrossRef]
- Guner, S.; Guven, N.; Karadas, S.; Ceylan, M.; Turktas, U.; Gokalp, M.; Gozen, A. Iatrogenic or fracture-related nerve injuries in supracondylar humerus fracture: is treatment necessary for nerve injury. Eur Rev Med Pharmacol Sci 2013, 17, 815–9. [Google Scholar]
- Allen, S.R.; Hang, J.R.; Hau, R.C. Review article: Paediatric supracondylar humeral fractures: Emergency assessment and management. Emergency Medicine Australasia 2010, 22, 418–426. [Google Scholar] [CrossRef]
- Crombie, A.; Duncan, R. Closed reduction and percutaneous fixation of displaced paediatric supracondylar fractures of the elbow. Current Orthopaedics 2004, 18, 147–153. [Google Scholar] [CrossRef]
- Pretell-Mazzini, J.; Rodriguez-Martin, J.; Andres-Esteban, E.M. Does open reduction and pinning affect outcome in severely displaced supracondylar humeral fractures in children? A systematic review. Strategies Trauma Limb Reconstr 2010, 5, 57–64. [Google Scholar] [CrossRef]
- Korompilias, A.V.; Lykissas, M.G.; Mitsionis, G.I.; Kontogeorgakos, V.A.; Manoudis, G.; Beris, A.E. Treatment of pink pulseless hand following supracondylar fractures of the humerus in children. International Orthopaedics 2009, 33, 237–241. [Google Scholar] [CrossRef]
- Sinikumpu, J.J.; Victorzon, S.; Lindholm, E.L.; Peljo, T.; Serlo, W. Ulnar nerve morbidity as a long-term complication of pediatric supracondylar humeral fracture. MUSCULOSKELETAL SURGERY 2014, 98, 127–133. [Google Scholar] [CrossRef]
- Bookstein, F.L. Shape and the Information in Medical Images: A Decade of the Morphometric Synthesis. Comput. Vis. Image Underst. 1997, 66, 97–118. [Google Scholar] [CrossRef]
- Dryden, I.L.; Mardia, K.V. Multivariate Shape Analysis. Sankhya: The Indian Journal of Statistics, Series A (1961-2002) 1993, 55, 460–480. [Google Scholar]
- Goodall, C. Procrustes Methods in the Statistical Analysis of Shape. Journal of the Royal Statistical Society: Series B (Methodological) 1991, 53, 285–321. [Google Scholar] [CrossRef]
- Gong, R.H.; Stewart, J.; Abolmaesumi, P. Reduction of multi-fragment fractures of the distal radius using atlas-based 2D/3D registration. Medical Imaging 2009: Visualization, Image-Guided Procedures, and Modeling; Miga, M.I.; Wong, K.H., Eds. International Society for Optics and Photonics, SPIE, 2009, Vol. 7261, pp. 995 – 1003. [CrossRef]
- Markelj, P.; Tomaževič, D.; Likar, B.; Pernuš, F. A review of 3D/2D registration methods for image-guided interventions. Medical Image Analysis 2012, 16, 642–661, Computer Assisted Interventions. [Google Scholar] [CrossRef]
- Baka, N.; de Bruijne, M.; van Walsum, T.; Kaptein, B.L.; Giphart, J.E.; Schaap, M.; Niessen, W.J.; Lelieveldt, B.P.F. Statistical Shape Model-Based Femur Kinematics From Biplane Fluoroscopy. IEEE Transactions on Medical Imaging 2012, 31, 1573–1583. [Google Scholar] [CrossRef]
- Smoger, L.M.; Shelburne, K.B.; Cyr, A.J.; Rullkoetter, P.J.; Laz, P.J. Statistical shape modeling predicts patellar bone geometry to enable stereo-radiographic kinematic tracking. Journal of Biomechanics 2017, 58, 187–194. [Google Scholar] [CrossRef]
- Demidenko, E. Mixed Models: Theory and Applications; John Wiley and Sons, New York, 2004.
- Demidenko, E. Advanced Statistics with Applications in R; John Wiley and Sons: New York, 2020. [Google Scholar]
- Gower, J.C.; Dijksterhuis, G.B. Procrustes Problems; Oxford Statistical Science Series; Oxford University Press: Oxford, 2004. [Google Scholar]
- Dryden, I.L.; Mardia, K.V. Statistical Shape Analysis with Applications in R. Second Edition; John Wiley and Sons Ltd, 2016. [Google Scholar]
- Dryden, I.L.; Faghihi, M.R.; Taylor, C.C. Procrustes Shape Analysis of Planar Point Subsets. Journal of the Royal Statistical Society. Series B (Methodological) 1997, 59, 353–374. [Google Scholar] [CrossRef]
- Mardia, K.V.; Dryden, I.L. The Statistical Analysis of Shape Data. Biometrika 1989, 76, 271–281. [Google Scholar] [CrossRef]
- Dryden, I.L. shapes package. R Foundation for Statistical Computing, Vienna, Austria, 2021. Contributed package, Version 1.2.6.
Figure 1.
Examples of XR images of humeral fractures: from (AP) and side (L) projections. Solid lines indicate the fracture.
Figure 1.
Examples of XR images of humeral fractures: from (AP) and side (L) projections. Solid lines indicate the fracture.
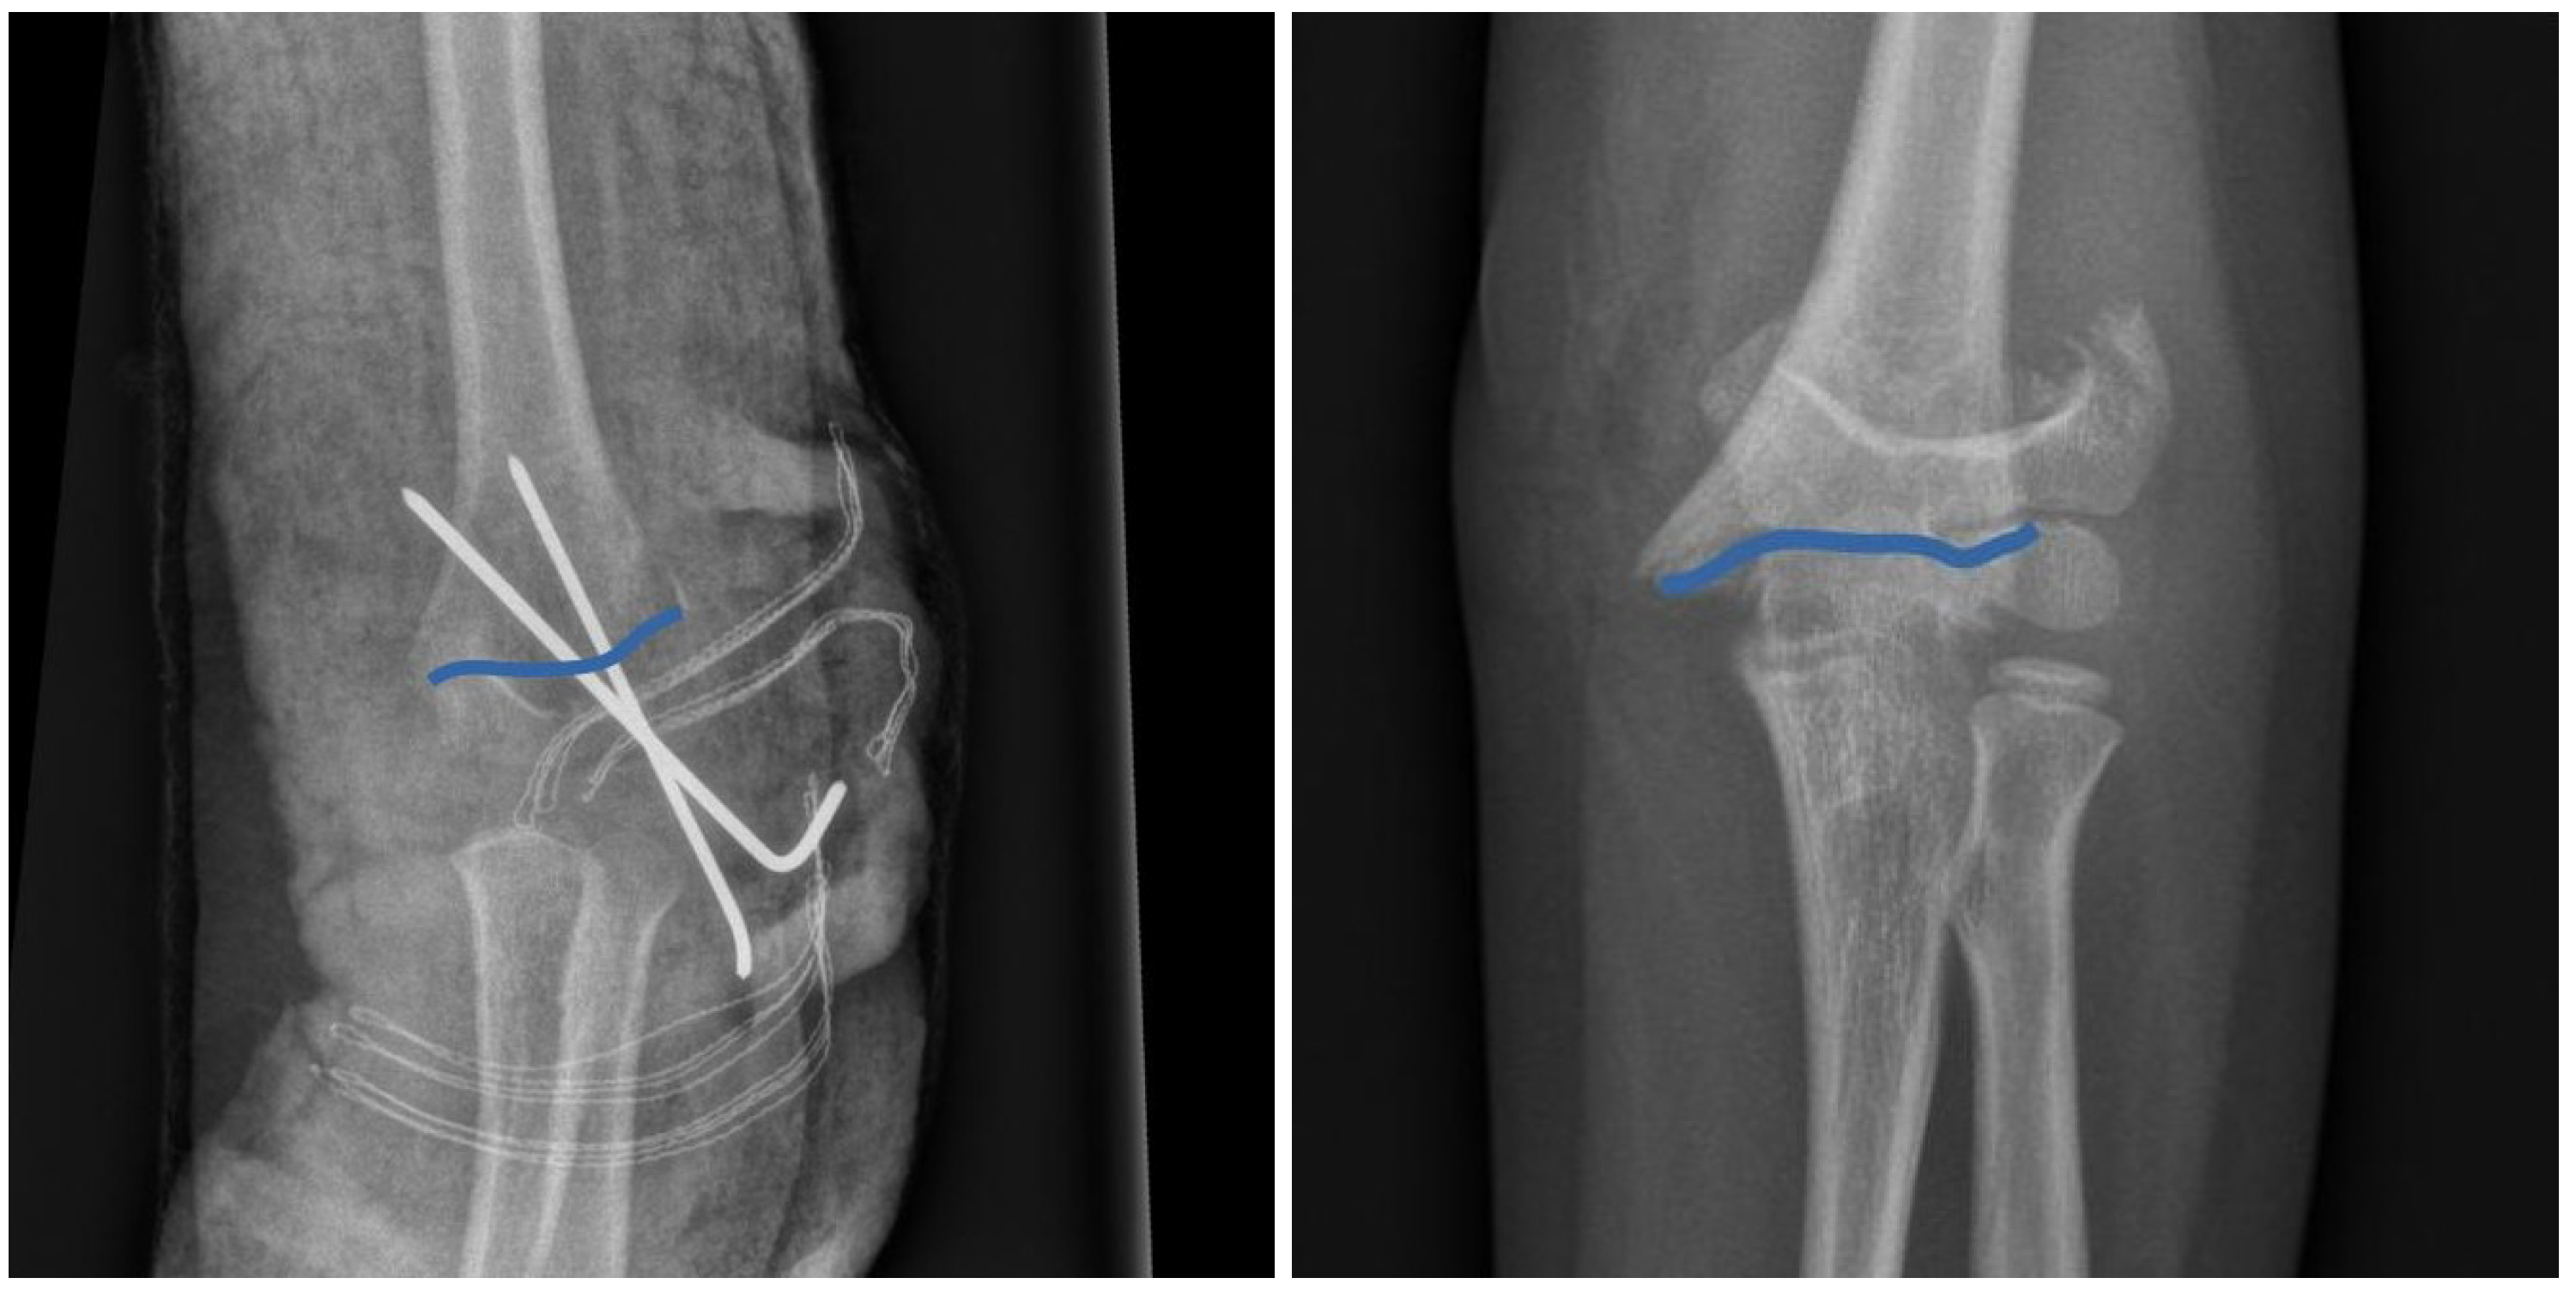
Figure 2.
Fracture shapes based upon 10 landmarks (left panels) and the corresponding Procrustes means for the front (AP) and side (L) projections.
Figure 2.
Fracture shapes based upon 10 landmarks (left panels) and the corresponding Procrustes means for the front (AP) and side (L) projections.

Figure 3.
Procrustes mean shapes of humeral fractures in fron (AP) and side (B) views interpolated with cubic splines
Figure 3.
Procrustes mean shapes of humeral fractures in fron (AP) and side (B) views interpolated with cubic splines
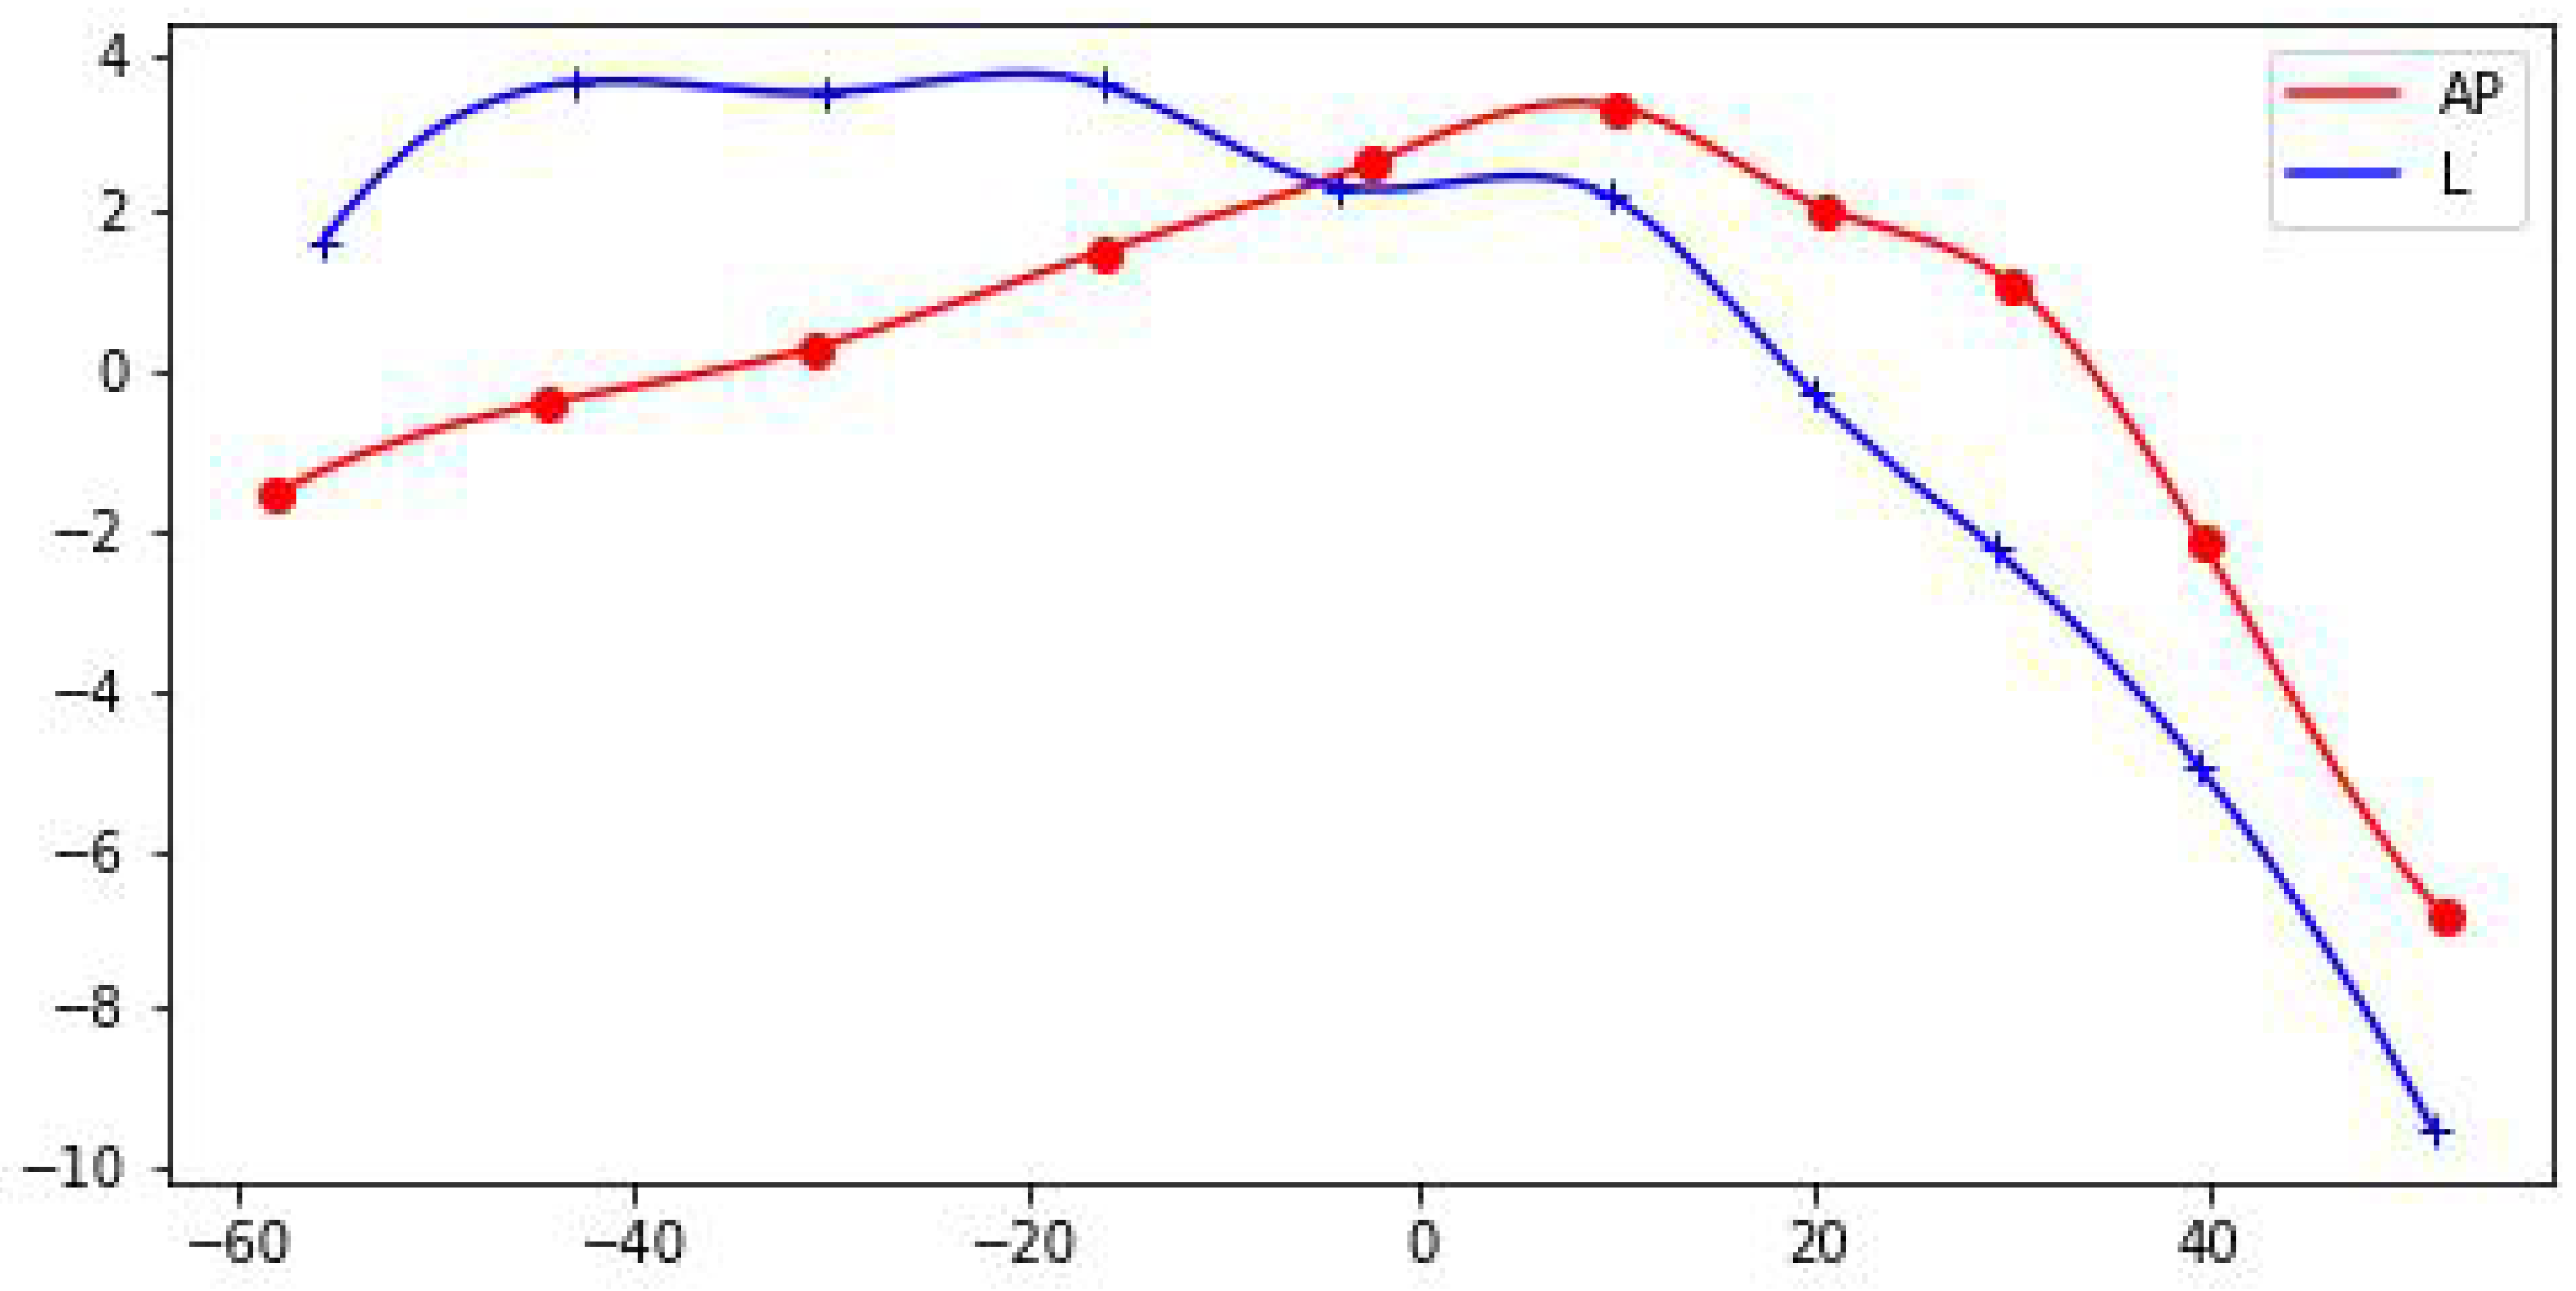
Figure 4.
Three principal components of shape variability for the Procrustes mean shape of humeral fractures in front view (AP). Figure rows correspond to three principal components . In the j-th row there is Procrustes mean (central panel) presented with a tripled () standard deviation (sd) subtracted (left) and added (right).
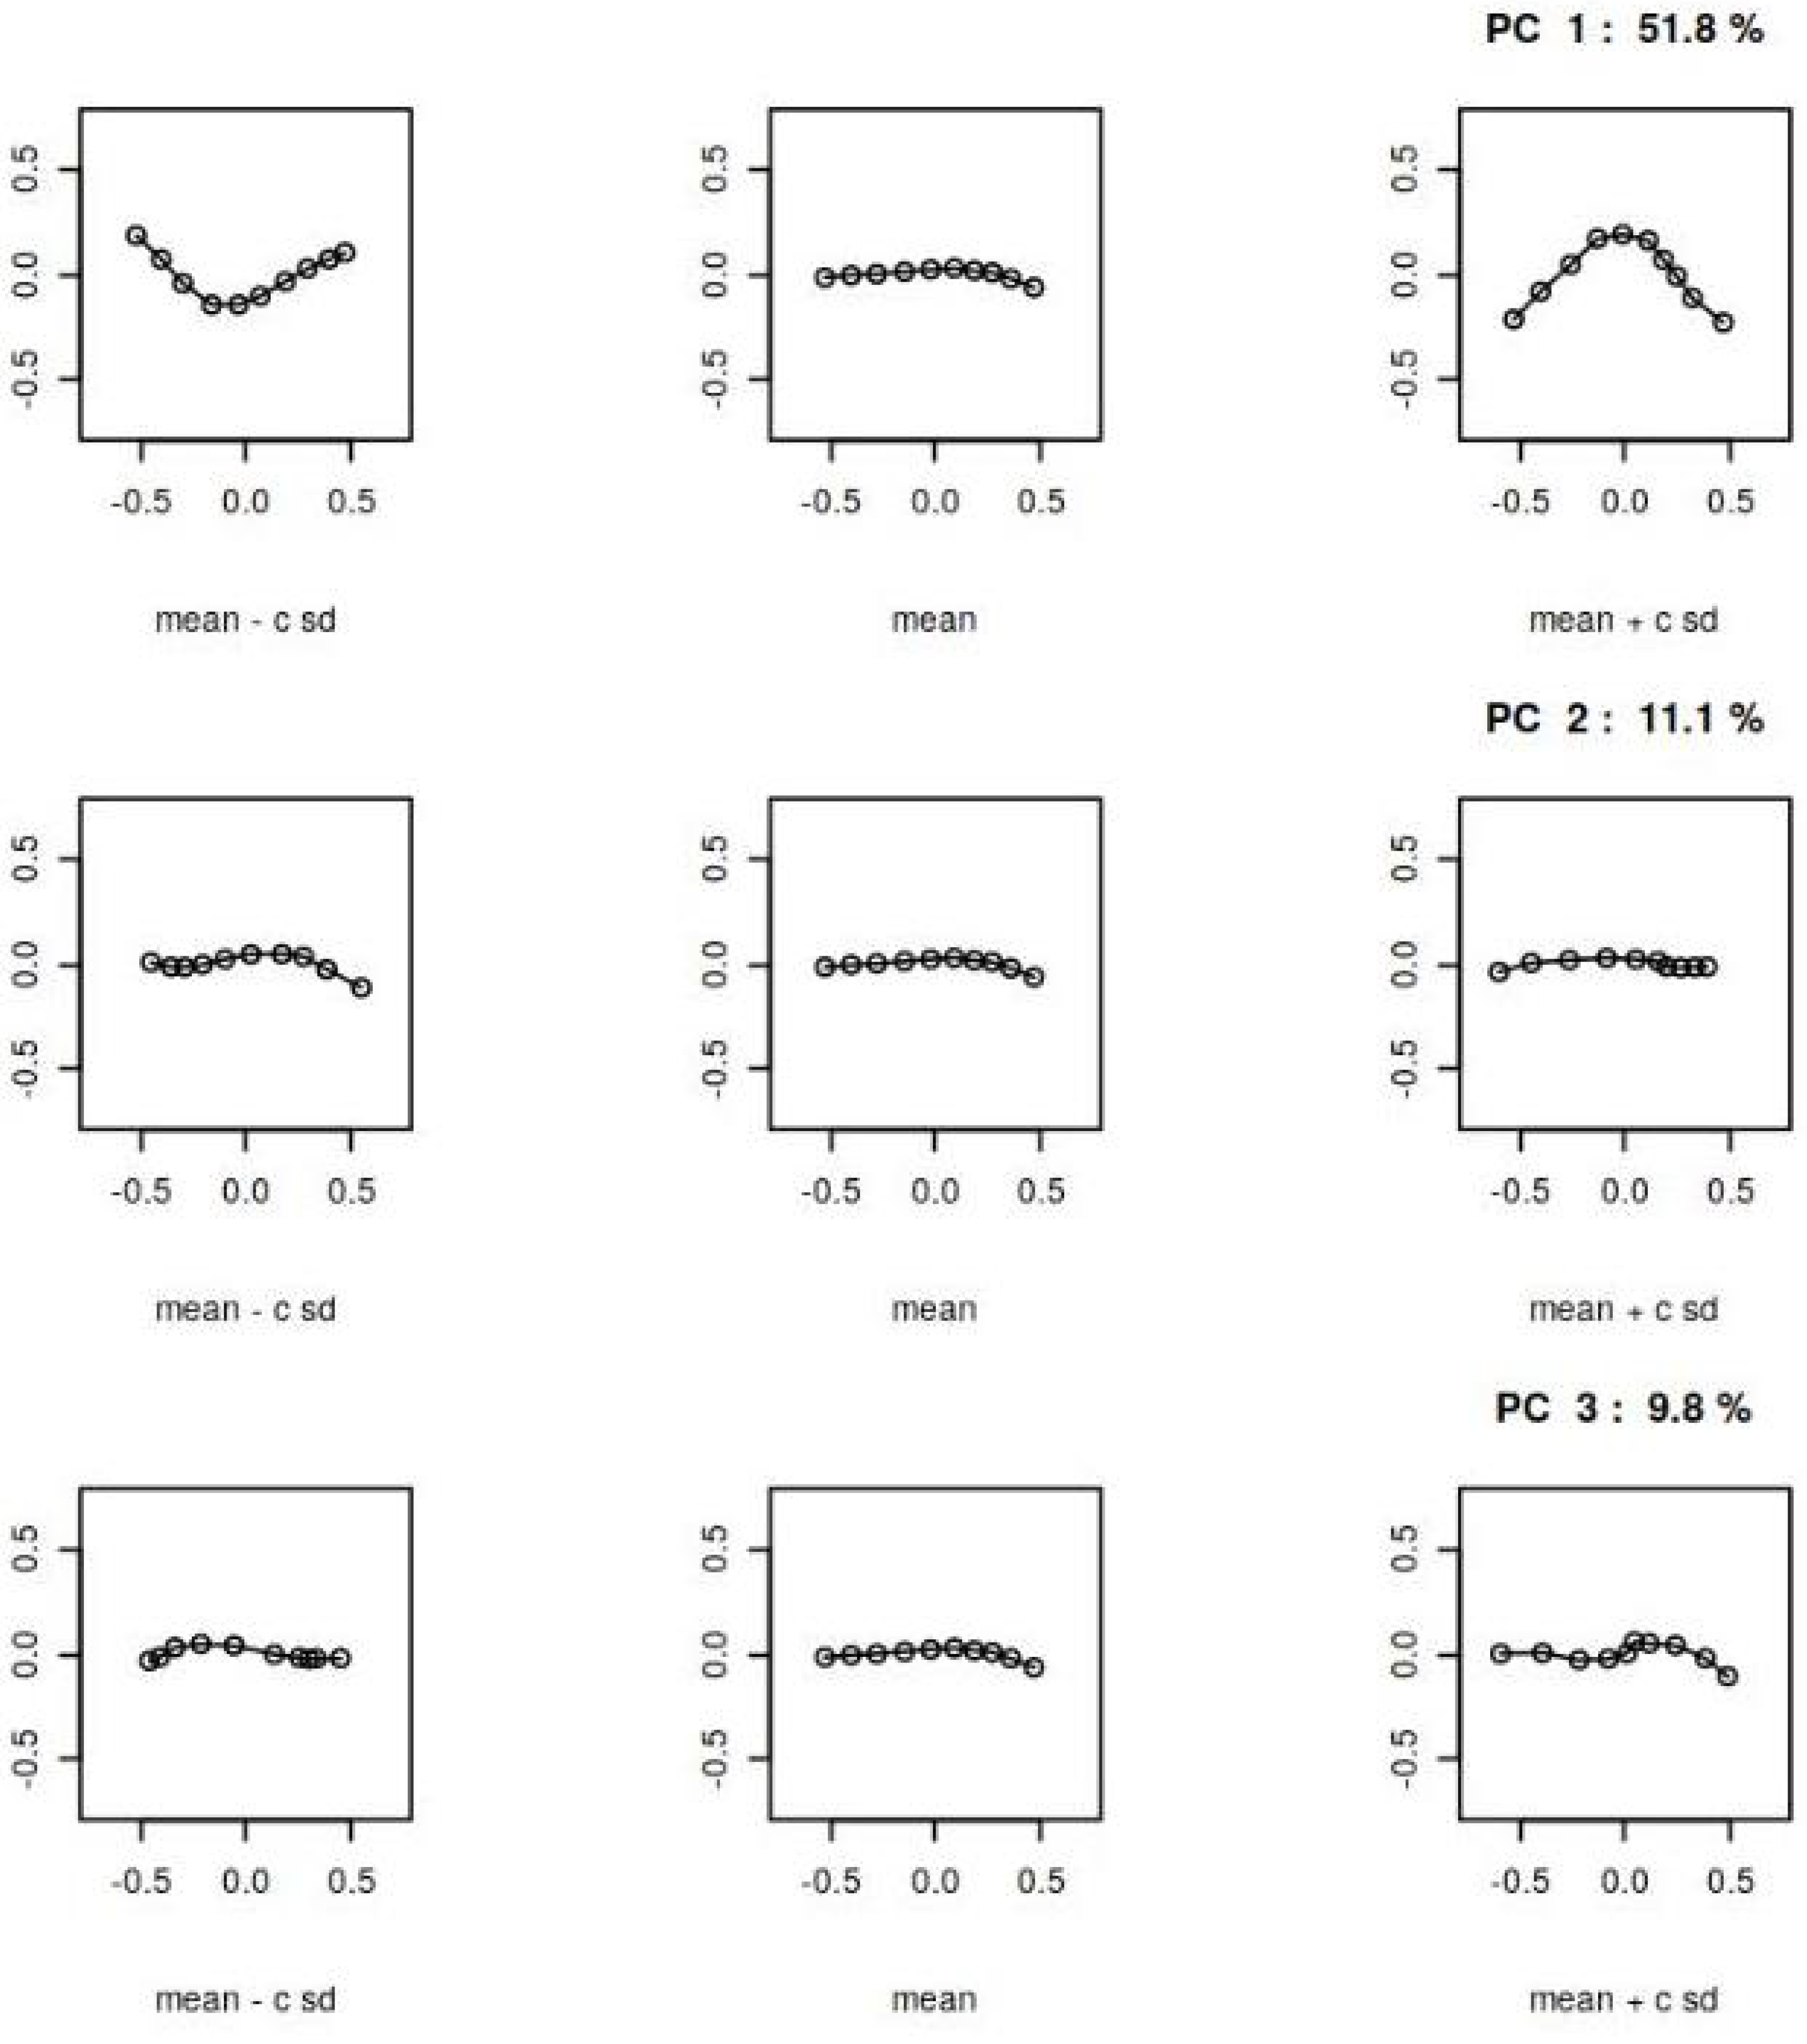
Figure 5.
Three principal components of shape variability for the Procrustes mean shape of humeral fractures in side view (L). Figure rows correspond to three principal components . In the j-th row there is Procrustes mean (central panel) presented with a tripled () standard deviation (sd) subtracted (left) and added (right).
Disclaimer/Publisher’s Note: The statements, opinions and data contained in all publications are solely those of the individual author(s) and contributor(s) and not of MDPI and/or the editor(s). MDPI and/or the editor(s) disclaim responsibility for any injury to people or property resulting from any ideas, methods, instructions or products referred to in the content. |
© 2023 by the authors. Licensee MDPI, Basel, Switzerland. This article is an open access article distributed under the terms and conditions of the Creative Commons Attribution (CC BY) license (http://creativecommons.org/licenses/by/4.0/).
Copyright: This open access article is published under a Creative Commons CC BY 4.0 license, which permit the free download, distribution, and reuse, provided that the author and preprint are cited in any reuse.


