
Submitted:
26 June 2023
Posted:
27 June 2023
You are already at the latest version
Abstract
The effect of coal hydrophilic particles in water-glycerol drops on the maximum diameter of spreading along a hydrophobic solid surface is experimentally studied by analyzing the velocity of internal flows by Particle Image Velocimetry. The grinding fineness of coal particles was 45-80 μm and 120-140 μm, their concentration was 0.06 wt.% and 1 wt.%. The impact of particle-laden drops on a solid surface occurred at Weber numbers (We) from 30 to 120. It is revealed the interrelated influence of We and the concentration of coal particles on changes in the maximum absolute velocity of internal flows in a drop within the kinetic and spreading phases of the drop-wall impact. A physical model is formulated for internal convective flows in the longitudinal section of a drop parallel to the plane of the solid wall. The kinetic energy of translational motion of coal particles in a spreading drop compensates for the energy expended by the drop on sliding friction along the wall. At We=120, the inertia-driven spreading of the particle-laden drop is mainly determined by the dynamics of the deformable Taylor rim. An increase in We contributes to more noticeable differences in the convection velocities in spreading drops. When the drop spreading diameter rises at the maximum velocity of internal flows, a growth of the maximum spreading diameter occurs. The presence of coal particles causes a general tendency to reduce the drop spreading.
Keywords:
slurry
; drop impact
; maximum spreading
; coal particle
; PIV
; velocity field
1. Introduction
In many technologies, e.g., spraying of composite liquid fuels (CLF) into combustion chambers [1,2,3], 3D printing, including bioprinting [4,5] and printed electronics [6], spraying of liquid friction modifiers [7], the particle-laden drops interact with various media. The development of these technological processes requires knowledge of the particle distributions in drops spreading after impact on the wall and of the effect of these particles on the flow. For example, for CLF drops, results on the effect of carbon-containing particles on drop spreading and splashing are important, since analysis of such results will help optimize the secondary atomization when hitting the wall [8]. When 3D printing composite materials, tasks related to the ordering of particles on the target (functional surface) are critical [9].
In the case of particle-laden drop-wall collisions, the particle size, volume fraction, and wettability of the particles and the surface are considered as influencing factors. In this regard, the particle-laden drops can be in the form of liquid marbles [10] и slurries [11], and surfaces, respectively, can be hydrophobic [12] and hydrophilic [13]. This study focuses on the particle-laden drops interacting with a hydrophobic surface.
There is quite a wide range of works devoted to suppressing the regimes known from pure drop impact, such as jetting [14], rebound [15,16], drop break-up during rebound [17]. It is also known that such regimes as prompt and corona splashing, which are typical for drops without particles [18,19,20,21], are significantly modified [14], since the destruction of a thin liquid layer can occur far from the drop contact line, being more similar to splashing of viscous liquids [22].
Particles in drops also affect the initial phase of interaction – spreading [11], decreasing the maximum spreading diameter Dmax [14,15]. However, this result is rather ambiguous, since there is a contradiction in which an increase in Dmax occurs with a growth of the volume fraction of particles, but at the same time an increase in the effective viscosity should lead to less spreading [11,23]. Obviously, in the case of particle-laden drops, spreading cannot be controlled by viscosity alone; it is a complex of influencing factors and related effects listed above. The examination of the spreading drop morphology and the distribution of internal particles results in the exploration of the spreading and receding phases [11]. In particular, Grishaev et al. demonstrated that the particle patterns strongly depends on the surface wettability, particle size, and initial impact velocity, as well as the Reynolds (Re) and Weber (We) numbers [11]. These parameters also determine the spreading and receding phases.
Nicolas explored the patterns and distribution of the particles in the case of dilute slurries [23]. He observed a ring and disk-like distribution of particles as a function of Re and particle diameter (dp). The manifestation of ring distribution was associated with the movement of the liquid towards the center when the drop receded. In general, the effect of particles on spreading was mainly determined by the ratio between inertial and viscous forces (Re). With a significant predominance of inertia (Re > 5000-6000), particle-laden drops spread more significantly compared to the drops without particles. However, the shape of the drop contact line was significantly distorted relative to the shape of the circle.
Since there is a rather limited amount of research on the morphology of the particle-laden drop impacting on a surface and the effect of particles on the drop spreading control, a number of issues indicated by Grishaev et al. [11] remain relevant and motivate further research. These include issues related to the influence of surface wettability, particle size, and initial drop velocities on particle distribution and drop spreading. We believe that all these issues for dilute slurries should be considered comprehensively (with empirical expressions derived), with due regard for the effective viscosity. The latter depends to a greater extent on the viscosity of the carrier medium, the buoyancy of monodisperse particles, their volume fraction and material. Thus, the purpose of the study is to experimentally determine the conditions for reducing or increasing the maximum diameter of water-glycerol drops laden with coal hydrophilic particles and spreading along the hydrophobic surface by analyzing the velocity fields using Particle Image Velocimetry; in addition, the research will consider the morphology of the particle-laden drop impacting on a surface – contact line deformation.
2. Materials
The solid component of the suspension was a coking coal from the Berezovskaya mine, Kemerovo region, Russia. Table 1 shows the results of its elemental and technical analysis. The data was measured by the Vario micro cube Elementar device. The carrier medium of a slurry was a mixture of distilled water and glycerol. The use of glycerol is caused by the need to artificially increase the viscosity of the slurry, bringing the conditions of particle movement in the flow closer to highly concentrated slurries typical of the energy sector [24,25].
The solids were kept in an air bath at 105 °C for two hours before mixing. The dried solids were crushed in a Pulverisette 14 high-speed rotary mill with a grinding degree of 0.08–6 mm and a rotor speed of 6000–20000 rpm. To obtain the required grinding degree, the crushed solids were sieved in a ANALYSETTE 3 SPARTAN vibrating screen with a potential sieving time of 3–20 min and using the sieves with a mesh width of 20–90 μm. The solids were weighed using Vibra AF 225DRCE analytical scales with a resolution of 10-6 g.
The slurries were prepared in several stages. 12 g of glycerol was added to the carrier medium – water weighing 8 g. Mixing of the aqueous solution with additives was carried out using an AIBOTE ZNCLBS-2500 magnetic stirrer with a stirring temperature of 25±2°C, a rotation speed of 1500 rpm, and a mixing time of 7 min. Solid particles were added gradually to the mixed volume to prevent the formation of agglomerates and obtain a more uniform structure. Grinding fineness and mass concentration of coal particles varied. In addition, the experiments were carried out at different drop discharge heights relative to the impact surface (h), and, consequently, at different drop velocities before impact (U0) and Weber numbers (, where D0 is the diameter of the drop before impact on a wall, m; ρ is the density of the liquid, kg/m3; σ is the surface tension of the liquid, N/m). Despite the presence of solid particles and varying their concentration, the properties of liquids within different compositions were assumed to be the same and corresponded to the water-glycerol solution under examination. This is due to the relatively low proportion of solids in the slurry. Table 2 lists the properties of the water-glycerol solution. Table 3 introduces the initial conditions for conducting experiments.
3. Experimental set-up
During the research, an experimental set-up was used, the scheme of which is demonstrated in Figure 1a. The Particle Image Velocimetry (PIV) technique determined the flow velocity inside the drop during isothermal contact with the surface. The method estimates the velocity of convective flows in the longitudinal section of a spreading (after impact on a wall) drop parallel to the plane of the solid wall at the distance of 0.2–0.3 mm from it. The PIV method is based on recording the movement of special particles (tracers) over a very short period of time. For this purpose, "tracer" microparticles are introduced into the measured medium. The particles are illuminated by a powerful laser source, and their images are recorded by a video camera. In this case (Figure 1b), the flat laser knife generated by the radiation source cuts the drop in a plane parallel to the solid wall, and the optical axis of the video camera is perpendicular to the plane of the laser knife (Figure 1a). This method is applied due to the peculiarities of the absorption and scattering of laser radiation in the internal volume of the drop, related to the presence of solid carbon-containing particles and their mass concentration in a slurry.
The experimental set-up (Figure 1a) included the following aggregated positions: measurement (registration) part, linear displacement module, drop generation system, lighting system, high-speed video camera, and a computer for data collection and subsequent processing (not shown in Figure 1a). A platform of 0.1 m in diameter and 0.01 m in thickness with a through hole of 0.02 m in diameter was manufactured for placing an optically transparent substrate above the hole. The substrate has a diameter of 0.025 m and a thickness of 0.005 m and is made of sapphire glass (Thorlabs). The platform and the substrate with a particle-laden drop conventionally represent the measuring part.
The drop discharge height varies due to the linear displacement module with an integrated servo drive and a power supply. This module is used for linear vertical (relative to the substrate surface) movement of the drop generation system, which consists of a feed tube and a hollow needle. The temperature of the liquid in the test tube corresponds to the temperature in the laboratory and is 22-23 °C. The liquid in the system is pumped by a LongerPump BT100-1F dosing peristaltic pump with a set dosage volume of 0.01 ml. The drop velocity U0 to the moment of impact on the surface could change as the drop generation system moved vertically and was 0.63 m/s, 1.17 m/s, 1.72 m/s, and 2.08 m/s. The systematic error in velocity measurement is 0.1 m/s. The diameter of the generated drop D0 to the moment of impact on the surface remained constant and was 2.9±0.05 mm. The latter was defined as the arithmetic mean of the drop diameters measured vertically and horizontally (in a frame) before the drop came into contact with the wall.
The set-up (Figure 1a) was equipped with a high-speed Phantom Miro M310 video camera recording the drop spreading and the speed of tracer particles with a sample rate of 10,000 fps and a resolution of 512 × 512 pixels. When using PIV (Figure 1a), a Nikon 200mm f/4 AF-D Macro lens with a focal length of 200 mm and a relative aperture of f/4 was engaged. A light filter was installed on the lens, which is a laboratory orange optical glass with a bandwidth of more than 590 nm. A Thorlabs PT1B/M linear manipulator with a maximum shift of 25 mm and an accuracy of ±5 μm representing a micro-positioning system allowed the adjustment of the optics relative to the platform in the vertical plane. The minimum and maximum dimensions of the registration area were 4×4 mm and 25×25 mm, respectively. A continuous DPSS laser KLM-532A (radiation wavelength – 532 nm, maximum power – 5 W, power stability – 3%) was employed to illuminate particle-laden drops. When implementing PIV, the generated laser radiation was transformed into a flat laser knife with an opening angle of 12° by means of the collimator based on a set of spherical and cylindrical lenses. The width and thickness of the laser knife in the measuring area were 60 mm and 0.2 mm, respectively. The plane of the laser knife was set parallel to the plane of the substrate surface. The laser knife cut the drop in the longitudinal section at a minimum distance (about 200-300 microns) from the substrate surface (Figure 1a).
Polyamide fluorescent microparticles with a diameter of 5 μm acted as tracers necessary for recording the velocity of internal convective flows in a drop. The particles absorbed laser radiation at a wavelength of 532 nm (close to the maximum of the absorption spectrum) and emitted (re-emitted) light at a wavelength of more than 550 nm. The microparticles were added to the drop at the stage of slurry preparation (see subsection 2). The concentration of fluorescent microparticles was 1 g/l in accordance with the results and recommendations in Ref. [26]. The tracers were introduced into the slurry sample together with coal particles. The utilization of fluorescent microparticles together with the optical light filter contributed to reaching the following positive aspects. First, it made it possible to filter out reflected and refracted (by drop and substrate) laser radiation at a wavelength of 532 nm. It was possible to exclude the glare on the drop image. Second, it made it possible to filter out the light reflected from the coal particles inside the slurry drop and, as a result, to visualize only the tracers inside the drop, i.e., to determine exactly a liquid velocity.
For each liquid sample, at least three experiments were performed under identical initial conditions: drop size and velocity before the drop-wall collision. A calibration prism (Edmund Optics) with a minimum division value of 10 μm helped to determine the depth of field of the lens and the scale factor. The depth of field in the case of the PIV method was about 2 mm, the minimum value of the scale factor for the considered cases was 0.05 mm/pixel.
4. Method of drop spreading research
PIV allowed recording instantaneous velocity fields in a longitudinal section of the drop by fluorescent microparticle motion for an inter-frame delay. Thus, we were able to study the effect of coal particle concentration on the velocity of internal convective flows in a spreading drop. High-power laser radiation used as illumination and high-speed video recording with an exposure time of 4 μs made it possible to observe the movement of microparticles in the drop with high detail, as well as to record the microparticle velocity in spreading and receding phases. The Actual Flow software enabled to process experimental data by a cross-correlation algorithm when constructing instantaneous velocity fields of microparticles in a drop. The data processing included several consecutive stages (Figure 2):
- -
- the frames recorded by the high-speed video camera were imported into Actual Flow;
- -
- the average background intensity of the image was determined for the area without a drop; the obtained intensity was subtracted from each frame, i.e., the intensity of each pixel of the image was reduced by this value of the intensity;
- -
- when the laser light beam is strongly distorted by a drop or when laser light is strongly absorbed in a slurry drop, a geometric mask was applied to the original frame to avoid absorption and refraction of the laser light, so that only the half of the drop that the light beam enters is analyzed (Figure 1);
- -
- each frame was divided into elementary regions of 32 × 32 pixels in size.
- -
- for each elementary region, the correlation function was calculated, after which the coordinates of its maximum were estimated;
- -
- the shift of the coordinates of the maximum of the correlation function in each elementary region for the time between each two consecutive frames was determined with an accuracy of 0.2 pixels; the displacement of the coordinates of the maximum corresponds to the most probable movement of particles within the elementary region;
- -
- using the scale factor and the time delay between two consecutive frames, the velocity of fluorescent microparticles was calculated, and plotting the corresponding velocity vector for each elementary region took place;
- -
- using a set of velocity vectors, an instantaneous two-dimensional two-component field of the velocity of fluorescent microparticles was reconstructed at each frame;
- -
- an interpolation procedure was performed for the obtained velocity fields, during which the modulus and direction of each velocity vector were compared with the corresponding modulus and direction of neighboring vectors, as well as vectors located in the same elementary region in the previous and subsequent velocity fields; If the differences in the modulus and direction of the velocity vector were more than 20%, the correction of these parameters for this vector occurred.
The following limitations and disadvantages of PIV for measuring the velocity of internal convective flows in a spreading drop were typical of preliminary experiments:
- the curvature of the drop surface causes the angle between the plane of the laser knife incident on it and the drop surface to be different from 90° [27]. At the same time, this angle also changes up during the drop spreading. This leads to refraction of the laser knife inside the drop and, as a result, its deviation from the direction parallel to the substrate surface. In other words, the knife begins to hit the surface of the substrate and reflect off it. This fact may introduce an additional error in the measurement results;
- when a drop spreads radially after it collides with a solid wall, waves ("horns") are often formed along its surface, the crests of which also focus the laser beam as local collecting lenses. This results in the appearance of alternating laser-illuminated and non-illuminated regions, and makes the registration of convection velocities inside the drop also impossible;
- if the content of coal particles is higher than 1-2 wt.%, the laser knife does not penetrate into the drop to a depth of more than 0.2-0.5 mm due to the absorption and reflection of light by these particles. This makes it impossible to record the convection velocities inside the drop.
Thus, PIV allows measuring the convection velocity fields in a drop at any stage of its spreading over the substrate under conditions of insignificant curvature of the drop surface, even when it is heated, but only at small mass concentrations of coal particles, less than 1 wt.%. If at least one of the above disadvantages occurred, the video frame and its corresponding velocity field were not considered.
The PIV-derived results enabled analyzing the trends of maximum absolute convection velocities of internal flows in the spreading drop (Umax¬¬), as well as the average velocities of these flows (Umean) from the contact of the surface by a drop to its maximum spreading, i.e., until the drop reaches the maximum spreading diameter Dmax. Accordingly, the primary data are presented in the form of instantaneous maximum and average velocities of fluorescent microparticles in a drop impacting the wall (U). Instantaneous maximum velocities (Umax¬¬) were determined based on averaging 20 maximum velocity vectors in the frame at a given impact time (t). Instantaneous average velocities (Umean) were calculated as the arithmetic mean of all velocity vectors contained in the velocity field at a specific time moment. The values of Umax and Umean were analyzed by processing the interpolated instantaneous velocity fields of fluorescent microparticles. The data of velocity distributions from Actual Flow were additionally processed through the Wolfram Mathematica customized algorithm of a moving average filter. The results analyzed by introducing a parameter Umax/U0, representing Umax scaled by the initial drop velocity before the impact U0, to describe the behavior of the maximum absolute velocities of internal flows in the spreading drop at various We.
Since the drop-transparent wall impact was recorded from below by means of high-speed photography, it became possible to simultaneously measure the hydrodynamic characteristics of the drop spreading, in particular, Dmax and the time to reach Dmax – tmax. The value of Dmax was the arithmetic mean of the horizontal Dmaxhor and vertical Dmaxvert diameters, since the drop spreading occurs radially and conventionally evenly from the center. To determine Dmaxhor and Dmaxvert, the shadow photography method captures the collision process (Figure 3). In order to derive the empirical expressions on the spreading process, the factor of maximum spreading βmax = Dmax/D0 widely used in typical studies [18,28,29,30] was under examination.
By combining the PIV-derived data on Umax and the results of the drop spreading diameters recorded by shadow photography, it became possible to determine the drop diameter, at which the maximum absolute velocity of internal flows DUmax is reached. In addition, a parameter DUmax/D0 was introduced for quantitative and qualitative interpretation of the effect of the maximum absolute velocity of internal flows on βmax.
5. Results and discussion
5.1. Morphological observations
The results of measuring the velocity of internal fluid flows during a drop-wall collision are analyzed within four generally accepted phases (Figure 4a), such as: kinetic, spreading, receding and relaxation phases [31]. The kinetic one is characterized by a sharp increase in the maximum and average velocities of internal flows in the longitudinal section of the drop and the achievement of peak velocities Umax and Umean. Thus, in the drop spreading phase, at the initial stage, the values of flow velocities correspond to peak values, after which they steadily tend to values close to zero. At the same time, both phases show an almost linear character of the growth and fall of Umax and Umean values for all the considered initial experimental conditions (size and velocity of droplets, liquid viscosity). In most cases, the duration of the kinetic phase is about two times shorter relative to the spreading phase. The end of the spreading phase occurs when the drops reach Dmax. At this point, mostly due to the viscous dissipation, the kinetic energy in the system is exhausted. The evolution of velocity fields in the longitudinal section of a spreading drop before kinetic energy depletion is presented in inserts above each velocity distribution over time (Figure 4). The inserts allow us to characterize the velocity field of internal flows as significantly inhomogeneous with a shift of increased velocities in the radial direction towards the drop spreading at the end kinetic phase and the beginning of the spreading one. During the spreading, the flow velocity decreases (see all inserts # 4 in Figure 4), starting from the periphery (rim), in the opposite direction towards the point of initial contact of the drop with the wall.
The subsequent receding phase is characterized by inertial processes mainly in the drop rim, which lead to a local, less significant increase in the velocity of internal flows. This is clearly seen in Figure 4 from the values of Umax at t = 0.0075–0.0085 s. The presence of coal particles in a drop noticeably weakens the flow velocities during receding due to the effect of inhibiting the outflow of liquid by solids. This is clearly observed in the time distributions of flow velocities when comparing the ends of the receding phase in Figure 4a-e. The values of Umax for the compared cases are significantly different. The relaxation phase (rather, its initial stage) begins immediately after the local extremum (Umax) at the end of receding and is accompanied by a monotonous attenuation of internal flows.
The addition of coal particles generally affects the velocity of internal convective flows in a drop in a variety of ways. In addition, the experimental results made it possible to identify a number of influencing factors, namely, the grinding fineness of coal particles, their concentration, and We.
5.2. Effect of We and the concentration of coal particles on the velocity of internal flows in a spreading drop. Physical flow model in a particle-laden drop
The analysis of the results on the distributions of maximum velocities in the drop over the spreading time (Figure 5) revealed the interrelated effect of We and the concentration of coal particles on changes in the peak values of Umax in the kinetic and spreading phases. At We = 120, it is difficult to distinguish the effect of coal particles on the development of internal flows (Figure 5b and Figure 5d), regardless of their grinding fineness and concentration. The radial motion of the drops occurs with the spreading velocity Uspr (Figure 5b and Figure 5d) approximately twice as high as at We=30 (Figure 5a and Figure 5c). At such high values of Uspr (about 3.5 m/s), the inertia-driven spreading of the particle-laden drop is mainly determined by the dynamics of the Taylor rim, whose diameter becomes relatively smaller. Then, the rim begins to deform (Figure 6ab) due to the Rayleigh-Taylor instability [32,33,34]. The contribution of solids is insignificant, so the values of Umax are quite close. While with We =30 and a grinding fineness of 45-80 μm (Figure 5a) the addition of coal particles contributes to a rather significant increase in Umax. However, at a coal particle concentration of 0.06 wt.%, the values of Umax were significantly higher than at 1 wt.%. The relative decrease in Umax in the case of a higher concentration can be physically associated with the formation of the internal structure (Figure 6c) and, accordingly, an increase in shear stresses between the liquid layers during the drop spreading. The latter leads to the expenditure of more energy to move the liquid. At a lower concentration, solids, having more physical space between them, cannot form the structure, and therefore the particles can act as single "accelerators" in the velocity field, which get the inertia-driven acceleration from the internal translational flow of the liquid (Figure 6d). When We = 30 and the particle grinding fineness is 120-140 μm (Figure 5c), then even in the case of a lower concentration, a certain effect of inhibition of internal flows is observed both in absolute values of Umax and in the spreading time t relative to the case without coal particles. This phenomenon is presumably caused by the immediate sedimentation of coal particles upon contact with the surface and their restraining disturbance of the laminar flow (Figure 6e). At 1 wt.%, the number of the particles of 120-140 μm in size becomes larger; they can not only restrain laminar flow, but also mechanically deform the liquid-gas interface both on the free surface of the liquid and near the contact line after particle collisions (Figure 6f). The latter can lead to additional local liquid flows that affect the overall distribution of U over the spreading time (Figure 5c). A remarkable thing happened for the drops of Slurry 4, which characterizes the difficult-to-predict nature of particle motion. In particular, coal particles were often grouped in a rather limited area of the radially moving flow. In this case, most of the spreading particle-laden drop contained almost no coal particles.
The effect of coal particles and U0 on Umax is demonstrated in the simplest format in Figure 7a. First of all, it can be seen that the values of U0 and Umax are quite close, i.e., as the values of U0 increase, Umax grow in direct proportion, the momentum conservation law in a drop is satisfied. However, with more detailed observation, it is noticeable that in the absence of coal particles, the drop consumes energy by the sliding friction force when spreading along a solid surface for all We considered. In Figure 7a, this moment is expressed in the values of Umax for water-glycerol drops, which are lowered relative to this characteristic for particle-laden drops and the values of U0. All other things being equal, coal particles (due to their mass) allow developing a relatively high maximum absolute velocity of internal flows, which almost does not differ from the values of U0. Essentially, this means that the kinetic energy (mainly) of the translational motion of coal particles in the drop compensates for the energy spent by the drop on sliding friction along the wall. Linear functions that describe the behavior of Umax with a change in U0 have the following form: Umax = 1.02U0 – 0.11 for the particle-laden drops and Umax = 0.91U0 – 0.11 for the water-glycerol drops. A coefficient of determination R2 is 0.94 and 0.99, respectively. Figure 7b, when introducing the parameter Umax / U0, clearly illustrates in which cases the values of Umax are closest to the values of U0. In addition, Figure 7b also assumes that, based upon the location of the experimental points, a further increase in We will not result in a directly proportional increase in the maximum absolute velocity of internal flows. Most likely, Umax will remain constant, about 2 m/s, for the considered sizes and concentrations of coal particles in the particle-laden drops. The behavior of the parameter Umax / U0 depending on We for water-glycerol and particle-laden drops is well described by third-order polynomial functions, Eq. (1) and Eq. (2), respectively. The value of R2 for water-glycerol drops is 0.97, for the particle-laden drops – R2=0.77. The value of R2 for the particle-laden drops can be considered satisfactory, since all the slurries under study are taken into account, i.e. with different concentrations and grinding fineness of coal particles.
5.3. Effect of the internal flow velocity on the maximum drop spreading diameter
5.3.1. Weber number factor
In the previous subsection, it was shown that coal particles in a spreading drop can affect the internal flow velocities. If the velocity of internal flows in the drop increases, this should affect the spreading characteristics, in particular, the spreading diameter. Therefore, one of the key tasks of the study was to establish an implicit relationship between the velocity of internal flows in the longitudinal section of the drop and the factor of its maximum spreading βmax. To test this relationship, it was necessary to make sure that for all the liquids under study, the behavior of βmax is mainly determined by the initial drop velocity with the constancy of other terms within We. This confidence was achieved after summarizing the results in the framework of the relationship βmax = f(We) depicted in Figure 8a. The behavior of βmax for particle-laden and water-glycerol drops is governed by the power function of βmax = 0.45We2/5 with R2 = 0.95.
A data analysis in Figure 8b suggests that the time to reach the maximum spreading diameter¬ tmax for the liquids under consideration begins to vary more strongly with increasing We. At the same time, there are cases when tmax stays almost the same for different We. Thus, the higher We, the more noticeable the differences in the internal flow velocities in the spreading drops become. This is clearly demonstrated in Figure 7a. Another feature suggests that an increase in DUmax, which depends on We, causes a growth of the maximum spreading diameter (Figure 8c) that is qualitatively described by a power function according to Eq. (3). This result is not obvious, since the later achievement of the maximum absolute velocity of internal flows in a drop is naturally in no way connected with the achievement of a higher maximum spreading diameter. Nevertheless, the established feature allows quantitative (Eq. (3), R2=0.78) and qualitative characterization of the effect of the internal flow velocity in the drop on its maximum spreading diameter.
Despite the same initial conditions (i.e. drop velocity before impacting the wall) for drops of all liquids within the same We, the experimental results in subsections 3.1 and 3.2 introduce a very ambiguous effect of coal particles on the velocity of internal convective flows in the drop. Thus, the potential energy of particles in the particle-laden drops, expressed for different slurries in the form of a change in the flow velocity when colliding with a wall, should establish a certain pattern with respect to the movement of the contact line at least until inertia-driven motion ceases (i.e., until the maximum spreading diameter is reached). This will be discussed in more detail in the next subsection.
5.3.2. Factor of coal particles in a drop
The predicted pattern on the effect of the internal flow velocities Umax and Umean on Dmax (Dmax = βmaxD0) was initially obtained from the point of view of the presence of coal particles in the drop taking into account their grinding fineness and all the studied concentrations. In Figure 9a and Figure 9b, the trend lines (Dmax = aUmaxb and Dmax = aUmeanb, respectively) make it clear that Dmax for the particle-laden drops decrease relative to the water-glycerol drops at the same velocities of internal flows and drops before impacting the wall.
The differences in Dmax tend to grow with increasing internal flow velocities Umax and Umean. Thus, the presence of coal particles, in general, regardless of the considered particle fineness and their concentration causes a general tendency to decrease the intensity of liquid drop spreading.
6. Conclusions
- The PIV-derived results of measuring the velocities of internal convective flows in the longitudinal section of a water-glycerol solution drop laden with coal hydrophilic particles and spreading over a hydrophobic surface allowed the exploration of the conditions for reducing the maximum spreading diameter.
- At We = 30, the particle grinding fineness and their concentration strongly affect the internal flow velocities , contributing both to their increase and decrease, depending on the combination of the initial parameters of a slurry. At We=120, the spreading velocity of the particle-laden drops is approximately twice as high as at We=30. Given this fact, the inertia-driven spreading of the particle-laden drop is mainly determined by the dynamics of the deformable Taylor rim, and the contribution of solids is insignificant, causing the closeness of the values of the maximum absolute velocity of internal flows for various combinations of the initial parameters of a slurry. Relying on the experimental data obtained by the shadow photography and PIV, a physical model of internal convective flows in the longitudinal section of a particle-laden drop is proposed. It is revealed that the kinetic energy of translational motion of coal particles in a drop compensates for the energy expended by the drop on sliding friction along the wall.
- The behavior of the maximum spreading factor βmax for particle-laden and water-glycerol drops is mainly defined by the initial drop velocity with the constancy of other terms within the Weber number and is governed by the power function of βmax = 0.45We2/5 with a coefficient of determination R2 = 0.95. Further, it is revealed the peculiarity of a noticeable increase in the differences in the velocities of internal flows in spreading drops with an increase in Weber number. Finally, as the Weber number grows, an increase in the spreading drop diameter at the maximum absolute velocity of internal flows causes the elevated values of the maximum spreading diameter and is described by an expression of In addition, the presence of coal particles causes a general tendency to reduce the liquid drop spreading.
Author Contributions
Conceptualization, R.V., M.P., P.S.; methodology, A.A., R.V., M.P.; Investigation, A.A., N.K., R.V., M.P.; data curation, A.A., M.P.; formal analysis, A.A., R.V., M.P., P.S.; writing –original draft preparation, A.A., R.V., M.P.; writing—review and editing, N.K., R.V., P.S.; resources, R.V., P.S.; project administration, M.P., P.S. All authors have read and agreed to the published version of the manuscript.
Funding
The study was supported by the grant of the Ministry of Science and Higher Education of the Russian Federation, Agreement No 075-15-2020-806 (Contract No 13.1902.21.0014).
Conflicts of Interest
The authors declare no conflict of interest.
Nomenclature
Ad – ash content of the fuel on a dry basis (%);
Cdaf – carbon content calculated on a dry ash-free (daf) mass, (%);
D0 – initial droplet diameter before impact (m);
Dmax – maximum spreading diameter (m);
Dmaxhor – maximum diameter of the drop spreading measured horizontally in a frame (m);
Dmaxvert – maximum diameter of the drop spreading measured vertically in a frame (m);
DUmax – drop diameter corresponding to the maximum absolute velocity of internal flows (m);
Hdaf – hydrogen content calculated on a dry ash-free (daf) mass, (%);
Ndaf – nitrogen content calculated on a dry ash-free (daf) mass, (%);
Odaf – oxygen content calculated on a dry ash-free (daf) mass, (%);
Qas,V – specific heat of combustion (MJ/kg);
Re – Reynolds number (–);
Std – sulfur content in dry matter, (%);
t – impact time (s);
tmax – time at the maximum spreading diameter (s);
U – instantaneous maximum and average velocities of fluorescent particles in a drop impacting the wall (m/s);
U0 – initial drop velocity (m/s);
Umax¬¬ – maximum absolute velocity of internal flows in the drop during spreading (m/s);
Umean – average speed of internal flows for the period from the contact of the surface with a drop and up to the maximum spreading (m/s);
Uspr – drop spreading velocity (m/s);
Vdaf – amount of volatiles (%);
Wa – fuel moisture (%);
We – Weber number (–).
Greek symbols
βmax – maximum spreading factor (–);
ρ – density (kg/m3);
σ – coefficient of surface tension (N/m);
μ – dynamic viscosity (Pa⸱s).
References
- Wu, X.; Guo, Q.; Gong, Y.; Cheng, C.; Ding, L.; Wang, F.; Yu, G. Visualization Study on Particle Flow Behaviors during Atomization in an Impinging Entrained-Flow Gasifier. Chemical Engineering Science 2020, 225, 115834–115834. [Google Scholar] [CrossRef]
- Wu, X.; Gong, Y.; Guo, Q.; Xue, Z.; Yu, G. Experimental Study on the Atomization and Particle Evolution Characteristics in an Impinging Entrained-Flow Gasifier. Chemical Engineering Science 2019, 207, 542–555. [Google Scholar] [CrossRef]
- Kuznetsov, G.V.; Strizhak, P.A.; Valiullin, T.R.; Volkov, R.S. Atomization Behavior of Composite Liquid Fuels Based on Typical Coal Processing Wastes. Fuel Processing Technology 2022, 225, 107037–107037. [Google Scholar] [CrossRef]
- Zhang, Y.; Kumar, P.; Lv, S.; Xiong, D.; Zhao, H.; Cai, Z.; Zhao, X. Recent Advances in 3D Bioprinting of Vascularized Tissues. Materials and Design 2021, 199. [Google Scholar] [CrossRef]
- Shen, E.M.; McCloskey, K.E. Affordable, High-Resolution Bioprinting with Embedded Concentration Gradients. Bioprinting 2021, 21. [Google Scholar] [CrossRef]
- Brian, D.; Ahmadian-Yazdi, M.-R.; Barratt, C.; Eslamian, M. Impact Dynamics and Deposition of Perovskite Droplets on PEDOT:PSS and TiO2 Coated Glass Substrates. Experimental Thermal and Fluid Science 2019, 105, 181–190. [Google Scholar] [CrossRef]
- Suda, Y.; Iwasa, T.; Komine, H.; Tomeoka, M.; Nakazawa, H.; Matsumoto, K.; Nakai, T.; Tanimoto, M.; Kishimoto, Y. Development of Onboard Friction Control. Wear 2005, 258, 1109–1114. [Google Scholar] [CrossRef]
- M. -J., T.; J., S.; S., K.; M., C.; F., B.; E., S.-N.; J.F., D.; J.H., S.; D., L. Nanoscopic Interactions of Colloidal Particles Can Suppress Millimetre Drop Splashing. Soft Matter 2021, 17, 5116–5121. [Google Scholar] [CrossRef]
- Visser, C.W.; Kamperman, T.; Karbaat, L.P.; Lohse, D.; Karperien, M. In-Air Microfluidics Enables Rapid Fabrication of Emulsions, Suspensions, and 3D Modular (Bio)Materials. Science Advances 2018, 4, 1–8. [Google Scholar] [CrossRef]
- Laborie, B.; Lachaussée, F.; Lorenceau, E.; Rouyer, F. How Coatings with Hydrophobic Particles May Change the Drying of Water Droplets: Incompressible Surface versus Porous Media Effects. Soft Matter 2013, 9, 4822–4830. [Google Scholar] [CrossRef]
- Grishaev, V.; Iorio, C.S.; Dubois, F.; Amirfazli, A. Impact of Particle-Laden Drops: Particle Distribution on the Substrate. Journal of Colloid and Interface Science 2017, 490, 108–118. [Google Scholar] [CrossRef]
- Nguyen, T.V.; Ichiki, M. Bubble Entrapment during the Recoil of an Impacting Droplet. Microsystems and Nanoengineering 2020, 6, 1–7. [Google Scholar] [CrossRef]
- Almohammadi, H.; Amirfazli, A. Droplet Impact: Viscosity and Wettability Effects on Splashing. Journal of Colloid and Interface Science 2019, 553, 22–30. [Google Scholar] [CrossRef]
- Grishaev, V.; Iorio, C.S.; Dubois, F.; Amirfazli, A. Complex Drop Impact Morphology. Langmuir 2015, 31, 9833–9844. [Google Scholar] [CrossRef]
- Ok, H.; Park, H.; Carr, W.W.; Morris, J.F.; Zhu, J. Particle-Laden Drop Impacting on Solid Surfaces. Journal of Dispersion Science and Technology 2005, 25, 449–456. [Google Scholar] [CrossRef]
- Ashikhmin, A.E.; Khomutov, N.A.; Piskunov, M.V.; Yanovsky, V.A. Secondary Atomization of a Biodiesel Micro-Emulsion Fuel Droplet Colliding with a Heated Wall. Applied Sciences (Switzerland) 2020, 10. [Google Scholar] [CrossRef]
- Ueda, Y.; Yokoyama, S.; Nomura, M.; Tsujino, R.; Iguchi, M. Bouncing Behaviors of Suspension Liquid Drops on a Superhydrophobic Surface. Journal of Visualization 2010, 13, 281–283. [Google Scholar] [CrossRef]
- Piskunov, M.; Semyonova, A.; Khomutov, N.; Ashikhmin, A.; Yanovsky, V. Effect of Rheology and Interfacial Tension on Spreading of Emulsion Drops Impacting a Solid Surface. Physics of Fluids 2021, 33, 83309–83309. [Google Scholar] [CrossRef]
- Bertola, V. An Impact Regime Map for Water Drops Impacting on Heated Surfaces. International Journal of Heat and Mass Transfer 2015, 85, 430–437. [Google Scholar] [CrossRef]
- Piskunov, M.; Khomutov, N.; Semyonova, A.; Ashikhmin, A.; Misyura, S. Unsteady Convective Flow of a Preheated Water-in-Oil Emulsion Droplet Impinging on a Heated Wall. Physics of Fluids 2022, 34, 93311–93311. [Google Scholar] [CrossRef]
- Semyonova, A.; Khomutov, N.; Misyura, S.; Piskunov, M. Dynamic and Kinematic Characteristics of Unsteady Motion of a Water-in-Oil Emulsion Droplet in Collision with a Solid Heated Wall under Conditions of Convective Heat Transfer. International Communications in Heat and Mass Transfer 2022, 137, 106277–106277. [Google Scholar] [CrossRef]
- Bolleddula, D.A.; Berchielli, A.; Aliseda, A. Impact of a Heterogeneous Liquid Droplet on a Dry Surface: Application to the Pharmaceutical Industry. Advances in Colloid and Interface Science 2010, 159, 144–159. [Google Scholar] [CrossRef]
- NICOLAS, M. Spreading of a Drop of Neutrally Buoyant Suspension. Journal of Fluid Mechanics 2005, 545, 271–280. [Google Scholar] [CrossRef]
- Zhao, Z.; Wang, R.; Ge, L.; Wu, J.; Yin, Q.; Wang, C. Energy Utilization of Coal-Coking Wastes via Coal Slurry Preparation: The Characteristics of Slurrying, Combustion, and Pollutant Emission. Energy 2019, 168, 609–618. [Google Scholar] [CrossRef]
- Kuznetsov, G.V.; Romanov, D.S.; Vershinina, K.Yu.; Strizhak, P.A. Rheological Characteristics and Stability of Fuel Slurries Based on Coal Processing Waste, Biomass and Used Oil. Fuel 2021, 302, 121203–121203. [Google Scholar] [CrossRef]
- Volkov, R.S.; Strizhak, P.A. Using Planar Laser Induced Fluorescence and Micro Particle Image Velocimetry to Study the Heating of a Droplet with Different Tracers and Schemes of Attaching It on a Holder. International Journal of Thermal Sciences 2021, 159, 106603–106603. [Google Scholar] [CrossRef]
- Volkov, R.S.; Strizhak, P.A.; Misyura, S.Y.; Lezhnin, S.I.; Morozov, V.S. The Influence of Key Factors on the Heat and Mass Transfer of a Sessile Droplet. Experimental Thermal and Fluid Science 2018, 99, 59–70. [Google Scholar] [CrossRef]
- Breitenbach, J.; Roisman, I.V.; Tropea, C. From Drop Impact Physics to Spray Cooling Models: A Critical Review. Experiments in Fluids 2018, 59, 1–21. [Google Scholar] [CrossRef]
- Liang, G.; Mudawar, I. Review of Drop Impact on Heated Walls. International Journal of Heat and Mass Transfer 2017, 106, 103–126. [Google Scholar] [CrossRef]
- Piskunov, M.; Ashikhmin, A.; Khomutov, N.; Semyonova, A. Effects of Wall Temperature and Temperature-Dependent Viscosity on Maximum Spreading of Water-in-Oil Emulsion Droplet. International Journal of Heat and Mass Transfer 2022, 185, 122442–122442. [Google Scholar] [CrossRef]
- Rioboo, R.; Marengo, M.; Tropea, C. Time Evolution of Liquid Drop Impact onto Solid, Dry Surfaces. Experiments in Fluids 2002, 33, 112–124. [Google Scholar] [CrossRef]
- Piskunov, M.; Breitenbach, J.; Schmidt, J.B.; Strizhak, P.; Tropea, C.; Roisman, I.V. Secondary Atomization of Water-in-Oil Emulsion Drops Impinging on a Heated Surface in the Film Boiling Regime. International Journal of Heat and Mass Transfer 2021, 165, 120672–120672. [Google Scholar] [CrossRef]
- Burzynski, D.A.; Roisman, I.V.; Bansmer, S.E. On the Splashing of High-Speed Drops Impacting a Dry Surface. Journal of Fluid Mechanics 2020, 892. [Google Scholar] [CrossRef]
- Sharp, D.H. An Overview of Rayleigh-Taylor Instability. Physica D: Nonlinear Phenomena 1984, 12, 3–18. [Google Scholar] [CrossRef]
Figure 1.
(a) Scheme of the experimental set-up for the implementation of the PIV method: 1 – linear displacement module; 2 – test tube with a liquid; 3 – peristaltic pump; 4 – hollow needle-nozzle; 5 – silicone feed tube; 6 – liquid drop; 7 – optically transparent substrate; 8 – a platform with a through hole for placing the substrate. 9 – high-speed CMOS video camera; 10 – continuous DPSS laser; 11 – collimator; 12 – laser power supply; 13 – lens; 14 – laser beam (knife); 15 – micro-positioning system for the platform; (b) frame with the image of tracer particles in the drop under study, the planes of the laser radiation and video recording, as well as the masked and analyzed areas.
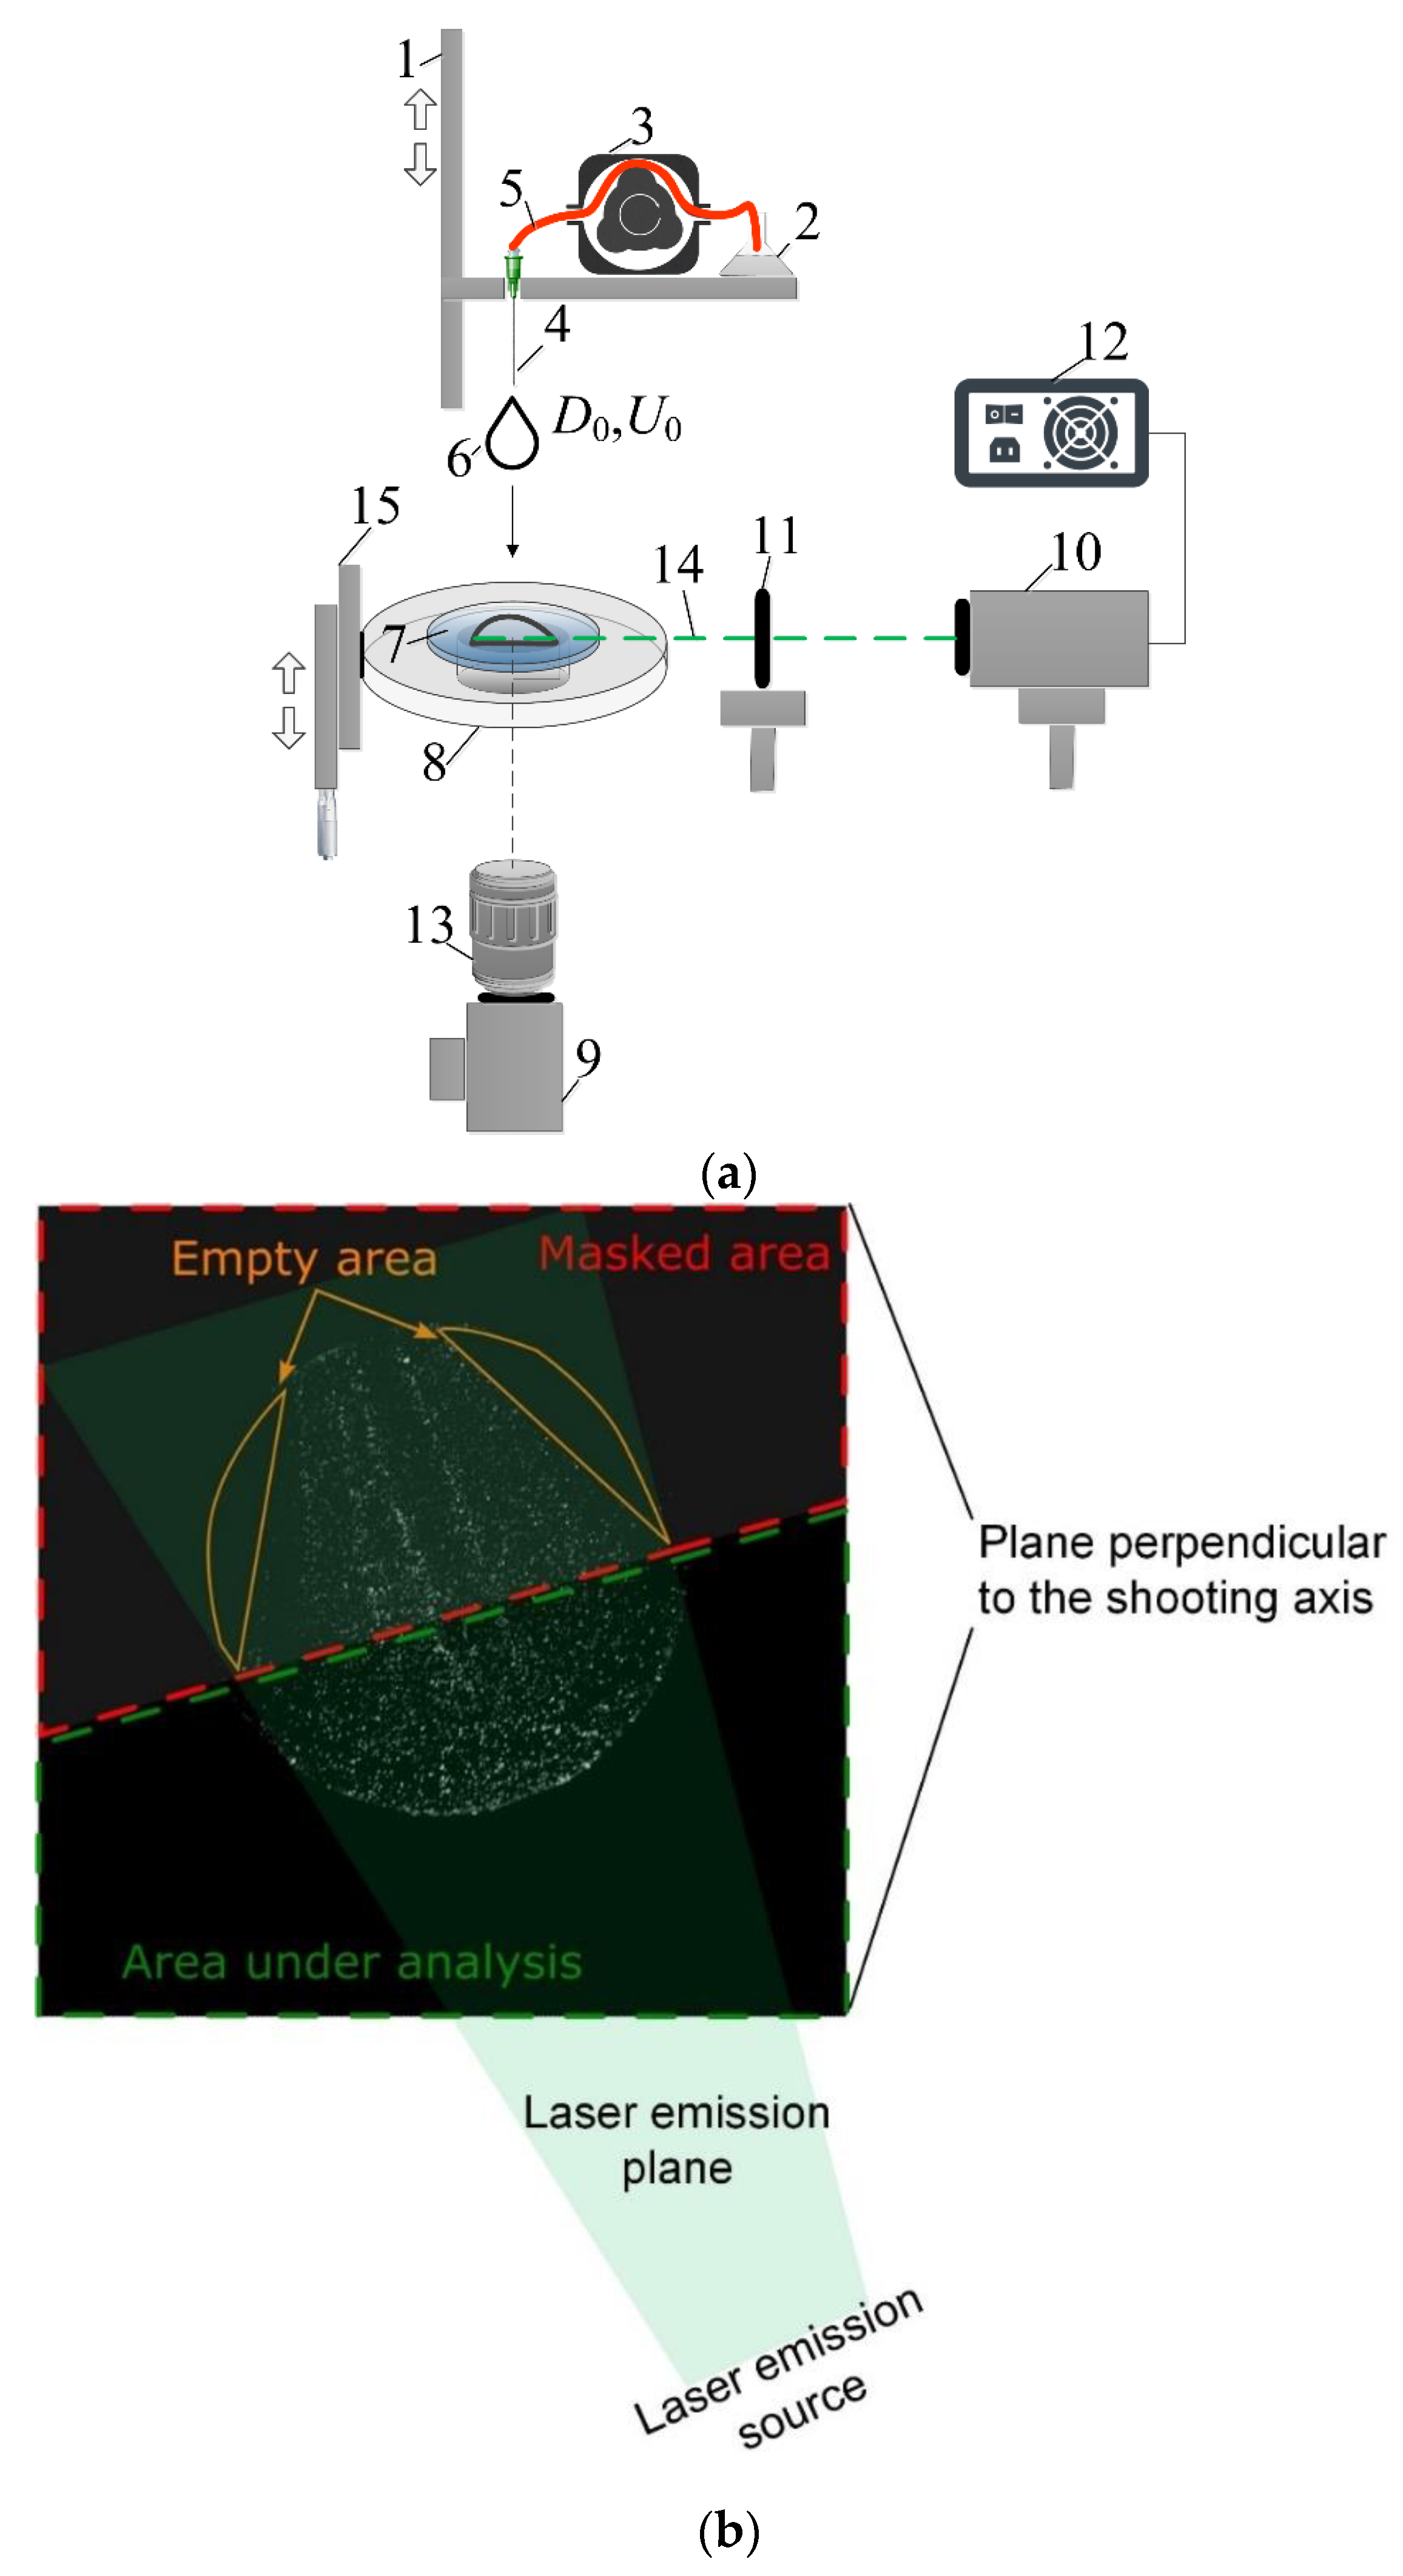
Figure 2.
Illustration of the image processing and construction of convective flow velocity fields: I – primary image; II – image after subtracting the background intensity; III – instantaneous velocity field; IV – instantaneous velocity field after the vector interpolation procedure.
Figure 2.
Illustration of the image processing and construction of convective flow velocity fields: I – primary image; II – image after subtracting the background intensity; III – instantaneous velocity field; IV – instantaneous velocity field after the vector interpolation procedure.
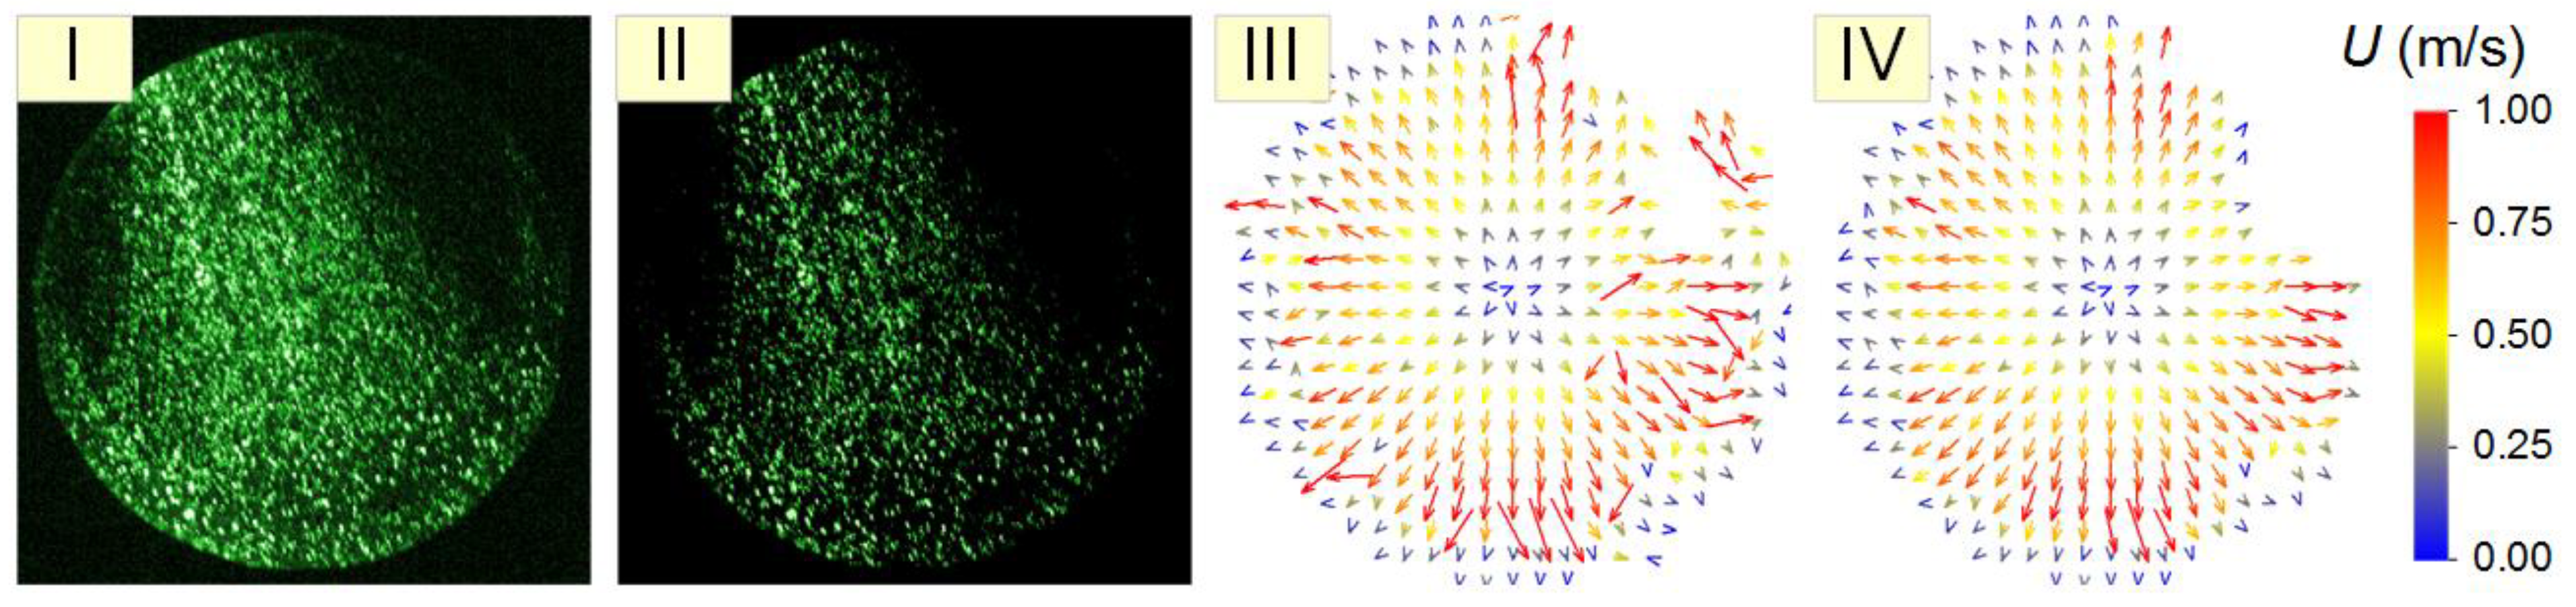
Figure 3.
Illustration of the approach to analyzing the maximum drop spreading diameter Dmax in shadow photography of the collision process.
Figure 3.
Illustration of the approach to analyzing the maximum drop spreading diameter Dmax in shadow photography of the collision process.
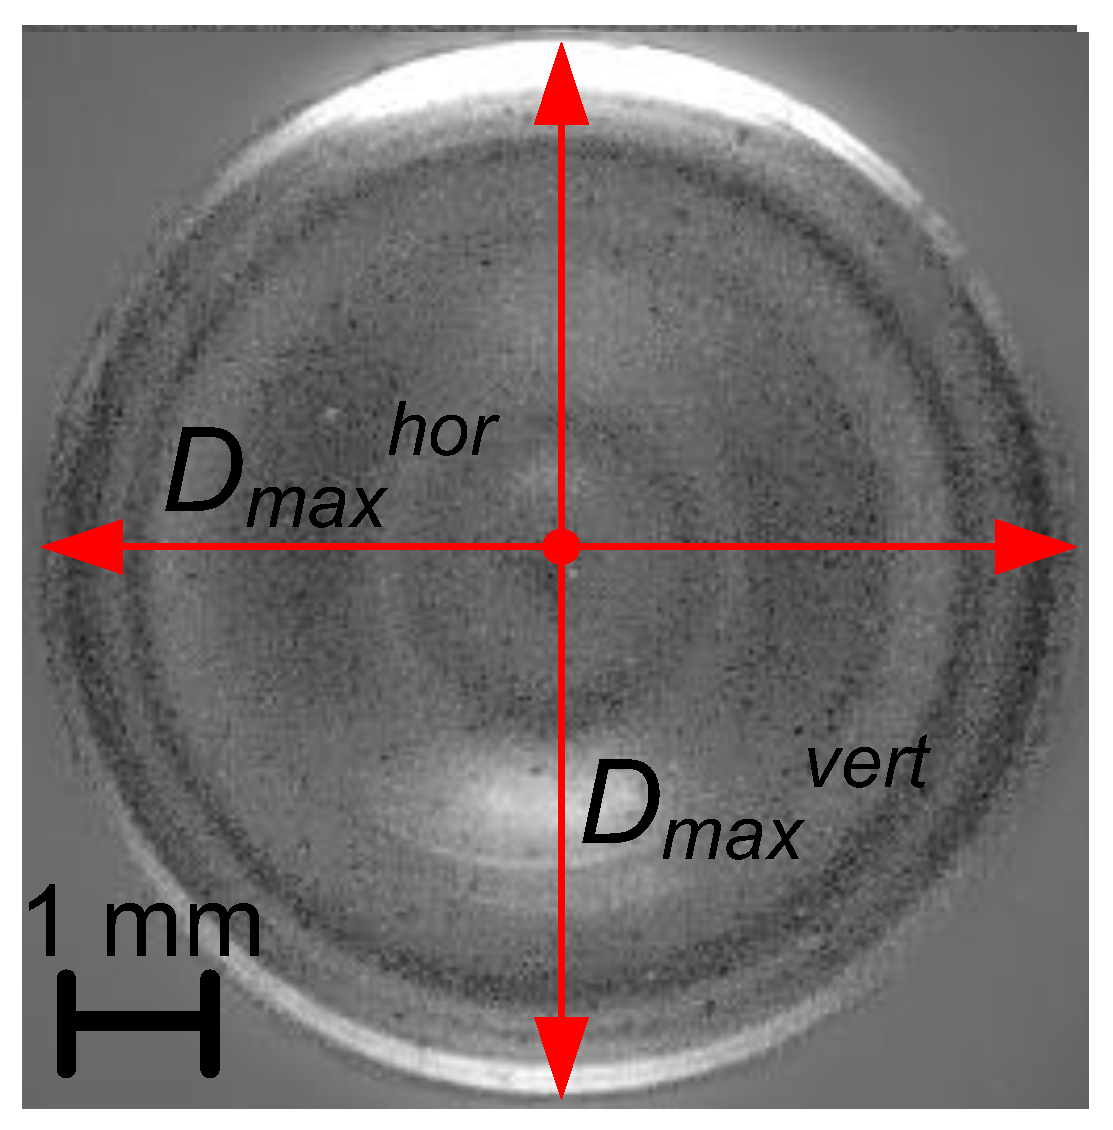
Figure 4.
Instantaneous maximum and average velocities of fluorescent microparticles in a spreading drop at We 30 as a function of the spreading time, as well as the insertion of velocity fields in the longitudinal section of the spreading drop at the following time points: 1 – 0.001 s; 2 – 0.0015 s; 3 – 0.0024 s; 4 – 0.004 s for Slurry 1 (a), Slurry 2 (b), Slurry 3 (c), Slurry 4 (d), water-glycerol solution (e). The confidence intervals for the experimental data were no more than 3.3 %.

Figure 5.
Effect of the Weber number and the concentration of coal particles on the distributions of the instantaneous maximum velocity of fluorescent microparticles in a drop over the spreading time: (a) – grinding fineness of coal particles 45-80 μm, We = 30; (b) – 45-80 μm, We = 120; (c) –120-140 μm, We = 30; (d) – 120-140 μm, We = 120. The confidence intervals for the experimental data were no more than 3.3%.
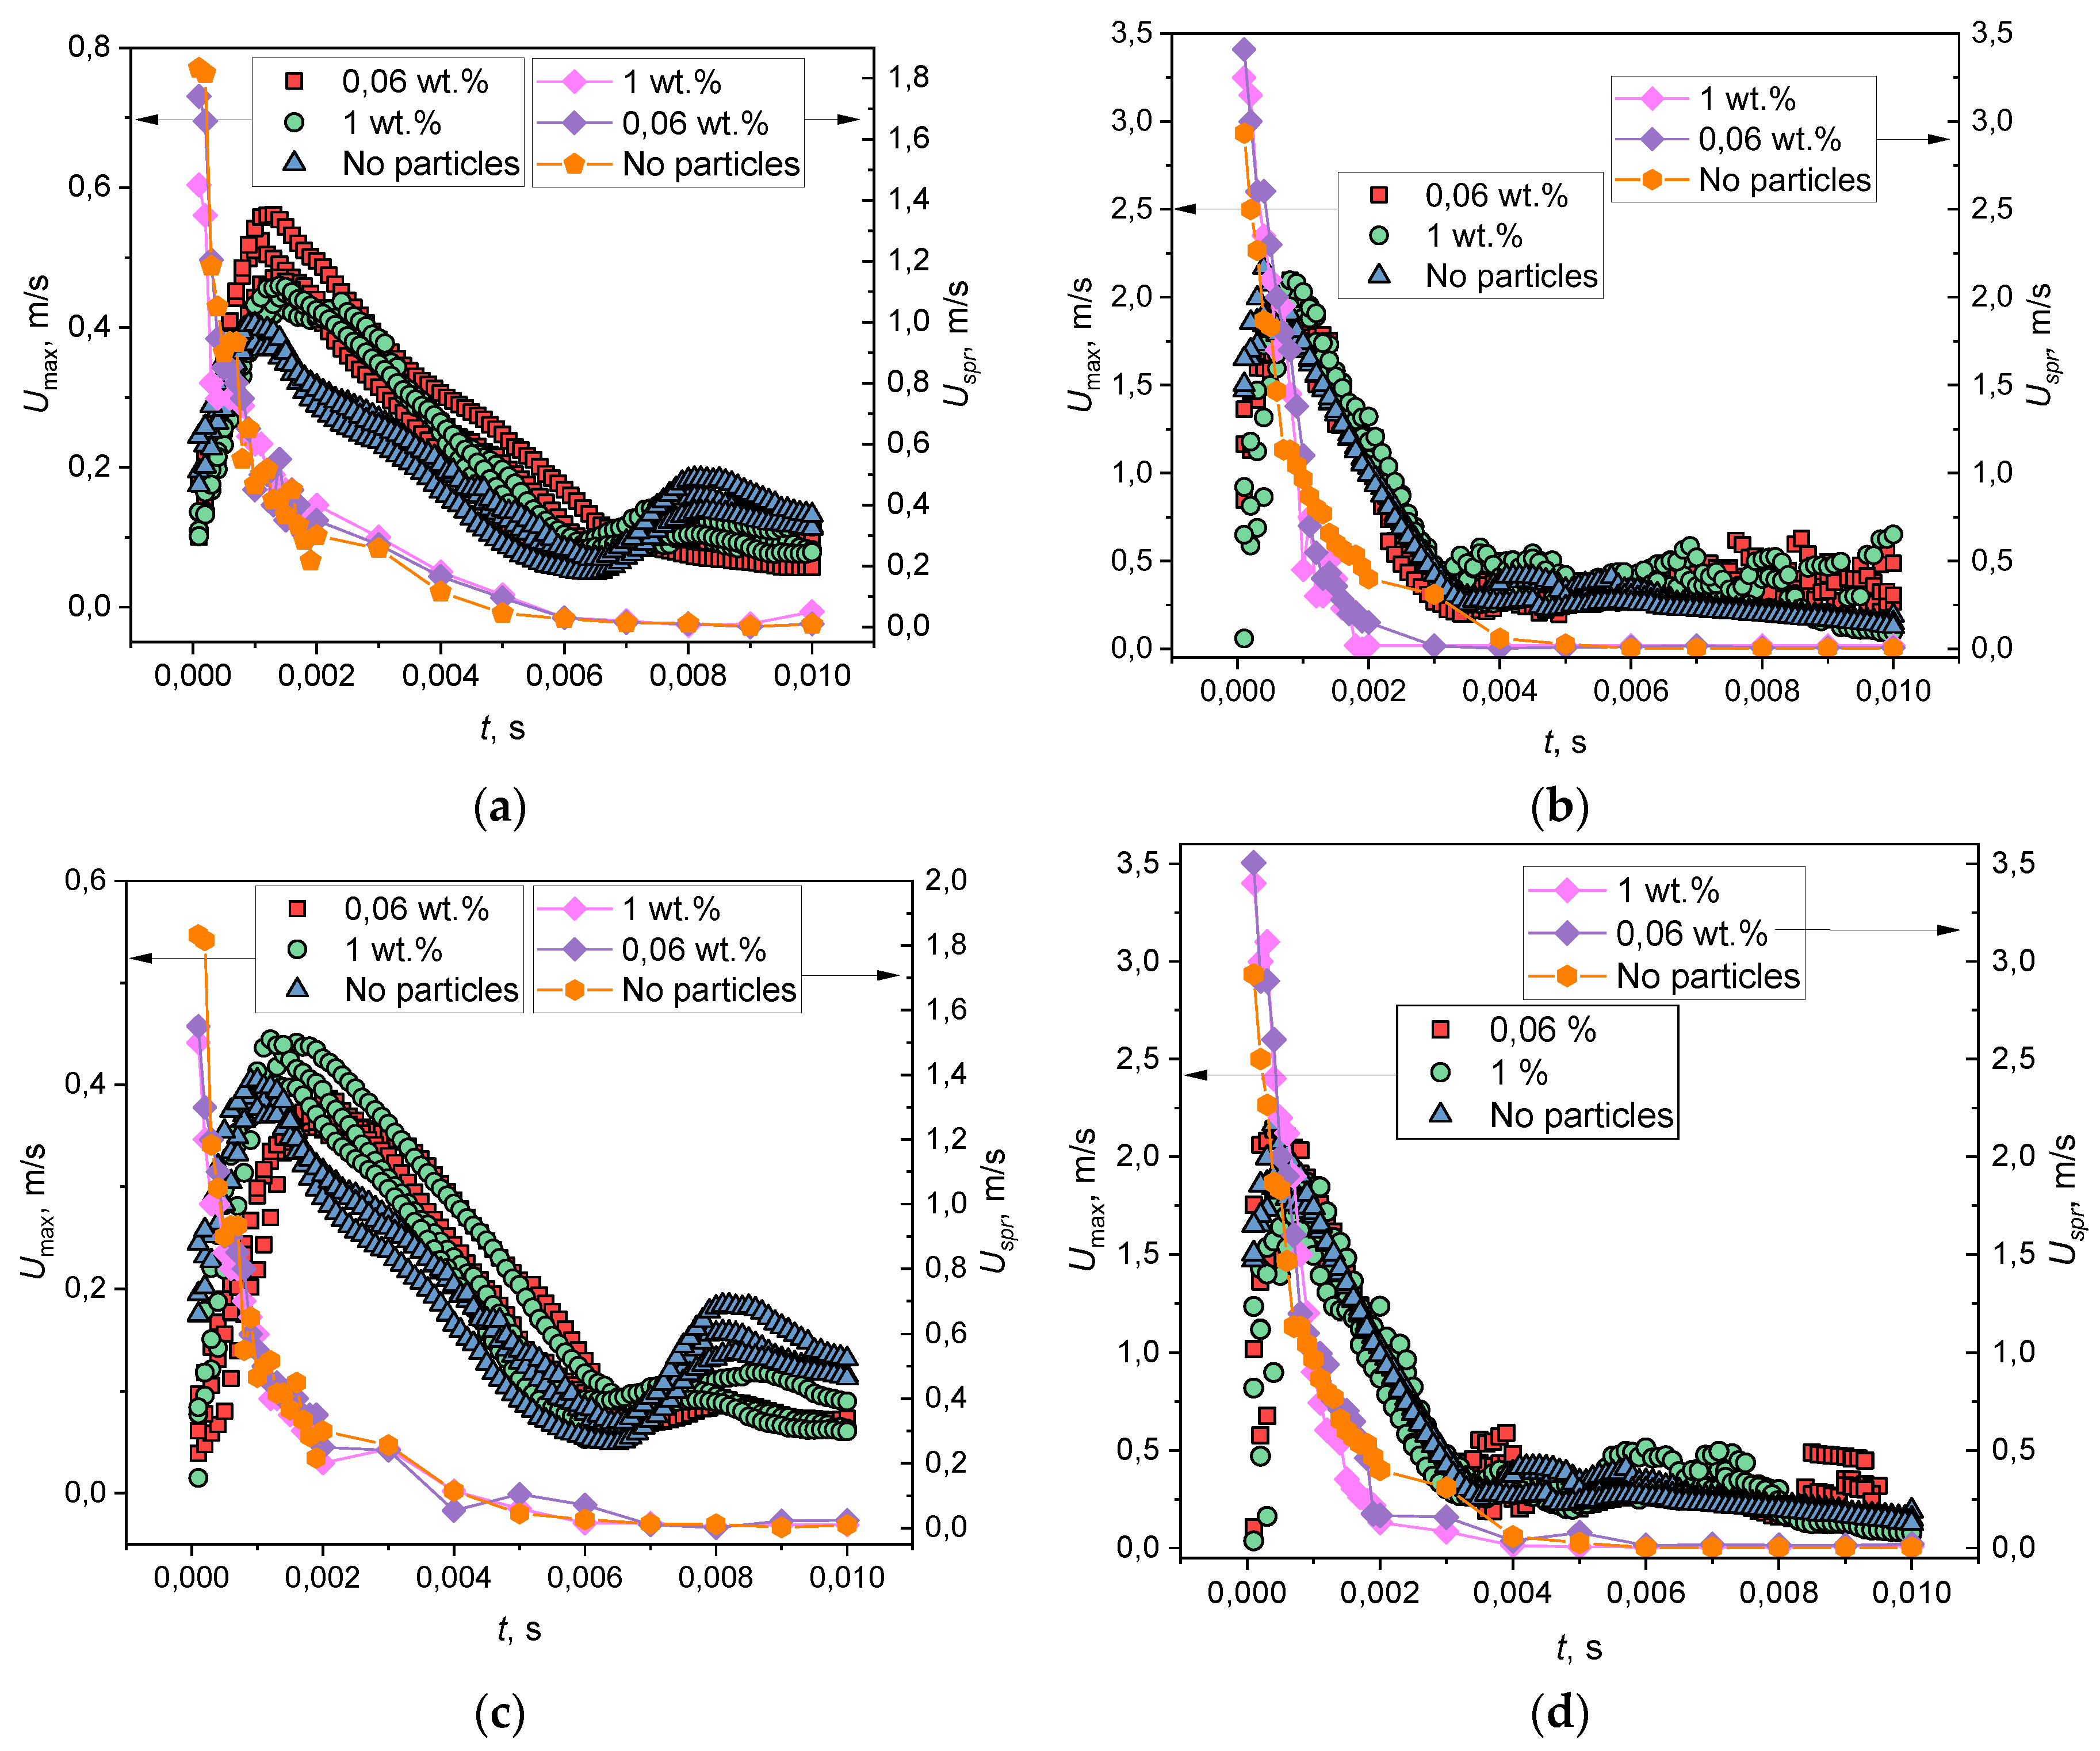
Figure 6.
Frames of the forming rim during the Slurry 4 drop spreading with a particle concentration of 1 wt.% and a grinding fineness of 120-140 μm at We=120 and t=1.3 ms (a), We=30 and t=3 ms (b); frame illustrating the appearance of a Slurry 2 drop with a particle concentration of 1 wt.% and a grinding fineness of 45-80 μm at We=120 and t=0.6 ms (c); frames illustrating the relative acceleration of a single coal particle in a drop of Slurry 1 (d); frames illustrating coal particles deposited at the liquid–substrate interface during most of the Slurry 3 drop spreading (e); frame of the mechanical deformation of the Slurry 4 drop rim due to perturbation by coal particles (f).
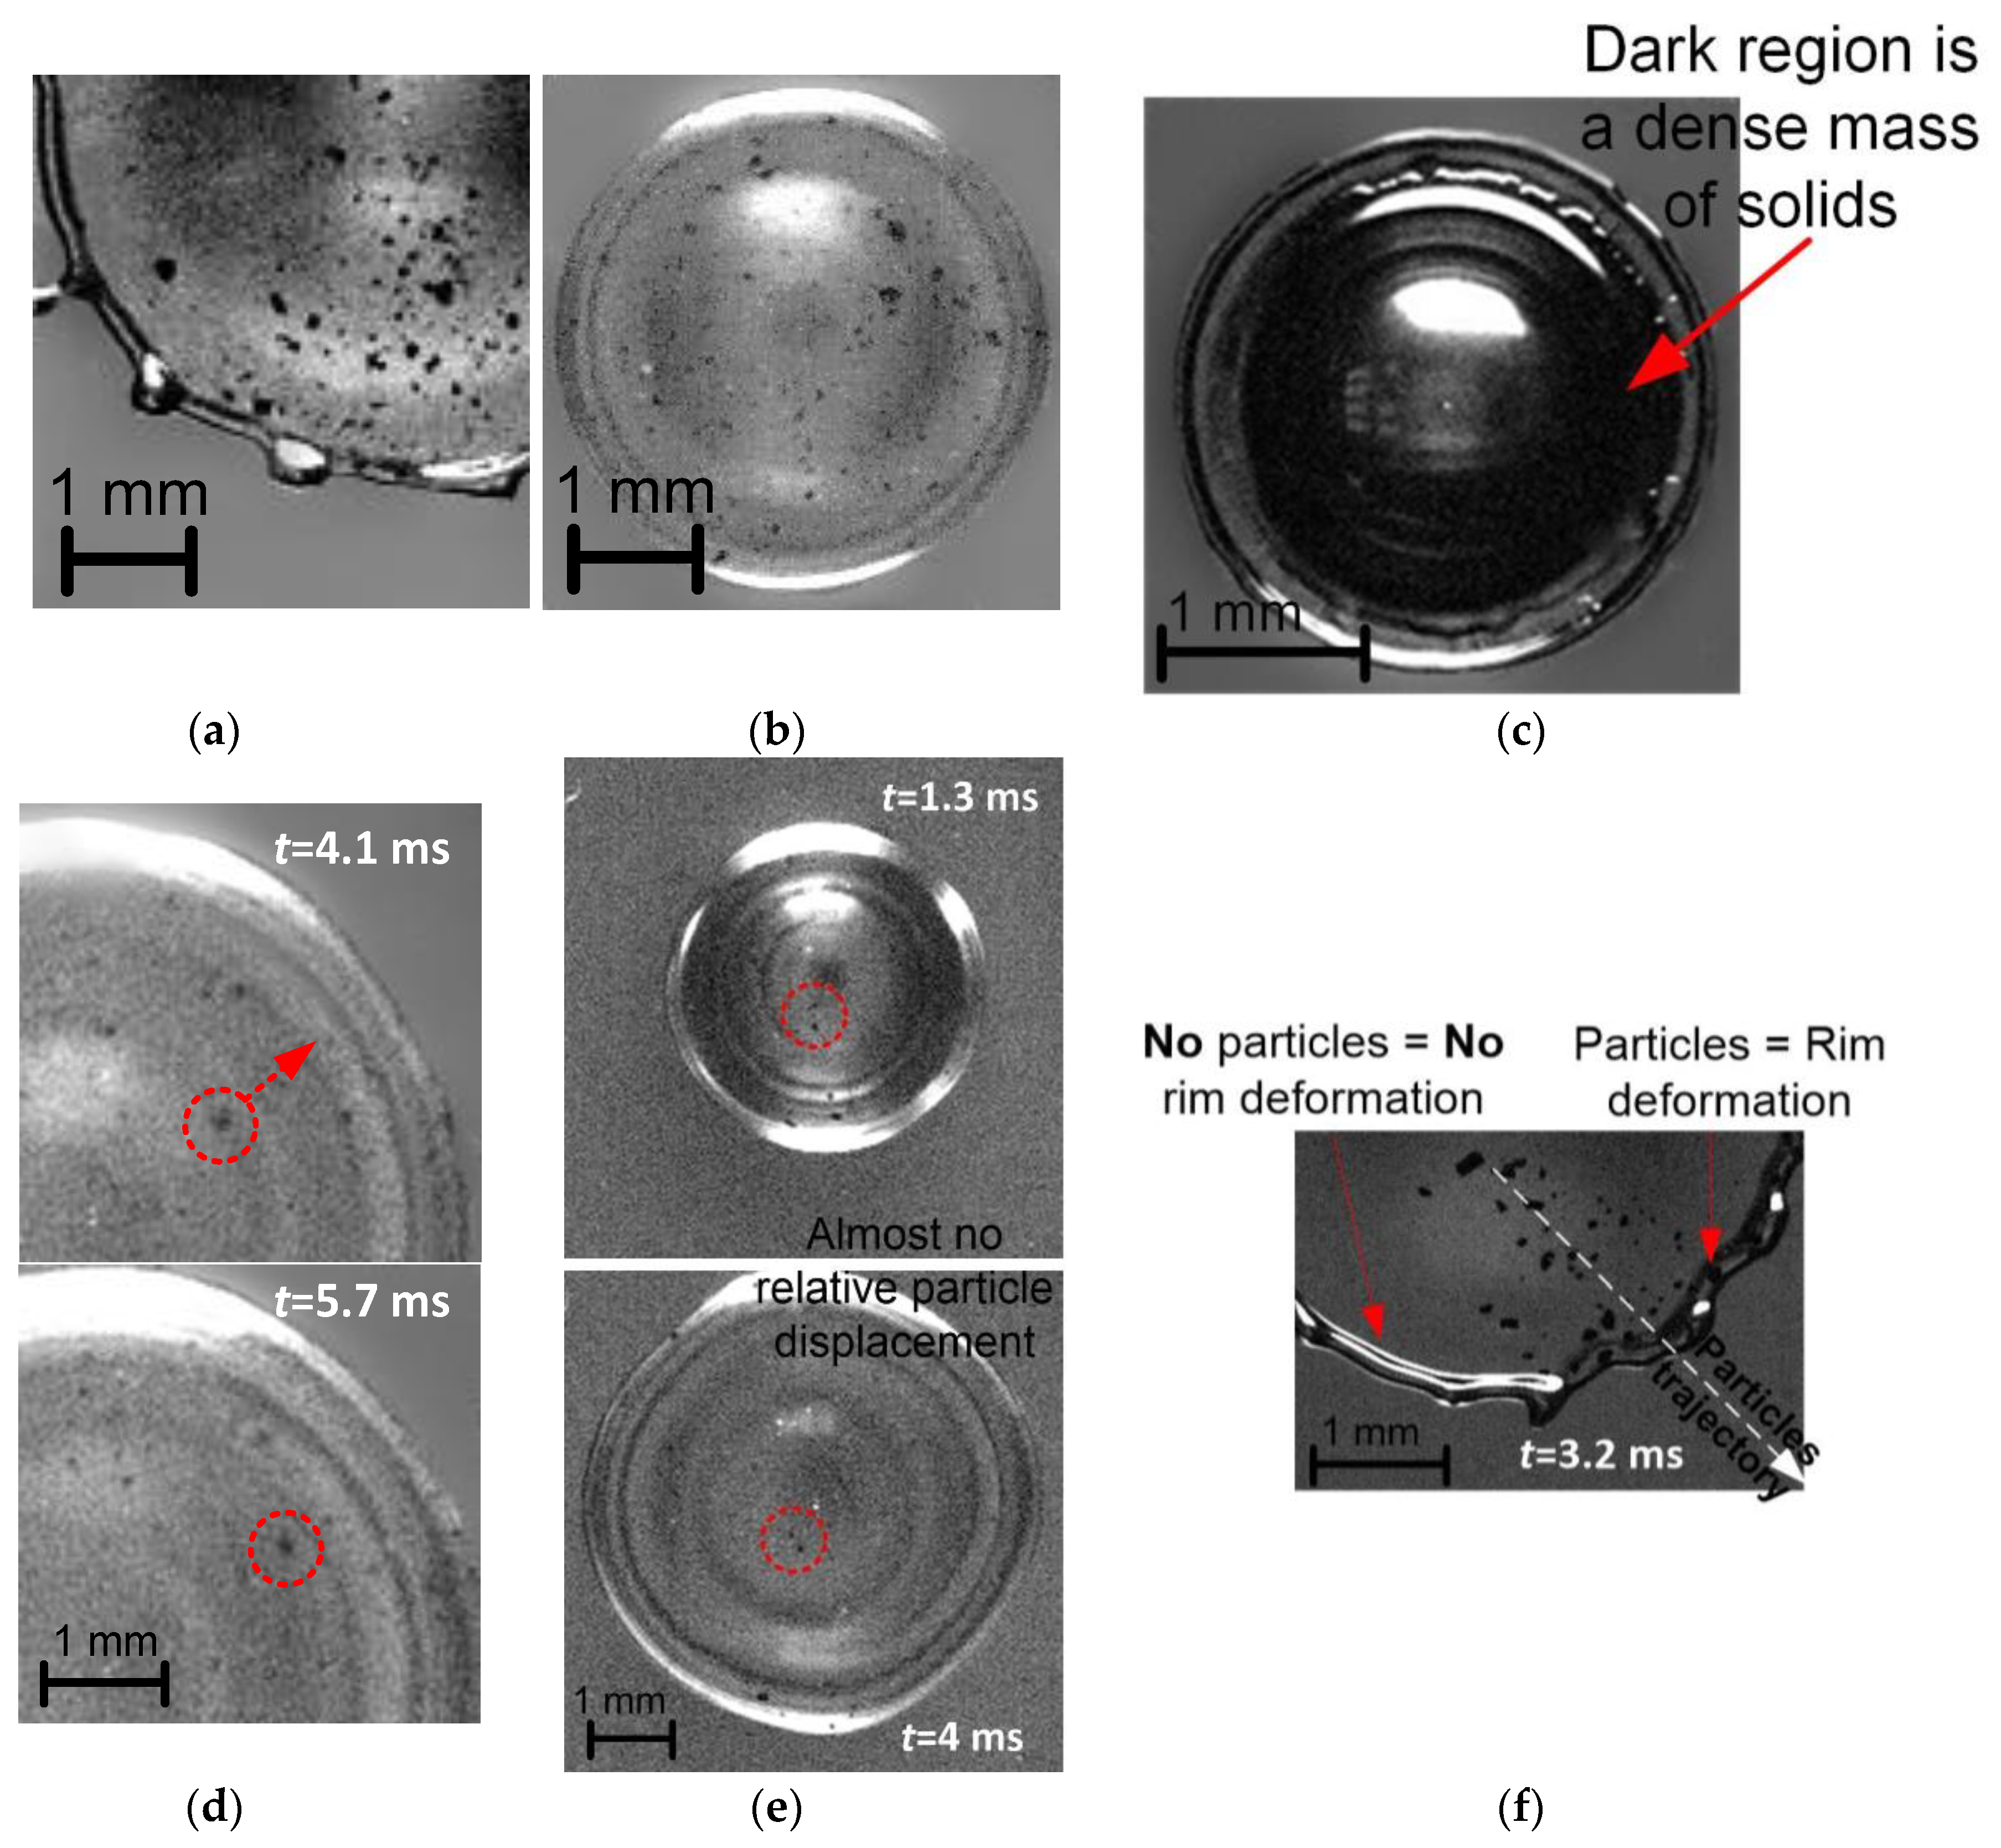
Figure 7.
Maximum absolute velocities of internal flows in a drop Umax as a function of the initial velocity of the drop before impact U0 (a), parameter Umax / U0 as a function of We (b).
Figure 7.
Maximum absolute velocities of internal flows in a drop Umax as a function of the initial velocity of the drop before impact U0 (a), parameter Umax / U0 as a function of We (b).
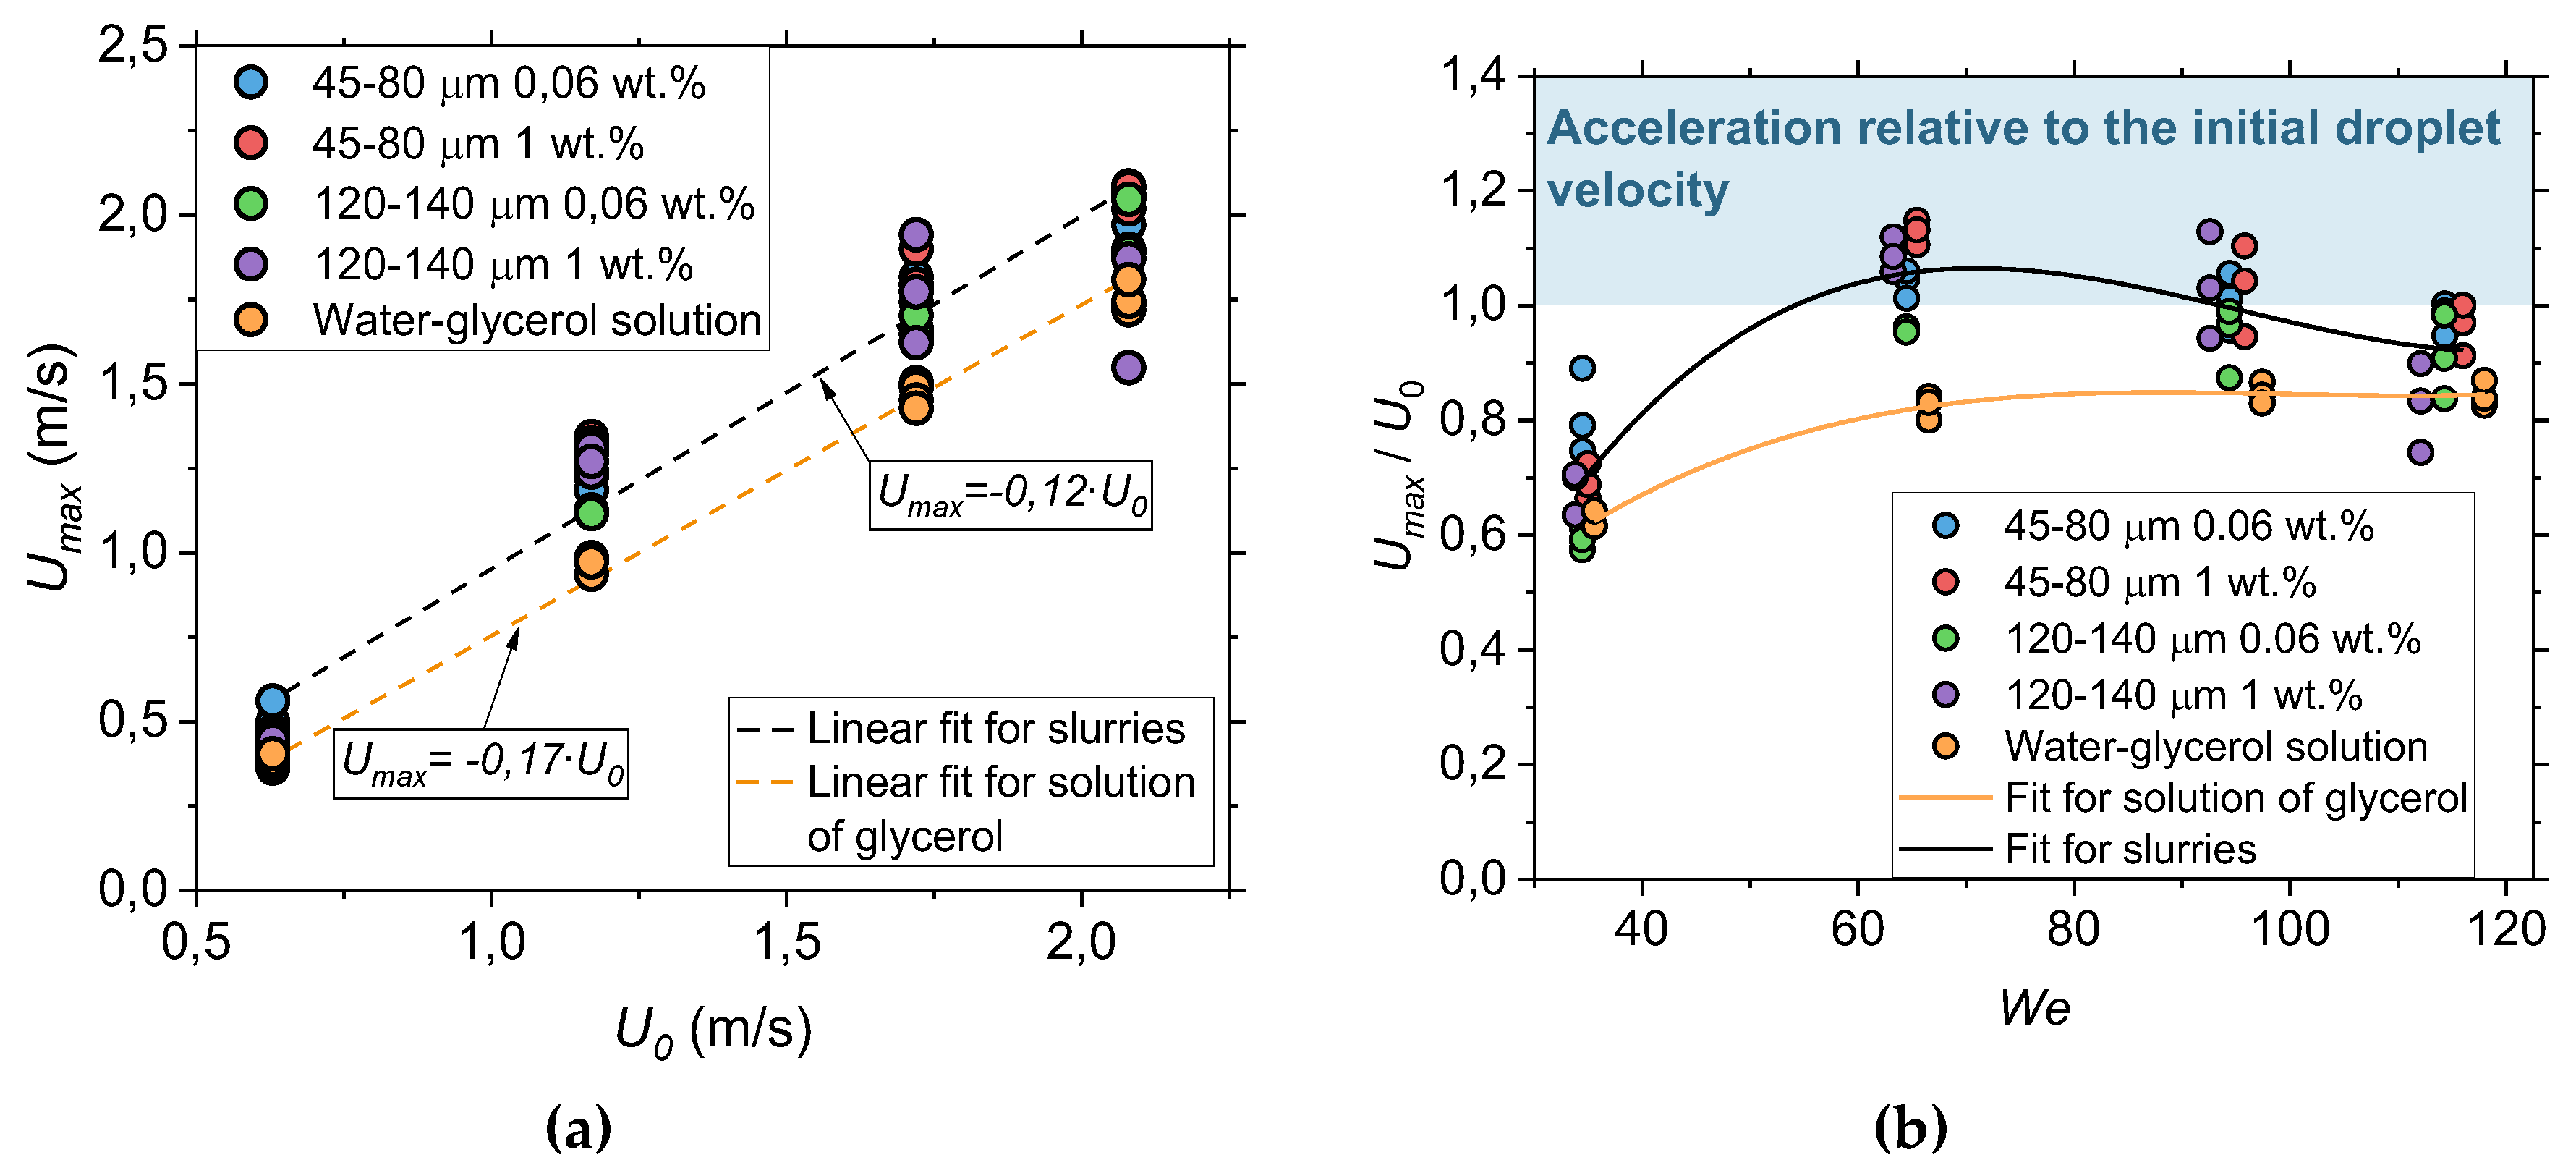
Figure 8.
Maximum spreading factor βmax and time to reach the maximum spreading diameter tmax for the considered liquids at We=30, 60, 90, and 120 (a); values of βmax as a function of We (b); values of βmax as a function of the dimensionless diameter of the spreading drop at the maximum velocity of internal flows DUmax / D0.
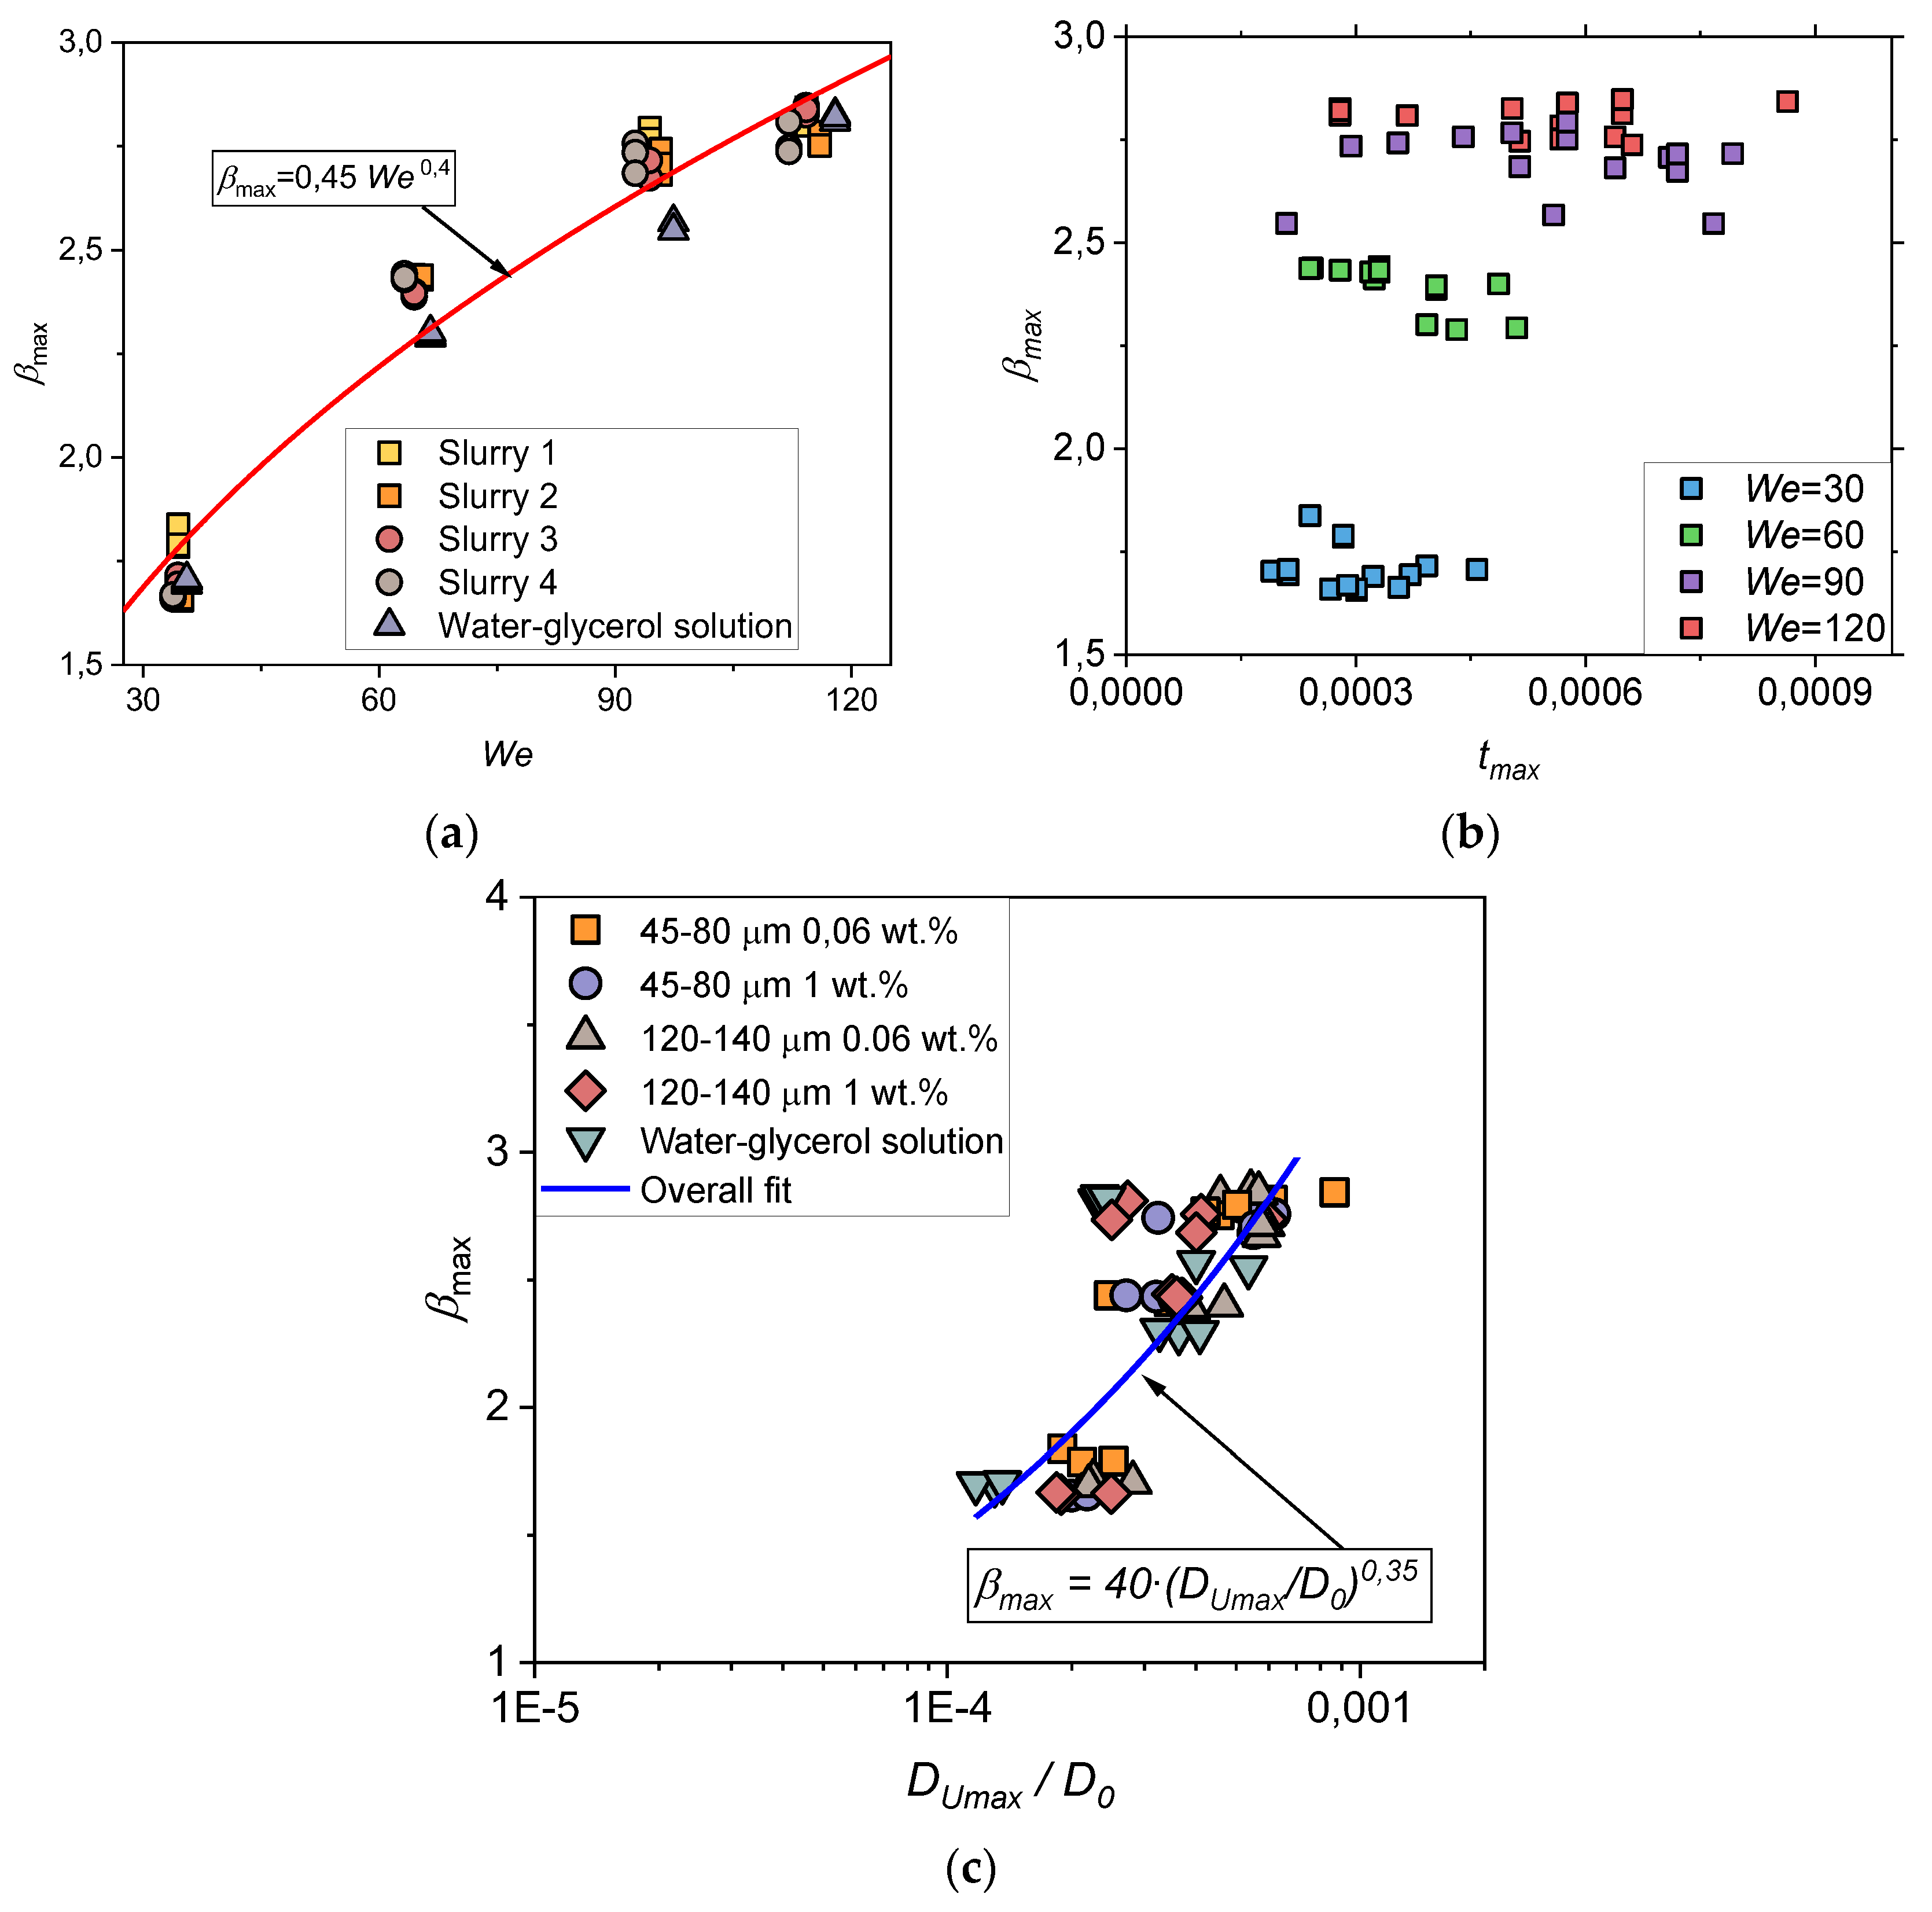
Figure 9.
Effect of Umax (a) and Umean (b) on the maximum spreading diameter at different grinding fineness of coal particles.
Figure 9.
Effect of Umax (a) and Umean (b) on the maximum spreading diameter at different grinding fineness of coal particles.
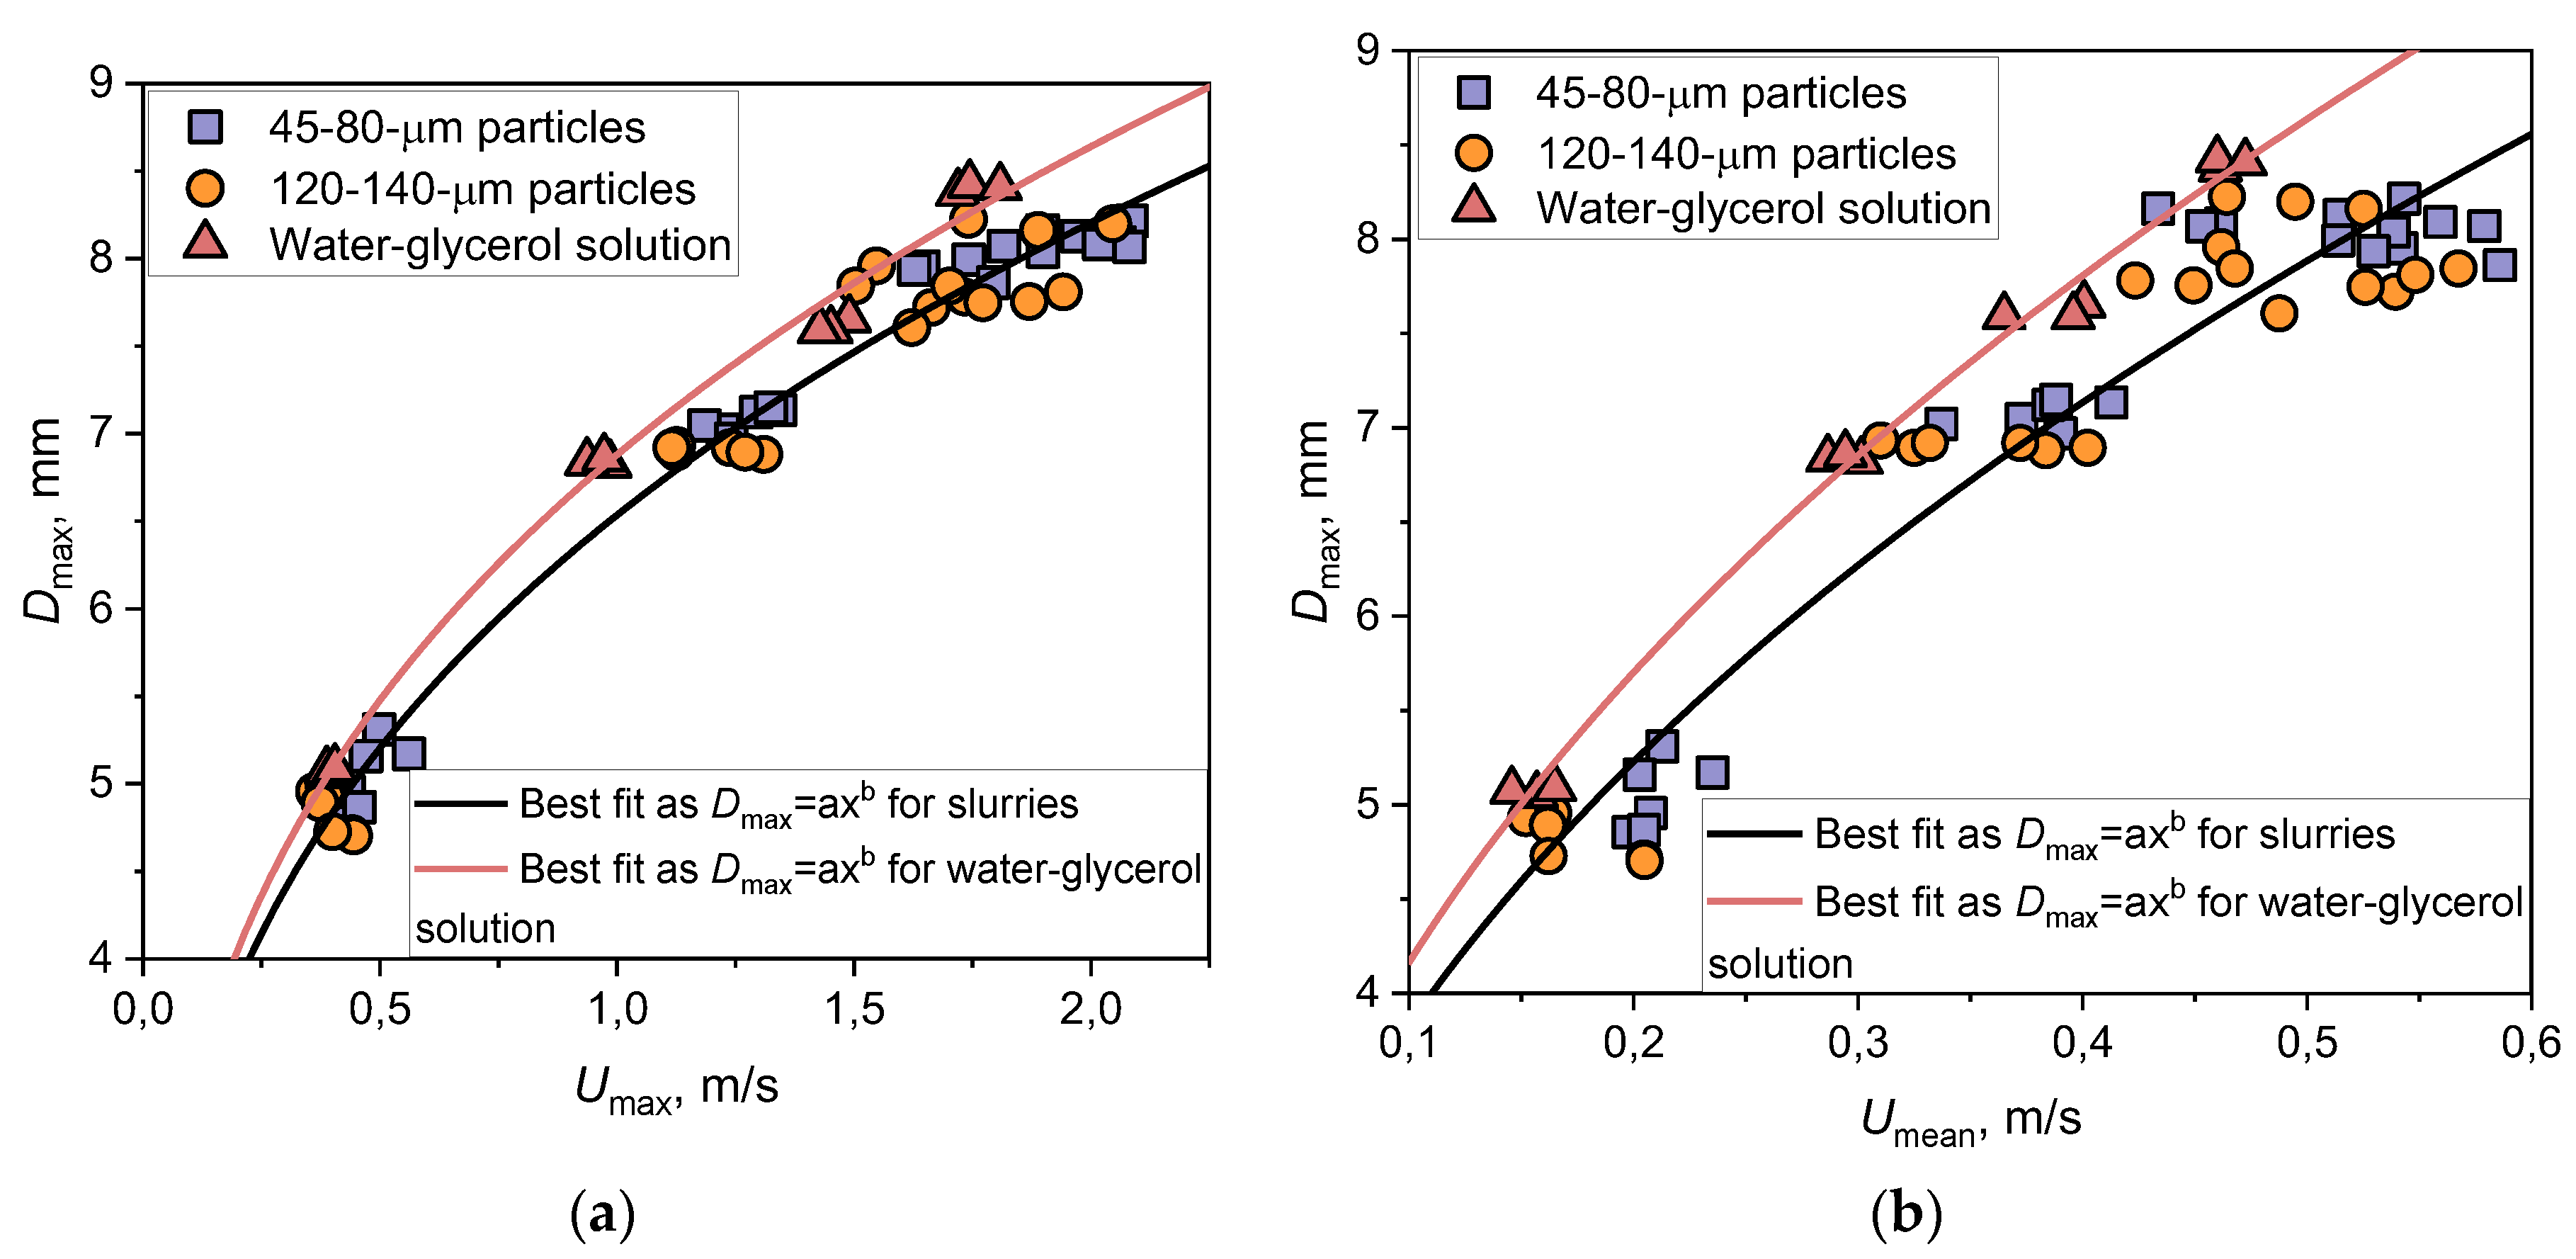

Table 1.
Elemental composition and main characteristics of the coking coal.
| Main characteristics | Elemental composition | ||||||||
|---|---|---|---|---|---|---|---|---|---|
| Substance | Wa, % | Ad, % | Vdaf, % | Qas,V, MJ/kg | Cdaf, % | Hdaf, % | Ndaf, % | Std, % | Odaf, % |
| Coking coal | 2.05 | 14.65 | 27.03 | 29.76 | 79.79 | 4.486 | 1.84 | 0.868 | 13.016 |
Table 2.
Properties of the water-glycerol solution.
| Temperature | Density, ρ | Dynamic viscosity, µ | Surface tension, σ |
|---|---|---|---|
| °C | kg/m3 | Pa·s | N/m |
| 20 | 1154 | 10.8·10-3 | 0.06058 |
Table 3.
Initial conditions for conducting experiments.
| Discharge height – 2 cm, We ≈ 30 | Coal grinding fineness | Sample name | Coal grinding fineness | Sample name | Number of experiments |
| 45-80 μm | - | 120-140 μm | - | pcs. | |
| Particle concentration, wt.% | 0.06 | Slurry 1 | 0.06 | Slurry 3 | 6 |
| 1 | Slurry 2 | 1 | Slurry 4 | 6 | |
| Discharge height – 7 cm, We ≈ 60 | Coal grinding fineness | Sample name | Coal grinding fineness | Sample name | Number of experiments |
| 45-80 μm | - | 120-140 μm | - | pcs. | |
| Particle concentration, wt.% | 0.06 | Slurry 1 | 0.06 | Slurry 3 | 6 |
| 1 | Slurry 2 | 1 | Slurry 4 | 6 | |
| Discharge height – 15 cm, We ≈ 90 | Coal grinding fineness | Sample name | Coal grinding fineness | Sample name | Number of experiments |
| 45-80 μm | - | 120-140 μm | - | pcs. | |
| Particle concentration, wt.% | 0.06 | Slurry 1 | 0.06 | Slurry 3 | 6 |
| 1 | Slurry 2 | 1 | Slurry 4 | 6 | |
| Discharge height – 22 cm, We ≈ 120 | Coal grinding fineness | Sample name | Coal grinding fineness | Sample name | Number of experiments |
| 45-80 μm | - | 120-140 μm | - | pcs. | |
| Particle concentration, wt.% | 0.06 | Slurry 1 | 0.06 | Slurry 3 | 6 |
| 1 | Slurry 2 | 1 | Slurry 4 | 6 | |
| Total | 48 | ||||
Disclaimer/Publisher’s Note: The statements, opinions and data contained in all publications are solely those of the individual author(s) and contributor(s) and not of MDPI and/or the editor(s). MDPI and/or the editor(s) disclaim responsibility for any injury to people or property resulting from any ideas, methods, instructions or products referred to in the content. |
© 2023 by the authors. Licensee MDPI, Basel, Switzerland. This article is an open access article distributed under the terms and conditions of the Creative Commons Attribution (CC BY) license (http://creativecommons.org/licenses/by/4.0/).
Copyright: This open access article is published under a Creative Commons CC BY 4.0 license, which permit the free download, distribution, and reuse, provided that the author and preprint are cited in any reuse.


