Submitted:
24 June 2023
Posted:
25 June 2023
You are already at the latest version
Abstract
Taking Shanxi Province, a typical energy region in China, as the research object, data on economic development quality and environmental pollution intensity from 2001 to 2021 were selected. Linear regression, numerical simulation, and Pearson correlation coefficient were used to analyze the evolution characteristics of economic development quality and environmental pollution intensity in Shanxi Province in the past 20 years, and to explore the relationship between economic development and environmental pollution. The results indicate that since 2001, Shanxi Province has made long-term progress in economic development, with GDP increasing by nearly 10 times and an average annual growth rate of around 7%. In the past 20 years, the main pollutants have shown a trend of increasing first and then decreasing steadily, with a turning point occurring during the "12th Five Year Plan" period. This shows that the environmental policies and investments of the Chinese and Shanxi provincial governments in the past 10 years have been effective in the new era. The numerical simulation curve results show that the per capita GDP exhibits a classic inverted "U" curve relationship with wastewater and SO2 emissions, with a turning point occurring at around 20000 yuan per capita GDP; However, there is a monotonic decreasing trend with Chemical oxygen demand and ammonia nitrogen emissions, and a monotonic increasing trend with solid waste generation. There is no turning point yet. The correlation analysis results further support the fitting curve conclusion.
Keywords:
Environmental pollution
; Numerical fitting
; Economic growth
; Industrial three wastes
; sustainable development
Introduction
Since the establishment of the People’s Republic of China, China has achieved a transformation from an agricultural country to an industrial country. In the process of industrialization and urbanization, like most developed countries, rapid economic development comes at the cost of excessive consumption of natural resources and damage to the ecological environment. While people enjoy the enormous benefits brought by economic development, they also have to bear various injuries caused by environmental problems [1].
Faced with the increasingly serious environmental pollution problem, China has abandoned the outdated concept of development before governance, and continuously increased the protection of the ecological environment, in order to coordinate the promotion of ecological environment and economic development, and take the path of sustainable development. From the inclusion of ecological civilization construction in the overall layout of the “Five in One” at the 18th National Congress of the Communist Party of China, to the important elaboration of promoting green development as the first step in the reform of the ecological civilization system at the 19th National Congress of the Communist Party of China, and to the proposal at the 20th National Congress of the Communist Party of China that one of the important features of building socialist modernization in China is the modernization of harmonious coexistence between humans and nature, emphasizing the synchronous promotion of material civilization construction and ecological civilization construction [2,3,4].
The coupling Relational model of economic growth and ecological environment has always been one of the hot issues in Global studies [5,6,7,8,9]. However, most studies focus on coastal cities or first tier developed areas [10,11,12,13], with relatively few related studies taking typical energy regions as examples. Shanxi Province, as a typical energy region in China, with coal, energy, and chemical industries as the leading industries, is an important industrial and energy base in northern China. Its economic development and environmental pollution issues have also attracted scholars’ attention. On the basis of reviewing previous research results, this study explores the evolution characteristics of economic development and environmental pollution in typical energy regions of Shanxi Province. Linear regression, Pearson correlation coefficient, and numerical simulation methods are used to study the changing characteristics and dominant factors of regional economic development quality and environmental pollution intensity. This is of great significance for improving urban environmental quality and improving residents’ living standards, At the same time, it can provide scientific basis and theoretical reference for achieving sustainable development in typical energy regions.
1. Materials and Methods
1.1. Data Sources
Relevant economic development quality data and environmental pollution intensity data were collected and sorted out through the Shanxi Statistical Yearbook (2001–2021), the national database, the people’s government website, etc. The missing data were fitted and supplemented by establishing a linear regression equation according to the existing data.
1.2. Research Methods
(1) Empirical analysis method. Collect data on the quality of economic development and environmental pollution intensity in Shanxi Province in recent years, including GDP and per capita GDP, permanent population, and per capita disposable income; Industrial pollutant emissions (wastewater, solid waste, Chemical oxygen demand, ammonia nitrogen emissions, nitrogen oxides, smoke, dust, sulfur dioxide) and other indicators, statistical analysis of the collected data, based on the theoretical framework established by normative analysis, build a model of urban economic development and environmental pollution.
(2) Statistical analysis method. Draw a scatter plot using economic development quality indicators and environmental pollution intensity indicators as vertical and horizontal coordinates. Based on the distribution of the scatter plot, select appropriate fitting curves, such as exponential curves, linear curves, logarithmic curves, etc. Calculate the correlation coefficient between the quality of economic development and the intensity of environmental pollution, and determine the correlation between the two. The data processing, analysis, and plotting in the article were calculated and analyzed using Excel 2010 software and SPSS Statistics 26 software.
2. Results and Analysis
2.1. Characteristics of Changes in the Quality of Economic Development
From Figure 1a, it can be seen that the GDP of Shanxi Province has increased from 202.95 billion yuan in 2001 to 2259.02 billion yuan in 2021, with an average annual growth rate of 7% [14]. However, the performance in terms of the fluctuation range of growth rates is not stable. In the past 20 years, its growth rate has shown some cyclical changes. Specifically, the GDP growth rate of Shanxi Province showed an upward trend from 2001 to 2003; In 2004, there was a downward trend and a brief stagnation in economic growth; In 2006, the economy rebounded and showed an increase; From 2007 to 2008, due to the global economic crisis, the economy of Shanxi Province also experienced a significant decline; Until 2010, the economy showed an upward trend; But then the economy declined until 2017, when it warmed up again, but then declined again until an upward trend appeared in 2021. The entire economic growth cycle has gone through multiple fluctuation cycles, with varying degrees of growth and decline. The fluctuations in this economic growth cycle can be interpreted and analyzed from multiple perspectives. For example, changes in various market factors, including changes in internal and external demand, changes in policy environment, etc., may have a significant impact on economic growth rates. In addition, the special resource environment of Shanxi Province may also have a significant impact on its economic growth. In summary, the economic growth trends presented by the data need to be analyzed based on multiple considerations.
From Figure 1b, it can be seen that in the past 20 years, the per capita GDP of Shanxi Province has shown an overall growth trend. Except for the negative growth rates in 2009 and 2015, the growth rates in other years have been positive. From 6226 yuan in 2001 to 64821 yuan in 2021, the average annual growth rate has reached 12.82%, but the per capita GDP growth rate is unstable, with significant fluctuations, and the trend of change is consistent with GDP. From 2001 to 2003, there was an upward trend, and in 2004, there was a downward trend. In 2006, the economy warmed up and rose. From 2007 to 2008, due to the impact of the world economic crisis, the economy of Shanxi Province also declined significantly. Until 2010, with the rise of Gross regional product, it rose, and then continued to decline. Until 2017, the economic growth rate of Shanxi Province rose, and then continued to decline. In 2021, there was an upward trend.
According to Figure 1c, the analysis of Gross regional product index of Shanxi Province in recent 20 years shows that economic growth shows multiple cyclical fluctuations. Specifically, during 2002~2005, the index of Gross regional product of Shanxi Province showed a great downward trend. It can be seen that the economic development of Shanxi Province has encountered significant pressure during this stage, which may involve factors such as changes in the market environment and policy adjustments. However, between 2006 and 2007, the economic growth of Shanxi Province once again showed an upward trend, which may be related to factors such as the improvement of the domestic market environment and favorable policies at that time. Afterwards, the economic growth situation once again showed a significant downward trend. Specifically, during the three years from 2007 to 2009, the Gross regional product index of Shanxi Province showed an obvious downward trend, which may be related to the impact of the international financial crisis and other factors at that time. From 2010 to 2015, the economic growth of Shanxi Province has been in a declining state, indicating that at that time, the economic development of Shanxi Province faced some new structural pressures, such as a focus on traditional industries and insufficient support for emerging industries. During the “Twelfth Five Year Plan” period, the economic growth of Shanxi Province gradually showed an upward trend, and the indicators showed that the Gross regional product index had narrowed, that is, its quality was slowly rising. By 2020, the economic growth of Shanxi Province will again turn into a declining state, which may be due to the impact of the COVID-19. It should be noted that in 2021, the GDP of Gross regional product will rise again, which may mean that the economic development of Shanxi Province has begun to recover and new growth opportunities have been obtained. Overall, from these indicator data, we can see the development trend of the economy in Shanxi Province, and it also reminds us to rationally view the phenomenon of economic growth and fluctuations, and take effective measures to strengthen support and ensure its sustainable economic development.
2.2. Characteristics of Changes in the Three Major Industries
From Figure 2a, it can be concluded that in the past 20 years, the total output value of the three major industries in Shanxi Province has shown an upward trend. The total output value of Primary sector of the economy in Shanxi Province increased from 17.109 billion yuan in 2001 to 128.687 billion yuan in 2021, with an average annual growth rate of 11.09%. The total output value of Secondary sector of the economy in Shanxi Province increased from 95.6 billion yuan in 2001 to 112.131 billion yuan in 2021, with an average annual growth rate of 14.31%. The total output value of Tertiary sector of the economy in Shanxi Province increased from 90.243 billion yuan in 2001 to 100.906 billion yuan in 2021, with an average annual growth rate of 12.95%. Over time, the total output value of the Primary sector of the economy has shown a downward trend year by year, while that of the Secondary sector of the economy has gradually increased and fluctuated in recent years. At the same time, the gross output value of the Tertiary sector of the economy also continued to grow and accounted for an increasingly important proportion in the entire GDP. The proportion of gross output value of Primary sector of the economy in GDP fluctuates greatly, indicating that agricultural development is not stable enough. The total output value of the three major industries in Shanxi Province has increased in absolute terms. The growth rate of the Primary sector of the economy is relatively slow but has been growing steadily. The average annual growth rate of the Secondary sector of the economy is relatively large but the growth is unstable. The Tertiary sector of the economy shows a relatively stable and rapid growth.
From Figure 2b, it can be observed that in the past 20 years, the industrial structure of Shanxi Province has undergone a series of changes. According to the data, the proportion of the gross output value of the Primary sector of the economy in GDP has remained relatively stable and basically flat. The proportion of gross output value of the Secondary sector of the economy in GDP has experienced a wave of rise and then began to decline gradually, which has been strengthened in recent years. At the same time, the proportion of gross output value of the Tertiary sector of the economy in GDP also shows a volatility, which has experienced a wave of decline and then began to rise. Overall, the industrial structure of Shanxi Province has undergone significant changes in the past 20 years. The Secondary sector of the economy has always accounted for the main proportion of the total GDP, while the Primary sector of the economy and Tertiary sector of the economy are always in a secondary position. However, with the change of the times, the industry of Shanxi Province is also gradually transforming to light industry, which makes the proportion of the Secondary sector of the economy gradually decline. At the same time, with the vigorous development of the service industry, the Tertiary sector of the economy has begun to emerge gradually, and has now become a very important part of Shanxi’s GDP. However, in 2021, we found that the proportion of the Secondary sector of the economy has actually increased by a small margin. This trend may be caused by unstable factors in the world economy and fluctuations in international raw material prices.
2.3. Characteristics of Changes in Environmental Pollution Intensity
It can be seen from Figure 3 that the intensity of major pollutants (wastewater, solid waste, Chemical oxygen demand, ammonia nitrogen emissions, nitrogen oxides, smoke, dust, sulfur dioxide) in Shanxi Province in the past 20 years has shown a trend of first rising and then stabilizing. The turning point occurred around 2012 during the “12th Five Year Plan” period. The change of pollutants from 2001 to 2012 showed a steady upward trend, and after the “12th Five Year Plan” period, it basically showed a steady downward trend.
From Figure 3a, it can be seen that the total amount of wastewater discharge in Shanxi Province has remained relatively stable, except for a significant decrease from 2014 to 2017. The production of solid waste has shown an upward trend, with only a brief decline in 2008 and 2014, and a certain increase in other years. The change of Chemical oxygen demand is relatively obvious, and the emission of Chemical oxygen demand decreases significantly, from 78806.9 t in 2013 to 4515 t in 2021. The total amount of ammonia nitrogen emissions has remained relatively stable and steadily decreasing for nearly 20 years. From Figure 3b, it can be seen that from 2001 to 2015, the emissions of nitrogen oxides increased from 86.36 in 2013 × 104 tons, reduced to 17.37 in 2021 × 104 tons, with an annual growth rate of -79.85%. From 2001 to 2010, the emission of smoke and dust showed a decrease, from 832000 tons in 2001 to 432000 tons in 2010. The emission of dust decreased from 2001 to 2002, followed by a slight increase from 2002 to 2005, but maintained a relatively stable downward trend until reaching 365000 tons in 2010. The emission of sulfur dioxide remained stable at around 1 million tons, with a significant decrease in 2016, from around 900000 tons to around 380000 tons. Afterwards, it showed a slow decline trend.
2.4. Analysis of Fitting Characteristics between Economic Development Quality and Environmental Pollution Intensity
According to the previous research [15], this paper selects the per capita GDP of Shanxi Province as an indicator to measure the quality of economic development, and takes wastewater (WW), solid waste (SW), Chemical oxygen demand (COD), ammonia nitrogen emissions (NH3-N), and sulfur dioxide (SO2) emissions as environmental pollution intensity indicators to conduct numerical simulation research. The research time axis is from 2001 to 2021, a total of 21 years.
- 1.
- Fitting curve between per capita GDP and wastewater discharge
The fitting results are shown in Figure 4a. The results show that the fitting effect between per capita GDP and wastewater discharge is good, showing a classic inverted “U” relationship. The regression fitting equation is y=1E-09x3-0.0001x2+4.5777x+2145.4, R ² = 0.7122. From the curve, it can be seen that with the growth of per capita GDP, the wastewater discharge in Shanxi Province shows a trend of first increasing and then decreasing. The more ambiguous turning point appears at around 20000 yuan per capita GDP. Around 2014, with the continued growth of per capita GDP, the wastewater discharge in Shanxi Province decreased.
- 2.
- Fitting curve between per capita GDP and solid waste production
The fitting results are shown in Figure 4b, which shows a monotonically increasing relationship between per capita GDP and solid waste production. The regression fitting equation is y=1E-09x3-4E-05x2+0.9333x+3046.3, R ² = 0.9907. From the curve, it can be seen that with the growth of per capita GDP, the production of solid waste in Shanxi Province shows a gradual upward trend, which can be roughly described as the left side of the inverted “U” curve and is still in a monotonic upward stage. That is to say, with the development of the economy in Shanxi Province and the increase of per capita GDP, the production of solid waste also gradually increases, and there has not been a turning point within the data range of this article.
- 3.
- Fitting curve between per capita GDP and Chemical oxygen demand
The fitting results are shown in Figure 4c, which shows a monotonically decreasing relationship between per capita GDP and COD. The regression fitting equation is y=-1E-08x3+0.0016x2-81.631x+1E+06, R² = 0.757. It can be seen from the curve that with the growth of per capita GDP, Chemical oxygen demand in Shanxi Province shows a downward trend. According to the inverted U-shaped curve theory, it can be considered that the turning point of the fitting curve of Chemical oxygen demand in Shanxi Province is around 2013. As per capita GDP continues to grow, COD emissions continue to decline.
- 4.
- Fitting curve between per capita GDP and ammonia nitrogen emissions
The fitting results are shown in Figure 4d, which shows a monotonically decreasing relationship between per capita GDP and ammonia nitrogen emissions. The regression fitting equation is y=-8E-10x3+0.0001x2-7.0359x+124547, R ² = 0.7832. This curve can be roughly regarded as the right side of the inverted “U” shaped curve, with the turning point occurring before 2013. From the curve, it can be seen that with the growth of per capita GDP, the ammonia nitrogen emissions in Shanxi Province show a downward trend, which is basically consistent with the COD change curve.
- 5.
- Fitting curve between per capita GDP and SO2 emissions
The fitting results are shown in Figure 4e. The results show that the fitting effect of per capita GDP and SO2 is good, showing a classic inverted “U” relationship. The regression fitting equation is y=4E-12x3-4E-07x2+0.0119x+25.803, R ² = 0.7903, as can be seen from the curve, with the growth of per capita GDP, the sulfur dioxide emissions in Shanxi Province show a trend of first increasing and then decreasing. The more ambiguous turning point appears at around 20000 yuan per capita GDP. Around 2013, with the continued growth of per capita GDP, the sulfur dioxide emissions decreased.
In summary, the fitting curve between the quality of economic development and the intensity of environmental pollution can be classified into three categories. The first type shows a classic inverted “U” curve relationship between per capita GDP and wastewater and SO2 emissions, with a turning point occurring at around 20000 yuan per capita GDP; Second, the per capita GDP is monotonically decreasing with Chemical oxygen demand and ammonia nitrogen emissions, and the turning point is before 2013; The third category shows a monotonically increasing relationship between per capita GDP and solid waste generation, with no turning point yet.
3. Discussion and Summary
3.1. Analysis of Economic Development and Environmental Pollution Issues
According to Figure 1, Figure 2, Figure 3 and Figure 4, it can be seen that the rapid economic growth in Shanxi Province in the past 20 years has brought serious environmental problems, which can be summarized as follows:
(1) Excessive energy consumption exacerbates resource dependence. From 2.2, it can be seen that during the “Tenth Five Year Plan” and “Eleventh Five Year Plan” periods, the environmental pollution intensity in Shanxi Province was relatively severe. Shanxi Province has abundant coal reserves, with a proven coal reserve of 27 billion tons, second only to Xinjiang and Inner Mongolia, ranking third in the country, and coal production accounting for about 1/4 of the country. At the same time, there are abundant mineral resources, and 120 types of minerals have been discovered, including 63 minerals with proven resource reserves and 230.4 billion cubic meters of coalbed methane recoverable reserves [16]. At the same time, Shanxi Province is a famous heavy industry base in China, and the steel industry is one of the important pillar industries. There are many large iron and steel enterprises in the province, such as Taiyuan Iron and Steel Group, Shougang Changzhi Iron and Steel Company, etc. The scale of iron and steel production capacity ranks in the forefront of the country, focusing on the development of iron and steel, metallurgy, electricity, coke and other industries. These traditional “three high” (high pollution, high energy consumption, high emissions) industries bring high industrial output, but also bring serious environmental problems, mainly air pollution, soil pollution, and water pollution. According to statistics, the average annual growth rate of energy consumption in Shanxi Province from 2007 to 2017 reached 3.52%, increasing from 146.1976 million tons of standard coal to 200.5723 million tons of standard coal [17]. In the energy structure, coal consumption accounts for over 88% of the energy consumption in the industrial industry, forming a typical feature of Shanxi Province in the process of economic development, which is dominated by coal. It can be seen from Figure 1a that the Gross regional product (1552.84 billion yuan) of Shanxi Province in 2017 ranked 23 among the 31 provinces and cities in China, while the per capita Gross regional product (40557 yuan) ranked 18, indicating that the per capita income level of residents in Shanxi Province is not high, and the level of economic development is relatively backward, reducing the expectations of environmental quality.
(2) The industrial structure is single and the economic structure is fragile. With the acceleration of industrialization, the proportion of Tertiary sector of the economy in GDP will inevitably surpass that of Primary sector of the economy and Secondary sector of the economy, and become the main force leading the healthy development of the national economy. It can be seen from Figure 2 that during the period from the “Tenth Five Year Plan” to the “Twelfth Five Year Plan”, among the three major industrial output values of Shanxi Province, the Secondary sector of the economy>Tertiary sector of the economy output value>Primary sector of the economy output value, and the proportion of the Secondary sector of the economy in GDP exceeded 50%. The economic development was mainly driven by the Secondary sector of the economy. Until the beginning of 2015, the proportion of the Tertiary sector of the economy in GDP was overtaking, becoming the pillar of social economy in Shanxi Province. From the perspective of the proportion of the three industries in GDP, the contribution rate of the Primary sector of the economy has been basically stable. Before 2015, the change trend of the contribution rate of the Secondary sector of the economy and the Tertiary sector of the economy was basically stable. Since the “13th Five Year Plan”, the contribution rate of the Tertiary sector of the economy in Shanxi Province has continued to grow, and exceeded the contribution rate of the Secondary sector of the economy in 2015. The industrial structure is gradually changing from “two, three, one” to “three, two, one”. The main reason for this change is that the Shanxi Provincial Government took the initiative to vigorously develop the cultural service industry [18], adjust the proportion of the three major industries, optimize industrial layout, upgrade and transform industrial structure, in order to gradually reverse the traditional extensive economic development model. Nevertheless, the extensive development approach still leads to an unreasonable industrial structure, with a high proportion of resource based industries with high energy consumption and pollution such as coal, steel, and electricity. There are fewer green and low-carbon emerging strategic projects, and there is still a severe situation where environmental protection lags behind economic and social development.
(3) Backward development level and insufficient investment in environmental protection funds. According to statistics [19], during the 11th Five Year Plan period in Shanxi Province, the total amount of environmental protection investment was 16.51 billion yuan. However, within 7 years after entering the 12th Five Year Plan and 13th Five Year Plan periods, the total amount of environmental protection investment in Shanxi Province has reached 18.59 billion yuan, of which only 15% is used to treat industrial waste pollutants, and the majority is used for environmental infrastructure construction. Obviously, the investment is far from enough. For typical energy regions, The space for improving environmental pollution control is becoming increasingly small, and tackling challenges is becoming increasingly difficult. In the past 10 years of the new era, China’s industrial added value has doubled, from 20.9 trillion yuan to 45.1 trillion yuan. During the epidemic period, the output value is increasing, and China has been the world’s largest manufacturing country for 12 consecutive years [20]. From Figure 3, it can be seen that the discharge of solid waste in Shanxi Province has significantly decreased since 2012. After taking control measures, the discharge of industrial wastewater and sulfur dioxide in Shanxi Province has been decreasing year by year, and the compliance rate and sulfur dioxide removal rate of industrial wastewater discharge treatment have been increasing year by year. After 2012, industrial sulfur dioxide emissions significantly decreased, mainly due to the government’s significantly higher investment in exhaust gas treatment compared to other pollution control fields [21]. At the same time, during the “12th Five Year Plan” period, Shanxi Province actively transformed its economic development mode from extensive to intensive, eliminated excess production capacity, seized the construction opportunity of the “Yellow River Golden Triangle Demonstration Area” [22], further optimized the industrial structure, strengthened regional economic cooperation between Shanxi, Shaanxi and Henan, gave full play to the advantages of Cultural resource management, and actively explored new development models focusing on culture, tourism, finance, real estate, etc.
In summary, in the past 20 years, the main pollutants have shown a trend of increasing first and then decreasing steadily, with a turning point occurring during the “12th Five Year Plan” period. It can be seen that the environmental policies and investments of the Chinese and Shanxi provincial governments in the new era have been effective in the past 10 years, and the environmental pollution problem has been effectively improved.
3.2. Correlation Analysis
Correlation analysis refers to the analysis of multiple variables related to the quality of economic development and the intensity of environmental pollution, in order to measure the degree of correlation between economic development and environmental pollution. From Figure 5, it can be seen that there are different degrees of correlation between economic development quality data and environmental pollution intensity data.
In terms of the quality of economic development, there is a positive correlation between GDP and per capita GDP, permanent population, and per capita disposable income. Among these data, the correlation between GDP and per capita GDP is the strongest, with a correlation coefficient of 0.981 with per capita disposable income and 0.742 with permanent population. This means that population growth has a significant impact on GDP, and the level of economic development is closely related to per capita disposable income.
In terms of environmental pollution intensity, it can be seen that there is a strong positive correlation between wastewater discharge and Chemical oxygen demand, ammonia nitrogen discharge and sulfur dioxide discharge, with correlation coefficients of 0.757, 0.764 and 0.855 respectively. This indicates that the amount of wastewater discharge may affect the level of these pollutant emissions. There is no significant correlation between the amount of wastewater discharge and the amount of solid waste generated or exhaust gas emissions. There is a strong correlation between the amount of solid waste generated and Chemical oxygen demand emissions, ammonia nitrogen emissions, with coefficients of 0.519 and 0.513 respectively. The correlation coefficient between Chemical oxygen demand and ammonia nitrogen emissions reached 0.998, indicating that the higher the concentration of ammonia nitrogen, the higher the COD; The correlation coefficient between Chemical oxygen demand and sulfur dioxide emissions is 0.642, showing a certain correlation, and the change trend is basically the same under certain conditions. The correlation coefficient between ammonia nitrogen emissions and solid waste emissions and sulfur dioxide emissions is greater than 0.5, showing a certain positive correlation.
The correlation between economic development quality and environmental pollution intensity indicators shows that the correlation coefficients between GDP (per capita GDP) and wastewater emissions and sulfur dioxide emissions are -0.4 and -0.7, respectively. This indicates that as economic indicators increase, wastewater emissions and sulfur dioxide emissions gradually decrease, which is consistent with the curve fitting results in Figure 4a,e; The correlation coefficient between GDP (per capita GDP) and COD emissions and ammonia nitrogen emissions is -0.3, while the correlation coefficient between COD and ammonia nitrogen emissions exceeds 0.9, indicating that with the continuous development of the economy, COD emissions and ammonia nitrogen emissions slowly decrease. The fitting curves in Figure 4c,d further support this conclusion; The correlation coefficient between GDP (per capita GDP) and solid waste production exceeds 0.5, showing a positive correlation, which is consistent with the conclusion of the fitting curve in Figure 4b, that is, the two show a monotonically increasing relationship. In addition, the correlation coefficient between GDP (per capita GDP) and exhaust emissions exceeds 0.7, indicating that the level of economic development is also closely related to exhaust emissions.
In terms of other indicators, the resident population has the strongest correlation with the amount of solid waste generated, with a coefficient of 0.841 and a strong correlation with the amount of exhaust gas emissions, with a coefficient of 0.450. There is no obvious correlation with other pollutants (wastewater emissions, Chemical oxygen demand emissions, ammonia nitrogen emissions, sulfur dioxide emissions). The per capita disposable income has a strong correlation with the generation of solid waste and exhaust gas emissions, with coefficients of 0.513 and 0.714, respectively, while it has a significant negative correlation with sulfur dioxide (coefficient of -0.799), and has no strong or significant correlation with other pollutants (wastewater emissions, Chemical oxygen demand emissions, ammonia nitrogen emissions).
In summary, the trend of correlation between the quality of economic development and the intensity of environmental pollution is basically consistent, with GDP (per capita GDP) showing moderate and strong negative correlations with wastewater emissions and sulfur dioxide emissions; GDP (per capita GDP) shows a moderate negative correlation with COD emissions and ammonia nitrogen emissions, while GDP (per capita GDP) shows a strong positive correlation with solid waste production. The correlation analysis results further support the fitting curve results.
3.3. Comparison of Evolution Characteristics in Different Periods
From Table 2, it can be seen that there are slight differences in the research conclusions of different researchers on the relationship between economic development and environmental pollution in Shanxi Province during different periods. The research results of Zhang Rongyan et al. [23] indicate that the fitting curve of Shanxi is in an “N” shape. With economic growth, the industrial exhaust emissions in Shanxi will increase, and there has not yet been a turning point. The research results of Zhang Lin et al. [24] show that wastewater discharge, soot dust discharge and sulfur dioxide are inverted “U” shaped, industrial solid waste and industrial waste gas are “U” shaped curves, and Chemical oxygen demand is “N” shaped curves. Zhu Weixin et al. [25] found that 1998 was the year with the most severe pollution in Shanxi Province, with atmospheric and industrial solid waste pollution being the most severe; In 2011, water pollution reached its peak. The fitting curve shows that the curves of industrial exhaust emissions, SO2 emissions, and COD emissions conform to the inverted “U” shape feature; The curve of NH3-N emissions shows an inverted “N”shape; The curve of smoke and dust emissions and industrial solid waste emissions shows an “N”shaped characteristic.
In this study, it was found that the per capita GDP of Shanxi Province showed a classic inverted “U” shaped relationship between wastewater and SO2 emissions, with a turning point occurring around 20000 yuan per capita; It is monotonically decreasing with Chemical oxygen demand and ammonia nitrogen emissions, and monotonically increasing with solid waste generation. The reasons for the differences in the above research results may include the following: firstly, differences in the selection of data intervals and ranges: different researchers have chosen different research intervals and ranges, which may lead to different results. Secondly, differences in the selection of research variables: Researchers may choose different variables, such as some studies only studying exhaust and wastewater emissions, while others may also study solid waste production, which may lead to different results. Thirdly, differences in research methods: Researchers may adopt different research methods, using different statistical or computational methods, resulting in different results.
Therefore, for the evolution characteristics of economic development quality and environmental pollution intensity, it is necessary to select appropriate variables, research methods, and data intervals based on a thorough understanding of the research object, in order to obtain more accurate research results.
4. Conclusion
(1) The GDP of Shanxi Province has shown a certain growth trend in the past 20 years, with an average annual growth rate of 7%; The overall per capita GDP shows a growth trend. Except for the negative growth rates in 2009 and 2015, the growth rates in other years are all positive, with an average annual growth rate of 12.82%. However, the growth rate is unstable and fluctuates significantly.
(2) In recent 20 years, the intensity of major pollutants (wastewater, solid waste, Chemical oxygen demand, ammonia nitrogen emissions, nitrogen oxides, smoke, dust, sulfur dioxide) in Shanxi Province showed a trend of first rising and then stabilizing. The turning point roughly occurred around 2012 during the “12th Five Year Plan” period, and basically showed a steady downward trend after the “12th Five Year Plan” period.
(3) The numerical fitting features can be classified into three categories. The first category shows a classic inverted “U” curve relationship between per capita GDP and wastewater and SO2 emissions, with a turning point occurring at around 20000 yuan per capita GDP; Second, the per capita GDP is monotonically decreasing with Chemical oxygen demand and ammonia nitrogen emissions, and the turning point is before 2013; The third category shows a monotonically increasing relationship between per capita GDP and solid waste generation, with no turning point yet.
(4) GDP (per capita GDP) shows moderate and strong negative correlations with wastewater emissions and sulfur dioxide emissions; GDP (per capita GDP) shows a moderate negative correlation with COD emissions and ammonia nitrogen emissions, while GDP (per capita GDP) shows a strong positive correlation with solid waste production. The correlation analysis results further support the fitting curve conclusion.
(5) For the evolution characteristics of economic development quality and environmental pollution intensity, it is necessary to select appropriate variables, research methods, and data intervals based on a thorough understanding of the research object, in order to obtain more accurate research results.
Funding
National Natural Science Foundation of China (51504193); Key Project of State Key Laboratory for Pollution Control and Treatment of Petroleum and Petrochemical Industry (PPC2019001); China Petroleum Major Low Carbon Special Project (240113001); Shaanxi Provincial Natural Science Basic Research Program Project (2023-JC-YB-129).
References
- Ma Man, Zhao Wen. An empirical study on the relationship between economic growth and environmental pollution in Guangxi based on the theory of environmental Kuznets curve [J]. Journal of Yulin Normal University, 2019, 40 (6): 122-126.
- Zhang Yujie. Research on Environmental Kuznets curve of Fujian Province [D]. Fuzhou: Fujian Agriculture and Forestry University, 2016.
- He Wei, Wang Peng. Research on the relationship between economic development and environmental pollution in resource-based cities - taking Hengyang City as an example [J]. Research on Land and Natural Resources, 2019 (6): 20-22.
- Ministry of Ecology and Environment. Strive to compose a new chapter on ecological civilization construction in the new era [EB/OL] (2022-11) www.qstheory.cn/wp/2022-10/20/c_ 1129072411.htm.
- SHAFIK N, BANDYOPADHYAY S. Economic growth and environmental quality: time series and cross country evidence. Background paper for the world development report[R].Washington:World Bank Policy Research Working Paper Series, 1994.
- STERN D I, COMMON M S.Is there an environmental Kuznets curve for sulfur[J].Journal of Environmental Economics and Management,2001,41(2):162-178.
- COLE M A. Trade, the pollution haven hypothesis and the environmental Kuznets curve:examining the linkages[J].Ecological Economics,2004,48:71-81.
- Zhang Bian, Wang Hongdong. Further Discussion on the Kuznets Inverse U-Curve [J]. Economic Perspectives, 2023 (3): 26-34.
- Zhao Feifei, Lu Liwen. Empirical Test of Environmental Kuznets curve from the Perspective of Environmental Governance [J]. Statistics and Decision Making, 2022, 38 (20): 174-178.
- Zhao Liange, Xu Jianfen, Wang Xueyuan, et al. Verification of Kuznets curve of agricultural non-point source pollution in Zhejiang Province [J]. Journal of Zhejiang Agriculture, 2012,24 (6): 1079-1085.
- Zhuang Dachang, Ye Hao, Zhang Huixia A Study on the Relationship between Economic Development and Water Environment Pollution in Guangzhou City [J]. Economic Geography, 2013,33 (12): 38-41.
- Yan Ning, Shi Zeyao, Wang Tianying. Research on Kuznets curve of Industrial Exhaust Emission Environment in Jiangsu [J]. China’s Population, Resources and Environment, 2017, 27 (S2): 119-123.
- Zhan Yonghui, Meng Yadong. Research on the Relationship between Economic Growth and Environmental Pollution in Shandong Province Based on EKC [J]. Science and Technology and Engineering, 2012,12 (9): 4857-4860.
- Shanxi Provincial Bureau of Statistics. Shanxi Statistical Yearbook [M]. Beijing: China Statistical Publishing House, 2022.
- Chen Jinghui, Lu Xinwei, Chen Cancan, et al. Analysis and prediction of environmental Kuznets curve in Shaanxi Province [J]. Environmental Protection Science, 2010, 36 (4): 58-60.
- Shanxi Provincial Bureau of Statistics Overview of Provincial Situation [EB/OL] (April 2023) http://www.shanxi.gov.cn/zjsx/zlssx/sqgk/202007/t20200724_6045048.shtml.
- Wang Liwen Research on the coupling relationship between economic development and ecological environment protection in Shanxi Province [D]. Taiyuan: Shanxi University of Finance and Economics, 2020.
- Wang Xiayu. Research on the Evaluation of Industrial Green Transformation and Upgrading Level in Shanxi Province [D] Taiyuan: Shanxi University of Finance and Economics, 2022.
- National Bureau of Statistics China Environmental Statistics Yearbook [M] Beijing: China Statistical Publishing House, 2009.
- Xu Shengnan. Research on the Efficiency Measurement and Influencing Factors of Industrial Green Development in Shanxi Province [D] Taiyuan: Shanxi University of Finance and Economics, 2022.
- Yin Long Research on the Coordinated Development of Economy, Energy, and Environment in Shanxi Province [D] Taiyuan: Shanxi University of Finance and Economics, 2022.
- Henan Provincial People’s Government The Declaration on Jointly Building a Green Development Demonstration Zone for the Yellow River Basin in the Jin Shaanxi Henan Yellow River Golden Triangle Region was launched [EB/OL]. (2020-09-15) https://www.henan.gov.cn/2020/09-15/1767619.html.
- Zhang Rongyan, Zhang Rongxia. Empirical analysis of the Kuznets curve of economic growth and environmental pollution in six central provinces based on Panel data from 1998 to 2012 [J]. Journal of Henan University of Education (Natural Science Edition), 2016, 25 (2): 39-44.
- ZHANG Lin, YAO An.The government capacity on industrial pollution management in Shanxi province: A response impulse analysis[J].Journal of environmental management, 2018(223):1037 -1046.
- Zhu Weixin, Ma Xiaohong, Wang Jieyu. Analysis of Economic Growth and Environmental Characteristics in Shanxi Province Based on the EKC Hypothesis [J]. Environmental Ecology, 2020, 2 (8): 55-60.
Figure 1.
Trends in the quality of economic development in Shanxi Province from2001 to 2021. (a) GDP and its growth rate chart. (b) Per capita GDP and its growth rate chart. (c) Gross regional product Index Chart.
Figure 1.
Trends in the quality of economic development in Shanxi Province from2001 to 2021. (a) GDP and its growth rate chart. (b) Per capita GDP and its growth rate chart. (c) Gross regional product Index Chart.
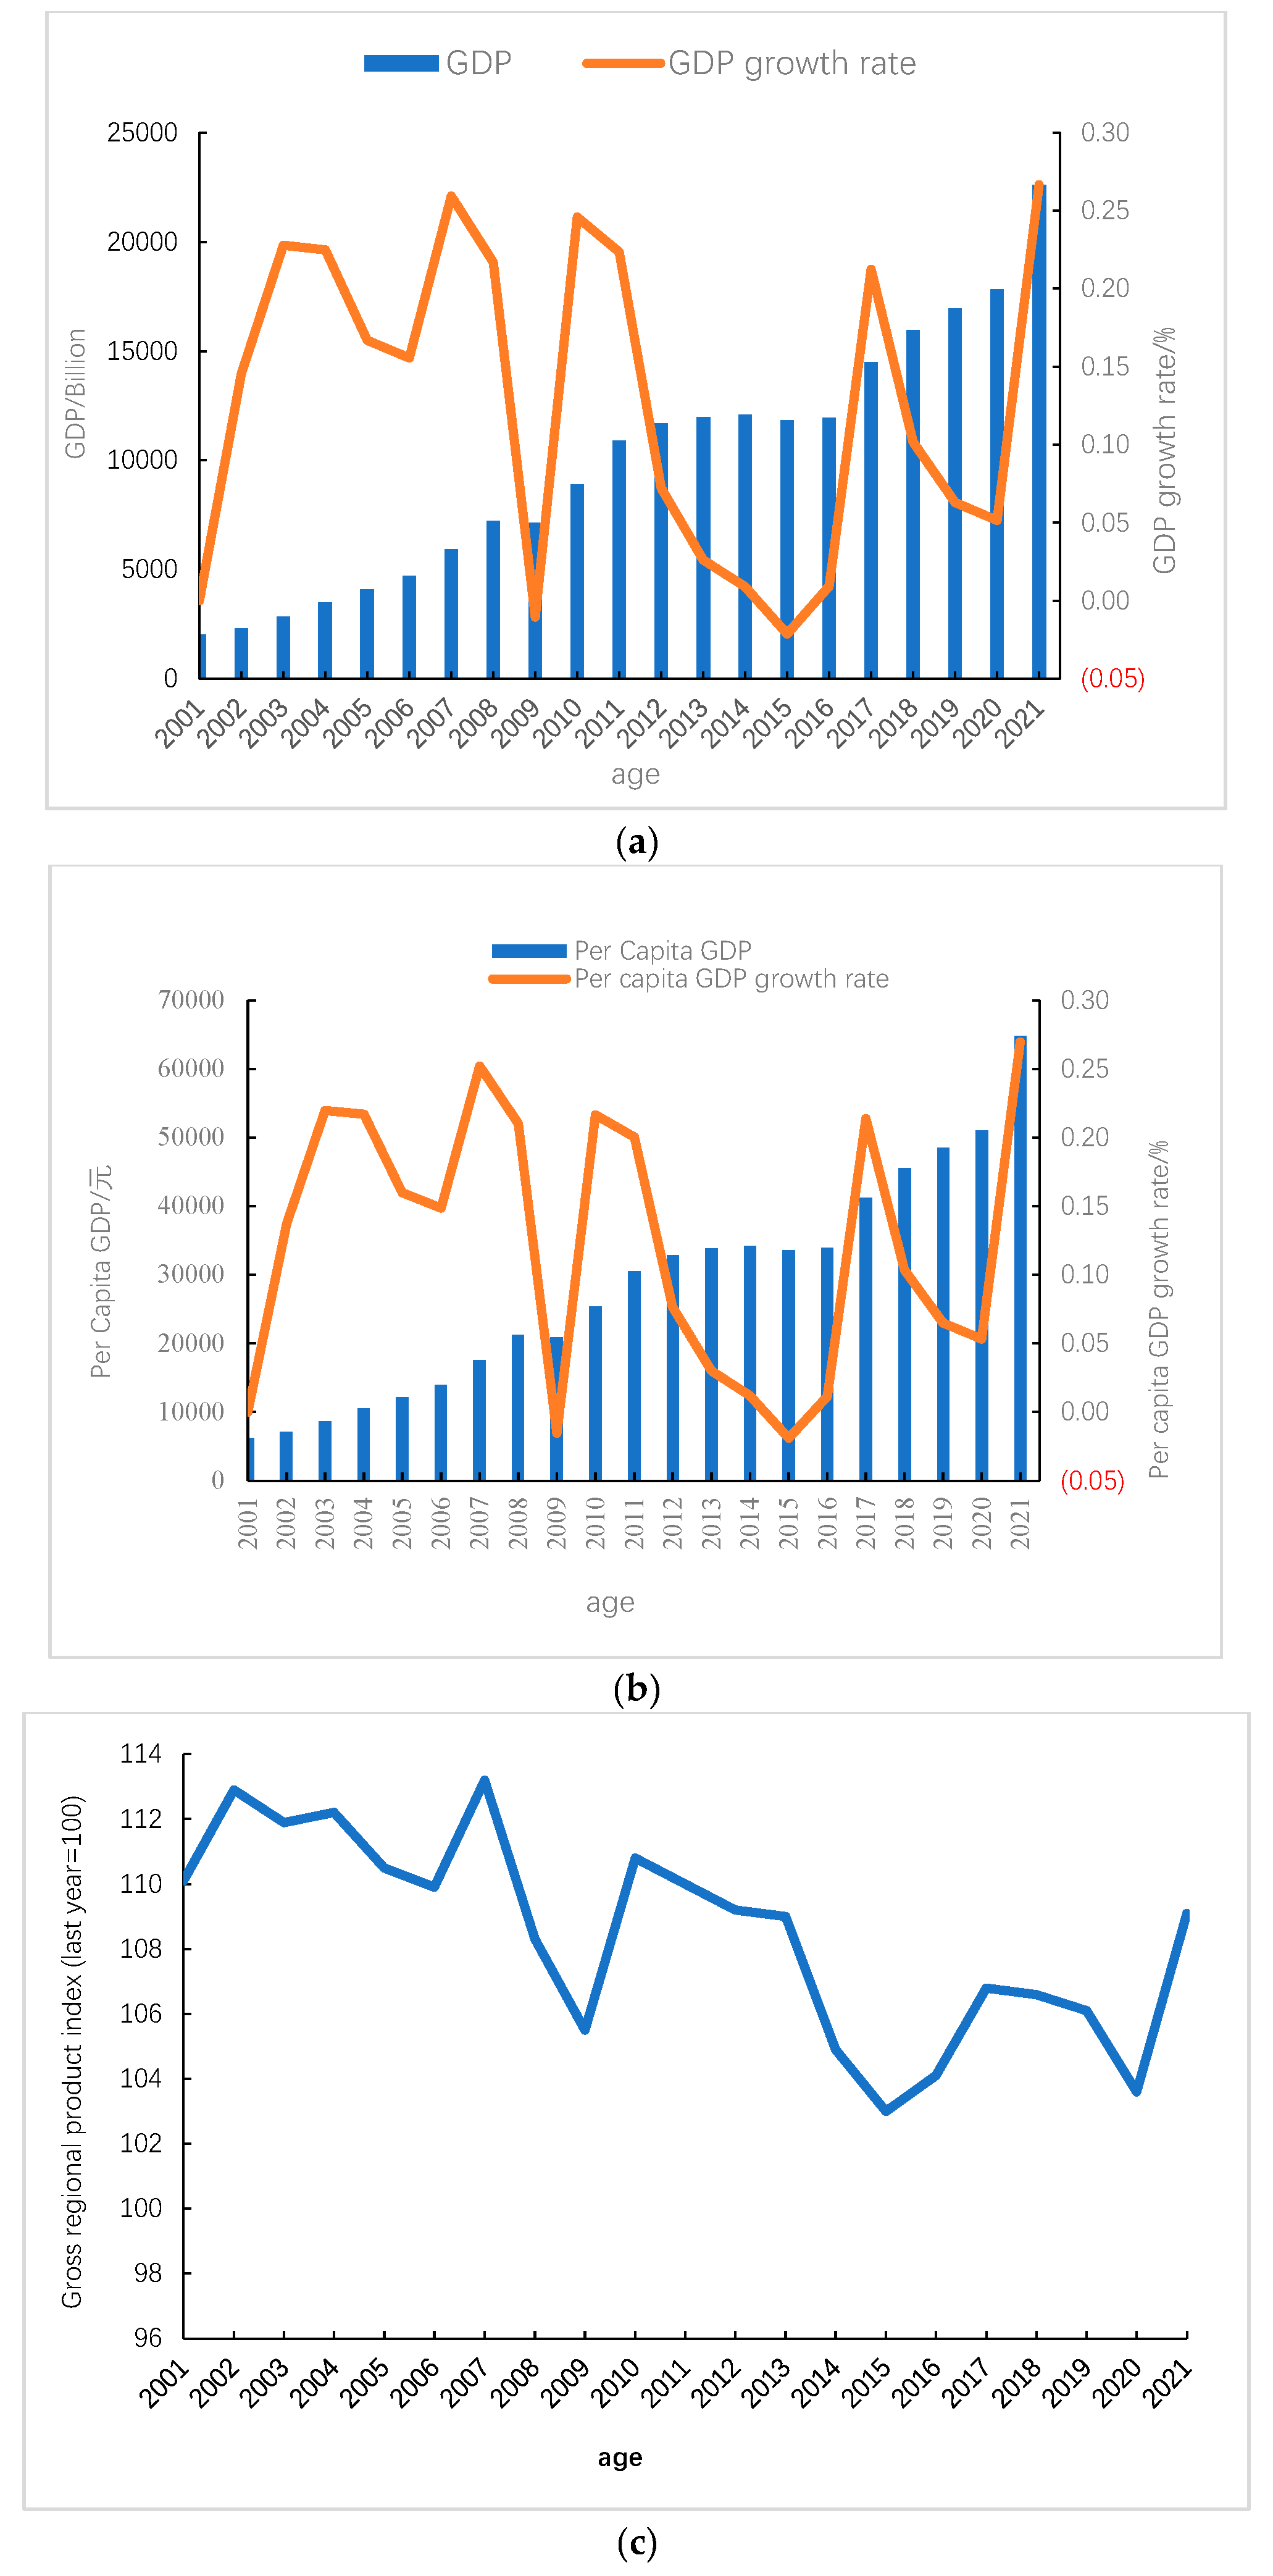
Figure 2.
The total value and proportion of the three major industries in Shanxi Province to GDP from 2001 to 2021. (a) Changes in the total output value of the three major industries. (b) The proportion of the total output value of the three major industries to GDP.
Figure 2.
The total value and proportion of the three major industries in Shanxi Province to GDP from 2001 to 2021. (a) Changes in the total output value of the three major industries. (b) The proportion of the total output value of the three major industries to GDP.
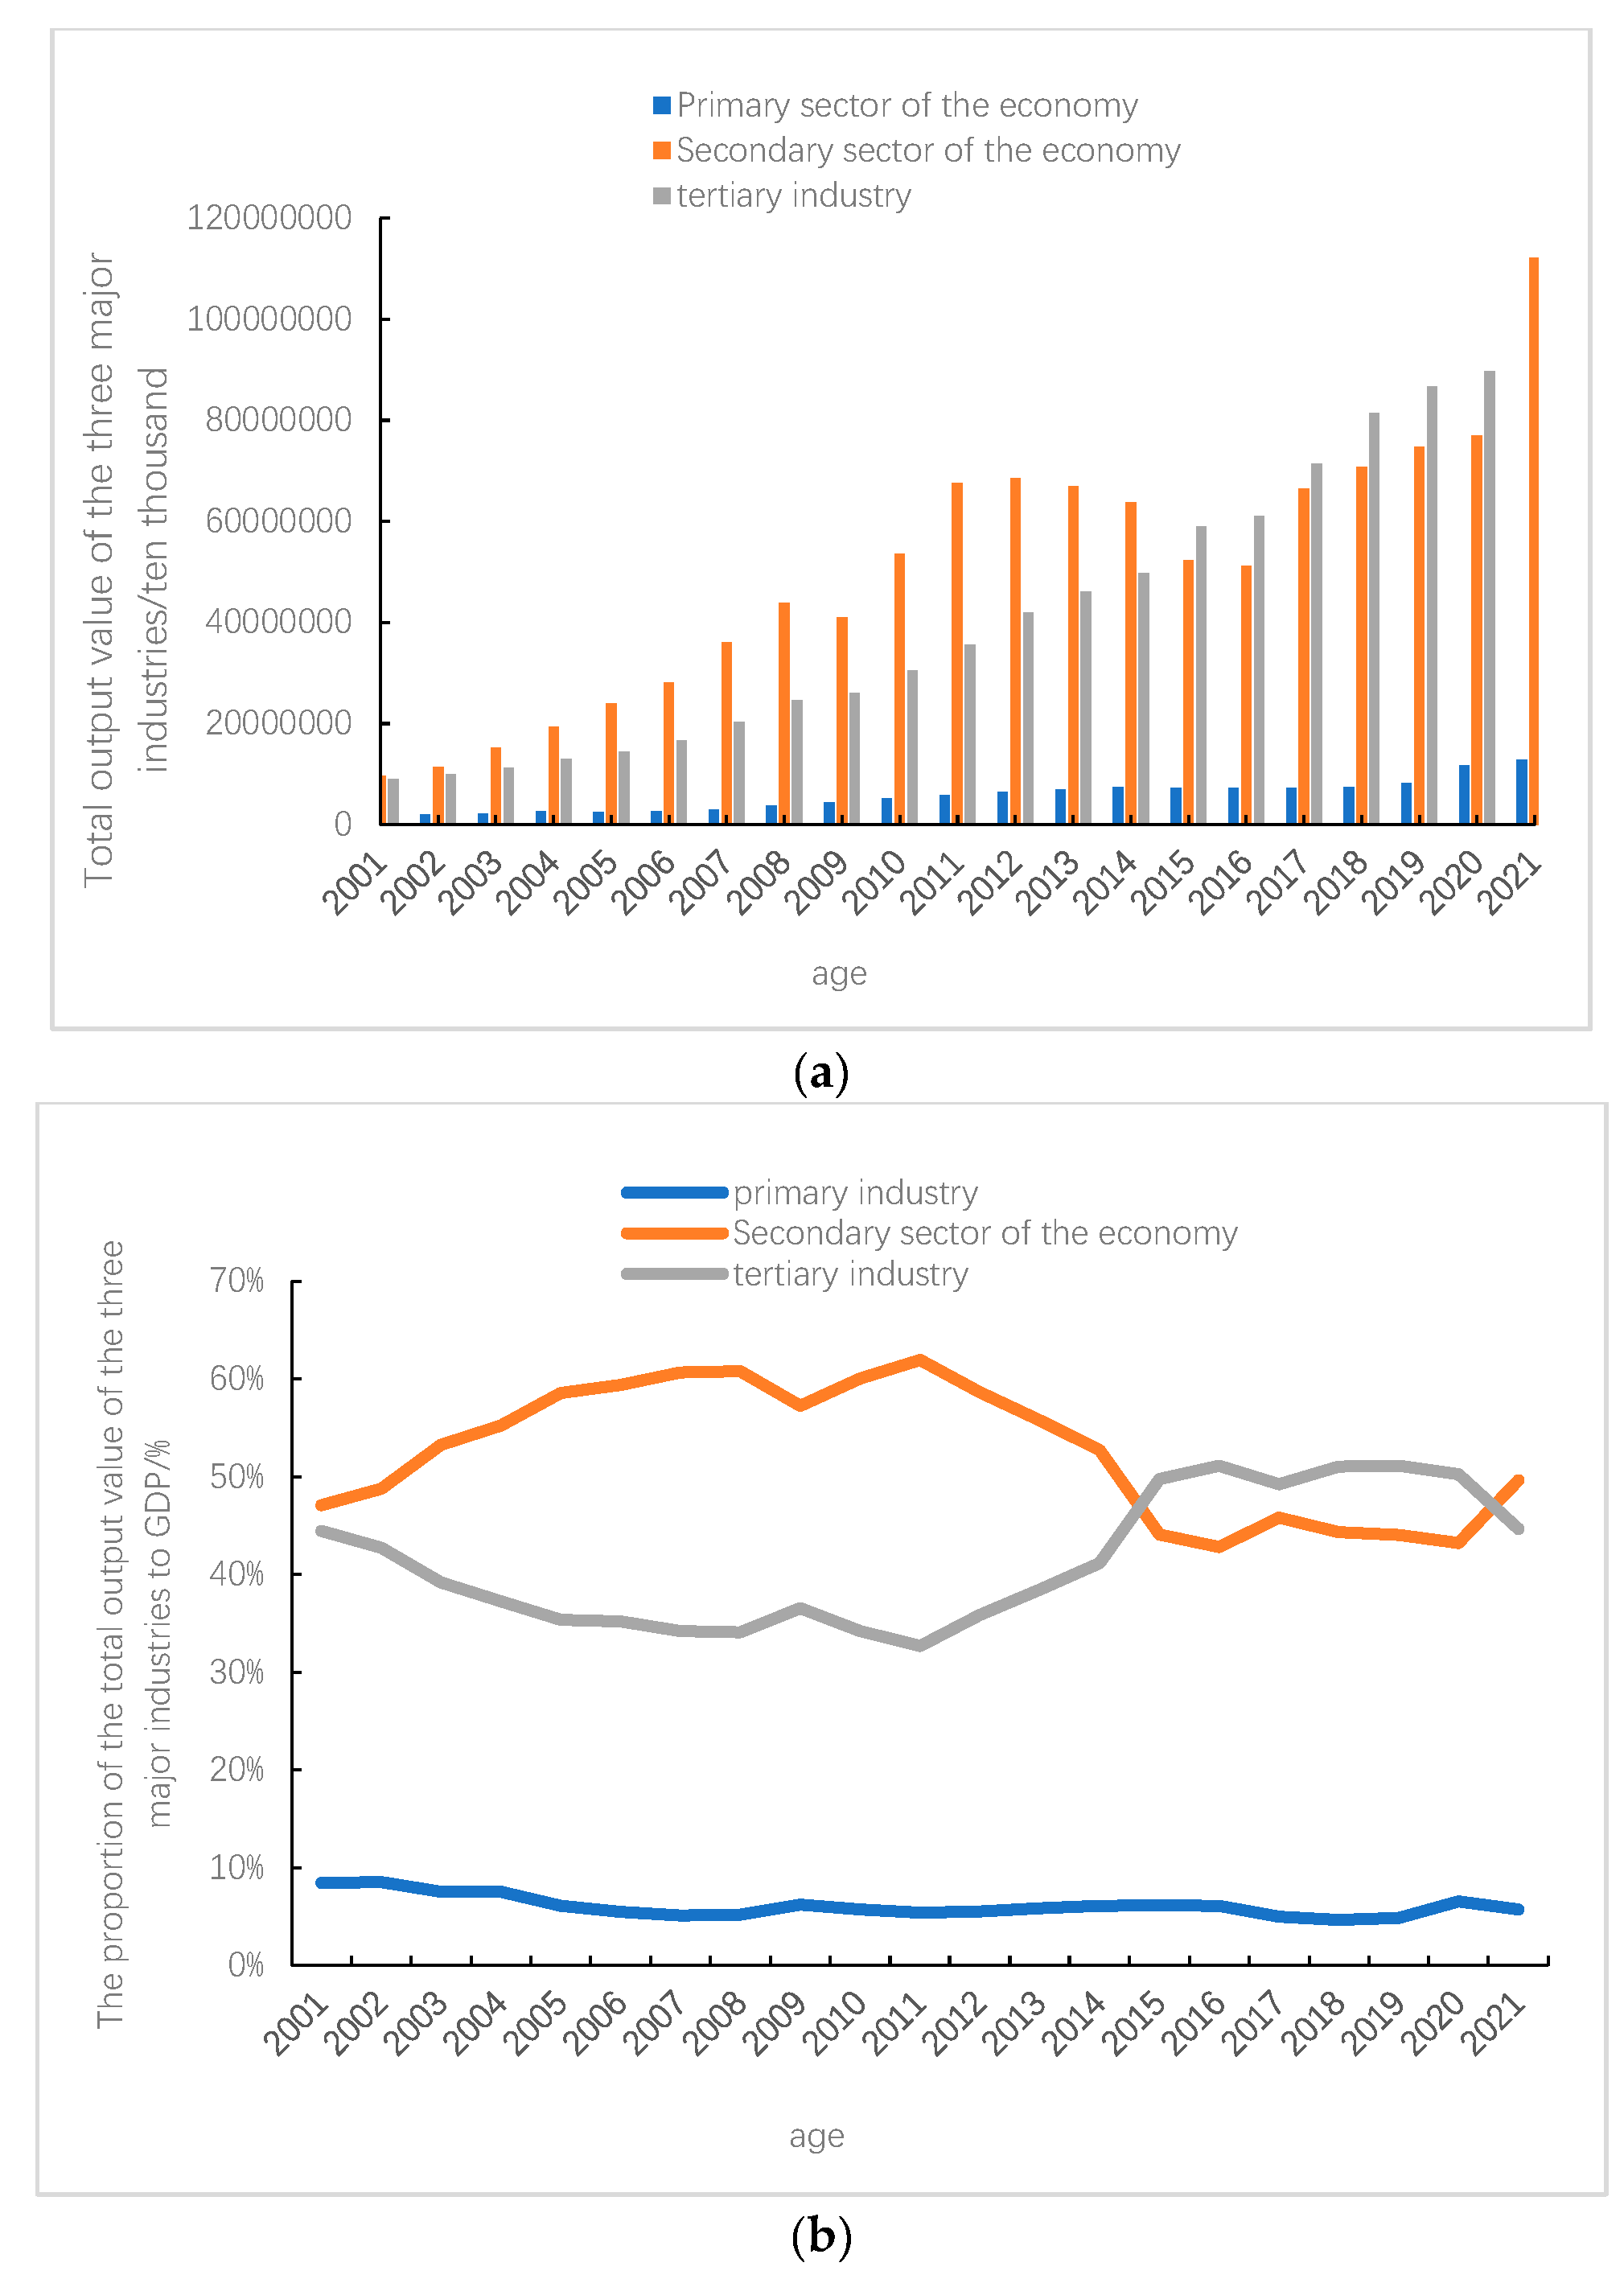
Figure 3.
Trends of major pollutant changes in Shanxi Province. (a) Wastewater, solid waste, Chemical oxygen demand, ammonia nitrogen emissions from 2001 to 2021. (b) Emissions of nitrogen oxides, smoke, dust, and sulfur dioxide from 2001 to 2021. *WW - Industrial wastewater discharge; COD - Chemical oxygen demand emissions; SW - Industrial solid waste emissions; WG - Industrial exhaust emissions; SO2- Emission of sulfur dioxide; NH3-N - Ammonia nitrogen emissions; PCGDP - Per capita GDP.
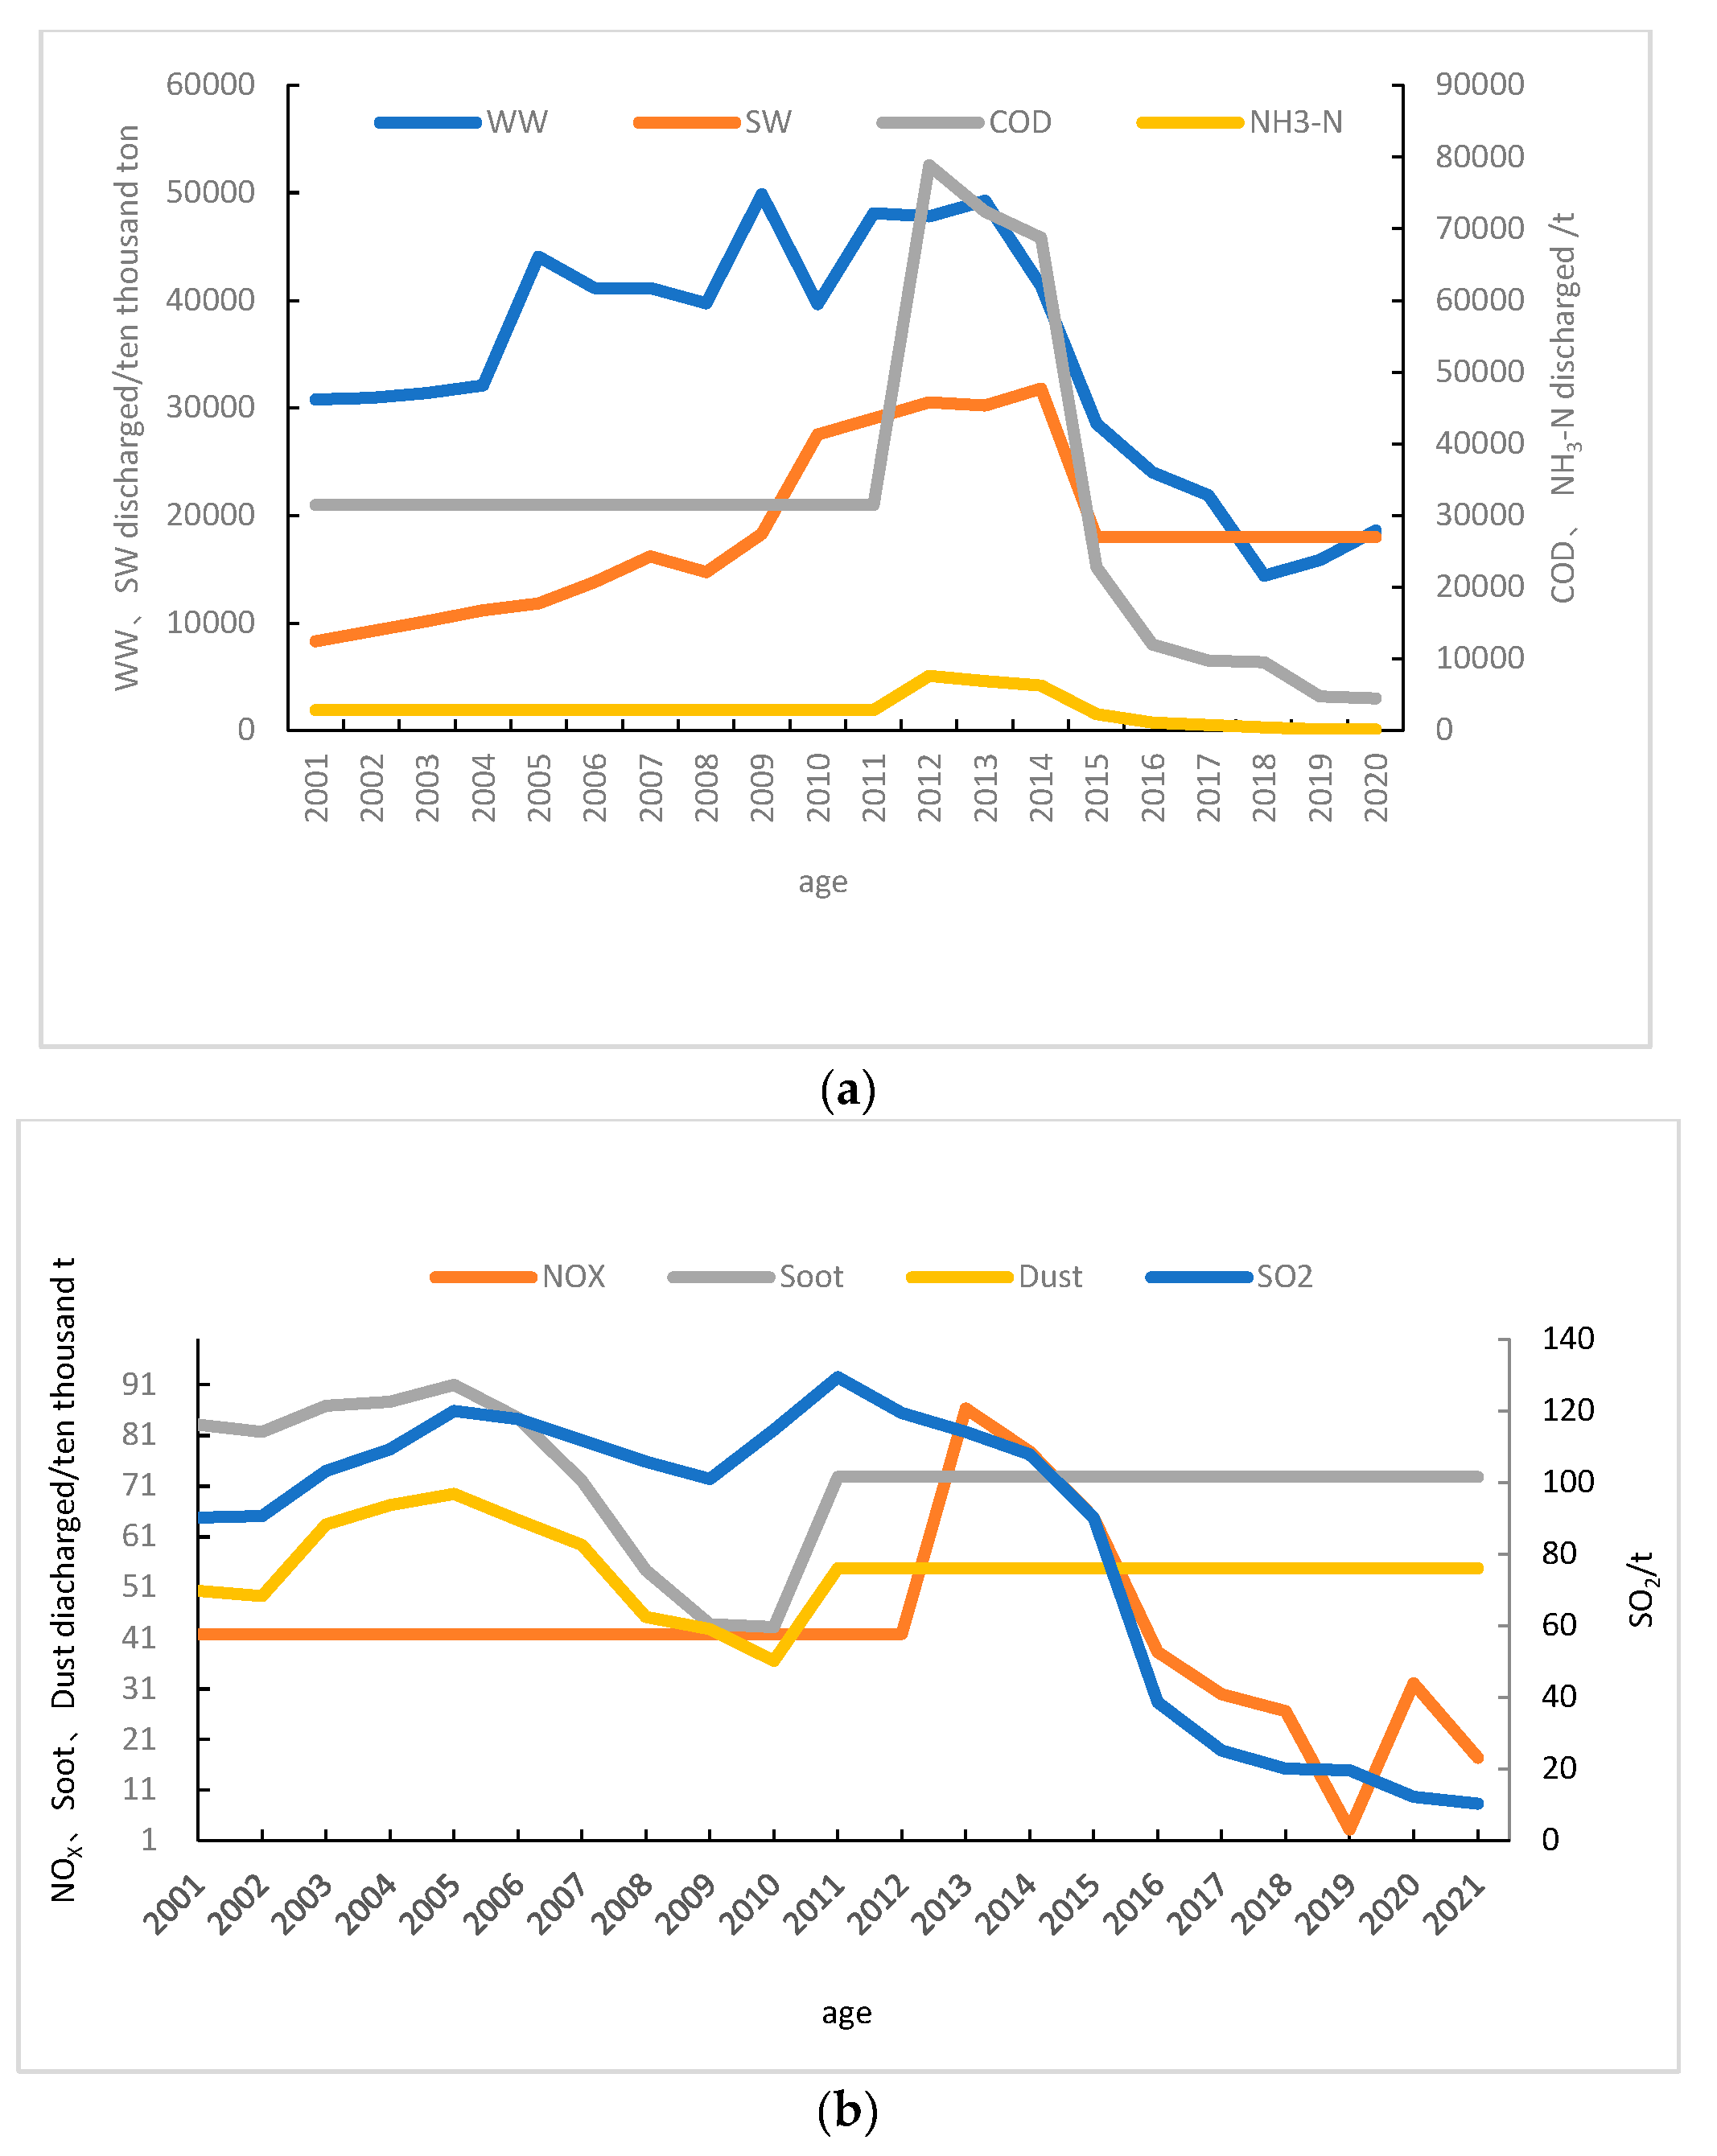
Figure 4.
Numerical simulation curve of economic quality and environmental pollution intensity in Shanxi Province. (a) Fitting curve between PGGDP and WW. (b) Fitting curve between PGGDP and SW. (c) Fitting curve between PGGDP and COD. (d) Fitting curve between PGGDP and NH3-N. (e) Fitting curve between PGGDP and SO2. *WW - Industrial wastewater discharge; COD - Chemical oxygen demand emissions; SW - Industrial solid waste emissions; WG - Industrial exhaust emissions; SO2- Emission of sulfur dioxide; NH3-N - Ammonia nitrogen emissions; PCGDP - Per capita GDP.
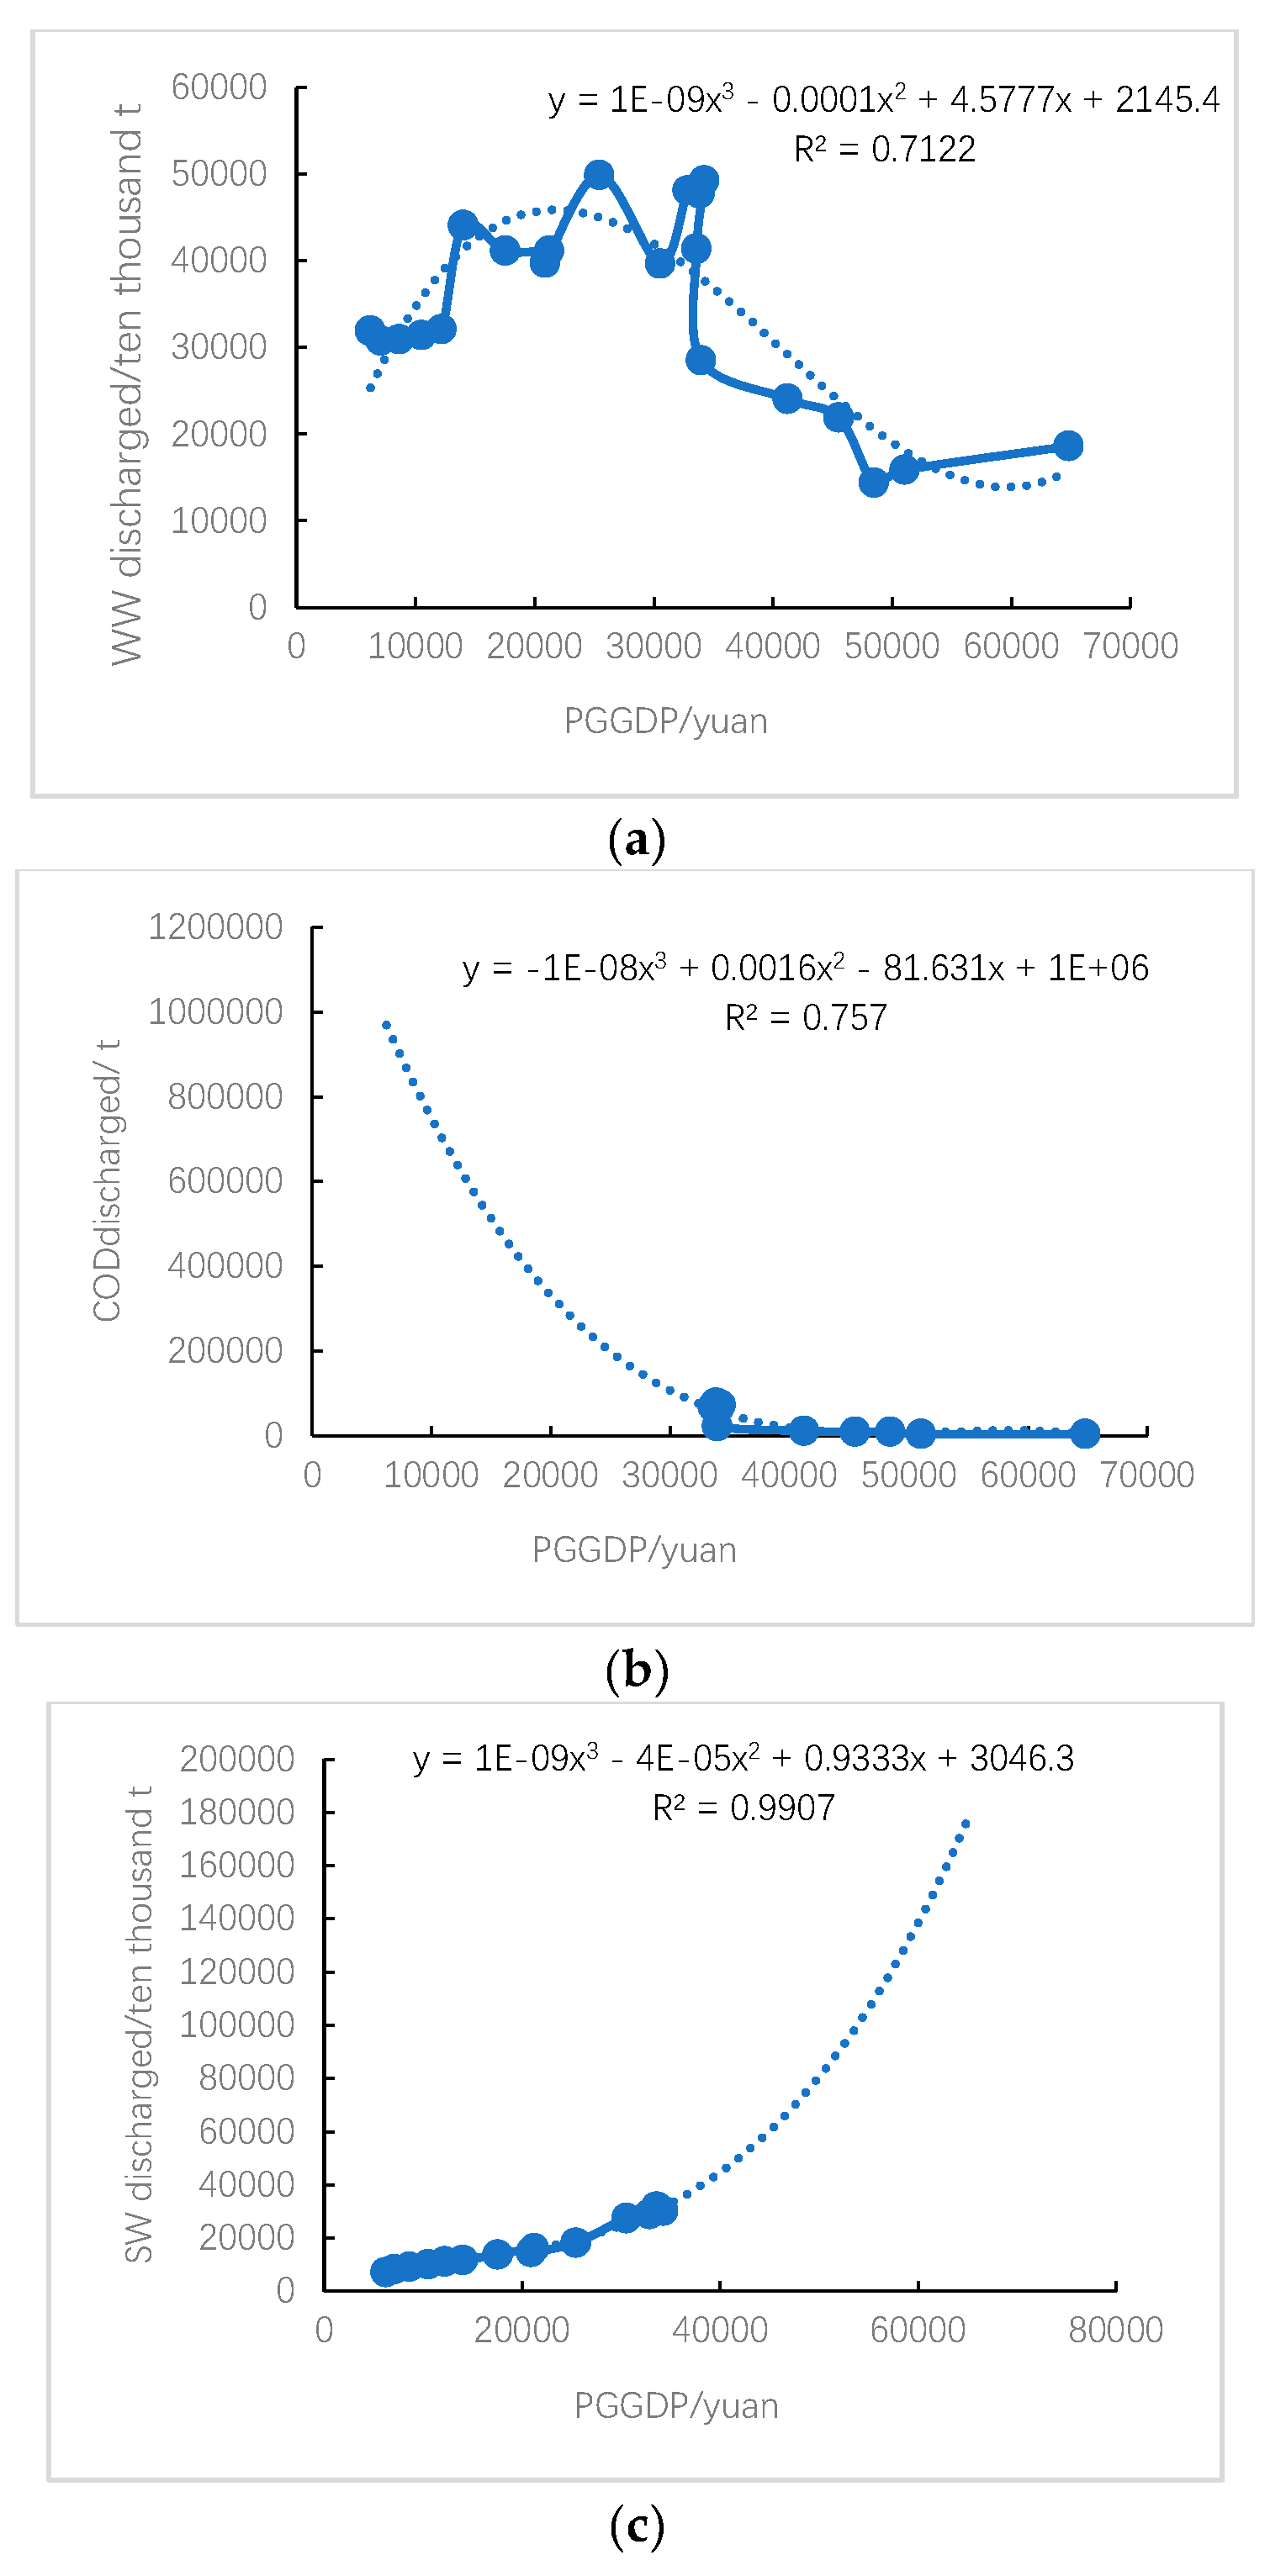
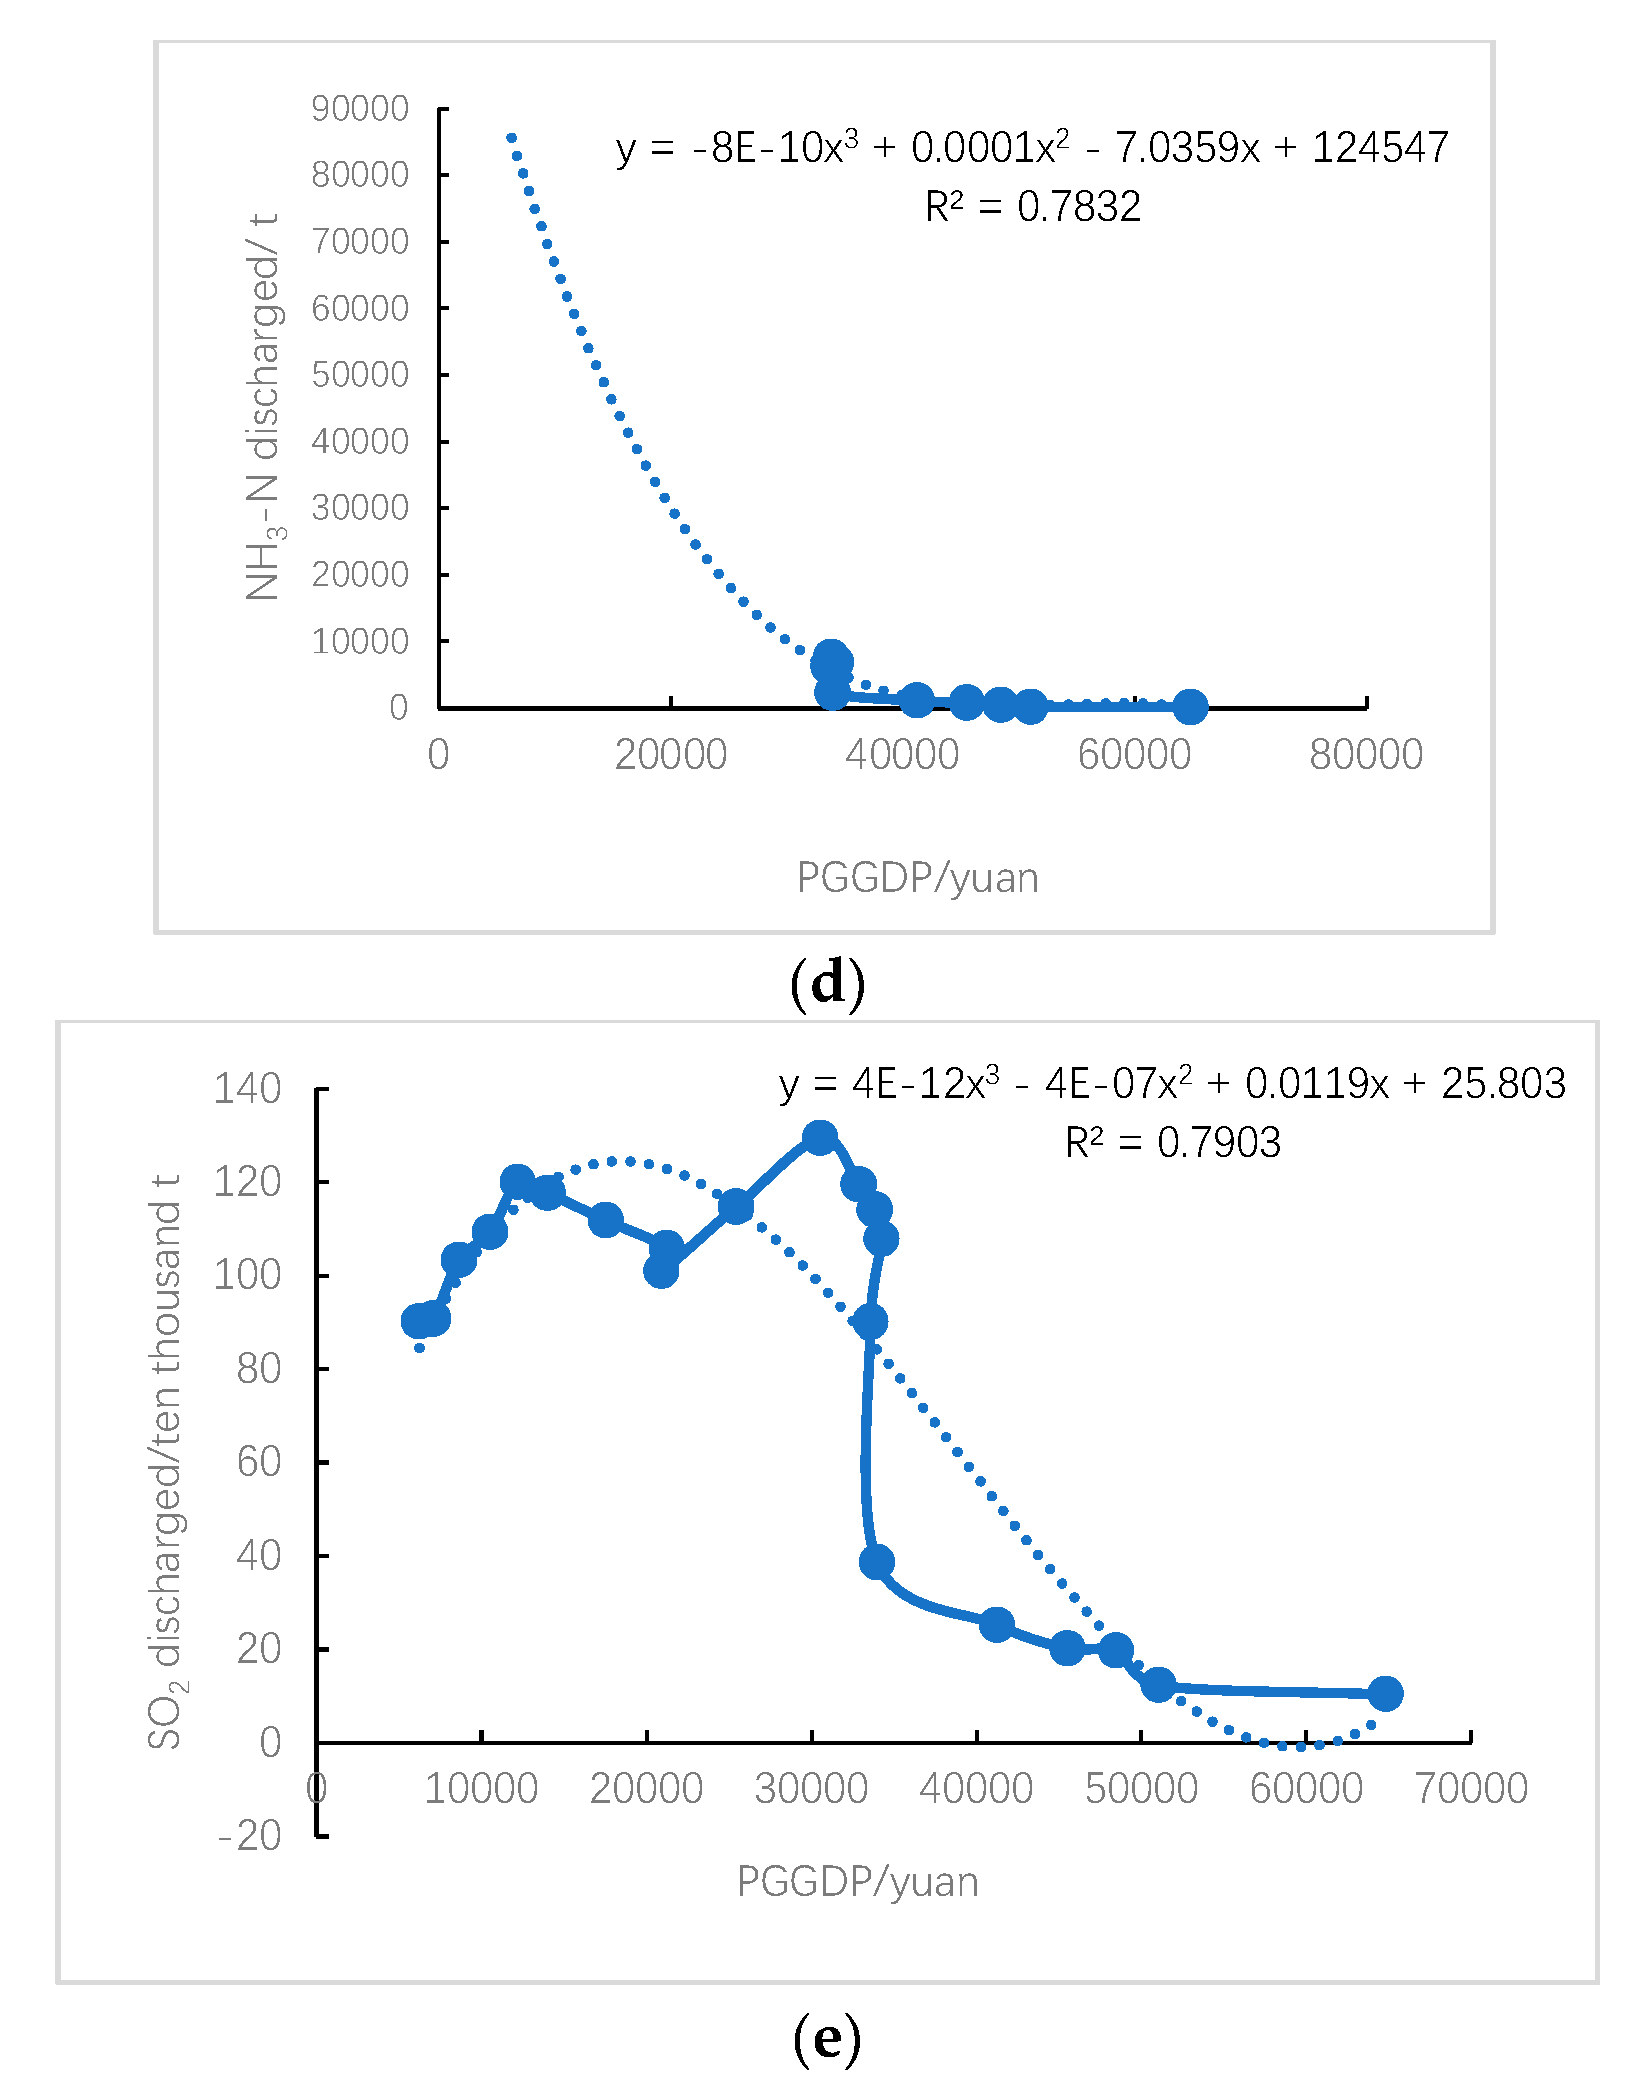
Figure 5.
Thermal Map for Correlation Analysis of Environmental Pollution Intensity Indicators in Shanxi Province. *WW - Industrial wastewater discharge; COD - Chemical oxygen demand emissions; SW - Industrial solid waste emissions; WG - Industrial exhaust emissions; SO2- Emission of sulfur dioxide; NH3-N - Ammonia nitrogen emissions; WG-Waste Gas; PCGDP - Per capita GDP.
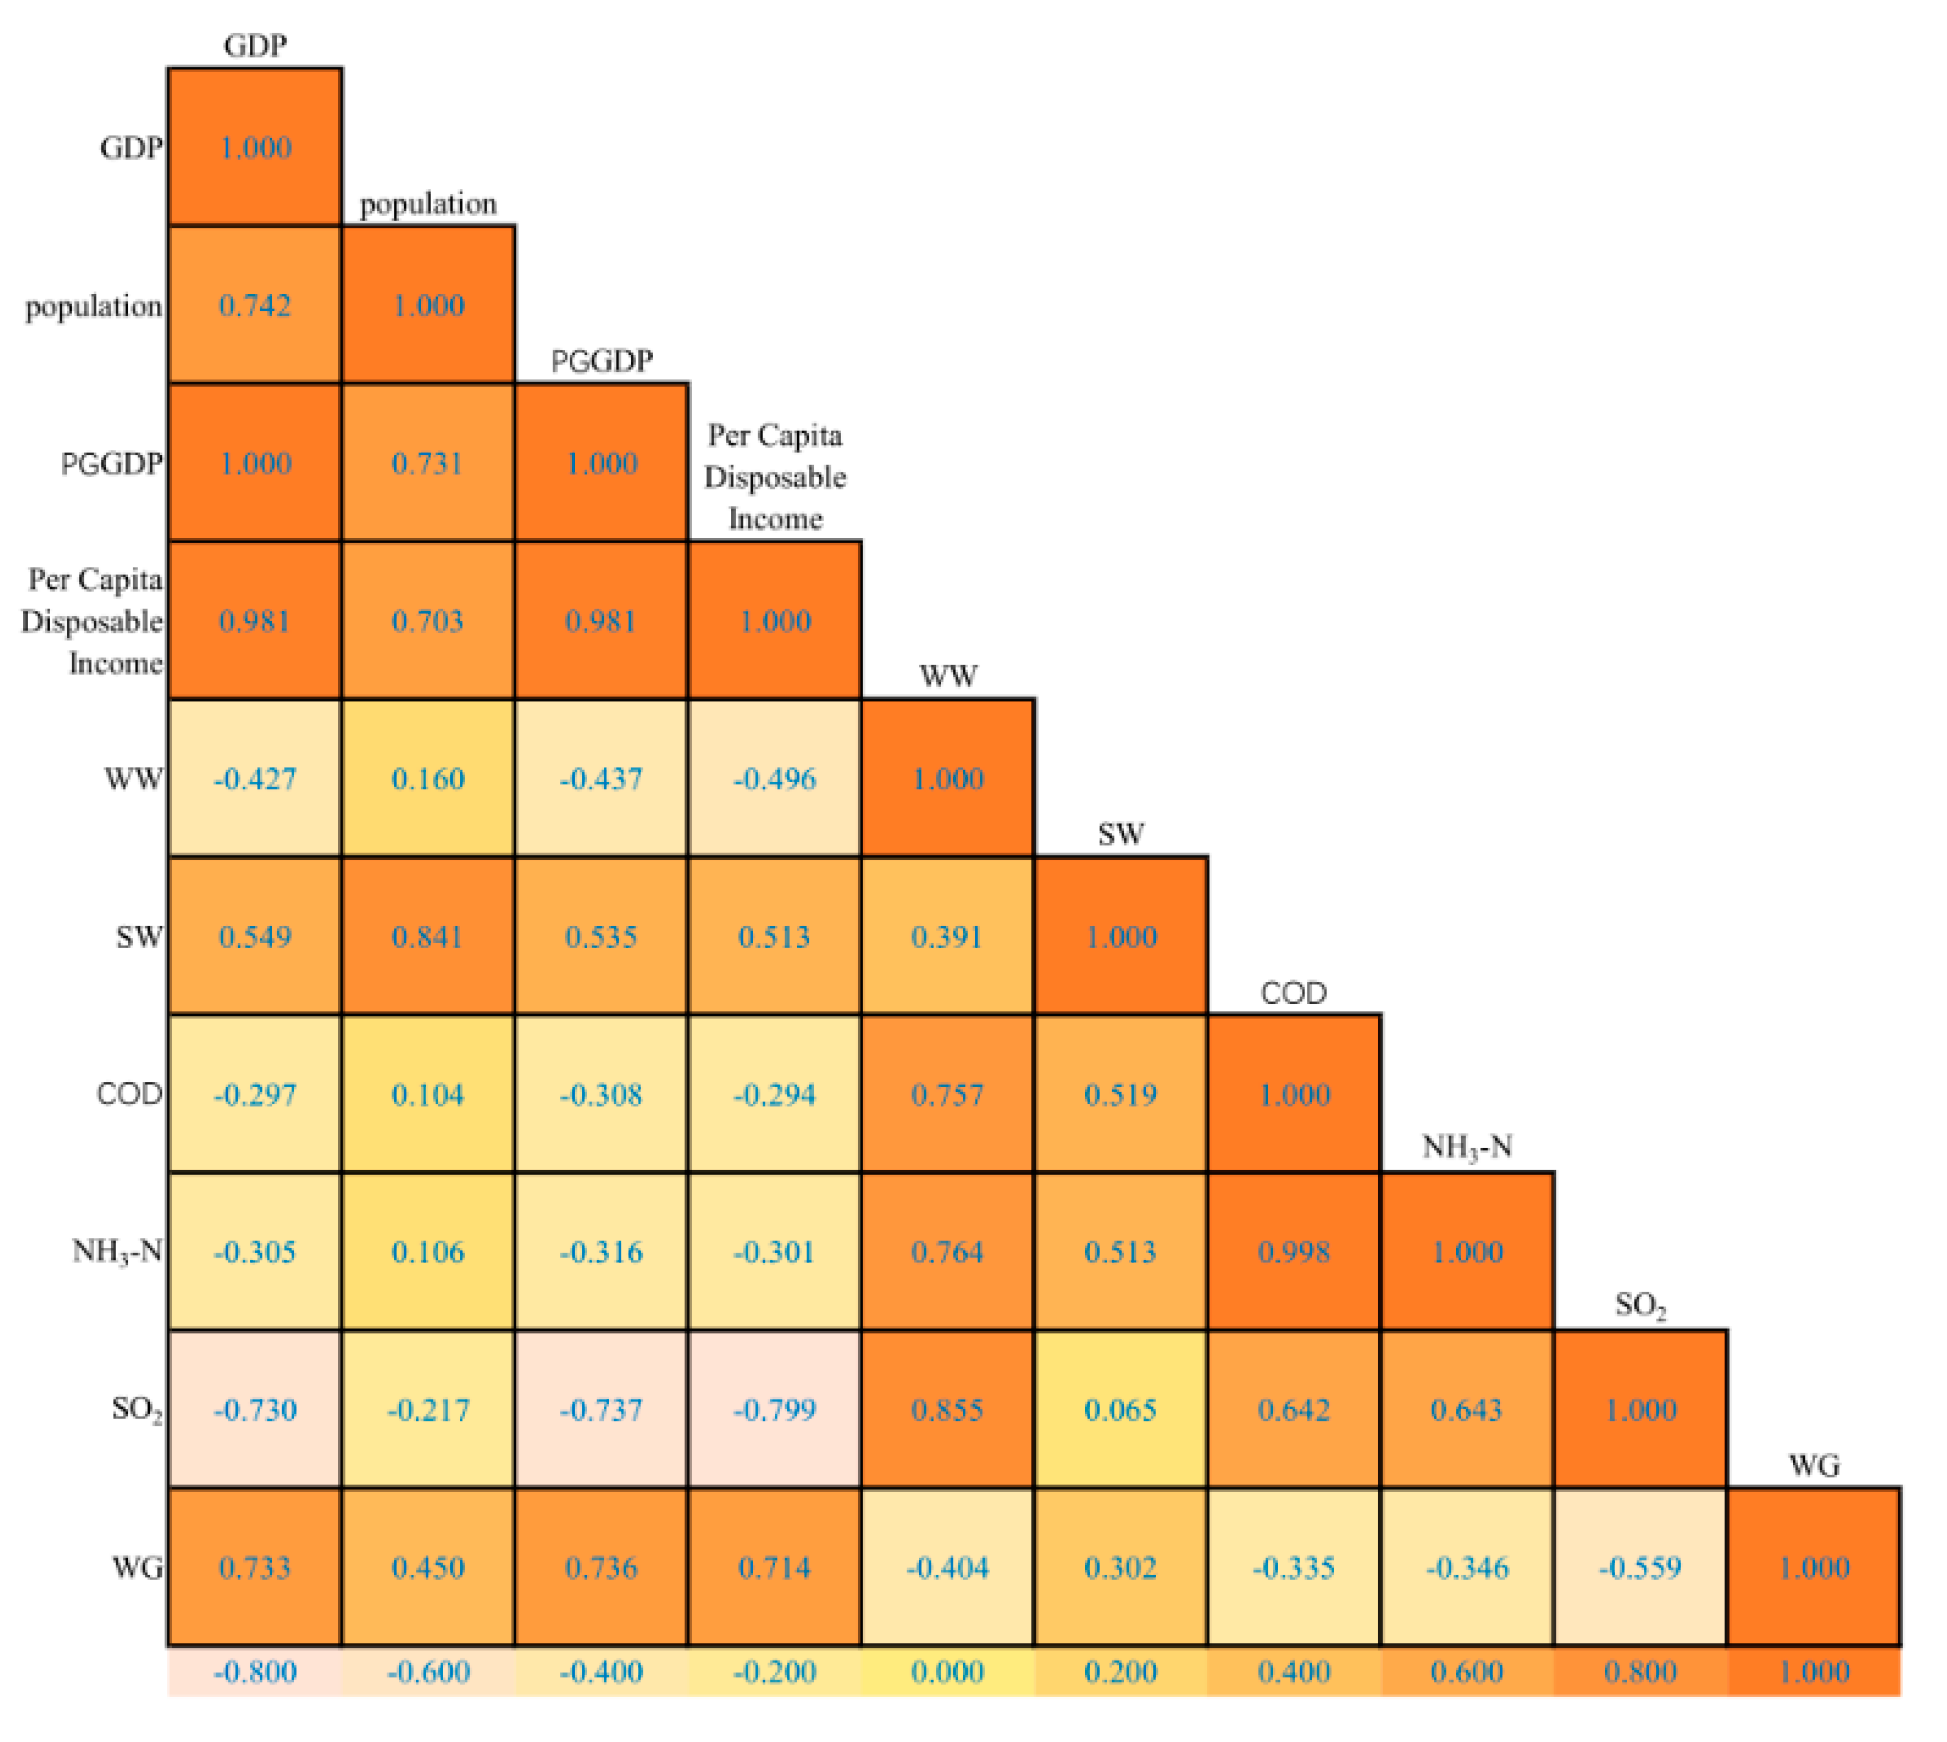

Table 2.
Comparison of evolution characteristics in different periods.
| age | Timeline | Environmental pollution intensity indicators | Quality indicators of economic developmen | Result | References |
|---|---|---|---|---|---|
| 2016 | 1998-2012 | WW | PCGDP | N-shaped | 23 |
| 2018 | 1995-2015 | WW, COD, SW, Soot, WG, SO 2 | PCGDP | Inverted U-shaped, U-shaped, N-shaped | 24 |
| 2020 | 1985-2017 | WG, SO2, COD | PCGDP | N-shaped | 25 |
| 2023 | 2001-2021 | WW, SW, COD, NH3-N, SO 2 | PCGDP | Inverted U-shaped, Inverted N-shaped, N-shaped | This study |
*WW—Industrial wastewater discharge; COD—Chemical oxygen demand emissions; SW—Industrial solid waste emissions; WG—Industrial exhaust emissions; SO2—Emission of sulfur dioxide; NH3-N—Ammonia nitrogen emissions; PCGDP—Per capita GDP.
Disclaimer/Publisher’s Note: The statements, opinions and data contained in all publications are solely those of the individual author(s) and contributor(s) and not of MDPI and/or the editor(s). MDPI and/or the editor(s) disclaim responsibility for any injury to people or property resulting from any ideas, methods, instructions or products referred to in the content. |
© 2023 by the authors. Licensee MDPI, Basel, Switzerland. This article is an open access article distributed under the terms and conditions of the Creative Commons Attribution (CC BY) license (http://creativecommons.org/licenses/by/4.0/).
Copyright: This open access article is published under a Creative Commons CC BY 4.0 license, which permit the free download, distribution, and reuse, provided that the author and preprint are cited in any reuse.


