
Submitted:
22 June 2023
Posted:
23 June 2023
You are already at the latest version
Abstract
Background and aim: To explore the discriminant accuracy of Cytokeratin 18 (CK18, including M65 and M30 forms) for an elevated fatty liver index (FLI) as a validated proxy of Non-Alcoholic Fatty Liver Disease (NAFLD), and cardiovascular disease (CVD) risk in the general population.
Methods: Both serum CK18 forms were measured using a commercial immunoassay in randomly selected samples from 312 participants of the PREVEND general population cohort. FLI ≥60 was used to indicate NAFLD. Framingham Risk Score (FRS) and the SCORE2 were used to estimate the 10-year risk of CVD. Receiver Operating Characteristic (ROC) curve, linear/logistic regression models and Spearman's correlations were used.
Results: Intricate associations were found between CK18, FLI and CVD risk scores. While M30 was the only independent predictor of FLI≥60, M65 discriminated best NAFLD individuals at very-high 10-years CVD risk according to SCORE2 (AUC:0.71; p=0.001). Values above the predefined manufacturer cut-off (400 U/l), were associated with an independent 5-fold increased risk (adjusted odds ratio: 5.44, p=0.01), with negative predictive value of 93%.
Conclusions: Confirming that NAFLD is associated with an increased CVD risk, our results point to CK18 M65 as a candidate biomarker to identify NAFLD individuals at low CVD risk in European general population.
Keywords:
Cytokeratin 18
; Non-Alcoholic Fatty Liver Disease
; Fatty liver index
; Framingham risk score
; Systematic COronary Risk Evaluation 2
1. Introduction
Non-alcoholic fatty liver disease (NAFLD) [1] is defined as hepatic steatosis (triglycerides > 5.5% of liver volume) arising in the absence of significant alcohol intake without evidence of injury or fibrosis [2].
NAFLD is currently the most common cause of chronic liver disease globally, with a 20-30% prevalence in adult population that grows in obese or diabetic patients up to 70-90% with elevated annual medical costs worldwide [3,4]. NAFLD encompasses a histological spectrum ranging from simple steatosis to nonalcoholic steatohepatitis (NASH), and the latter is estimated to become the leading indication for liver transplantation [4]. Meeting population-based NAFLD screening requirements, several laboratory-based algorithms have been developed [5] to identify individuals at NAFLD risk in the general population, such as the fatty liver index (FLI) [6,7,8]. NAFLD is nowadays considered as an independent risk factor for several extra-hepatic chronic diseases such as cardiovascular disease (CVD), hypertension, type 2 diabetes (T2D) and chronic kidney disease [7,9,10,11]. With CVD being the most common cause of death among NAFLD patients [12], accurate CVD risk stratification is also of major clinical importance where biomarker-based approaches are often pragmatically appealing in top of providing further physiopathological insights.
Cytokeratin 18 (CK18) is a cytoskeletal protein and the main intermediate filament family member expressed in the liver [13] and other epithelial tissues [14]. The CK18 full-length form is released from necrotic cells, whereas a caspase-cleaved fragment is a product of the structural changes that occur during apoptosis [14,15]. Soluble total and fragments of CK18 can be detected in human serum with immunoassay [16,17] (Figure 1). The M65 assay measures total CK18 that is, full-length and caspase-cleaved fragments of CK18 generated during cell necrosis and apoptosis, [16,17] (Figure 1b), while the M30 assay detects a neoepitope created in the caspase-3 cleaved 30kDa fragment [16] during cell apoptosis (Figure 1c).
Total CK18 and its fragments have been proposed as promising biomarkers of liver cell death, may be useful for the diagnosing nonalcoholic steatohepatitis (NASH) [18] and can differentiate between non-alcoholic fatty liver and non-alcoholic steatohepatitis [19]. Furthermore, CK18 levels were found to be increased in different diseases associated with an increased CV risk, such as chronic kidney disease [20], T2D [21] and other diseases related to increased endoplasmic reticulum stress and oxidative stress, typical features of cardiometabolic disorders [22,23,24].
A recent study by Quian and colleagues showed that CK18 (M65) was independently and positively associated with cardiometabolic disorders, even after adjustment for the presence of NAFLD and other cardiovascular risk factors [25]. Notably, data are limited regarding the ability of CK18 to predict NAFLD in the general population, and to predict CVD risk among NAFLD subjects. Here we aimed at evaluating i) the discriminant accuracy of CK18 in detecting individuals with NAFLD suspicion (FLI ≥60), and ii) in individuals with a FLI≥60, the predictive ability of CK18 levels to predict high 10-year CV risk according to Framingham Risk Score (FRS) and the Systematic COronary Risk Evaluation (SCORE)-2 algorithms. For these purpose we used data from the Prevention of Renal and Vascular Endstage Disease (PREVEND) general-based population cohort study.
The Cytokeratin 18 (CK18) M65 immunoassay measures total CK18 that is, full-length and caspase-cleaved fragments of CK18 generated during cell necrosis and apoptosis, (Figure 1b). CK18 M30 assay detects a neoepitope created in the caspase-3 cleaved 30-kDa fragment released during cell apoptosis only, (Figure 1c).
2. Methods
2.1. The PREVEND General Population Cohort
The PREVEND (Prevention of Renal and Vascular Endstage Disease) cohort is a large population-based study including 8592 individuals aged 28-75 years from the city of Groningen (Netherlands) [26,27]. From these, 6066 participants completed the third screening PREVEND study round (2004–2007) where active infectious hepatitis and alcohol consumption have been excluded by a detailed questionnaire and for which an extensive clinical and biological characterization is available. For the purpose of the current study, we randomly selected 312 individuals with available fasting serum aliquots stored at -80C for Fatty Liver Index (FLI) and CK18 assessment. The PREVEND cohort study was approved be the local ethical committee from the University of Groningen, The Netherlands (full name in Dutch: Medisch Ethische Toetsingscommissie, abbreviated Metc, IRB no. 01/139) and performed according to the Helsinki declaration. Further information on PREVEND cohort can be found at: https://research.rug.nl/en/datasets/prevention-of-renal-and-vascular-end-stage-disease-prevend.
2.2. NAFLD Definition in PREVEND
Suspected NAFLD was ascertained using the Fatty Liver Index (FLI) and defined as a FLI ≥ 60 as a validated proxy to detect NAFLD in the general population [6,7,8,27,28].
The FLI is calculated according to the following formula: FLI = (e0.953*loge (triglycerides +0.139*BMI+0.718*loge (GGT)+0.053*waist circumference–15.745)/(1+e0.953*loge (triglycerides)+0.139*BM +0.718*loge(GGT +0.053*waist circumference–15.745)*100, where GGT is gamma-glutamyltransferase.
2.3. CVD Risk Prediction Assessment
Absolute risk for 10-year CVD was computed using the Framingham heart risk (FRS) [29] or the Systematic COronary Risk Evaluation 2 (SCORE2) [30] algorithms.
FRS calculation is based upon gender, age, systolic blood pressure, treatment for hypertension, smoking, presence of diabetes, total cholesterol and HDL cholesterol [29]. According to latest recommendations, absolute CVD risk percentage over 10 years was classified as low risk (< 10%), intermediate risk (10–20%), and high risk (> 20%) [31,32].
SCORE2 is a recent computed algorithm derived, calibrated, and validated to predict 10-year risk of first-onset CVD in European populations. It is calculated based on sex, age, smoking status, systolic blood pressure, total cholesterol, HDL cholesterol [30]. The SCORE2 algorithm assigned three risk categories: 1) low-moderate risk, 2) high risk and 3) very-high risk [30].
2.4. Cytokeratin 18 Assessment
The ELISA measurements of the Cytokeratin 18 concentrations were performed using the PEVIVA M65® ELISA and M30® ELISA kits (TECO medical AG, Switzerland), according to their corresponding protocols. Absorbance was measured with the FilterMax F3 Multi-Mode Microplate Reader, using the SoftMax Pro software, version 7.0.3.
For the M65 ELISA test, a cut-off < 400 U/L was established on 222 normal subjects with the 95th percentile equal to 413 U/L. M65 values > 400 U/L are a strong indication for liver disease [33].The LLOD and LLOQ for this test is 25 U/L and 67 U/L respectively.
For the M30 ELISA test, a cut-off < 200 U/L was established on 200 normal subjects with the 95th percentile equal to 251 U/L. M30 values > 200 U/L are a strong indication for liver disease as reported on the technical information sheet [33,34]. The LLOD and LLOQ for this test is 20 U/L and 40 U/L respectively.
2.5. Biomarkers Determinations
Total cholesterol, HDL cholesterol and triglycerides (TG) were measured using routine procedures on a Roche Modular P chemistry analyzer (Roche 8000/H Cobas), low-density lipoprotein (LDL) cholesterol were calculated using the Friedewald formula. Glucose, gamma-glutamyltransferase (GGT), alkaline phosphatase (ALP), alanine aminotransferase (ALT) and aspartate aminotransferase (AST) were quantified on a Roche Modular Platform.
2.6. Statistical Analysis
Continuous variables were expressed as median and interquartile range (IQR) and categorical variables in numbers with percentages. Normality of distribution was tested with the Shapiro-Wilk test. Comparisons between two groups were performed using a non-parametric Mann-Whitney U test or Chi-square test. Correlations analyses were carried out using Spearman rank correlation test. In linear regression analysis, non-normally distributed data were transformed in natural logarithmic value.
C-statistics analyses were used to evaluate the discriminant accuracies of CK18 for FLI≥60, and very-high 10-year CVD risk according to FRS and SCORE2 and reported as area under the curve (AUC). Univariate and adjusted logistic regression analyses were performed to examine the association between FLI (continuous value) or CK18 (continuous or categorical values) and a high 10-year risk for CVD (according to SCORE2 or FRS scoring) [29,30,31,32] in case of significant AUC only. High FRS or very-high SCORE2 categories (described in the methods section) versus moderate and low risk groups together in the same category have been set as the binary outcome. We used the cut-off of 200 U/L and 400 U/L for M30 and M65 respectively [33,34] as specified in the above paragraph. Adjusted analyses for continuous or categorical variables were performed only in case of signification in univariate model. These analyses were carried-out in three pre-specified PREVEND subgroups consisting of i) the overall randomly selected individuals, ii) those with FLI≥60, and iii) those with FLI< 60). Results are reported with 95% confidence intervals (95%CI). Due to the predefined study endpoints and the exploratory nature of this work, adjustment for multiple testing was not performed. Statistical analyses were performed with Tibco Statistica software (version 13.5.0.17, TIBCO Software Inc., Palo Alto, CA, USA) on the PREVEND cohort, statistical significance was set at p<0.05. Receiver operating curve (ROC) analysis and the reported values of sensitivity, specificity, positive and negative predictive values were performed using Analyse-it Software, Ltd. (Leeds, United Kingdom).
3. Results
3.1. Characteristics of the Study Subjects
The demographic characteristics of the 312 randomly selected PREVEND participants are summarized in Table 1. In order to analyze the associations between CK18 (both forms M30 and M65) with CVD risk, in individuals from the PREVEND general population with NAFLD we dichotomized PREVEND participants according to FLI values, < or ≥ 60 [6,28].
All continuous variables are expressed as median (interquartile range [IQR]) or number [no.] (percentages [%]). P-value (Mann-Whitney U-test for continuous variables and Fisher's exact test for categorical variables).Abbreviations: total-c: total cholesterol; LDL-c: low density lipoprotein cholesterol; HDL-c: high-density lipoprotein cholesterol; TG: triglyceride; BMI: body mass index; ALT: alanine transaminase; AST: aspartate transaminase; FLI: fatty liver index; ALP: alkaline phosphatase; GGT: gamma-glutamyl-transferase; FRS: Framingham risk score; SCORE: Systematic COronary Risk Evaluation; CK: Cytokeratin; § FRS: calculated based on sex, age, smoking status, presence of diabetes, hypertension treatment, total cholesterol, HDL cholesterol.
§§ SCORE2: calculated based on sex, age, smoking status, systolic blood pressure, total cholesterol, HDL cholesterol.; §§§ FLI: (e 0.953*loge (triglycerides) + 0.139*BMI + 0.718*loge (ggt) + 0.053*waist circumference - 15.745) / (1 + e 0.953*loge (triglycerides) + 0.139*BMI + 0.718*loge (ggt) + 0.053*waist circumference - 15.745) * 100. # LDL-c: calculated according to Friedwald formula.
The prevalence of a FLI ≥ 60 was 35.8% (112/312). Men were less likely to have a FLI ≥ 60 then women (P=0.003). Subjects with FLI ≥ 60 exhibited significantly higher values for age, body mass index (BMI), waist circumference, weight, diastolic and systolic blood pressure, TG, plasma Glucose, ALT, AST, GGT and a lower value for HDL-c than those with FLI < 60. Total-c and LDL-c did not differ significantly between the two groups. Serum CK18, M30 and M65 levels were significantly higher in subjects with FLI ≥ 60 than in subjects with FLI<60. Moreover, FLI ≥ 60 group had a significantly higher values of FRS and SCORE2 compared to the FLI<60 group (Table 1).
3.2. CK18 and the Risk of NAFLD (FLI≥60)
On the 312 randomly selected PREVEND participants, C-statistics analyses showed that both M30 and M65 as continuous variables had a significant discriminant accuracy to predict a FLI≥60, with AUCs of 0.702 and 0.657 respectively (Supplemental Table S1). Adjusted logistic regression analyses indicated that only M30 was an independent predictor of FLI≥60. Values above the predefined cut-off of 200 U/L (provided by the manufacturer), were associated with an independent 3-fold increased risk of NAFLD (FLI≥ 60) (Supplemental Table s1). At this cut-off the sensitivity (SE), specificity (SP), positive and negative predictive value (PPV, NPV) were 57.1%, 72.5 %, 54.0% and 75.0%, respectively.
3.3. CK18 and High-Risk of Cardiovascular Disease Prediction
To further explore the CK18 CVD risk prediction strength in PREVEND participants we performed C-statistics and logistic regression in the three pre-specified PREVEND groups (overall, FLI≥60 and FLI< 60).
As shown in Table 2, FLI displayed significant AUCs to discriminate an individual at high 10-years CVD risk according to FRS across the three considered groups. M65 was also a significant predictor of high CVD risk in overall and in FLI ≥60 groups, while M30 was found to bare some significant predictive ability in the overall cohort only (Table 2). Extending these observations, multivariate logistic regression analyses (using CK18 continuous or categorical values) indicated FLI was the only independent predictor of high FRS (P<0.0001) in the three groups. A close to significant association was observed for M65 in the overall and FLI≥60 subgroup as continuous variable, but not when categorized according to the pre-specified cut-off (Table 2). No associations were retrieved for M30 in any for the subgroups analyzed (Table 2).
SCORE2 algorithm likely being better calibrated for European populations than the FRS [35], we repeated the same analyses with the 10-year CVD risk computed according to SCORE2 as described in Table 3. In the overall group, C-statistics indicated that FLI as continuous value was found to be the only significant predictor of a very high CVD risk, while a non-significant trend was noted for M65 (Table 3). On the other hand, in the FLI≥60 subgroup, M65 was the only predictor of high CV risk according to SCORE2, with an AUC of 0.71. Logistic regression analyses corroborated these results demonstrating that M65 was independently associated with a 5-fold increased risk of a very high CVD risk according to SCORE2 (Table 3). M65 values above the pre-specified manufacturer cut-off were associated with the following SE, SP, PPV and NPV: 41.7%, 89.7%, 33% and 93.0%, respectively. None of these predictors of interest were found to be discriminant in the FI<60 subgroup (Table 3).
3.4. Determinants of CK18 Associations with Cardiovascular Disease Risk Scores and FLI
In the overall cohort, Spearman analyses indicated positive correlations between M30 and M65 with most of the cardiometabolic and hepatic parameters, including FLI, FRS and SCORE2 at the exception of inverse correlations with total-c, LDL-c and HDL-c. Most of these associations were lost in the FLI ≥ 60 or FLI<60 subgroups (Table 4). In the FLI ≥ 60 subgroup, the significant positive correlations between M30, M60 with liver function enzymes were maintained, as well as the significant negative associations with total cholesterol and LDL-C. In FLI<60 subgroup, M30 and M65 associated only with plasma glucose, AST, GGT and FLI (Table 4).
In order to further understand the factors susceptible to underlie associations between M30 and M65 with FRS, SCORE2 or FLI, we performed univariate and multivariate linear regression analyses on the three groups of PREVEND participants (Table 5). In the 312 subjects combined univariate linear regression analyses demonstrated that M30, M65 and FLI were associated with FRS or SCORE2 and that M30 and M65 were associated with FLI (Table 5). However, in multivariate analyses, only FLI was statistically significantly associated with FRS, while both FLI and M65 were statistically significantly associated with SCORE2 (Table 5). In addition, M30 and M65 were associated with FLI (P=0.0001; P=0.03, respectively).
In the FLI ≥ 60 group (Table 5), univariate linear regression analysis indicated that only FLI was associated with FRS while M65 and FLI were associated with SCORE2; the associations of M30 and M65 with FLI was lost P=0.88; P=0.28, respectively). In multivariate analyses, FLI was independently associated with FRS, and FLI and M65 were independently associated with SCORE2 (Table 5). The same analyses performed in participants with FLI<60, highlighted that only FLI was independently associated to FRS or SCORE2 and that only M30 associated with FLI P=0.02; P=0.70).
4. Discussion
The first important finding of the present study is that FLI, a validated biochemically-derived index used for NAFLD screening in the general population, [6,7,28,36] is well an independent CVD risk predictor, further lending weight to the cumulative body of evidence showing that NAFLD is associated with an increased CVD risk and may even be considered as an independent CVD risk factor [10,25,37,38]. Our current results showing an association between an elevated FLI and CVD risk according to FRS corroborate and extend recent findings derived from Korean [39], and European populations [40]. Our results also showed that the prevalence of elevated FLI in the general population is similar to what has been previously reported [7,28]. Interestingly, our results indicate that in the context of FLI≥60, this independent association could not be reproduced with SCORE2, possibly due to known model calibration differences between FRS and SCORE2 [35]. FRS has been developed in the United States [29], while SCORE2 has been recently derived to estimate 10-year fatal and non-fatal cardiovascular disease (CVD) risk in individuals from Europe [30].Whether a calibration or any other non-mutually exclusive issue underly such discrepancy in our European general population study is still unknown and warrants further scrutinyThe discordance in those results can be a strength point of our study given the PREVEND cohort originates from the North of Europe consequently SCORE2 can be a more suitable algorithm to use for the CVD risk estimation.
The second important finding of this work is that total CK18 (M65) was found to be associated with a very high CVD risk according to the SCORE2, both in the overall cohort and particularly in individuals suspected of NAFLD (FLI≥60). Consistent with previous studies [21,41,42], our linear regression and Spearman analyses showed that M30 and M65 were independently associated with FLI and with several cardiometabolic parameters in the complete PREVEND participants subset. Extending previous observations reporting higher levels of CK18 (M30 and M65) in NAFLD subjects compared to healthy subjects [21,42] and even more in steatohepatitis [25], this is to our knowledge the first demonstration indicating that CK-18 (M30) predicts FLI-suspected NAFLD and that CK-18 (M65) predicts 10-year CVD risk independently of FLI, if the SCORE2 is used for CVD risk stratification purposes.
Using the M65 pre-specified and previously validated cut-off set at 400 U/L, the odds of very high CVD would increase by 5-fold (adjusted OR: 5.44; P=0.01). At this cut-off, the NPV of 93.0% indicates that M65 may potentially be useful in primary care setting to exclude very-high risk CVD in NAFLD individuals. The potential clinical application needs to be challenged by larger multi-center studies.
Our study has several limitations.
Firstly, our cross-sectional observational study included a relatively limited number of randomly selected subjects, raising the possibly of selection biais. The fact that both the prevalence of FLI-based NAFLD diagnosis in our study and the FLI associations with cardiometabolic features was similar to what was reported in other European populations previously [7,11,40], we consider that such issue is unlikely to have blunted the present results, even if formally not excluded.. Therefore, these preliminary findingsshould be considered as hypothesis-generating and are not meant to propose clinical guidance.
Secondly, if FLI is an accepted diagnostic tool for NAFLD in population studies [6,7,8], it is a surrogate indicator of hepatic fat accumulation. Moreover we could not further validate our findings by taking into account other well validated indirect indices of liver fibrosis, such as FIB-4 score [5] due to the lack of appropriate sampling for platelet counts upon study inclusion.
In conclusion, the present results show that CK18 (M30) is a predictor of FLI suspected NAFLD, confirm that FLI is an independent predictor of a high 10-year CV risk according to both FRS and SCORE2 algorithms. Furthermore, this hypothesis-generating study indicates that CK18 (M65) measurement could help to exclude a very-high CVD risk in NAFLD individuals. Further research is needed to validate these findings and to support M65 clinical significance and clarify these observed associations in a longitudinal design.
Supplementary Materials
The following supporting information can be downloaded at the website of this paper posted on Preprints.org. Table s1. Performance of CK-18 (categorical or continuous value) in predicting FLI≥60 in PREVEND participants.
Author Contributions
Sabrina Pagano: Conceptualization, Methodology, Validation, Data curation, Formal analysis, Writing - Original Draft, Writing - Review & Editing. Stephan J. L. Bakker: Resources, data curation, Writing - Original Draft. Catherine Juillard: Investigation. Robin P. F. Dullaart: Supervision, Resources, Writing - Original Draft, Writing - Review & Editing. Nicolas Vuilleumier: Conceptualization, Writing - Original Draft, Supervision, Project administration, Funding acquisition, Writing - Review & Editing.
Funding
This research received no external funding.
Acknowledgments
The authors express their thanks to the participants of the PREVEND study.
Conflicts of Interest
The authors disclose no conflicts.
References
- Eslam, M.; Sanyal, A.J.; George, J.; on behalf of theInternational Consensus Panel. MAFLD: A Consensus-Driven Proposed Nomenclature for Metabolic Associated Fatty Liver Disease. Gastroenterology 2020, 158, 1999–2014. [Google Scholar] [CrossRef]
- Chalasani, N.; Younossi, Z.; LaVine, J.E.; Charlton, M.; Cusi, K.; Rinella, M.; Harrison, S.A.; Brunt, E.M.; Sanyal, A.J. The diagnosis and management of nonalcoholic fatty liver disease: Practice guidance from the American Association for the Study of Liver Diseases. Hepatology 2018, 67, 328–357. [Google Scholar] [CrossRef]
- Younossi, Z.M.; Anstee, Q.M.; Marietti, M.; Hardy, T.; Henry, L.; Eslam, M.; George, J.; Bugianesi, E. Global burden of NAFLD and NASH: trends, predictions, risk factors and prevention. Nat. Rev. Gastroenterol. Hepatol. 2017, 15, 11–20. [Google Scholar] [CrossRef]
- Younossi, Z.M.; Blissett, D.; Blissett, R.; Henry, L.; Stepanova, M.; Younossi, Y.; Racila, A.; Hunt, S.; Beckerman, R. The economic and clinical burden of nonalcoholic fatty liver disease in the United States and Europe. Hepatology 2016, 64, 1577–1586. [Google Scholar] [CrossRef] [PubMed]
- Segura-Azuara, N.d.L. .; Varela-Chinchilla, C.D.; Trinidad-Calderón, P.A. MAFLD/NAFLD Biopsy-Free Scoring Systems for Hepatic Steatosis, NASH, and Fibrosis Diagnosis. Front. Med. 2022, 8, 774079. [Google Scholar] [CrossRef] [PubMed]
- Bedogni, G.; Bellentani, S.; Miglioli, L.; Masutti, F.; Passalacqua, M.; Castiglione, A.; Tiribelli, C. The Fatty Liver Index: A simple and accurate predictor of hepatic steatosis in the general population. BMC Gastroenterol. 2006, 6, 33. [Google Scholar] [CrossRef] [PubMed]
- Van den Berg, E.H.; Amini, M.; Schreuder, T.C.M.A.; Dullaart, R.P.F.; Faber, K.N.; Alizadeh, B.Z.; Blokzijl, H. Prevalence and determinants of non-alcoholic fatty liver disease in lifelines: A large Dutch population cohort. PLoS ONE 2017, 12, e0171502. [Google Scholar] [CrossRef]
- Gastaldelli, A.; Kozakova, M.; Højlund, K.; Flyvbjerg, A.; Favuzzi, A.; Mitrakou, A.; Balkau, B.; RISC Investigators. Fatty liver is associated with insulin resistance, risk of coronary heart disease, and early atherosclerosis in a large European population. Hepatology 2009, 49, 1537–1544. [Google Scholar] [CrossRef]
- Armstrong, M.J.; Adams, L.A.; Canbay, A.; Syn, W.-K. Extrahepatic complications of nonalcoholic fatty liver disease. Hepatology 2014, 59, 1174–1197. [Google Scholar] [CrossRef]
- Targher, G.; Tilg, H.; Byrne, C.D. Non-alcoholic fatty liver disease: a multisystem disease requiring a multidisciplinary and holistic approach. Lancet Gastroenterol. Hepatol. 2021, 6, 578–588. [Google Scholar] [CrossRef]
- Berg, E.H.v.D.; Flores-Guerrero, J.L.; Gruppen, E.G.; de Borst, M.H.; Wolak-Dinsmore, J.; Connelly, M.A.; Bakker, S.J.L.; Dullaart, R.P.F. Non-Alcoholic Fatty Liver Disease and Risk of Incident Type 2 Diabetes: Role of Circulating Branched-Chain Amino Acids. Nutrients 2019, 11, 705. [Google Scholar] [CrossRef]
- Targher, G.; Day, C.P.; Bonora, E. Risk of Cardiovascular Disease in Patients with Nonalcoholic Fatty Liver Disease. New Engl. J. Med. 2010, 363, 1341–1350. [Google Scholar] [CrossRef]
- Eguchi, A.; Wree, A.; Feldstein, A.E. Biomarkers of liver cell death. J. Hepatol. 2014, 60, 1063–1074. [Google Scholar] [CrossRef]
- Ueno, T.; Toi, M.; Linder, S. Detection of epithelial cell death in the body by cytokeratin 18 measurement. Biomed. Pharmacother. 2005, 59, S359–S362. [Google Scholar] [CrossRef]
- Schutte, B.; Henfling, M.; Kölgen, W.; Bouman, M.; Meex, S.; Leers, M.P.; Nap, M.; Björklund, V.; Björklund, P.; Björklund, B.; et al. Keratin 8/18 breakdown and reorganization during apoptosis. Exp. Cell Res. 2004, 297, 11–26. [Google Scholar] [CrossRef]
- Cummings, J.; Ranson, M.; Butt, F.; Moore, D.; Dive, C. Qualification of M30 and M65 ELISAs as surrogate biomarkers of cell death: long term antigen stability in cancer patient plasma. Cancer Chemother. Pharmacol. 2007, 60, 921–924. [Google Scholar] [CrossRef]
- Kramer, G.; Schwarz, S.; Hägg, M.; Havelka, A.M.; Linder, S. Docetaxel induces apoptosis in hormone refractory prostate carcinomas during multiple treatment cycles. Br. J. Cancer 2006, 94, 1592–1598. [Google Scholar] [CrossRef]
- Lee, J.; Vali, Y.; Anstee, Q.; Duffin, K.; Bossuyt, P.; Zafarmand, M.H. Accuracy of cytokeratin-18 (M30 and M65) in detecting non-alcoholic steatohepatitis and fibrosis: a systematic review and meta-analysis. J. Hepatol. 2020, 73, S416. [Google Scholar] [CrossRef]
- Kosasih, S.; Qin, W.Z.; Rani, R.A.; Hamid, N.A.; Soon, N.C.; Shah, S.A.; Yaakob, Y.; Ali, R.A.R. Relationship between Serum Cytokeratin-18, Control Attenuation Parameter, NAFLD Fibrosis Score, and Liver Steatosis in Nonalcoholic Fatty Liver Disease. Int. J. Hepatol. 2018, 2018, 1–9. [Google Scholar] [CrossRef]
- Roth, G.A.; Lebherz-Eichinger, D.; Ankersmit, H.J.; Hacker, S.; Hetz, H.; Vukovich, T.; Perne, A.; Reiter, T.; Farr, A.; Hörl, W.H.; et al. Increased total cytokeratin-18 serum and urine levels in chronic kidney disease. Clin. Chim. Acta 2011, 412, 713–717. [Google Scholar] [CrossRef]
- Chang, Y.-H.; Lin, H.-C.; Hwu, D.-W.; Chang, D.-M.; Lin, K.-C.; Lee, Y.-J. Elevated serum cytokeratin-18 concentration in patients with type 2 diabetes mellitus and non-alcoholic fatty liver disease. Ann. Clin. Biochem. Int. J. Biochem. Lab. Med. 2018, 56, 141–147. [Google Scholar] [CrossRef] [PubMed]
- Dalleau, S.; Baradat, M.; Guéraud, F.; Huc, L. Cell death and diseases related to oxidative stress:4-hydroxynonenal (HNE) in the balance. Cell Death Differ. 2013, 20, 1615–1630. [Google Scholar] [CrossRef]
- Ozcan, L.; Tabas, I. Role of Endoplasmic Reticulum Stress in Metabolic Disease and Other Disorders. Annu. Rev. Med. 2012, 63, 317–328. [Google Scholar] [CrossRef]
- Swisa, A.; Glaser, B.; Dor, Y. Metabolic Stress and Compromised Identity of Pancreatic Beta Cells. Front. Genet. 2017, 08, 21. [Google Scholar] [CrossRef]
- Altaf, B.; Rehman, A.; Jawed, S.; Raouf, A. Association of liver biomarkers and cytokeratin-18 in Nonalcoholic fatty liver disease patients. Pak. J. Med Sci. 2020, 36, 387–390. [Google Scholar] [CrossRef]
- Kappelle, P.J.W.H.; Gansevoort, R.T.; Hillege, J.L.; Wolffenbuttel, B.H.R.; Dullaart, R.P.F. ; on behalf of the PREVEND study group Apolipoprotein B/A-I and total cholesterol/high-density lipoprotein cholesterol ratios both predict cardiovascular events in the general population independently of nonlipid risk factors, albuminuria and C-reactive protein. J. Intern. Med. 2010, 269, 232–242. [Google Scholar] [CrossRef] [PubMed]
- Damba, T.; Bourgonje, A.R.; Abdulle, A.E.; Pasch, A.; Sydor, S.; van den Berg, E.H.; Gansevoort, R.T.; Bakker, S.J.L.; Blokzijl, H.; Dullaart, R.P.F.; et al. Oxidative stress is associated with suspected non-alcoholic fatty liver disease and all-cause mortality in the general population. Liver Int. 2020, 40, 2148–2159. [Google Scholar] [CrossRef]
- Post, A.; Garcia, E.; Berg, E.H.D.; Flores-Guerrero, J.L.; Gruppen, E.G.; Groothof, D.; Westenbrink, B.D.; Connelly, M.A.; Bakker, S.J.; Dullaart, R.P.F. Nonalcoholic fatty liver disease, circulating ketone bodies and all-cause mortality in a general population-based cohort. Eur. J. Clin. Investig. 2021, 51, e13627. [Google Scholar] [CrossRef]
- D'Agostino, R.B., Sr.; Vasan, R.S.; Pencina, M.J.; Wolf, P.A.; Cobain, M.; Massaro, J.M.; Kannel, W.B. General Cardiovascular Risk Profile for Use in Primary Care: The Framingham Heart Study. Circulation 2008, 117, 743–753. [Google Scholar] [CrossRef]
- SCORE2 working group and ESC Cardiovascular risk collaboration. SCORE2 risk prediction algorithms: new models to estimate 10-year risk of cardiovascular disease in Europe. Eur. Hear. J. 2021, 42, 2439–2454. [Google Scholar] [CrossRef]
- Bosomworth, N.J. Practical use of the Framingham risk score in primary prevention: Canadian perspective. Can. Fam. Physician 2011, 57, 417–23. [Google Scholar]
- Sohn, C.; Kim, J.; Bae, W. The framingham risk score, diet, and inflammatory markers in Korean men with metabolic syndrome. Nutr. Res. Pr. 2012, 6, 246–253. [Google Scholar] [CrossRef]
- Lee, J.; Vali, Y.; Boursier, J.; Duffin, K.; Verheij, J.; Brosnan, M.J.; Zwinderman, K.; Anstee, Q.M.; Bossuyt, P.M.; Zafarmand, M.H. Accuracy of cytokeratin 18 (M30 and M65) in detecting non-alcoholic steatohepatitis and fibrosis: A systematic review and meta-analysis. PLOS ONE 2020, 15, e0238717. [Google Scholar] [CrossRef]
- Kawanaka, M.; Nishino, K.; Nakamura, J.; Urata, N.; Oka, T.; Goto, D.; Suehiro, M.; Kawamoto, H.; Yamada, G. Correlation between serum cytokeratin-18 and the progression or regression of non-alcoholic fatty liver disease. Ann. Hepatol. 2015, 14, 837–844. [Google Scholar] [CrossRef]
- Pennells, L.; Kaptoge, S.; Wood, A.; Sweeting, M.; Zhao, X.; White, I.; Burgess, S.; Willeit, P.; Bolton, T.; Moons, K.G.M.; et al. Equalization of four cardiovascular risk algorithms after systematic recalibration: individual-participant meta-analysis of 86 prospective studies. Eur. Hear. J. 2018, 40, 621–631. [Google Scholar] [CrossRef]
- European Association for the Study of the Liver (EASL); European Association for the Study of Diabetes (EASD); European Association for the Study of Obesity (EASO). EASL-EASD-EASO Clinical Practice Guidelines for the management of non-alcoholic fatty liver disease. J. Hepatol. 2016, 64, 1388–1402. [Google Scholar] [CrossRef]
- Kasper, P.; Martin, A.; Lang, S.; Kütting, F.; Goeser, T.; Demir, M.; Steffen, H.-M. NAFLD and cardiovascular diseases: a clinical review. Clin. Res. Cardiol. 2020, 110, 921–937. [Google Scholar] [CrossRef] [PubMed]
- Targher, G.; Byrne, C.D.; Tilg, H. NAFLD and increased risk of cardiovascular disease: clinical associations, pathophysiological mechanisms and pharmacological implications. Gut 2020, 69, 1691–1705. [Google Scholar] [CrossRef]
- Kim, J.H.; Moon, J.S.; Byun, S.J.; Lee, J.H.; Kang, D.R.; Sung, K.C.; Kim, J.Y.; Huh, J.H. Fatty liver index and development of cardiovascular disease in Koreans without pre-existing myocardial infarction and ischemic stroke: a large population-based study. Cardiovasc. Diabetol. 2020, 19, 51–9. [Google Scholar] [CrossRef]
- Kunutsor, S.K.; Bakker, S.J.L.; Blokzijl, H.; Dullaart, R.P.F. Associations of the fatty liver and hepatic steatosis indices with risk of cardiovascular disease: Interrelationship with age. Clin. Chim. Acta 2017, 466, 54–60. [Google Scholar] [CrossRef] [PubMed]
- Qian, L.; Zhang, L.; Wu, L.; Zhang, J.; Fang, Q.; Hou, X.; Gao, Q.; Li, H.; Jia, W. Elevated Serum Level of Cytokeratin 18 M65ED Is an Independent Indicator of Cardiometabolic Disorders. J. Diabetes Res. 2020, 2020, 1–10. [Google Scholar] [CrossRef] [PubMed]
- Rasool, A.; Qadir, A.; Sahar, T.; Khan, M.A. Correlation of cytokeratin-18 as a marker of cardiovascular risk assessment in nonalcoholic fatty liver disease in nonobese and nondiabetic patients: Two years prospective study. Asian J. Pharm. Res. Heal. Care 2022, 14, 177. [Google Scholar] [CrossRef]
Figure 1.
CK18 detection and distinction between M30 and M65 immunoassays.
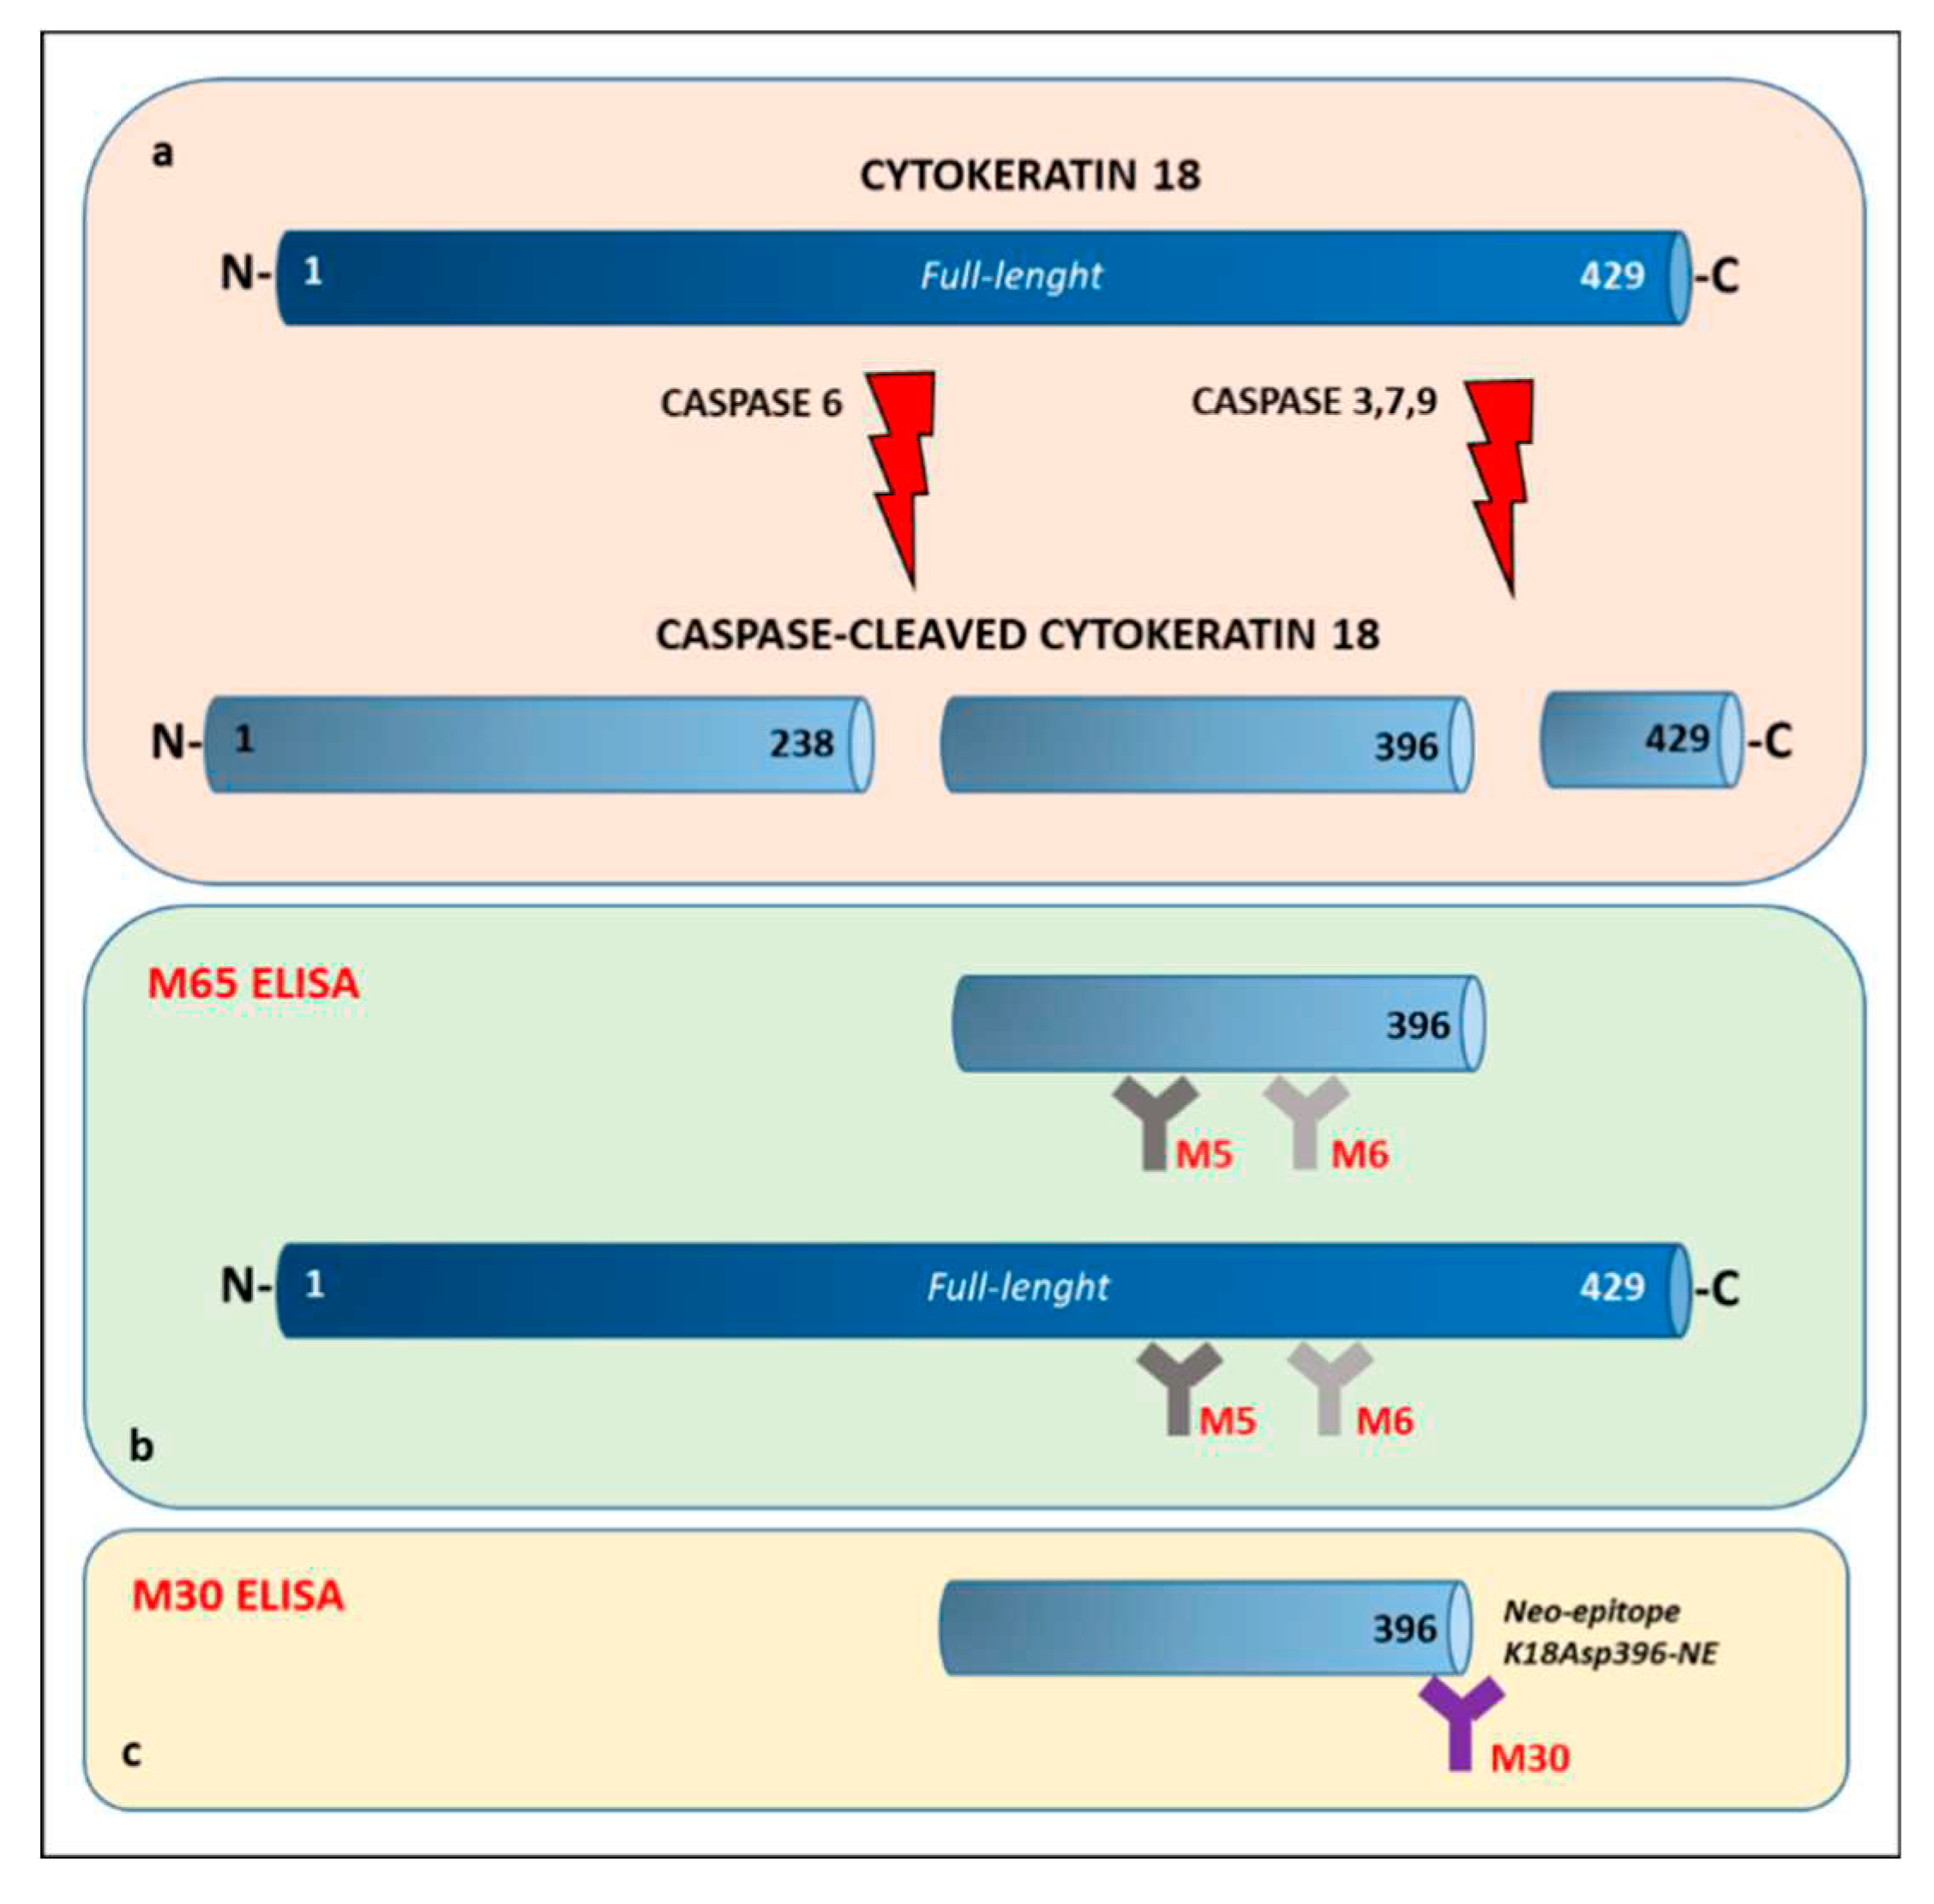

Table 1.
Clinical characteristics of PREVEND participants (n=312) according to FLI status.
| Overall (n=312) | FLI < 60 (n=200) |
FLI ≥ 60 (n=112) |
P-value | |
|---|---|---|---|---|
| Demographic | ||||
| Age, yr. | 53 (46-65) | 51 (45-59.5) | 59 (50.5-69) | <0.0001 |
| Males, no. (%) | 154 (49.3) | 111 (55.5) | 43 (38.3) | 0.01 |
| Waist circumference, cm | 94 (85-104) | 87 (80-94) | 107 (102-114) | <0.0001 |
| Weight, kg | 78 (69.7-89) | 73 (65-80) | 93 (84-102) | <0.0001 |
| BMI, kg/m2 | 26.5 (23.7-29.5) | 24.6 (22.8-26.4) | 30.4 (28.8-32.9) | <0.0001 |
| Diastolic blood pressure, mm Hg | 72 (67-78) | 70 (65-76) | 76 (71-80) | <0.0001 |
| Systolic blood pressure, mm Hg | 124 (111-138) | 118 (108-130) | 134 (123-146) | <0.0001 |
| Current smoker, no. (%) | 87 (27.9) | 65 (32.5) | 22 (19.6) | 0.064 |
| Type 2 diabetes, no. (%) | 43 (13.7) | 17 (8.5) | 16 (14.2) | 0.03 |
| FRS (%) § | 11.7 (6.1-23) | 9.1 (5.3-14.9) | 18.5 (11.7-30) | <0.0001 |
| SCORE2 (%) §§ | 4 (2.1-7.2) | 3.2 (1.9-5.8) | 5.75 (3.5-9) | <0.0001 |
| Biochemical | ||||
| Total-c mg/dl | 195 (167-221.9) | 196.8 (166.2-220.4) | 189.8 (167.6-224.4) | 0.97 |
| LDL-c mg/dl # | 131.7 (104-155.7) | 132.3 (106-154.2) | 123.7 (100.2-155.8) | 0.46 |
| HDL-c mg/dl | 38.2 (31.7-47.5) | 41.9 (35.5-50.8) | 32.4 (26.9-37.1) | <0.0001 |
| TG mg/dl | 114.2 (84.1-157.6) | 95.6 (69-123.1) | 162 (120.4-215.2) | <0.0001 |
| Plasma glucose, mg/dl | 85 (77-92) | 81.4 (76-88.6) | 90 (84.6-106.2) | <0.0001 |
| ALP, U/l | 44 (35-54) | 42 (34-52.5) | 47.5 (40-56.5) | 0.0008 |
| ALT, U/l | 6.5 (5-9) | 5.8 (5-8) | 7.9 (5.6-10.1) | <0.0001 |
| AST, U/l | 18 (15-23) | 18 (14-21) | 20 (16-26) | 0.0005 |
| GGT, U/l | 21 (14-35) | 16.5 (12.5-24.5) | 36 (24-54.5) | <0.0001 |
| FLI (%) §§§ | 41.3 (16.7-75.6) | 22.2 (10.9-39.5) | 82.3 (73.4-92.5) | <0.0001 |
| CK-18/M30, U/l | 176.9 (132.8-224.5) | 158.6 (121.2-204.6) | 210.6 (163.7-272.4) | <0.0001 |
| CK-18/M65, U/l | 173.1 (128.2-263.1) | 161.1 (115.5-234.6) | 220.4 (153.6-323.2) | <0.0001 |
Table 2.
Performance of FLI or CK-18 (M30 and M65, categorical or continuous value) in predicting high FRS in PREVEND participants.
Table 2.
Performance of FLI or CK-18 (M30 and M65, categorical or continuous value) in predicting high FRS in PREVEND participants.
| All PREVEND participants (n=312) | |||||||||
| Discriminant accuracy | Univariate analysis | Multivariate analysis | |||||||
| Predictor | AUC | 95% CI | P-value | R | 95% CI | P-value | R | 95% CI | P-value |
| M30 | 0.609 | 0.540-0.677 | 0.03 | 1.001 | 0.99-1.00 | 0.08 | 0.99 | 0.99-1.001 | 0.32 |
| FLI | 0.722 | 0.658-0.785 | <0.0001 | 1.03 | 1.01-1.03 | <0.0001 | 1.025 | 1.01-1.035 | <0.0001 |
| M65 | 0.608 | 0.540-0.677 | 0.03 | 1.003 | 1.001-1.004 | 0.001 | 1.002 | 0.99-1.004 | 0.05 |
| M30>200 | - | - | - | 2.01 | 1.22-3.32 | 0.005 | 1.10 | 0.61-2.00 | 0.73 |
| FLI | 0.722 | 0.658-0.785 | <0.0001 | 1.03 | 1.01-1.03 | <0.0001 | 1.026 | 1.016-1.035 | <0.0001 |
| M65>400 | - | - | - | 2.01 | 0.91-4.45 | 0.08 | 1.10 | 0.57-3.51 | 0.44 |
| FLI≥60 PREVEND participants (n=112) | |||||||||
| Discriminant accuracy | Univariate analysis | Multivariate analysis | |||||||
| Predictor | AUC | 95% CI | P-value | R | 95% CI | P-value | R | 95% CI | P-value |
| M30 | 0.572 | 0.466-0.679 | 0.187 | - | - | - | - | - | - |
| FLI | 0.678 | 0.580-0.777 | 0.001 | 1.06 | 1.023-1.010 | 0.001 | 1.06 | 1.020-1.100 | 0.002 |
| M65 | 0.615 | 0.511-0.719 | 0.036 | 1.002 | 1.000-1.004 | 0.03 | 1.001 | 0.999-1.004 | 0.06 |
| M30>200 | - | - | - | 0.52 | 0.246-1.135 | 0.102 | - | - | - |
| FLI | 0.678 | 0.580-0.777 | 0.001 | 1.06 | 1.023-1.010 | 0.001 | 1.062 | 1.023-1.102 | 0.001 |
| M65>400 | - | - | - | 1.58 | 0.545-0.46 | 0.39 | 1.46 | 0.48-4.47 | 0.49 |
| FLI<60 PREVEND participants (n=200) | |||||||||
| Discriminant accuracy | Univariate analysis | Multivariate analysis | |||||||
| Predictor | AUC | 95% CI | P-value | R | 95% CI | P-value | R | 95% CI | P-value |
| M30 | 0.543 | 0.447-0.639 | 0.416 | - | - | - | - | - | - |
| FLI | 0.618 | 0.520-0.716 | 0.025 | 1.024 | 1.003-1.045 | 0.02 | - | - | - |
| M65 | 0.532 | 0.434-0.630 | 0.546 | - | - | - | - | - | - |
| M30>200 | - | - | - | 1.109 | 0.506-2.43 | 0.79 | - | - | - |
| FLI | 0.618 | 0.520-0.716 | 0.025 | 1.024 | 1.003-1.045 | 0.02 | - | - | - |
| M65>400 | - | - | - | 1.50 | 0.388-0.587 | 0.55 | - | - | - |
AUC: area under the curve; OR: odds ratio; CI: confidence interval; CK: Cytokeratin; FLI: fatty liver index. (-): where AUC is non-signficant, logistic regression analysis was not performed and where univariate logistic regression is non-significant, in consequence the variable is not added in multivariate analysis. FLI is used as continuous variable. M30>200 and M65>400 means that variables are used as categorical predictor with the cutoff as specified in the methods section. In multivariate analysis, only FLI was included in the model considering M30 and M65 as continuous or categorical.
Table 3.
Performance of FLI or CK-18 (M30 and M65, categorical or continuous value) in predicting very-high CV risk according to SCORE2 in PREVEND participants.
Table 3.
Performance of FLI or CK-18 (M30 and M65, categorical or continuous value) in predicting very-high CV risk according to SCORE2 in PREVEND participants.
| All PREVEND participants (n=312) | ||||||||||
| Discriminant accuracy | Univariate analysis | Multivariate analysis | ||||||||
| Predictor | AUC | 95% CI | P-value | OR | 95% CI | P-value | OR | 95% CI | P-value | |
| M30 | 0.554 | 0.422-0.686 | 0.39 | - | - | - | - | - | - | |
| FLI | 0.637 | 0.518-0.756 | 0.029 | 1.015 | 1.001-1.029 | 0.035 | 1.009 | 0.99-1.024 | 0.21 | |
| M65 | 0.608 | 0.478-0.737 | 0.085 | 1.003 | 1.001-1.004 | 0.0006 | 1.002 | 1.00-1.004 | 0.005 | |
| M30>200 | - | - | - | 1.267 | 0.537-2.991 | 0.587 | - | - | - | |
| FLI | 0.637 | 0.518-0.756 | 0.029 | 1.015 | 1.001-1.029 | 0.035 | 1.012 | 0.991.027 | 0.08 | |
| M65>400 | - | - | - | 4.23 | 1.516-11.83 | 0.005 | 3.59 | 1.25-10.26 | 0.01 | |
| FLI≥60 PREVEND participants (n=112) | ||||||||||
| Discriminant accuracy | Univariate analysis | Multivariate analysis | ||||||||
| Predictor | AUC | 95% CI | P-value | OR | 95% CI | P-value | OR | 95% CI | P-value | |
| M30 | 0.587 | 0.384-0.790 | 0.384 | - | - | - | - | - | - | |
| FLI | 0.636 | 0.467-0.805 | 0.086 | 1.045 | 0.984-1.109 | 0.147 | 1.043 | 0.975-1.115 | 0.21 | |
| M65 | 0.714 | 0.524-0.904 | 0.016 | 1.003 | 1.001-1.005 | 0.001 | 1.003 | 1.001-1.005 | 0.002 | |
| M30>200 | - | - | - | 1.592 | 0.449-5.644 | 0.471 | - | - | - | |
| FLI | 0.636 | 0.467-0.805 | 0.086 | 1.045 | 0.984-1.109 | 0.147 | 1.042 | 0.98-1.108 | 0.18 | |
| M65>400 | - | - | - | 5.584 | 1.50-20.65 | 0.009 | 5.444 | 1.44-20.53 | 0.01 | |
| FLI<60 PREVEND participants (n=200) | ||||||||||
| Discriminant accuracy | Univariate analysis | Multivariate analysis | ||||||||
| Predictor | AUC | 95% CI | P-value | OR | 95% CI | P-value | OR | 95% CI | P-value | |
| M30 | 0.495 | 0.346-0.644 | 0.955 | - | - | - | - | - | - | |
| FLI | 0.568 | 0.424-0.712 | 0.448 | - | - | - | - | - | - | |
| M65 | 0.500 | 0.376-0.625 | 0.996 | - | - | - | - | - | - | |
| M30>200 | - | - | - | 0.555 | 0.116-2.655 | 0.461 | - | - | - | |
| M65>400 | - | - | - | 1.618 | 0.189-13.80 | 0.659 | - | - | - | |
SCORE: Systematic COronary Risk Evaluation; AUC: area under the curve; OR: odds ratio; CI: confidence interval; CK: Cytokeratin; FLI: fatty liver index. (-): where AUC is non-signficant, logistic regression analysis was not performed and where univariate logistic regression is non-significant in consequence the variable is not added in multivariate analysis. FLI is used as continuous variable. M30>200 and M65>400 means that variables are used as categorical predictor with the cutoff as specified in the methods section. In multivariate analysis, only FLI was included in the model considering M65, being M30 non-significant in the univariate analysis.
Table 4.
Spearman’s rank correlation between levels of CK18 (M30 and M65) and clinical characteristics of PREVEND participants.
Table 4.
Spearman’s rank correlation between levels of CK18 (M30 and M65) and clinical characteristics of PREVEND participants.
| All PREVEND participants (n=312) | ||||
| M30 | M65 | |||
| Variable | R | P | R | P |
| Age | 0.22 | <0.0001 | 0.26 | <0.0001 |
| Waist circumference | 0.33 | <0.0001 | 0.23 | <0.0001 |
| Weight | 0.22 | <0.0001 | 0.14 | 0.01 |
| BMI | 0.24 | <0.0001 | 0.14 | 0.008 |
| Diastolic blood pressure | 0.14 | 0.01 | 0.05 | 0.36 |
| Systolic blood pressure | 0.26 | <0.0001 | 0.19 | 0.0004 |
| Total -c | -0.10 | 0.06 | -0.11 | 0.04 |
| LDL-c | -0.14 | 0.01 | -0.12 | 0.02 |
| HDL-c | -0.17 | 0.002 | -0.14 | 0.01 |
| TG | 0.25 | <0.0001 | 0.16 | 0.003 |
| Plasma glucose | 0.27 | <0.0001 | 0.29 | <0.0001 |
| ALP | 0.18 | 0.001 | 0.14 | 0.01 |
| ALT | 0.21 | 0.0001 | 0.19 | 0.0004 |
| AST | 0.35 | <0.0001 | 0.36 | <0.0001 |
| GGT | 0.37 | <0.0001 | 0.36 | <0.0001 |
| FLI | 0.37 | <0.0001 | 0.27 | <0.0001 |
| FRS | 0.21 | 0.0001 | 0.19 | 0.0006 |
| SCORE2 | 0.20 | 0.0003 | 0.21 | 0.0001 |
| FLI≥60 PREVEND participants (n=112) | ||||
| M30 | M65 | |||
| Variable | R | P | R | P |
| Age | 0.13 | 0.15 | 0.25 | 0.006 |
| Waist circumference | -0.01 | 0.89 | -0.01 | 0.87 |
| Weight | -0.16 | 0.08 | -0.15 | 0.09 |
| BMI | -0.08 | 0.38 | -0.06 | 0.51 |
| Diastolic blood pressure | 0.07 | 0.43 | -0.1 | 0.26 |
| Systolic blood pressure | 0.23 | 0.01 | 0.19 | 0.03 |
| Total -c | -0.30 | 0.001 | -0.30 | 0.001 |
| LDL-c | -0.37 | <0.0001 | -0.30 | 0.001 |
| HDL-c | 0.03 | 0.74 | -0.01 | 0.83 |
| TG | 0.05 | 0.6 | -0.03 | 0.75 |
| Plasma glucose | 0.21 | 0.02 | 0.26 | 0.005 |
| ALP | 0.19 | 0.03 | 0.15 | 0.09 |
| ALT | 0.31 | 0.0008 | 0.27 | 0.003 |
| AST | 0.41 | <0.0001 | 0.51 | <0.0001 |
| GGT | 0.36 | <0.0001 | 0.31 | 0.0006 |
| FLI | 0.18 | 0.05 | 0.14 | 0.14 |
| FRS | 0.13 | 0.17 | 0.20 | 0.03 |
| SCORE2 | 0.11 | 0.24 | 0.18 | 0.05 |
| FLI<60 PREVEND participants (n=200) | ||||
| M30 | M65 | |||
| Variable | R | P | R | P |
| Age | 0.15 | 0.03 | 0.18 | 0.009 |
| Waist circumference | 0.16 | 0.01 | 0.07 | 0.30 |
| Weight | 0.09 | 0.18 | 0.06 | 0.37 |
| BMI | 0.03 | 0.66 | -0.04 | 0.57 |
| Diastolic blood pressure | 0.04 | 0.54 | 0.006 | 0.92 |
| Systolic blood pressure | 0.15 | 0.02 | 0.08 | 0.22 |
| Total -c | -0.002 | 0.97 | 0.001 | 0.98 |
| LDL-c | -0.009 | 0.89 | -0.005 | 0.94 |
| HDL-c | -0.04 | 0.50 | -0.01 | 0.88 |
| TG | 0.10 | 0.14 | 0.05 | 0.42 |
| Plasma glucose | 0.15 | 0.02 | 0.21 | 0.002 |
| ALP | 0.10 | 0.15 | 0.09 | 0.19 |
| ALT | 0.05 | 0.44 | 0.06 | 0.37 |
| AST | 0.24 | 0.0005 | 0.22 | 0.001 |
| GGT | 0.20 | 0.003 | 0.25 | 0.0003 |
| FLI | 0.19 | 0.004 | 0.11 | 0.09 |
| FRS | 0.1 | 0.15 | 0.08 | 0.23 |
| SCORE2 | 0.11 | 0.10 | 0.12 | 0.07 |
Abbreviations: Total-C: total cholesterol; LDL-C: low-density lipoprotein cholesterol; HDL-C: high-density lipoprotein cholesterol ; TG: triglycerides; BMI: body mass index; ALT: alanine transaminase; AST: aspartate transaminase; FLI: fatty liver index; ALP: alkaline phosphatase; GGT: gamma-glutamyl-transferase; FRS: Framingham risk score; SCORE: Systematic COronary Risk Evaluation.
Table 5.
Linear regression analysis using CK18 (M30 and M65) and FLI as independent variables for FRS or SCORE2 as dependent variables and using M30 and M65 as independent variables for FLI as dependent variable in PREVEND participants.
Table 5.
Linear regression analysis using CK18 (M30 and M65) and FLI as independent variables for FRS or SCORE2 as dependent variables and using M30 and M65 as independent variables for FLI as dependent variable in PREVEND participants.
| All PREVEND participants (n=312) | ||||
| Univariate analysis | Multivariate analysis | |||
| Variable | β (95% CI) | P-value | (95% CI) | P-value |
| FRS | ||||
| M30 | 0.27 | 0.0008 | -0.009 | 0.91 |
| M65 | 0.31 | 0.00012 | 0.14 | 0.08 |
| FLI | 0.41 | <0.0001 | 0.39 | <0.0001 |
| SCORE2 | ||||
| M30 | 0.27 | 0.0006 | 0.01 | 0.86 |
| M65 | 0.34 | <0.0001 | 0.20 | 0.02 |
| FLI | 0.33 | <0.0001 | 0.30 | <0.0001 |
| FLI | ||||
| M30 | 0.53 | <0.0001 | 0.41 | 0.0001 |
| M65 | 0.44 | <0.0001 | 0.23 | 0.03 |
| FLI≥60 PREVEND participants (n=112) | ||||
| Univariate analysis | Multivariate analysis | |||
| Variable | β (95% CI) | P-value | (95% CI) | P-value |
| FRS | ||||
| M30 | 0.09 | 0.43 | -0.09 | 0.54 |
| M65 | 0.19 | 0.05 | 0.20 | 0.12 |
| FLI | 1.2 | 0.003 | 1.15 | 0.007 |
| SCORE2 | ||||
| M30 | 0.09 | 0.48 | -0.20 | 0.20 |
| M65 | 0.28 | 0.01 | 0.37 | 0.01 |
| FLI | 0.98 | 0.03 | 0.81 | 0.08 |
| FLI | ||||
| M30 | 0.02 | 0.27 | 0.004 | 0.88 |
| M65 | 0.03 | 0.12 | 0.032 | 0.28 |
| FLI<60 PREVEND participants (n=200) | ||||
| Univariate analysis | Multivariate analysis | |||
| Variable | β (95% CI) | P-value | (95% CI) | P-value |
| FRS | ||||
| M30 | 0.13 | 0.17 | 0.01 | 0.91 |
| M65 | 0.14 | 0.19 | 0.09 | 0.41 |
| FLI | 0.37 | <0.0001 | 0.36 | <0.0001 |
| SCORE2 | ||||
| M30 | 0.20 | 0.04 | 0.10 | 0.43 |
| M65 | 0.20 | 0.06 | 0.11 | 0.24 |
| FLI | 0.31 | <0.0001 | 0.06 | <0.0001 |
| FLI | ||||
| M30 | 0.27 | 0.01 | 0.25 | 0.02 |
| M65 | 0.14 | 0.23 | 0.04 | 0.70 |
unstandardizedregression coefficient; CI, confidence interval; FRS, Framingham risk score; SCORE: Systematic COronary Risk Evaluation; FLI, fatty liver index. Because the no normal distribution of all considered variables, data were transformed in logarithmic value.
Disclaimer/Publisher’s Note: The statements, opinions and data contained in all publications are solely those of the individual author(s) and contributor(s) and not of MDPI and/or the editor(s). MDPI and/or the editor(s) disclaim responsibility for any injury to people or property resulting from any ideas, methods, instructions or products referred to in the content. |
© 2023 by the authors. Licensee MDPI, Basel, Switzerland. This article is an open access article distributed under the terms and conditions of the Creative Commons Attribution (CC BY) license (http://creativecommons.org/licenses/by/4.0/).
Copyright: This open access article is published under a Creative Commons CC BY 4.0 license, which permit the free download, distribution, and reuse, provided that the author and preprint are cited in any reuse.


