
Submitted:
15 June 2023
Posted:
16 June 2023
You are already at the latest version
Abstract
The concept of ecosystem services (ESs) provides a valuable approach to communicate societies' dependence on natural ecosystems, assisting in the evaluation of measures to protect vegetation in watersheds that promote water-related ESs. Vegetation cover and land use are important factors related to the capacity of ecosystems to provide soil loss regulation and sediment retention services, which are highly relevant for sediment management in watersheds draining into reservoirs with multiple water uses. This study aims to assess the relationship between potential changes in land use and land cover and the sediment retention service provided by riparian vegetation in a watershed draining into a hydroelectric reservoir in the Brazilian Cerrado. Sediment load was selected as a physical variable that affects different water uses in reservoirs, with these uses being dependent on the quality or quantity of stored water. Scenarios were analyzed to represent landscape reconfigurations from a baseline condition in order to account for the recovery of riparian vegetation by the agricultural sector, as foreseen in the Brazilian Forest Code. To map and quantify variations in annual sediment retention, the InVEST model was used, which allows estimating an integrated response of the drainage basin to large-scale land use changes over time and space. The results show that for the drainage basin of the Corumbá IV Hydroelectric Power Plant (HPP), the recovery of riparian areas occupied by annual crops has the potential to generate greater benefits to water use in the reservoir. In the studied catchment area, 14% of the total vegetation deficit in riparian areas is occupied by crops, while 86% is occupied by pastures. This highlights the buffering role of riparian vegetation as an effective practice for managing sediment flows originating from sheet erosion in agricultural landscapes. The methodology employed in this study allows for the quantification and mapping of the effects of soil and water conservation measures in river basins. This enables the prioritization of sectoral efforts for the restoration of native vegetation, considering the highest returns in benefits perceived by water users affected by sediment input in reservoirs. The study's results reinforce the importance of conserving vegetation in riparian areas and their surroundings for sediment retention, highlighting the role of these areas as assets in providing water-related ecosystem services.
Keywords:
Water-related ecosystem services
; Sediment retention
; Riparian vegetation
; Brazilian Forest Code
; Water management
; Water-Energy-Food nexus
1. Introduction
The concept of ecosystem services provides a valuable approach to communicate societies' dependence on natural ecosystems and serves as a support tool in implementing measures for environmental protection to minimize impacts on the capacity of ecosystems to provide social benefits [1,2].
The alteration of land cover and land use is one of the main factors determining the degradation of ecosystem properties and their capacity to provide ecosystem services [3].
Studies demonstrate the role of land use and land cover in the process of erosion [4,5] and the importance of preserved vegetation and riparian zones in promoting water-related ecosystem services, such as soil loss regulation and sediment retention [6,7,8,9,10].
These services are of great relevance for sediment management in watersheds where there is drainage into reservoirs with multiple water uses, as reducing sediment input brings benefits that can extend to different water user sectors and beyond the reservoir boundaries. Some of these benefits include flood control upstream of the reservoir, maintenance of water storage capacity in the reservoir, reduction of impacts on built structures (such as hydroelectric turbines and irrigation pumps), and improvement in water quality parameters [11,12].
The amount of sediment reaching the reservoirs is an indicator of soil erosion in the contributing watershed. A series of hydrological and environmental processes influence the degradation of soil structure, the transport of sediments into the drainage network, and subsequently, the sediment load at the outlet.
The magnitude of soil loss is related not only to natural factors such as climate and topography but also to the degree of degradation and alteration of the natural vegetation in the watershed [5] and the propensity for adopting soil conservation measures that reduce or mitigate erosion on rural properties [13]. In this sense, public policies and mechanisms that ensure the integrity of vegetation in environmentally sensitive areas of watersheds ultimately promote ecosystem services that benefit multiple water uses [10,14].
In Brazil, one way to ensure the protection and recovery of sensitive areas, thus promoting water-related ecosystem services, is the implementation of the Native Vegetation Protection Law, known as the Forest Code. This code designated legally protected Permanent Preservation Areas (APPs), such as riparian APPs, aiming to protect natural resources such as water and soil. The recovery and conservation of riparian vegetation promote important ecological functions for water regulation, such as buffering of matter and energy between terrestrial and aquatic systems [15,16].
Therefore, riparian vegetation acts as effective filters that retain sediments and nutrients originating from upstream areas, especially in landscapes draining agricultural areas [16,17,18,19], contributing to the regulation of sediment and nutrient input into rivers and water reservoirs [10,20].
The width of the riparian APPs established in the Forest Code for conservation purposes ranges from 30 to 500 meters from each bank, depending on the width of the river. However, for riparian vegetation recovery purposes, the width of the APPs is determined by the deforestation history and the size of the rural property, ranging from 5 to 15 meters regardless of the river width, and from 20 to 100 meters depending on the width of the river [21]. These provisions aim to ensure the protection and restoration of riparian zones to maintain their ecological functions and promote water-related ecosystem services.
According to Soares-filho et al [22], under the new Forest Code, Brazil has a deficit vegetation in riparian APPs of 4.8±1.8 million hectares (Mha), with an estimated 0.6±0.35 Mha of this being potentially occupied by crops, representing less than 1% of national agriculture, and the remaining area occupied by pastureland. The Cerrado biome has the largest deficit of riparian APPs (1.7 Mha), with the state of Goiás leading the deficit ranking for this biome (around 380 thousand hectares) [22], reflecting high deforestation rates caused by the expansion of the agricultural and energy sectors in the state [23].
Besides, this scenario has increased the magnitude of soil erosion in this region, as pointed out by Oliveira [24], resulting in an increased potential to adversely affect hydroelectric reservoirs and multiple water uses.
The adoption of an ecosystem approach in the analysis of vegetation protection policies allows for the simultaneous consideration of biophysical and socioeconomic components, which is particularly relevant in the case of water resources that depend on environmental characteristics of the landscape and the interrelationships in land and water management in the watershed [25,26].
Indeed, direct observations of watershed responses before and after the implementation of riparian vegetation buffers, while important for ex-post evaluation, can be expensive and limited to specific environmental conditions that hinder extrapolation to other sites [27]. Despite the limitations due to limited knowledge of sediment transport processes and data uncertainties [28], hydrological modeling can provide valuable information for assessing water-related ecosystem services, particularly through the analysis of spatial land management scenarios [26,27,29].
This work aims to assess the role of vegetation protection measures in promoting water-related ecosystem services that benefit multiple water uses in hydroelectric reservoirs, such as sediment retention. To analyze the benefits of conserved riparian vegetation areas and scenarios of riparian recovery, the Sediment Delivery Ratio (SDR) model from the InVEST 3.3.1 package was used to map and quantify variations in sediment export and sediment retention throughout the watershed upstream of Corumbá IV HPP, located in the Brazilian Cerrado.
The SDR model is a widely used tool that estimates the ratio of sediment delivered to a river network from a given landscape unit. By incorporating data on land use, soil characteristics, topography, and hydrological processes, the model can simulate the sediment delivery process and identify areas with higher or lower sediment yields. This information is crucial for assessing the impact of different land management scenarios, including the protection and restoration of riparian areas, on sediment retention in the watershed.
2. Materials and Methods
The proposed methodology aims to quantify the benefits of riparian vegetation recovery and conservation in relation to sediment retention in watersheds that drain multipurpose water reservoirs. The benefits of reducing sediment input (a proxy for sediment retention service) can have an impact on reducing sedimentation in different parts of the reservoir and on established quality standards for various water uses, such as recreation and human consumption.
Given that the effect of land use change on sediment export is dependent on the previous land use and land cover, as well as its spatial location in the landscape and associated environmental factors [30], scenarios are generated to represent possible landscape reconfigurations that can be compared to the conditions of the baseline scenario.
The focus of this study is on analyzing where (location of sub-watersheds draining into the reservoir) and which transitions in land use and land cover aimed at riparian vegetation recovery in riparian buffer zones have the greatest impact on reducing the annual sediment load to the reservoir. To quantify variations in annual sediment export, the InVEST model [31] was used, which allows for estimating an integrated response of the watershed based on large-scale characteristics and processes (temporal and spatial). Sediment export was chosen as the variable of interest because it is a physical parameter that affects water quality and storage capacity in reservoirs, and it is directly influenced by conservation and riparian vegetation recovery policies.
2.1. Study Area
The study area focused on the watershed of the Corumbá IV HPP reservoir, which covers approximately 7,010 km². The reservoir, with a surface area of 173 km², is located in the upper section of the Corumbá River in the state of Goiás (GO) and the Federal District (DF) of Brazil. The geographical coordinates of the reservoir are approximately 16° 19' 22'' S and 48° 11' 15'' W.
In addition to electricity generation (with an installed capacity of 129.6 MW), the project also aims to utilize the reservoir for multiple purposes, such as water supply, recreation, and tourism [32]. The main tributary sub-basins to the reservoir are Corumbá, Areias, Descoberto, Alagado, Antas, Cervo, and Pirapitinga-Sarandi (Figure 1).
The basin is located in a Köppen climate classification region, characterized as "Aw," which corresponds to a hot tropical climate with consistent temperatures throughout the year (monthly average temperature of 20°C) and a dry winter season [23].
The average annual precipitation is 1,650 mm, with marked seasonality between dry months (May to September) and wet months (October to April). The basin features slopes exceeding 10% in various sections, with the highest altitudes reaching around 1,400 m in the headwaters region of the Corumbá River [23].
Regarding erosion potential, the natural susceptibility (soil and slope) is compounded by the reduced preservation of vegetation cover and intense agricultural activity (which covers about 60% of the basin area). The study area, located within the Cerrado biome, has experienced the deforestation of over 70% of its natural vegetation by the year 2002, due to the expansion of large-scale agriculture and the emergence of major urban centers [23].
2.2. APPs recovery scenarios
Based on the land use map from 2011 of the State of Goiás and Distrito Federal (baseline scenario) (Figure 1), new maps were created incorporating the recovery of APPs in marginal strips along watercourses as provided by the Forestry Code. The methodology used by Soares-filho et al [22] was adopted for delimiting the APPs, where, due to the lack of information on river widths, a hypothetical width was associated with the drainage order adopted by the National Water Agency (ANA), the Brazilian regulatory body, in order to comply with the widths specified in the Forestry Code (Table 1).
From the drainage network map of the basin, buffers of 30 meters, 60 meters, and 90 meters width were generated for river riparian areas. Additionally, based on the land use map of the baseline scenario, a 90 meters buffer was generated for the riparian area surrounding the reservoir of the Corumbá IV HPP (according to the width specified in the environmental licensing of this project – 100 meters in rural basins).
In this study, the widths of the riparian areas were adjusted based on the resolution of the DEM raster (30 meters). After analyzing the land use situation within the APPs buffers, three vegetation recovery scenarios were generated: scenario 1) vegetation recovery in APPs occupied by Pasture, scenario 2) vegetation recovery in APPs occupied by Agriculture, and scenario 3) vegetation recovery in APPs occupied by Agriculture or Pasture. Lastly, the land uses within the APPs were reclassified, and new management parameters and land cover (C and P factors) were associated with them. The remaining land uses in the basin were not altered. The generation of maps and analyses was conducted using ArcGIS 10.2 software.
2.3. Modeling sediment retention service
The Sediment Delivery Ratio model from InVEST [31] was used, which allows assessing ecosystem services provided by vegetated riparian zones, such as the service of regulating soil loss and the service of retaining sediments from sheet erosion.
The model uses georeferenced datasets, which allows mapping and quantifying soil loss from sheet erosion and the annual export of sediments at a point of interest. For each pixel, the model's algorithm first calculates the potential soil loss using the Revised Universal Soil Loss Equation (RUSLE) (Eq 1). This potential soil loss is then adjusted by management factors, land cover, and conservation practices (factors C and P) to obtain the expected soil loss (t/ha/year).
The equation (Eq. 1) is as follows:
Where:
uslei = (R · K · LS · C · P)i
- uslei is the soil loss potential (t/ha/year) at pixel i;
- R is the rainfall erosivity (MJ.mm/ha.hr);
- K is the soil erodibility factor (t.ha.hr/MJ.ha.mm);
- LS is the topographic factor, which is a function of the slope of pixel i;
- C and P represent the land use and land cover factors, as well as any management factors applied.
This equation combines these factors to estimate the potential soil loss at a given pixel based on the erosivity of rainfall, the erodibility of the soil, the topographic characteristics, and the land use and management practices.
The proportion of expected soil loss that actually reaches the watercourse is determined by a sediment delivery ratio (SDR), which is a function of the hydrological connectivity of the landscape [33]. Hydrological connectivity refers to the transfer of sediment from a source to a sink and is a key factor in determining how the spatial configuration of the landscape influences sediment retention. The model calculates the connectivity index (CI), which determines the degree of hydrological connectivity from a pixel to the watercourse based on its contributing area and the flow path to the drainage network, following the methodology proposed by [34]. The sediment delivery ratio is then derived from this index (Eq. 2):
Where:
SDRi = SDRmax / (1 + exp(IC0 - Ici/kb))
- SDRmax represents the theoretical maximum value of the sediment delivery ratio (SDR), which is the maximum proportion of fine sediments that can reach the drainage network. In the absence of detailed soil information, a default value of 0.8 is commonly used [33];
- IC0 and kb are calibration parameters of the model used in the equation to calculate the sediment delivery rate (SDR). IC0 is the initial value of the hydrological connectivity index (IC), and kb is an adjustment factor in the equation. These parameters are calibrated according to the specific characteristics of the studied landscape.
The sediment yield of a specific pixel i, sed_exporti (ton/ha.year), is a direct function of the soil loss and the SDR factor (Eq. 3):
Sed_exporti = uslei × SDRi
Finally, the total sediment yield in the drainage basin, originating from sheet erosion, is calculated as the sum of the sediment production of all pixels. Table 2, Table 3 and Table 4 present the data used as input for the model and their sources. The parameters used in this study were obtained from the literature with values specific to the study region, whenever possible (Table 3 and Table 4).
The model was calibrated to minimize the difference between the sediment production estimated by the model in the baseline and the average presented by the studies of [46] (0.8 t/ha/year) - based on measurements at sediment monitoring stations in the region - and [32] (1.8 t/ha/year) - based on pre-filling measurement campaigns at the reservoir. The calibration resulted in the modification of the calibration parameter Kb (1.7), following the guidance of the SDR model guide [31].
2.4. Estimating the Benefits of Sediment Retention by APPs
The variation in sediment export in the analyzed sub-basins was quantified as the change in sediment export after the restoration of Permanent Preservation Areas (APPs) compared to the estimated sediment export in the baseline. However, these results only reflect the impacts of changes related to the restoration of APP deficits and do not consider the benefits gained from the conservation of APPs (environmental assets), which is an important consideration for determining the value of existing native vegetation and the benefits of avoiding degradation of these areas. To analyze the benefits of avoiding degradation of the conserved APPs, a set of land use and land cover maps was created based on the methodology proposed by [47]. In these new maps, the deficits of APPs are restored according to the recovery scenarios, but the APPs designated as "conserved" in the baseline (APPs with native vegetation) are altered (converted into altered vegetation). The benefit is then calculated as the benefit of restoration (Eq. 3) and the benefit of conservation (Eq. 4) of the APPs, both relative to the baseline, for each sub-basin contributing to the Corumbá IV HPP reservoir.
Where:
BR= ((Yc;j-Yb;j))/(Yb;j)×100
BC= ((Yc;j-Ya;j))/(Yb;j)×100
- BR is the benefit of restoring the APPs;
- BC is the benefit of conserving the APPs with native vegetation in the baseline;
- Y is the estimated annual sediment export (t/year) for the sub-basin (j) in the following scenarios: restoration of APPs and maintenance of conserved APPs (c); restoration of APPs with conserved APPs converted into altered vegetation (a); and in the baseline (b).
The sub-basins draining into the reservoir were delineated using ArcGIS 10.2 software, considering level 6 for the Ottobacias of the ANA’s coded hydrographic base. The estimated values for each sub-basin were derived from the modeling results using the Zonal Statistics Tool in ArcGIS.
3. Results
We split this section in subheadings to provide a concise and precise description of the experimental results, their interpretation, as well as the experimental conclusions that can be drawn.
3.1. Land use in sub-basins and in APPs
Table 5 presents the land use and land cover classes in the sub-basins contributing to the Corumbá IV HPP and also in the buffers that delimit the APPs mapped in this study for the baseline scenario. Pasture is the predominant class in the Corumbá IV HPP drainage basin (49%), followed by Cerrado vegetation (27%) and annual agriculture (14%). The sub-basin with the highest proportion of preserved native vegetation is Alagado (39%), while the lowest is Antas (18%). This configuration is a reflection of the strong expansion of the agricultural sector in this region of Brazil in the 2000s, where the majority of the analyzed sub-basins have over 50% of their areas occupied by agriculture, reaching 72% and 74% in the Antas and Corumbá sub-basins, respectively. Regarding the riparian APPs mapped in this study, they occupy 74 thousand hectares of the total area of the Corumbá IV HPP basin, representing approximately 10% of the basin. About 40% (30 thousand ha) of the APPs in the Corumbá IV HPP basin are conserved (Cerrado vegetation class), and 55% (41 thousand ha) have a deficit of vegetation, meaning that instead of preserved native vegetation, these areas are occupied by agricultural crops (approximately 6 thousand ha) or pasture (approximately 35 thousand ha). It is important to note that, to meet the objectives of this study, areas occupied by pasture were considered as a deficit of APP, in addition to areas occupied by agriculture, while areas occupied by urban land use were not considered as a deficit of APP.
3.2. Benefits of APPs recovery and conservation
The modeling results indicate that the provision of sediment retention services varies across sub-basins due to the different land uses, the proportion of vegetated APPs, and the transitions between land cover scenarios (Figure 2 and Figure 3). The reduction in sediment export resulting from vegetation recovery in the drainage basin of the reservoir ranges from -9% to -27% in scenarios 1, 2, and 3, respectively (Figure 2). The contribution of conserved APPs to sediment export in the drainage basin remains relatively constant at around -3% across all scenarios, as the extent and location of protected APPs remain unchanged.
In terms of sediment retention at the sub-basin level, scenario 3 exhibits the largest variations for all sub-basins. This is expected since scenario 3 combines the APP recovery deficits from scenarios 1 and 2. When comparing scenarios 1 and 2, despite having smaller deficits of vegetation to recover, the largest benefits are observed in the recovery of APPs occupied by agricultural crops in scenario 2, except for the Corumbá and Areias sub-basins. The recovery of riparian vegetation in areas draining agricultural landscapes can contribute to a reduction of approximately 30% in sediment input to the reservoir, considering the baseline sediment export from the respective sub-basin. The proportion of sediment retention benefits attributed to the conservation of native vegetation ranges from -2% to -6% across sub-basins, with the Antas and Alagado sub-basins having the lowest and highest percentages, respectively (Figure 3).
The difference in the effects of APP conservation compared to recovery can be explained by the fact that the conserved areas identified in this study are predominantly located within remnants of cerrado vegetation. This influences the hydrological connectivity simulated by the model, as the surrounding cerrado vegetation plays a significant role in reducing soil erosion and retaining sediment loads from upstream areas.
4. Discussion and Conclusions
In this study, the benefits of riparian vegetation conservation and recovery were analyzed in terms of sediment retention in the drainage area of a multi-purpose water reservoir. The SDR InVEST model was calibrated to provide estimates of annual sediment loads to the reservoir under different land use and land cover scenarios in riparian buffer zones (APPs). The model captures the integrated response of the watershed to land use changes, considering the interaction among environmental factors that vary across the landscape. The variations in sediment input to the reservoir are greatly influenced by the land cover and land use in converted areas, as well as the availability of land for changes. Therefore, data that closely represent the local reality and align with the management goals of the watershed lead to better estimates of the provision of the water-related ES.
The results of the study demonstrate that the adoption of soil and water conservation measures, such as the Forest Code, has the potential to have a positive impact in landscapes with high sediment exportation. The recovery and conservation of vegetation in riparian areas have a proportionally greater effect in areas with high hydrological connectivity, such as areas with high sediment contribution upstream and where the sediment flow path to the drainage network has low sediment retention, such as agricultural areas. The recovery of deficits in riparian areas occupied by annual crops has a higher potential to generate benefits for water uses in the reservoir. This is because, out of the total deficit of vegetation in riparian areas in the drainage area of Corumbá IV HPP, 14% is occupied by crops and 86% by pasture. This result reinforces the buffering function of riparian vegetation as an effective practice for managing sediment flows originating from sheet erosion in landscapes draining agricultural areas.
It is important to highlight that the difference between the conservation and recovery of riparian areas in providing the sediment retention service, quantified in this study, can be explained by the effect of remnants of cerrado vegetation surrounding the conserved APPs. This will have an impact on reducing the hydrological connectivity computed by the model and, consequently, on the amount of sediment transported throughout this portion of the landscape.
The methodology adopted in this study allows for quantifying and mapping the effects of soil and water conservation measures in watersheds, enabling the prioritization of sectoral efforts for the recovery of native vegetation while considering higher returns in benefits perceived by water users affected by sediment input in reservoirs. Furthermore, the study's results reinforce the importance of conserving vegetation in APPs and their surroundings for providing sediment retention, highlighting the role of these areas as assets in the provision of water-related ecosystem services.
Author Contributions
Conceptualization, methodology, and software, Natália Pezzy Fachinelli; writing—original draft preparation, Natália Pezzy Fachinelli; writing—review and editing, Amaro Olimpio Pereira Jr; supervision, Amaro Olimpio Pereira Jr. All authors have read and agreed to the published version of the manuscript.
Funding
This research received no external funding.
Data Availability Statement
All data are given in the form of Tables and Figures.
Conflicts of Interest
The authors declare no conflict of interest.
References
- Gómez-Baggethun E, de Groot R, Lomas PL, Montes C. 2010 The history of ecosystem services in economic theory and practice: From early notions to markets and payment schemes. Ecol. Econ. 69, 1209–1218. [CrossRef]
- Haines-Young, Roy; Potschin M. 2010 Common International Classification of Ecosystem Goods and Services ( CICES ): Consultation on Version 4, August-December 2012. EEA Framework Contract No EEA/IEA/09/003. Contract , 30. [CrossRef]
- Fisher B, Turner KR. 2008 Ecosystem services: Classification for valuation. Biol. Conserv. 141, 1167–1169. [CrossRef]
- Wischmeier W, Smith DD, Wischmer WH, Smith DD. 1978 Predicting rainfall erosion losses: a guide to conservation planning. U.S. Dep. Agric. Handb. No. 537 , 1–69. [CrossRef]
- Walling DE. 1999 Linking land use, erosion and sediment yields in river basins. Hydrobiologia 410, 223–240. [CrossRef]
- Lowrance R et al. 1997 Water quality functions of riparian forest buffers in Chesapeake bay watersheds. Environ. Manage. 21, 687–712. [CrossRef]
- UNESCO. 2017 Forest Management and the impact on water resources: a review of 13 countries. Paris: United Nations Educational, Scientific and Cultural Organization.
- Restrepo JD, Kettner AJ, Syvitski JPM. 2015 Recent deforestation causes rapid increase in river sediment load in the Colombian Andes. Anthropocene 10, 13–28. [CrossRef]
- Maeda EE, Formaggio AR, Shimabukuro YE. 2008 Impacts of land use and land cover changes on sediment yield in a Brazilian amazon drainage basin. GIScience Remote Sens. 45. [CrossRef]
- Ditt EH, Mourato S, Ghazoul J, Knight J. 2010 Forest Conversion and Provision of Ecosystem Services in the Brazilian Atlantic Forest. L. Degrad. Dev. 21, 591–603. [CrossRef]
- CARVALHO NO, FILIZOLA JÚNIOR, N.P. SANTOS PMC, LIMA JEFW. 2000 Guia de avaliação de assoreamento de reservatórios.
- IRTCES. 2011 Sediment Issues & Sediment Management in Large River Basins Interim Case Study Synthesis Report.
- Mekonnen M, Keesstra SD, Stroosnijder L, Baartman JEM, Maroulis J. 2014 Soil conservation through sediment trapping: A review. L. Degrad. Dev. 556, 544–556. [CrossRef]
- Grizzetti B, Lanzanova D, Liquete C, Reynaud A, Cardoso AC. 2016 Assessing water ecosystem services for water resource management. Environ. Sci. Policy 61, 194–203. [CrossRef]
- Lowrance R, Sharpe JK, Sheridan JM. 1986 Long-term sediment deposition in the riparian zone of a coastal plain watershed. J. Soil Water Conserv. 41, 266–271.
- Santos DS dos, Sparovek G. 2011 Retenção de sedimentos removidos de área de lavoura pela mata ciliar, em Goiatuba (GO). Rev. Bras. Ciência do Solo 35, 1811–1818. [CrossRef]
- Yuan Y, Bingner RL, Locke MA. 2009 A review of effectiveness of vegetative buffers on sediment trapping in agricultural areas. Ecohydrology 2, 321–336. [CrossRef]
- Tomer MD et al. 2014 A decade of conservation effects assessment research by the USDA Agricultural Research Service: Progress overview and future outlook. J. Soil Water Conserv. 69, 365–373. [CrossRef]
- Souza ALT de, Fonseca DG, Libório RA, Tanaka MO. 2013 Influence of riparian vegetation and forest structure on the water quality of rural low-order streams in SE Brazil. For. Ecol. Manage. 298, 12–18. [CrossRef]
- Chang CL, Hsu TH, Wang YJ, Lin JY, Yu SL. 2010 Planning for implementation of riparian buffers in the Feitsui reservoir watershed. Water Resour. Manag. 24, 2339–2352. [CrossRef]
- Brasil. 2012 Lei n° 12.651, de 25 de maio de 2012. Diário Of. da União , 1–32.
- Soares-filho B, Rajão R, Macedo M, Carneiro A, Costa W, Coe M, Rodrigues H, Alencar A. 2014 Cracking Brazil’s Forest Code. Science (80-. ). 344, 363–364. [CrossRef]
- Agência Nacional de Águas. 2013 Plano de recursos hídricos e do enquadramento dos corpos hídricos superficiais da bacia hidrográfica do rio Paranaíba.
- Oliveira PTS, Nearing MA, Wendland E. 2015 Orders of magnitude increase in soil erosion associated with land use change from native to cultivated vegetation in a Brazilian savannah environment. Earth Surf. Process. Landforms 40, 1524–1532. [CrossRef]
- Falkenmark M. 2003 Freshwater as shared between society and ecosystems: from divided approaches to integrated challenges. Philos. Trans. R. Soc. B Biol. Sci. 358, 2037–2049. [CrossRef]
- Karabulut A et al. 2016 Mapping water provisioning services to support the ecosystem–water–food–energy nexus in the Danube river basin. Ecosyst. Serv. 17, 278–292. [CrossRef]
- Vigiak O, Malagó A, Bouraoui F, Grizzetti B, Weissteiner CJ, Pastori M. 2016 Impact of current riparian land on sediment retention in the Danube River Basin. Sustain. Water Qual. Ecol. 8, 30–49. [CrossRef]
- Hamel P, Chaplin-Kramer R, Sim S, Mueller C. 2015 A new approach to modeling the sediment retention service (InVEST 3.0): Case study of the Cape Fear catchment, North Carolina, USA. Sci. Total Environ. 524, 166–177. [CrossRef]
- Maes J et al. 2012 Mapping ecosystem services for policy support and decision making in the European Union. Ecosyst. Serv. 1, 31–39. [CrossRef]
- Chaplin-Kramer R, Hamel P, Sharp R, Kowal V, Wolny S, Sim S, Mueller C. 2016 Landscape configuration is the primary driver of impacts on water quality associated with agricultural expansion. Environ. Res. Lett. 11, 074012. [CrossRef]
- 201Sharp R et al. 2016 InVEST 3.3.1 User’s Guide.
- Concessões, C. 2011 PLANO AMBIENTAL DE CONSERVAÇÃO E USO DO ENTORNO DO RESERVATÓRIO DA UHE CORUMBÁ IV.
- Vigiak O, Borselli L, Newham LTH, McInnes J, Roberts AM. 2012 Comparison of conceptual landscape metrics to define hillslope-scale sediment delivery ratio. Geomorphology 138, 74–88. [CrossRef]
- Borselli L, Cassi P, Torri D. 2008 Prolegomena to sediment and flow connectivity in the landscape: A GIS and field numerical assessment. Catena 75, 268–277. [CrossRef]
- SICAM/SEMARH/SEAGRO. In press. Macro ZAEE. Zoneamento Agroecológico e Econômico do Estado de Goiás. Mapa das Macrozonas Ecológico e Econômicas do Estado Goiás.
- Agência Nacional de Águas. 2015 BASE HIDROGRÁFICA OTTOCODIFICADA DA BACIA DO RIO PARANAÍBA. See http://metadados.ana.gov.br.
- Valeriano MM, Rossetti DF, Albuquerque PC. 2009 TOPODATA: desenvolvimento da primeira versão do banco de dados geomorfométricos locais em cobertura nacional. bibdigital.sid.inpe.br , 5499–5506.
- Valeriano MM. 2005 Modelo digital de variáveis morfométricas com dados SRTM para o território nacional: o projeto TOPODATA. Simpósio Bras. Sensoriamento Remoto , 3595–3602. ISBN 85-17-00018-8.
- Galdino S. 2015 Distribuição espacial da erosividade da chuva no Estado de Goiás e no Distrito Federal. Bol. Pesqui. e Desenvolv. , 19. (doi:1806-3322).
- Agência Nacional de Águas. 2012 Manual Operativo do Programa Produtor de Água.
- Silva VC Da. 2004 Estimativa da erosão atual da bacia do Rio Paracatu (MG/GO/DF). Pesqui. Agropecuária Trop. 34, 147–159.
- Farinasso M, Júnior OA de C, Guimarãe RF, Gomes RAT, Ramos VM. 2006 Avaliação Qualitativa do Potencial de Erosão Laminar em Grandes Áreas por Meio da EUPS Equação Universal de Perdas de Solos Utilizando Novas Metodologias em SIG para os Cálculos dos seus Fatores na Região do Alto Parnaíba PI-MA. Rev. Bras. Geomorfogia 7, 73–85.
- BERTONI J, LOMBARDI NETO F. 2017 Conservação do Solo. 10th ed. São Paulo, Brazil: Ícone Editora.
- Gurgel RS, Júnior O de C, Gomes RAT, Guimarães RF, Câmara JFA, Sobrinho DA, Martins É deSouza, Braga ARS. 2011 Identificação das áreas vulneráveis à erosão a partir do emprego da EUPS – equação universal de perdas de solos no município de Riachão das Neves – BA. Geogr. Ensino Pesqui. 15, 93–112.
- Chaves HML, Piau LP. 2008 Efeito da variabilidade da precipitação pluvial e do uso e manejo do solo sobre o escoamento superficial e o aporte de sedimento de uma bacia hidrográfica do Distrito Federal. Rev. Bras. Ciência do Solo 32, 333–343. [CrossRef]
- Empresa de Pesquisa Energética (EPE). 2006 AVALIAÇÃO AMBIENTAL INTEGRADA (AAI) DOS APROVEITAMENTOS HIDROELÉTRICOS DA BACIA HIDROGRÁFICA DO RIO PARANAÍBA - CARACTERIZAÇÃO DA BACIA.
- Vogl AL, Dennedy-Frank PJ, Wolny S, Johnson JA, Hamel P, Narain U, Vaidya A. 2016 Managing forest ecosystem services for hydropower production. Environ. Sci. Policy 61, 221–229. [CrossRef]
Figure 1.
Land use and land cover map in the drainage basin of the Corumbá IV HPP. WTP_Corumbá: Water treatment plant of the Corumbá IV System (under construction).
Figure 1.
Land use and land cover map in the drainage basin of the Corumbá IV HPP. WTP_Corumbá: Water treatment plant of the Corumbá IV System (under construction).
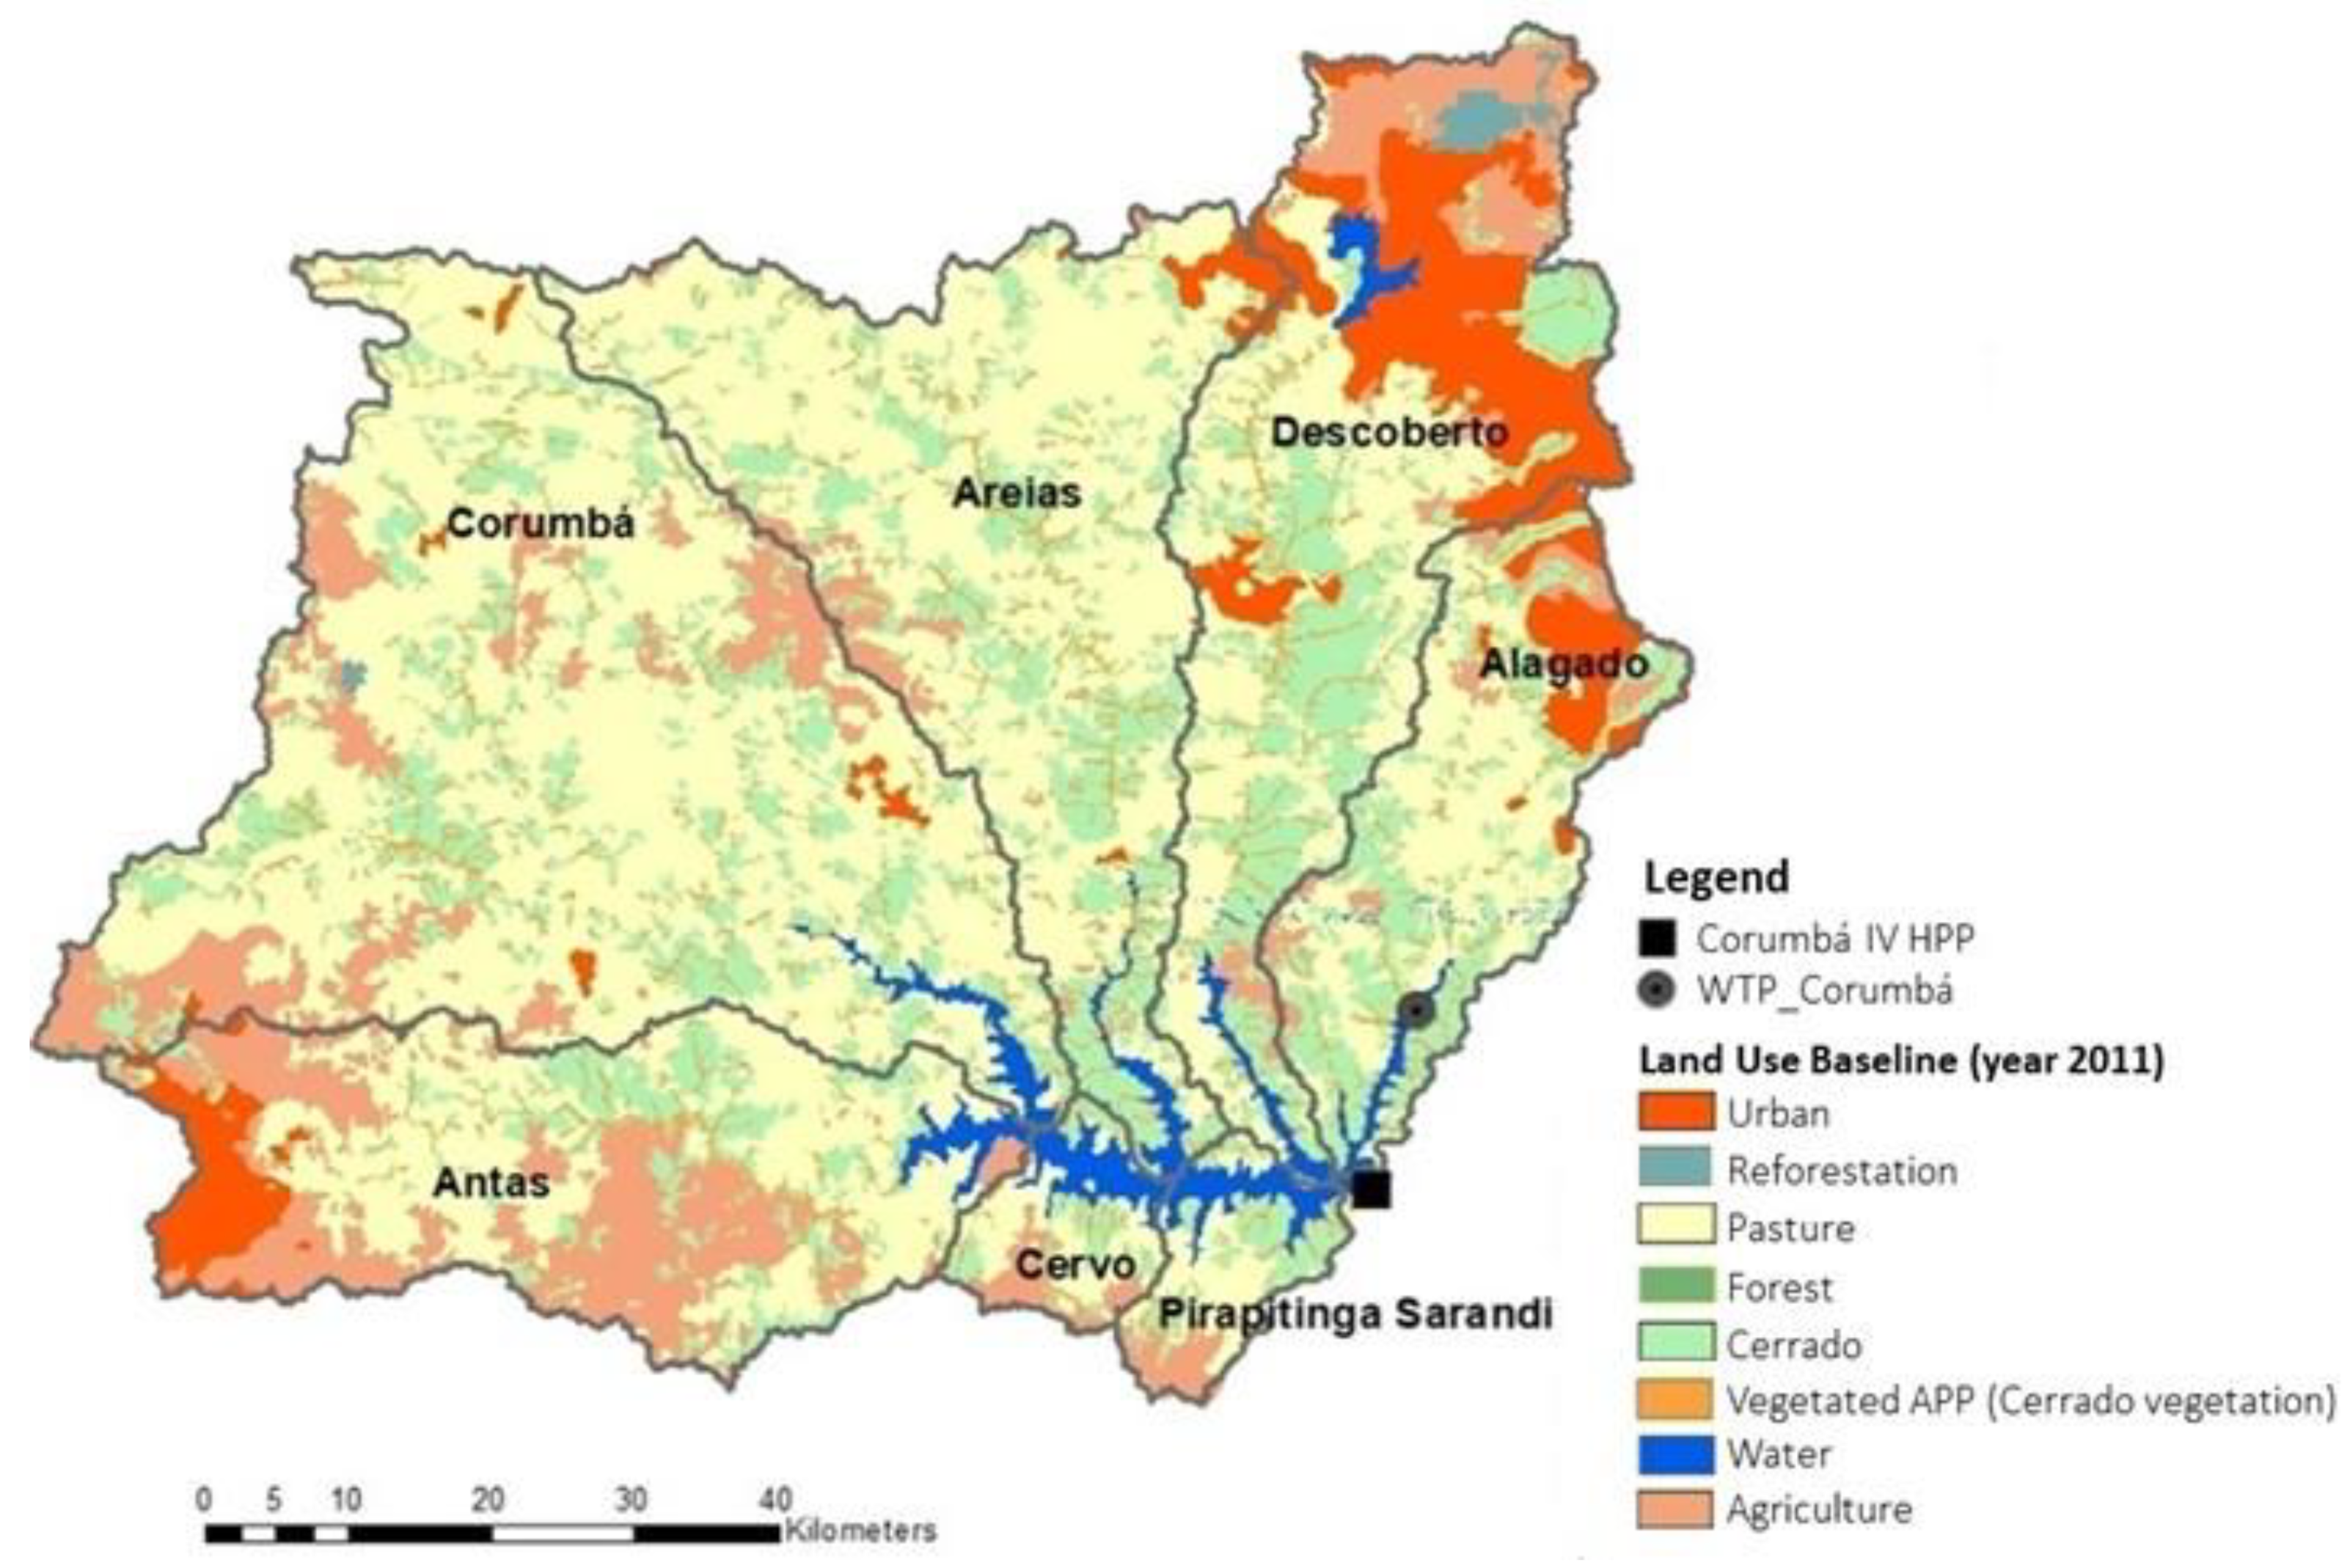
Figure 2.
Percentage variation in average annual sediment export compared to the baseline, calculated by the SDR InVEST model, for each hydrographic sub-basin in scenario 1 (a), scenario 2 (b), and scenario 3 (c). These results represent the benefits (BR) of APP recovery, as calculated in Eq. (4). Note that the x-axis values are different among the graphs.
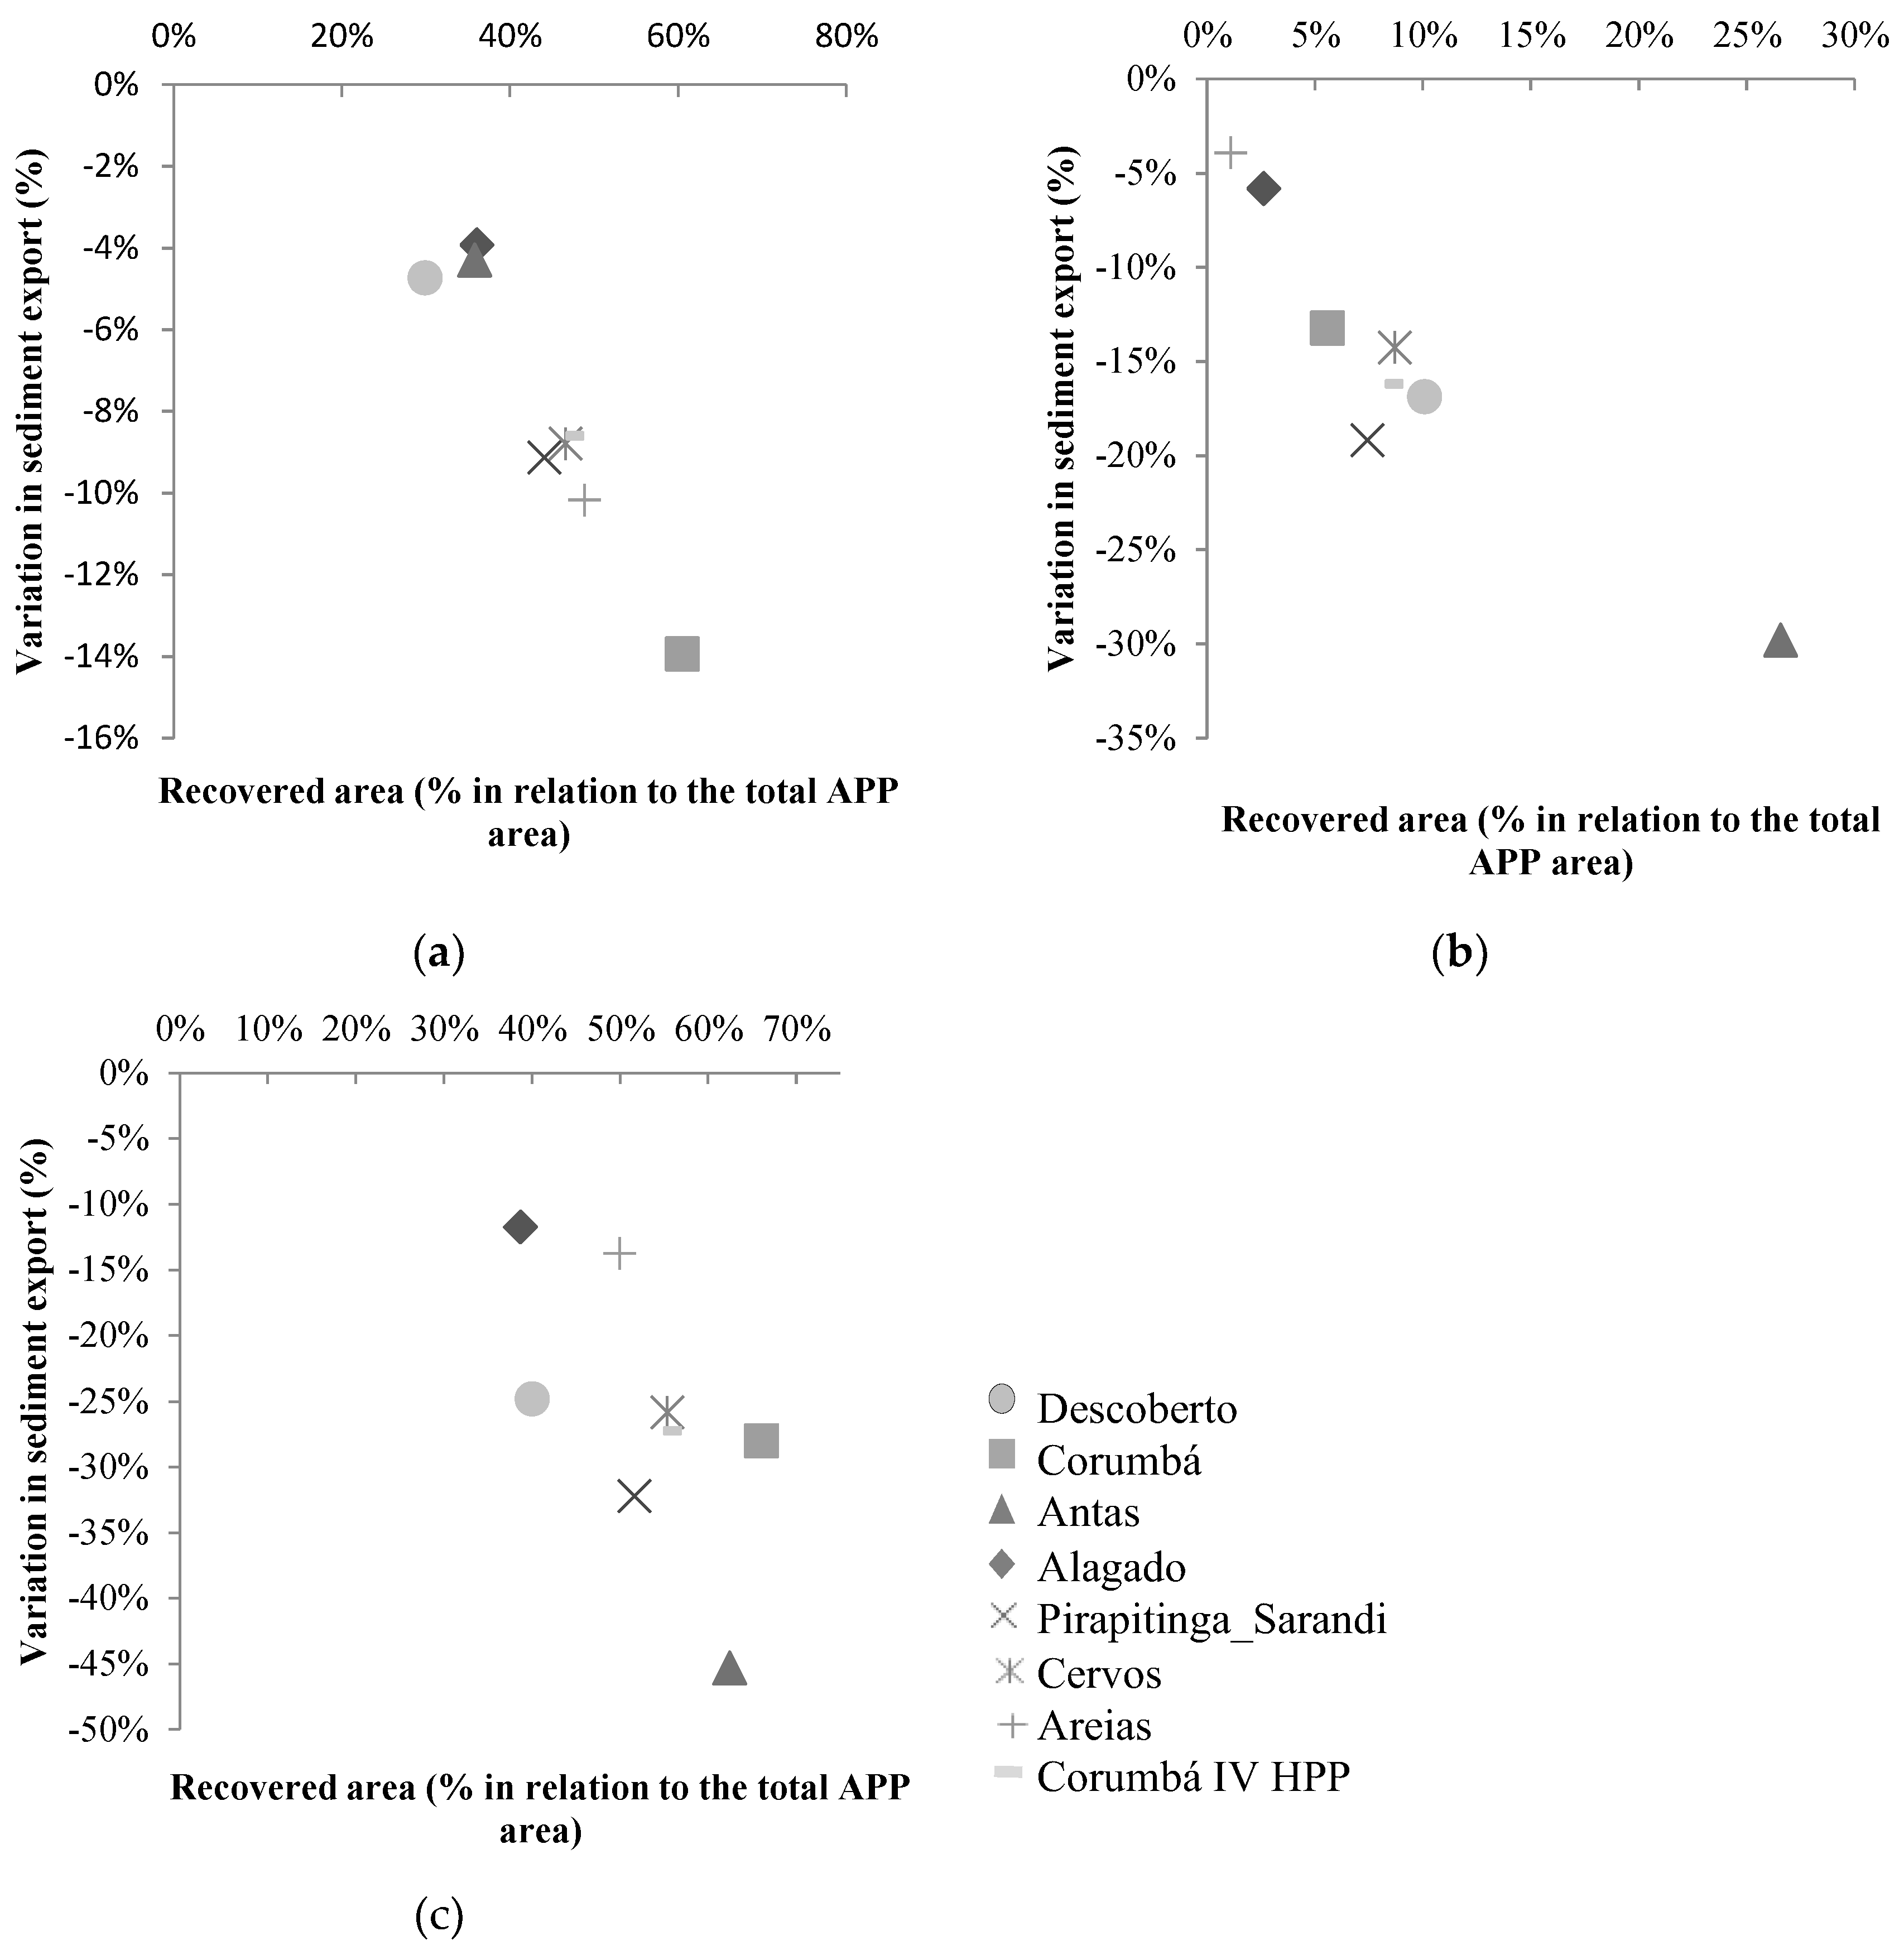
Figure 3.
Percentage variation in average annual sediment export compared to the baseline, calculated by the SDR InVEST model, for each hydrographic sub-basin in conservation scenarios. These results represent the benefits (BC) of APP conservation, as calculated in Eq. (5).
Figure 3.
Percentage variation in average annual sediment export compared to the baseline, calculated by the SDR InVEST model, for each hydrographic sub-basin in conservation scenarios. These results represent the benefits (BC) of APP conservation, as calculated in Eq. (5).
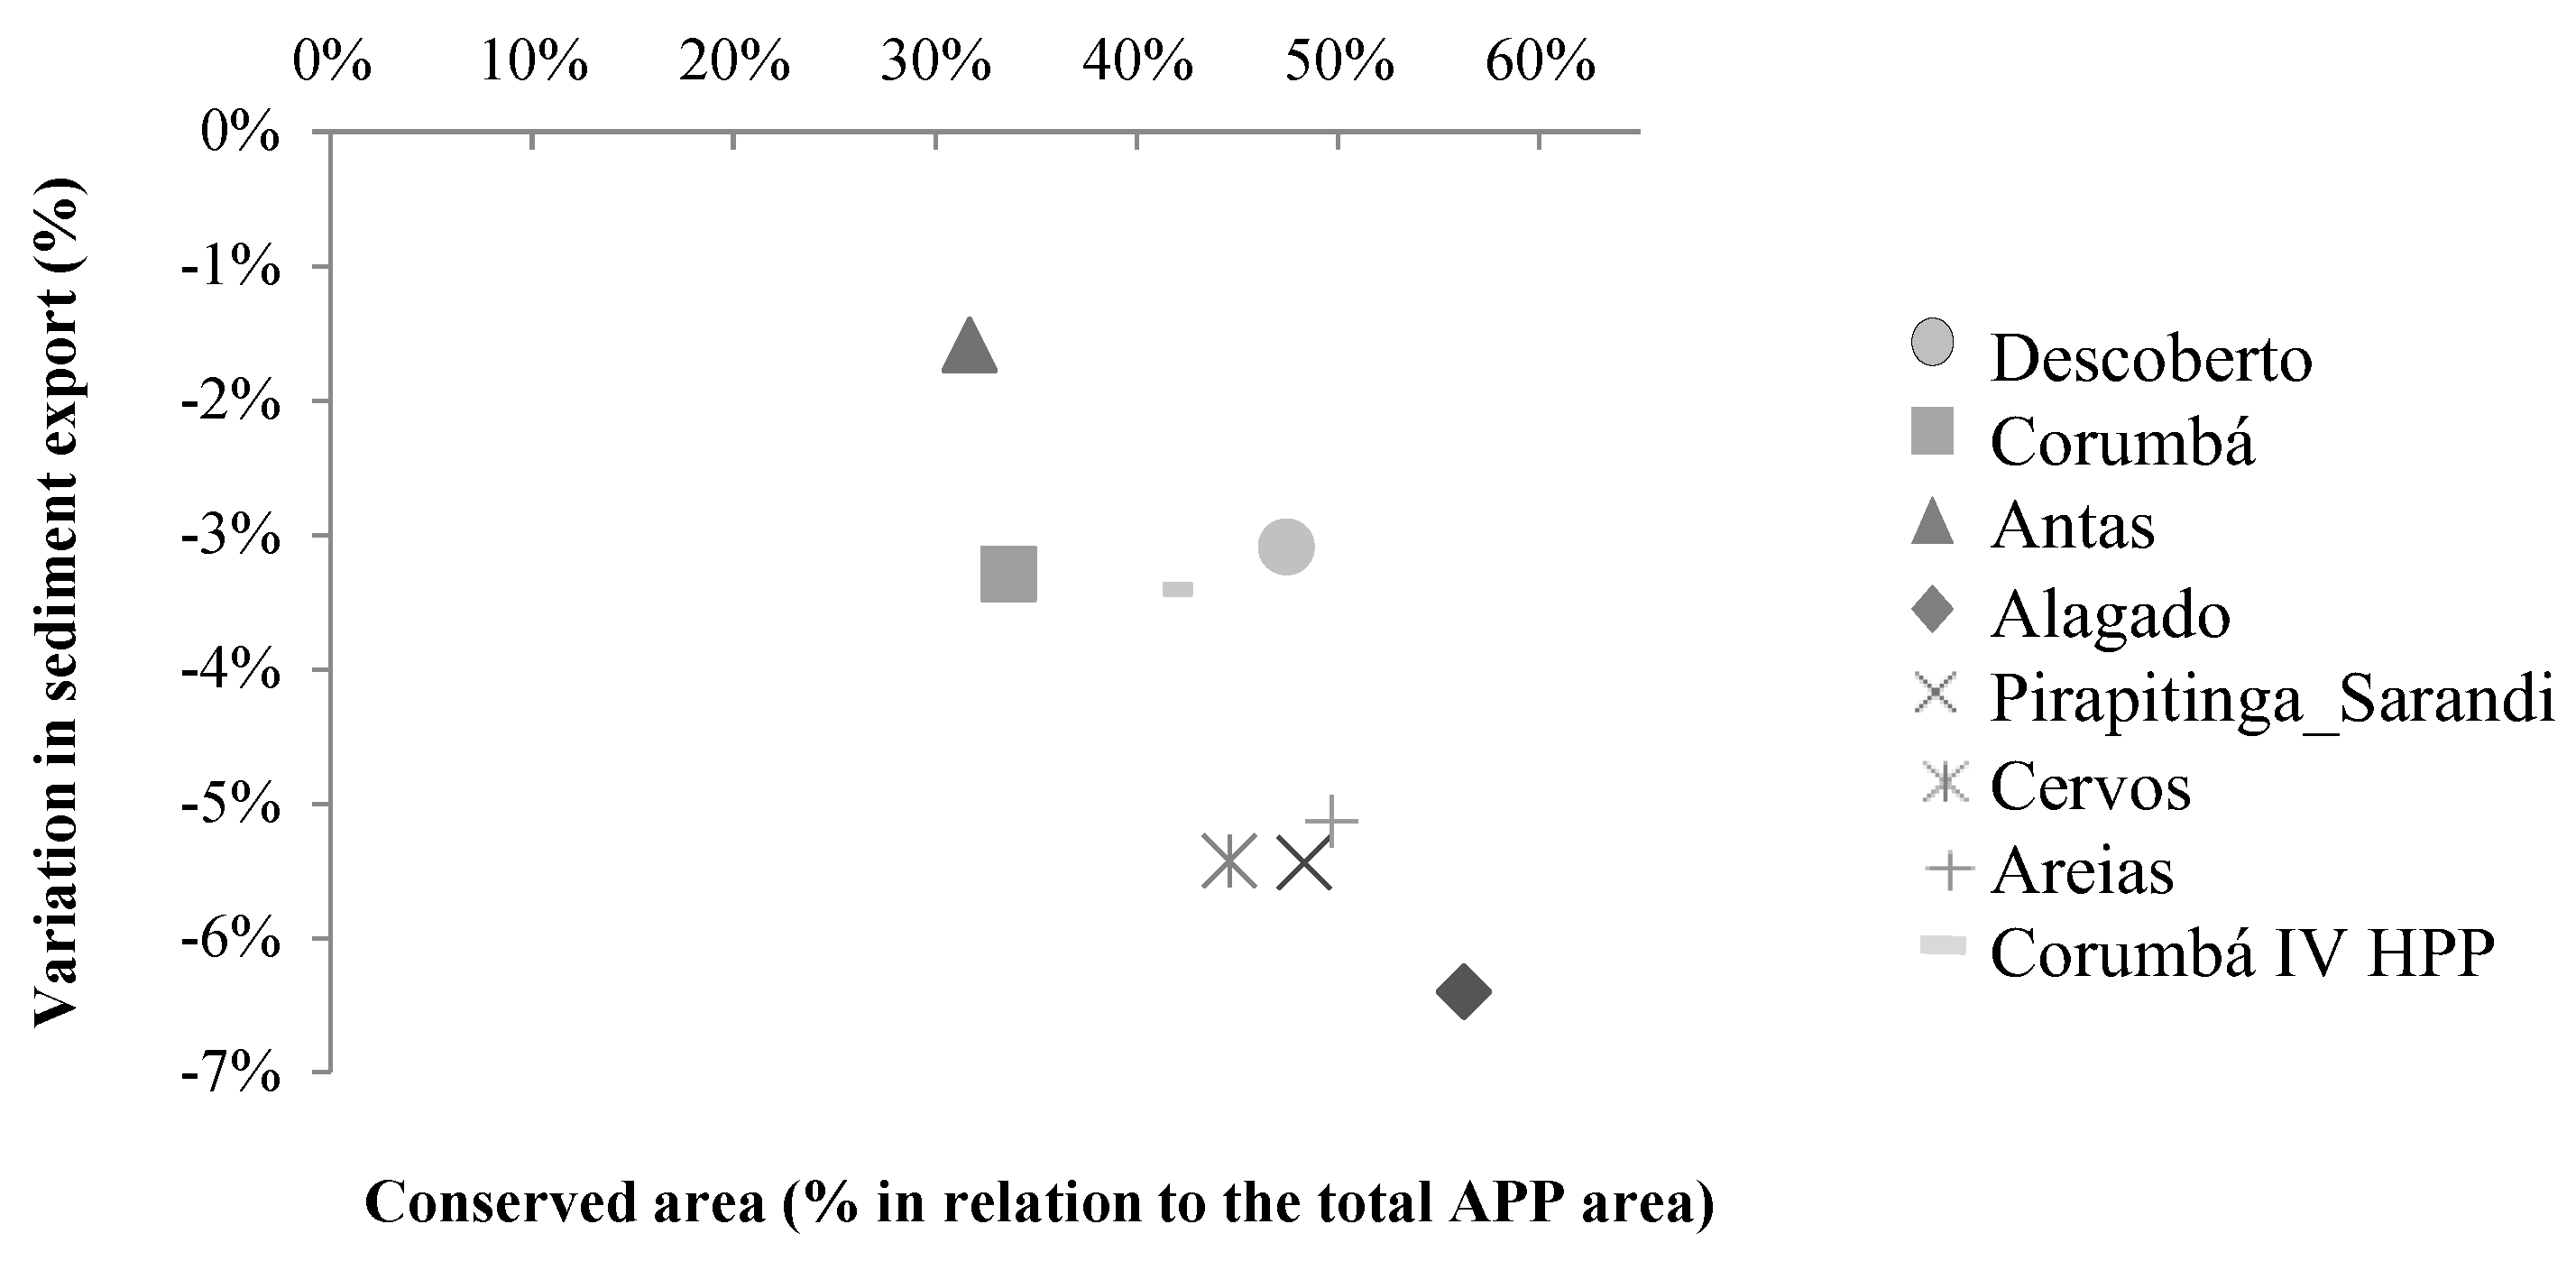

Table 1.
Widths of Riparian Protection Areas (APPs) associated with ANA's drainage hierarchy [22].
Table 1.
Widths of Riparian Protection Areas (APPs) associated with ANA's drainage hierarchy [22].
| Order | Width (m) |
|---|---|
| 1 | 240 |
| 2 | 180 |
| 3 | 90 |
| 4 | 60 |
| 5 | 60 |
| 6 | 30 |
| 7 | 30 |
| 8 | 30 |
| 9 | 30 |
| >=10 | 30 |
Table 2.
Input data for the model and associated sources.
| Data | Base year | Resolution | Goal | Source |
|---|---|---|---|---|
| Land use and land cover map | 2011 | 1:250,000 | To obtain land use and land cover classes | [35] |
| Soil Map | 2005 | 1:500,000 | To associate soil classes with Erodibility (K) data. | [35] |
| Drainage Network | 2014 | 1:50,000 | To generate APP buffer from land use map. To delineate the sub-basins area. |
[36] |
| Digital Elevation Model | 2000 | 30 m | To delineate the HPP drainage area. To calculate the topographic factor (calculated by the model). |
[37,38,38] |
| Point of interest location | 2011 | - | To obtain the HPP Corumbá IV catchment outlet position | [23] |
| Erosivity Map | 1980 to 2010 | - | To obtain the R factor | [39] |
Table 3.
C and P factors associated with land use classes.
| Land use class | Factor C | Factor P | Source |
|---|---|---|---|
| Urban | 0.1 | 1 | [4] |
| Agriculture (annual basis)* | 0.25 | 0.5 | [4,40] |
| Cerrado Biome | 0.042 | 1 | [41,42] |
| Water | 0 | 0 | By definition |
| Atlantic Forest | 0.005 | 1 | [4] |
| Pasture | 0.03 | 1 | [43] |
| Reforestation | 0.05 | 1 | [4] |
| Recovered/vegetated APP | 0.005 | 1 | [4] |
| Altered APP (absence of vegetation or unnatural vegetation) | 0.01 | 1 | [4,44] |
* Note: the areas of agriculture in the basin were considered to adopt conservationist practices, having the value of P = 0.5.
Table 4.
K factor values associated with soil classes.
| Class | k factor (t·ha·hr/MJ·ha·mm) |
Source |
|---|---|---|
| Water | 0 | By definition |
| Haplic Cambisol | 0.028 | [45] |
| Dystrophic Red Latosol | 0.012 | [45] |
| Dystrophic Red Yellow Latosol | 0.032 | [41] |
| Red Argisol | 0.04 | [41] |
| Litholic Neosols | 0.04 | [41] |
Table 5.
Input data for the model and associated sources.
| Ottobacia Code | Basin | Agriculture | Pasture | Cerrado | Other* | Total | APP Deficit** | ||||||
|---|---|---|---|---|---|---|---|---|---|---|---|---|---|
| % | Thousand Ha | Thousand Ha | % | ||||||||||
| Basin | APP | Basin | APP | Basin | APP | Basin | APP | Basin | APP | APP | |||
| 869696 | Alagado | 7 | 3 | 38 | 36 | 39 | 56 | 15 | 5 | 64 | 6 | 2 | 39% |
| 869698 | Corumbá | 13 | 6 | 61 | 61 | 24 | 34 | 2 | 0 | 225 | 27 | 18 | 66% |
| 869697 | Antas | 33 | 27 | 39 | 36 | 18 | 32 | 10 | 6 | 109 | 10 | 6 | 62% |
| 869695 | Pirapitinga-Sarandi | 14 | 7 | 34 | 44 | 34 | 48 | 18 | 0 | 17 | 2 | 1 | 52% |
| 869699 | Cervo | 19 | 9 | 36 | 47 | 26 | 45 | 19 | 0 | 16 | 2 | 1 | 55% |
| 869694 | Descoberto | 12 | 10 | 30 | 30 | 31 | 45 | 28 | 15 | 128 | 13 | 5 | 40% |
| 869696 | Areias | 4 | 1 | 61 | 49 | 32 | 50 | 3 | 0 | 141 | 14 | 7 | 50% |
| Corumbá IV HPP Basin | 14 | 8 | 49 | 47 | 27 | 41 | 10 | 4 | 701 | 74 | 41 | 55% | |
Note: *Other = Urban, Forest, Reforestation, Water (in the basin, corresponds to lakes and reservoirs). **APP Deficit = areas occupied by Pasture or Agriculture in the 2011 map (baseline).
Disclaimer/Publisher’s Note: The statements, opinions and data contained in all publications are solely those of the individual author(s) and contributor(s) and not of MDPI and/or the editor(s). MDPI and/or the editor(s) disclaim responsibility for any injury to people or property resulting from any ideas, methods, instructions or products referred to in the content. |
© 2023 by the authors. Licensee MDPI, Basel, Switzerland. This article is an open access article distributed under the terms and conditions of the Creative Commons Attribution (CC BY) license (http://creativecommons.org/licenses/by/4.0/).
Copyright: This open access article is published under a Creative Commons CC BY 4.0 license, which permit the free download, distribution, and reuse, provided that the author and preprint are cited in any reuse.


