
Submitted:
13 June 2023
Posted:
14 June 2023
You are already at the latest version
Abstract
This paper expressed three regression models that predict the lithium-ion battery life for electric cars based on a supervised machine-learning regression algorithm. The Linear Regression, Bagging Regressor, and Random Forest Regressor models will be compared for capacity prediction of lithium-ion batteries based on voltage-dependent per-cell modeling. When sufficient test data is available, three linear regression learning algorithms will train this model to give a promising battery capacity prediction result. The effectiveness of the three linear regression models will be demonstrated experimentally. The experiment table system is built with an NVIDIA Jetson Nano 4GB Developer Kit B01, a battery, an Arduino, and a voltage sensor. The Random Forest Regressor model has evaluated the model's accuracy based on the average of the square of the difference between the initial value and the predicted value in the data set (MSE (Mean Square Error)), and RMSE (Root Mean Squared Error) is smaller than the Linear Regression model, Bagging Regressor model (MSE is 516.332762; RMSE is= 22.722957). The Linear Regression model with MSE and RMSE is the biggest (MSE is 22060.500669; RMSE is= 148.527777). This result allows the Random Forest Regressor model to remain a helpful life prediction of lithium-ion batteries. Moreover, this result allows rapid identification of battery manufacturing processes and will enable users to decide to replace defective batteries when deterioration in battery performance and lifespan are identified.
Keywords:
Linear Regression
; Bagging Regressor Random
; Forest Regressor
; Machine Learning
; Lithium-Ion Battery
1. Introduction
Due to the benefits of high energy density, low self-discharge characteristics, fast charging, high capacity, low pollution, and long life, lithium-ion batteries (LIB) have recently received much attention in research and application. As a result, their market share is steadily growing [1,2,3]. These exceptional characteristics have drawn several scientists to research battery power management in recent years [4,5]. In particular, the battery's state of health (SOH) is utilized to gauge its aging and anticipate how long it will last during the storm's charge and discharge cycle. Through the design of materials and the evaluation of battery life, this approach may speed up the development of novel electrode materials with increased capacity and energy [6]. These exceptional characteristics have drawn several scientists to research battery power management in recent years [7]. In particular, the battery's state of health (SOH) is utilized to gauge its aging and anticipate how long it will last during the storm's charge and discharge cycle. Through the design of materials and the evaluation of battery life, this approach may speed up the development of novel electrode materials with increased capacity and energy [8]. Physical modeling and data collecting are used to forecast universal batteries' capacity and capacity loss [9]. Math is used in model-based approaches. To accurately represent the battery's decay law, the model is chosen by the battery's physical or experimental deterioration process [10]. The data generated by impedance were analyzed using fuzzy logic in the literature [11]. The integral of the discharge or charge current is used to determine the battery's remaining power in the coulomb (CC) technique of calculating capacity over time. This frequently used CC technique performs straightforward computations [12]. Based on a modified Randle circuit model, the authors of [13] created a non-linear model of the battery employing circuit characteristics like resistors, capacitors, and inductors to forecast the depletion of battery capacity. However, interference from other integrated system components impacts measurement accuracy [14]. Additionally, according to the literature [15], for analogous circuit models with several complicated characteristics, the lifespan prediction model, in conjunction with innovative filtering technology, will forecast the reduction in battery capacity. The battery cell is complex, varied, and mysterious.
An empirical exponential and polynomial regression model were also suggested in the document [16] to track the trend of battery cell degradation throughout the battery cell's life based on the analysis of experimental data and utilize a filtering approach to tweak the model parameters live. According to reference [17], a novel model using a Kalman filter and regression vector was created to forecast the battery's short-term capacity and cycle life. Additionally, the literature has established a novel prediction technique based on filter multiple interaction models [18] to estimate battery cycle life. Many battery capacity models employ the multi-model interaction modeling technique for various equations of state. Here, it is discovered that these model-based techniques have made significant strides toward high performance. Experimental evidence supports this finding. The battery-degrading accuracy of the physical model, however, limits the accuracy and robustness of these models [19,20].
Artificial intelligence (AI) techniques are now often used in state prediction, voice recognition, natural language processing, and picture and image processing. Machine learning (ML) uses a traditional neural network, but algorithms follow the system. To predict the SOH of Li-ion battery packs, the scientists also coupled the effectiveness of ML with training schemes and clever tweaks. As a result, the suggested technique is paired with the Gaussian Network Process (NGP) model [21,22,23,24,25] in this study, which considers the battery's degradation under various operating situations. The regression model is used to predict the target values as continuous values. This model also has far-reaching applications, from house price prediction, e-commerce valuation system, weather forecast, and stock market prediction to image resolution conversion. Super high, automatic encoder learning feature, image compression [26,27,28,29,30], In the paper used linear regression, bagging, and random forest regressor models. Three models will be compared for capacity prediction of Lithium-ion batteries based on voltage-dependent per-cell modeling. When sufficient test data is available, three linear regression learning algorithms will train this model to give a promising battery capacity prediction result. The effectiveness of the three linear regression models will be demonstrated experimentally. First, the study predicts, based on the correlation analysis, that the average power loss in the battery's early cycles is connected to the lifespan of the charge and discharge cycles. The developed model (ML) is then used to forecast the cycle life of the Li-ion battery. The papers are based on the characteristics of the first 100 charging and discharging cycles to determine the battery's capacity. Consequently, battery production methods may be quickly detected, and consumers can choose to replace bad batteries when performance and longevity start to decline.
The article is divided into the following six parts. First, Section 2 illustrates the extraction of the battery's physical components. Battery psychological characteristics are discussed in Section 3. Section 4 explores the learning-ML three regression approach that is presented. The results of the experiment and assessment are shown in Section 5. Lastly, Section 6 is conclusion and development of research results in the future.
2. Electric Vehicles Battery Key Parameters
2.1. Internal power supply
According to the document [13], the DC internal resistor is determined by the formula (1). The procedure assumes that the battery capacity drops over a short-specified period, so the internal DC resistance causes the voltage drop.
In which: Vt1; Vt2 is the battery voltage terminal at t1 and t2; It2 is the discharge current at time t2.
2.2. Variance of temperature
The surface temperature increases during heat generation remain constant and vary during the discharge phase. This temperature is created by I2R and the chemical reaction. As the battery capacity declines, the temperature increases leading to a large thermal variance. The temperature variance in each cycle is calculated by the formula (2).
where: E is the electromotive force; Ti is the ith temperature sample in n cycles.
2.3. Discharge voltage variance
As the voltage discharges faster as the battery capacity declines. Discharge voltage variance in each cycle is written as formula (3).
where: E is the electromotive force; Vi is the ith voltage sample in n cycles;
2.4. Voltage difference
The voltage difference between the first and subsequent cycles is the discharge energy difference between the first and next cycles. This energy difference has a nonlinear relationship with battery capacity degradation.
3. Physical Characteristics of Battery Lithium-Ion
The hue of the angles and the measured discharge capacity curves vary over the spectrum across the battery life cycle shown in Figure 1.
The connection between the predicted discharge capacity and the total number of cycles throughout the battery life is shown in Figure 1. Early processes of the battery's life cause its ability to decline gradually, while later cycles cause it to drain quickly. The power characteristics are also discovered to be alternating, indicating that the capacity and battery life model is not linear. Therefore, the research suggests a model based on fundamental physical characteristics with the premature discharge of the storm to calculate the battery's life precisely. Predict the battery life using the battery capacity formula at each cycle (5) based on the beginning values in part 2 (voltage, current, temperature, etc.). The recipe demonstrates the link between first-cycle discharge and battery life.
where: is the battery capacity at each cycle; U(t) is the discharge voltage; Q(t) is discharged power; t is the discharge time at each cycle to determine the average power, j is the jth battery and k number of discharge cycles.
Based on Figure 1, it can be seen that the capacity curves of the battery cells decline in the early cycles because of the slight increase in capacity during the early discharge phase. Therefore, to study the relationship between the characteristics and the subsequent period related to the battery cycle life, the paper uses data from 10 to 100 cycles. In Figure 1, the curve is shown. Power P indicates that the attenuation of the battery is minimal during the whole cycle. The paper uses variance statistics to convert the attenuation fluctuation of the average power Pj of each battery from 10 to 110 cycles into energy PDj to establish the related corresponding to the period Lj. The relationship between PDj and Lj is determined through the Eq. (6).
4. Regression Models Life Prediction of Lithium-Ion Batteries
4.1. Linear regression
Linear regression is a method to predict the dependent variable (y) based on the value of the independent variable (x). This means that linear regression should have a linear relationship between the independent variable and the non-independent variable, and the effect of a change in the values of the independent variables should further affect the dependent variables. Belong. Some properties of linear regression are that the regression line always passes through the mean of the independent variable (x) and the standard of the dependent variable (y). The regression line minimizes the sum of the "area of errors." The sum of areas measures the response/dependent variable (y) ratio variation. The amount of variation inherent in the reaction can be considered before regression is performed [19,20,21].
The linear regression model is shown in Figure 4, and the steps are as follows:
Step 1: Define input data characteristics
Step 2: Analyze the correlation of the data
Step 3: Estimating the model
Step 4: Determine the fitting line
Step 5: Analyze the model
Step 6: Test the model with tested data
Step 7: Calculation with metric types of sampled data.
The paper uses a simple linear regression model to predict the remaining life of the battery cell. This model calculates but gives accurate results. The linear model has the form of a formula (7).
where: is the period forecast of the ith battery cell, the feedback variable; xi is the feature vector p for the ith battery cell, the predictor variable; ŵ is a vector of p-dimensional model coefficients; is the regression coefficient.
When applying regression techniques, a penalty function is added to the least squares optimization formula to avoid overfitting. Linear regression uses an elastic network to fit and select the model by finding the sparse coefficient vectors. The linear regression formula using an elastic network has the following form:
where the min function represents finding the value of w that minimizes the argument, y is the n-dimensional vector of the observed battery life, X is the n × p matrix of objects, and λ is a quantity non-negative directional. Inside found in the smallest regular squares. P(w) depends on the elastic network regression technique.
where: is the scalar coefficient between 0 and 1.
One way to gauge how “good” a model fits a given data set is to calculate the square root mean square error (RMSE). RMES is a known metric that averages predicted values that are far from observed values. RMSE and mean percent error were chosen to evaluate the performance of the model. RMSE is calculated as formula (10) as follows:
where y is the observed lifetime, is the predicted period, and n is the total number of samples. The average percentage error is determined by the formula (11):
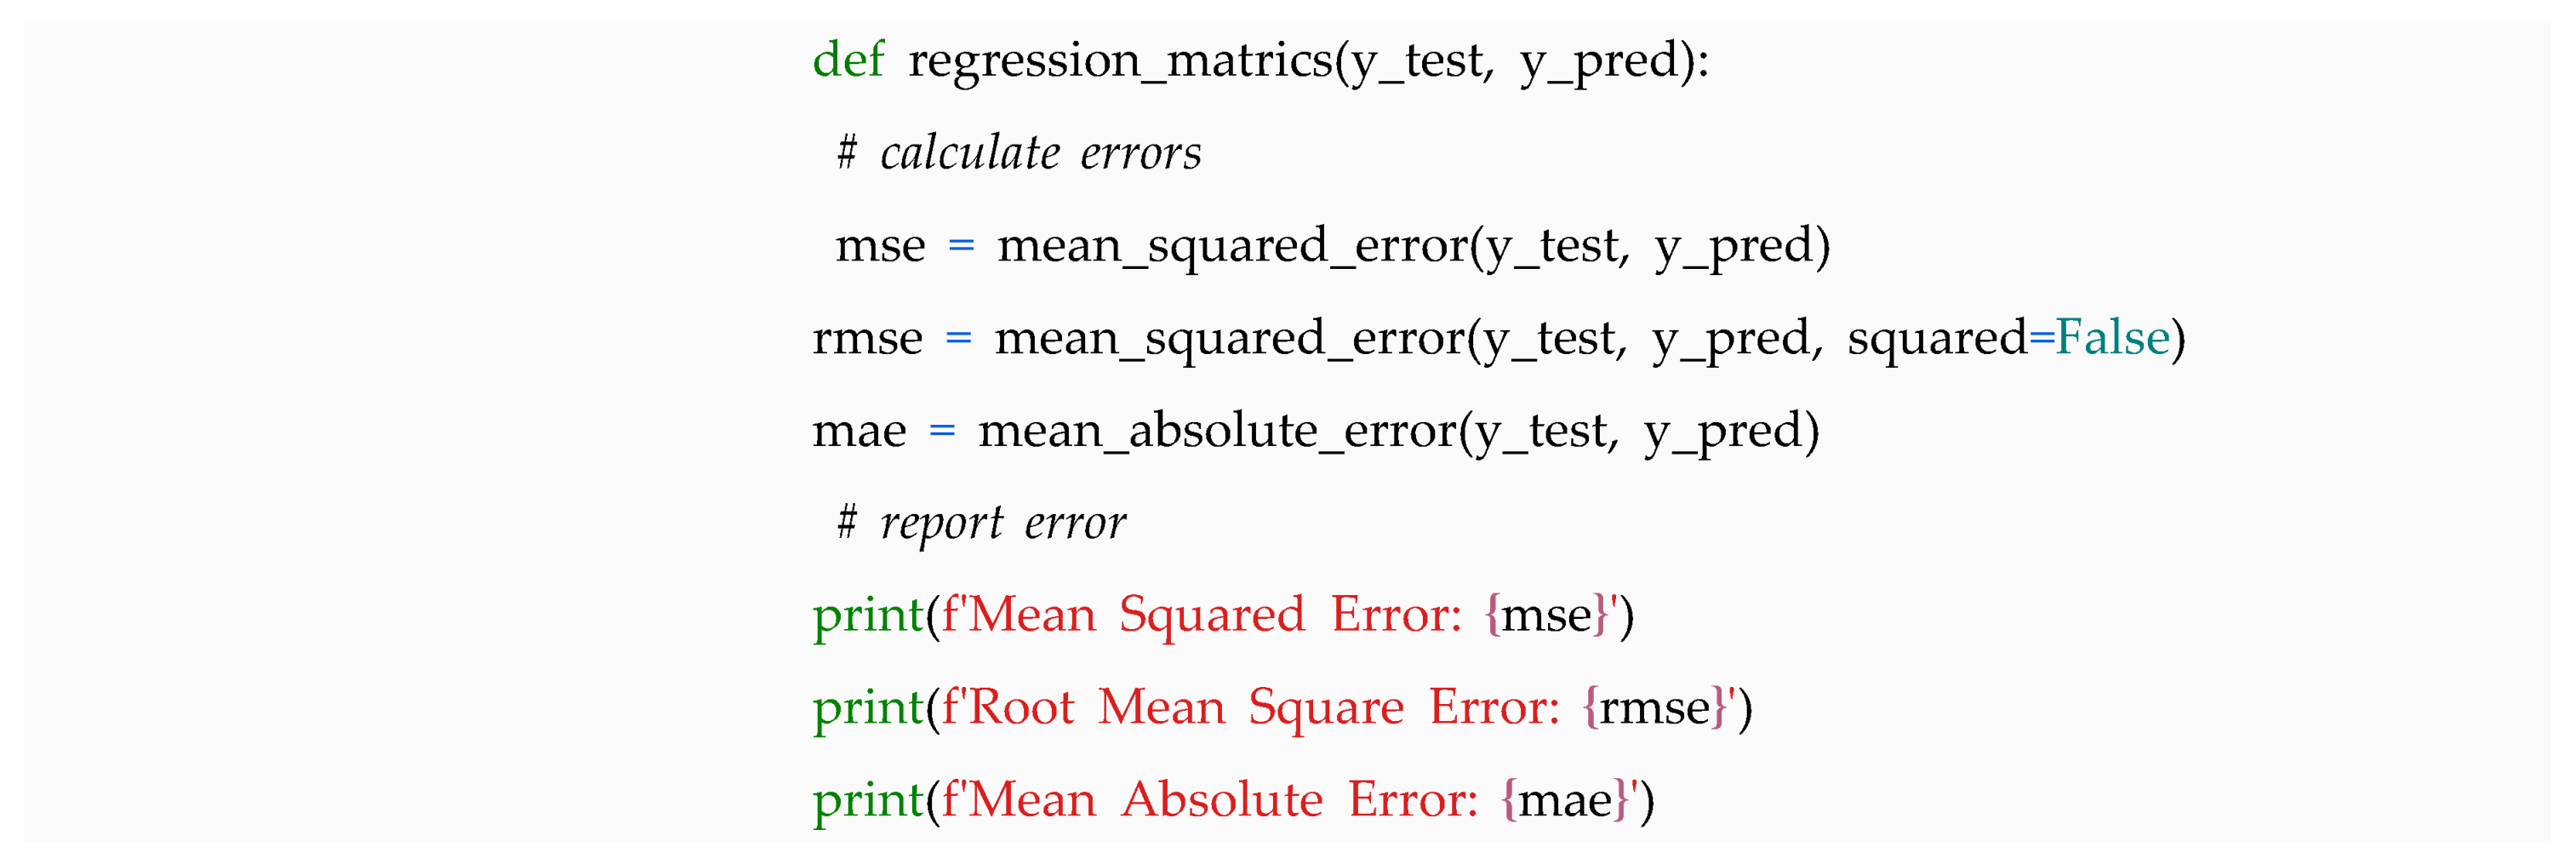
The Linear regression model is written by Python code as shown:
4.2. Random Forest Regressor
Random forest is an algorithm that belongs to the group of supervised learning algorithms used in two problems, classification, and regression. The general idea of the algorithm: It is a combination of many decision trees, but for each decision tree, there is randomness, then the prediction result is a combination of many decision trees. In building an algorithm for the regression problem, the implementation steps are still the same; only the output of the problem is a constant value; it will be averaged the output points. The structure of random forest regressor algorithm is shown in Figure 5
4.3. Build a Random Forest regression algorithm.
It prepares the data: It will randomly take n data from the dataset. This technique is called bootstrapping. It takes a sample from the data set without throwing it away but still leave it in the original data until we divide enough n data; these n data sets may overlap. After enough n data, we randomly pick k attributes (k < n). New data enough n data enough k attributes. For each dataset with k attributes, it will build each decision tree sub model.
The decision tree construction process is based on randomness, so the results of the trees in the Random Forest algorithm are different.
RMSE is calculated as formula (10) and the average percentage error is determined by the formula (11)
The result is the union of all the previously trained decision trees.
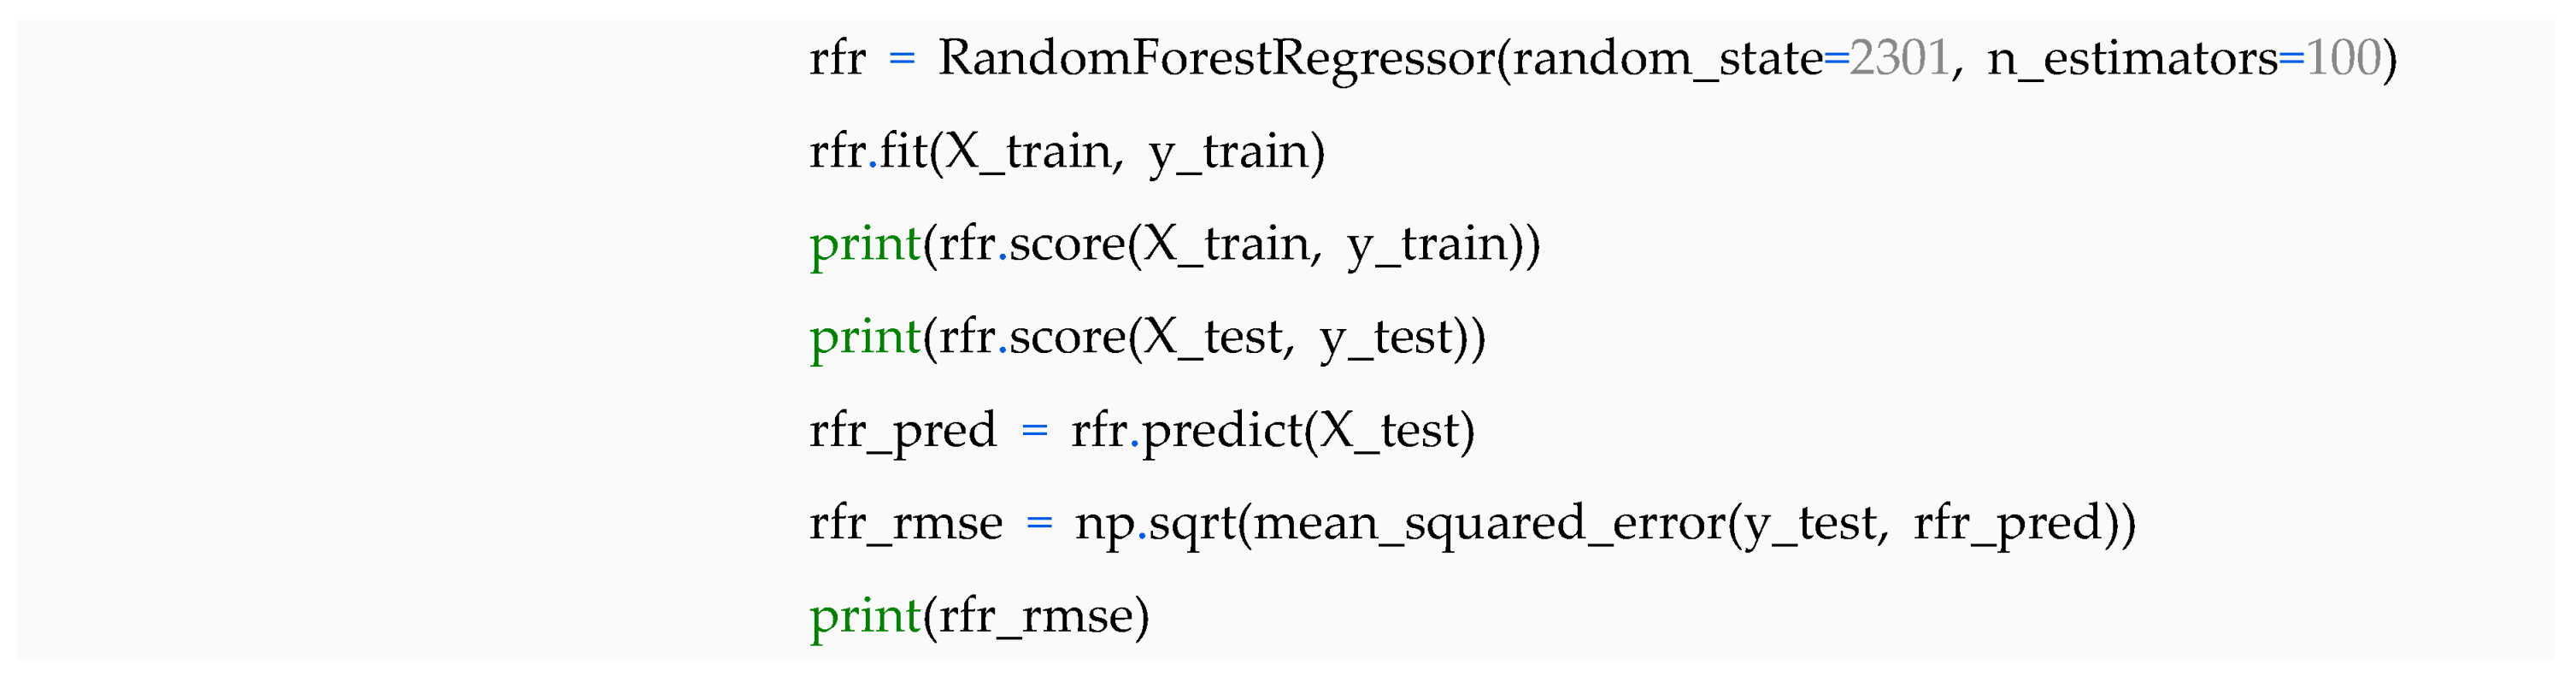
The Random Forest Regressor model is written by Python code as shown:
4.4. Decision Tree Regressor
A decision tree regressor is an algorithm belonging to the group of supervised learning; this algorithm can be used in two problems, classification and regression. Building an algorithm based on a given training data set is about determining the questions and their order. A unique feature is that the algorithm can work with unordered discrete categorical variables. Decision trees also work with data with feature vectors that include absolute and numeric attributes. The data also does not need to be normalized regarding training.
In the decision tree regression problem, we will discuss the CART algorithm: This algorithm can perform two regression or classification tasks.
The decision tree algorithm works like this:
Step 1: Create an empty binary tree
Step 2: Select features to split
Step 3: If there are no more questions, make a prediction
Step 4: Recursively from step 2
We can see two problems to solve in this algorithm: (1) feature selection and (2) when to stop recursion.
(1) Feature selection: To solve this problem, we calculate the MSE error cost (Mixedness). We will rely on this MSE cost to choose the feature accordingly. It will calculate from the root node and then calculate the intermediate nodes; the error cost of that split feature is the smallest, then choose that feature.
(2) Stop the recursion: The max depth parameter is in this task tree when the request limit is reached. Or divide the tree so it can't be divided anymore.
RMSE is calculated as formula (10) and the average percentage error is determined by the formula (11).
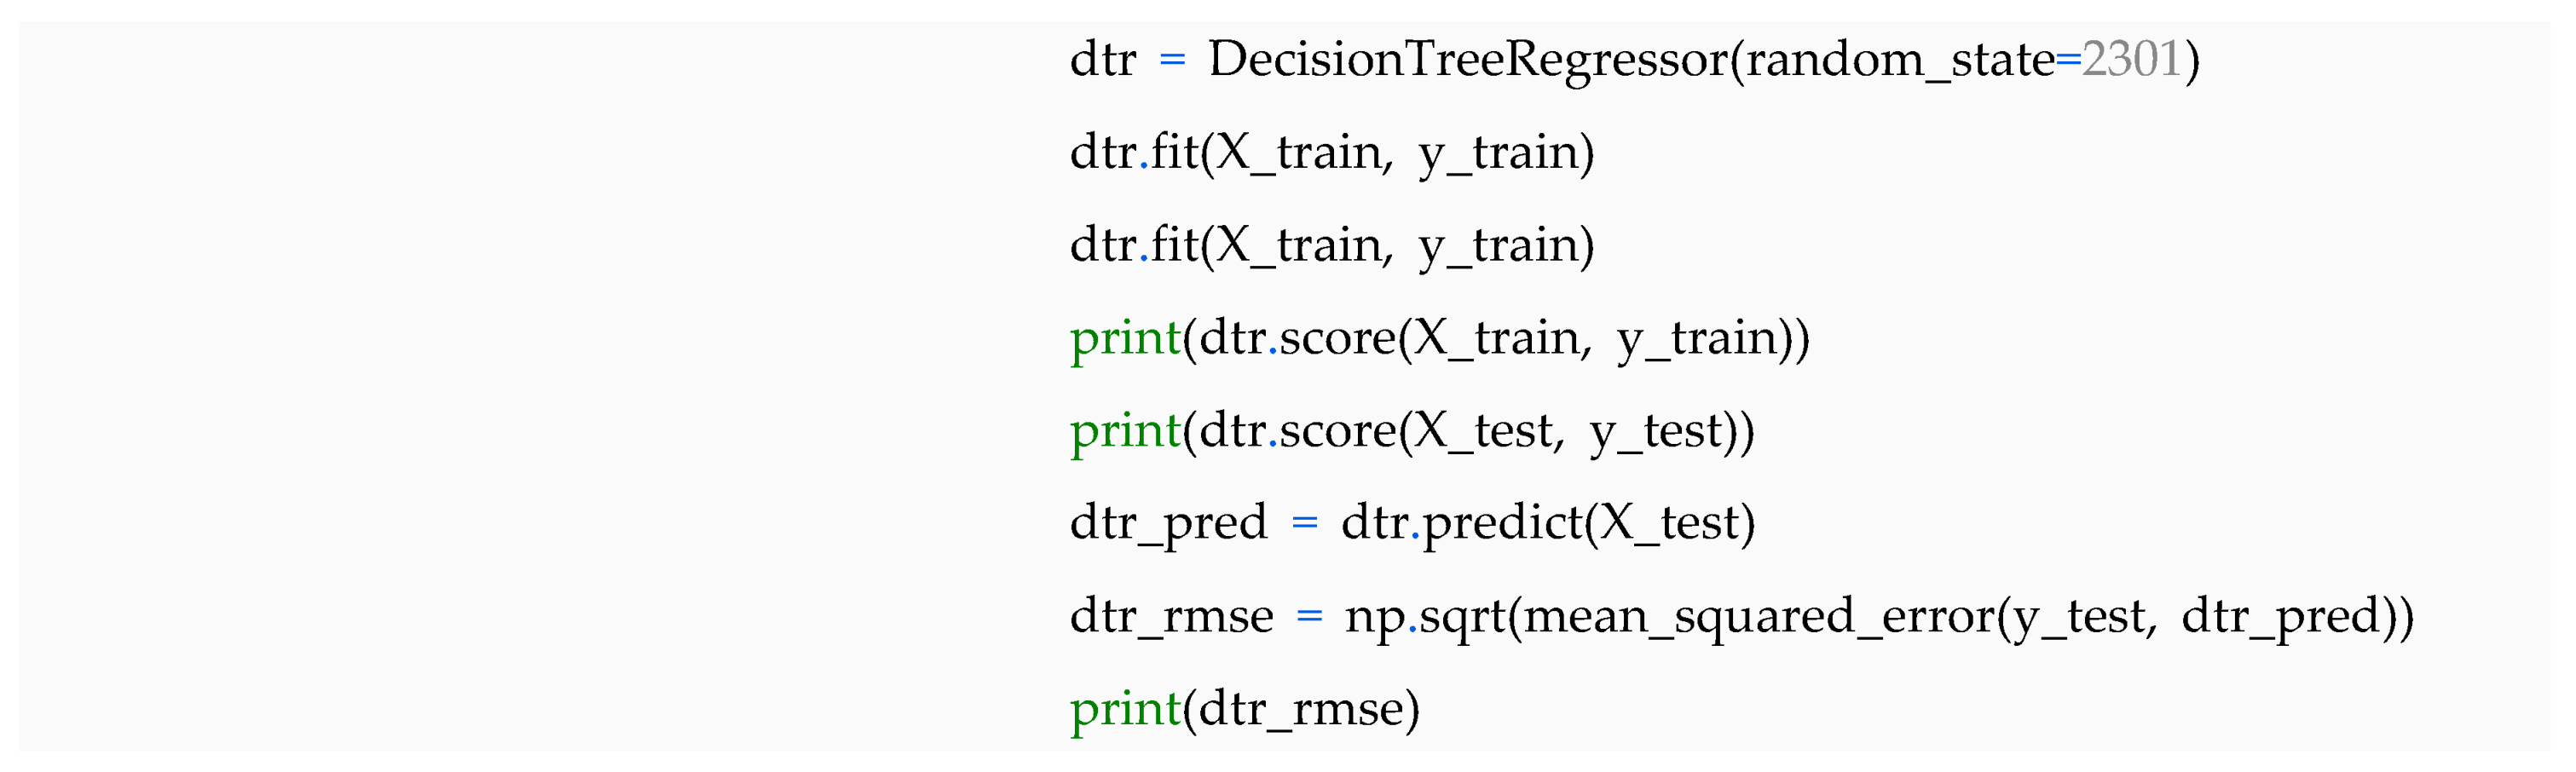
The Decision Tree Regressor model is written by Python code as shown:
5. Experiment Results and Discussion
The experimental table is built as shown in Figure 6 and Figure 7. The parameter of the battery to estimate the life is as follows:
- Cycle Index: number of cycles
- Decrement 3.8-4.05V(s)
- Max. Voltage Discharge (V): 4.05V
- Min. Voltage Charge (V): 3.8V
- Combo NVIDIA Jetson Nano Developer Kit B01: GPU: 128-core Maxwell, CPU: Quad-core ARM A57 @ 1.43 GHz, Memory 4 GB 64 bits LPDDR4 25,6 GB/s.
Time constant current (s) after being tested, the model could accurately calculate the battery's voltage in one hour. This data could be further extrapolated to estimate the entire life cycle. Power management can become more approachable and more effective by adding machine learning to clever battery technology.
The parameters of the battery: Maximum discharge voltage (V): 4.05V and minimum charging voltage (V): 3.8V. The experimental scenario conducts 3 cases below, comparing two predictive models: Linear Regression and Bagging Regression.
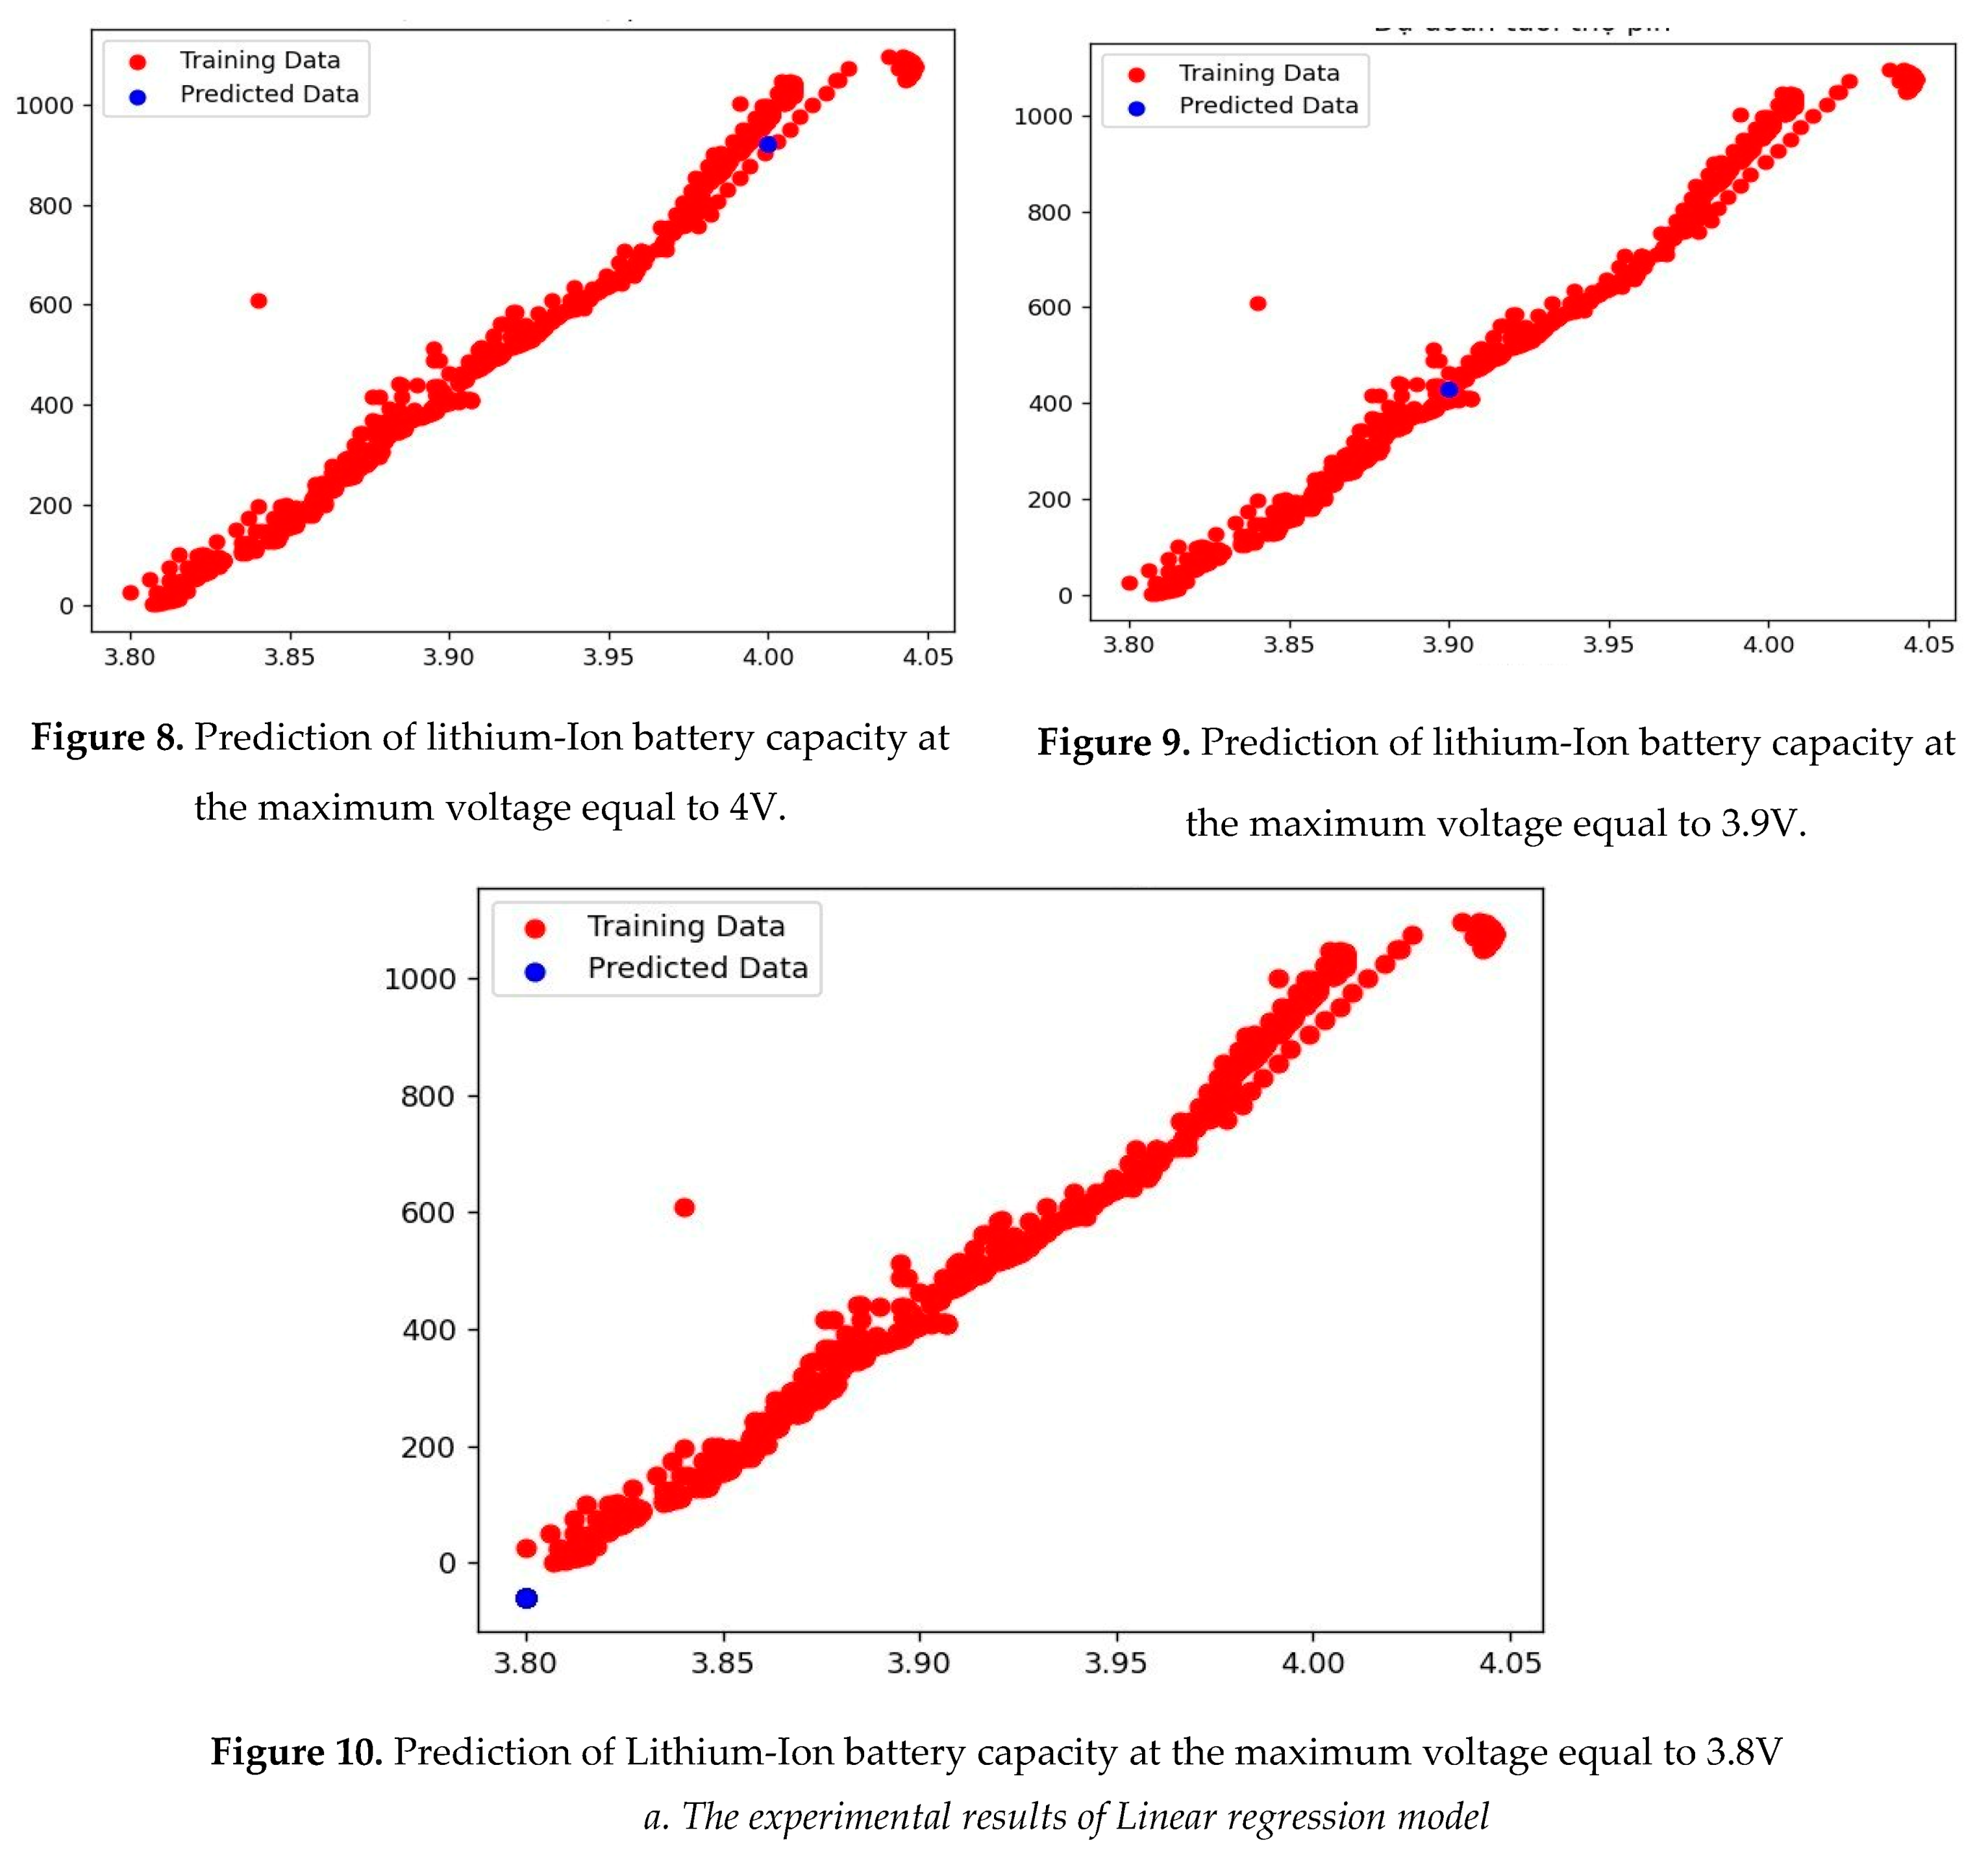
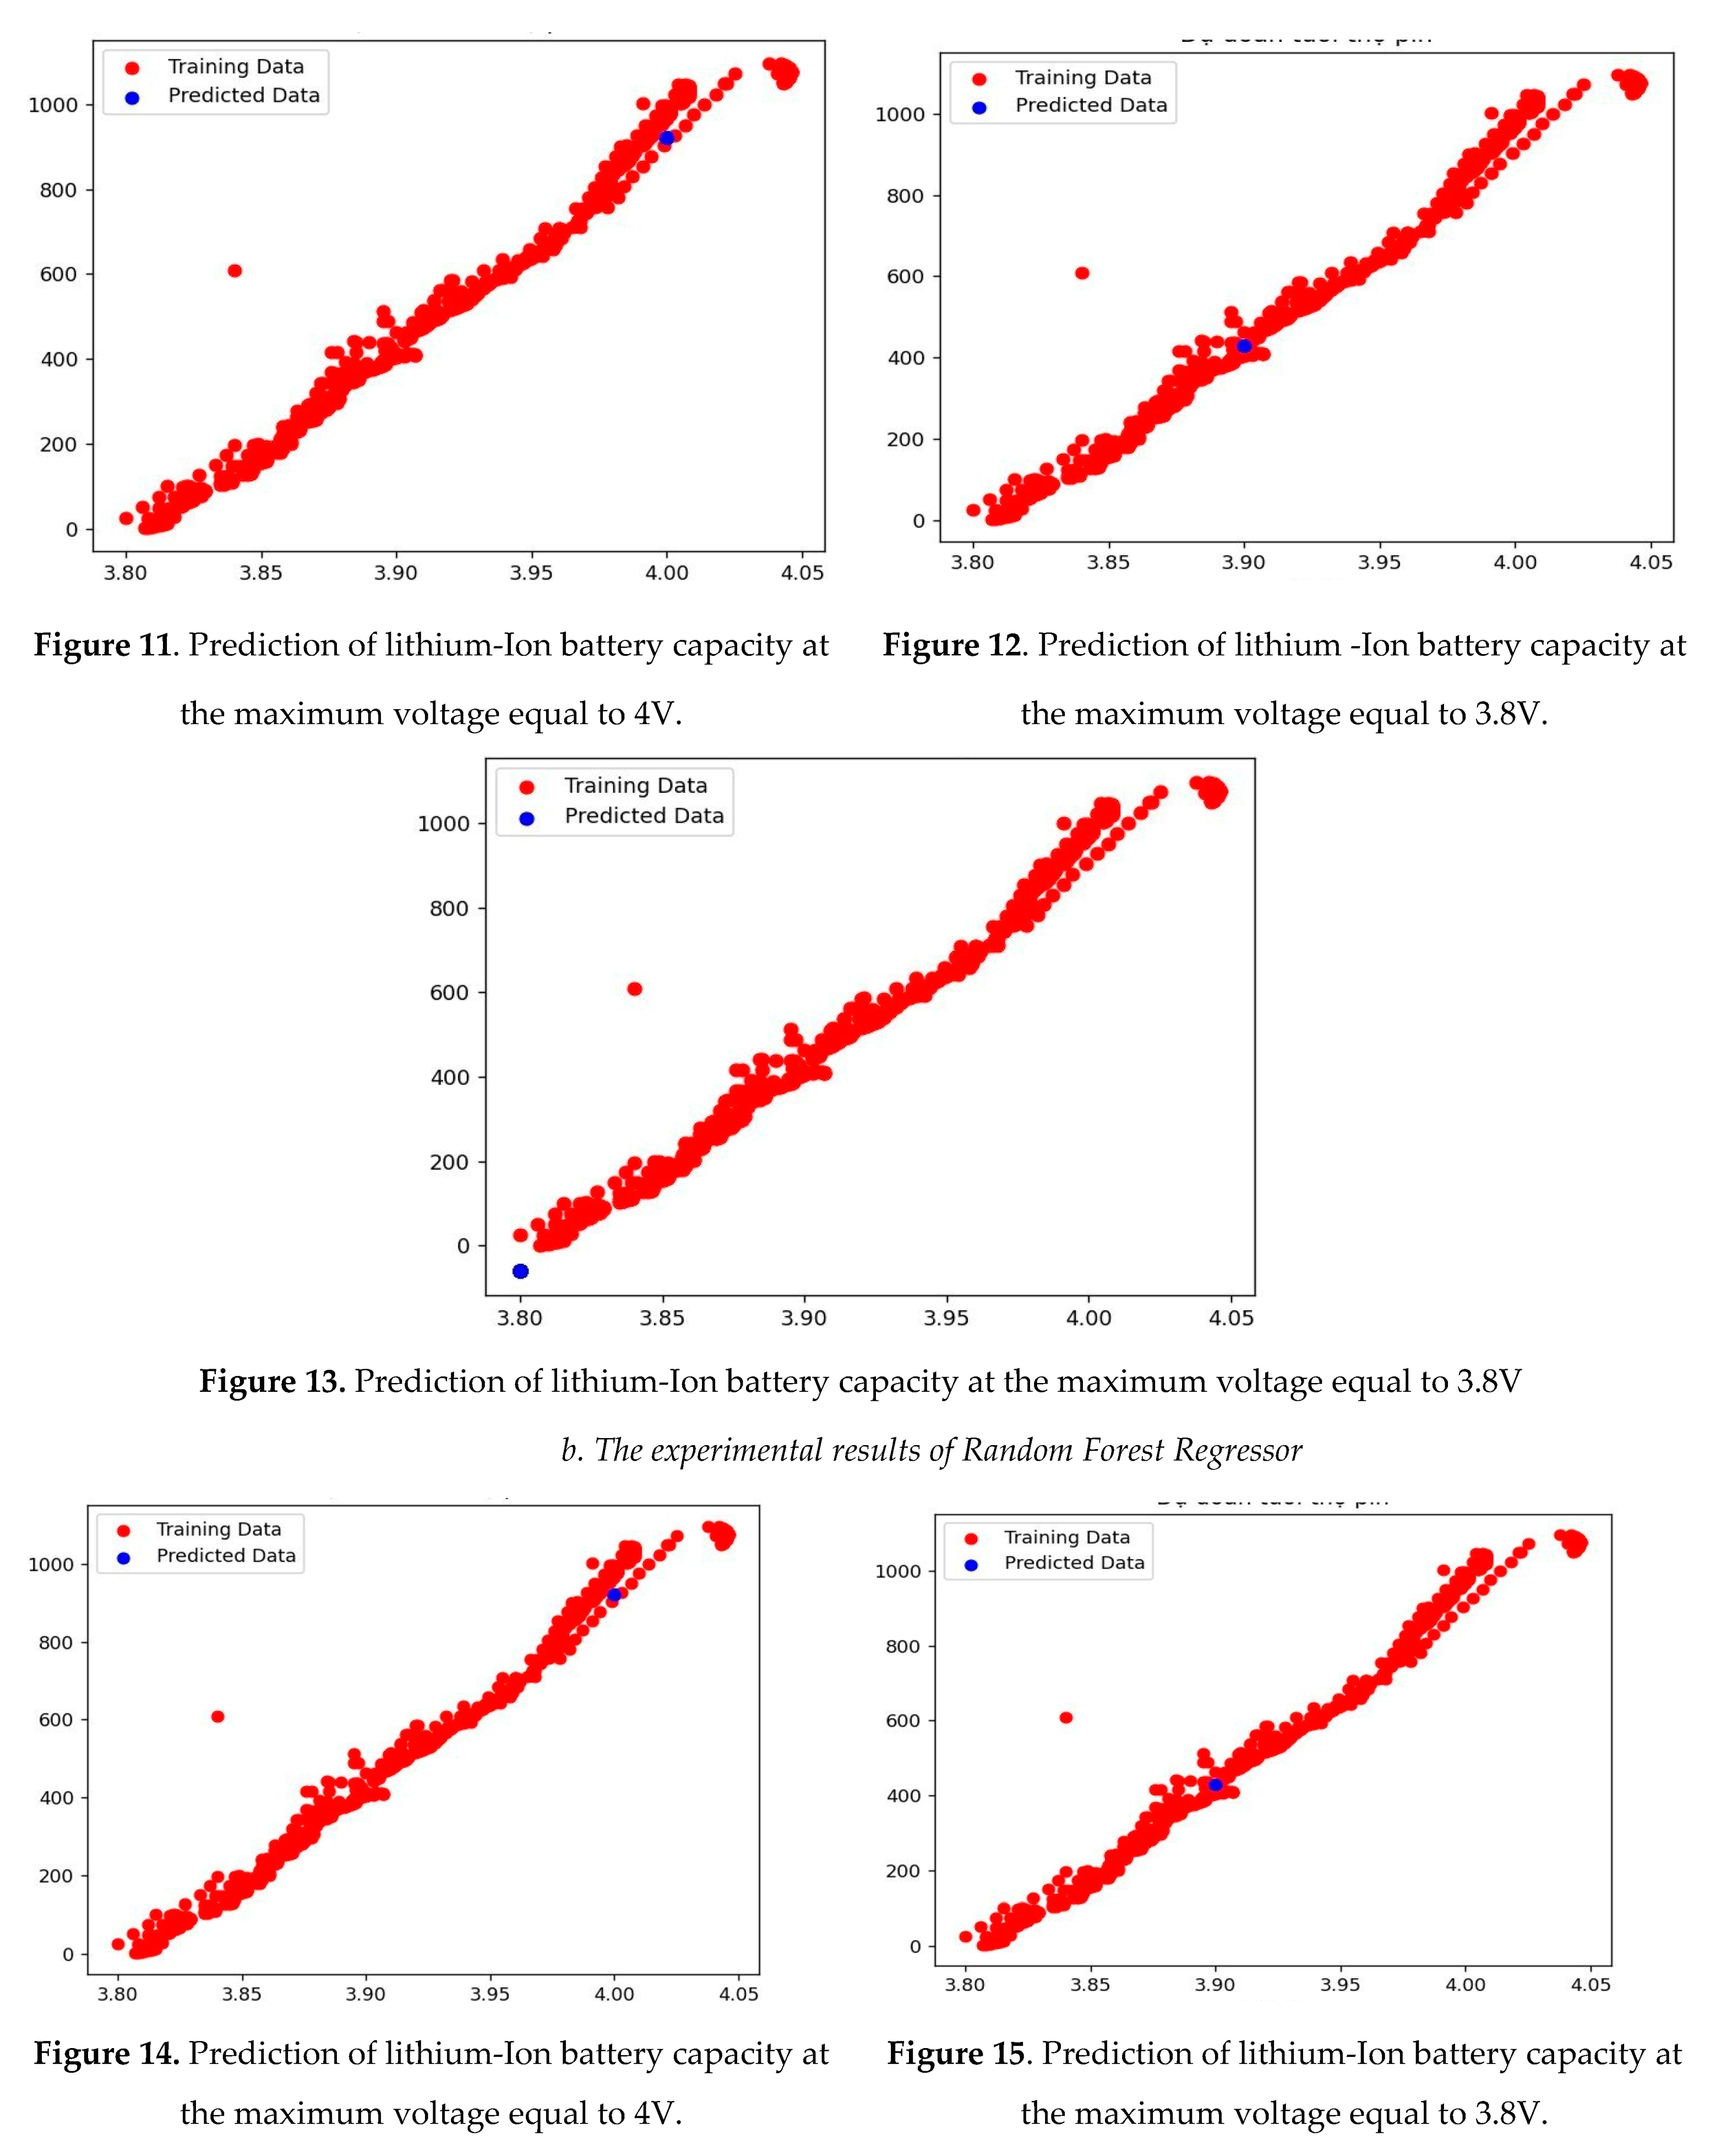
- Case 1: Predict of lithium-Ion battery capacity when the maximum voltage is equal to 4V (when the battery is working without load).
- Case 2: Predict of lithium-Ion battery capacity at the time of maximum voltage equal to 3.9V (Batteries power DC motor with parameters: No-load current at 12V 0.92A, no-load speed 1200 rpm No-load current at 24V 1.46A, no-load speed 2000rpm. It is recommended to use a 12v 10A source for a stable motor).
- Case 3: Forecast of Li-Ion battery capacity at the time of maximum voltage equal to 3.8V ((Batteries power DC motor with parameters: No-load current at 12V 0.92A, no-load speed 1200 rpm No-load current at 24V 1.46A, no-load speed 2000 rpm. A 12v 10A power source is recommended for the motor to run stably).
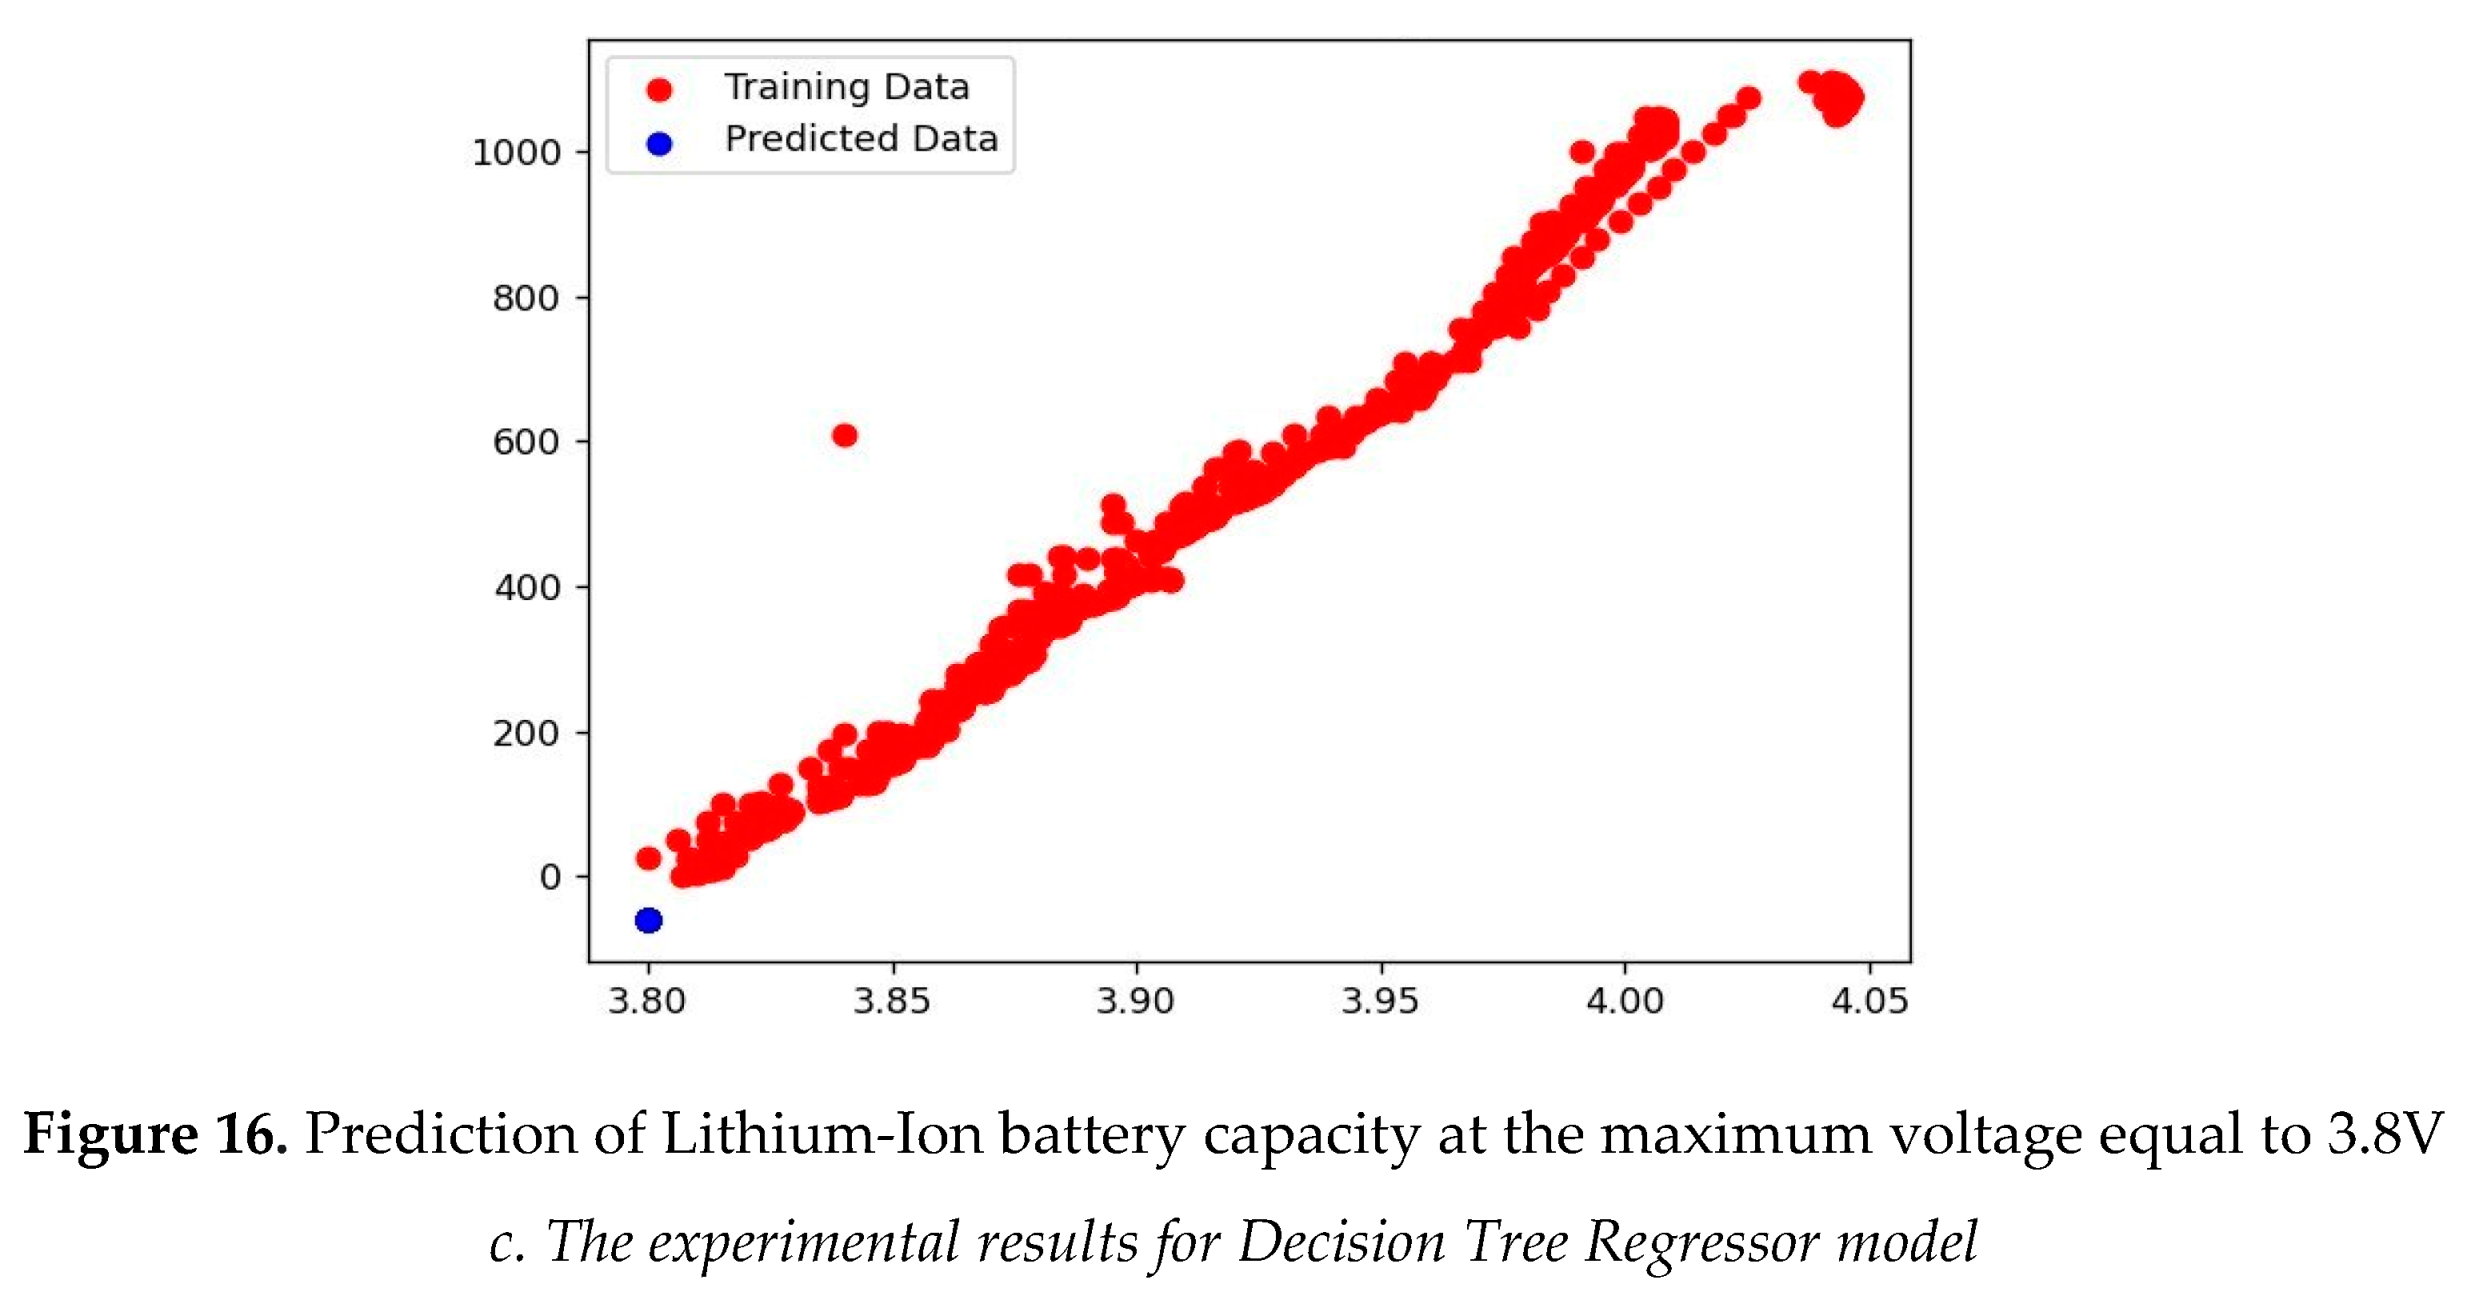
The experimental results for linear regression model, random forest regressor model, and decision tree regressor model are shown in Figures 8–16.
The MSE and RMSE results of three regression models are shown by Table 1.
Figures 8–16 shows that the experimental results in the two empirical cases for the three regressor models have similar results. This means every training point in the above graph is close to the diagonal. Therefore, the trained model resembles linear regression theory. According to the training model, the higher the rated voltage, the better the battery life. For example, the life of a battery is 1000 discharge cycles when it is 4V. Meanwhile, the battery life is 500 discharge cycles when it is 3.9V. However, considering the accuracy of the model, it was found that the random forest regressor model has evaluated the model's accuracy based on the average of the square of the difference between the initial value and the predicted value in the data set (MSE (Mean Square Error)) is smaller than the linear regression, decision tree regressor models (516.332762). The linear regression model with MSE is the biggest (22060.500669). This result allows the random forest regressor model to remain helpful life prediction of lithium-ion batteries.
6. Conclusions
This paper proposes a battery life prediction using a linear regression model, a random forest regressor model, and a decision tree regressor model with features designed based on a lithium-Ion battery voltage. The prediction results show high accuracy for Lithium-Ion batteries under different battery capacity conditions. All parts can be achieved in one discharge cycle. This advantage allows for an accurate lifecycle prediction model without historical data, making it more practical in real applications. The computation time is reasonable to achieve real-time prediction. This approach is well suited when Lithium-Ion batteries serve as energy storage or backup devices, such as data centers and grid-level energy storage. For the proposed solution to improve the predictive performance more accurately and reliably in the future, the research team will compare many machine learning or deep learning models to predict the battery's remaining capacity. At the same time, the lithium-Ion battery life prediction model combines with more designed features based on the lithium-Ion battery's voltage, current, temperature, and discharge time.
Author Contributions
All authors contributed equally to this paper. All authors have read and agreed to the published version of the manuscript.
Funding
This research received no external funding.
Institutional Review Board Statement
Not applicable.
Informed Consent Statement
Not applicable.
Data Availability Statement
Not applicable.
Acknowledgments
This project study was supported by all researchers and funding from University Transport and Communications.
Conflicts of Interest
The authors declare no conflict of interest
References
- Schmuch, R., Wagner, R., Hörpel, G., Placke, T. & Winter, M. Performance and cost of materials for lithium-based rechargeable automotive batteries. Nat. Energy 3, 267–278 (2018). [CrossRef]
- C. Zhu, F. Lu, H. Zhang and C. C. Mi, “Robust predictive battery thermal management strategy for connected and automated hybrid electric vehicles based on thermoelectric parameter uncertainty,” IEEE Journal of Emerging and Selected Topics in Power Electronics, vol. 6, no. 4, pp. 1796–1805, 2018. [CrossRef]
- Peterson, S. B., Apt, J. & Whitacre, J. F. Lithium-ion battery cell degradation resulting from realistic vehicle and vehicle-to-grid utilization. J. Power Sources 195, 2385–2392 (2010). [CrossRef]
- Ramadesigan, V. et al. Modeling and simulation of lithium-ion batteries from a system engineering perspective. J. Electrochem. Soc. 159, R31–R45 (2012). [CrossRef]
- Waag, W., Fleischer, C. & Sauer, D. U. Critical review of the methods for monitoring of lithium-ion batteries in electric and hybrid vehicles. J. Power Sources 258, 321–339 (2014). [CrossRef]
- C. Vidal, P. Kollmeyer, E. Chemali and A. Emadi, “Li-ion battery state of charge estimation using long short-term memory recurrent neural network with transfer learning,” in Proc. of IEEE Transportation Electrification Conf. and Expo (ITEC), Detroit, MI, USA, pp. 1–6, 2019.
- C. She, L. Zhang, Z. Wang, F. Sun, P. Liu et al., “Battery state of health estimation based on incremental capacity analysis method: Synthesizing from cell-level test to real-world application,” IEEE Journal of Emerging and Selected Topics in Power Electronics, vol. 10, no. 1, pp. 28–41, 2022. [CrossRef]
- Hu, X.; Li, S.; Peng, H. A comparative study of equivalent circuit models for Li-ion batteries. J. Power Sources 2012, 198, 359–367. [Google Scholar] [CrossRef]
- A. Samanta, S. Chowdhuri and S. S. Williamson, “Machine learning-based data-driven fault detection/di- agnosis of lithium-ion battery: A critical review,” Electronics, vol. 10, no. 11, pp. 1309, 2021.
- Su, X.; Wang, S.; Pecht, M.; Zhao, L.; Ye, Z. Interacting multiple model particle filter for prognostics of lithium-ion batteries, Microelectron. Reliab. 2017, 70, 59–69. [Google Scholar] [CrossRef]
- Sahinoglu, G.O.; Pajovic, M.; Sahinoglu, Z.; Wang, Y.B.; Orlik, P.V.; Wada, T. Battery state-of-charge estimation based on regular/recurrent Gaussian process regression. IEEE Trans.Ind.Electron. 2018, 65, 4311–4321. [Google Scholar] [CrossRef]
- Ng, S.; Xing, Y.; Tsui, K. A naive Bayes model for robust remaining useful life prediction of lithium-ion battery. Appl. Energy 2014, 118, 114–123. [Google Scholar] [CrossRef]
- Wang, D.; Miao, Q.; Pecht, M. Prognostics of lithium-ion batteries based on relevance vectors and a conditional three-parameter capacity degradation model. J. Power Sources 2013, 239, 253–264. [Google Scholar] [CrossRef]
- Liu, D.; Zhou, J.; Liao, H.; Peng, Y.; Peng, X. A health indicator extraction and optimization framework for lithium-ion battery degradation modeling and prognostics. IEEE Trans. Syst. Man Cybern. Syst. 2015, 45, 915–928. [Google Scholar] [CrossRef]
- Zhou, Y.; Huang, M.; Chen, Y.; Tao, Y. A novel health indicator for on-line lithium-ion batteries remaining useful life prediction. J. Power Sources 2016, 321, 1–10. [Google Scholar] [CrossRef]
- Zhou, Y.; Huang, M.; Chen, Y.; Tao, Y. A novel health indicator for on-line lithium-ion batteries remaining useful life prediction. J. Power Sources 2016, 321, 1–10. [Google Scholar] [CrossRef]
- Widodo, A.; Shim, M.; Caesarendra, W.; Yang, B. Intelligent prognostics for battery health monitoring based on sample entropy. Expert Syst. Appl. 2011, 38, 11763–11769. [Google Scholar] [CrossRef]
- Severson, K.A., Attia, P.M., Jin, N. et al. "Data-driven prediction of battery cycle life before capacity degradation." Nat Energy 4, 383–391 (2019). [CrossRef]
- Liu, Jie, et al. An adaptive recurrent neural network for remaining useful life prediction of lithium-ion batteries. National Aeronautics and Space Administration Moffett Field CA AMES Research Center, 2010.
- J. G. Zhu, Z. C. Sun, X. Z. Wei, and H. F. Dai, “A new lithium-ion battery internal temperature on-line estimate method based on electrochemical impedance spectroscopy measurement,” J. Power Sources, vol. 274, pp. 990–1004, Jan. 2015. [CrossRef]
- L. Ho-Ta, T. Liang, and S. M. Chen. "Estimation of battery state of health using probabilistic neural network." IEEE Transactions on Industrial Informatics, vol. 9, no. 2, pp. 436-451, 679-685, May 2013. [CrossRef]
- V. Nair, G. E. Hinton, “Rectified linear units improve restricted Boltzmann machines”, International Conference on Machine Learning (ICML), Haifa, Israel, June 2010, pp. 807-814.
- Liu, Jie, et al. An adaptive recurrent neural network for remaining useful life prediction of lithium-ion batteries. National Aeronautics and Space Administration Moffett Field CA AMES Research Center, 2010.
- Rezvani, Mohammad, Seungchul Lee, and Jay Lee. A comparative analysis of techniques for electric vehicle battery prognostics and health management (PHM). No. 2011-01-2247. SAE Technical Paper, 2011.
- Zhang, Yongzhi, et al. Long short-term memory recurrent neural network for remaining useful life prediction of lithium-ion batteries. IEEE Transactions on Vehicular Technology 67.7 (2018): 5695-5705. [CrossRef]
- Srivastava, Nitish, et al. Dropout: a simple way to prevent neural networks from overfitting. The Journal of Machine Learning Research 15.1 (2014): 1929-1958.
- Kingma, D. P., and J. L. Ba. Adam: A method for stochastic optimization. arXiv 2014. arXiv preprint arXiv:1412.6980 (2014).
- Li D, Yang L. Remaining useful life prediction of lithium battery using convolutional neural network with optimized parameters. In: IEEE 5th Asia Conference on Power and Electrical Engineering, 2020;840–44.
- Anagun Y, Isik S, Seke E. SRLibrary: Comparing different loss functions for superresolution over various convolutional architectures. J Visual Commun Image Represent 2019;61:178–87. [CrossRef]
- Richardson RR, Birkl CR, Osborne MA, Howey D. Gaussian process regression for in-situ capacity estimation of lithium-ion batteries. IEEE Trans Ind Inform 2019;15 (1):127–38. [CrossRef]
Figure 1.
Observable discharge power curve, and the color of the curve changes along the spectrum over the life cycle.
Figure 1.
Observable discharge power curve, and the color of the curve changes along the spectrum over the life cycle.
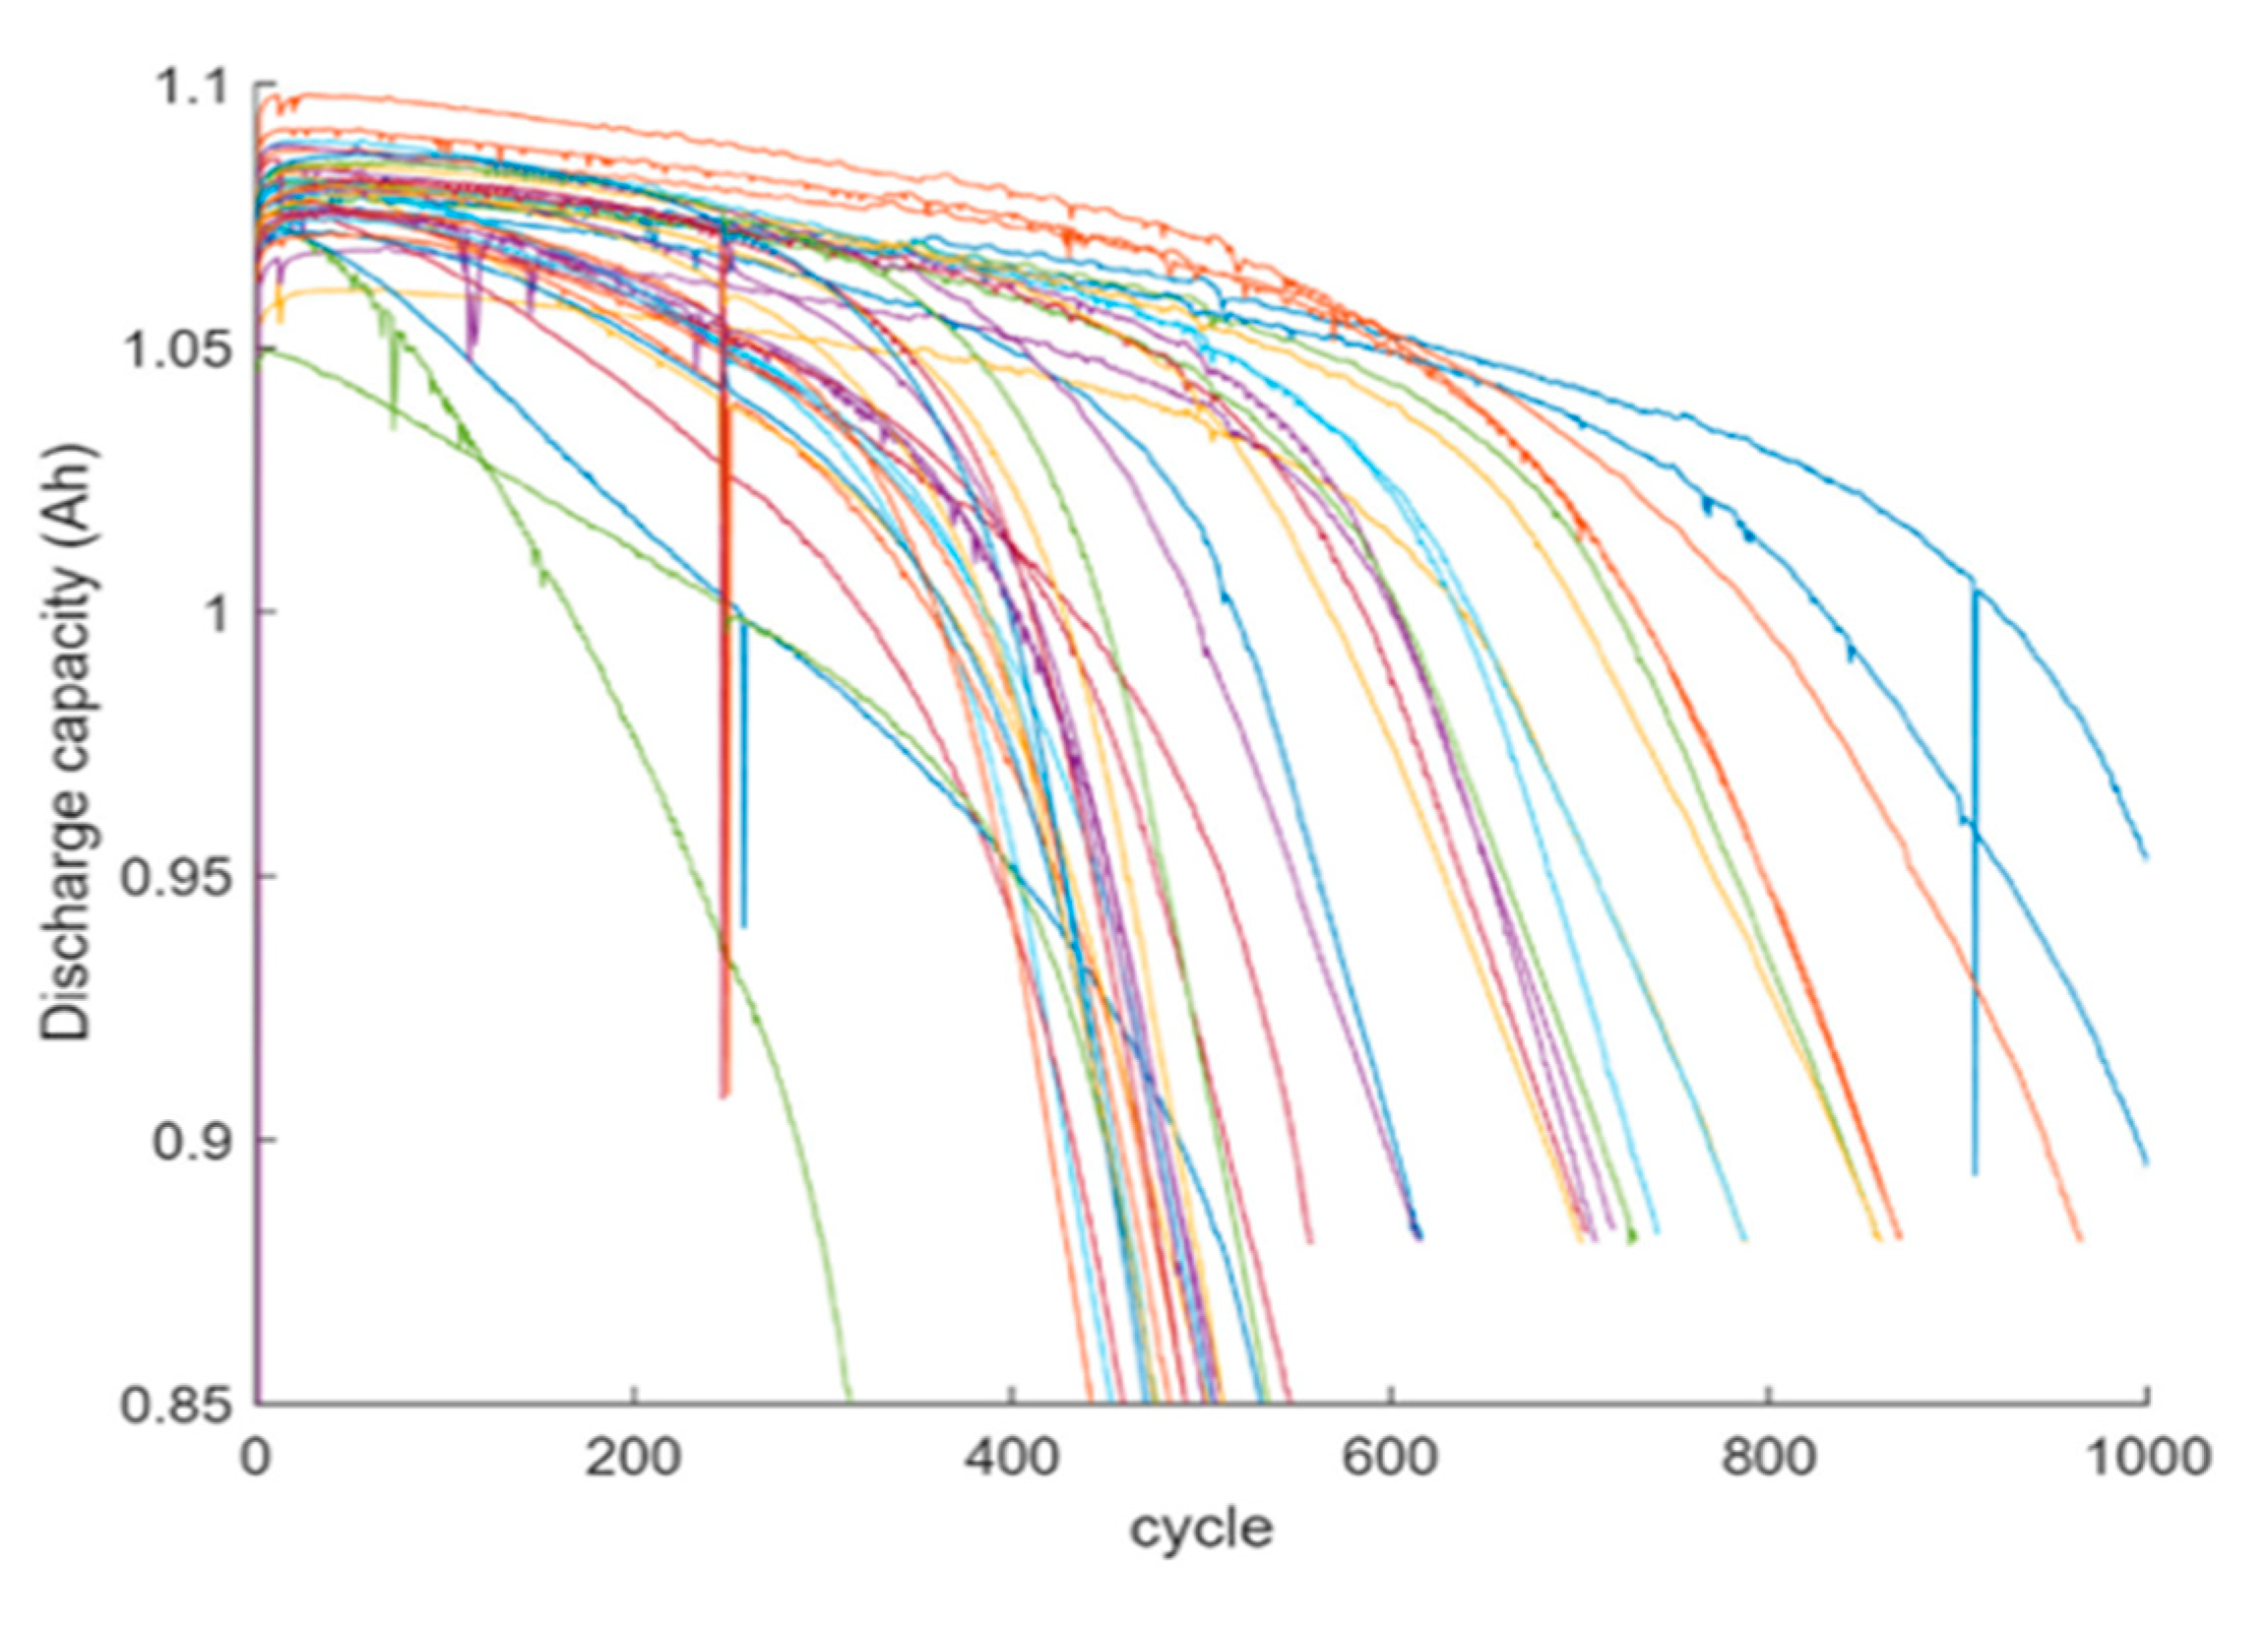
Figure 2.
Each voltage-discharge power relationship is different from the 100th and 10th cycles .
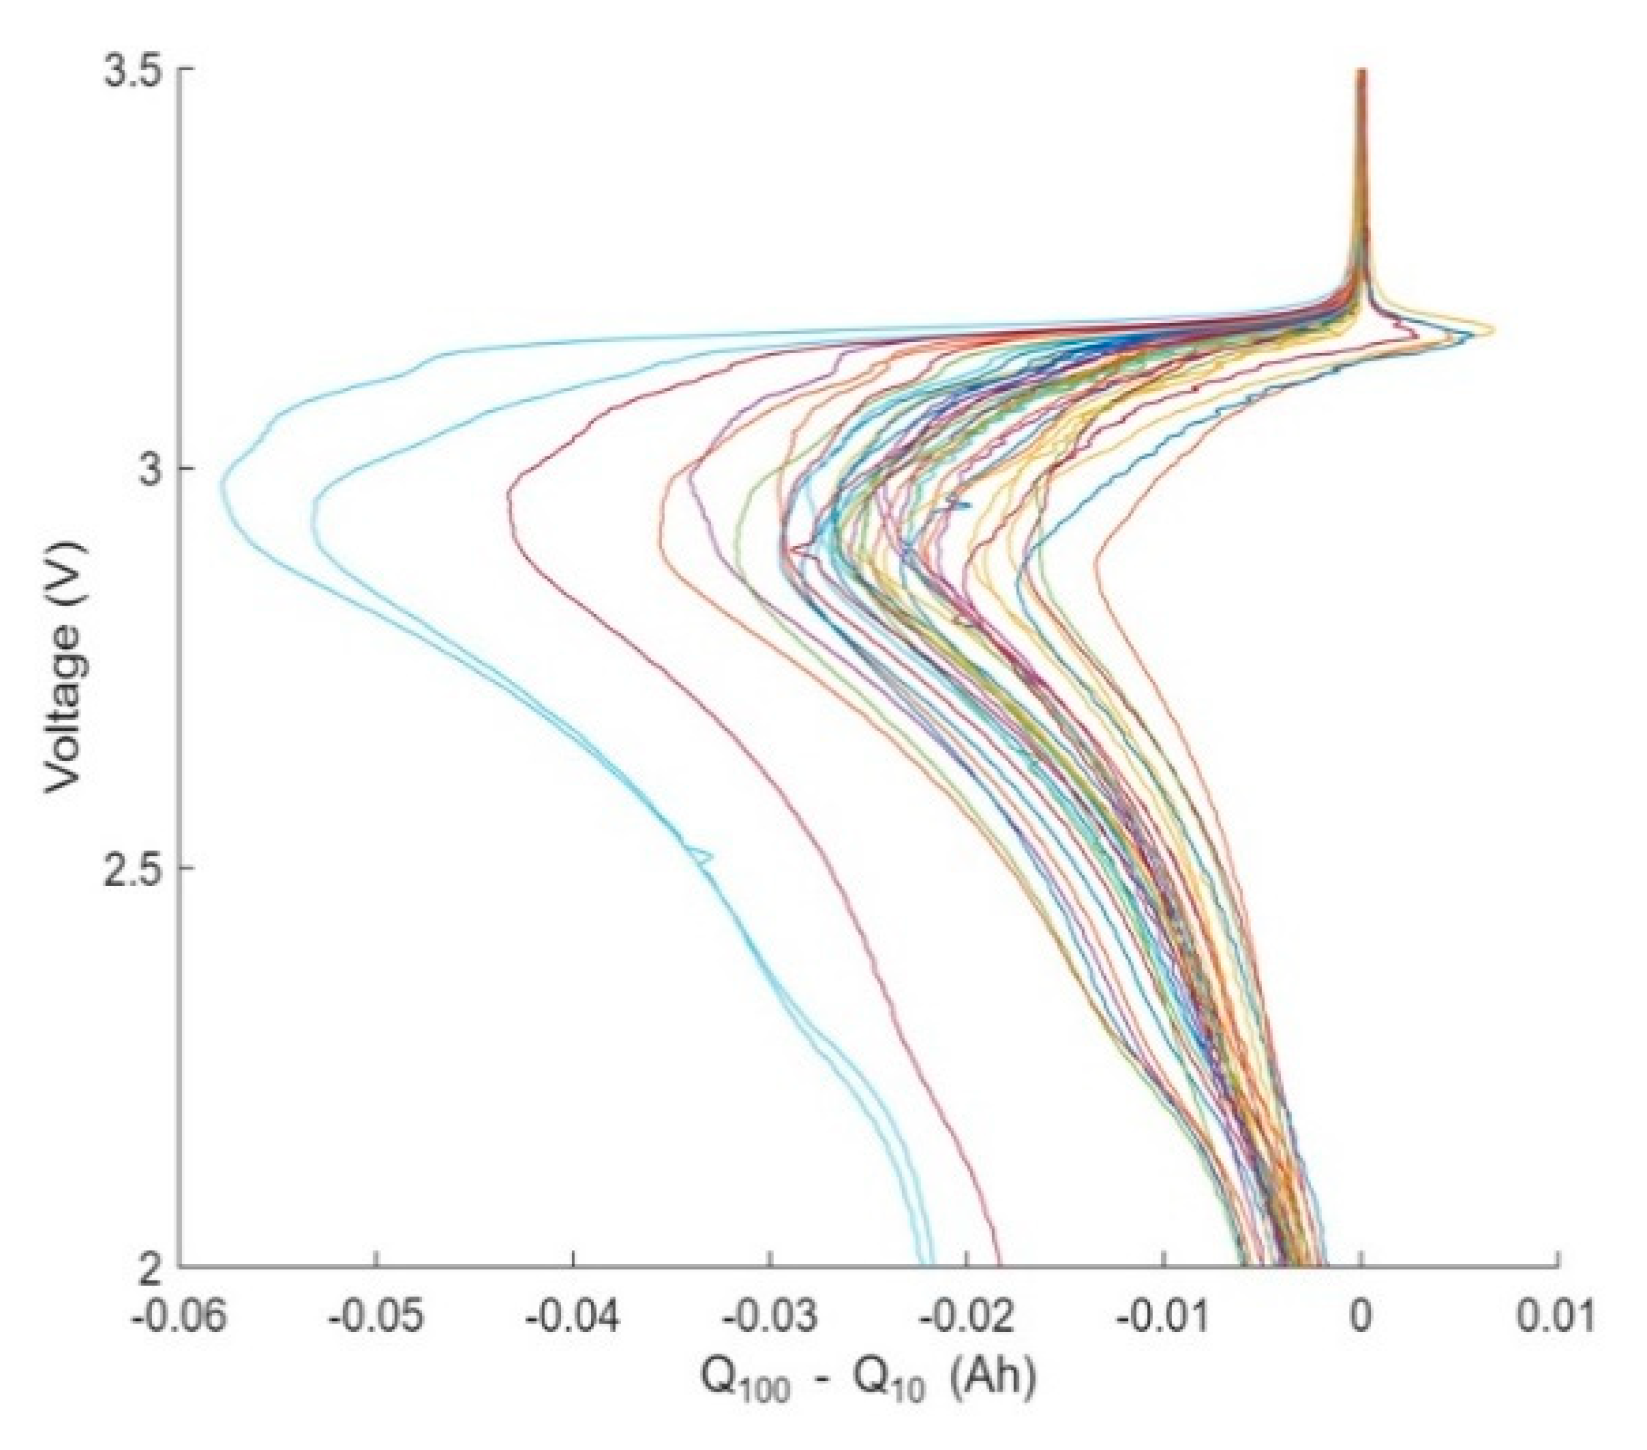
Figure 3.
Relationship coefficient between PDj and Lj.
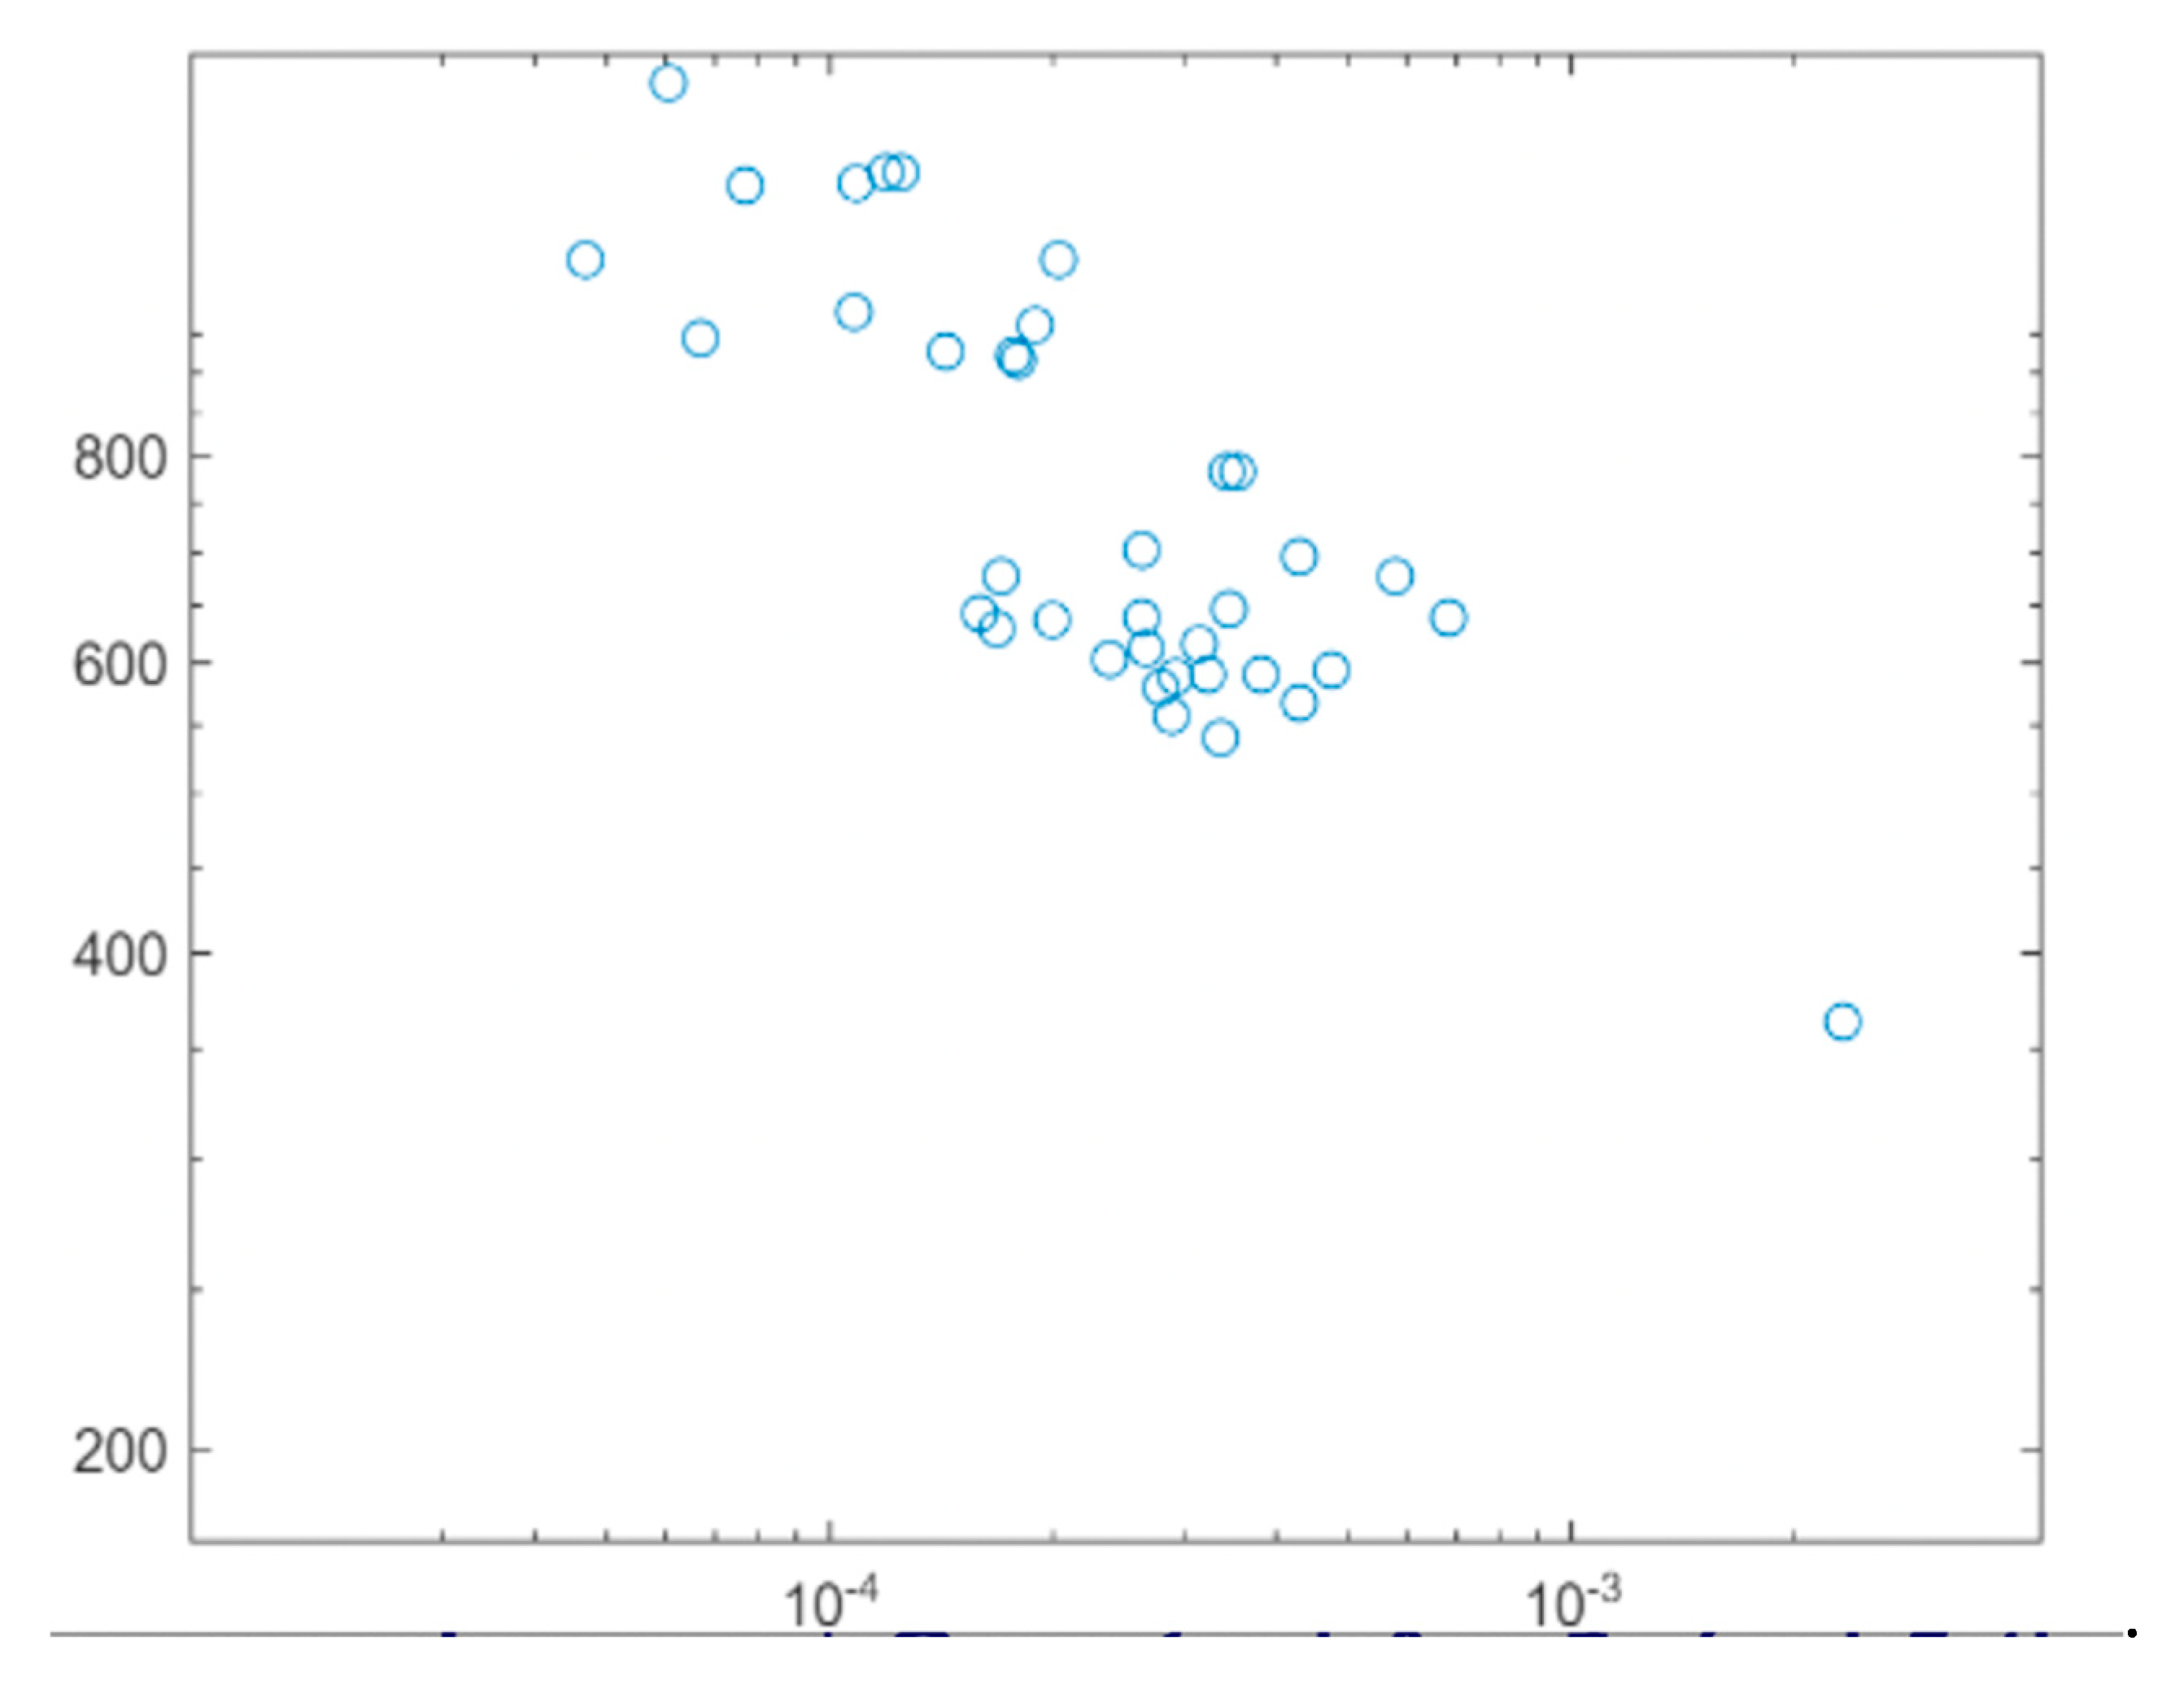
Figure 4.
Linear regression model cycles .
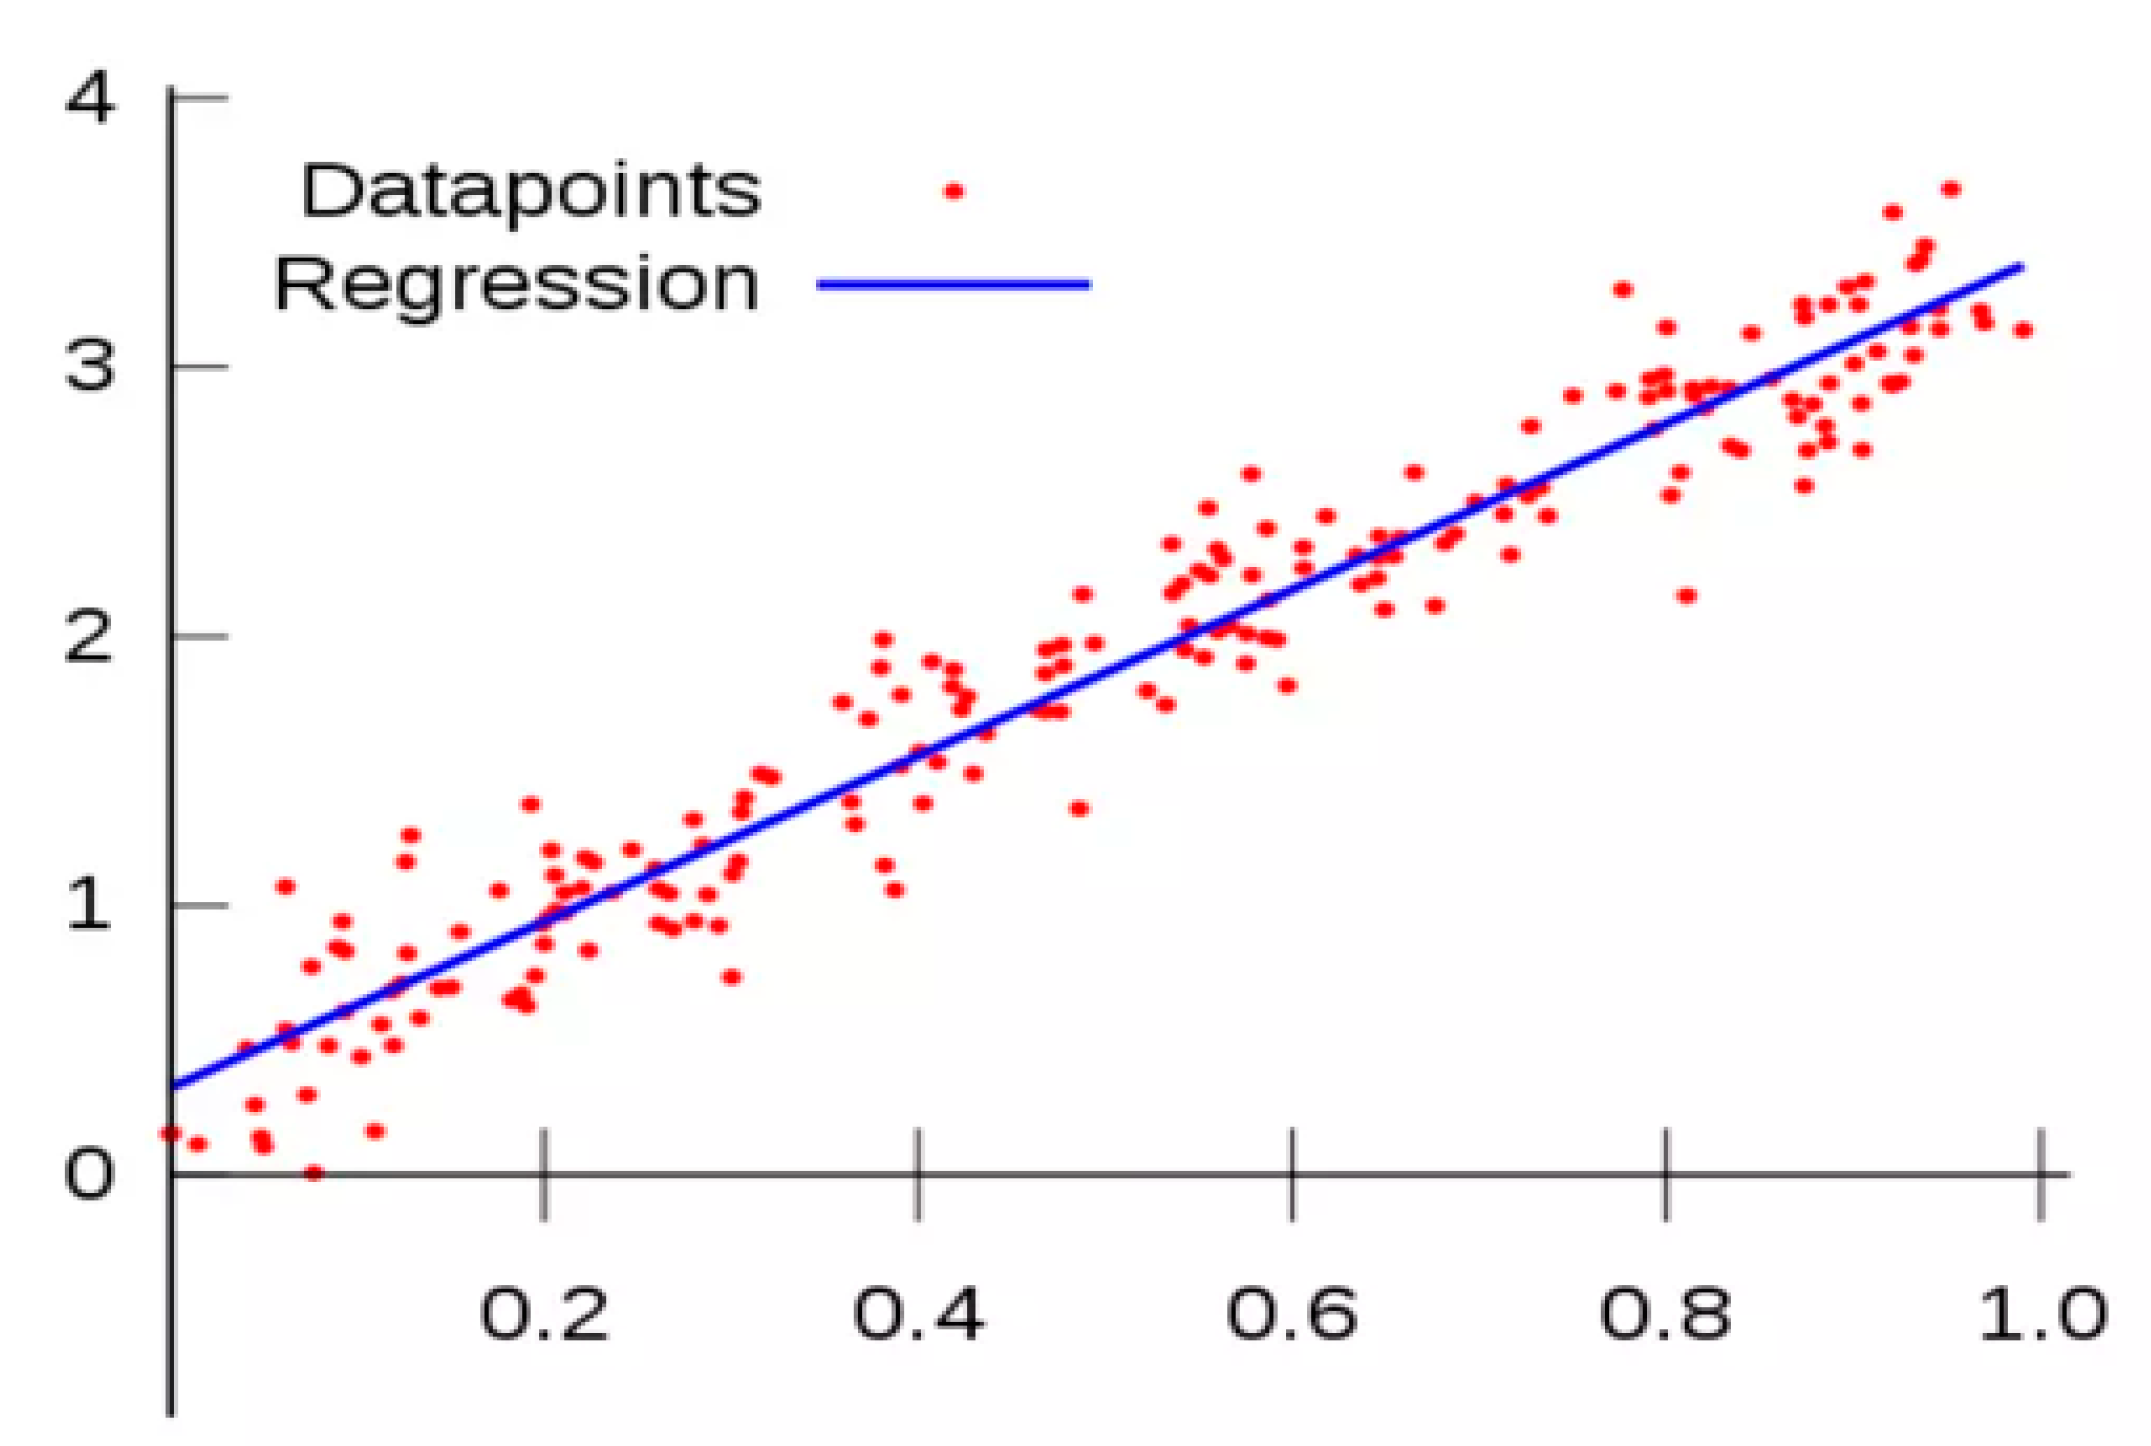
Figure 5.
Structure of random forest regressor algorithm.
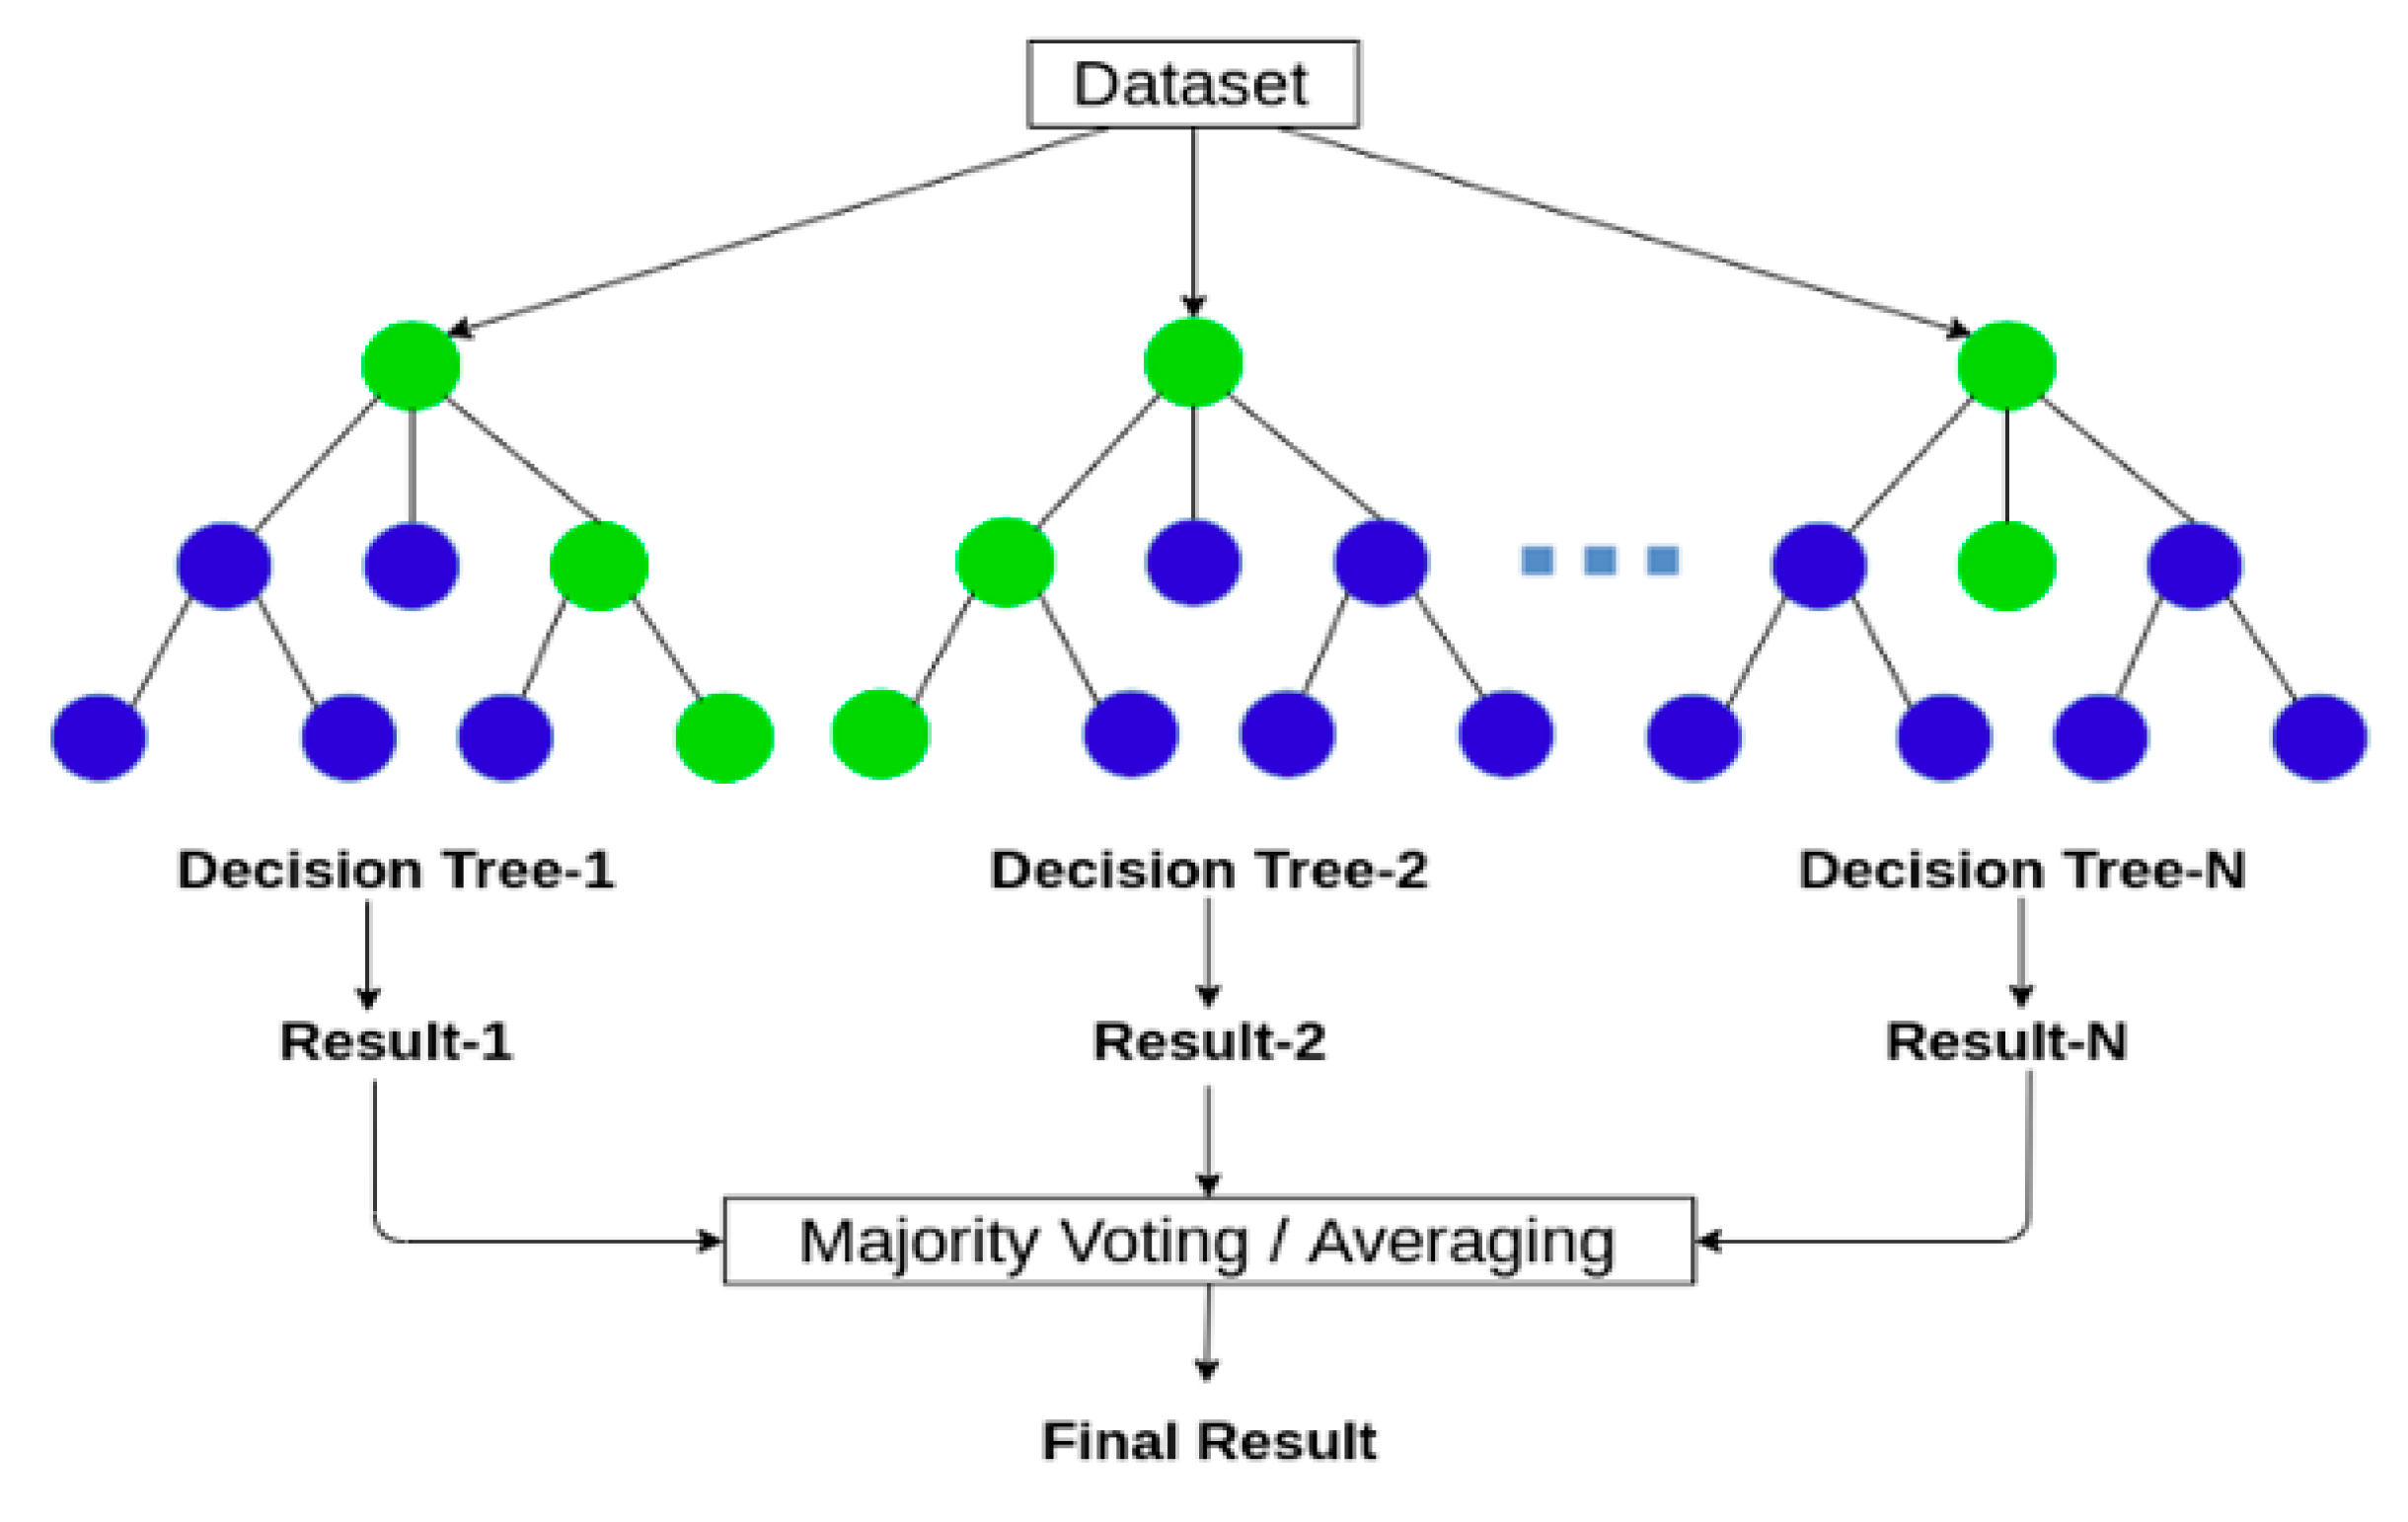
Figure 6.
Structure of experiment model to predicted life of Lithium-Ion.
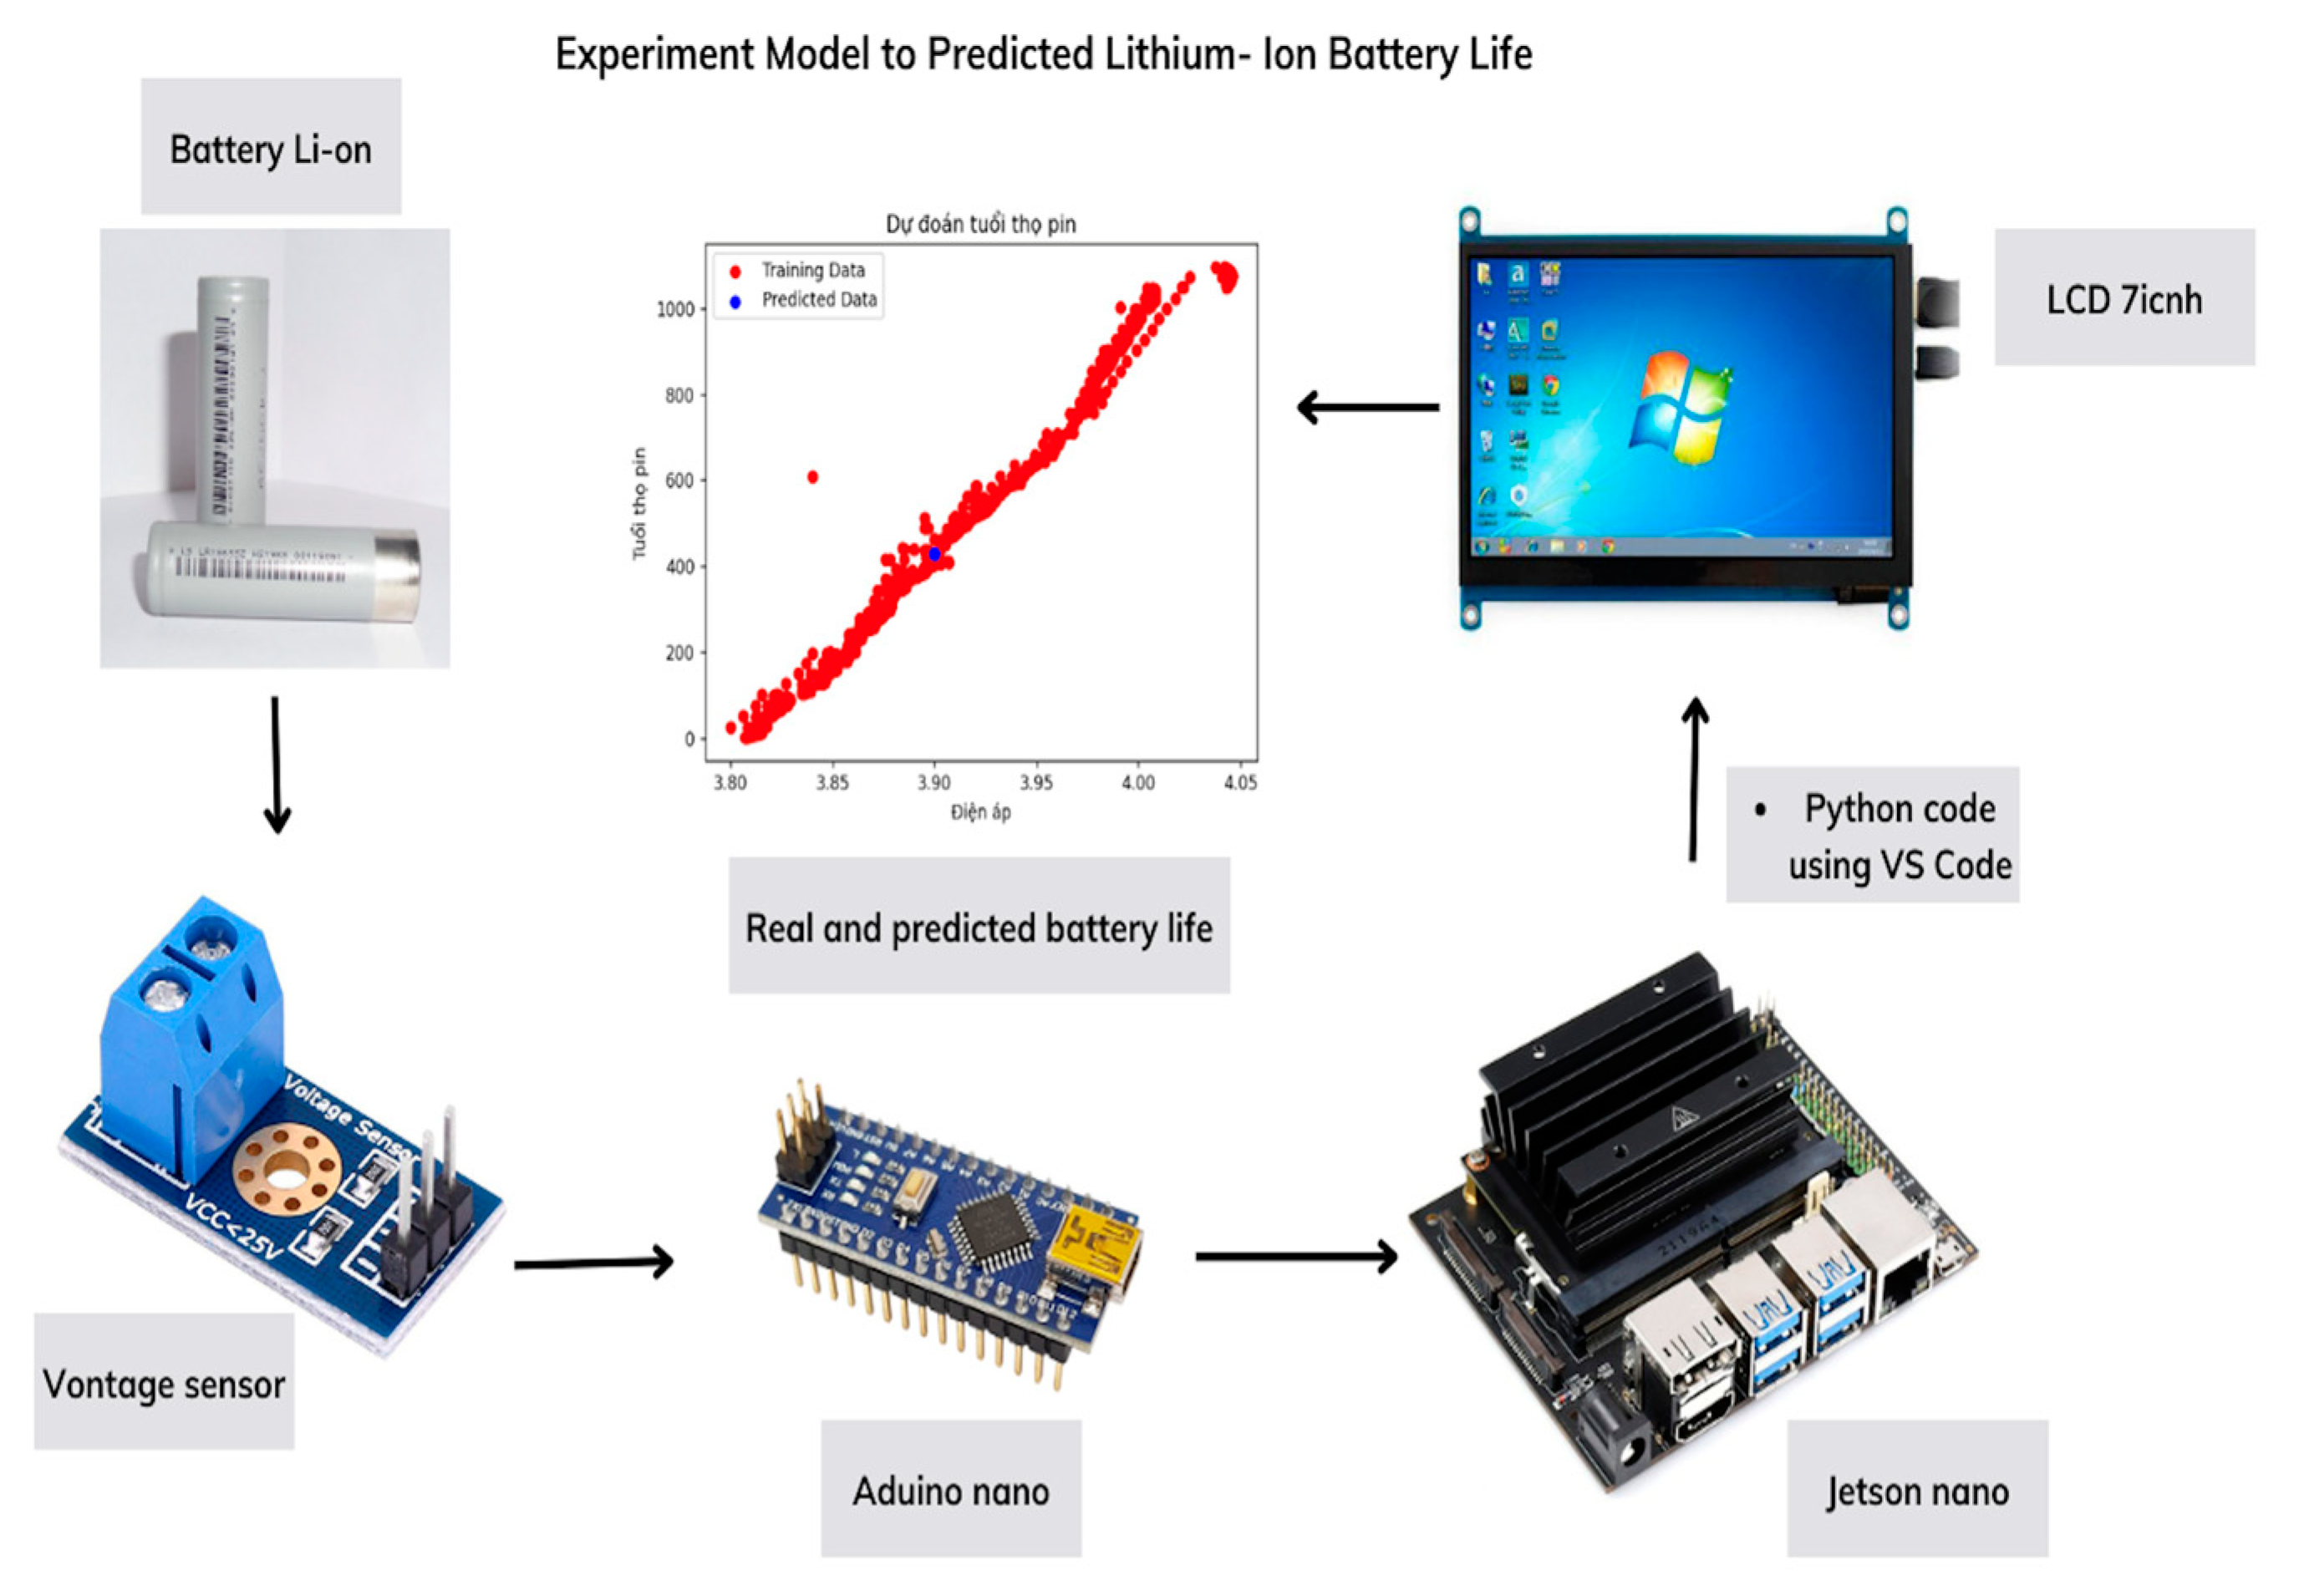
Figure 7.
Experiment model to predicted life of lithium-Ion battery.
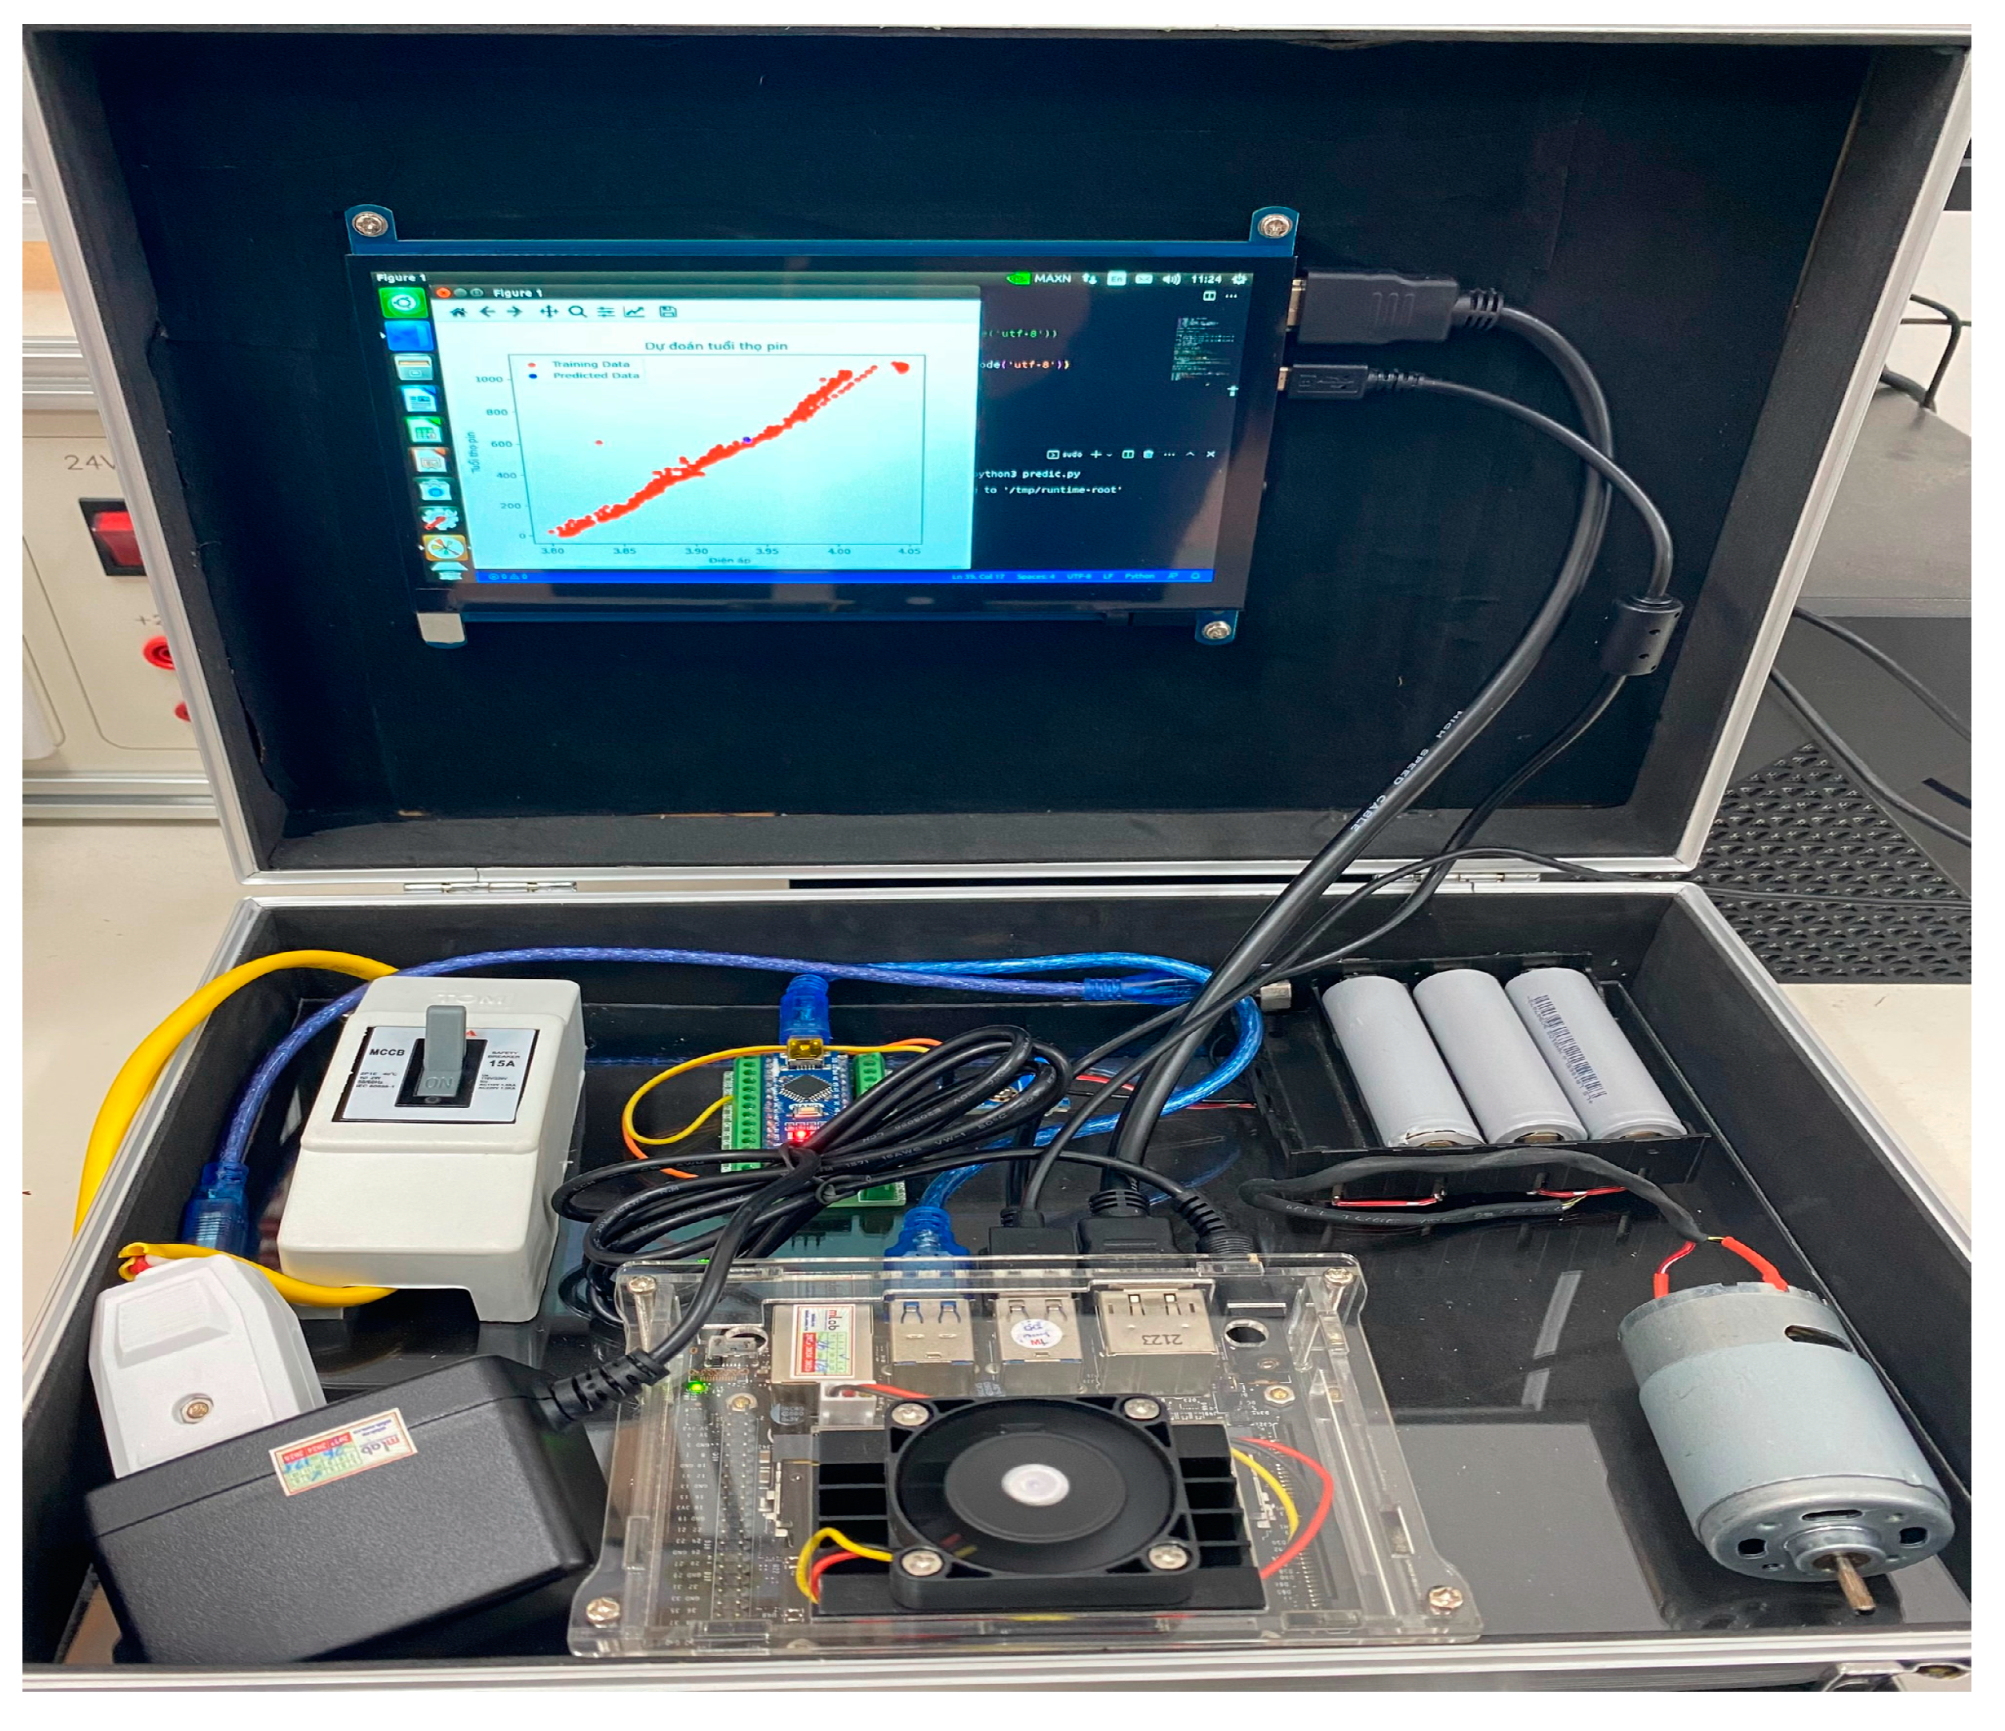

Table 1.
The MSE and RMSE results of three regression models.
| Regression model | MSE | RMSE |
|---|---|---|
| Linear regression | 22060.500669 | 148.527777 |
| Random Forest Regressor | 516.332762 | 22.722957 |
| Decision Tree Regressor | 1337.112429 | 36.566548 |
Disclaimer/Publisher’s Note: The statements, opinions and data contained in all publications are solely those of the individual author(s) and contributor(s) and not of MDPI and/or the editor(s). MDPI and/or the editor(s) disclaim responsibility for any injury to people or property resulting from any ideas, methods, instructions or products referred to in the content. |
© 2023 by the authors. Licensee MDPI, Basel, Switzerland. This article is an open access article distributed under the terms and conditions of the Creative Commons Attribution (CC BY) license (http://creativecommons.org/licenses/by/4.0/).
Copyright: This open access article is published under a Creative Commons CC BY 4.0 license, which permit the free download, distribution, and reuse, provided that the author and preprint are cited in any reuse.


