Submitted:
13 June 2023
Posted:
14 June 2023
You are already at the latest version
Abstract
Necrotic enteritis (NE) is an intestinal disease that results in poor performance, inefficient nu-trient absorption, and has a devastating economic impact on poultry production. This study evaluated the effects of a saponin-based product (Clarity Q [CQ]) during a NE challenge. A to-tal of 1,200 male chicks were randomly assigned to four dietary treatments (10 pens/treatment; 30 birds/pen): treatment 1 (NC): a non-medicated corn-soybean basal diet; treatment 2 (PC) NC + 50 g/metric ton (MT) of Bacitracin methylene disalicylate (BMD); treatments 3 (CQ15) and 4 (CQ30) NC + 15 and 30 g/MT, respectively. On day (d) of placement, birds were challenged by a coccidia vaccine to induce NE. On d 8, 14, 28, and 42, performance parameters were measured. On d 8, three birds/pen were necropsied for NE lesions. On d 8 and d 14, jejunum samples from one bird/pen were collected for mRNA abundance of tight junction proteins and nutrient trans-porter genes. Data were analyzed in JMP (JMP Pro, 16) and significance (P ≤ 0.05) between treatments identified by Fisher’s least significant difference (LSD) test. Compared to PC and NC, CQ15 had higher average daily gain (ADG), while CQ30 had lower average daily feed in-take (ADFI) and feed conversion ratio (FCR). NE lesions in the duodenum were lower in CQ15 compared to all other treatments. On d 8, mRNA abundance of CLDN1, CLDN5, AMPK, PepT2, GLUT2, and EAAT3 were significantly greater in CQ30 (P < 0.05) compared to both PC and NC. On d 14, mRNA abundance of ZO2 and PepT2 was significantly lower in PC when compared to all treatments, while that of ANXA1, JAM3, and GLUT5 was comparable to CQ15. In summary, adding Clarity Q to broiler diets has the potential to alleviate adverse effects caused by this enteric disease by improving performance, reducing intestinal lesions, and positively modulating the mRNA abundance of various tight junction proteins and key nutrient transporters during peak NE infection.
Keywords:
Necrotic enteritis
; saponin
; chicken
; performance
; tight junctions
1. Introduction
Clostridium perfringens alpha toxin (CPA) and the necrotic enteritis B like pore forming toxin (NetB) are produced by this anaerobic bacterium reported as the causative agent of necrotic enteritis (NE) in poultry [1,2,3]. NE is of economic importance to the industry as it has been estimated to cost approximately $6 billion in yearly losses [4,5]. To control pathogenic bacteria, sub-therapeutic doses of in-feed antibiotics have been used to improve broilers' welfare and overall productivity [6,7]. However, with consumer demands for chickens raised without antibiotics and legislative restrictions, the poultry industry is looking to raise more flocks without antibiotic growth promoters (AGPs) [8,9]. However, with the removal of AGPs, incidences of NE have increased, leading the industry to find alternative strategies to improve bird health during this enteric challenge [10,11].
One strategy currently being studied to reduce enteric diseases is nutritional interventions like phytogenic-based feed additives [12,13,14,15]. Phytogenic feed additives (PFA) are plant-derived bioactive compounds incorporated into animal feed or water [16,17,18]. They can improve productivity, available dietary energy, nutrient digestibility, innate immunity and host disease resistance, alter the gut microbiota, decrease the prevalence of pathogens, and prevent bacterial colonization of the gastrointestinal tract [15,19]. Quillaja saponaria (QS) is classified as a PFA that is both fat and water-soluble [20,21,22]. It is thought that the mechanism of action is their ability to penetrate the cell membrane affecting cellular permeability, which leads to leakage of critical molecules and ions from harmful bacteria [23,24,25]. However, there is still an ongoing need to alleviate the adverse effects caused by enteric diseases, as well as the need to better understand how these saponins improve performance and health. The central hypothesis was that Clarity Q would have a positive effect on birds’ performance and response during this subclinical NE model. Therefore, this study was conducted to determine the effects of the saponin based product Clarity Q on average daily gain (ADG), average daily feed intake (ADFI), feed conversion ratio (FCR), NE lesion scores, mRNA abundance of tight junction proteins, energy signaling pathways, and essential nutrient transport genes of broiler chickens during an NE challenge.
2. Materials and Methods
Day (d)-old Cobb male broiler chicks (n=1,200) were sourced from a local hatchery and randomly weighed and allocated to 4 treatment groups with each treatment consisting of 10 replicate pens and 30 birds per pen. Floor pens were ~1.22m × 2.44m and covered with fresh pine shavings as litter. The treatments included a negative control (NC) with birds fed a corn-soybean meal basal diet, a positive control (PC) fed the NC diet with bacitracin methylene disalicylate (BMD) at 50 g/metric ton (MT), and Clarity Q (CQ) added at 15 (CQ15) or 30 g/MT (CQ30). The diets were crumbled for the starter phase (d 0-14) and pelleted for the grower (d 15-28) and finisher (d 29-42) phases (Table 1). Chicks had access to feed and water ad libitum using a bucket-type feeder and a nipple drinker waterline. The light cycle was 24 h of light for the first three days, reduced to 23h: 1 h for d 4-7, and then reduced to 18 h of light and 6 h of dark for the remaining duration of the trial. An automatic ventilation system was used to control the environment, and the temperature was maintained as follows: 32°C for the first 3 days, then gradually reduced ~3°C each week until it reached 23°C at the start of week 4 where it remained constant. This study was conducted under the Institutional Animal Care and Use Committee guidelines.
2.1. Performance
Starting at placement, birds were monitored twice daily. Birds were weighed on d 8, 14, 28, and 42 on a per pen basis. If dead birds were found, date, body weight, and cause of death were recorded. This procedure continued throughout the 42 d trial to record mortality/treatment for each phase thus allowing for adjusting performance parameters such as body weight (BW), average daily gain (ADG), average daily feed intake (ADFI), feed conversion ratio (FCR) and, adjustments for daily mortality.
2.2. Necrotic Enteritis Challenge and Lesion Scoring
As previously done in our lab, on day of placement, feed and litter were sprayed with 10 × coccidiosis vaccine (Advent®; Huvepharma, Inc) containing live oocysts of Eimeria acervulina, E. maxima, and E. tenella [26,27,28]. When coupled with the presence of C. perfringens spores in the barn environment, this leads to the development of a NE outbreak around one week after vaccine application [26,27,28]. On d 8, based on average body weight of each pen, 3 birds were randomly selected and euthanized via cervical dislocation and the small intestine was removed to examine NE lesions. The duodenum and jejunum were scored separately based on a 0-4 scale system: 0 = no gross lesions, normal intestinal appearance; 1 = thin-walled or friable, gray appearance; 2 = thin-walled, focal necrosis, gray appearance, small amounts of gas production; 3 = thin-walled, sizable patches of necrosis, gas-filled intestine, small flecks of blood; 4 = severe extensive necrosis, marked hemorrhage, large amounts of gas in the intestine [29] by personnel blinded to the treatments.
2.3. Total RNA Extraction and Reverse Transcription
On d 8 and d 14, one bird from each pen) was humanely euthanized and ~2-cm sample immediately cut from the middle section of the jejunum, rinsed in cold PBS, snap-frozen in liquid nitrogen, and stored at −80℃ until analysis. The samples were homogenized by a bead mill homogenizer (TissueLyser II, Qiagen) and total RNA was extracted with Trizol reagent following the manufacturer's instructions (ZYMO Research, Direct-zol RNA Miniprep). Total RNA concentration was determined at optical density (OD) 260 (Nanodrop 1, Thermo Fisher), and RNA purity was verified by evaluating the ratio of OD 260 to OD 280. After extraction, 2 μg of total RNA were reverse-transcribed into cDNA using the high-capacity cDNA Reverse Transcription kit (Applied Biosystems) following the manufacturer's protocol, and the cDNA was stored at −20°C.
2.4. Quantitative Real-Time PCR
Quantitative real-time PCR (qRT-PCR) was performed using the QuantStudio 3 (Applied Biosystems) using PowerTrak Fast SYBRTM Green Master Mix (Applied Biosystems). The cDNA was diluted 1:20 in nuclease-free water, and 1.5 μL of the diluted cDNA were added to each well of a 96-well plate. Next, 8.5 μL of real-time PCR master mix containing 5 μL of Fast SYBR Green Master Mix (Applied Biosystems), 0.5 μL each of forward and reverse primers (Table 2), and 2.5 μL of sterile nuclease-free water were added to each well for a final reaction volume of 10 μL. During the PCR reaction, samples were subjected to an initial denaturation phase at 95°C for 120 s followed by 40 cycles of denaturation at 95°C for 5 s and annealing and extension at 60°C for 30 s. Each target reaction was performed in duplicate wells. Product specificity was confirmed by analysis of the melting curves produced by the QuantStudio 3. mRNA abundances for tight junction proteins occludin (OCLN), claudin (CLDN) 1 and 5, zonula occludens (ZO) 1 and 2, and junctional adhesion molecules (JAM) 2 and 3, as well as the nutrient transporter genes excitatory amino acid transporter 3 (EAAT3), glucose transporter (GLUT) 2 and 5, peptide transporter (PepT) 1 and 2, and sodium glucose transporter (SGLT) 1 were analyzed using glyceraldehyde-3-phosphate dehydrogenase (GAPDH) as an endogenous control. Cellular energy homeostasis pathways were also analyzed via AMP-activated protein kinase (AMPK), mammalian target of rapamycin (mTOR), and peroxisome proliferator activated receptor gamma coactivator one alpha (PGC-1α), as well as mucin 2 (MUC2), pro-inflammatory gene tumor necrosis factor receptor associated factor 3 (TRAF3) and anti-inflammatory gene Annexin (ANXA1). Average mRNA abundance relative to GAPDH for each sample was calculated using the 2−ΔΔCt method. The calibrator for each gene was the average ΔCt value from the negative control group of each corresponding day.
2.5. Statistical Analysis
All data were subjected to a one-way ANOVA using the JMP Pro 16 program, a Chi-squared test was used for lesion scores. The Fisher’s least significant difference (LSD) test compared separated means when significant differences were noted. Statistical differences were considered significant at P ≤ 0.05.
3. Results
3.1. Performance Parameters
Performance data are presented in Table 3. Body weight displayed no significant difference between treatments throughout the 42 d trial. However, both CQ15 and CQ30 had numerically higher weights on d 28 (1,381.27 and 1,389.33 g/bird, respectively) and 42 (3,165.79 and 3097.07 g/bird, respectively) compared to NC and PC. Average daily gain was similar for all treatments during the first two weeks. During d 0-28, the PC (55.59 g/bird) and CQ15 (55.81 g/bird) groups had significantly greater ADG compared to CQ30 (53.09 g/bird) but were comparable to NC. Average daily feed intake in CQ30 and NC were lower compared to CQ15, but comparable to PC during d 9-14 and d 0-14. Overall (d 0-42), CQ30 had a numerically lower ADFI and FCR compared to all other treatments.
3.2. Mortality Rate
Mortality rate is presented in Figure 1. There were no statistical differences amongst treatment, however both CQ supplemented treatments showed a reduction in percent mortality compared to NC and PC.
3.3. Necrotic Enteritis Lesion Scores
The effect of the dietary supplementation of the saponin-based product Clarity Q on necrotic lesions is presented in Figure 2. On d 8, although there were no statistical differences in lesion scores amongst treatments, CQ15 and PC supplements reduced NE lesions in the duodenum and jejunum, respectively, compared to all other treatments.
3.4. mRNA Abundance of Tight Junction Proteins, Cellular Energy Homeostasis Pathways, and Nutrient Transporters
Figure 3, Figure 4 and Figure 5 show the effects of dietary supplementation of the saponin-based product Clarity Q on mRNA abundance of genes for tight junction proteins, markers of cellular energy homeostasis, and nutrient transporters. On d 8 (peak infection), CQ30 birds exhibited a significantly greater abundance of CLDN1 and CLDN5 (P = 0.0016 and P = 0.0038 respectively) compared to NC and PC, as well as AMPK compared to all other treatments. Both CQ15 and CQ30 treatment groups exhibited greater abundance of EAAT3, GLUT2, and PepT2 compared to NC. GLUT5 mRNA abundance was greater in PC birds (P < 0.0001) compared to all treatments. On d 8 and d 14, abundance of MUC2 and PGC1-α was significantly lower in CQ15 and CQ30 compared to NC and PC. On d 14 (recovery phase), OCLDN, CLDN1, JAM2, and ZO1 showed a significantly lower abundance in CQ15 and CQ30 compared to NC and PC. However, mRNA abundance of ZO2 was significantly greater in CQ30 compared to all other groups. Annexin 1 was significantly reduced in CQ30 while that of PepT1 was lower compared to NC and PC on d 14; and PepT2 was greater in CQ15 and CQ30 compared to NC and PC.
4. Discussion
Subclinical NE inflicts one of the greatest economic impacts in poultry production mostly due to reduction in feed efficiency [30]. In the current study, CQ30 showed a reduction in ADFI on d 9-14 and d 0-14 and caused a slight decrease in ADFI during the overall experimental period. This contributed to the overall better FCR in the CQ30-supplemented group although these results were not statistically significant. Moreover, PC and CQ15 groups significantly increased ADG compared to CQ30 during d 0-28, showcasing that CQ supplementation could promote broiler performance similarly to an AGP. Similar studies have shown results supporting both positive and no effects of phytogenics on feed conversion under normal conditions or after a challenge with C. perfringens [31,32,33,34,35]. These varying effects on performance are not uncommon amongst studies and could be associated with the health of the flock, type of basal diet, and environmental conditions.
Damage to the intestinal mucosa is an important factor for C. perfringens colonization and the presence of a coccidial infection is the most common causative factor facilitating C. perfringens pathogenesis [2]. Intestinal lesion scores are used to assess the severity of NE [26,27,36] and low scores are indicative of subclinical cases as presented herein. Although CQ15 displayed the lowest recorded lesions in the duodenum during peak infection (d 8), there was not a significant effect on lesions in either the duodenum or jejunum. A decrease in lesions could be an indication of a more intact, healthy, and functioning gut.
Tight junction proteins play an important role in gut integrity and homeostasis and are constantly remodeling in response to external stimuli in the gut lumen such as nutrients and commensal or pathogenic microbes [34,35,36]. The claudin family is a major component of tight junctions because it is an adhesion membrane protein, and several members are receptors for the bacterial toxins produced by C. perfringens [37]. Tight junctions are not the only first line of defense in maintaining the intestinal barrier; MUC2 is produced by goblet cells and is considered a biomarker of intestinal health because it reduces microbial adhesion to the mucosa [38,39]. Coccidia infection has been shown to increase mucus production which can contribute rapid proliferation of C. perfringens by providing protein-rich nutrients because of the damage caused to the host cell [40]. Our findings suggest that supplementing the diet with CQ increased the mRNA abundance of CLDN1 and CLDN5. Claudin 1 and occludin are markers for regulation of the tight junction paracellular permeability barrier, and they help seal the space between two enterocytes avoiding the translocation of any harmful molecule from the intestinal lumen into the underlying tissue and bloodstream [37]. mRNA abundance of JAM3 and MUC2 were lower in the jejunum of supplemented groups opposite to that of ZO2 in the same tissues. This variation in abundance could be associated with better intestinal integrity and lower permeability in the CQ supplemented groups which can also be demonstrated by the reduction in lesions.
Both AMPK and PGC1α are important in regulating energy metabolism within cells and play an essential role in intestinal health [36,41]. While ANXA1, is important in the clearance of inflammation and restoration of mucosal homeostasis [42]. The current findings suggest that dietary supplementation of CQ can increase the abundance of AMPK during peak infection, while slightly lowering the abundance of PGC1α during the recovery period. Since immune responses are energy demanding and tend to divert nutrients from growth resulting in reduced performance [27], a decrease in PGC1α could be the result of nutrients being directed towards growth rather than for mounting an immune response in the CQ supplemented groups. The release of ANXA1 in the epithelial lining during peak infection could prevent the adverse effects caused by NE by inducing mucosal restoration and clearance of inflammation.
An intact epithelium prevents the entry of potential pathogens and results in optimal performance and increases the bird’s ability to better absorb and utilize nutrients [2]. Clarity Q at 30g/MT expressed greater mRNA abundance of EAAT3, GLUT- 2, and PepT-2. Differences in the relative abundance of intestinal transporters such as PepT1, GLUT2, and EAAT3 are known to affect body weight, weight gains, and FCR in broilers [43]. Excitatory amino acid transporter 3 has also shown beneficial in initiating the amino acid dependent cell signaling in the mTOR pathway [40]. Nutrient transporters at the apical membrane of the small intestine are essential in moving nutrients into the enterocytes [44]. During dietary supplementation of saponins, SGLT1 and PepT1 have shown to increase cytoplasmic membrane recruitment, which has a positive effect on body weight and FCR in broilers [45]. In general, PepT1 is predominantly expressed in the small intestine and its expression is upregulated in response to diet, malnourishment, and growth factors and could be a mechanism for using abundant resources or to compensate for the lack thereof [46,47]. This increased activity of disaccharides could also be attributed to an increase substrate presence at the apical membrane and can enhance the development of intestinal villi, which is important for efficient nutrient absorption and digestion [48].
Under this subclinical NE challenge model when broilers were supplemented with Clarity Q, the presented data showed a reduction in duodenal lesion scores on d 8 and a slightly improved FCR during the overall grow-out period. The results also showed a positive modulation in mRNA abundance of several tight junction proteins and nutrient transporter genes. As such, dietary supplementation of Clarity Q can potentially assist birds during an enteric disease challenge.
Declaration of Interest
The authors declare no conflict of interest.
References
- Rood, J.I.; Adams, V.; Lacey, J.; Lyras, D.; McClane, B.A.; Melville, S.B.; Moore, R.J.; Popoff, M.R.; Sarker, M.R.; Songer, J.G.; Uzal, F.A.; Van Immerseel, F. Expansion of the Clostridium perfringens toxin-based typing scheme. Anaerobe. 2018, 53, 5–10. [Google Scholar] [CrossRef] [PubMed]
- Emami, N.K.; Dalloul, R.A. Centennial Review: Recent developments in host-pathogen interactions during necrotic enteritis in poultry. Poult. Sci. 2021, 100, 101330. [Google Scholar] [CrossRef] [PubMed]
- Lepp, D.; Zhou, Y.; Ojha, S.; Mehdizadeh Gohari, I.; Carere, J.; Yang, C.; Prescott, J.F.; Gong, J. Clostridium perfringens produces an adhesive pilus required for the pathogenesis of necrotic enteritis in poultry. J. Bacteriol. 2021, 203. [Google Scholar] [CrossRef] [PubMed]
- Timbermont, L.; Haesebrouck, F.; Ducatelle, R.; Van Immerseel, F. Necrotic enteritis in broilers: an updated review on the pathogenesis. Avian Pathol. 2011, 40, 341–347. [Google Scholar] [CrossRef] [PubMed]
- Wade, B.; Keyburn, A.L. The true cost of necrotic enteritis. World Poult. 2015, 31, 16–17. [Google Scholar]
- Bedford, M. Removal of antibiotic growth promoters from poultry diets: implications and strategies to minimize subsequent problems. World’s Poult. Sci. J. 2000, 56, 347–365. [Google Scholar] [CrossRef]
- Dibner, J.J.; Richards, J. D. Antibiotic growth promoters in agriculture: history and mode of action. Poult. Sci. 2005, 84, 634–643. [Google Scholar] [CrossRef]
- Van Immerseel, F.; Rood, J.I.; Moore, R.J.; Titball, R.W. Rethinking our understanding of the pathogenesis of necrotic enteritis in chickens. Trends Microbiol. 2009, 17, 32–36. [Google Scholar] [CrossRef]
- Adhikari, P.; Kiess, A.; Adhikari, R.; Jha, R. An approach to alternative strategies to control avian coccidiosis and necrotic enteritis. J. Appl. Poult. Res. 2020, 29, 515–534. [Google Scholar] [CrossRef]
- Castanon, J.I.R. History of the use of antibiotics as growth promoters in European poultry feeds. Poult. Sci. 2007, 86, 2466–2471. [Google Scholar] [CrossRef]
- Huyghebaert, G.; Ducatelle, R.; Van Immerseel, F. An update on alternatives to antimicrobial growth promoters for broilers. Vet. J. 2011, 187, 182–188. [Google Scholar] [CrossRef]
- Amad, A.; Männer, K.; Wendler, K.; Neumann, K; Zentek J. Effects of a phytogenic feed additive on growth performance and ileal nutrient digestibility in broiler chickens. Poult. Sci. 2011, 90, 2811–2816. [CrossRef] [PubMed]
- Paraskeuas, V.; Mountzouris, K.C. Modulation of broiler gut microbiota and gene expression of Toll-like receptors and tight junction proteins by diet type and inclusion of phytogenics. Poult. Sci. 2019, 98, 2220–2230. [Google Scholar] [CrossRef] [PubMed]
- Bafundo, K.W.; Johnson, A.B.; Mathis, G.F. The effects of a combination of Quillaja saponaria and Yucca schidigera on Eimeria spp., in broiler chickens. Avian Dis. 2020, 64, 300–304. [Google Scholar] [CrossRef]
- Abdelli, N.; Solà-Oriol, D.; Pérez, J. F. Phytogenic feed Additives in poultry: Achievements, prospective and challenges. Animals (Basel). 2021, 11. [Google Scholar] [CrossRef]
- Windisch, W.; Schedle, K.; Plitzner, C.; Kroismayr, A. Use of phytogenic products as feed additives for swine and poultry. J. Anim. Sci. 2008, 86, 140–148. [Google Scholar] [CrossRef] [PubMed]
- Yang, C.; Chowdhury, M.A.K.; Hou, Y.; Gong, J. Phytogenic compounds as alternatives to in-feed antibiotics: potentials and challenges in application. Pathogens. 2015, 4, 137–156. [Google Scholar] [CrossRef]
- Greene, E.S.; Cauble, R.; Kadhim, H.; de Almeida Mallmann, B.; Gu, I.; Lee, S.O.; Orlowski, S.; Dridi, S. Protective effects of the phytogenic feed additive "comfort" on growth performance via modulation of hypothalamic feeding- and drinking-related neuropeptides in cyclic heat-stressed broilers. Domest. Anim. Endocrinol. 2021, 74, 106487. [Google Scholar] [CrossRef]
- Youssef, I.M.I.; Männer, K.; Zentek, J. Effect of essential oils or saponins alone or in combination on productive performance, intestinal morphology and digestive enzymes' activity of broiler chickens. J. Anim. Physiol. Anim. Nutr. (Berl). 2021, 105, 99–107. [Google Scholar] [CrossRef]
- Bafundo, K.W.; Männer, K.; Duerr, I. The combination of quillaja and yucca saponins in broilers: effects on performance, nutrient digestibility and ileal morphometrics. Br. Poult. Sci. 2021, 62, 589–595. [Google Scholar] [CrossRef] [PubMed]
- Bafundo, K.W.; Duerr, I.; McNaughton, J.L.; Johnson, A.B. The effects of a quillaja and yucca combination on performance and carcass traits of coccidia-vaccinated broilers exposed to an enteric disease challenge. Poult. Sci. 2021, 100, 101391. [Google Scholar] [CrossRef]
- Bafundo, K.W.; Gomez, L; Lumpkins, B.; Mathis, G.F.; McNaughton, J.L.; Duerr, I. Concurrent use of saponins and live coccidiosis vaccines: the influence of a quillaja and yucca combination on anticoccidial effects and performance results of coccidia-vaccinated broilers. Poult. Sci 2021, 100, 100905.
- Cheeke, P. Actual and potential applications of Yucca schidigera and Quillaja saponaria saponins in human and animal nutrition. J. Anim. Sci. 2000, 77, 1–10. [Google Scholar] [CrossRef]
- Sparg, S.G.; Light, M.E.; van Staden, J. Biological activities and distribution of plant saponins. J. Ethnopharmacol. 2004, 94, 219–243. [Google Scholar] [CrossRef]
- Fleck, J.D.; Betti, A.H.; Pereira da Silva, F.; Troian, E.A.; Olivaro, C.; Ferreira, F.; Verza, S.G. Saponins from Quillaja saponaria and Quillaja brasiliensis: particular chemical characteristics and biological activities. Molecules. 2019, 24. [Google Scholar] [CrossRef]
- Calik, A.; Omara, I.I.; White, M.B.; Evans, N.P.; Karnezos, T.P; Dalloul, R.A. Dietary non-drug feed additive as an alternative for antibiotic growth promoters for broilers during a necrotic enteritis challenge. Microorganisms. 2019, 7. [Google Scholar] [CrossRef]
- Emami, N.K.; Calik, A.; White, M.B.; Kimminau, E.A.; Dalloul, R.A. Effect of probiotics and multi-component feed additives on microbiota, gut barrier, and immune responses in broiler chickens during subclinical necrotic enteritis. Front. Vet. Sci. 2020, 7, 572142. [Google Scholar] [CrossRef]
- Emami, N.K.; White, M.B.; Calik, A.; Kimminau, E.A.; Dalloul, R.A. Managing broilers gut health with antibiotic-free diets during subclinical necrotic enteritis. Poult. Sci. 2021, 100, 101055. [Google Scholar] [CrossRef]
- Prescott, J.F.; Sivendra, R.; Barnum, D.A. The use of bacitracin in the prevention and treatment of experimentally induced necrotic enteritis in the chicken. Can. Vet. J. 1978, 19, 181–183. [Google Scholar]
- Hofacre, C.L.; Smith, J.A.; Mathis, G.F. An optimist's view on limiting necrotic enteritis and maintaining broiler gut health and performance in today's marketing, food safety, and regulatory climate. Poult. Sci. 2018, 97, 1929–1933. [Google Scholar] [CrossRef]
- Amad, A.; Männer, K; Wendler, K; Neumann, K; Zentek J. Effects of a phytogenic feed additive on growth performance and ileal nutrient digestibility in broiler chickens. Poult. Sci. 2011, 90, 2811–2816. [CrossRef]
- Cho, J.; Kim, H; Kim, I. Effects of phytogenic feed additive on growth performance, digestibility, blood metabolites, intestinal microbiota, meat color and relative organ weight after oral challenge with Clostridium perfringens in broilers. Livest. Sci. 2014, 160, 82–88. [CrossRef]
- Du, E.; Wang, W; Gan, L.; Li, Z.; Guo, S.; Guo, Y. Effects of thymol and carvacrol supplementation on intestinal integrity and immune responses of broiler chickens challenged with Clostridium perfringens. J. Anim. Sci. Biotechnol. 2016, 7, 19–25. [CrossRef]
- Pirgozliev, V.; Beccaccia, A.; Rose, S.P.; Bravo, D. Partitioning of dietary energy of chickens fed maize- or wheat-based diets with and without a commercial blend of phytogenic feed additives. J. Anim. Sci. 2015, 93, 1695–1702. [Google Scholar] [CrossRef]
- Pirgozliev, V.; Mansbridge, S.C.; Rose, S.P.; Lillehoj, H.S.; Bravo, D. Immune modulation, growth performance, and nutrient retention in broiler chickens fed a blend of phytogenic feed additives. Poult. Sci. 2019, 98, 3443–3449. [Google Scholar] [CrossRef] [PubMed]
- Emami, N.K.; Calik, A.; White, M.B.; Young, M.; Dalloul, R.A. Necrotic enteritis in broiler chickens: The role of tight junctions and mucosal immune responses in alleviating the effect of the disease. Microorganisms. 2019, 7, 231. [Google Scholar] [CrossRef] [PubMed]
- Saitoh, Y.; Suzuki, H.; Tani, K.; Nishikawa, K.; Irie, K.; Ogura, Y.; Tamura, A.; Tsukita, S.; Fujiyoshi, Y. Structural insight into tight junction disassembly by Clostridium perfringens enterotoxin. Science. 2015, 347, 775–778. [Google Scholar] [CrossRef] [PubMed]
- Golder, H. M.; Geier, M.S.; Forder, R.E.; Hynd, P.I.; Hughes, R.J. Effects of necrotic enteritis challenge on intestinal micro-architecture and mucin profile. Br. Poult. Sci. 2011, 52, 500–506. [Google Scholar] [CrossRef]
- Stefanello, C.; Rosa, D.P.; Dalmoro, Y.K.; Segatto, A. L.; Vieira, M.S.; Moraes, M.L.; Santin, E. Protected blend of organic acids and essential oils improves growth performance, nutrient digestibility, and intestinal health of broiler chickens undergoing an intestinal challenge. Front. Vet. Sci. 2020, 6, 491. [Google Scholar] [CrossRef]
- Fathima, S.; Hakeem, W.G.A.; Shanmugasundaram, R.; Selvaraj, R.K. Necrotic enteritis in broiler chickens: A review on the pathogen, pathogenesis, and prevention. Microorganisms. 2022, 10, 1958. [Google Scholar] [CrossRef]
- Daneshmand, A.; Kermanshahi, H.; Sekhavati, M.H.; Javadmanesh, A.; Ahmadian, M.; Alizadeh.; Aldawoodi, A. Effects of cLFchimera peptide on intestinal morphology, integrity, microbiota, and immune cells in broiler chickens challenged with necrotic enteritis. Sci. Rep. 2020, 10, 17704. [CrossRef] [PubMed]
- Flees, J.J.; Ganguly, B.; Dridi, S. Phytogenic feed additives improve broiler feed efficiency via modulation of intermediary lipid and protein metabolism-related signaling pathways. Poult. Sci. 2020, 100, 100963. [Google Scholar] [CrossRef] [PubMed]
- Ye, J. L.; Ga, C. Q.; Li, X. G.; Jin, C. L.; Wang, D.; Shu, G.; Wang, W. C.; Kong, X. F.; Yao, K.; Yan, H. C.; Wang, X. Q. EAAT3 promotes amino acid transport and proliferation of porcine intestinal epithelial cells. Oncotarget. 2016, 7, 38681–38692. [Google Scholar] [CrossRef] [PubMed]
- Murugesan, G.R.; Romero, L.F.; Persia, M.E. Effects of protease, phytase and a Bacillus sp. direct-fed microbial on nutrient and energy digestibility, ileal brush border digestive enzyme activity and cecal short-chain fatty acid concentration in broiler chickens. PLoS One. 2014, 9, 101888. [Google Scholar] [CrossRef]
- Reyer, H.; Zentek, J.; Manner, K.; Youssef, I.M.I.; Aumiller, T.; Weghuber, J.; Mueller, A.S. Possible molecular mechanisms by which an essential oil blend from star anise, rosemary, thyme, and oregano and saponins increase the performance and ileal protein digestibility of growing broilers. J. Agric. Food Chem. 2017, 65, 6821–6830. [Google Scholar] [CrossRef] [PubMed]
- Zwarycz, B.; Wong, E.A. Expression of the peptide transporters PepT1, PepT2, and PHT1 in the embryonic and post hatch chick. Poult. Sci. 2013, 92, 1314–1321. [Google Scholar] [CrossRef]
- Chen, H.; Pan, Y.X.; Wong, E.A.; Webb, K.E., Jr. Dietary protein level and stage of development affect expression of an intestinal peptide transporter (cPepT1) in chickens. J. Nutr. 2005, 135, 193–198. [Google Scholar] [CrossRef]
- Farrokhifar, S.H.; Ali Jafari, R.; Erfani Majd, N.; Fatemi Tabatabaee, S.R.; Mayahi, M. Effects of dietary vitamin E on mucosal maltase and alkaline phosphatase enzyme activities and on the amount of mucosal malonyldialdehyde in broiler chickens. Vet. Res. Forum. 2013, 4, 221–225. [Google Scholar]
Figure 1.
Effects of various inclusion rates of Clarity Q (CQ) on average mortality rate of broilers during a natural occurring 42 d NE challenge.1Each bar represents the mean ± SE values of 10 replicate pens of 30 birds/pen. 2Treatments included negative control (NC) as corn-soybean meal basal diet; positive control (PC) as NC + 50 g/MT of BMD; and NC + 15 or 30 g/MT of Clarity Q (CQ15 and CQ30 respectively).
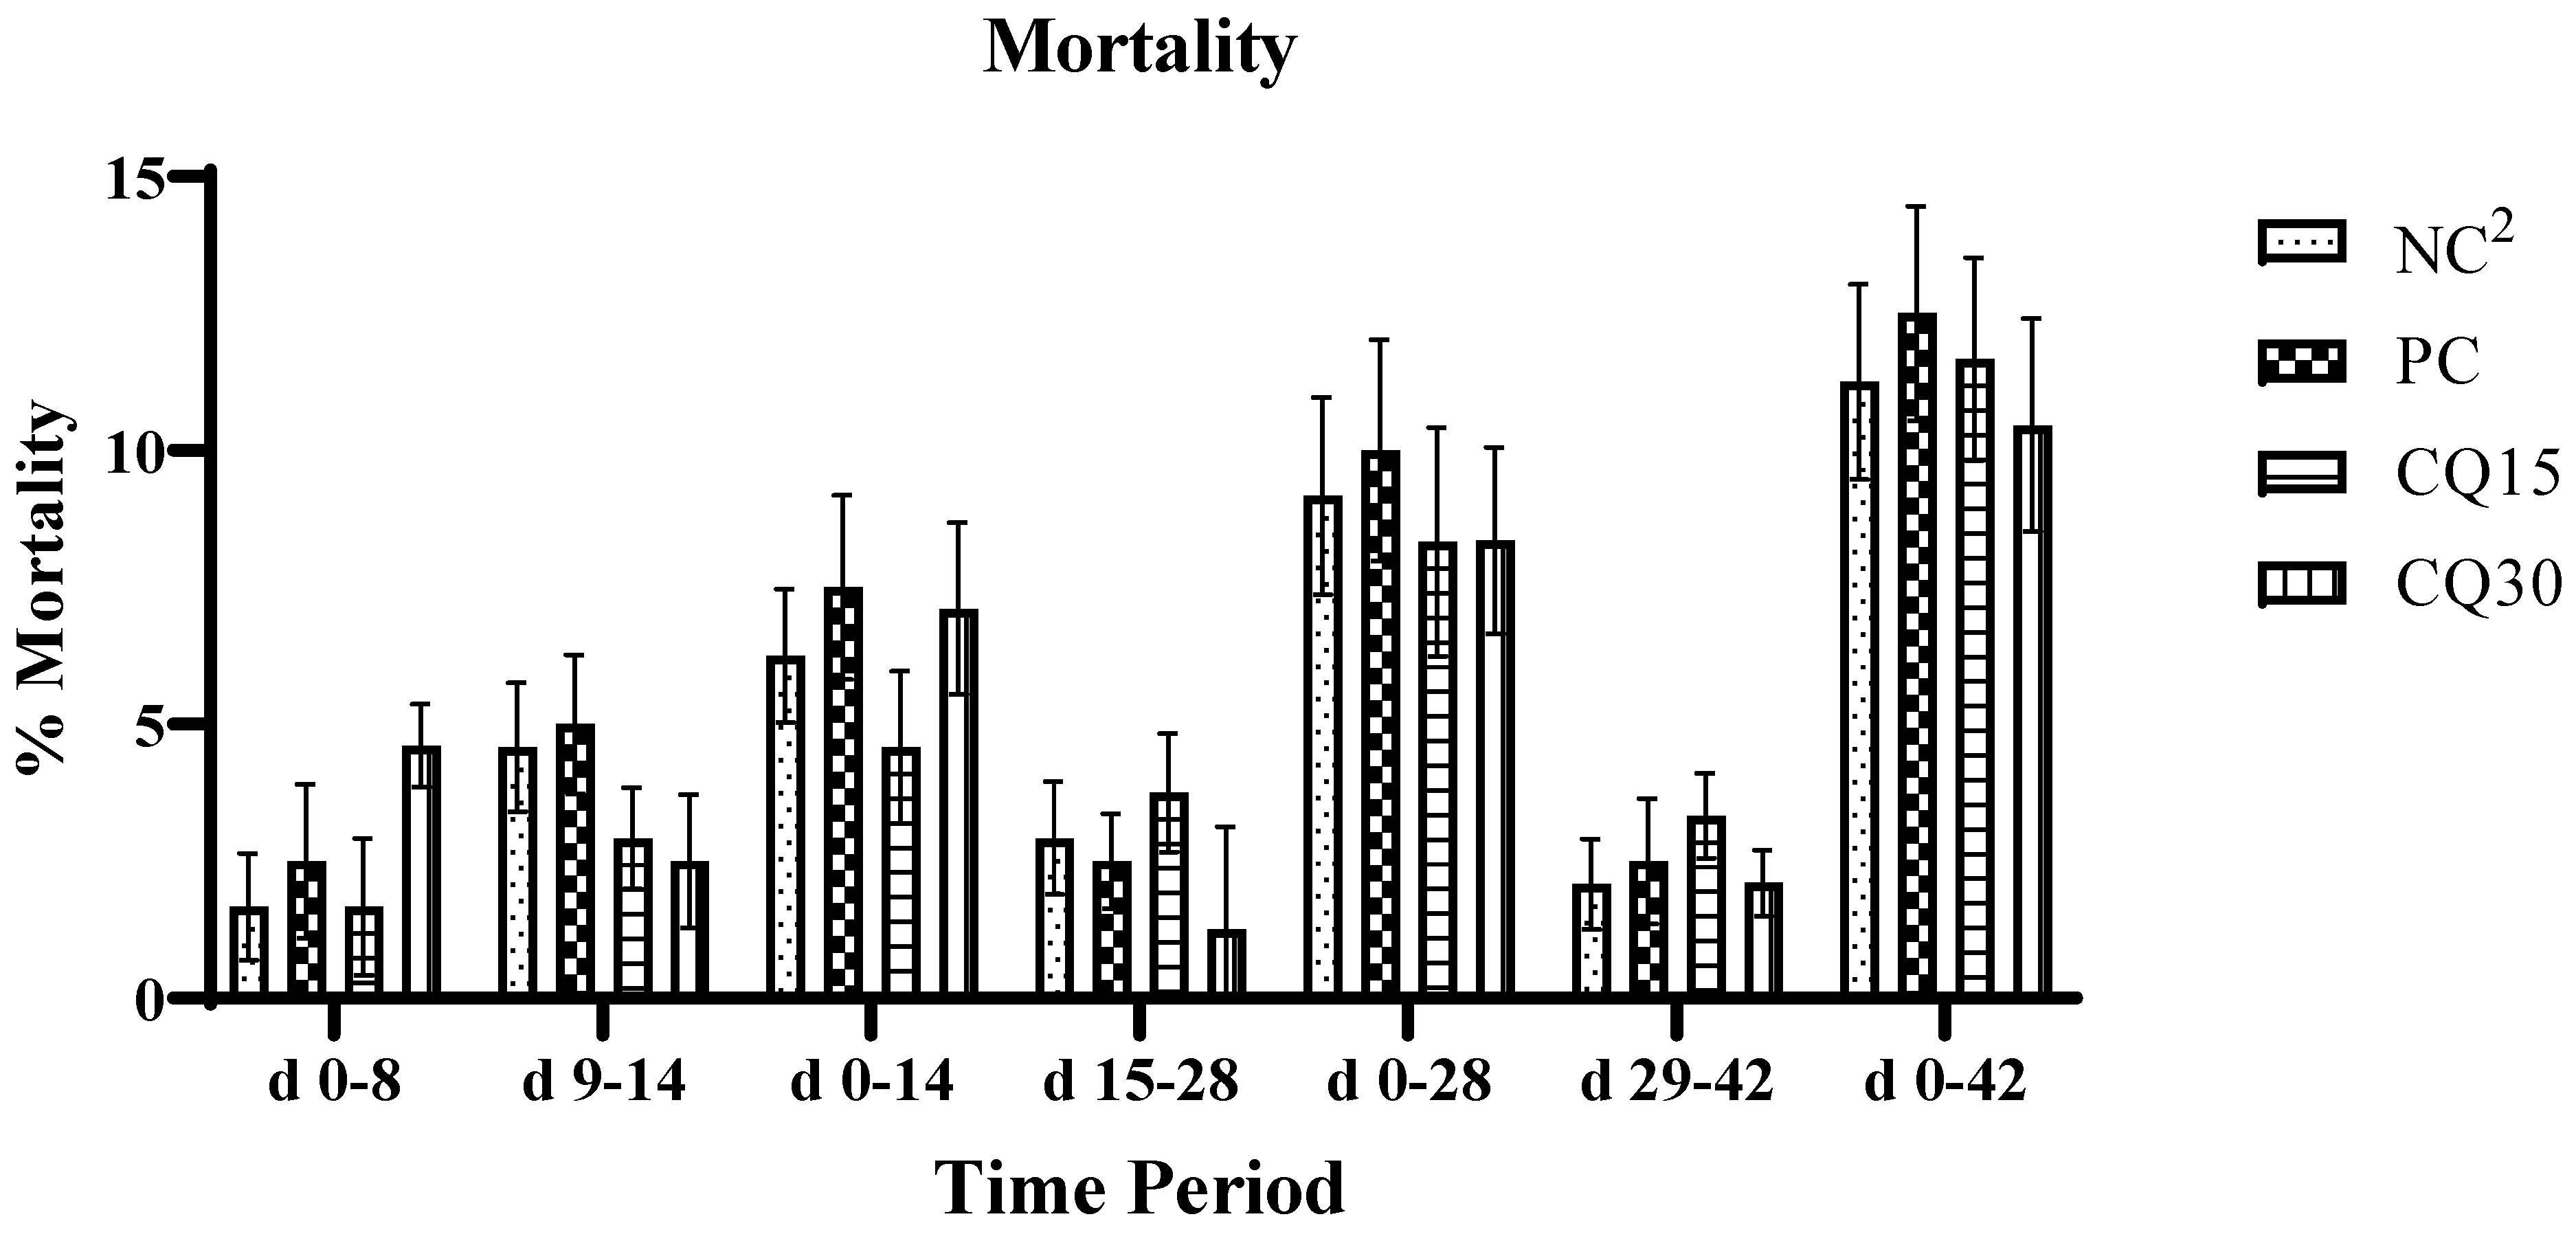
Figure 2.
Effects of various inclusion rates of Clarity Q (CQ) on necrotic enteritis (NE) lesion scores on D 8 of broilers during a natural occurring 42 D NE challenge. 1 Data represents the small intestinal sections (duodenum and jejunum) and mean value of 14 replicate pens of 3 birds/pen on day 8. 2Each bar represents the mean ± SE values of 10 replicate pens of 30 birds/pen. 3Treatments included negative control (NC): corn-soybean meal basal diet, positive control (PC) NC + 50 g/MT of BMD, and NC + 15 or 30 g/MT of Clarity Q (CQ15 and CQ30 respectively.
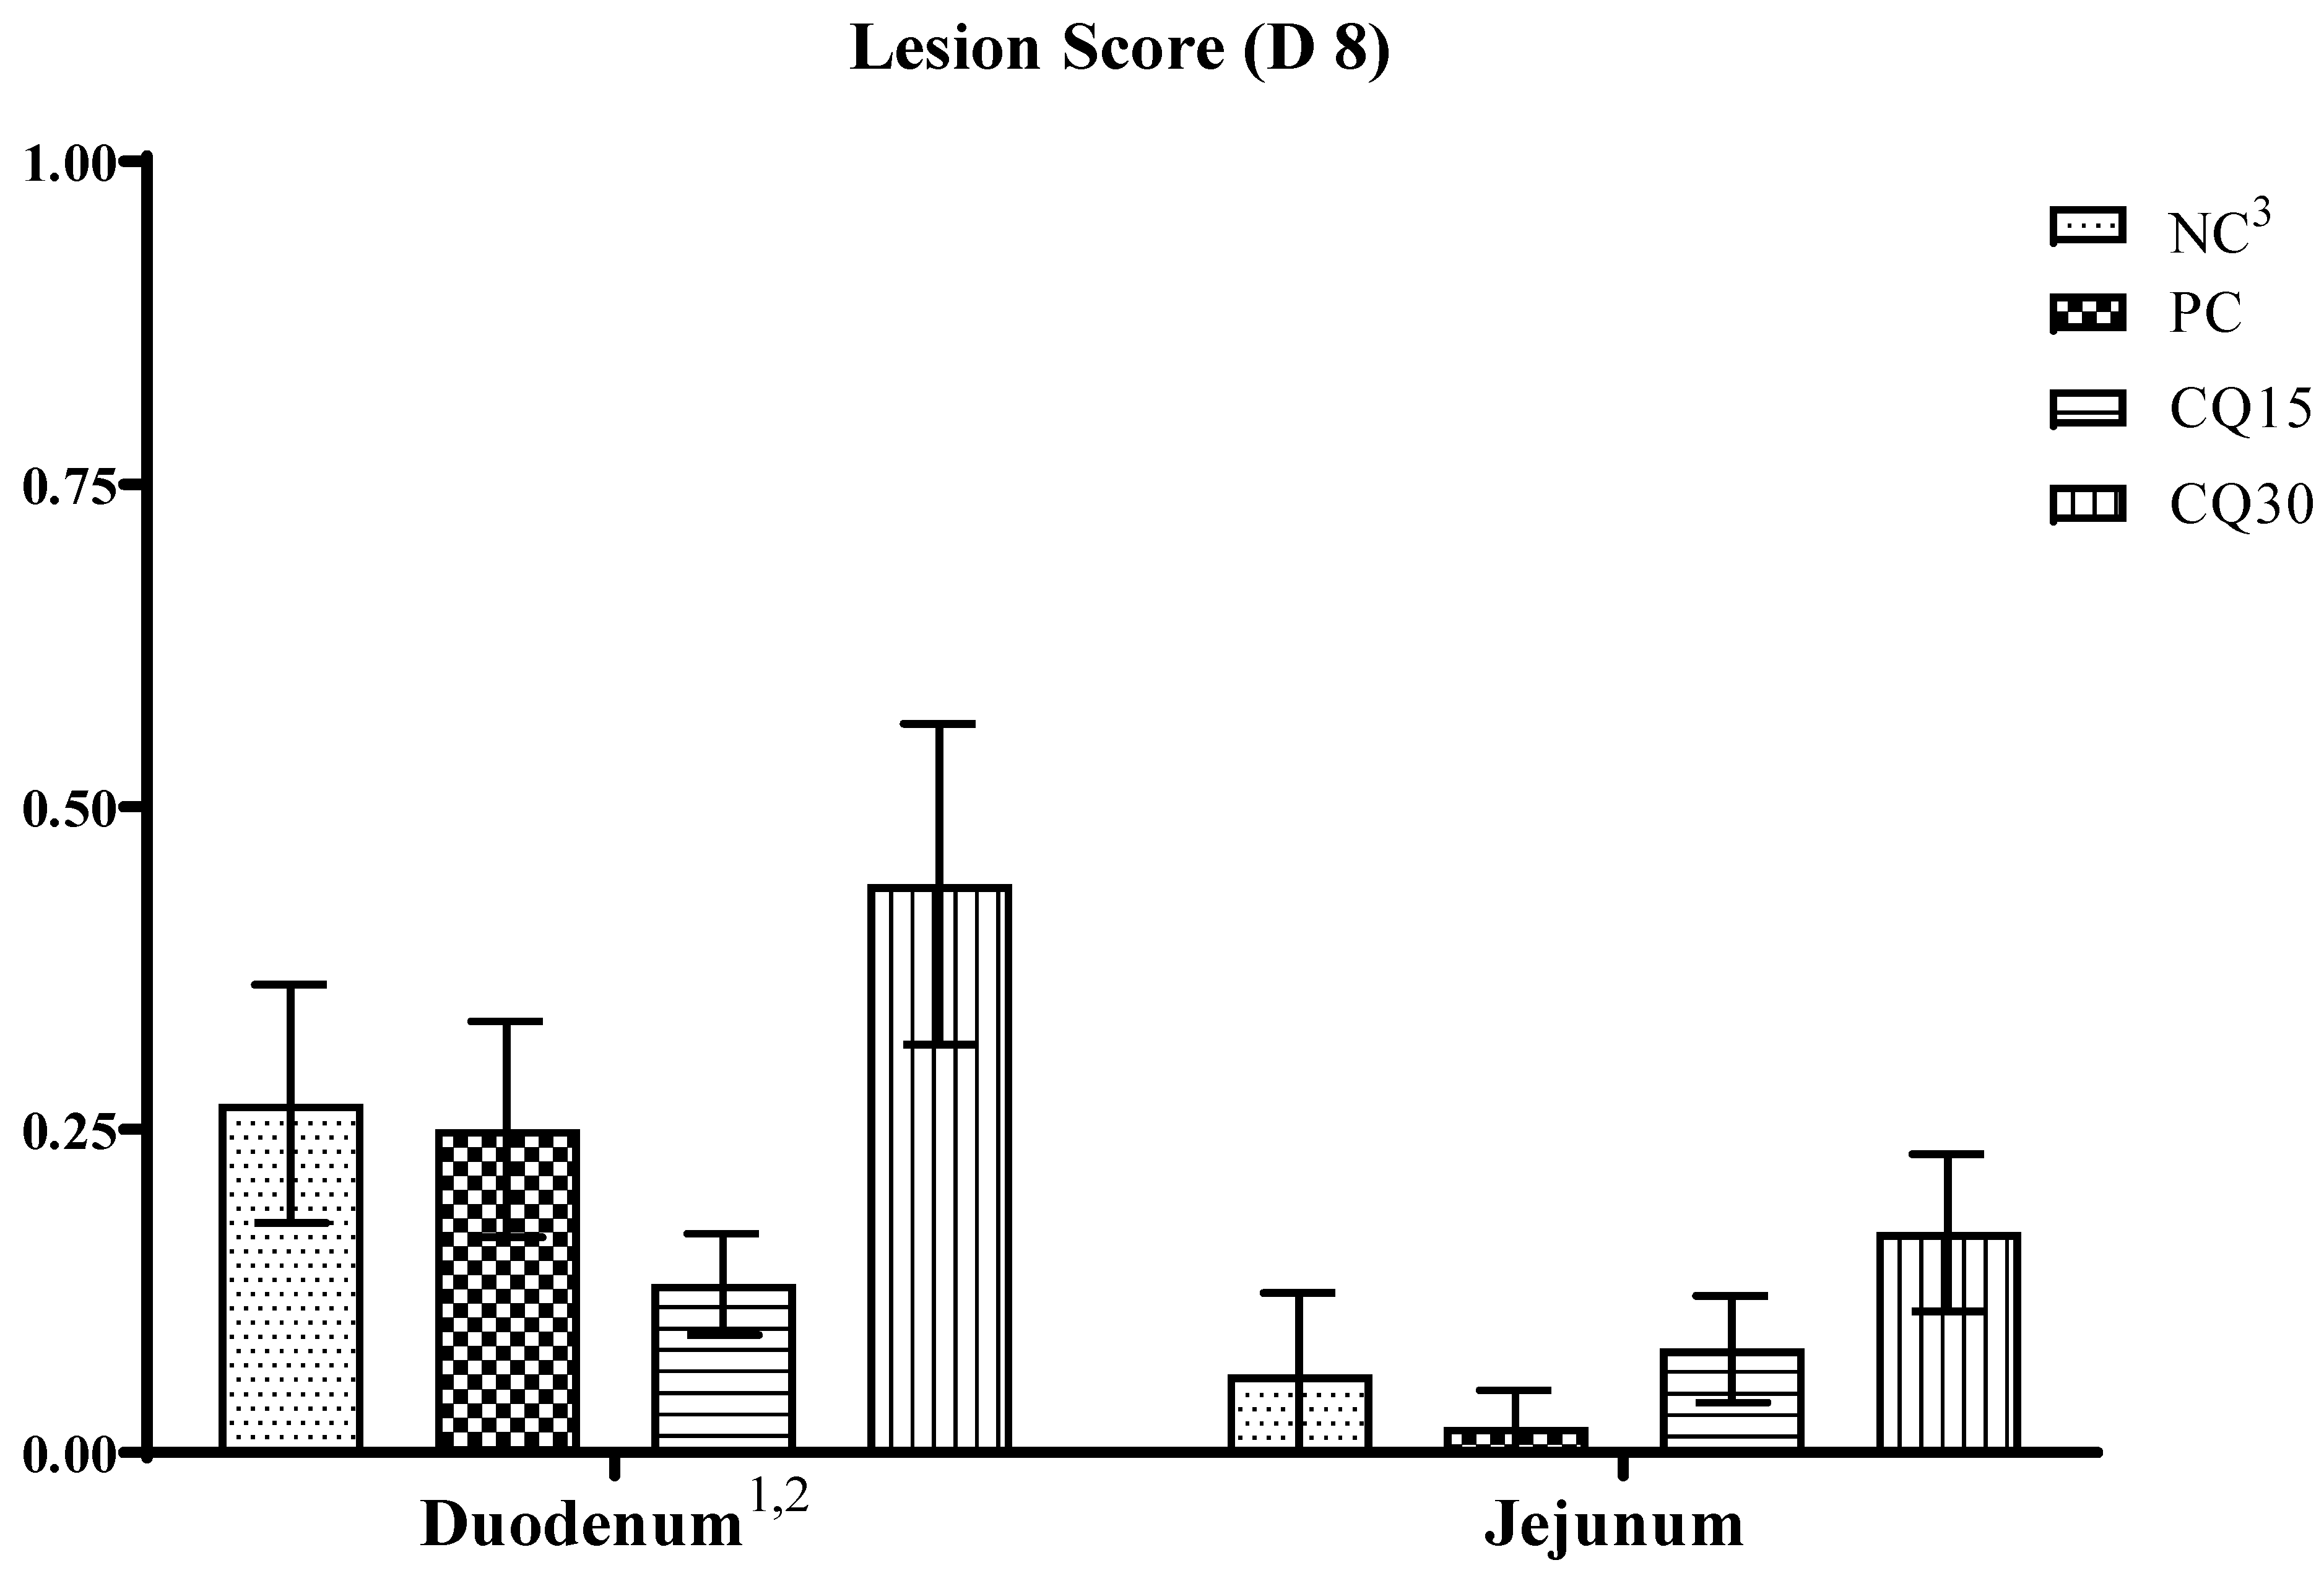
Figure 3.
Relative mRNA abundance of tight junction proteins in the jejunum of broiler chickens on d 8 and d 14 during a 42 d NE challenge. *Numbers with different letters (a-c) differ significantly (P < 0.05). Values are represented as n-fold difference relative to the calibrator (NC). A-G Each bar represents the mean ± SE values of 10 replicate pens of 1 birds/pen. A-G Occludin (OCLN), claudins (CLDN) 1 and 5, junctional adhesion molecules (JAM) 2 and 3, and zonula occludens (ZO) 1 and 2. 1Treatments included negative control (NC) as corn-soybean meal basal diet; positive control (PC) as NC + 50 g/MT of BMD; and NC + 15 or 30 g/MT of Clarity Q (CQ15 and CQ30 respectively).
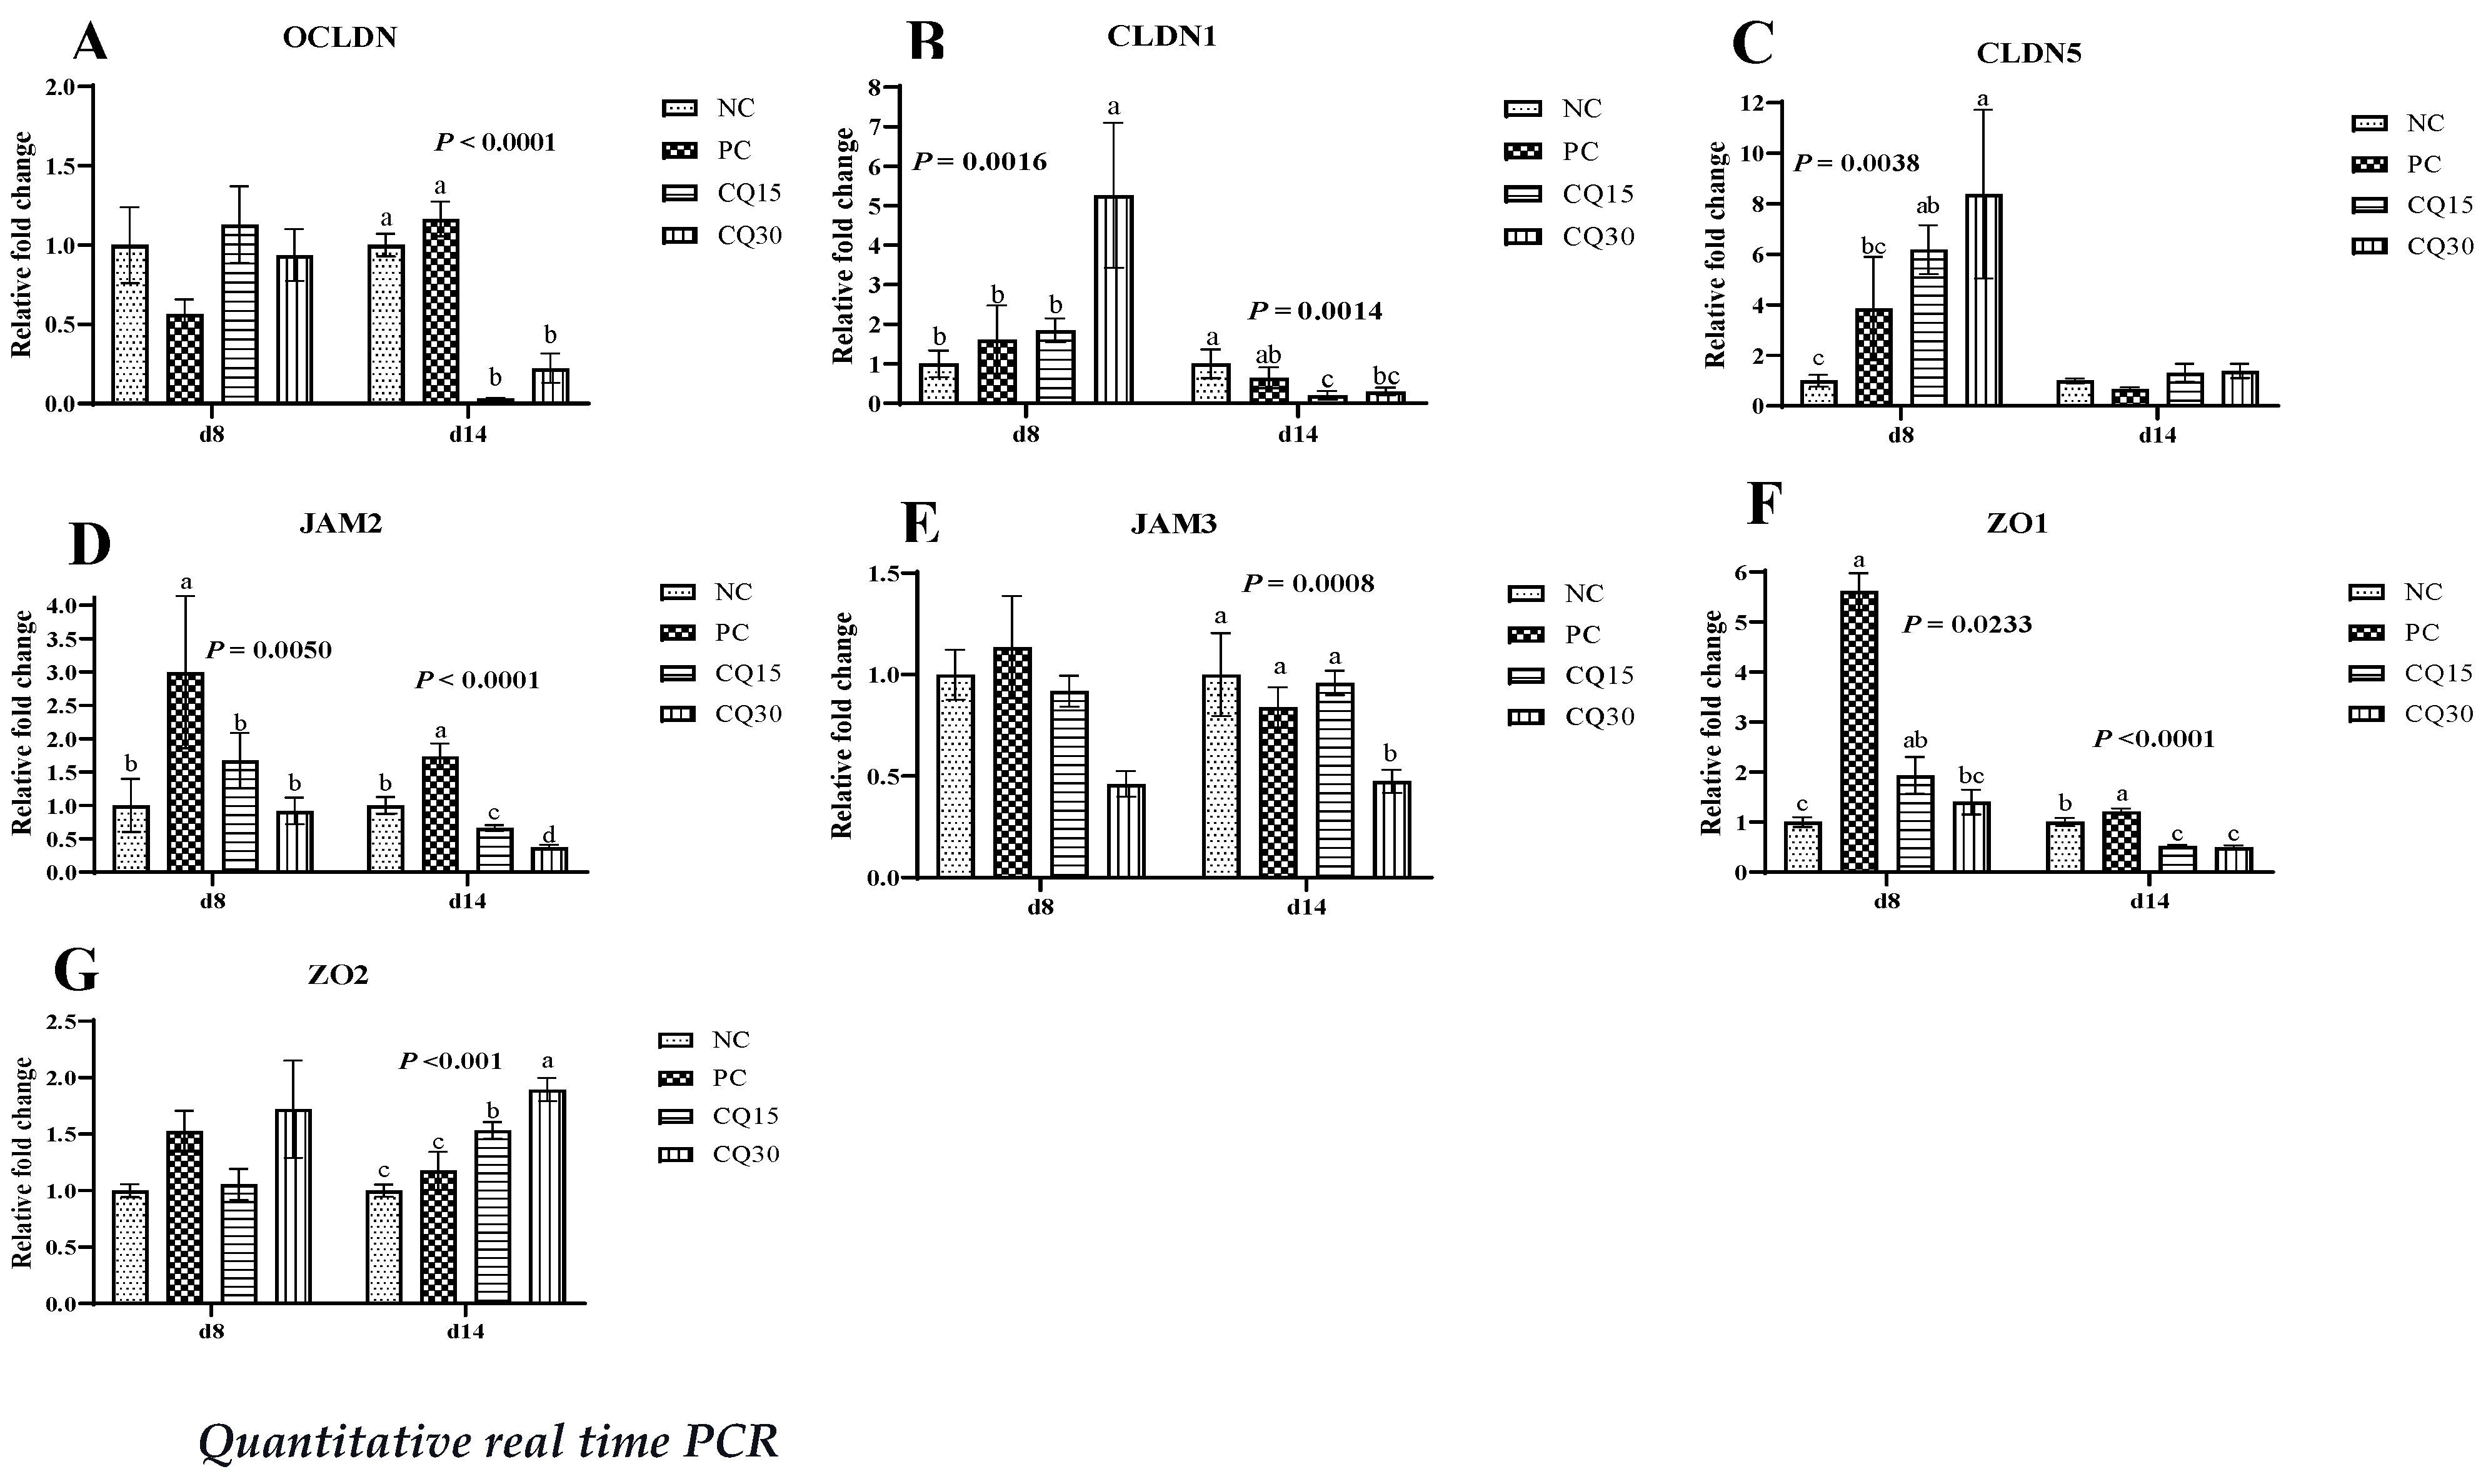
Figure 4.
Relative mRNA abundance of signaling pathways and mucin in the jejunum of broiler chickens on d 8 and d 14 during a 42 d NE challenge. *Numbers with different letters (a-c) differ significantly. (P < 0.05). Values are represented as n-fold difference relative to the calibrator (NC). A-F Each bar represents the mean ± SE values of 10 replicate pens of 1 birds/pen. A-FAdenosine monophosphate-activated protein kinase (AMPK), mammalian target of rapamycin (mTOR), peroxisome proliferator-activated receptor-gamma coactivator one alpha (PGC1α), mucin 2 (MUC2), annexin 1 (ANXA1), and TNF receptor 3 (TRAF3). 1Treatments included negative control (NC) as corn-soybean meal basal diet; positive control (PC) as NC + 50 g/MT of BMD; and NC + 15 or 30 g/MT of Clarity Q (CQ15 and CQ30 respectively).
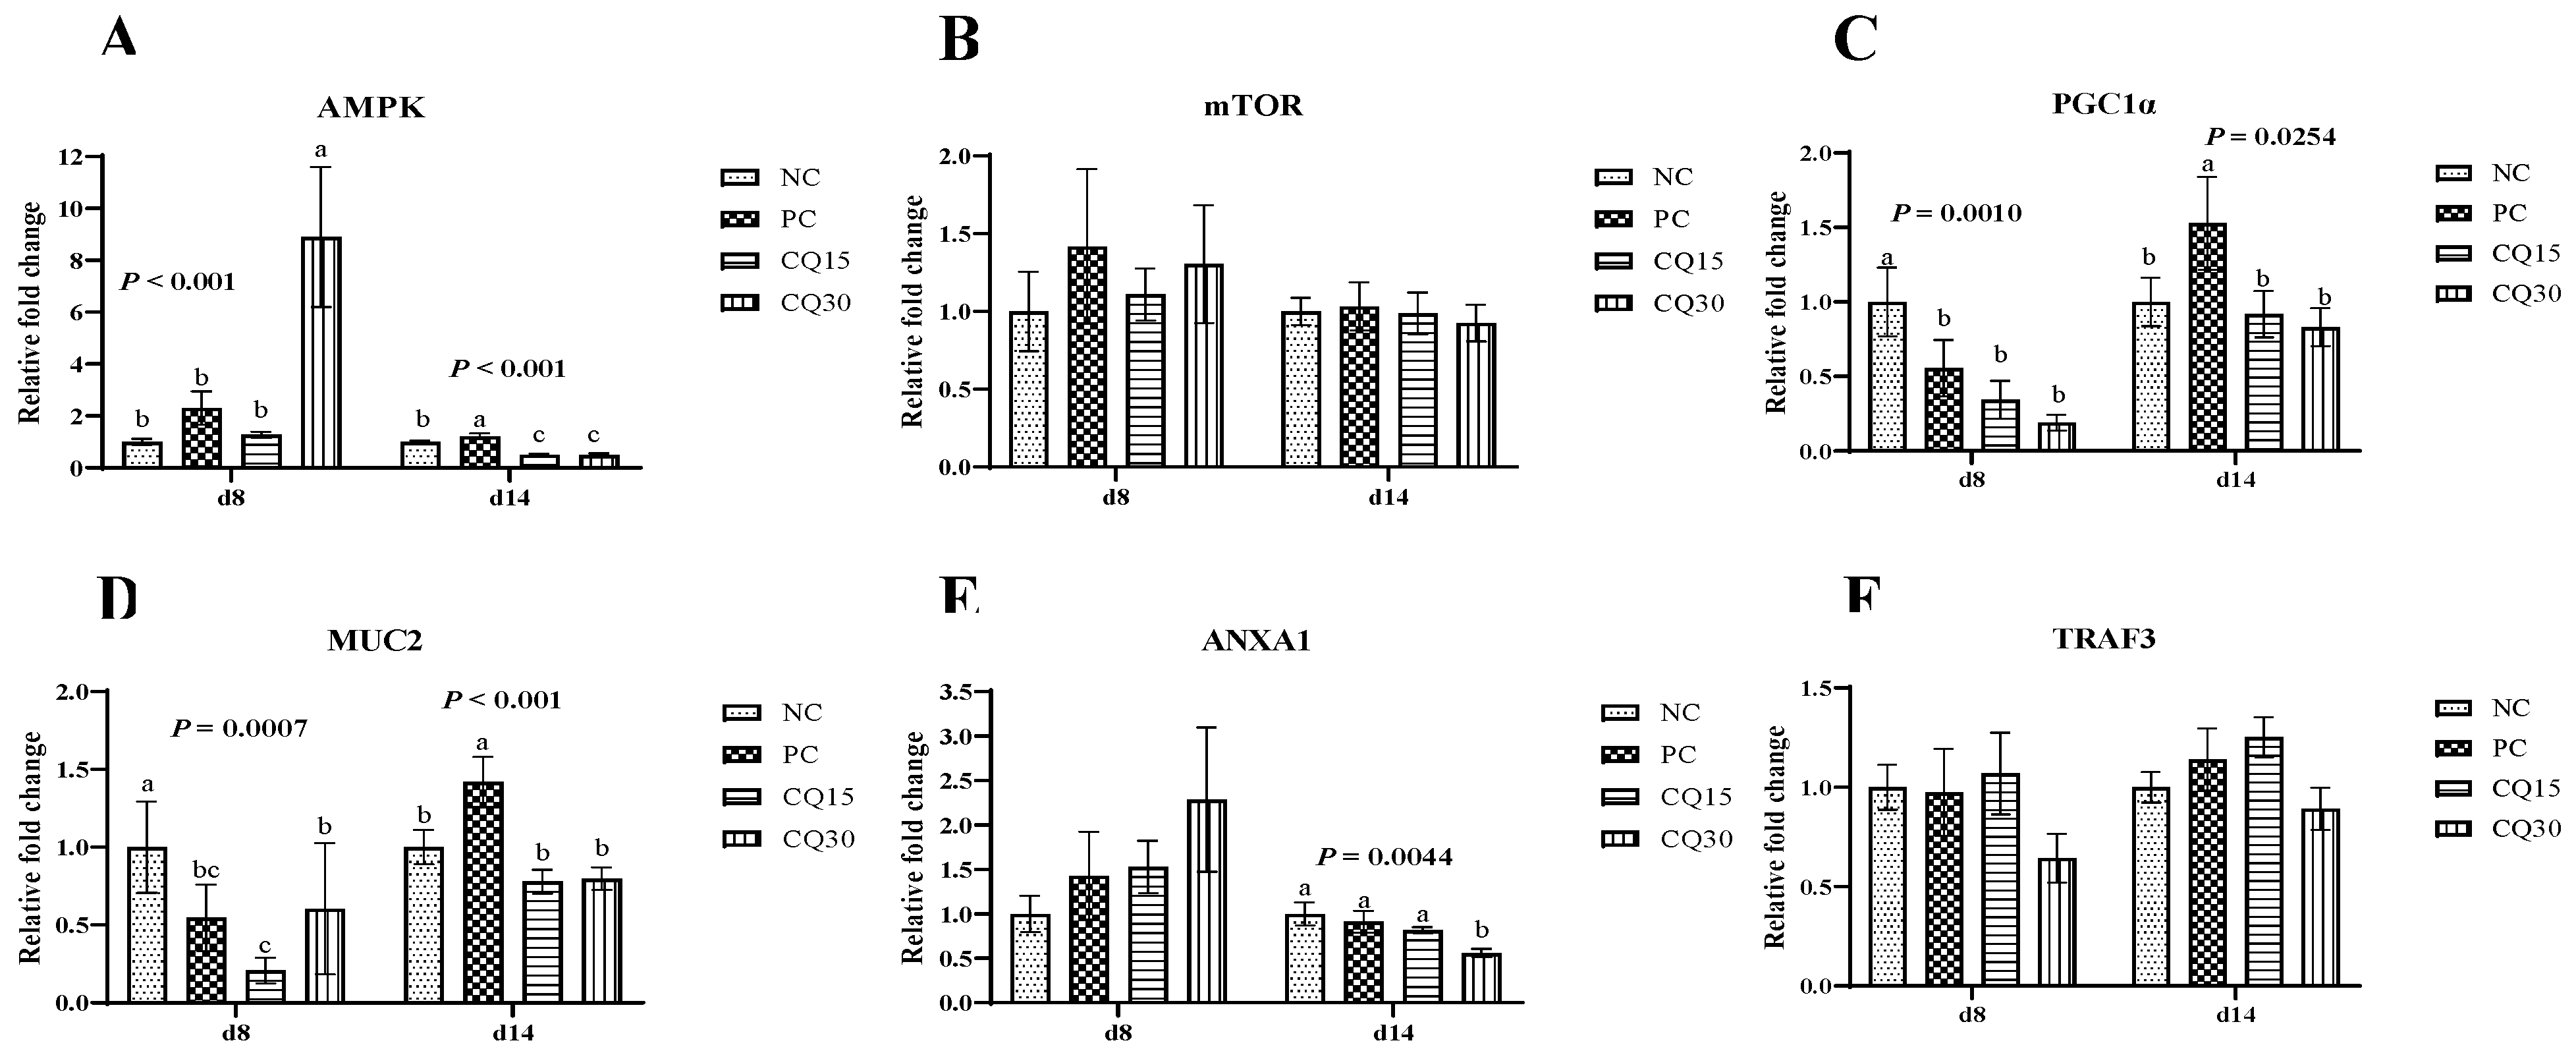
Figure 5.
Relative mRNA abundance of nutrient transport genes of broiler chickens on d 8 and d 14 during a 42 d NE challenge. *Numbers with different letters (a-c) differ significantly. (P < 0.05). Values are represented as n-fold difference relative to the calibrator (NC). A-F Each bar represents the mean ± SE values of 10 replicate pens of 1 birds/pen. A-F Excitatory amino acid transporter 3 (EAAT3), glucose transporter (GLUT) 2 and 5, peptide transporter (PepT) 1 and 2, sodium-dependent glucose co-transporter 1 (SGLT1).1Treatments included negative control (NC) as corn-soybean meal basal diet; positive control (PC) as NC + 50 g/MT of BMD; and NC + 15 or 30 g/MT of Clarity Q (CQ15 and CQ30 respectively).
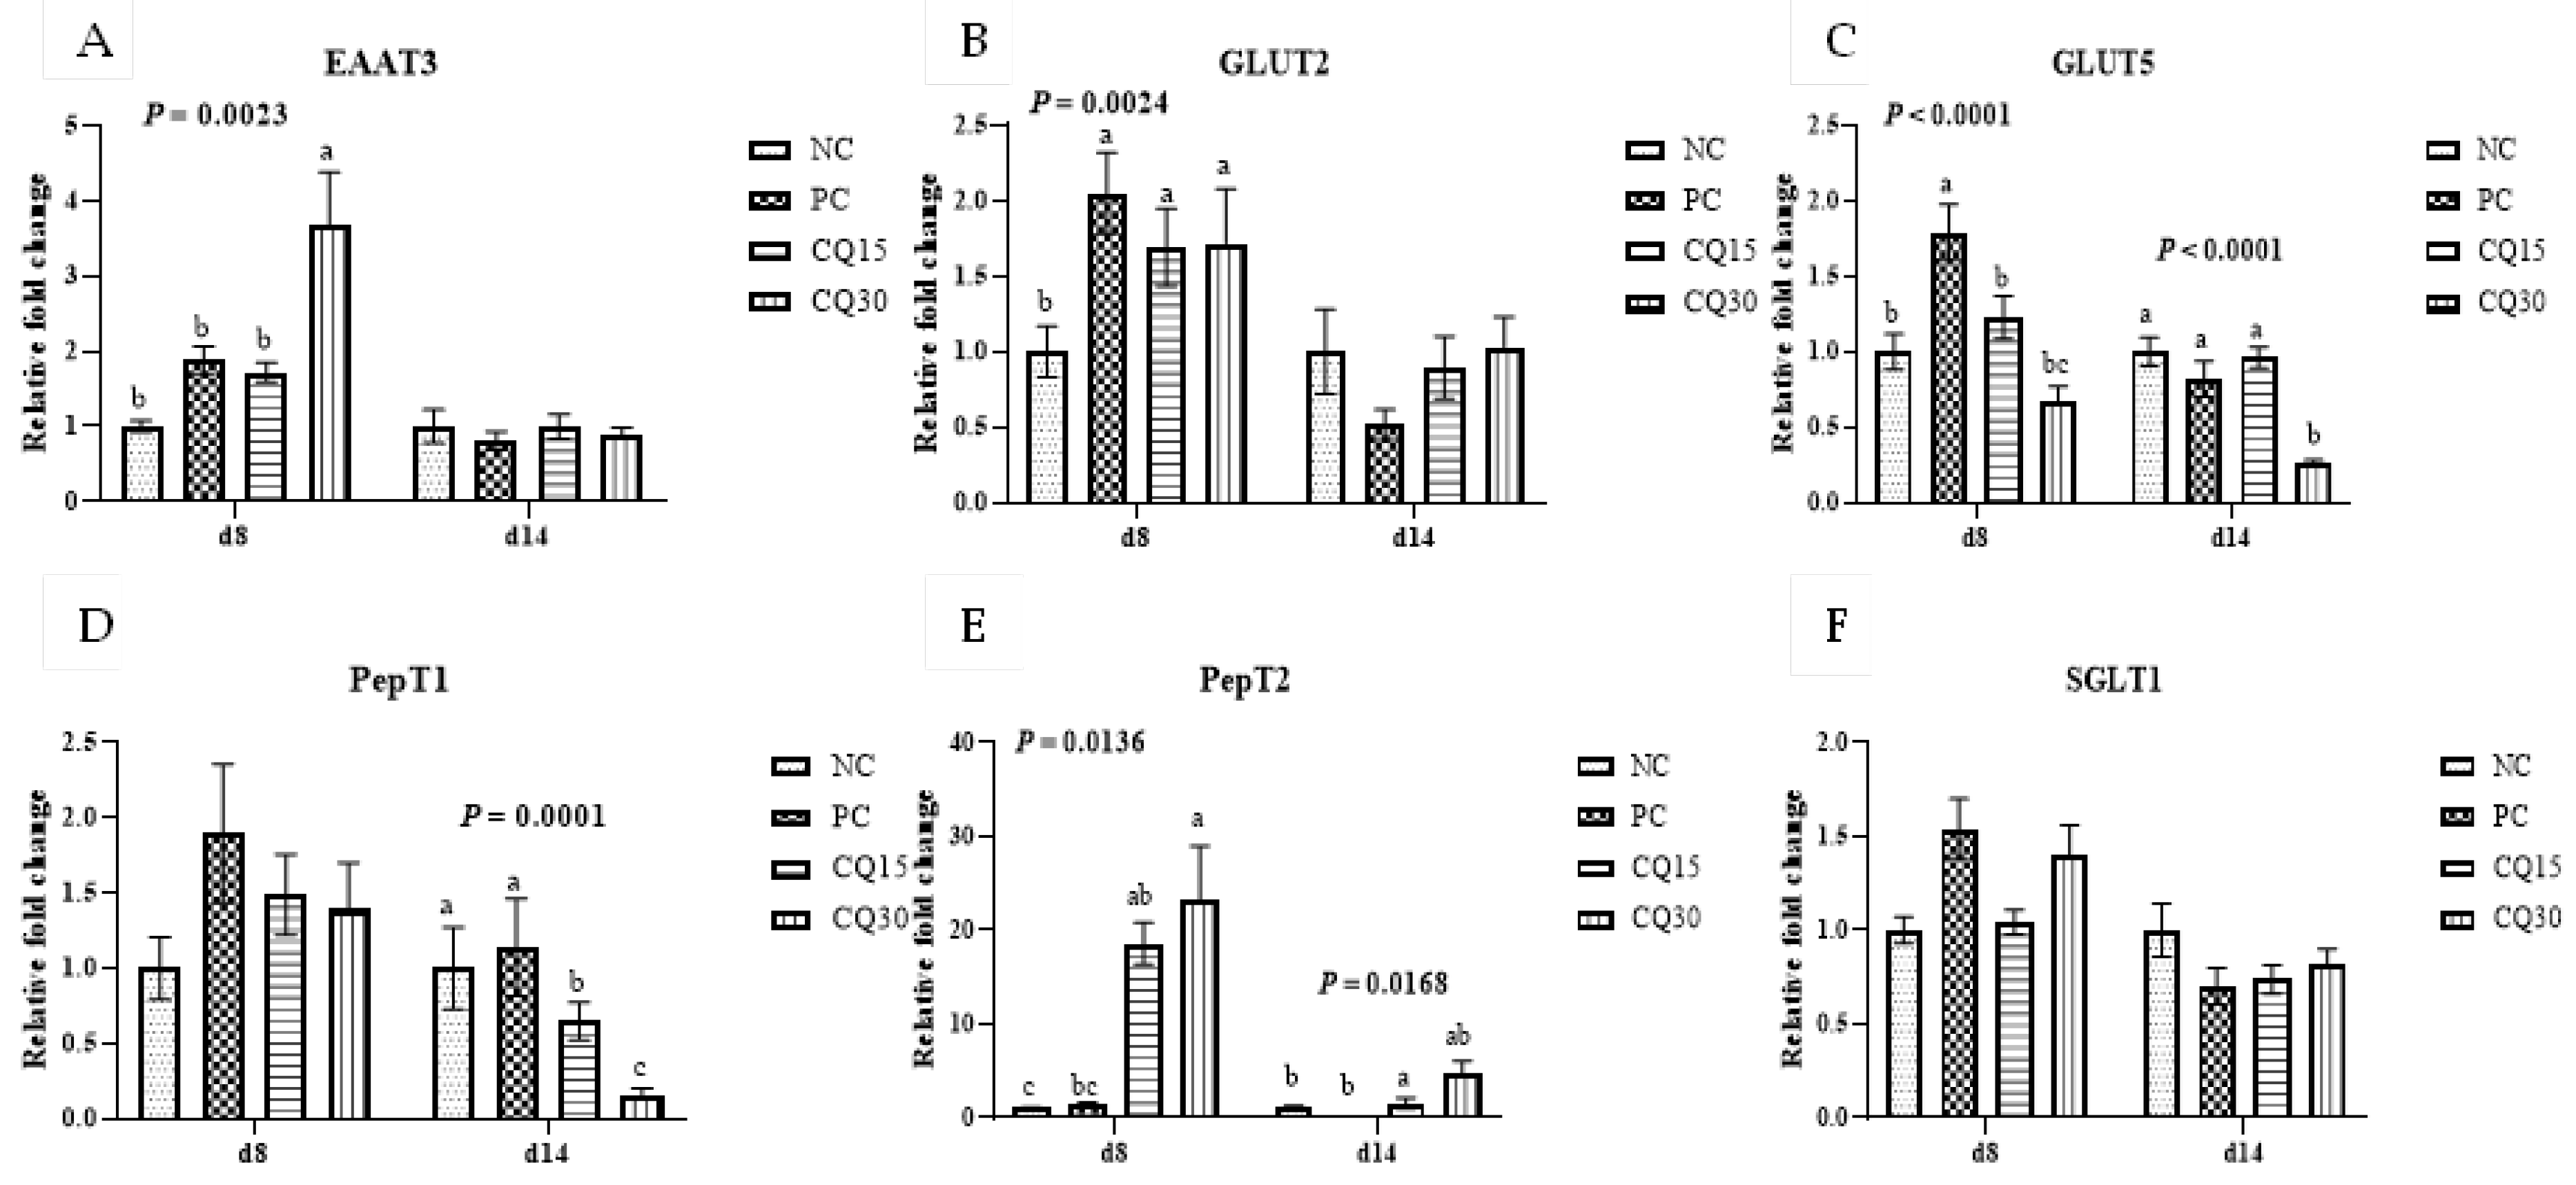

Table 1.
Composition of basal diets (as fed basis, %) a.
| Feeding Phase (days) | |||
|---|---|---|---|
|
Ingredients (%) |
Starter (1-14) |
Grower (14-28) |
Finisher (28-42) |
| Corn (7.81% CP) | 59.53 | 64.12 | 65.70 |
| Soybean meal (48% CP) | 33.5 | 28.80 | 26.86 |
| Soybean Oil (9000 kcal/kg) | 2.18 | 2.60 | 3.50 |
| Dicalcium Phosphate (18.5% P, 22% Ca) | 2.05 | 1.92 | 1.70 |
| Calcium Carbonate (37% Calcium) | 1.11 | 1.00 | 0.90 |
| Sodium Chloride | 0.3 | 0.3 | 0.3 |
| Sodium Bicarbonate | 0.07 | 0.07 | 0.05 |
| DL-Methionine (990 g/kg)b | 0.38 | 0.34 | 0.29 |
| L-Lysine Hydrochloride (788g L-Lysine/kg)c | 0.37 | 0.35 | 0.24 |
| L-Threonine (985g/kg)d | 0.15 | 0.14 | 0.10 |
| Vitamin/Trace Mineral Premixe | 0.36 | 0.36 | 0.36 |
| Calculated Analysis (% unless specified) | |||
| ME (kCal/kg) | 3007 | 3087 | 3168 |
| Crude protein | 21.81 | 19.90 | 18.94 |
| Total phosphorus | 0.76 | 0.71 | 0.66 |
| Available phosphorus | 0.45 | 0.42 | 0.38 |
| Calcium | 0.90 | 0.84 | 0.76 |
| Chlorine | 0.33 | 0.33 | 0.29 |
| Sodium | 0.16 | 0.16 | 0.15 |
| Potassium | 0.85 | 0.77 | 0.73 |
| Methionine | 0.67 | 0.61 | 0.55 |
| Methionine+Cysteine | 0.98 | 0.89 | 0.82 |
| Lysine | 1.32 | 1.19 | 1.05 |
| Threonine | 0.86 | 0.78 | 0.71 |
| Linoleic acid | 1.44 | 1.52 | 1.55 |
| Dietary cation-anion balance (mEq) | 194 | 174 | 170 |
a The supplements are added to the basal mixes to provide the six experimental diets in every feeding period. b Rhodimet® NP9, ADISSEO. c L-Lysine HCl, AJINOMOTO HEARTLAND. d FENCHEM Ingredient Technology. e Vitamins supplied per kg diet: retinol 3.33 mg, cholecalciferol 0.1 mg, α-tocopherol acetate 23.4 mg, vitamin K3 1.2 mg, vitamin B1 1.6 mg, vitamin B2 9.5 mg, niacin 40 mg, pantothenic acid 9.5 mg, vitamin B6 2 mg, folic acid 1 mg, vitamin B12 0.016 mg, biotin 0.05 mg, choline 556 mg. Minerals supplied per kg diet: Mn 144 mg, Fe 72 mg, Zn 144 mg, Cu 16.2 mg, I 2.1 mg, Se 0.22 mg
Table 2.
Sequences of primer pairs used for amplification of target and reference genes.
| Target gene | Primer sequence | Accession # |
|---|---|---|
| Occludin (OCLN) |
F- CCGTAACCCCGAGTTGGAT R- ATTGAGGCGGTCGTTGATG |
NM_205128.1 |
| Claudin 1 (CLDN1) |
F- GTGTTCAGAGGCATCAGGTATC R- TCAGGTCAAACAGAGGTACAA |
NM_001013611.2 |
| Claudin 5 (CLDN5) |
F- AGGTGTCAGCCTTCATCGAC R- CCAGGATGGAATCGTACACC |
NM_204201.1 |
| Junctional Adhesion Molecule 2 (JAM2) |
F- CTGCTCCTCGGGTACTTGG R- CCCTTTTGAAAATTTGTGCTTGC |
XM_015299112.3 |
| Juncitonal Adhesion Molecule 3 (JAM3) |
F- CCAGAGTGTTGAGCTGTCCT R- AGAATTTCTGCCCGAGTTGC |
XM_417876.6 |
| Zonula Occluden 1 (ZO1) |
F- GGAGTACGAGCAGTCAACATAC R- GAGGCGCACGATCTTCATAA |
XM_413773 |
| Zonula Occluden (ZO2) |
F- GCGTCCCATCCTGAGAAATAC R- CTTGTTCACTCCCTTCCTCTTC |
NM_204918.1 |
| AMP activated protein kinase (AMPK) |
F- ATCTGTCTCGCCCTCATCCT R- CCACTTCGCTCTTCTTACACCTT |
NM_001039603.1 |
| Mammalian target of rapamycin (mTOR) |
F- CATGTCAGGCACTGTGTCTATTCTC R- CTTTCGCCCTTGTTTCTTCACT |
XM_417614.6 |
| Mucin 2 (MUC2) |
F- TTCATGATGCCTGCTCTTGTG R- CCTGAGCCTTGGTACATTCTTGT |
XM_421035 |
| Annexin 1 (ANXA1) |
F- CTGCCTGACTGCCCTTGTGA R- GTTTGTGTCGTGTTCCACTCCC |
NM_206906.1 |
| TNF Receptor Associated Factor 3 (TRAF3) |
F- CTGAGAAAAGATTTGCCAGACCA R- CATGAAACCATGACACACGGG |
XM_040672268.1 |
| Excitatory amino acid transporter 3 (EAAT3) |
F- GGTGAAGGCGGACAGGAA R- TGCTGAGCAGGAGCCAGTT |
XM_424930.7 |
| Glucose transporter 2 (GLUT2) |
F- GAAGGTGGAGGAGGCCAAA R- TTTCATCGGGTCACAGTTTCC |
NM_207178.1 |
| Glucose transporter (GLUT5) |
F- CCTCAGCATAGTGTGTGTCATCATT R- GGATCGGACTGGCTCCAA |
XM_040689119.1 |
| Peptide transporter 1 (PepT1) |
F- GACAACTTTTCTACAGCCATCTACCA R- CCCAGGATGGGCGTCAA |
NM_204365.1 |
| Peptide transporter 2 (PepT2) |
F- TGAAAAACCGCTCCCATCA R- TGTTCCGATGCCCAGTCAA |
NM_001319028.1 |
| Sodium dependent glucose cotransporter 1 (SGLT1) |
F- AGCATTTCAGCATGGTGTGTCT R- TGCTCCTATCTCAGGGCAGTTC |
NM_001293240.1 |
| Glyceraldehyde 3-phosphate dehydrogenase (GAPDH) |
F- CCTAGGATACACAGAGGACCAGGTT R- GGTGGAGGAATGGCTGTCA |
NM_204305.1 |
For each gene, the sequences for forward (F) and reverse (R) primers and the NCBI accession numbers used are listed.
Table 3.
Effects of a phytogenic feed additive on average daily gain (g/bird), average daily feed intake (g/bird), and feed conversion ratio during a 42 d necrotic enteritis (NE) challenge.
Table 3.
Effects of a phytogenic feed additive on average daily gain (g/bird), average daily feed intake (g/bird), and feed conversion ratio during a 42 d necrotic enteritis (NE) challenge.
| Dietary Treatments1 | Statistics | |||||
|---|---|---|---|---|---|---|
| NC | PC | CQ15 | CQ30 | SEM2 | P-value | |
| Days 0 to 8* | ||||||
| BW | 175.22 | 176.23 | 180.16 | 176.02 | 2.09 | 0.3593 |
| ADG | 21.93 | 22.35 | 22.55 | 22.42 | 0.23 | 0.2752 |
| ADFI | 18.85 | 19.59 | 20.34 | 19.50 | 0.37 | 0.0625 |
| FCR | 0.86 | 0.88 | 0.90 | 0.87 | 0.02 | 0.3593 |
| Days 9 to 14 | ||||||
| ADG | 34.02 | 36.07 | 34.70 | 32.42 | 1.30 | 0.2724 |
| ADFI | 45.26b | 46.11ab | 48.51a | 45.07b | 0.88 | 0.0373 |
| FCR | 1.34 | 1.29 | 1.42 | 1.39 | 0.06 | 0.3687 |
| Days 0 to 14 | ||||||
| BW | 364.13 | 376.94 | 379.01 | 365.46 | 5.72 | 0.1698 |
| ADG | 31.03 | 31.93 | 31.56 | 31.55 | 0.56 | 0.7272 |
| ADFI | 34.16b | 34.59b | 36.60a | 35.45ab | 0.49 | 0.0081 |
| FCR | 1.10 | 1.09 | 1.16 | 1.12 | 0.02 | 0.1278 |
| Days 15 to 28 | ||||||
| ADG | 69.02 | 69.77 | 72.32 | 69.70 | 1.34 | 0.3370 |
| ADFI | 105.99 | 106.41 | 108.88 | 107.80 | 1.51 | 0.5229 |
| FCR | 1.54 | 1.53 | 1.51 | 1.55 | 0.01 | 0.1982 |
| Days 0 to 28 | ||||||
| BW | 1348.78 | 1370.61 | 1381.27 | 1389.33 | 22.61 | 0.1679 |
| ADG | 53.74ab | 55.59a | 55.81a | 53.09b | 0.78 | 0.0468 |
| ADFI | 75.14 | 76.90 | 78.00 | 75.06 | 0.90 | 0.0782 |
| FCR | 1.40 | 1.38 | 1.40 | 1.41 | 0.01 | 0.1705 |
| Days 29 to 42 | ||||||
| ADG | 111.73 | 112.65 | 114.45 | 111.66 | 3.02 | 0.9061 |
| ADFI | 177.38 | 182.62 | 182.93 | 175.35 | 2.25 | 0.0553 |
| FCR | 1.60 | 1.62 | 1.60 | 1.57 | 0.03 | 0.7096 |
| Days 0 to 42 | ||||||
*In each row, numbers with different letters (a-b) differ significantly 1Treatments included negative control (NC): corn-soybean meal basal diet, positive control (PC) NC + 50g/MT of BMD and NC + 15 and 30g/MT of Clarity Q (CQ15 and CQ30 respectively) 2Standard error mean (SEM) represents values of 10 replicate pens of 30 birds/pen.
Disclaimer/Publisher’s Note: The statements, opinions and data contained in all publications are solely those of the individual author(s) and contributor(s) and not of MDPI and/or the editor(s). MDPI and/or the editor(s) disclaim responsibility for any injury to people or property resulting from any ideas, methods, instructions or products referred to in the content. |
© 2024 by the authors. Licensee MDPI, Basel, Switzerland. This article is an open access article distributed under the terms and conditions of the Creative Commons Attribution (CC BY) license (https://creativecommons.org/licenses/by/4.0/).
Copyright: This open access article is published under a Creative Commons CC BY 4.0 license, which permit the free download, distribution, and reuse, provided that the author and preprint are cited in any reuse.


