
Submitted:
12 June 2023
Posted:
13 June 2023
You are already at the latest version
Abstract
China is rich in coal resources under water bodies. However, for a long time, the safety prediction of high-intensity mining under water bodies is one of the problems encountered by the coal industry. It is of great significance to realize safe mining under water bodies, improve the recovery rate of coal resources and protect reservoir resources. Therefore, this article takes the No. 5 coal seam and No. 11 mining area of Wangwa Coal Mine as the research object, and integrates physical simulation, numerical simulation, theoretical analysis and other methods to study the development height of water-conducting fracture zones in fully mechanized top coal caving mining. Solid-liquid coupling physical simulation test reveals the failure characteristics of overlying strata in goaf and the seepage law of reservoir water under the influence of mining. By comparing the monitoring data of borehole leakage, the measured data obtained by borehole peeping with the height data of water-conducting fracture zone obtained by the traditional empirical formula of three-under standard, the error between the two is as high as -29.39 %. In this case, the variance correction coefficient is used to correct the empirical formula, and on this basis, in order to effectively protect the surface water dam and water body, the mining height of coal seam in the working face with limited height mining is inversely derived. The research results provide a basis for the safety prediction of high-intensity mining under the reservoir dam in the ecologically fragile areas of western China and provide a scientific guarantee for the formulation of safety measures under such conditions.
Keywords:
Coal mining under reservoirs
; High-intensity mining
; Green mining
; Physical simulation
; Water conducting fracture zone
1. Introduction
As the leading energy source in China, the safe and efficient exploitation of coal resources is a major strategic demand for China. China's "double carbon" strategic goal and the "14th Five-Year Plan and Outline of Vision Goals for 2035" also clearly put forward to hoist the safe and efficient utilization of coal and other fossil energy resources [1]. However, there are still a large number of coal resources under high-quality water bodies, and according to incomplete statistics, nearly 10 billion tons of coal resources are pressed under various types of water bodies in China, which seriously affects the service life of mines. Moreover, the protection of these high-quality water bodies and the safe mining of coal resources pressed under water bodies are one of the problems that need to be solved and improved in China's coal industry [2]. The disorderly development of coal will bring groundwater damage and surface ecological damage [3], so China attaches great importance to the protection of water resources in mining areas, and in 2013, the National Development and Reform Commission issued the Development Plan for the Utilization of Mine Water [4]; in 2014, the State Council issued the Action Plan for the Prevention and Control of Water Pollution (Water Ten), which clearly pointed out that: to promote the comprehensive utilization of mine water, the supplementary water in coal mines, surrounding areas production and ecological water should give priority to the use of mine water [5]. The issue of mining under water bodies should not only consider safety issues, especially in the western ecologically fragile areas but also take into account the protection of precious freshwater resources on the surface and water conservation facilities [6].
In the study of underground mining of water resources in western ecologically fragile areas, the hydraulic fissures caused by underground coal mining are the root cause of groundwater loss and surface ecological deterioration [8], and the study reveals the development pattern of mining hydraulic fissures in western mining areas, which is of great significance for the realization of regional coal green mining [8]. Wu Qiang [9] et al. discussed the concept of construction and development of dual-resource coal mines, and proposed the optimal combination of the "trinity" of mine groundwater control, utilization, and ecological environmental protection, the separation of underground gushing water, combined surface and underground drainage, and mine water resources, and other "coal-water The specific technical methods for the construction of "dual resource mines". Wang Shuangming [10-12] and others evaluated the zoning of water conservation mining in terms of hydrogeological conditions and water level burial depth to target appropriate water conservation mining methods, which initially formed the basic framework of water conservation mining research. Fan Limin [13-15]and others considered that in water-scarce mining areas in western China, coal mining, water resources protection, and ecological environment safety should be developed in a coordinated way through rational layout and scientific mining. In 2000, we also measured the fracture height of coal seam after mining according to the consumption of flushing fluid in the borehole. Huang Qingxiang [16-18] analyzed the characteristics of the water-holding rock group in the aquifer, and he also classified water-preserving coal mining into three types, namely, natural water-preserving mining, controlled water-preserving mining, and special water-preserving mining. Chi Mingbo [19] et al. considered the resource properties of water and gave a set of evaluation systems to define and calculate the water resource carrying capacity. Zhang Jie [20] et al. used physical simulation tests to study the damage law of shallow coal seam overburden and pointed out that the mining height is the main factor affecting the development height of the water-conducting fracture zone. Lai Xingping [21] et al. used physical similar simulation test to investigate the law of water-conducting fissure zone development in the comprehensive release working face of three soft coal seams. They discovered that the law of mining intensity on the reservoir area and the periodic incoming pressure will cause an increase in water gushing at the working face.
The above research concepts of green mining and water conservation mining have an important role in the research of predicting the height of water-conducting rift zone on the roof of coal seam, but due to the complex geological environment of mines in northwest China, the surface is covered by thick loess layer, and the mining disturbance on the surface is intense under the geological conditions of extra thick coal seam, resulting in the obvious and complicated development of water-conducting rift zone, and no reliable prediction of the height of water-conducting rift zone development in comprehensive mining has been formed so far. Formula, the research on the development height of water-conducting fracture zones under different geological conditions has always been a key research topic for mine geologists in China. Based on the above and a large number of research results, the industry has revised and compiled new specifications and guidelines [22], which provide scientific guarantee for guiding the safe mining of coal in the coal mines "under three". From the perspective of coal production, mining under water bodies is more concerned with the safety of the coal mine itself, but often neglects the safety and normal use of the water body itself and hydraulic structures [23], such as mining under reservoirs, as the reservoir itself carries the role of flood control, water storage, irrigation, power generation, breeding, etc., so the safety of reservoir water bodies and dams must also be given attention. In this paper, the feasibility and safety of coal seam mining under the reservoir of Wangwa coal mine in the western ecologically fragile area are analyzed and discussed in the context of high-intensity mining under the dam of the mine's pea ditch reservoir to provide a reference and reference for safe mining under similar conditions.
2. Project Summary
Wangwa coal mine is located in Wangwa town, Ningxia Hui Autonomous Region, Ningxia Wangwa coal mine is a key poverty alleviation project established by the autonomous region to solve the fuel structure in the mountainous area of Ningnan, the mine is now approved production capacity of 6 million tons per year, currently mining No.5 coal, coal seam depth of 432.81m, the average coal thickness of 9.08m, is a very thick coal seam, mining height of 3m, coal release height of 6.08m. There is an artificial reservoir in the southwest of the well field, with a total storage capacity of 770,000m³. The reservoir is a national poverty alleviation project, which provides water for local agricultural irrigation and serves as a local humanistic landscape project. The reservoir is located within the mining area of the No.11 mining area of Wangwa coal mine, running through 110503, 110505, 110507 and 110509 working faces in No.11 mining area, The layout and stratigraphy of the mine working faces are shown in Figure 1.
According to the stratigraphic diagram of the working face of mining area No.11, the surface of the mine area is covered by thick soil layer, the roof of the coal seam is mainly siltstone and mudstone, the lithology of the roof is good, more horizontal laminations and small interlocking laminations are developed, only a small amount of fine sandstone and coarse sandstone is distributed in the north, the thickness is 0.50~34.05m, the average thickness is 4.11m. However, because there is an artificial reservoir on the No.11 mining area, and the working surface of the mine is mined by the long-wall retreat type and comprehensive mechanized low-level top coal mining method, all the roofs are managed by the collapse method. The mining disturbance is severe, and the development law of the water-conducting fissure zone has not yet been explored.
3. Analysis of fracture evolution of high-intensity mining overburden under reservoir dams
3.1. Experimental design of physical simulation
Since the mine does not have a clear grasp of the overburden rock transport and fissure distribution under the mining conditions of 110505 working face, and the engineering period is long and costly if the field engineering measurement is carried out blindly, the working face with similar endowment conditions and the safety hazard of water breakout is selected as the simulation prototype to conduct physical simulation experiments [24] to study the overburden rock breakout movement and fissure distribution of the high-intensity mining working face under the reservoir dam. distribution. In order to simulate the destruction characteristics of the overlying rock layer on the working surface under the 110505 mining area and the development height of the water-conducting fracture zone, based on the solid-liquid coupling test platform [25], using river sand as aggregate and cement and white powder as cementing material for ratio test, developing non-hydrophilic solid-liquid coupling material [26], and using high-precision water molecule tester, infrared imager [27], total station and borehole peeper for the monitoring of the top slab water influx, hydraulic fracture zone, overburden movement. Based on the simulation test similarity theory, the parameters of coal seam depth and coal seam thickness in the simulated mining area [28], combined with the test bench geometry, the similarity constants selected for this test were divided into two parts. The similar material model parameters and material ratios are shown in Table 1, and the model design is shown in Figure 2.
The settlement information of the model is monitored by pre-set measurement points on the surface of the experimental model, specifically by laying 4 rows of measurement lines from A to D, 14 measurement points per row, 56 measurement points in total, along the horizontal direction in the overlying rock seam of the coal seam mining. The distance between the measurement points is 10cm and the distance between the rows is 20cm.
The experiment used borehole peeping instruments to monitor the fracture development inside the model during the workings retrieval process. Three boreholes were arranged in the model, which were located at the location of the flood release area below the dam, and at the junction between the surface loess layer and water at the edge of the dam and reservoir.
3.2. Overlying rock layers and dam body rock transport evolution pattern
Mining of the No.5 coal working face in No.11 mining area of Wangwa coal mine caused transport damage and fracture dynamic evolution of the overlying rock layer, which posed a threat to the stability of the reservoir and the dam, thus affecting the safe mining under the reservoir. Based on the mining damage theory [29-31] and by monitoring each observation point, the overburden rock collapse height, overburden rock subsidence and surface subsidence curves during the mining of the No.5 coal working face were plotted as shown in Figure 3.
As the No.5 coal working face advances continuously, the overlying rock layer occurs pulling and cracking, direct top initial collapse, basic top breaking and ground surface sinking. When the working face advances to 85m from the upper coal pillar dam body level distance, the delamination phenomenon is significant, the roof rock layer collapses along the coal wall behind the formation of articulation structure, the surface movement deformation is not obvious, the surface occurs weakly sinking; to 118m, at this time the collapse zone height no longer continues to develop upward, the overlying rock fissures are mainly horizontal fissures, the roof plate occurs larger sinking, fissure zone upward development; to 148m, the roof plate At 148m, the top plate collapses, the upper part of the overlying rock forms an articulated structure, the original lower part of the cladding layer gradually closes, generating new overlying rock cladding layer, the overlying rock layer sinks but still plays a bearing role; at 175m, because the overlying rock layer is hard, the fractures develop to a certain extent and fractures appear, the overlying rock layer sinks so that the collapse height increases, and vertical fractures are produced at the open-cutting eye; at 200m, the mining area is compacted, each rock layer is mainly The overall bending and sinking of the rock layers mainly appears but does not expand, the amount of surface sinking increases sharply, and the sinking amount reaches 4.6m; to 223m, at this time, the overlying rock fissures above the working face are mainly horizontal fissures, and the fissure zone no longer continues to develop upward; advancing to 260m, the overlying rock collapses in a large area, and the articulation structure is formed on the left side, the overlying rock layers sink, and the original lower part of the fissures gradually close; Due to the thicker coal seam, the overall surface subsidence is larger, forming a "concave" basin. It is found that the surface subsidence near the left and right boundaries is smaller because the boundary effect causes the left and right boundaries as the overlying rocks do not fully collapse, and the surface subsidence is the largest.
As shown in Figure 4, after the recovery of the working surface, the distribution of the overlying rock layer collapse zone and the fracture zone is obvious, and the overlying rock collapse occurs in a large area. The height of the collapse zone is 52.4m, the hinged structure is formed on the left side, and the coal wall collapse angle is 64°, the overlying rock layer sinks, and the original lower part of the detachment gradually closes, the form of destruction is mainly the separation or cracking along the layer and the cracking or fracture of the layer vertically or obliquely. The maximum height of the collapse zone of the Wangwa coal mine is 52.4m, and the maximum collapse ratio is 6.1, which is within the theoretical range.
In the fracture zone, due to the influence of cyclic incoming pressure, the axial stretching of the overlying rock layer exceeds the limit it can withstand, and the infrared chromatogram reveals that the overlying rock layer has obvious stretching fractures and continues to extend, finally, the damage occurs at the corner which leads to instability. In the bottom part of the formation near the collapse zone, the interlayer delamination cracking is obvious, the delamination is good, vertical or inclined fractures are developed, and in the upper part of the formation, the interlayer delamination cracking gradually decreases, the multi-layer combination characteristics are strengthened, vertical fractures are reduced, and most of them are microfractures occurring in the upper and lower levels of the formation, there are few fracture fractures, the horizontal and vertical fractures are poorly connected, and the continuity of the formation is good.
3.3. Reservoir water seepage pattern
The model water level and humidity distribution were measured and recorded during the excavation process. The data recorded by the test process plotted the variation law of overburden humidity with the working face advance distance, as shown in Figure 5. It can be seen from the figure that the humidity of the rock layer 50m below the reservoir before excavation is obviously larger than that of 100m, 200m and 300m below the reservoir, which is due to the infiltration of surface water, and the humidity of 200m below the reservoir is smaller than that of 300m below, which is due to the different degrees of dryness and wetness of the model before excavation; the humidity of the overlying rock below the reservoir is on the rise with the increase of the working surface advancement distance, and when the working surface advances to 178m The rising rate of humidity at 50m below the reservoir is due to the increase of surface water infiltration under the reservoir destruction. Until the excavation of the working face is completed, the humidity of the rock layer 50m below the reservoir is 93%, which is 60% higher than the humidity of the rock layer before the excavation of the model, and the humidity of the rock layer 100m below the reservoir is 82%, which is 55% higher than the humidity of the rock layer before the excavation of the model; the humidity of the rock layer 200m and 300m below the reservoir has not changed, which means that the surface water has not infiltrated to 200m below the reservoir. The dynamic observation of bedrock and water barrier destruction process during the process is carried out with the help of infrared imager. When the fracture development occurs in the observation area accompanied by energy release, the infrared imager can well monitor this microscopic change and characterize the fracture field development by means of infrared chromatogram cloud map. When the model excavation is completed, the infrared temperature chromatogram cloud map shows that the overlying rock layer is destabilized and destroyed, while the bedrock develops upward along the broken angle of about 64°, and at the same time the water level of the loose aquifer decreases, and the water content tester monitors that the working face advances within the distance of 0~160m, and the water level decreases uniformly and slowly, and the humidity rises at a faster rate of 93% at the place below the reservoir when advancing to 172m, which is due to the destruction of the reservoir The amount of surface water infiltration increased. The upper part of the aquiver layer produces small cracks due to tensile action, and the seepage rate of surface water to the aquifer and the diffusion on the right side of the dam body are accelerated. After the working surface is pushed to 210m, the water level decline rate slows down due to the re-closing of the small cracks of the water barrier. In summary, it can be seen that the impact on the surface is inconsistent with the advancement of the working surface to different locations. The water level decreases from 50 mm to 12 mm after the end of the excavation of the whole model, with a decrease ratio of 76%.
3.4. Overlying rock fracture development characteristics
(1) Fracture development quantity characteristics
The fracture development of the overlying rock layer can reflect the damage of the overlying rock more intuitively after being affected by mining. In the physical simulation experiment, the fracture development inside the overlying rock was detected by using a borehole peeper, and the supporting K-12A borehole image software was used to view and read the fracture development inside the borehole and compare it, and the number of fractures inside the borehole was plotted [32] as shown in Figure 6
After finishing the face mining, the fissure development azimuth of drill hole 1# is concentrated in the range of 170°~270°. The fissure development azimuth of drill hole 2# is concentrated in the range of 229.5°~360°and a small amount of fissure is in the range of 0°~22.5°. The fissure development azimuth of drill hole 3# is concentrated in the range of 270°~360°. The azimuth of fracture development in drill holes 1#, 2# and 3# is similar from the figure, and they are all located in the range of 180°~360°. In the actual production process, the mine advances from north to south. The experimental analysis suggests that the development of overburden fissures during the workings retrieval process is mainly located in the due west direction.
(2) Surface fracture development characteristics
According to the law of surface movement deformation and distribution, within the influence of mining subsidence, the surface of the peripheral area of the mining boundary of the working face is in the state of horizontal tensile deformation. When the tensile stress exceeds the tensile strength, fractures will appear on the ground surface, which are initially formed and developed in the horizontal tensile deformation zone of the ground surface at the periphery of the working face.
With the advancement of the working face, it gradually closes after transitioning to the horizontal compression deformation zone above the working face. After finishing the face mining, the reservoir water drained observed in the reservoir and the dam body to produce horizontal fissures and horizontal vertical fissures, as shown in Figure 7. In the slope of the dam body produces a 3mm wide crack through the reservoir, fully indicating that the reservoir and the dam body will be affected by the mining disturbance, there is a certain safety hazard to the actual production, so the actual production site should do a good job of the corresponding safety and waterproof measures.
4. Simulation analysis of overburden rock under different mining intensity of fracture
In order to make the observation of the spatiotemporal response law of the development of three zones with different mining intensity under the water body more intuitive, the solid-liquid coupling model was constructed relying on MIDAS and FLAC3D, and the following assumptions were made: the self-gravity stress field was the original stress field; the coal body after mining was treated with no water and no pressure; the isotropic flow criterion of saturated steady flow was adopted for the fluid ontology model. The parameters such as porosity and permeability coefficient of the rock body refer to the actual measurement data of Wangwa coal mine.
4.1. Numerical modeling of fluid-solid coupling
Wangwa coal mine depot area under the 110505 working face as a geological prototype, and establish a three-dimensional model size of 400m × 300m × 450m, the model is divided into 680400 units, the height of the coal seam is 9.08m, the coal seam is arranged along the direction, the working face direction length is set to 300m, the coal seam dip angle selected value of 6 °, the establishment of the model shown in Figure 8. The overlying bedrock of the coal seam is 423m, and the water-bearing layer is a weak water-rich aquifer. The left, right and lower boundaries of the model are displacement fixed constraint boundaries, and the upper boundary is stress boundary, and the uniform load is applied according to the thickness of the overlying rock layer. Considering the model boundary effect, the left mining boundary is 50m from the left boundary of the model, and the right mining boundary is 50m from the right boundary of the model, and each excavation is 10m. According to the control chart of the upper and lower wells, the profiles are carried out along the working face direction, and the overburden plastic zone, vertical stress distribution law, overburden displacement change, horizontal displacement change and other change laws are studied respectively according to the mining method after the excavation of the working face.
4.2. Simulation analysis of damage characteristics of overlying rock formations
By observing the range where the overlying rock layer yielded and broke during the advancing process of the working face, the corresponding response characteristics in time and space were analyzed. In order to reflect the deformation law of the overlying rock layer more intuitively, the simulation results of plastic zone, displacement zone and stress zone of the overlying rock are used for analysis, and the data are extracted and processed for visualization, and the calculation results are reflected in the form of a cloud diagram, as shown in Figure 9.
From the simulation results, it can be seen that when the working face advanced to 30m, the direct top came to pressure for the first time, which led to the central fracture, but still in the articulation state; the shear stress damage was dominant at both ends of the working face, and the plastic zone range was developed along the coal seam direction, and the broken ring range was about 8m; shear and tensile damage occurred in the central area, forming an inverted funnel shape, and the maximum height of the plastic zone was 24.6m, indicating that the initial collapse of the old top had occurred. The first cycle of the old roof came to pressure and the height of the collapse zone reached 24.6m.
When the working face advances to 90m, the plastic zone of the working face roof increases, the displacement diagram of the rock layer above the mining area is similar to an "arch" shape, and the surrounding rock expands upward continuously. When the working face is advanced to 300m, the plastic zone of overburden and pressure relief zone reach the maximum. When the working face advances to 120m, the old top fissure develops gradually, the top plate sinkage increases, and is irregularly collapsed, the maximum height of the overburden plastic zone in the middle of the working face is 92m, and the maximum height of the top plate plastic zone at the end is 53m, the height of the collapse zone is 48m and no longer developed, and the height of the fissure zone is 51m. When the working face advances to 180m, the end of the working face is located at the left border of the dam body, the development of hydraulic fissure is larger, and the overlying rock layer is obviously bending and sinking, the overlying rock plastic zone continues to expand and is more obvious in height, showing a nearly symmetrical saddle shape, the maximum development height is located in the left side of the mining area above the oblique. When the working face advances to 210m, it can be seen from the figure that the top plate of the coal seam is still in the state of tensile stress damage, and the width of the damage zone in front and behind the coal wall of the working face does not change much, but the width of the plastic zone in front and behind above the mining void area has increased to 104m. The scope of the overlying rock damage has penetrated the coarse-grained sandstone in the uppermost section of the Zhiluo Group, and a smaller plastic zone has appeared on the right side of the reservoir and the dam body, indicating that the mining disturbance has rippled to the reservoir and dam body, the overburden plastic zone range nearly expanded, plastic area continues to expand. When the working face is mined at 240m, it is clear from the figure that the plastic zone on the left side continues to develop upward, and the development form on the right side gradually takes the shape of an arch. At this time, the shear damage is mainly distributed in the front of the coal seam advance, that is, the rear of the coal seam advance is basically stable, and the impact of mining on it is very little. When the working face is mined for 300m, the damaged width of the front and back of the coal wall is about 15m, and the damaged area above the coal wall on both sides of the mining area develops and connects to both ends, and new shear damage areas appear in the upper two ends of the model. The development height of the water-conducting fractured zone is about 168m after the mining of the working face is finished, the rock layer of Yan'an Group and Zhiluo Group above the working face has been basically destroyed, and the fracture has extended to the bottom of the Anding Group, which may have a greater impact on the diving and seepage activities of the aquifer.
4.3. Development height of hydraulic fracture zone of overburden rock under different mining height
The mining height is an important factor affecting the height of the hydraulic conductivity fracture zone, which directly influences the development height of hydraulic conductivity fracture zone. Under the condition of keeping the thickness, burial depth and slope length of loose layer unchanged, the height of water-conducting rift zone development in overlying rock is studied by simulating different mining heights (2, 3, 4, 5, 6, 7, 8 and 9m), as shown in Figure 10.
As the mining height is increasing, the more space is given for the overburden to collapse. When the mining height is 2m~3m, the development height of water-conducting fissure zone is 23~36m, which is 12 times the thickness of the mining, the direct top collapse, and the overburden around the collapse area will be affected by tensile stress, at this time also appear vertical fissure, slowly vertical fissure more and more, there is an arch-shaped water-conducting fissure circle.
When the mining height is 4~5m, the development height of hydraulic fracture zone is 42~58m, which is 11 times the thickness of the mining, the hydraulic fracture zone has been developing upward, and the off-layer fracture and longitudinal fracture are also increasing gradually, the off-layer fracture and off-layer amount are more obvious when the mining height is 4~5m than when the mining height is 2~3m. When the mining height is 6~7m, compared with the mining height of 2~5m, the scope of direct top collapse is bigger, the overlying rock layer is affected by mining to expand the scope, and the higher rock layer starts to appear fissures, at this time, the hydraulic fissure zone has developed a height of about 90m. When the mining height is 8~9m, after reaching the full mining, two aspects will appear the maximum, one is the height of hydraulic fissure zone development; the other is the amount of surface subsidence. The final development height of hydraulic fissure zone is 163m when the mining height is 8m~10m. Through the above analysis, we can find that the development height of hydraulic fissure zone increases linearly with the increase of mining height. Therefore, as an important factor affecting the development height of hydraulic fissure zone, the mining height has an important influence on the safety of coal mining.
5. Field measurement of overburden damage height
5.1. Drill hole location and program design
Based on the physical simulation and numerical simulation, the actual measurement scheme was designed to determine the overburden damage height. Two post-mining observation holes are arranged above the working face. Since the coal seam under the reservoir dam has not been mined yet, the holes are arranged in the adjacent mined working face to guide the upcoming working face.
This observation uses the drilling flushing fluid leakage method to obtain the development of hydraulic conductivity fractures in the post-mining overburden. In order to reflect the general rule of overburden damage after mining at the working face, two drill holes were drilled 285m apart and located within the inclined centerline of the 110503 working face, and the drill holes were arranged as shown in Figure 11.
5.2. Detection results and analysis
At present, the most common and accurate method for detecting the height of overburden hydraulic fracture zone is the drill hole flushing fluid leakage method, which is used to determine the development height of overburden hydraulic fracture zone by recording the leakage amount of flushing fluid and the change of water level in the drill hole during the drilling process. The observation of drilling flushing fluid leakage is carried out simultaneously with drilling, and the water level of the water source tank is measured when the flushing fluid forms a cycle, and the drilling depth is recorded. Thereafter, the water level of the water source tank and the hole depth of the borehole were recorded once for every 0.5m of drilling, and the water level in the hole was recorded once for every 6m of drilling until the end of the observation of interruption of flushing fluid circulation, and the observation of flushing fluid leakage from the borehole was schematically shown in Figure 12.
From Figure 13(a), it can be seen that the amount of flushing fluid leakage starts to change at hole depth 267m, and suddenly increases and enters the top of the fracture zone; the drilling is drilled to 287m for plugging, and continues top leakage drilling after the plugging is ineffective; the hole does not return to the slurry when drilling reaches 358.60m, all the flushing fluid is lost, there is no water in the hole after up-drilling, and there is obvious wind absorption phenomenon in the hole. The amount of flushing fluid leakage, water level change and abnormal phenomenon in the hole were combined, and the rock layer at 266m deep was judged to be the top boundary of the fissure zone, and the top boundary of the collapse zone was judged to be at 358.60m deep.
From Figure 13(b), it can be seen that when drilling to 262m, the flushing fluid leakage was interrupted and gradually increased, and at 283m deep, all flushing fluid was lost, and no water was returned after repeated water injection tests. In order to investigate the height of the collapse zone, we drilled to the hole depth of 382.90m when all the flushing fluid was lost and decided that this was the top boundary of the collapse zone.
Comprehensive geological compilation of cores and drilling peeps obtained that the position of the top interface of fissure zone development is about 234.85m in the hole depth of Hole No.1, and the height of water-conducting fissure zone development is 161.15m, which is 17.9 times of the mining thickness. The location of the top interface of the collapse zone is around 352m deep in Hole No.1, the height of the collapse zone is 39.85m, and the collapse ratio is 4.4; the location of the top interface of the fracture zone development in Hole No.2 is around 253.8m deep, the height of the water-conducting fracture zone development is 170.76m, which is 19 times of the mining thickness, and the location of the top interface of the collapse zone is around 225.24m deep in Hole No.2, the height of the collapse zone is 47.76m, and the collapse ratio is 5.3. The height of collapse zone is 47.76m, and the ratio of collapse to mining is 5.3; the development height of 5 coal bending and sinking zone has reached the surface, and the surface is subject to uneven settlement to produce tensile fissures.
5.3. Three-band height formula correction analysis
Since the physical simulation and numerical simulation are already simplifying the relevant geological conditions, there are deviations between their obtained data and the actual data in the field. Therefore, in order to get more accurate research data, based on the above comprehensive analysis, four groups of data from similar physical simulation experiments, numerical simulation experiments, empirical formula analysis and field actual measurement are compared with the measured maximum value: the height of collapse zone is 47.76 m, and the height of water-conducting fracture zone development is 170.76 m. According to the empirical formula of water-conducting fracture zone height:
Where: is the height of collapse zone, is the height of hydraulic fracture zone, M is the thickness of coal seam mining, take 9m.
According to the formula of the height of the hydraulic fracture zone, the height of the overlying rock collapse zone in the mining area is 34.07~42.42m respectively; the height of the fracture zone development is 99.74~120.57m. In the process of using downhole quantitative detection, the amount of water injection leakage within this height should be focused on observation.
The experimental observations and the values calculated by the empirical formula are now compared and analyzed as shown in Table 2.
As shown in Table 2, the height of hydraulic fracture zone calculated by empirical formula has a large error of -29.39% with the field measurement results. According to the calculation results in Table 2, because the field observation results of the development height of hydraulic fissure zone of mining overburden differ greatly from the calculation results of empirical formula, and the development height of hydraulic fissure zone of mining working face is not clear, so for the sake of safety, the maximum field observation data is taken as the height of hydraulic fissure zone under the conditions of this mine, and the traditional "three lower The height of the collapse zone and the height of the hydraulic fissure zone of the traditional "three down" empirical formula are expected to be significantly lower than the measured values, which will have certain safety risks if the relevant safety regulations are formulated in this way, while the prediction model of similar simulation experiments, numerical simulation and the actual measured values in the field are in good agreement, with an error of less than 5%. Therefore, the traditional empirical formula of "three lower" specification is optimized by using the variance coefficient to meet the actual needs of production mines. The standard deviation theory is applied to analyze the height of hydraulic fracture zone and the height of collapse zone, namely:
where: is the average of the data. The root mean square error of the collapse zone and the hydraulic fracture zone of Wangwa coal mine 11 mining area are 7.86 and 20.01, respectively, by substituting the data obtained from the above four methods into equation (4). the variance correction coefficient is brought into the empirical formula to obtain the hydraulic fracture zone correction formula applicable to the high-intensity mining under the dam of the reservoir in the western ecologically fragile area:
Where: is the correction working face collapse zone height; is the correction working face hydraulic fracture zone height; is the cumulative mining thickness of coal seam; k is the variance correction coefficient.
In summary, under the condition of thick coal seam comprehensive discharge mining under the reservoir dam body, the overlying rock layer water conductive fracture zone penetrates to the surface, resulting in downward leakage of reservoir water and causing damage to the reservoir dam body, which causes loss to the local ecological environment and agricultural development, so it is necessary to reduce the impact of underground mining disturbance on the surface and other methods for economic analysis. ①Currently infill mining, as an important method of green mining at this stage, has a wide range of application, but because the No.11 mining area working face of Wangwa coal mine is located under the dam of the reservoir, which leads to the engineering difficulty of filling materials from the ground borehole into the mining area, when the pipeline is laid from underground, it indirectly leads to the increase of the production cost of the mine, so it is not applicable to this mine; ②Moving and Pouring Face is the simplest one method to deal with the problem of coal seam mining under complex geological conditions, but due to the strict management of coal resources at this stage of the country, in order to avoid the waste of coal resources and coal mines in the economic loss, so this method may not be used. As a mining method that does not add extra cost, ③limited height mining ensures the safety of coal mines and the safety of workers on the basis of ensuring the safe production of coal mines, and effectively reduces the situation of flooding caused by surface water gushing into the working face due to the penetration of the hydraulic fracture zone to the surface, thus achieving the purpose of green mining.
Through the field observation of the leakage amount of the borehole is known that the height of the hydraulic fissure zone development of 170.76m, the development to the sub-clay water barrier below, and the reservoir dam body deformation damage, after physical simulation experiments to bend down above the belt for the water barrier, and by the mining height of the influence is obvious, in order to avoid in the actual production process because of mining height is too large and cause the dam and the reservoir area water seepage into the ground, so in order to avoid the infiltration of water from the dam and the reservoir area into the ground during the actual production process, the development height of the water-conducting fissure zone should not be similar to that of the water-insulating soil layer. According to the experimental results, the safe height of water-conducting fissure zone is controlled at 82.88m, which is reintroduced into the correction formula (5), and the back calculation shows that when the safe mining height of the working face is 2.6~4.2m, the development range of water-conducting fissure zone can be controlled at a safe height, that is, when the mining height is reduced to 2.6m, the water barrier under the reservoir water body can be in a stable and continuous state, so as to ensure the safety of the reservoir water body Stability, thus reducing the large deformation of the ground dam caused by underground mining and the reservoir water gushing into the working face, reducing the incidence of flooding accidents and ensuring the safe production of the mine.
According to the "Three Underground Coal Mining Regulations", "Technical Specification for Water Conservation Coal Mining" (DB61/T 1295-2019) and the "Design Specification for Embankment Project Management", combined with the above correction results of the three belt heights of the mine, and with reference to the research on the management of coal mining collapse under lakes and rivers in China, therefore, at this stage, using the method of limiting the height of mining 2.6m and the original working face equipment remains unchanged, the mining height of the coal seam is reduced. Therefore, at this stage, under the condition of using the 2.6m mining height limit method and the original working face equipment remains unchanged, reducing the mining height of the coal seam can effectively avoid damage to the dam and the water body due to mining disturbance, and at the same time, engineering measures such as pre-raising the dam, grouting and seepage control have been taken to ensure the safe recovery of the coal mine. Up to now, the working face under the reservoir dam of Wangwa coal mine has been safely re-mined, and the water volume of the reservoir is stable during the re-mining period, and the water consumption of the working face is always within the safety surge threshold of 94m3/h. This indicates that the safety of high-intensity mining under the water body can be greatly improved by accurate correction prediction of the guide height zone.
6. Conclusion
By analyzing the rock assignment of 5# coal seam, geological structure and hydrogeological data of Wangwa coal mine, physical simulation, numerical simulation and theoretical analysis were used to study the prediction of safety under the reservoir dam of Wangwa coal mine, and the following main conclusions were reached:
(1) Based on the solid-liquid coupling test platform, drilling peephole, infrared imaging, and moisture monitoring were applied to the simulation experiment, and the number and orientation characteristics of overburden fissure development during the working face retrieval process were analyzed. The use of non-hydrophilic materials as the main body of the model can effectively prevent the disintegration of the model and avoid the loss of surface water during the experiment to interfere with the experimental data. It is fully proved that the realism of physical simulation can effectively predict the development height of hydraulic fracture zone.
(2) Through the numerical model of fluid-solid coupling, it is calculated that the height of hydraulic fracture zone varies from coal seam to coal seam in Northwest China due to the different conditions of its occurrence, so the authenticity and practicality of the traditional "three lower" standard empirical formula will be greatly reduced in this case. Therefore, in order to ensure the accuracy of the data, the physical simulation experiment, numerical calculation and traditional empirical formula are compared to arrive at 162m, 164m and 120.57m of hydraulic fracture zone height respectively, among which the calculation results of the empirical formula are different and need further correction.
(3) Through the on-site monitoring of the amount of leakage in the borehole, the measured data obtained from the borehole TV and the traditional empirical formula for the height of the hydraulic fissure zone data for comparison, the error between the two is as high as -29.39%, which will seriously affect the decision of the site water control work. In this case, an accurate correction of the empirical formula was made to reduce the error value between the empirical formula and the actual measurement, and on this basis, for the protection of surface buildings and water bodies, the coal seam mining height of 2.6m was reversed to ensure safe production as much as possible, and the resources under the water bodies were retrieved as much as possible. In addition, the same geological conditions exist around Wangwa Mine, which provides a basis for decision-making for similar mines in the vicinity.
Author Contributions
T.Y. and J.D. conceived and designed the experiments; B.P. and J.Z. analyzed the data; T.Y.and Y.Z. and H.Y. and J.Z. wrote the paper.
Data Availability Statement
All data generated or analyzed during this study are included in this article.
Acknowledgments
This study was supported by the National Natural Science Foundation of China (NO. 52004200), The agency’s funding is gratefully acknowledged.
Conflicts of Interest
The authors declare no conflict of interest.
References
- National Bureau of Statistics of the People's Republic of China. China Statistical Yearbook [M]. Beijing: China Statistics Press, 2020.
- Liu Gui, Wang Yilong, Gao Chao, etc. Feasibility analysis of multiple coal seams mining under reservoir and dam[J]. Coal Science and Technology,2020,48(10):185-191.
- Zeng Yifan, Wu Qiang, Zhao Suqi, et al. Characteristics, causes, and prevention measures of coal mine water hazard accidents in China[J/OL]. Coal Science and Technology,2023-0500.
- National Development and Reform Commission, National Energy Administration. Development Plan of Mine Water Utilization [R]. Beijing: National Development and Reform Commission, 2013.
- Ministry of Environmental Protection. Water pollution prevention and control action plan: Chinese and English [M]. Beijing: People's Publishing House,2015.
- Wu Qiang, Shen Jianjun, Wang Yang. Mining techniques and engineering application for “Coal-Water” dual-resources mine[J]. Journal of China Coal Society,2017,42(1):8-16.
- Cao Zhiguo, Ju Jinfeng, Xu Jialin. Distribution model of water-conducted fracture main channel and its flow characteristics[J]. Journal of China Coal Society,2019,44(12):3719-3728.
- Cao Zhiguo, Li Quansheng, Dong Binqi. Water Resource Protection and Utilization Technology and Application of Coal Mining in Shendong Mining Area[J]. Coal engineering,2014,46(10):162-164+168.
- Wu Qiang, Li Duo. Research of "Coal-water" double-resources mine construction and development[J]. China Coal Geology.2009,21(3):32-35,62.
- Wang Shuangming, Huang Qingxiang, Fan Limin, etc. Study on overburden aquiclude and water protection mining regionalization in the ecological fragile mining area[J]. Journal of China Coal Society,2010,35(01):7-14.
- Wang Shuangming. Thoughts about the main energy status of coal and green mining in China[J]. China Coal, 2020,46(02):11-16.
- Wang Shuangming, Shen Yanjun, Song Shijie, etc. Change of coal energy status and green and low-carbon development under the “dual carbon” goal[J/OL]. Journal of China Coal Society:1-17[2023-05-22].
- Fan Limin. Development of coal mining method with water protection in fragile ecological region[J]. Journal of Liaoning Technical University ( Natural Science Edition ), 2011,30 (5):667-671.
- Fan Limin, Ma Xiongde, Ji Ruijun. Progress in engineering practice of water-preserved coal mining in the Western eco-environment frangible area[J]. Journal of China Coal Society, 2015,40(8):1711-1717.
- FAN Limin, WU Qunying, PENG Jie, et al. Thoughts and methods of geological environment monitoring for large coal bases in the middle reaches of the Yellow River[J]. Journal of China Coal Society, 2021,46(5):1417-1427.
- Huang Qingxiang. Impermeability Of Overburden Rock In Shallow Buried Coal Seam And Classification Of Water Conservation Mining[J]. Journal of Rock Mechanics and Engineering, 2010,29(S2):3622-3627.
- Huang Qingxiang, Zhang Wenzhong, Hou Zhicheng. Study Of Simulation Materials Of Aquifuge For Solid-Liquid Coupling[J]. Journal of Rock Mechanics and Engineering, 2010,29(S1):2813-2818.
- Huang Qingxiang. Progress and prospect of rock formation control for safe and green mining in large shallow-buried coalfields in the west[J]. Journal of Xi’an University of Science and Technology, 2021,41(3):382.
- Chi Mingbo. Evaluation of water resources carrying capacity and decision-making of scientific mining scale in the northwest mining area of China[D]. China University of Mining and Technology, 2019.
- Zhang Jie, Hou Zhongjie. Study on Three Strap in Water Resouces Preservation in Yu-shu-wan Shallow Seam Mining[J]. Journal of Hunan University of Science and Technology ( Natural Science Edition ), 2006(04):10-13.
- Lai Xingping, Cui Feng, Cao Jiantao, etc. Analysis on characteristics of overlying rock caving and fissure conductive water in top-coal caving working face at three soft coal seam[J]. Journal of Coal, 2017,42(01):148-154.
- State Administration of Safety Supervision, State Administration of Coal Mine Safety, National Energy Administration, et al. Specification for coal pillar retention and coal compression mining for buildings, water bodies, railroads and major shafts [M]. Beijing: Coal Industry Press,2017.
- Hu, B.N., Zhang, H.X., Shen, B.H. Guide to coal pillar retention and coal compression mining for buildings, water bodies, railroads and major shafts [M]. Beijing: Coal Industry Press,2017.
- Xue Shaobo, Wu Xiong, Xu Nengxiong. Pondering on Coal Mining under Large-sized Reservoir Research[J]. Coal geology of China,2008,20(S1):47-49.
- Zhang Jie, Yang Tao, Suo Yonglu, et al. Roof water-inrush disaster forecast based on the model of aquiclude instability[J]. Journal of Coal, 2017,42(10):2718-2724.
- LAI X,XU H,FAN J,et al. Study on the mechanism and control of rock burst of 2 coal pillar under complex conditions[J]. Geofluids, 2020.
- Hou Zhongjie, Zhang J. Experiment and analysis of diving protection solid-liquid two-phase coupling in mining area of northern Shaanxi Province[J]. Journal of Hunan University of Science and Technology (Natural Science Edition),2004,19(4):1-5.
- Zhang Jie, Yu Xueyi, Cheng Lianhua. Failure mechanism of soil layer in longwall face intermission advance in shallow seam mining [J]. Journal of Liaoning Technical University (Natural Science Edition), 2008,27(6):801-804.
- Zhang Jie, Yang Tao, Suo Yonglu, et al. Forecast model for roof water inrush in Anshan coal mine based on coupling evaluation[J]. Xi’ an: Xi’ an University of Science and Technology,2018,38(04):569-576.
- Lai Xingping, Sun Huan, Shan Pengfei, etc. Acoustic emission and temperature variation in failure process of hard rock pillars sandwiched between thick coal seams of extremely steep[J]. Chinese Journal of Rock Mechanics and Engineering, 2015,34(11):2285-2292.
- Zhang Yin, Tang Jianxin, Wang Yanlei, et al. A model for predicting mining subsidence in bedding rock slopes[J]. Chinese Journal of Rock Mechanics and Engineering, 2017,36(12):3012–3020.
- Lai Xingping, Zhang Xudong, Shan Pengfei, etc. Study on development law of water-conducting fractures in overlying strata of three soft coal seam mining under thick loose layers[J]. Chinese Journal of Rock Mechanics and Engineering,2021,40(09):1739-1750.
Figure 1.
Mine working face layout and strata diagram.

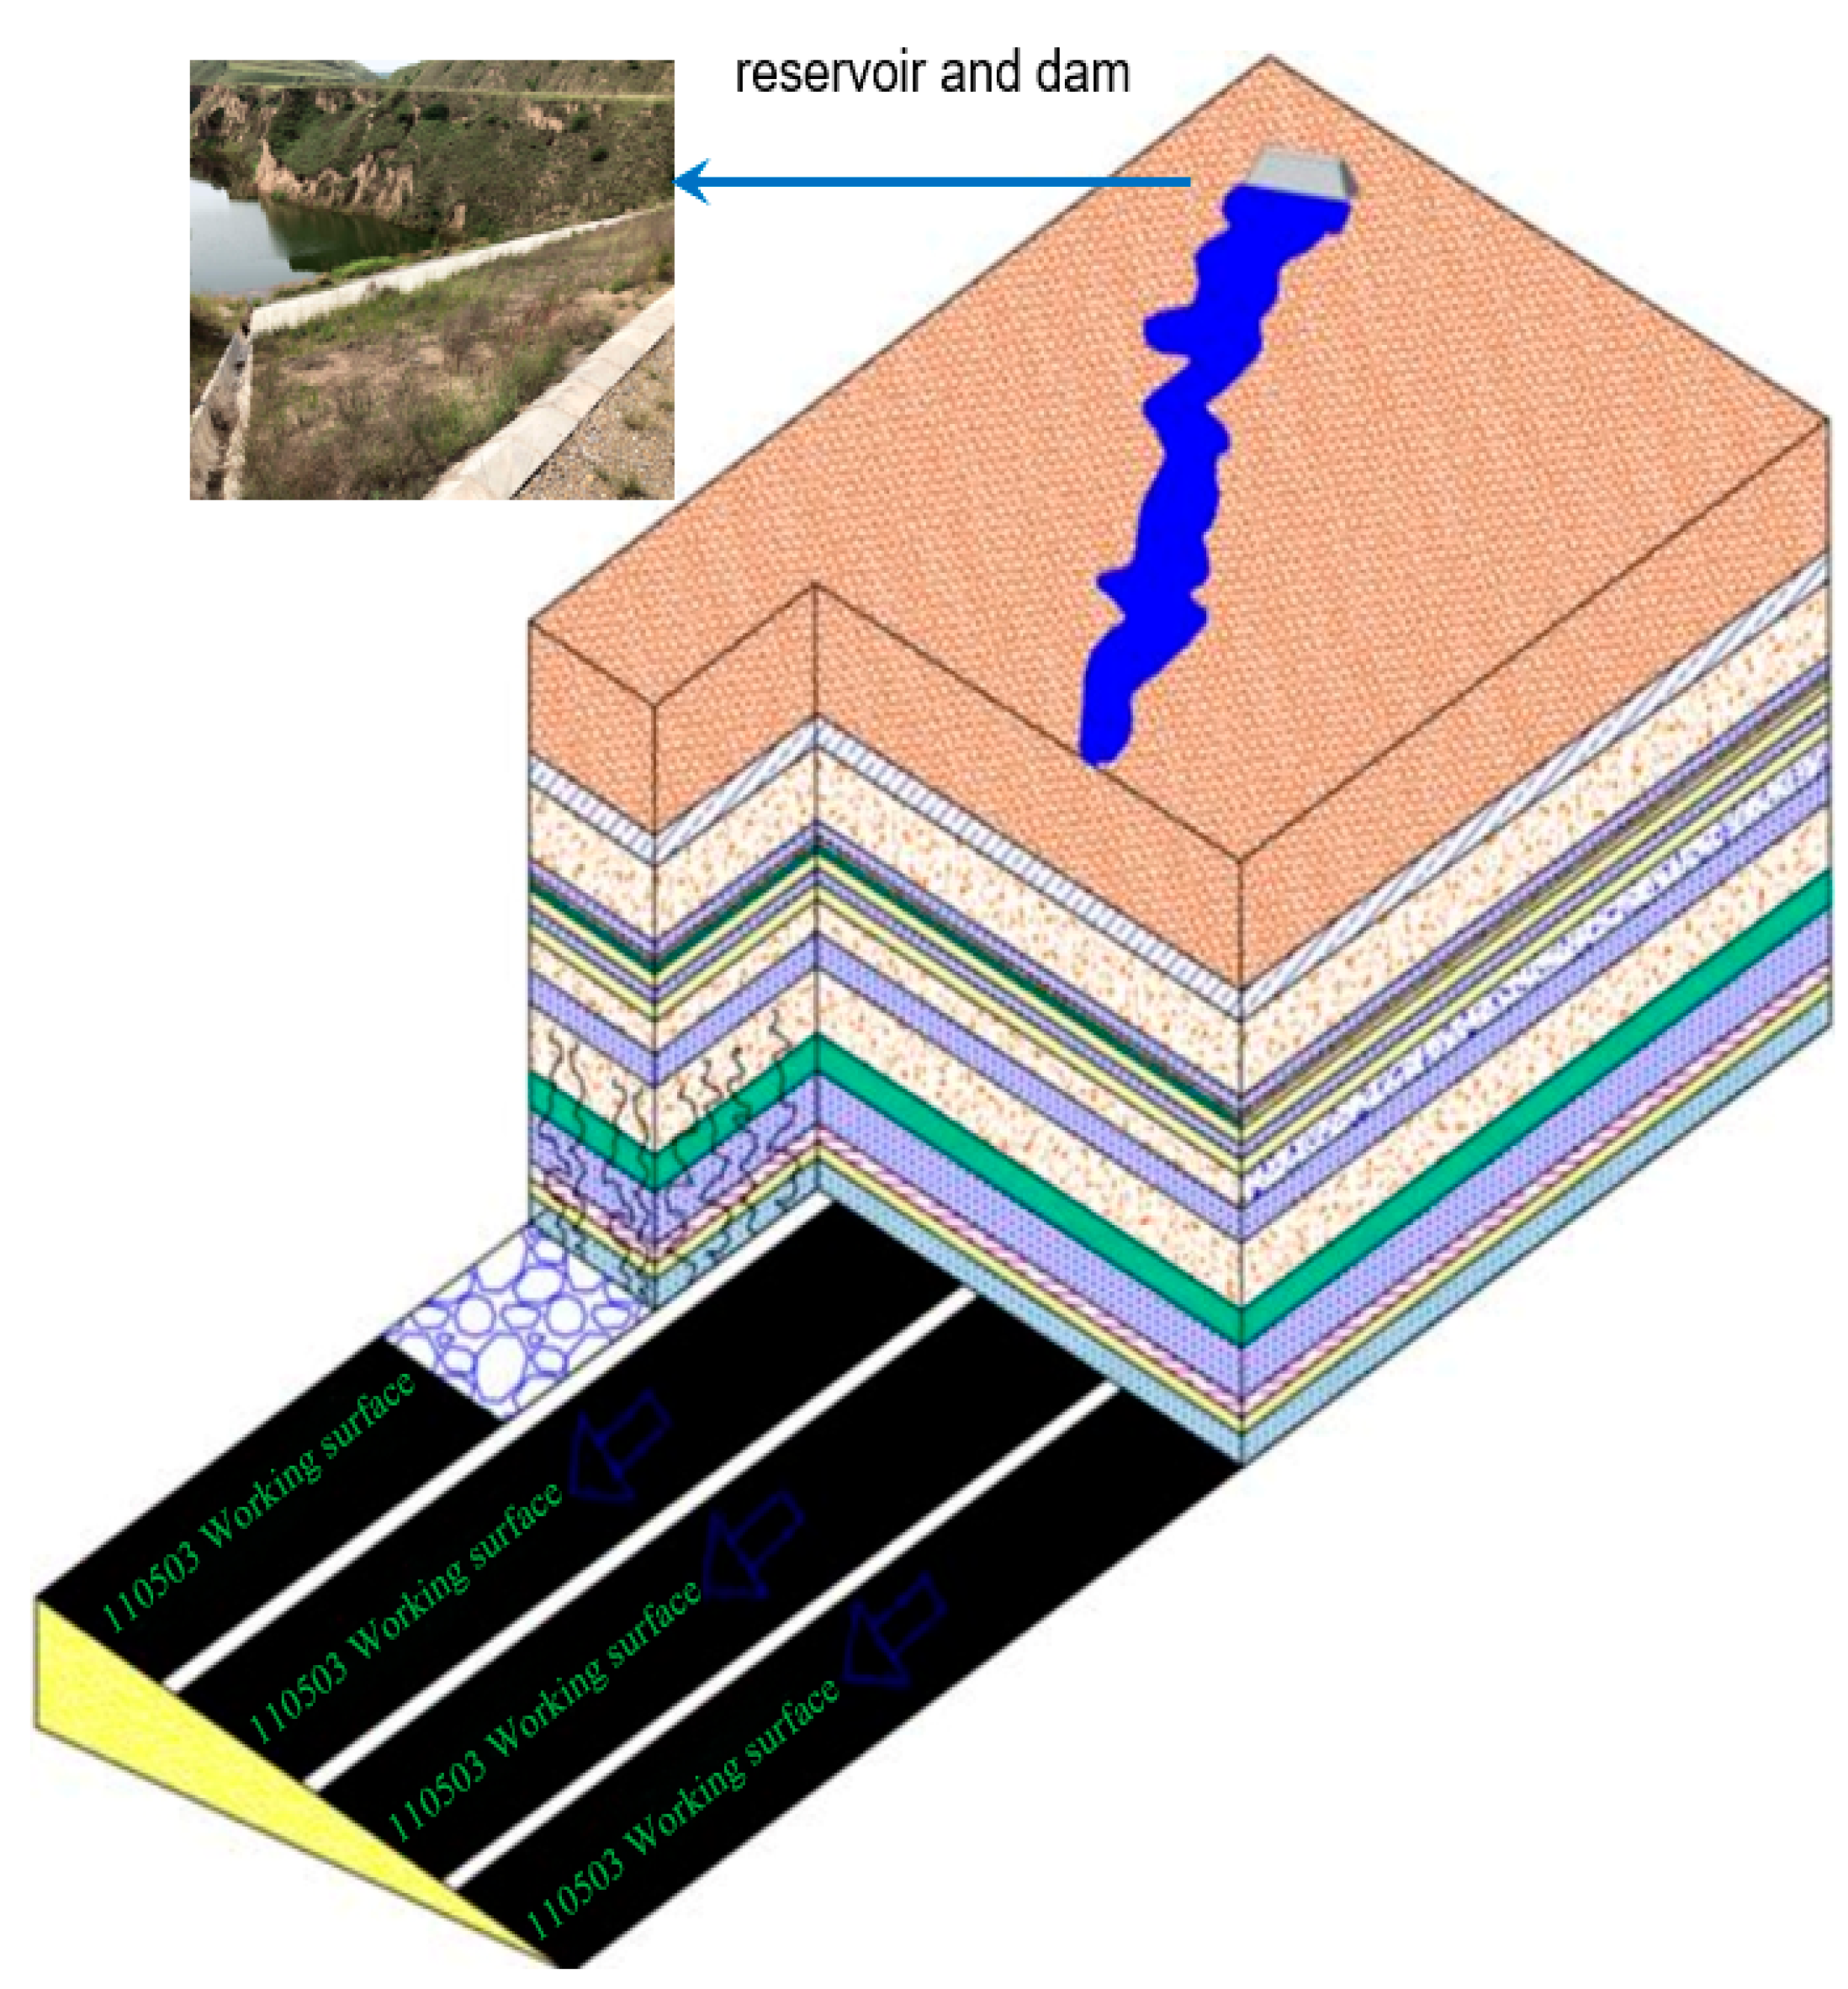
Figure 2.
Physical similarity model of Wangwa Coal Mine.
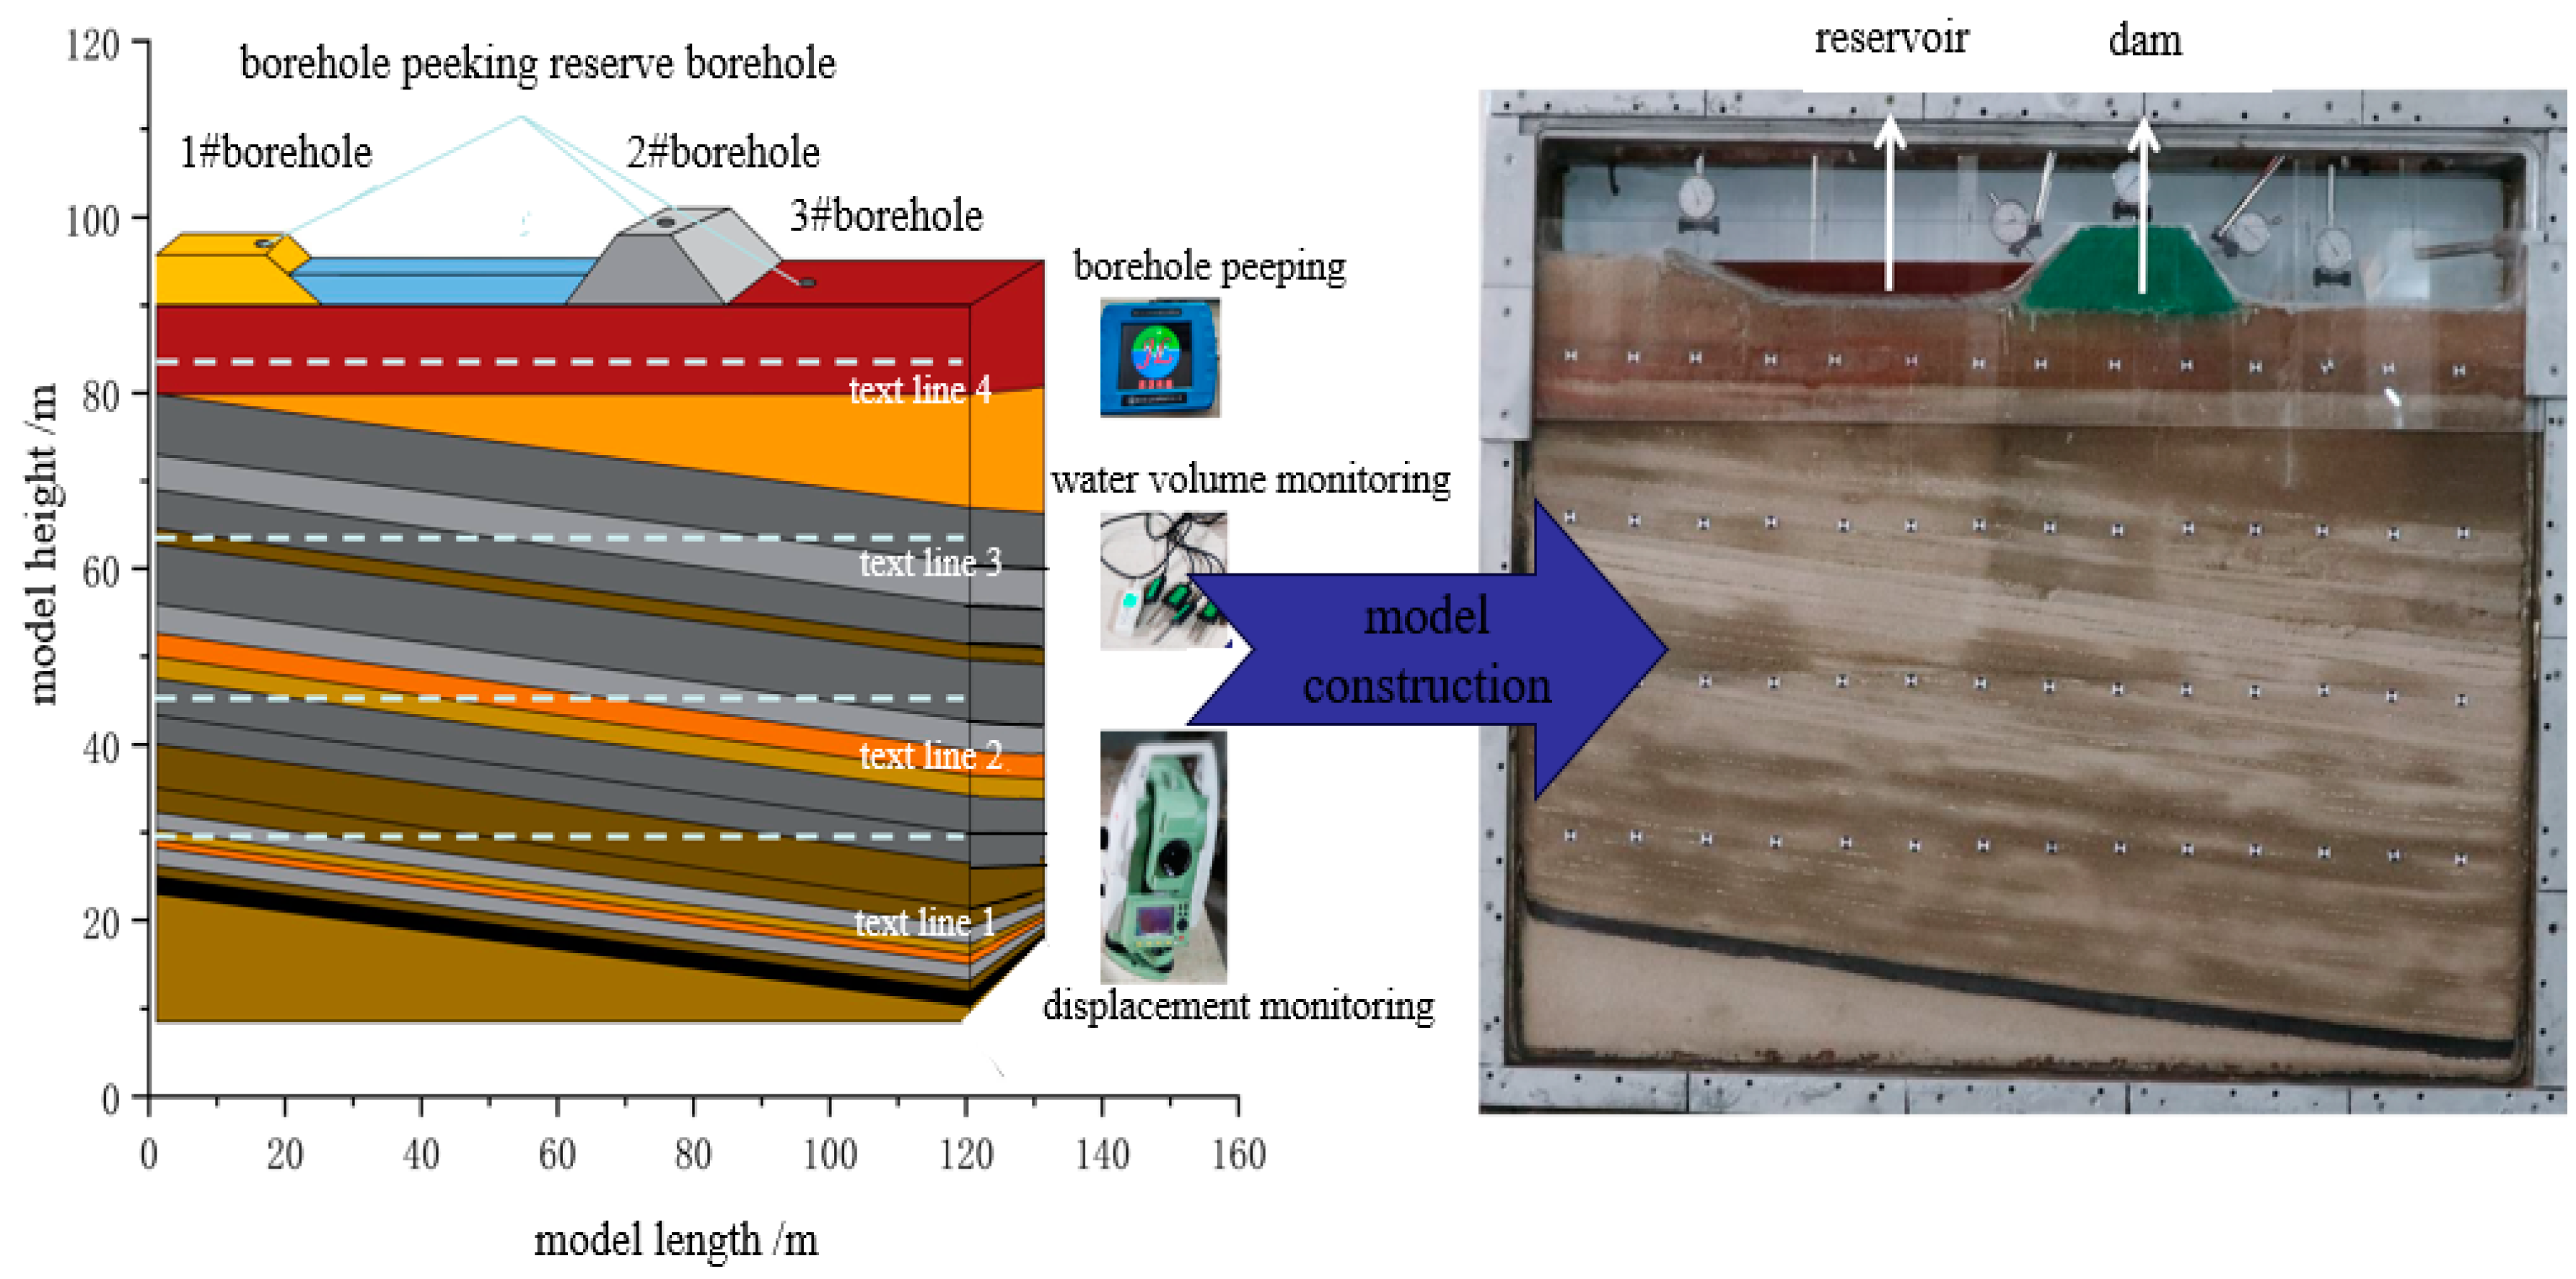
Figure 3.
Overburden rock displacement curve.
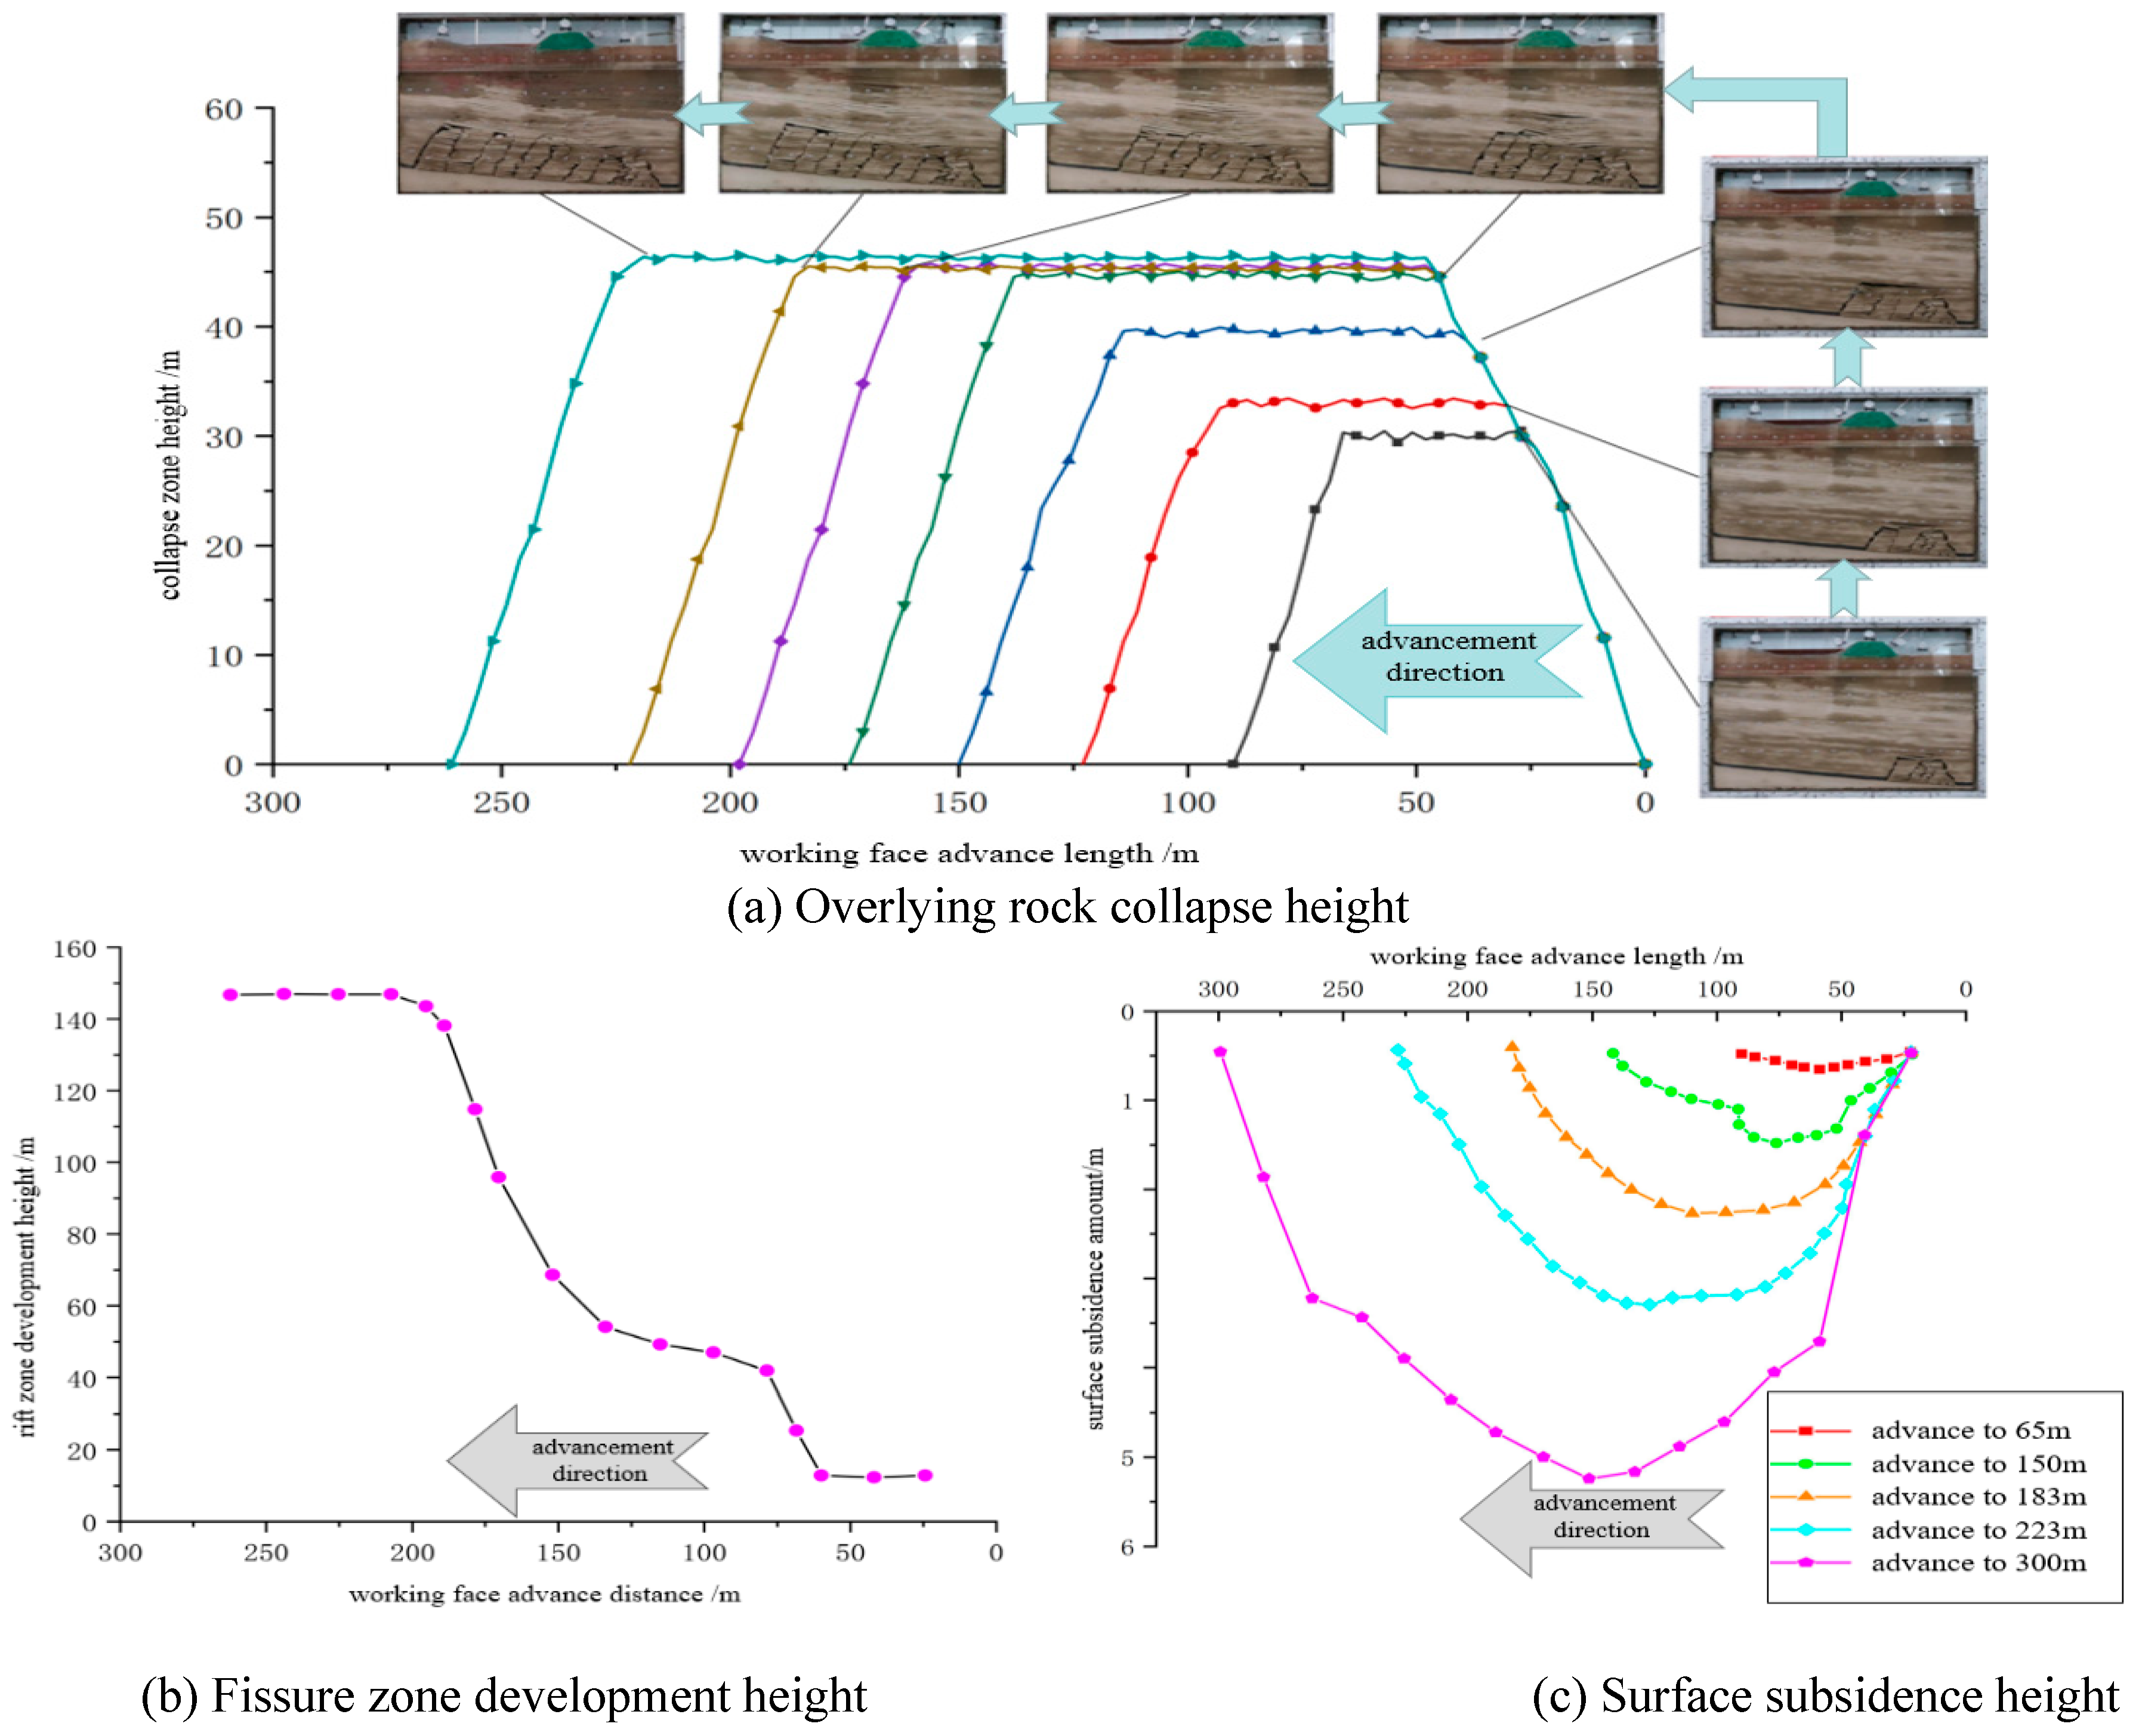
Figure 4.
Overburden rock displacement after working face mining.
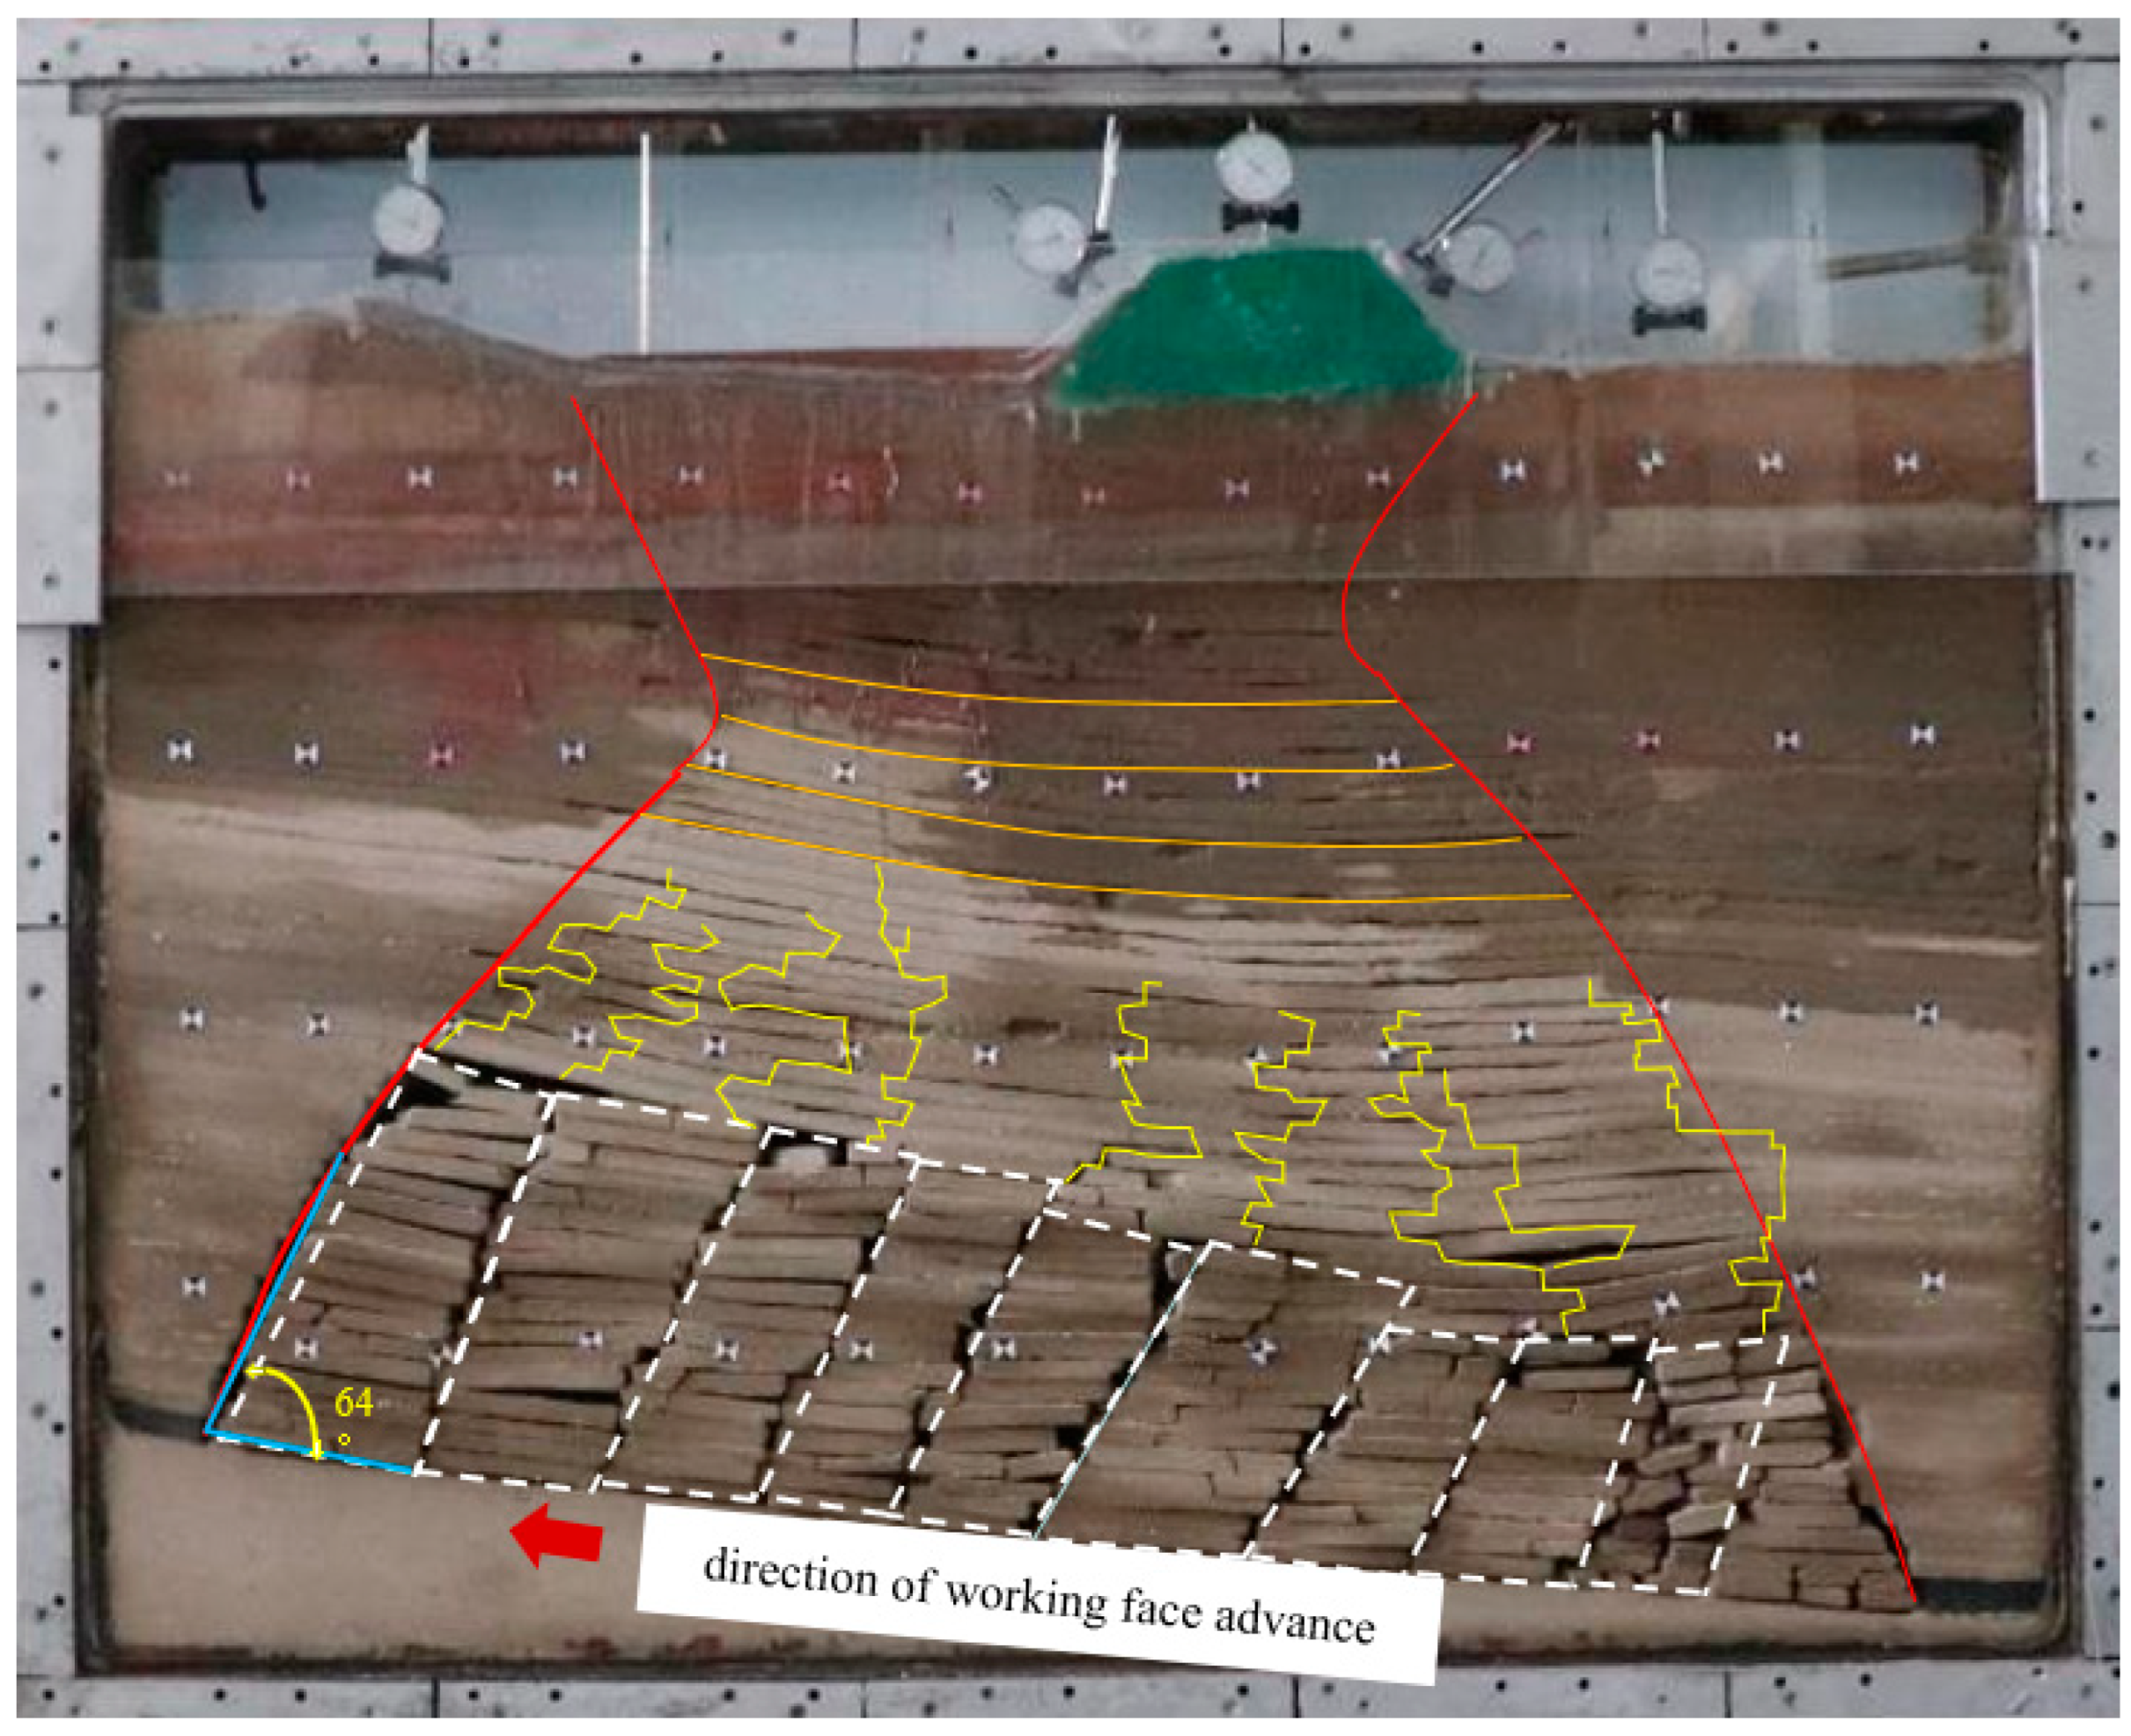
Figure 5.
Humidity variation curves of different buried depths.
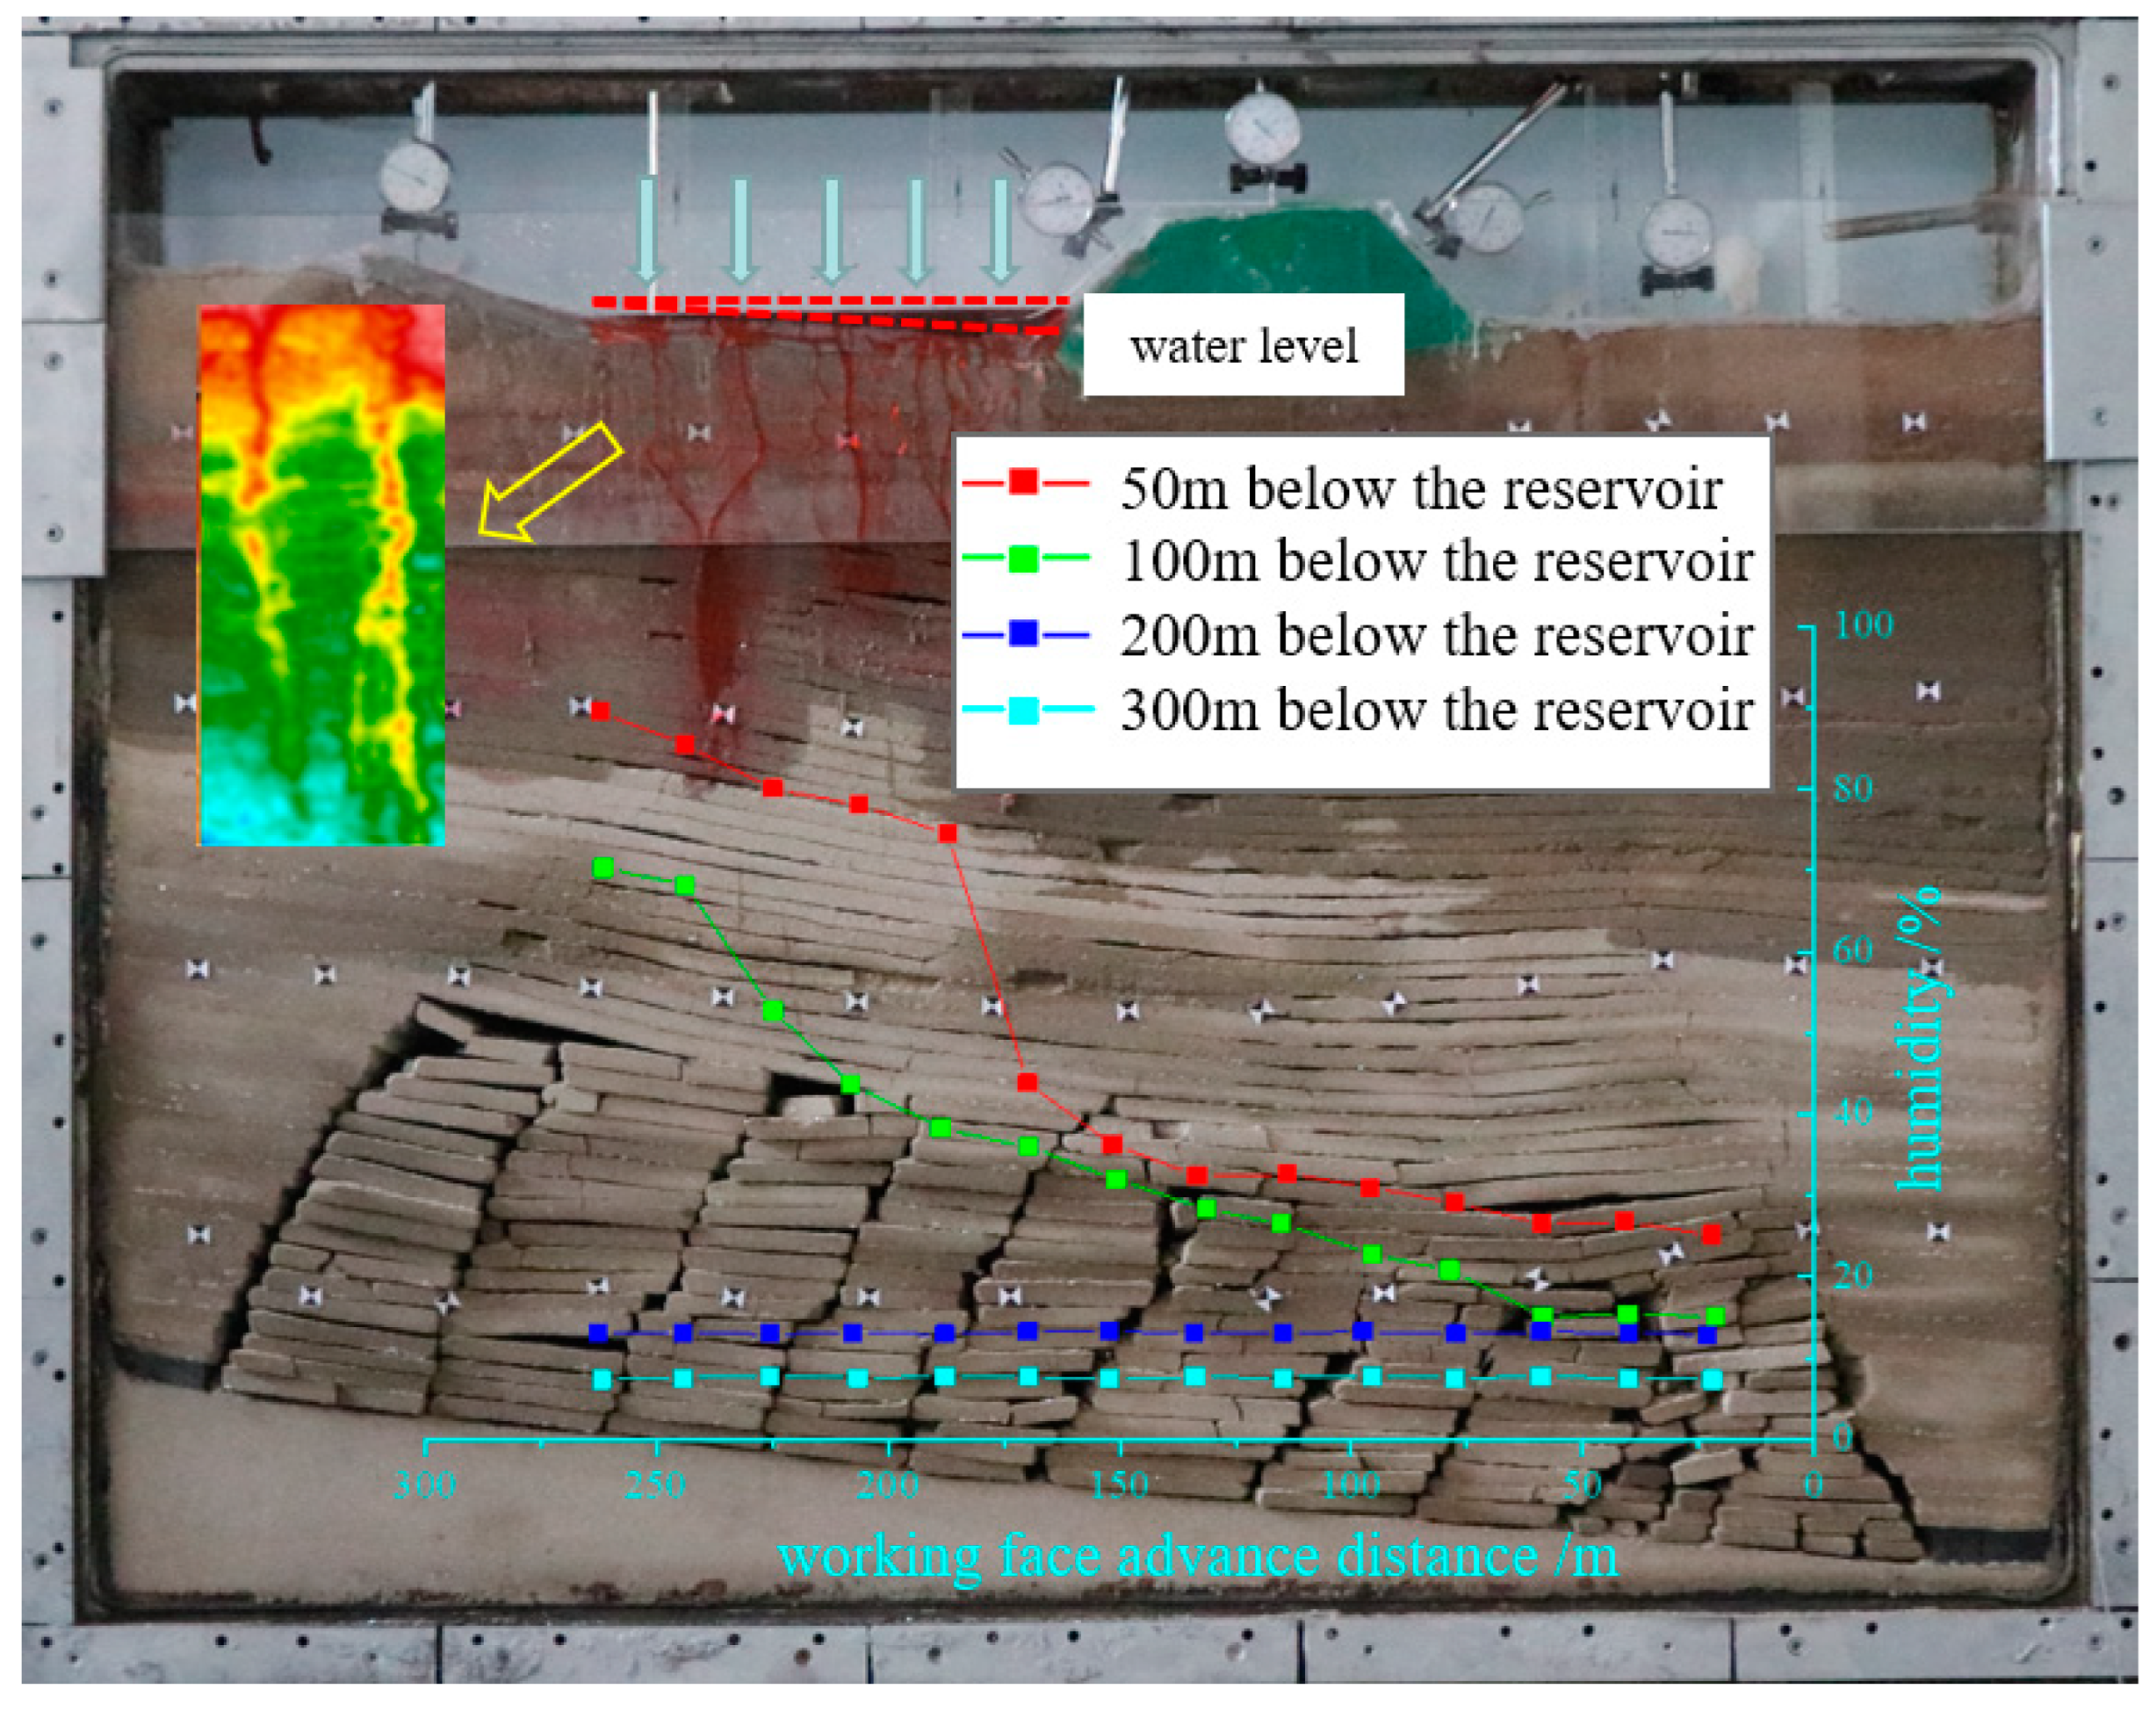
Figure 6.
Azimuth rose diagram of overburden fracture development.
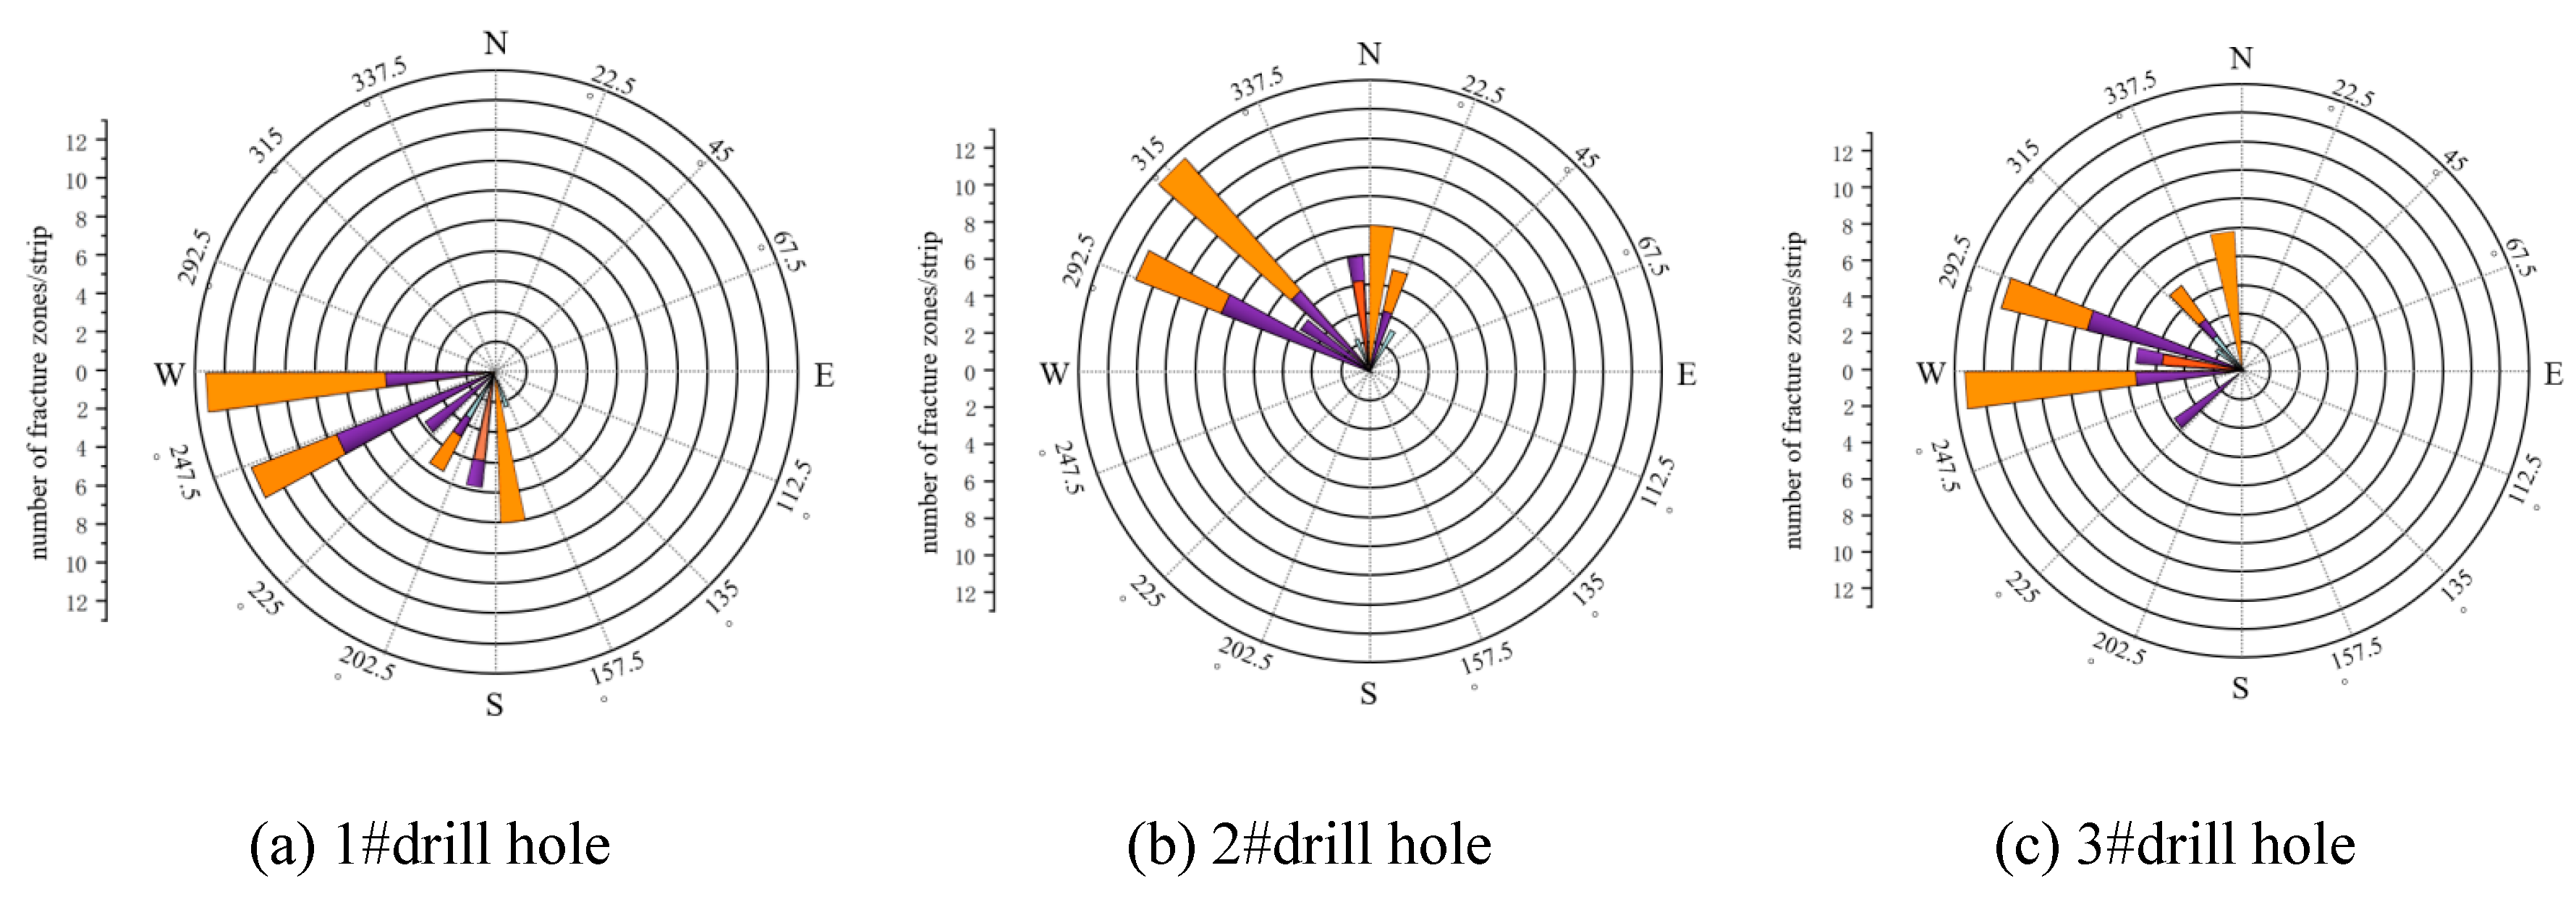
Figure 7.
Characteristic map of surface movement and deformation.
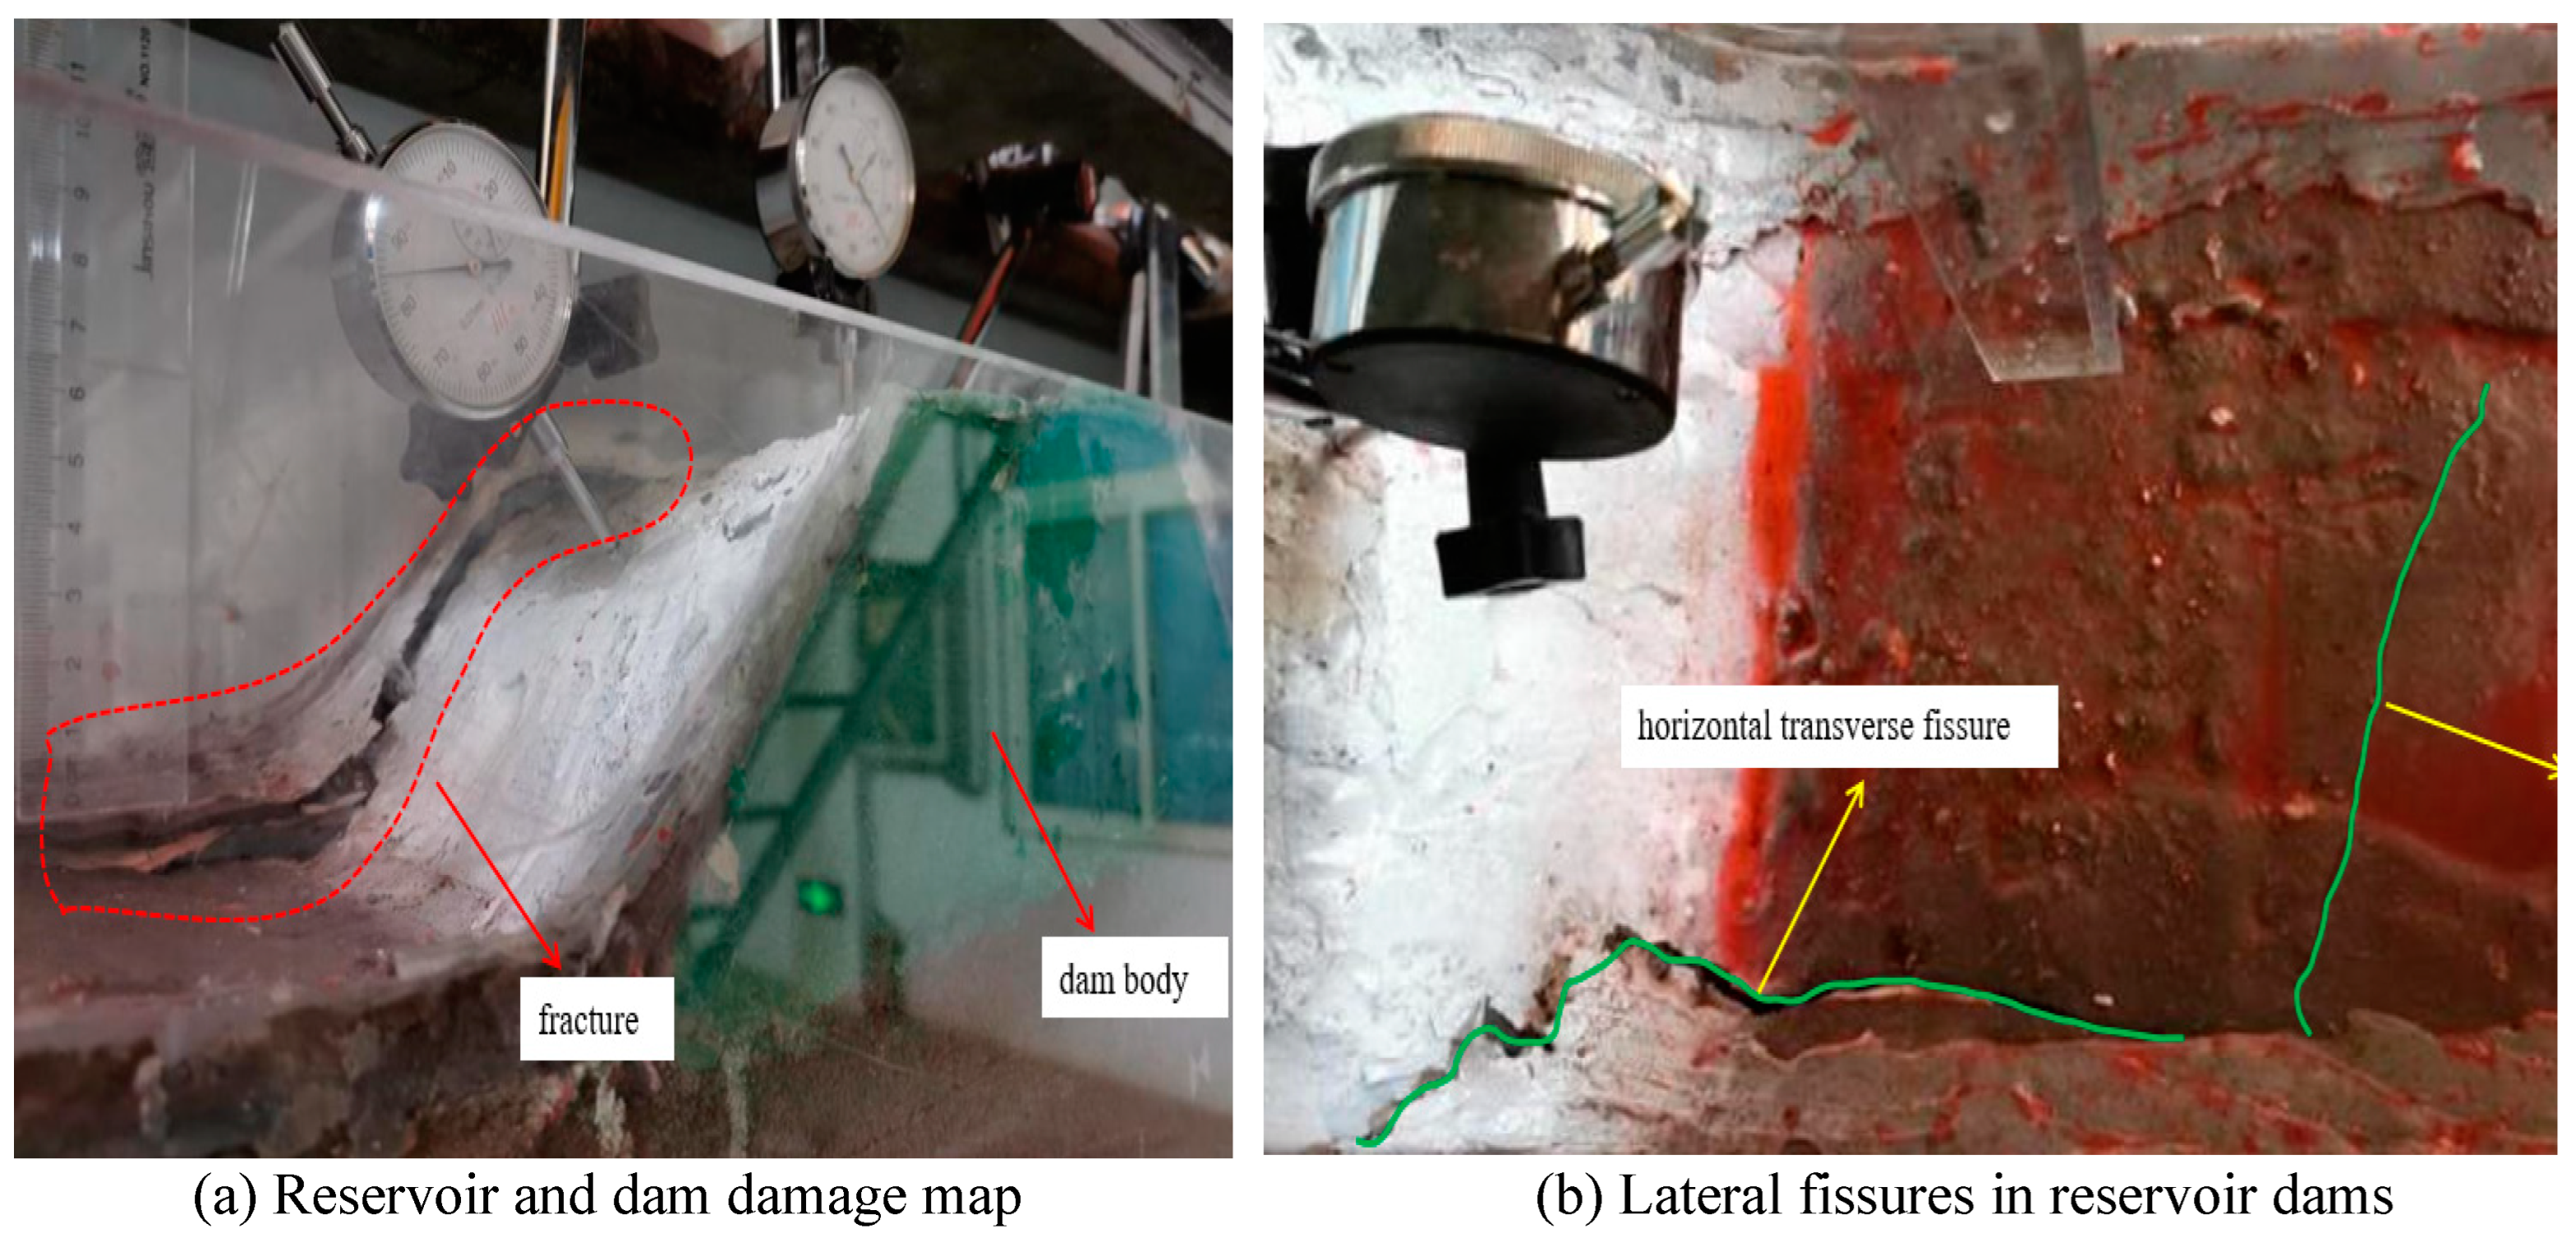
Figure 8.
FLAC3D numerical calculation coupling model.
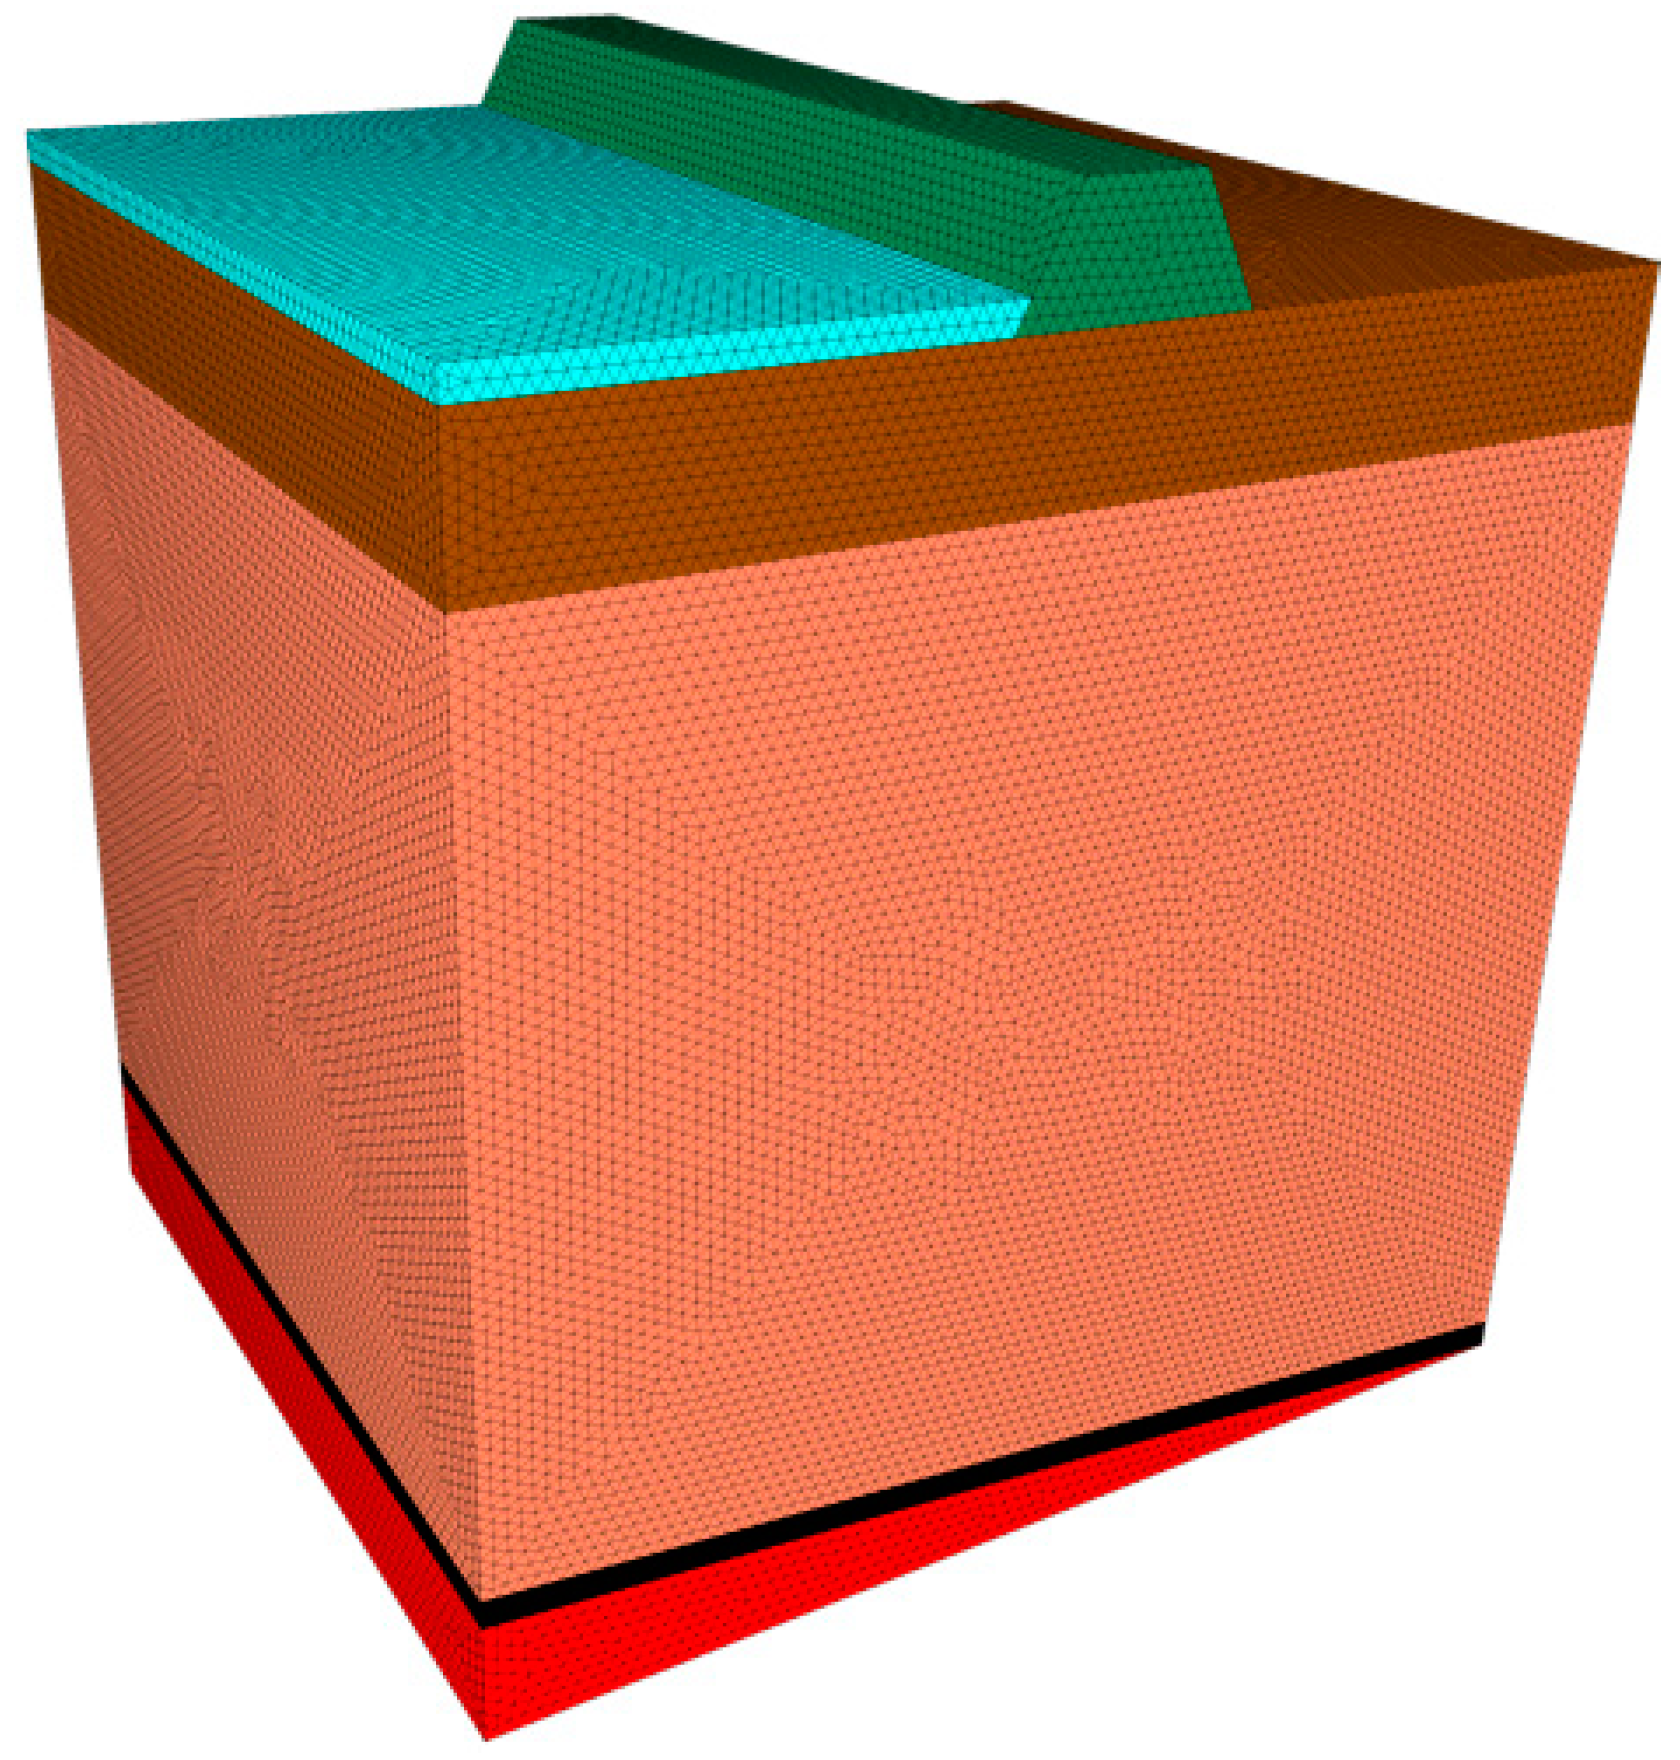
Figure 9.
Failure characteristics of overlying strata with mining intensity.
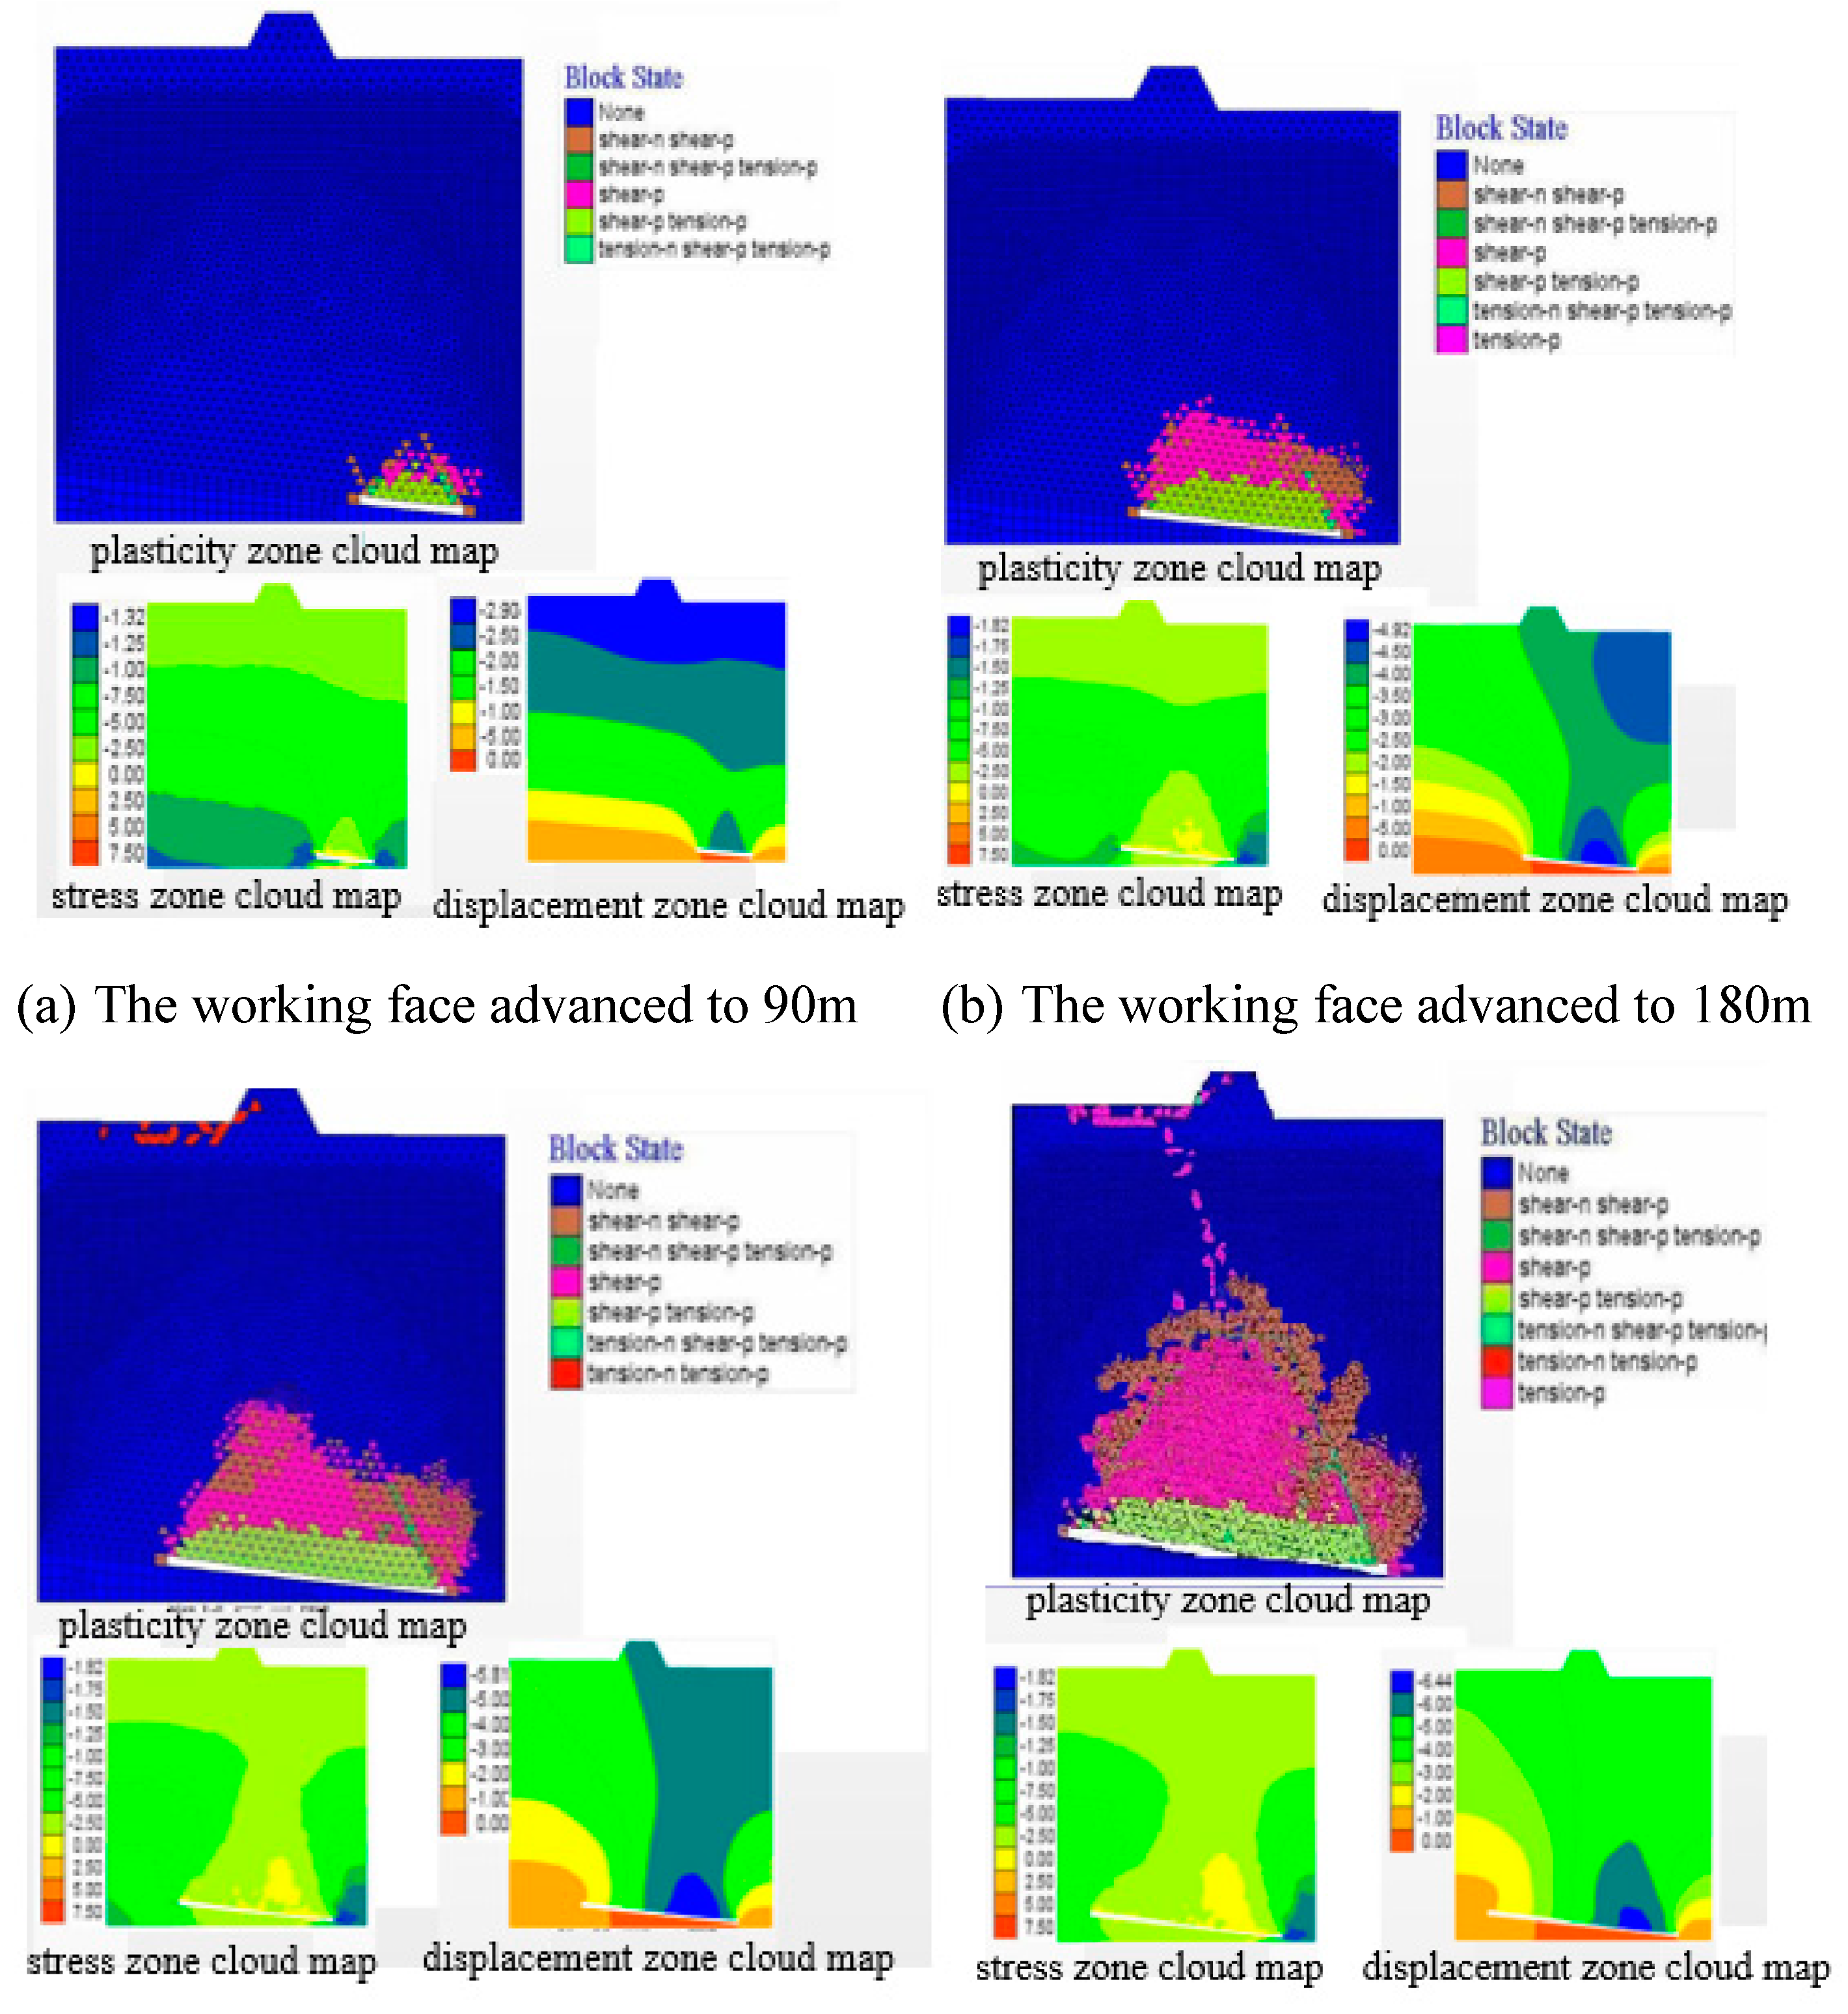
Figure 10.
Height of water flowing fractured zone under different mining height.
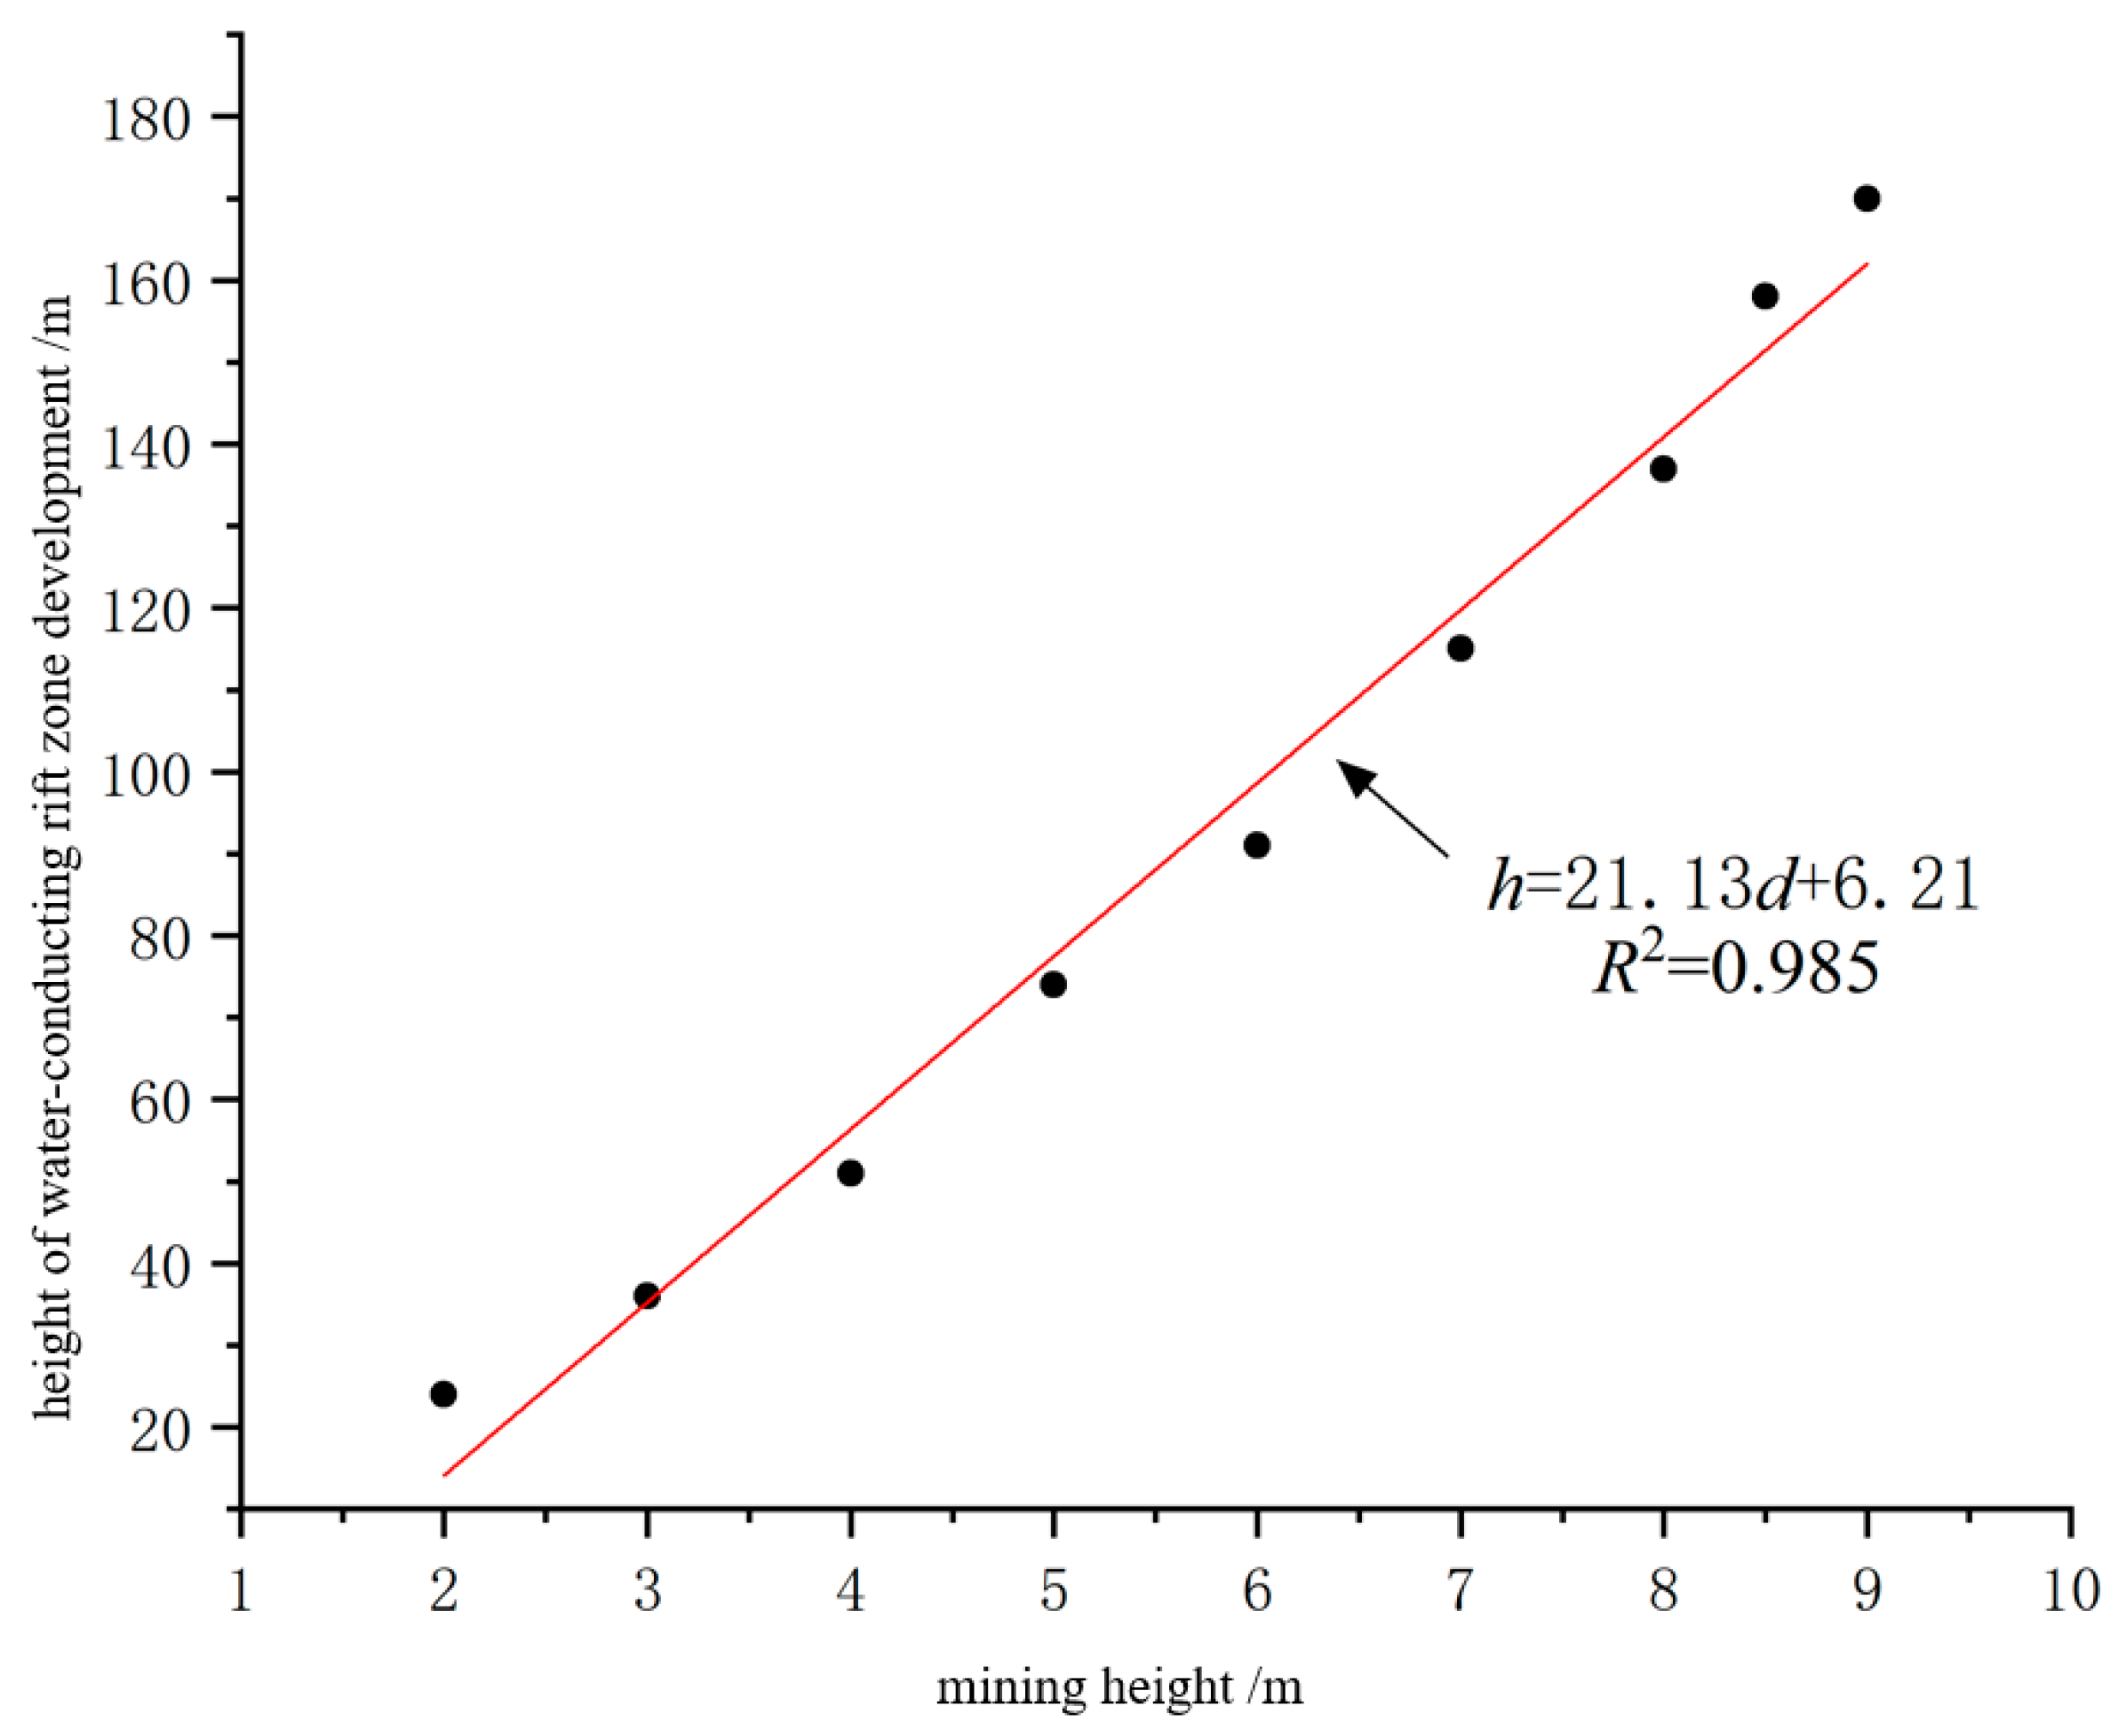
Figure 11.
Working face exploration drilling arrangement.
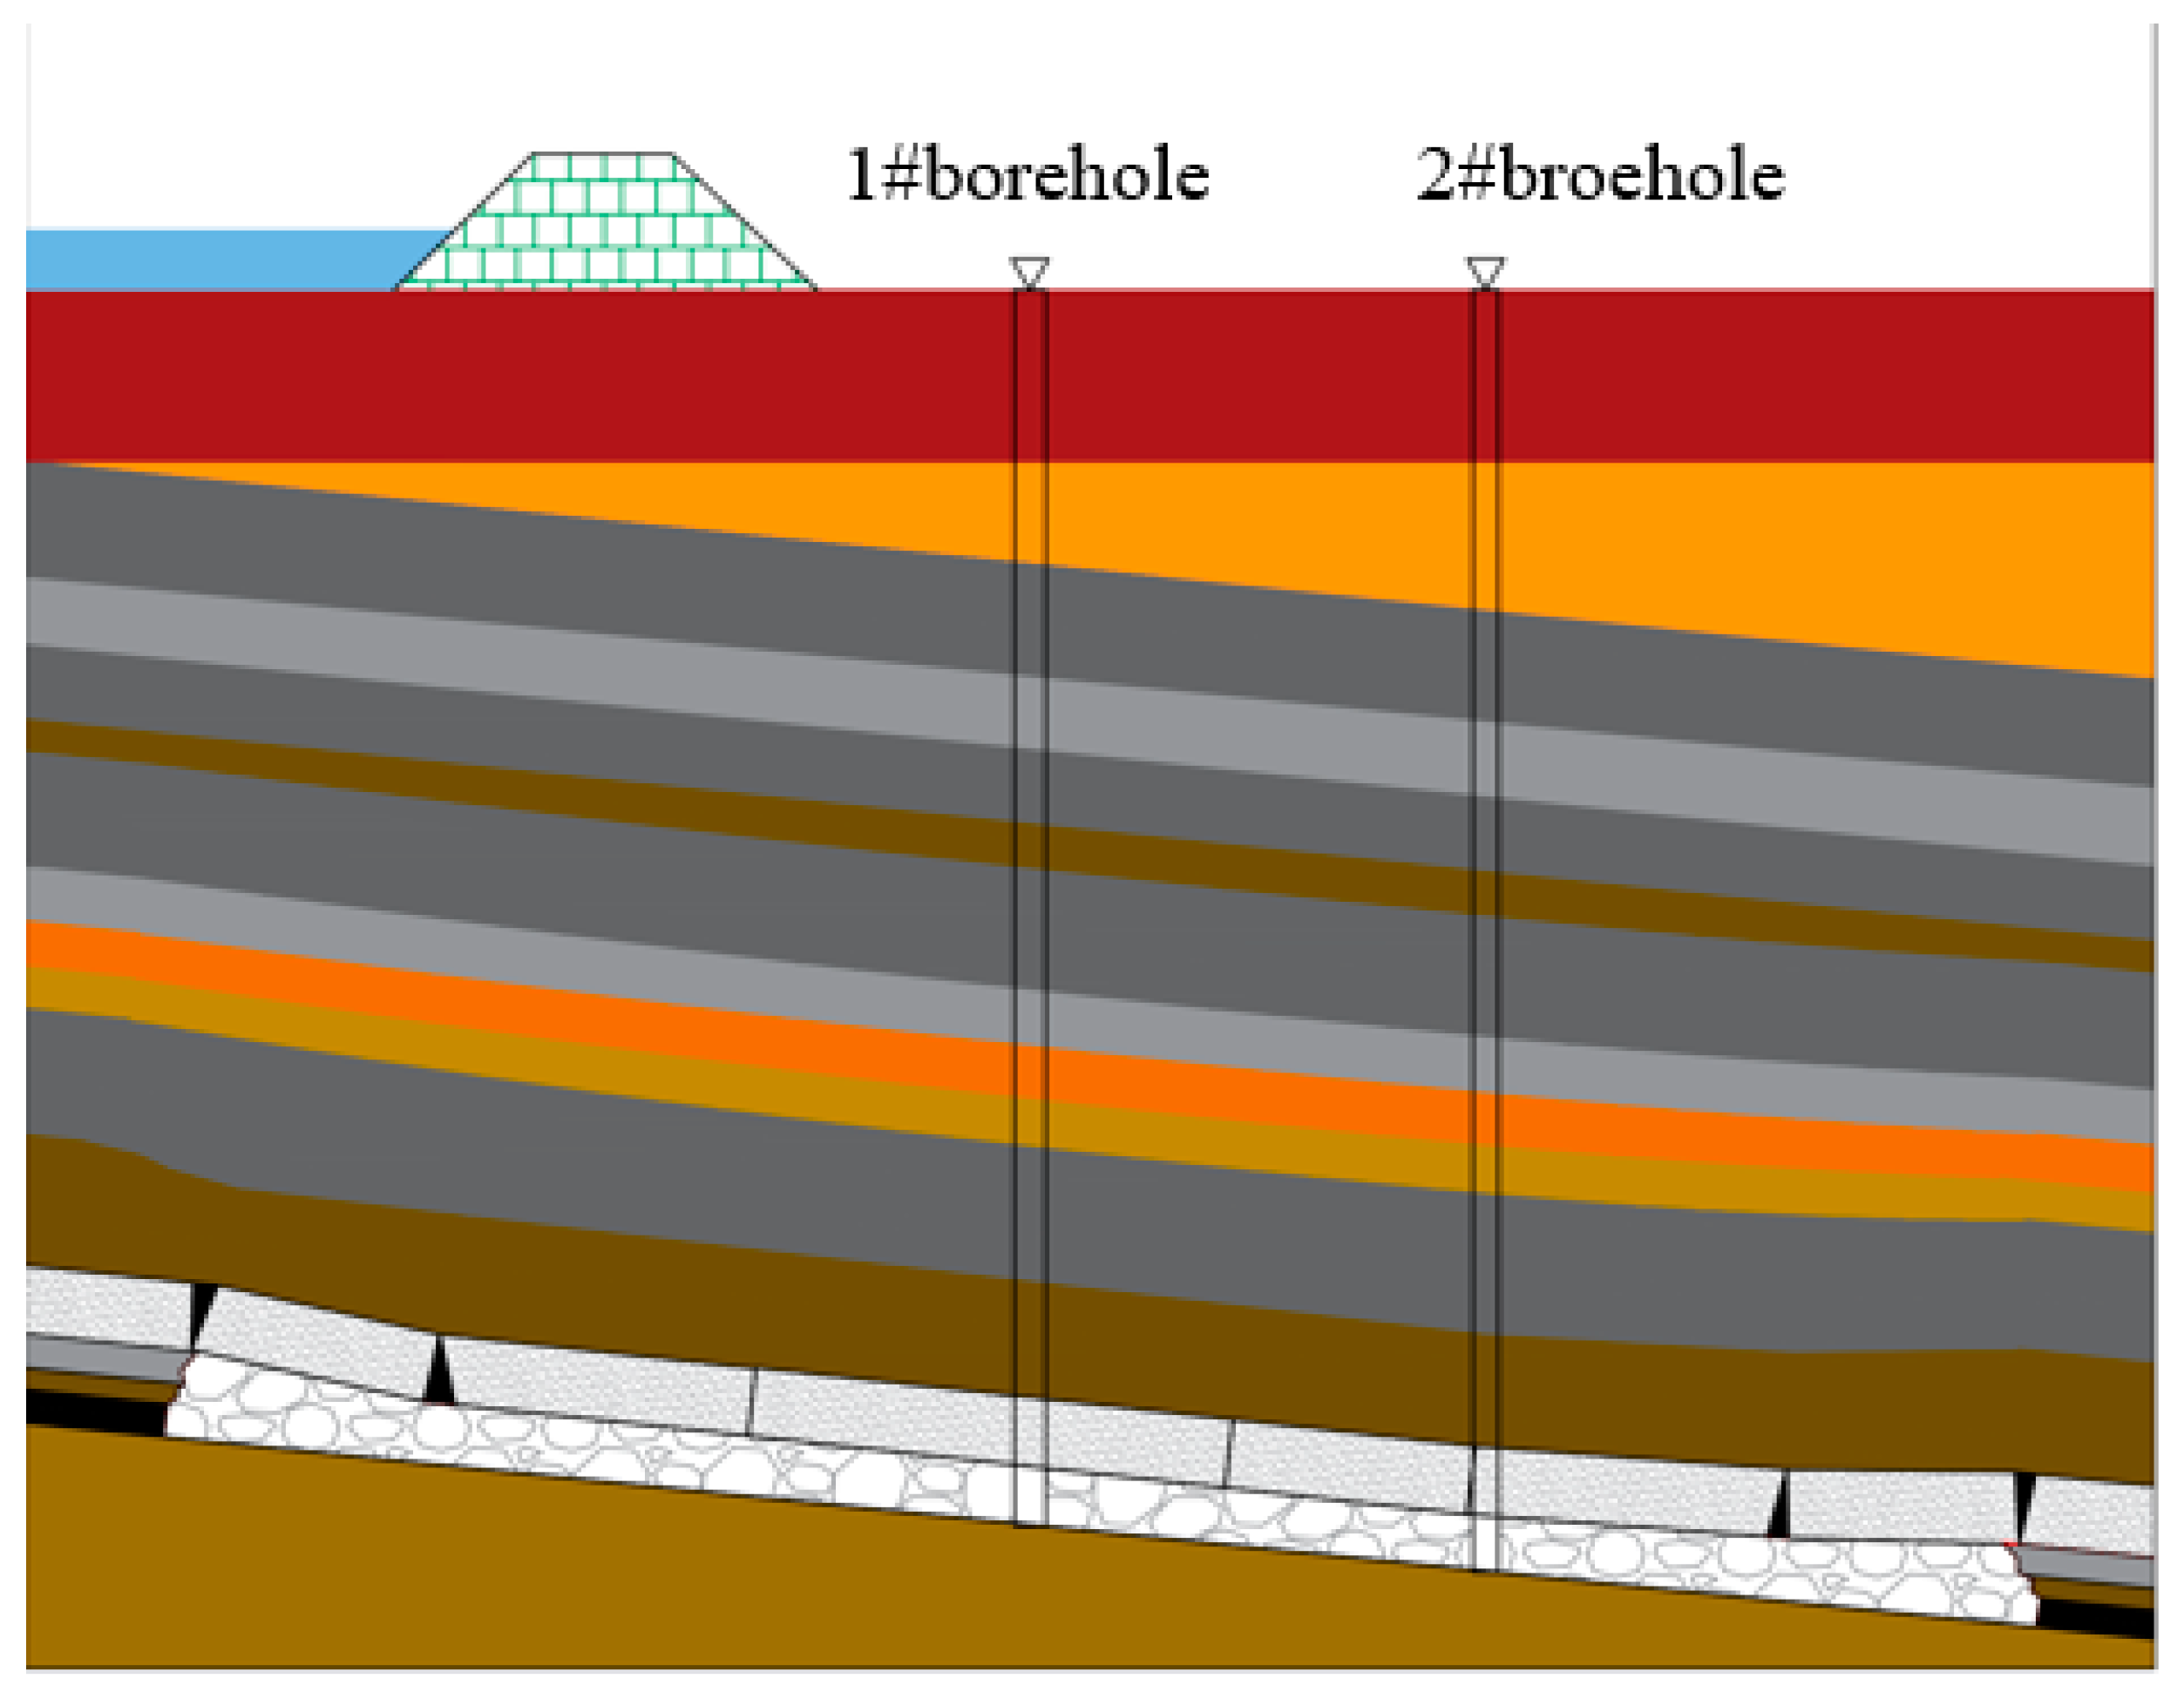
Figure 12.
Field borehole observation.
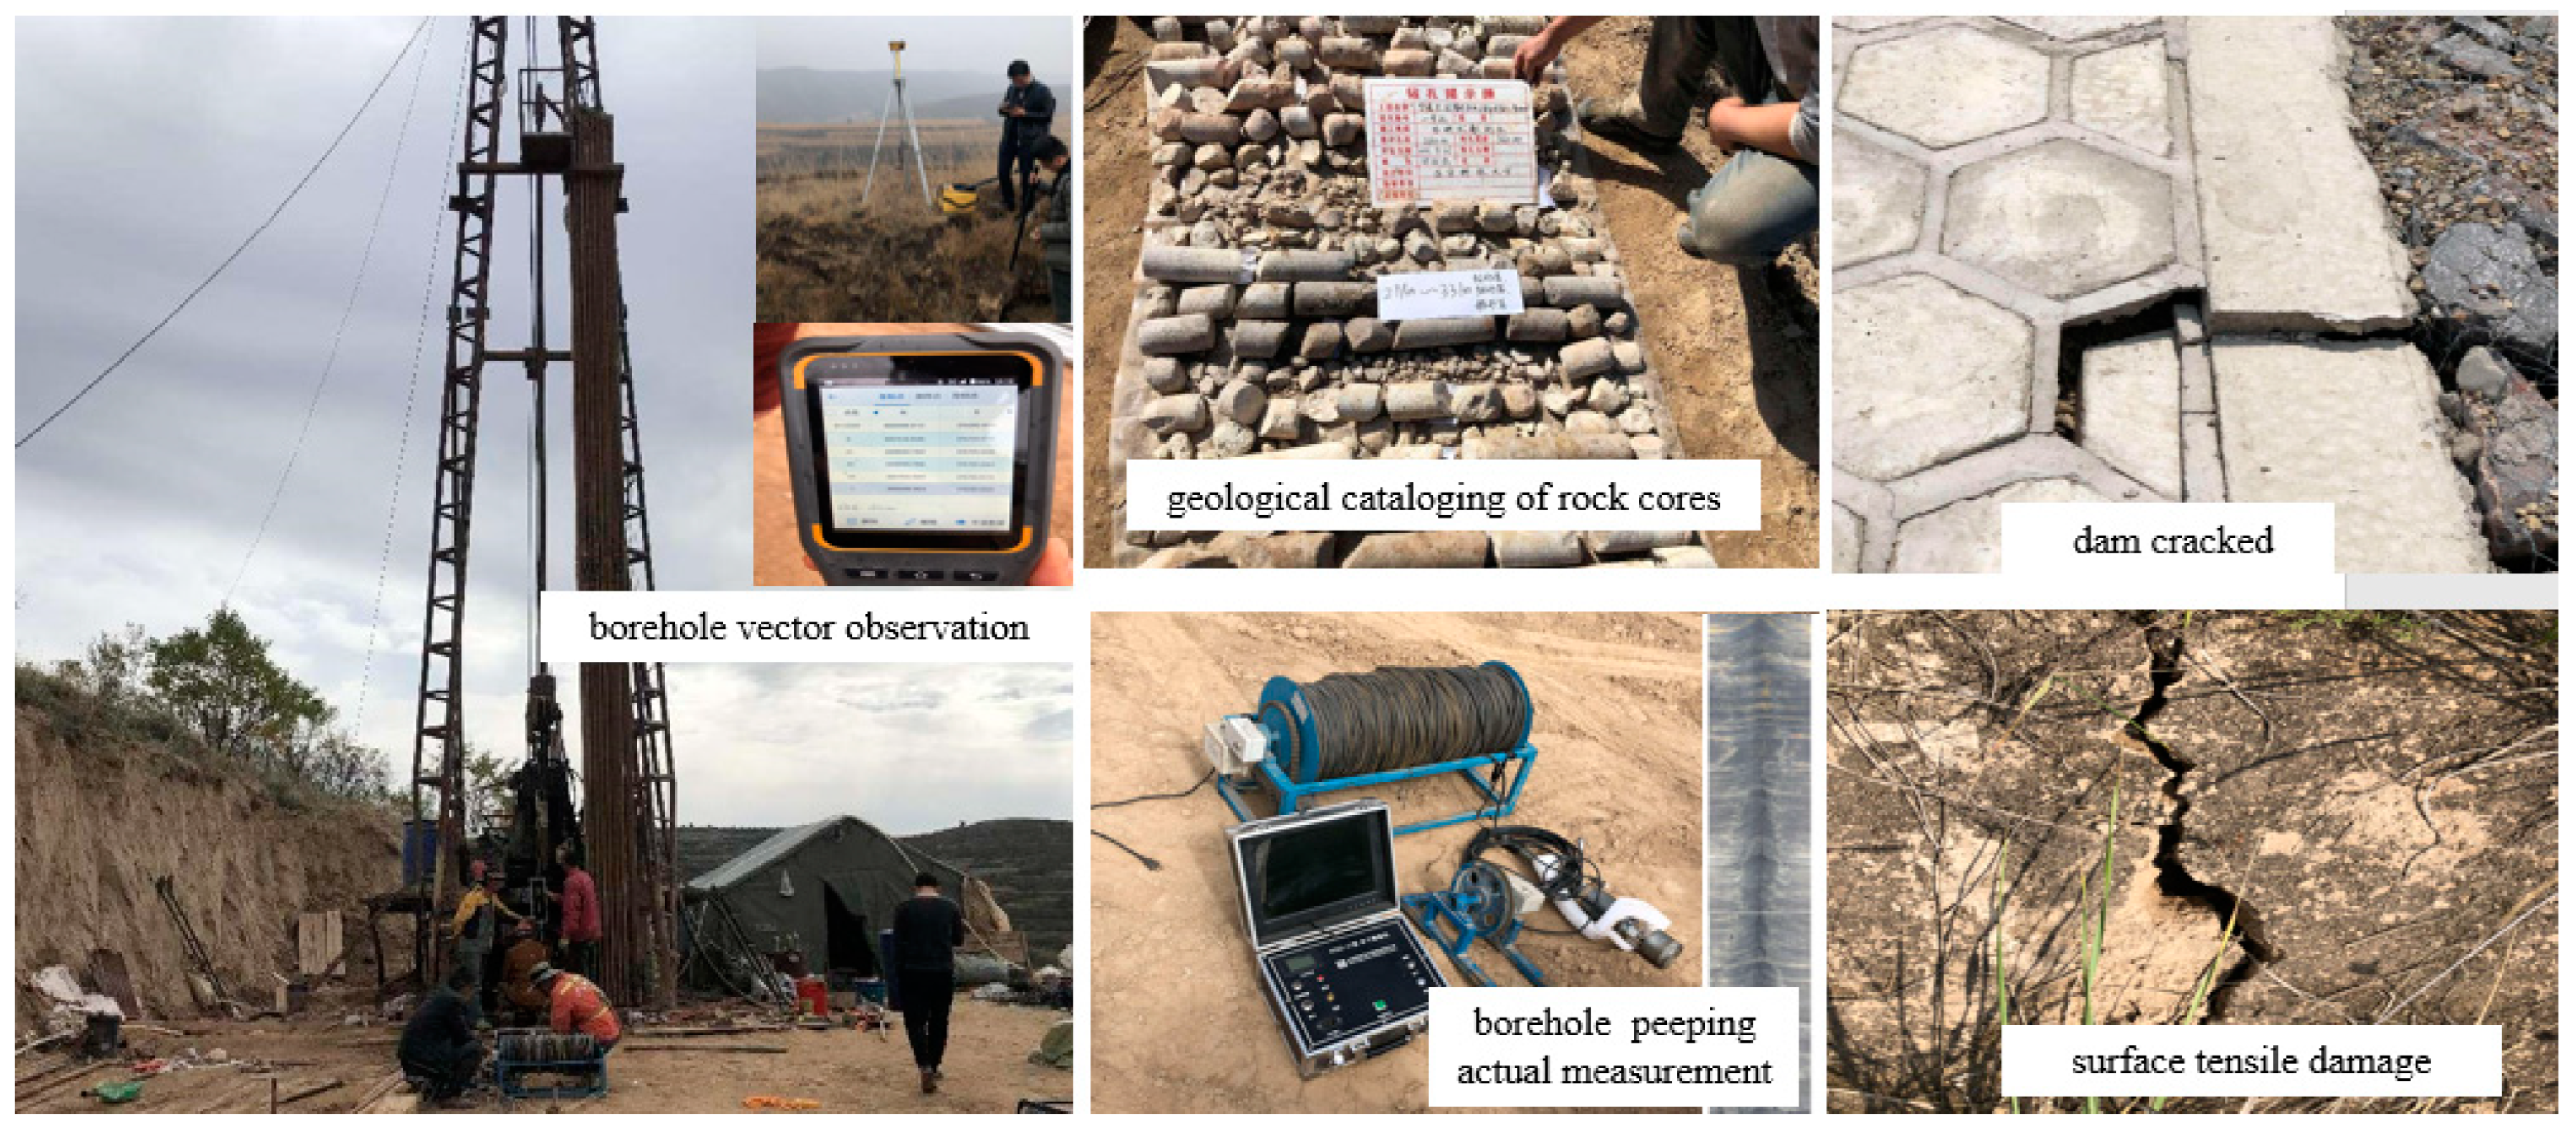
Figure 13.
Field borehole observation.
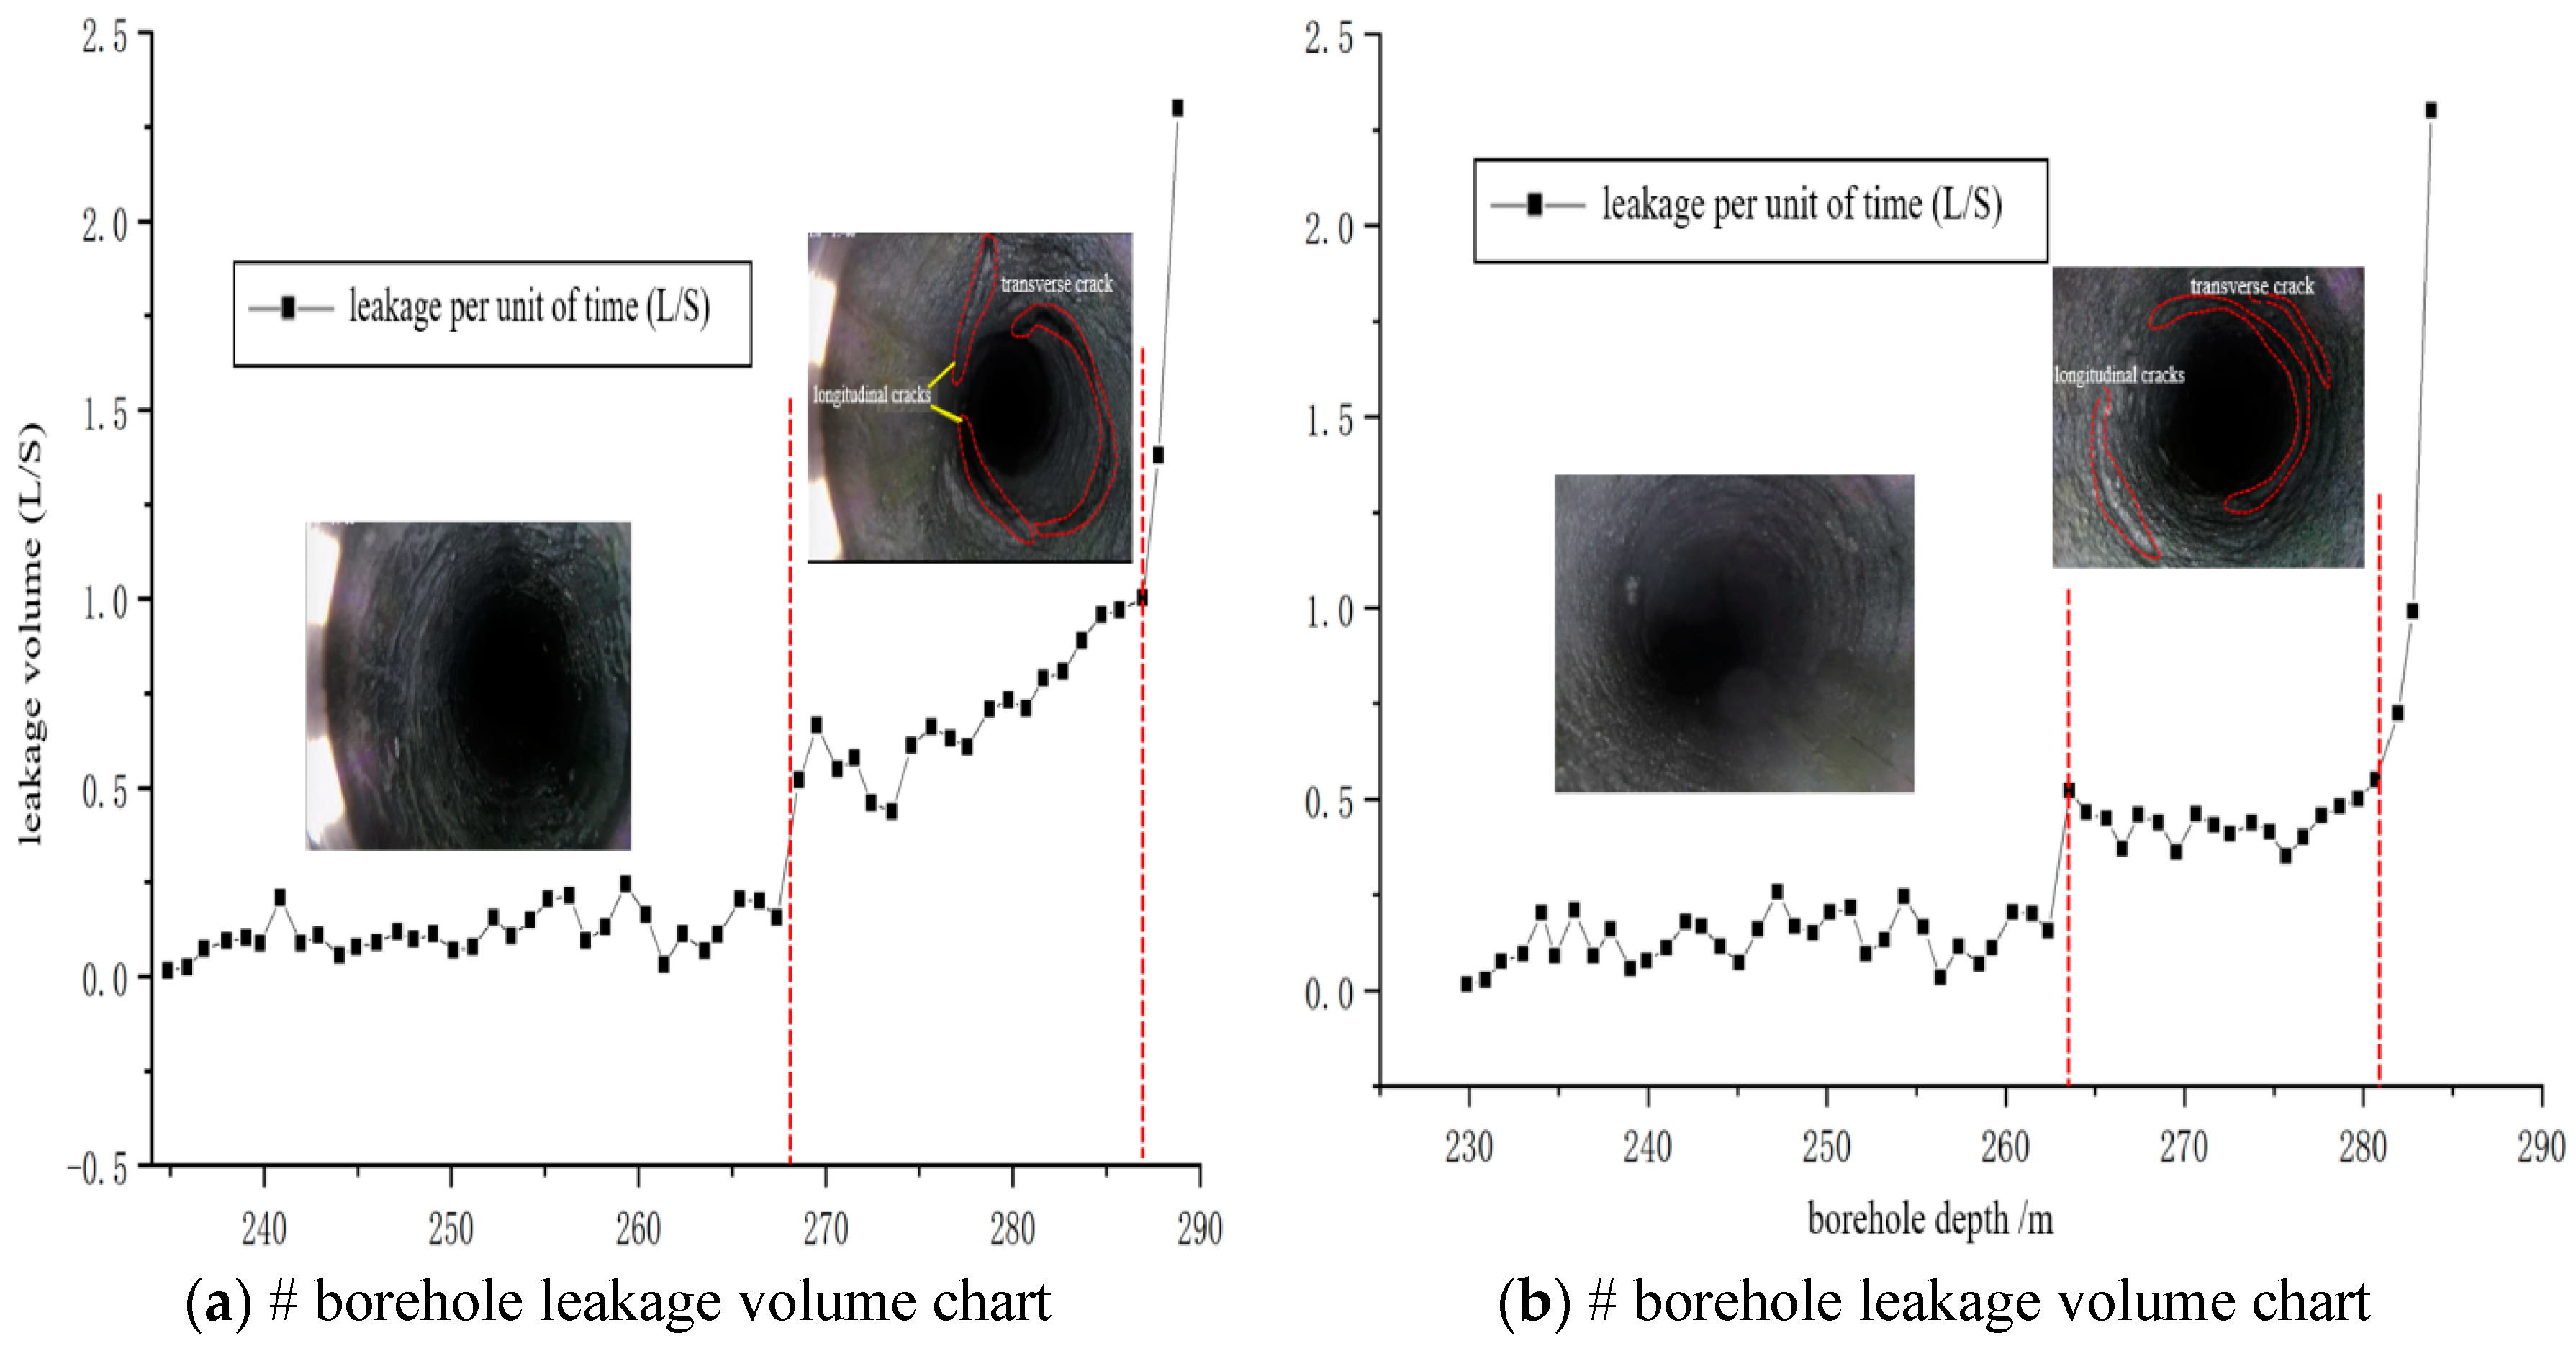

Table 1.
Model rock thickness parameters and ratio.
| Number | Lithology | Rock thickness /m | Model thickness Degree /cm |
Proportion |
| 1 | Dams | 15 | 3 | 100:5:3:1 (river: sand: cement: macadam: starch) |
| 2 | Loess | 50 | 10 | 25:25:1:1 (river: sand: loess: petroleum jelly: solid grease) |
| 3 | Laterite | 50 | 10 | 25:25:1:1 (river: sand: laterite: petroleum: jelly: solid: grease) |
| 4 | Coarse sandstone | 60 | 12 | 100:5:3:2:1 (river: sand: cement: macadam: liquid: paraffin: starch) |
| 5 | Mudstone | 40 | 8 | 100:5:3:2:4 (river: sand: cement: white: powder: liquid: paraffin: starch) |
| 6 | Coarse sandstone | 20 | 4 | 100:5:3:2:1(river: sand: cement: white: powder: liquid: paraffin: starch) |
| 7 | Siltstone | 75 | 15 | 100:6:3:4:3 (river: sand: cement: white: powder: liquid: paraffin: starch) |
| 8 | Coarse sandstone | 23 | 4.6 | 100:5:3:2:1 (river: sand: cement: white: powder: liquid: paraffin: starch) |
| 9 | Mudstone | 75 | 15 | 100:5:3:2:4 (river: sand: cement: white: powder: liquid: paraffin: starch) |
| 10 | Siltstone | 50 | 25 | 100:6:3:4:3 (river: sand: cement: white: powder: liquid: paraffin: starch) |
| 11 | 5# Coal | 9.08 | 4.5 | 20:20:1:5 (river: sand: cement: white: powder: liquid: paraffin: starch) |
| 12 | Siltstone | 4 | 2 | 100:8:3:2:3 (river: sand: cement: white: powder: liquid: paraffin: starch) |
Table 2.
Comparison of two-band heights under different methods.
| Method classification | Overburden damage height /m | Error /% | ||
| collapse zone | Water-conducting fissure zone | collapse zone | Water-conducting fissure zone | |
| Physical Simulation | 52.4 | 162 | +9.72 | -5.13 |
| Numerical Simulation | 48.11 | 164 | +0.73 | -3.96 |
| Empirical formulas | 42.42 | 120.57 | -11.18 | -29.39 |
| Field measurements | 47.76 | 170.76 | 0 | 0 |
Disclaimer/Publisher’s Note: The statements, opinions and data contained in all publications are solely those of the individual author(s) and contributor(s) and not of MDPI and/or the editor(s). MDPI and/or the editor(s) disclaim responsibility for any injury to people or property resulting from any ideas, methods, instructions or products referred to in the content. |
© 2023 by the authors. Licensee MDPI, Basel, Switzerland. This article is an open access article distributed under the terms and conditions of the Creative Commons Attribution (CC BY) license (http://creativecommons.org/licenses/by/4.0/).
Copyright: This open access article is published under a Creative Commons CC BY 4.0 license, which permit the free download, distribution, and reuse, provided that the author and preprint are cited in any reuse.


