Submitted:
08 June 2023
Posted:
09 June 2023
You are already at the latest version
Abstract
The use of nitrogen (N) fertilizers can have detrimental effects on the environment due to nitrate leaching. This study aims to examine the impact of N fertilizer source and application timing on wheat yield and nitrate leaching in various soil textures. A randomized complete block design (RCBD) was employed to conduct the experiment. The treatments consisted of two N fertilizer sources: ammonium nitrate (AN) and urea (NN), applied at three different times throughout the year, with a control treatment. The three application timings were total application before sowing (T1), total application in spring (T2), and half the amount before sowing and the other half in spring (T3). The experiment was conducted in three different soil textures (sandy loam, silty clay loam, and silty clay), with three replications over three growing seasons: 2018-19 (Y1), 2019-20 (Y2), and 2020-21 (Y3). The results indicated significant effects of different soil textures on grain yield. Specifically, the silty clay loam soil differed significantly from the sandy loam and silty clay soils in terms of grain yield. The interaction effects between the N fertilizer source and application timing were also found to be significant for all soil textures (p<0.01). In sandy loam and silty clay soils, the grain yield increased when using the T3 application timing compared to the silty clay loam soil. Notably, the silty clay loam soil with the T2 application timing exhibited the highest grain yield, with a yield of 6863.6 kg ha-1. Furthermore, the study revealed that N fertilizers and their application timing significantly influenced the protein content in the silty clay and sandy loam soils. The protein percentages were 10.76 and 10.93 for the silty clay and sandy loam soils, respectively, following the T2 treatment. Additionally, ammonium nitrate (AN) demonstrated a noticeable effect on the percentage of grain protein compared to urea (NN). In conclusion, the application timing of N fertilizers had an impact on grain yield and protein content in different soil textures. Moreover, nitrate concentration increased throughout the experiment, with the highest soil nitrate concentration observed in both fertilizer treatments, particularly in the sandy loam soil.
Keywords:
Grain yield
; N fertilizer
; Nitrate leaching
; Protein percentage
; Wheat
1. Introduction
Globally, approximately 70% of agricultural lands are dedicated to cereal production, while the remaining land is used for grazing or cultivating animal feed [1,2,3,4]. Wheat (Triticum aestivum L.) is the most significant cereal crop worldwide, with the ability to grow in various regions. In fact, wheat exhibits the highest level of adaptation to diverse climate conditions compared to other cereals [5,6]. The increasing demand for wheat in Iran further emphasizes the importance of this crop due to population growth and the objective of achieving self-sufficiency [7,8].
In general, the pursuit of food security and environmental preservation often conflicts with the use of chemical fertilizers [9]. However, the application of chemical fertilizers, particularly nitrogen (N) fertilizers, has significantly increased wheat yield over the past five decades [10,11]. Wheat crops can absorb high levels of N, making it necessary to use fertilizers containing N to ensure economic performance [12,13]. However, the efficiency of N fertilizers has been reported to be very low [14]. Low N efficiency not only raises production costs but also affects crop lodging, susceptibility to pest infestation, hardpan formation, soil agglomeration, and ultimately leads to a significant reduction in economic performance [15]. On a larger scale, excessive application of N fertilizers in agricultural lands can result in severe environmental issues such as nitrate leaching, ammonium sublimation, loss of soil biodiversity, and global N2O emissions [16,17]. Therefore, optimizing the use of N fertilizers becomes crucial to achieve economic stability in cropping systems, stabilize crop production, and reduce detrimental effects on the environment [18].
The timing of N fertilizer applications plays a crucial role in crop yield management. According to Wang et al. [19], applying 185 kg ha-1 of N proved effective in increasing wheat yield. Although there have been advancements in genetic improvement for N use efficiency [20], several studies have demonstrated that split application of N fertilizers can enhance N uptake and application efficiency in crops by synchronizing fertilizer demand [21,22]. Delin [23] confirmed that AN fertilizer provides the highest available source of N to the crop, surpassing ammonium sulfate (AS) and NN fertilizers. Results indicated that the crop's N uptake rate from AN ranged from 64 to 74.8%, while it was 61.5 to 64.5% for NN, and 61.7 to 63.4% for AS. Wang et al. [24] conducted an experiment on the interaction of these three fertilizers (NN, AN, and AS) with soil N in wheat. Their findings highlighted the significant impact of N fertilizer application on both soil N and crop dry matter, compared to the control treatment.
Traditionally, farmers in regions with intensive management, such as Iran, tend to use high rates of N applications to boost crop yield. However, this practice often leads to increased nitrate leaching across various land-use systems. Therefore, the objectives of this research were to investigate the effects of N fertilizer source and application timing on wheat yield and nitrate leaching in different soil textures within a semi-dry climate zone.
2. Material and methods
2.1. Experimental sites
The present study was conducted in three experimental sites located in the Kermanshah plain, specifically the Bistoon Plain. The Bistoon Plain is renowned for being one of the most productive wheat centers in western Iran. The climate in the area is classified as semidry, with potential evapotranspiration being approximately four times higher than precipitation [25]. The physical and chemical properties of the studied experimental sites are presented in Table 1. Prior to commencing the experiment, soil samples were collected at a depth of 0-30 cm, and the content of N, phosphorus, potassium, and other relevant parameters were determined.
2.2. Implementation of experiment
To assess the impact of N fertilizer source and application timing on grain yield, dry matter, protein percentage of wheat, and nitrate leaching, three experiments were conducted using a factorial arrangement of a randomized complete block design (RCBD) with three replications over the growing seasons from 2018 to 2021. The experiments included two types of N fertilizers: ammonium nitrate (AN) and urea (NN). The application timings consisted of total application before sowing (T1), total application in spring (T2), and half application before sowing and half in spring (T3), using three different soil textures (sandy loam, silty clay loam, and silty clay). The N fertilizers were applied through spraying. Phosphate and potassium fertilizers were not used as the chemical analysis of the studied soils (Table 1) indicated that they were not required. The application rate for N fertilizer was 60 kg per hectare. The treatment combinations varied based on the type of fertilizer and application timing. Each plot measured 2×3 square meters, with a 0.5-meter gap between plots. The duplicates were placed 2 meters apart, and the planting lines were spaced 0.2 meters apart. The seeding rate was 400 plants per m-2, determined by the 1000 seed weight.
2.3. Nitrate leaching evaluation
During the crop-growing season, soil samples were collected from a depth of 80-100 cm to assess nitrate leaching. The concentration of soil nitrate was determined through the Kjeldahl method. To measure the nitrate N (NO3-N) content in the soil extract, the Nitraver method was employed, utilizing a spectrophotometer (model LibsaS12).
2.4. Evaluation of protein percentage
Grain protein content was assessed utilizing the Bradford method [26]. To begin with, the samples were ground using a 1 mm sieve employing a mill (Arthur H. Thomas, Philadelphia, PA). Subsequently, the crude protein content was determined using the Kjeldahl apparatus (Kjeldahl Vap50 Gerhardt, Germany). The device measured the N content of the samples, which was then used in Equation 1 to calculate the protein content.
where T.N is the total N percentage, T is the volume of acid used for sample titer (ml), B is the volume of acid used for control volumetric measurement (ml), S is the crop sample weight (g), and N is the normality level of sulfuric acid (0.02 is normal). After measuring the total N of the sample, the protein percentage was calculated by applying a coefficient of 6.25% crude protein in different treatments.
2.5. Statistical analysis
The data analysis was conducted using SAS 9.4 [27]. Prior to performing the analysis of variance, a normality test was conducted. To compare the means, Duncan's multiple range tests were employed at the 1 and 5 percent probability levels. Furthermore, independent polynomial comparisons were utilized to examine the impact of linear or nonlinear sources, as well as the application times of N fertilizers, on wheat yield and nitrate leaching across various soil textures.
3. Results and discussion
3.1. Analysis of variance
The variance analysis conducted on sandy loam soil revealed significant effects of year, source, application time, and their interactions (year × N source, N source × application time, and year × N source × application time) on wheat grain yield and nitrate leaching at a significance level of one percent. Additionally, all treatments exhibited significant impacts on dry matter and protein percentage, with a probability level of 1 percent.

Table 2.
The mean square analysis of variance of grain yield, total dry matter, protein percentage and nitrate leaching in three soil textures.
Table 2.
The mean square analysis of variance of grain yield, total dry matter, protein percentage and nitrate leaching in three soil textures.
| Texture | S.O.V. | Grain yield | Dry matter | Protein % | N leaching |
| Sandy loam | Year | 16013581.4** | 221562237.5** | 8.28** | 0.005** |
| Year×Rep | 62185.9 | 43891.1 | 4.56 | 0.00 | |
| Application Time (AT) | 964579** | 1361045** | 13.2** | 0.006** | |
| Fertilizer Source (FS) | 79043.6n.s | 492n.s | 16.7** | 0.002** | |
| Year×TA | 110140.3n.s | 436469.2** | 1.6** | 0.00** | |
| Year×FS | 342727** | 477564** | 13.09** | 0.00** | |
| TA×FS | 398092.5** | 433432.2** | 6.4** | 0.002** | |
| Year×TA×FS | 498971.2** | 466510.2** | 0.71** | 0.002** | |
| Error | 42385.2 | 24300.1 | 0.23 | 0.00 | |
| C.V (%) | 9.12 | 14.4 | 4.9 | 0.41 | |
| Silty clay loam | Year | 4683751.6** | 6029696.22** | 6.5** | 0.005** |
| Year×Rep | 29678.6 | 24907.4 | 7.8 | 0.00 | |
| Application Time (AT) | 557473.9** | 693657.4** | 0.32n.s | 0.007** | |
| Fertilizer Source (FS) | 250785.1** | 275918.5** | 7.63** | 0.002** | |
| Year×TA | 168810.6** | 149574** | 1.17** | 0.00** | |
| Year×FS | 188446.5** | 481251.8** | 0.07n.s | 0.00** | |
| TA×FS | 642222.9** | 763590.7** | 0.18n.s | 0.002** | |
| Year×TA×FS | 58298.1* | 53240.7* | 0.4** | 0.002** | |
| Error | 15732.7 | 14767.4 | 0.1 | 0.00 | |
| C.V (%) | 8.92 | 3.36 | 3.5 | 0.75 | |
| Silty clay | Year | 2853762.1** | 1401790.7** | 22** | 0.006** |
| Year×Rep | 23909.7 | 45327.7 | 12.2 | 0.00 | |
| Application Time (AT) | 277543.3** | 241390.7** | 2** | 0.006** | |
| Fertilizer Source (FS) | 2216.9n.s | 27112.9n.s | 25.2** | 0.002** | |
| Year×TA | 420654.7** | 227112.9** | 1.89** | 0.00** | |
| Year×FS | 110082.7* | 273868.5** | 0.01** | 0.00** | |
| TA×FS | 654012.7** | 134501.8* | 0.54** | 0.002** | |
| Year×TA×FS | 737541.5** | 206590.7** | 0.9** | 0.002** | |
| Error | 34957.3 | 32516.6 | 0.05 | 0.00 | |
| C.V (%) | 6.86 | 4.9 | 3.21 | 0.54 |
n.s: not significant; (*) and (**) represent significant difference over control at p<0.05 and p<0.01, respectively.
3.2. Grain yield and Dry matter
Figure 1a depicts the impact of N fertilizer source and application time on wheat grain yields in three distinct soil textures. In sandy loam, the highest wheat grain yields were achieved with NN-T3 and AN-T3, yielding 6603.1 and 6476.3 kg ha-1, respectively. Conversely, in silty clay loam, AN-T2 resulted in the highest wheat grain yield of 6995.3 kg ha-1. This suggests a stronger correlation between N fertilizer source, application time, and this particular soil texture. In the case of silty clay, the maximum wheat grain yield of 7112.3 kg ha-1 was obtained with the NN-T3 treatment. No significant differences were observed among the various treatments regarding N fertilizer source and application time in the silty clay soil texture. Control treatments exhibited the lowest grain yields across all three soil textures, emphasizing the pivotal role of N fertilizers in enhancing grain production. Additionally, the findings suggest the potential consequences of excessive chemical fertilizer usage in previous years. All three soil textures examined in this experiment exhibited a pronounced reliance on N fertilizer. In a study conducted by Golba et al. [28], the effects of fertilizer management methods on wheat grain yield were investigated, specifically focusing on different application methods and varying levels of N fertilizer applied at different growth stages.
Figure 1b illustrates the impact of N fertilizer source and application time on wheat dry matter in the analyzed soils. The sandy loam soil exhibited the highest dry matter with NN-T3, AN-T3, and AN-T2 treatments (9698.7 kg ha-1, 9604.4 kg ha-1, and 9402.4 kg ha-1, respectively). Notably, the NN-T3 treatment resulted in 56.78% more dry matter than the control treatment, emphasizing the significance of N fertilizer application. Also, in the silty clay loam soil, the AN-T2 and AN-T1 treatments showed the highest wheat dry matter content (10143.1 kg ha-1 and 9932 kg ha-1, respectively). The AN-T2 treatment led to 31.63% more dry matter compared to the control treatment. In the silty clay soil, no significant differences were observed between application times and N fertilizer sources in terms of dry matter content. However, the highest dry matter yield (10043.6 kg ha-1) was achieved with the NN-T3 treatment, resulting in 25.37% more dry matter.
Among the studied soils, the silty clay soil exhibited the highest dry matter content in the control treatments (8011.1 kg ha-1). This soil type displayed no significant differences in dry matter content concerning the type of N fertilizer source and application time. The amount of N absorbed in the crops indicated the N status during the growth period. Enhancing N utilization efficiency promotes N uptake, dry matter production, and grain yield in crops [11,29].
3.3. Protein percentage and Nitrate leaching
The analysis of protein percentage in sandy loam revealed significant differences: AN (10.44%), T3 application time (10.93%), and AN-T3 treatment (11.01%) (Figure 2a). In the case of silty clay loam, the highest protein percentages were observed in the following groups: AN (10.98%), T1 and T3 combined (10.65%), and AN-T1 (11.1%). Comparing the means for protein percentage in silty clay, AN had the highest protein content (11.24%), followed by T2 (10.76%) and T1 (10.27%). Notably, the AN-T2 treatment yielded the best result with an average protein content of 12.23%.
The relationship between soil minerals like N and water-soluble sugars is influenced by environmental factors. When wheat has better access to nitrogen, protein content increases while sugar levels decrease. As photosynthetic activities intensify, sugar amounts rise, leading to protein deficiency. This effect is more pronounced with organic nitrogen fertilizers due to their gradual element release [30]. Additionally, nitrate leaching during the growth period depends on initial soil nitrogen, nitrogen type, crop growth conditions, crop nitrogen uptake, and fertilizer and irrigation management [30]. The presence of nitrates resulting from chemical fertilizer application is an important indicator of water resource, soil, and crop pollution [11,24].
The comparison of means in sandy loam soil revealed that the highest fraction of nitrate leaching was observed under the NN and T1 treatments, with a reported value of 0.37 mg l-1 in both treatments. Additionally, a nitrate leaching value of 0.38 mg l-1 was observed under the NN treatment in both the T1 and T2 treatments. In contrast, results varied in silty clay loam soil, which has a denser texture compared to sandy loam, indicating a lower expected nitrate leaching rate.
According to the results, the highest nitrate leaching amount was reported in the NN-T1 and NN-T2 treatments, with a value of 0.34 mg l-1. These findings also confirmed that there was no significant difference between the T1 and spring T2 treatments when NN fertilizer was used, resulting in a nitrate leaching rate of 0.35 mg l-1. However, the lowest nitrate leaching rate in both fertilizer sources was observed in the T3 treatment, with a value of 0.33 mg l-1. In terms of nitrate leaching fraction in silty clay soil, no significant difference was found between the two fertilizer sources, both resulting in a value of 0.34 mg l-1. Nevertheless, the timing of fertilizer application was found to affect the nitrate leaching rate. The highest leaching rate was observed when the fertilizer was applied at T1, indicating an increase in nitrate leaching during the autumn and winter seasons, with a value of 0.36 mg l-1. Conversely, the lowest amount of nitrate leaching was reported in the AN-T3 treatment, with a value of 0.32 mg l-1.
Based on the results obtained in this experiment, it was observed that soil texture, specifically the heavier texture of silty clay, resulted in a decrease in the amount of nitrate leaching. The control treatments showed varying levels of nitrate leaching in different soil textures, with values of 0.25, 0.22, and 0.2 mg l-1 for sandy loam, silty clay loam, and silty clay, respectively (refer to Figure 2b). Notably, an increase in the percentage of clay in the soil exhibited a significant reduction in nitrate leaching. This phenomenon can be attributed to the substantial entry of N from chemical fertilizers into the soil, coupled with the crop's inability to fully absorb it, leading to the loss of N that gradually moves towards deeper soil layers over time. Additionally, the presence of ammonium ions in the soil, generated by the activity of the Urease enzyme, contributes to the production of a significant amount of nitrate. Due to its negative charge, nitrate is not readily absorbed by soil particles. Consequently, with the occurrence of irrigation and rainfall, the soil profile undergoes downward movement, resulting in an eventual increase in nitrate concentration in the drainage sample [32]. Increasing the crop's N uptake capacity can effectively reduce the transfer of nitrate to lower soil layers, thereby minimizing the potential for leaching [24].
3.4. Interaction effects
According to the results of the analysis of variance, the effect of the year on grain yield was found to be significant. The highest grain yield was observed in the first year of the experiment in sandy loam and silty clay loam, while in silty clay, the highest yield was obtained from the second year's crop. The interactions between the year, N source, and application time on grain yield confirmed that the highest grain yield in sandy loam was achieved in the first year using NN (7462.8 kg ha-1) and T3 and T2 (7527.7 and 7252.4 kg ha-1) respectively (Figure 3a-1). In the first year of the experiment, the highest grain yield recorded was 7271.3 kg ha-1. However, in the second and third years of the experiment, there was a decrease of 22.7% and 14.97% in grain yield respectively (Figure 3a-2, 3).
As mentioned in the preceding paragraph, the silty clay loam soil exhibited the highest grain yield and total dry matter in the initial year of the experiment, with values of 7230.6 and 10793.7 kg ha-1, respectively. However, in the second and third years of the experiment, the grain yield declined by 8.46 and 13.4%, respectively. Among the different treatments applied to this soil texture, the AN application treatment resulted in the highest grain yield of 7357.8 kg ha-1, followed by T2 and T3 with yields of 7413.3 and 7245.7 kg ha-1, respectively. On the other hand, the grain yield outcomes in the silty clay soil differed from the other two soils due to its heavier texture. Throughout the three-year experiment, no significant difference was observed between the two nitrogen (N) sources. However, the second year of the experiment yielded the highest grain yield (7104.6 kg ha-1). In the third year, the grain yield decreased by 10.86%. Due to the heavy texture of this soil type, no significant difference was observed in terms of application times, particularly between the different N sources (Figure 3a-b).
An analysis of variance conducted on silty clay loam soil demonstrated a significant difference in grain yield when N fertilizer was applied at different times for the two fertilizer sources. However, in the case of the other two soil textures, the effect of the fertilizer source was found to be insignificant. Previous research has indicated that the utilization of N alters the pH of the soil in the rhizosphere, consequently affecting its chemical properties. Depending on whether the soil is acidic or alkaline, these changes in soil pH can enhance crop growth and improve the uptake of other nutrients [19,24]. The outcomes of this study align with the findings of Wang et al. [24], revealing that the effect of N sources on grain yield varies in different soil types. Furthermore, the application time also demonstrated a significant influence on grain yield and dry matter. The specific impact of the application time varied across different soil types, with T3 having the greatest effect on grain yield and dry matter in sandy loam and silty clay soil, while T2 had the greatest impact on these variables in silty clay loam. Additional research confirms that the response of crops to N varies depending on factors such as soil type, rainfall, rainfall distribution, and growth stage [28,29].
Generally, N consumption is high in soils with a light texture and low in soils with a heavy texture. When wheat is rotated with legumes, N consumption reaches an equilibrium point, indicating that N consumption does not significantly affect grain yield and dry matter production (Figure 3. b1-3). Another approach to increase available N during the planting season is through N mineralization. The required amount varies depending on the soil's organic carbon content, ranging from 60 kg ha-1 for soils with less than 0.9% organic carbon to 100 kg ha-1 for soils with more than 1.8% organic carbon [31,32,33,34].
It is possible that if N fertilizer was not used in the two experimental plots with heavy soil texture during the spring, the yield could have been higher than the values obtained in this project. In other words, by either not consuming N or reducing its application in the spring, it might be possible to achieve similar or even better results.
In the control field with silty clay loam soil, the highest protein content was recorded in the first year of the experiment, reaching 11.4% (Figure 4a-2). The protein percentage in the control field with silty clay soil differed from that of the sandy loam control field due to the heavier texture of the soil. In these denser soils, no significant difference was observed between the two control treatments throughout the three-year experiment. However, the highest protein percentage was obtained in the first year for both fields, measuring 12.1% and 12.2% respectively (Figure 4a-1, 3). Furthermore, there was no significant difference observed between application times, particularly among different N sources. The continuous cultivation of wheat in all three soil types resulted in a notable decline in protein content. This emphasizes the importance of incorporating legumes into crop rotation practices to minimize reliance on chemical fertilizers (Figure 4a-1).
The mean values of nitrate leaching in the control treatment were significantly lower compared to the N application treatments. In the sandy loam control fields, the timing of application had an impact on nitrate leaching, with the highest occurrence observed at T2 (42 mg l-1) (Figure 4b-1). However, there were no significant differences observed over the course of three years. For silty clay loam, a decreasing trend in nitrate leaching was observed throughout the three-year period, particularly with T3 application timing, where the decrease was significant (Figure 4b-2). No significant differences were found between the types of N fertilizer used. In silty clay, the highest amount of nitrate leaching occurred in the second year of the experiment (0.384 mg l-1). In this soil type, the use of AN resulted in lower nitrate leaching compared to NN. The decreasing trend in nitrate leaching with T3 application was statistically significant (Figure 4b-3).
3.5. Correlation coefficients
The Pearson correlation coefficients revealed notable findings. The strongest correlation was observed between wheat grain yield and dry matter production (0.93**). However, no significant correlation was found between the percentage of grain protein and dry matter. Conversely, an inverse and negative correlation was observed between nitrate leaching values and grain yield, dry matter, and protein percentage. Specifically, the highest negative correlation was reported between dry matter and nitrate leaching (-0.88**). This implies that as nitrate leaching increased, there was a decrease in dry matter, grain yield, and protein percentage in the wheat crops (Table 3).
3.6. Relationship between grain yield and nitrate leaching
Figure 5 illustrates the values of grain yield (kg ha-1) and nitrate leaching (mg l-1) when different forms of N were utilized, along with variations in application times and soil textures. In contrast to the earlier sections, these findings demonstrate the impact of nitrate accumulation in the soil on wheat grain yield, considering various N sources. To quantify these relationships, linear regression was employed. By comparing the scatter diagrams of wheat grain yield increments and nitrate leaching values using different N sources with the control treatment, the association was examined. The mean nitrate leaching values were 0.257, 0.222, and 0.023 mg l-1 for the control treatment, sandy loam, and silty clay loam/silty clay textures, respectively. The corresponding wheat grain yield values were 2350, 3416, and 3825 kg ha-1. These results reveal that in comparison to sandy loam, both silty clay loam and silty clay significantly reduced nitrate leaching by 0.035 and 0.054 mg l-1, respectively. Consequently, wheat grain yield experienced an increase of 1066 and 1475 kg ha-1 in the control treatment. This indicates that the soil texture plays a crucial role in minimizing nitrate leaching, with denser soil textures leading to higher wheat grain yields (Figure 5).
The application of AN fertilizer on wheat yielded the following results: In sandy loam, silty clay loam, and silty clay soils, the average leaching of nitrate using T1 application times was measured at 0.355, 0.347, and 0.284 mg l-1, respectively. These values were compared to the control treatment, resulting in wheat grain yields of 3136, 3132, and 2941 kg ha-1. In the case of T2 application, the nitrate leaching values in AN treatments were 0.3, 0.321, and 0.283 mg l-1, respectively. This reduction in nitrate leaching led to increased wheat grain yields of 3698, 3285, and 2576 kg ha-1 compared to the control treatment. For T3 application, the nitrate leaching values in the three soil textures were measured at 0.295, 0.32, and 0.305 mg l-1, respectively, resulting in grain yields of 3654, 2625, and 2648 kg ha-1 compared to the control treatment for wheat grain.
An important observation regarding the application of AN fertilizer is the reduction in leaching observed in silty clay soil, which resulted in a shorter distance between grain yields of wheat and the control treatment. It appears that in heavier soil textures, the total application of AN fertilizer during T1 had a greater impact on increasing wheat grain yield (silty clay loam and silty clay). On the other hand, the optimal time for AN application in silty clay soil was during T2. Comparing the treatments across different soil textures, the results indicate that heavier soil textures provide better growth conditions for wheat. The grain yield significantly increased while nitrate leaching decreased (Figure 5).
The nitrate leaching values for sandy loam, silty clay loam, and silty clay soils with the NN treatment at T1 were reported as 0.396, 0.367, and 0.275 mg l-1, respectively. These values indicated an increase of 0.088, 0.139, and 0.077 mg l-1 compared to the control treatment. Additionally, the wheat grain yield at T1 increased to 3629, 2577, and 2467 kg ha-1 for sandy loam, silty clay loam, and silty clay, respectively. At T2, the nitrate leaching values for the same soil types with the NN treatment were 0.106, 0.166, and 0.078 mg l-1, respectively. This resulted in grain yields of 3439, 3033, and 2696 kg ha-1 for sandy loam, silty clay loam, and silty clay soils. Furthermore, the application of nitrate fertilizer at T3 caused an increase in nitrate leaching values of 0.7, 0.166, and 0.1 mg l-1, respectively, compared to the control treatment. These elevated levels of nitrate leaching led to increased grain yields of 3993, 3131, and 2976 kg ha-1 for sandy loam, silty clay loam, and silty clay soils (Figure 5).
4. Conclusion
Based on the experimental results, the impact of N fertilizer on the protein percentage varied significantly across the three soil texture groups, reaching a level of significance of one percent. Among the nitrogen sources tested, AN exhibited the most substantial effect. Regarding wheat grain yield, the N fertilizer treatment showed a significant impact only in silty clay loam soil, at the one percent level, while it did not reach significance in the other two soil groups. The highest protein percentages were observed in silty clay loam with AN-T1 at 11.1% and silty clay with AN-T2 at 12.06%. Notably, the utilization of AN fertilizer significantly increased the protein percentage of the wheat crop in the two heavy soil textures (silty clay loam and silty clay). The results indicate that when applying AN fertilizer in any of the three soil types, the optimal timing is T2. The study findings approximated the following results: in sandy loam soil texture (nitrate leaching 0.3 mg l-1 and wheat grain yield 5981 kg ha-1), in silty clay loam (leaching 0.32 mg l-1 and grain yield 6707 kg ha-1), and in silty clay (nitrate leaching 0.3 mg l-1 and grain yield 6474 kg ha-1). Conversely, if NN fertilizer is used in any of the three soil types, the optimal application time is T3. The results closely resemble the findings from this study: in sandy loam soil texture (nitrate leaching 0.3 mg l-1 and grain yield 6302 kg ha-1), in silty clay loam soil texture (nitrate leaching 0.36 mg l-1 and grain yield 6538 kg ha-1), and in silty clay soil texture (nitrate leaching was 0.27 mg l-1 and grain yield was 6844 kg ha-1).
Funding
This research did not receive any specific grant from funding agencies in the public, commercial, or not-for-profit sectors.
Institutional Review Board Statement
Not applicable.
Informed Consent Statement
Not applicable.
Conflicts of Interest
The author declare no conflict of interest.
References
- Hochman, Z. Yield gap analysis with local to global relevance: a review. Field Crops Res. 2013, 143, 417. [Google Scholar]
- Ahmed, N.; Thompson, S.; Turchini, G.M. Organic aquaculture productivity, environmental sustainability, and food security: insights from organic agriculture. Food Secur. 2020, 12, 1253–1267. [Google Scholar] [CrossRef]
- FAOSTAT. Aquastat. Food and Agriculture Organization of the United Nations. 2023.
- FAPRI. FAPRI, US and World Agricultural Outlook. Food and Agriculture Research Institute, Iowa. 2023.
- Sheibani, S.; Ghadiri, H. Integration effects of split nitrogen fertilization and herbicide application on weed management and wheat yield. J. Agr. Sci. Tech. 2012, 14, 77–86. [Google Scholar]
- Sharafi, S. Predicting Iran’s future agro-climate variability and coherence using zonation? based PCA. Italian Journal of Agrometeorology 2022, 2, 17–30. [Google Scholar] [CrossRef]
- Kumar, N.; Chaudhary, A.; Ahlawat, O.P.; Naorem, A.; Upadhyay, G.; Chhokar, R.S.; Gill, S.C.; Khippal, A.; Tripathi, S.C.; Singh, G.P. Crop residue management challenges, opportunities and way forward for sustainable food-energy security in India: A review. Soil and Tillage Research. 2023, 228, 105641. [Google Scholar] [CrossRef]
- Sharafi, S.; Kazemi, A.; Amiri, Z. Estimating energy consumption and GHG emissions in crop production: A machine learning approach. Journal of Cleaner Production 2023, 408, 137242. [Google Scholar] [CrossRef]
- Xu, J.; Cai, H.; Wang, X.; Ma, C.; Lu, Y.; Ding, Y.; Wang, X.; Chen, H.; Wang, Y.; Saddique, Q. Exploring optimal irrigation and nitrogen fertilization in a winter wheat-summer maize rotation system for improving crop yield and reducing water and nitrogen leaching. Agricultural Water Management. 2020, 228, 105904. [Google Scholar] [CrossRef]
- Peng, S.; Buresh, R.J.; Huang, J.; Zhong, X.; Zou, Y.; Yang, J.; Wang, G.; Liu, Y.; Hu, R.; Tang, Q.; et al. Improving nitrogen fertilization in rice by sitespecific N management. A review. Agronomy for sustainable development. 2010, 30, 649–656. [Google Scholar] [CrossRef]
- Sharafi, S. Effectiveness of different methods of zinc application to increase grain micronutrients of rainfed wheat under reduced nitrogen application rate. Journal of Crop Science and Biotechnology. 2023, 26, 265–274. [Google Scholar] [CrossRef]
- Woodley, A.; Drury, C.; Yang, X.; Reynolds, W.; Calder, W.; Oloya, T. Streaming urea ammonium nitrate with or without enhanced efficiency products impacted corn yields, ammonia, and nitrous oxide emissions. Agronomy Journal 2018, 110, 444–454. [Google Scholar] [CrossRef]
- Linton, N.F.; Machado, P.V.F.; Deen, B.; Wagner-Riddle, C.; Dunfield, K.E. Long-term diverse rotation alters nitrogen cycling bacterial groups and nitrous oxide emissions after nitrogen fertilization. Soil Biology and Biochemistry 2020, 149, 107917. [Google Scholar] [CrossRef]
- Garnett, T.; Conn, V.; Kaiser, B.N. Root based approaches to improving nitrogen use efficiency in plants. Plant cell environment 2009, 32, 1272–1283. [Google Scholar] [CrossRef]
- Ishfaq, M.; Akbar, N.; Zulfiqar, U.; Ali, N.; Jabran, K.; Nawaz, M.; Farooq, M. Influence of nitrogen fertilization pattern on productivity, nitrogen use efficiencies, and profitability in different rice production systems. Journal of Soil Science and Plant Nutrition 2020, 1–17. [Google Scholar] [CrossRef]
- Galloway, J.N.; Leach, A.M.; Bleeker, A.; Erisman, J.W. A chronology of human understanding of the nitrogen cycle. Philosophical Transactions of the Royal Society B Biological Sciences. 2013, 368, 20130120. [Google Scholar] [CrossRef] [PubMed]
- Coskun, D.; Britto, D.T.; Shi, W.; Kronzucker, H.J. Nitrogen transformations in modern agriculture and the role of biological nitrification inhibition. Nature Plants. 2017, 3, 1–10. [Google Scholar] [CrossRef]
- Tabak, M.; Lepiarczyk, A.; Filipek-Mazur, B.; Lisowska, A. Efficiency of nitrogen fertilization of winter wheat depending on sulfur fertilization. Agronomy Journal. 2020, 10, 1304. [Google Scholar] [CrossRef]
- Wang, H.; Zhang, Y.; Chen, A.; Liu, H.; Zhai, L.; Lei, B.; Ren, T. An optimal regional nitrogen application threshold for wheat in the North China Plain considering yield and environmental effects. Field Crops Research 2017, 207, 52–61. [Google Scholar] [CrossRef]
- Mueller, S.M.; Messina, C.D.; Vyn, T.J. Simultaneous gains in grain yield and nitrogen efficiency over 70 years of maize genetic improvement. Scientific reports 2019, 9, 1–8. [Google Scholar] [CrossRef] [PubMed]
- Rehman, H.U.; Basra, S.M.; Wahid, A. Optimizing nitrogen-split application time to improve dry matter accumulation and yield in dry direct seeded rice. International Journal of Agriculture and Biology 2013, 15, 41–47. [Google Scholar]
- Huang, P.; Zhang, J.; Zhu, A.; Li, X.; Ma, D.; Xin, X.; Zhang, C.; Wu, S.; Garland, G.; Pereira, E.I. Nitrate accumulation and leaching potential reduced by coupled water and nitrogen management in the Huang-Huai-Hai Plain. Science of the Total Environment. 2018, 610, 1020–8. [Google Scholar] [CrossRef] [PubMed]
- Delin, S. Site-specific nitrogen fertilization demand in relation to plant available soil nitrogen and water 2005, vol 2005, 6.
- Wang, Z.; Miao, Y.; Li, S. Effect of ammonium and nitrate nitrogen fertilizers on wheat yield in relation to accumulated nitrate at different depths of soil in drylands of China. Field Crops Research. 2015, 183, 211–224. [Google Scholar] [CrossRef]
- Sharafi, S.; Ghaleni, M. Spatial assessment of drought features over different climates and seasons across Iran. Theor. Appl. Climatol 2022, 147, 941–957. [Google Scholar] [CrossRef]
- Bradford, M.M. A rapid and sensitive method for the quantitation of microgram quantities of protein utilizing the principle of protein-dye binding. Analytical biochemistry 1976, 72, 248–254. [Google Scholar] [CrossRef] [PubMed]
- SAS I. Base SAS 9.4 procedures guide: statistical procedures Cary, NC, USA: SAS Institute Inc, 2013.
- Golba, J.; Rozbicki, J.; Gozdowski, D.; Sas, D.; Madry, W.; Piechocinski, M.; Kurzynska, L.; Studnicki, M.; Derejko, A. Adjusting yield components under different levels of N applications in winter wheat. International Journal of Plant Production. 2013, 7, 139–150. [Google Scholar]
- Soltani, A.; Robertson, M.; Manschadi, A. Modeling chickpea growth and development: Nitrogen accumulation and use. Field crops research 2006, 99, 24–34. [Google Scholar] [CrossRef]
- Ma, D.; Guo, T.; Wang, C. Effects of nitrogen fertilizer applied at different development stages on the activities of photosynthetic enzymes in winter wheat flag leaves. Plant Physiology Communications. 2006, 42, 1091. [Google Scholar]
- Li, H.; Mei, X.; Nangia, V.; Guo, R.; Liu, Y.; Hao, W.; Wang, J. Effects of different nitrogen fertilizers on the yield, water-and nitrogen-use efficiencies of drip-fertigated wheat and maize in the North China Plain. Agricultural Water Management. 2021, 243, 106474. [Google Scholar] [CrossRef]
- Li, Y.; Liu, H.; Huang, G. The effect of nitrogen rates on yields and nitrogen use efficiencies during four years of wheat–maize rotation cropping seasons. Agronomy Journal. 2016, 108, 2076–2088. [Google Scholar] [CrossRef]
- Knowles, T.; Doerge, T.; Ottman, M. Improved nitrogen management in irrigated durum wheat using stem nitrate analysis: II. interpretation of nitrate-nitrogen concentrations. Agronomy Journal 1991, 83, 353–356. [Google Scholar] [CrossRef]
- Sharafi, S.; Sharifdost, F.; Mohajeri, F. Effect of Fe, Zn and Cu on quantity and quality characteristics and nutrient accumulation in wheat. Journal of Crop Science and Biotechnology 2021, 24, 469–476. [Google Scholar] [CrossRef]
Figure 1.
Effect of source and application time of N fertilizer on a) grain yield and b) dry matter of wheat in sandy loam, silty clay loam and silty clay soil textures.
Figure 1.
Effect of source and application time of N fertilizer on a) grain yield and b) dry matter of wheat in sandy loam, silty clay loam and silty clay soil textures.
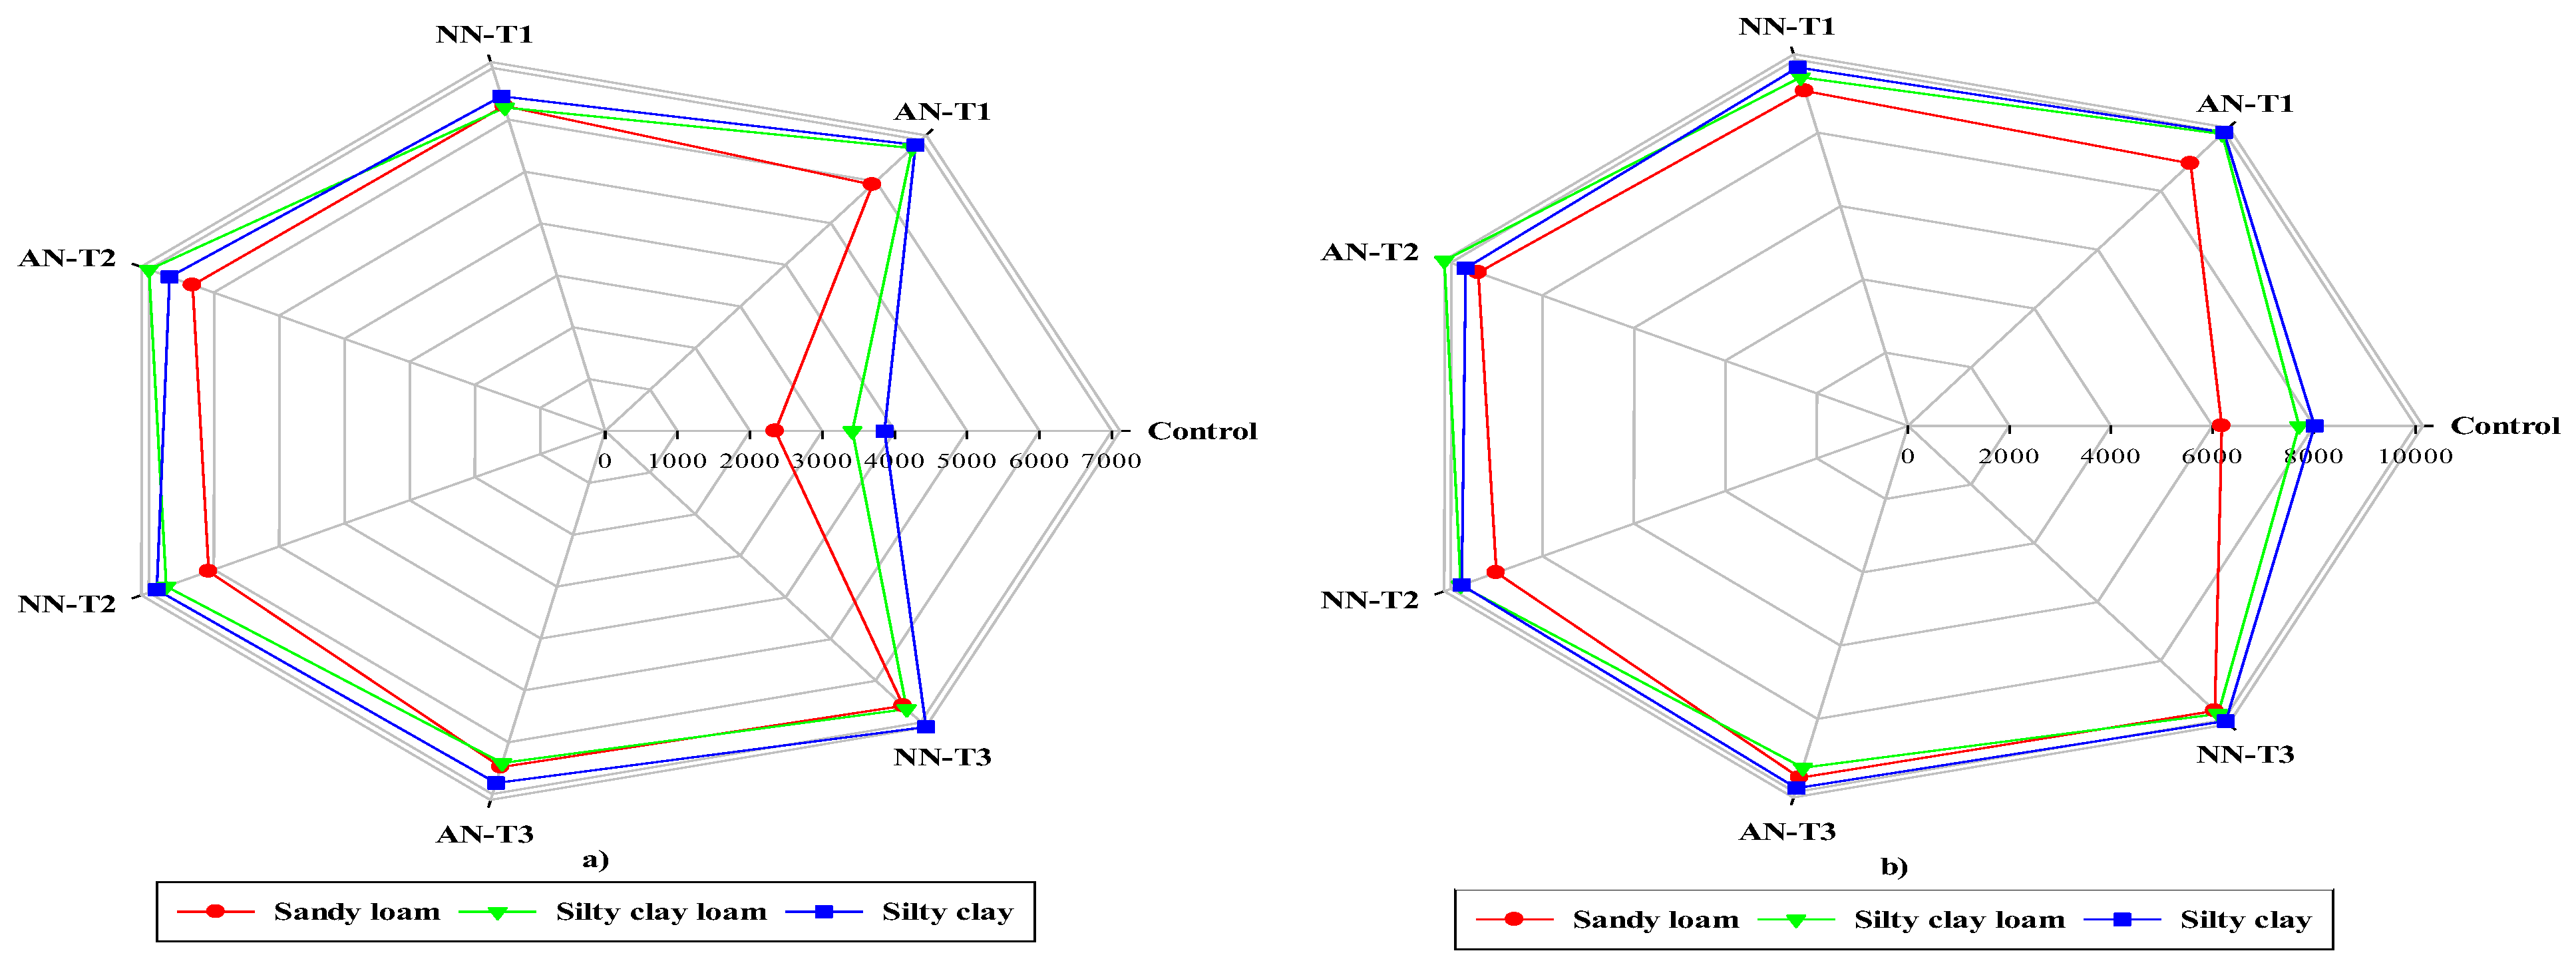
Figure 2.
Effect of source and application time of N fertilizer on a) grain protein percentage and b) nitrate leaching in sandy loam, silty clay loam and silty clay soil textures.
Figure 2.
Effect of source and application time of N fertilizer on a) grain protein percentage and b) nitrate leaching in sandy loam, silty clay loam and silty clay soil textures.
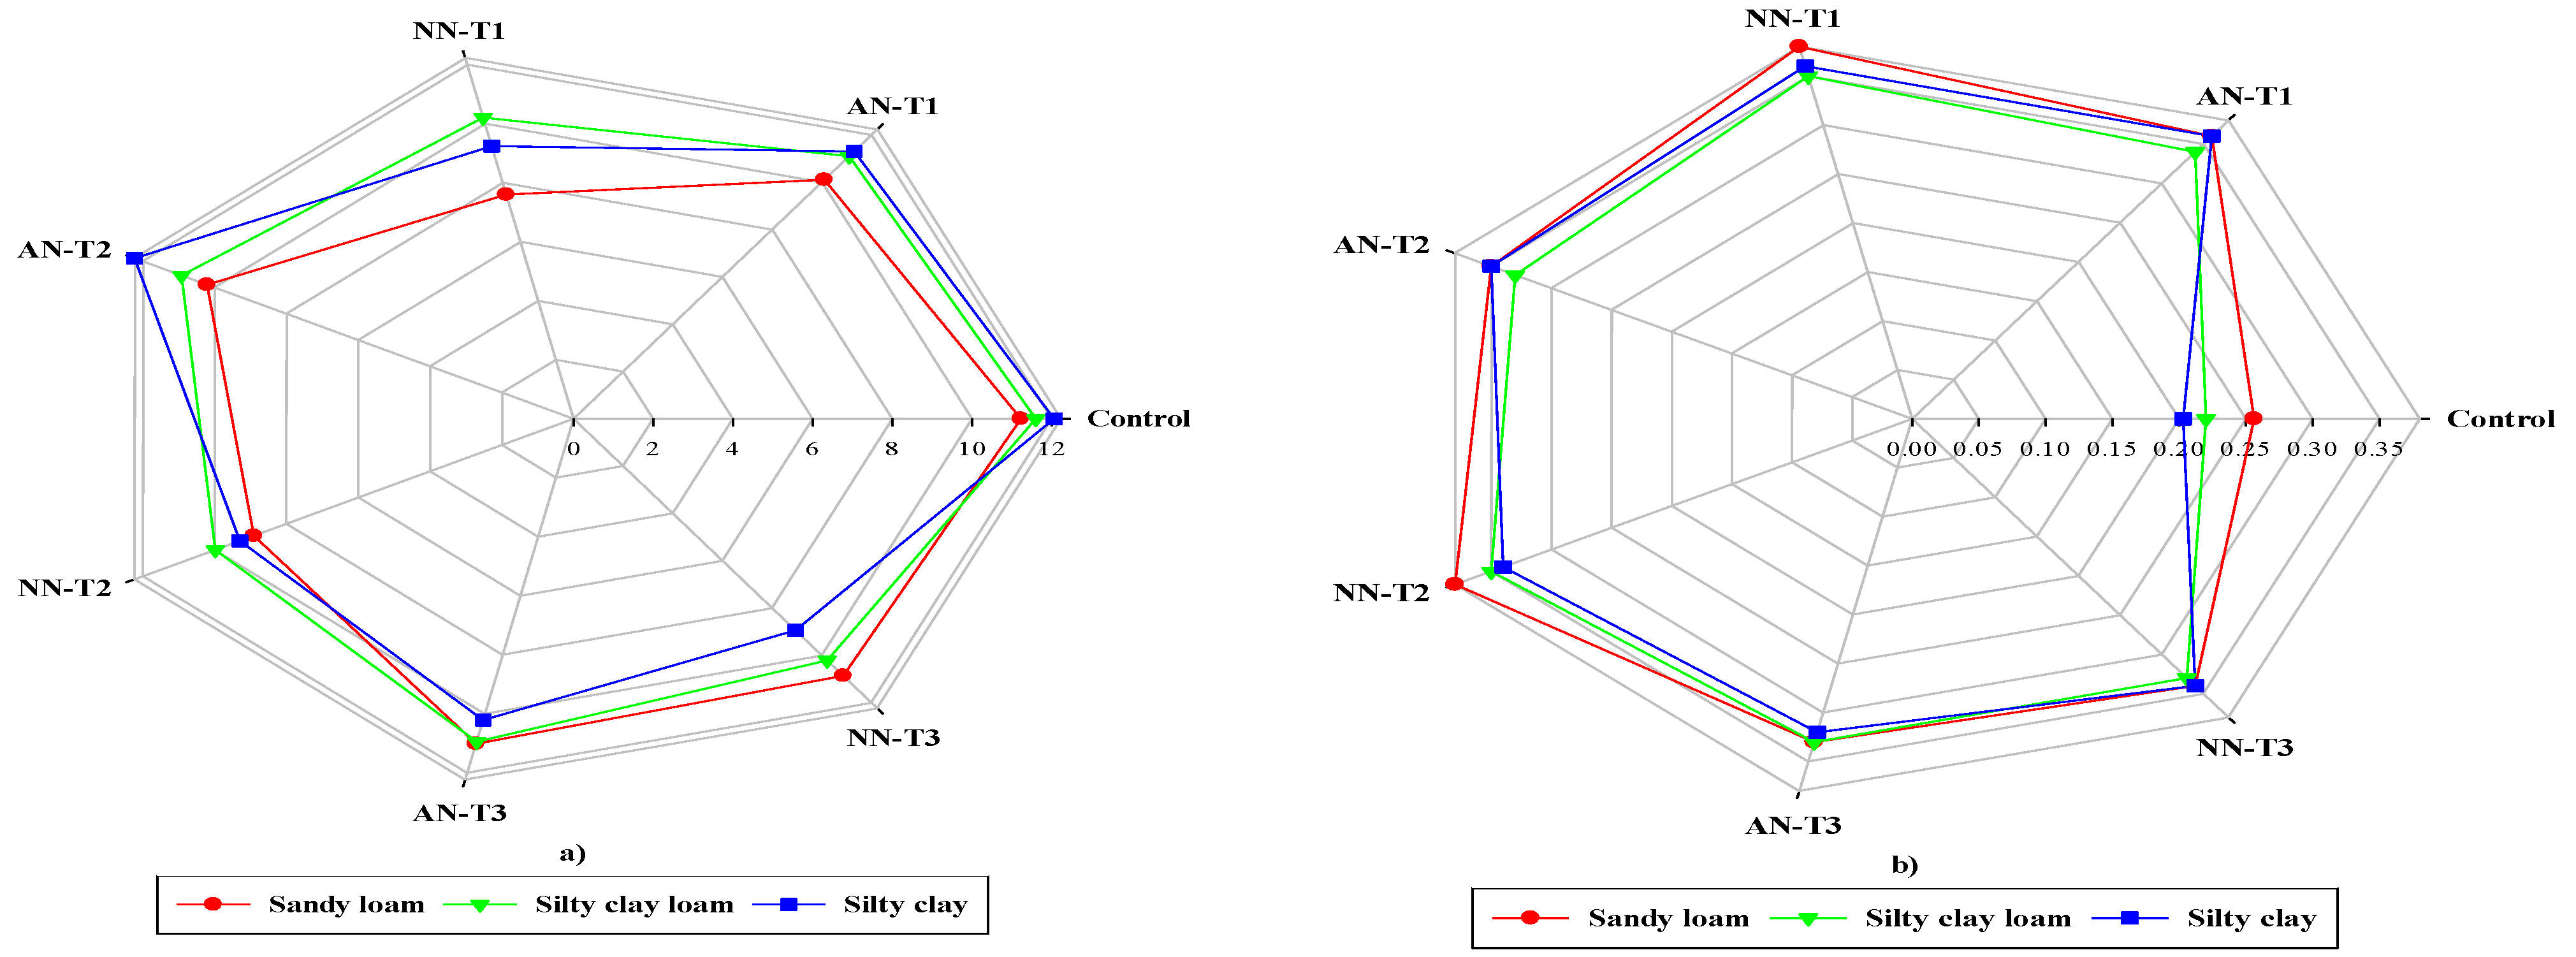
Figure 3.
The effects of year × N source × application time of fertilizer on a) grain yield and b) total dry matter (TDM) of wheat.
Figure 3.
The effects of year × N source × application time of fertilizer on a) grain yield and b) total dry matter (TDM) of wheat.
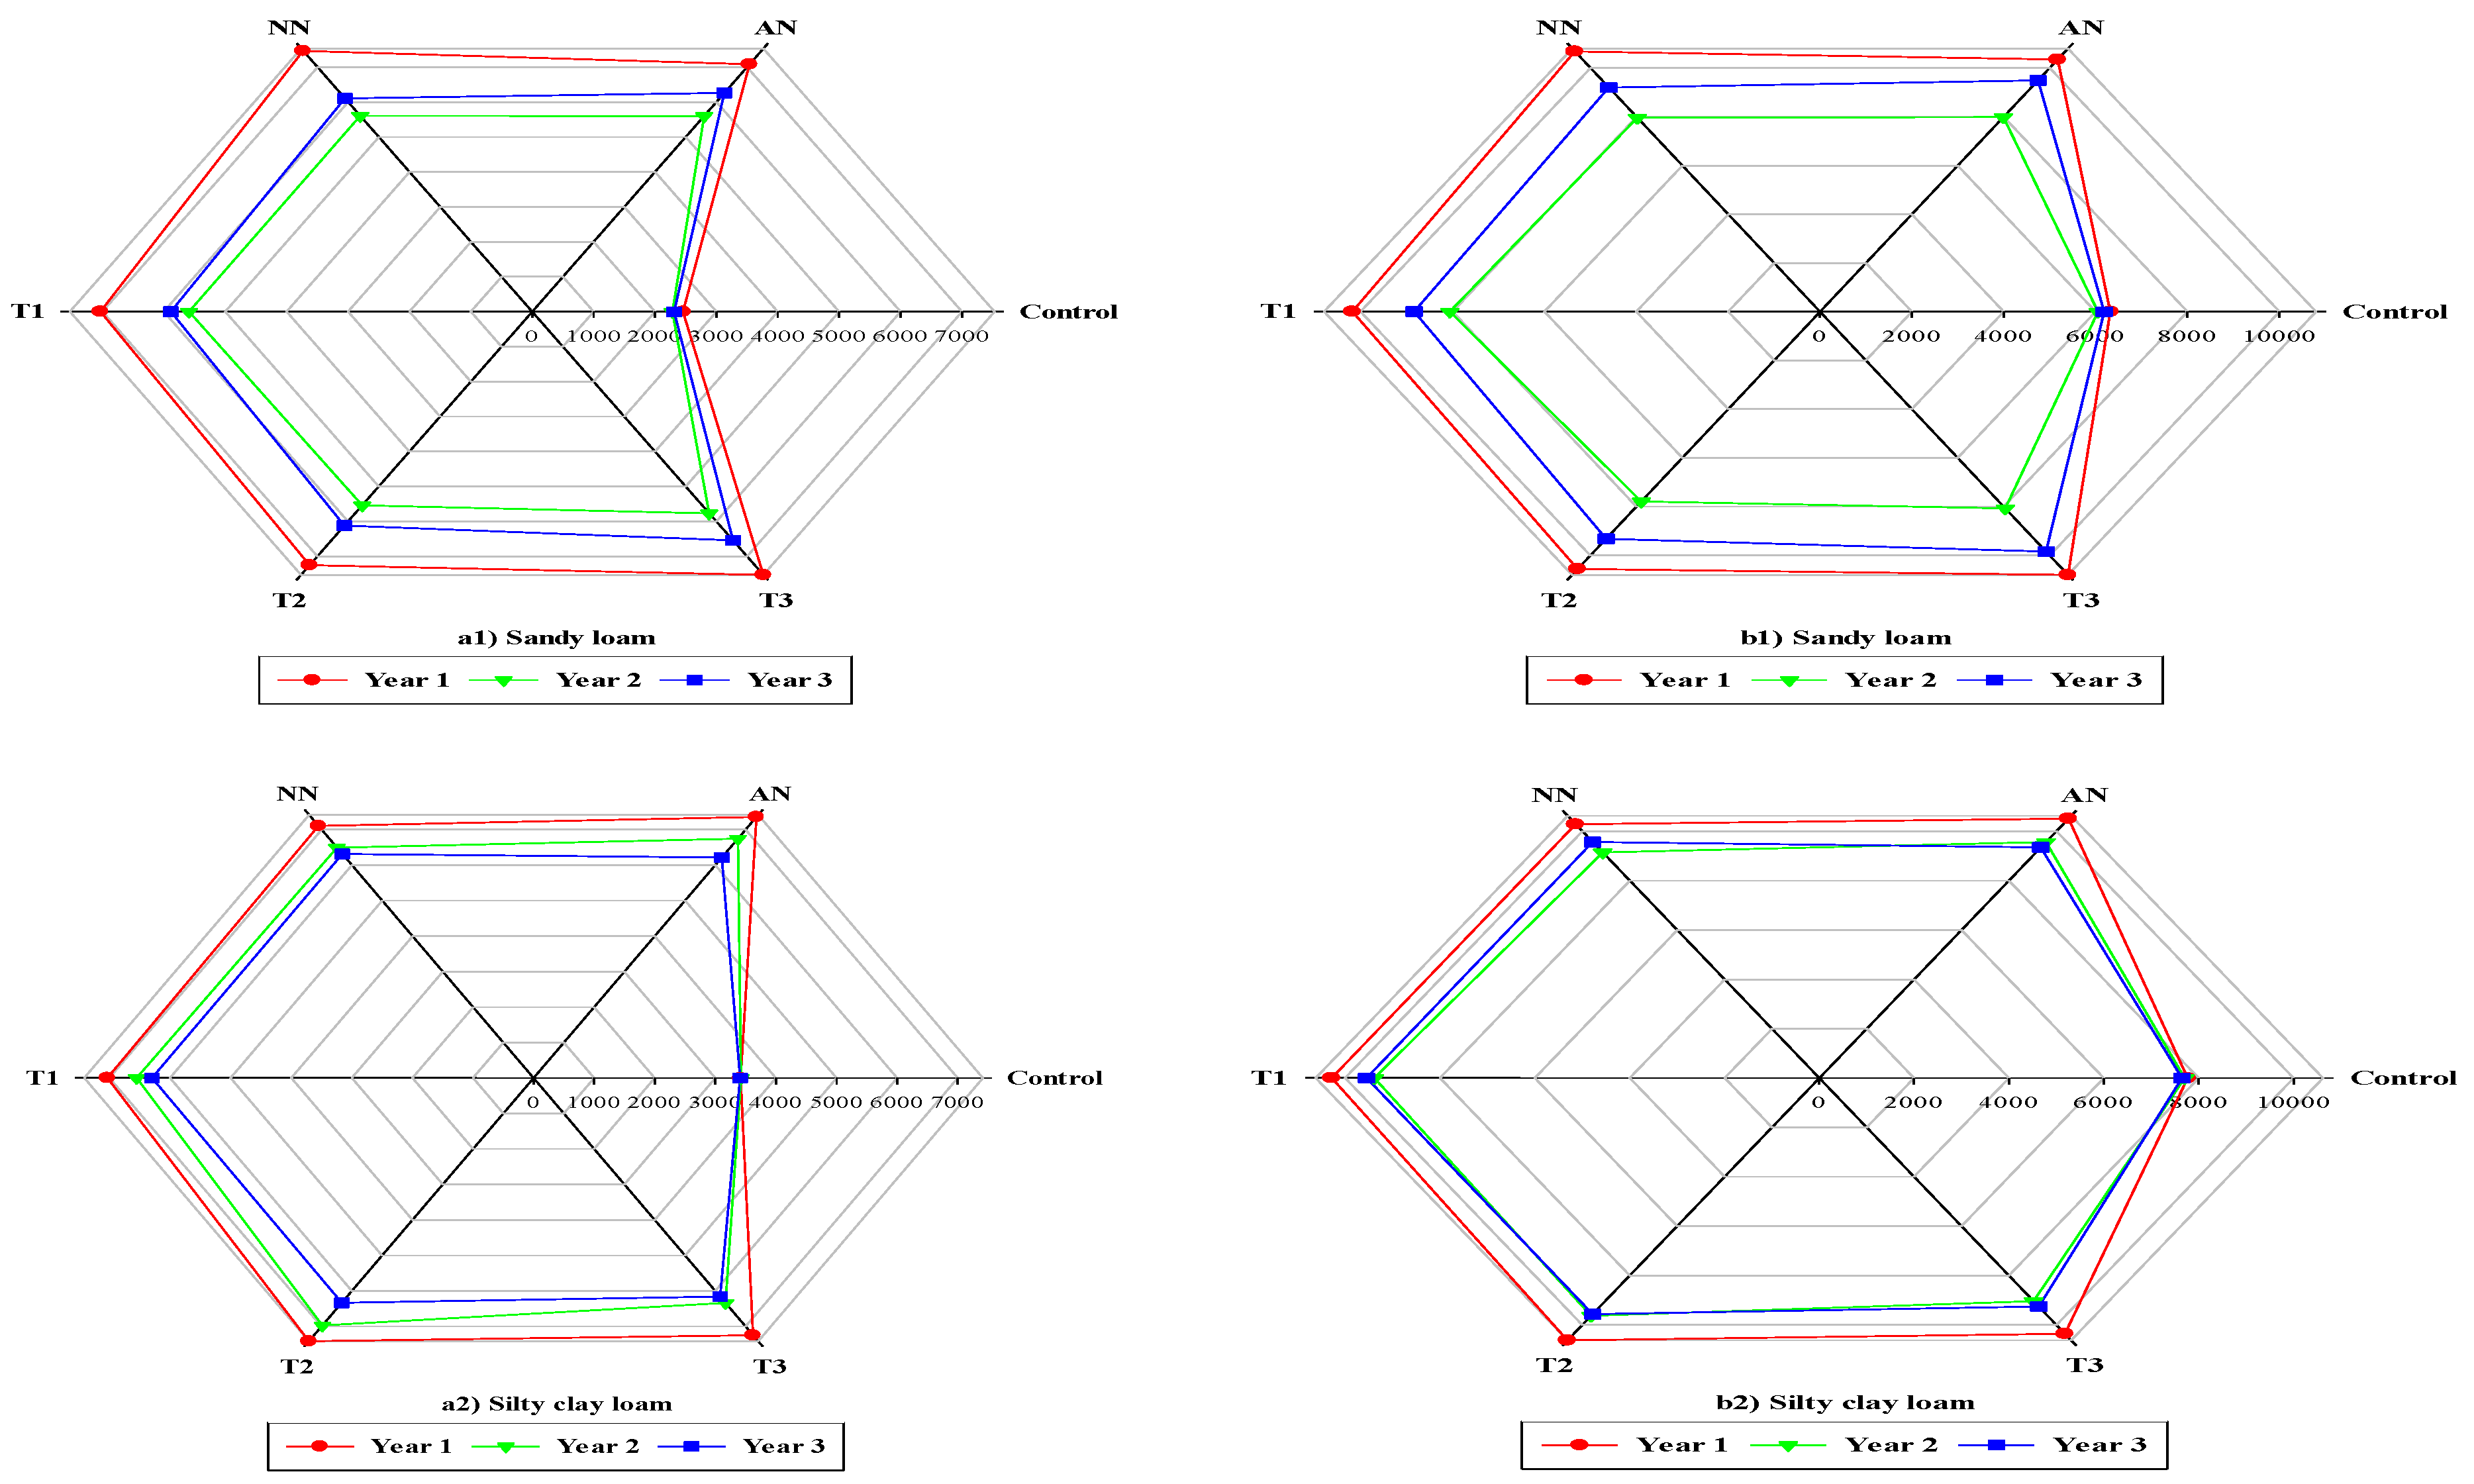
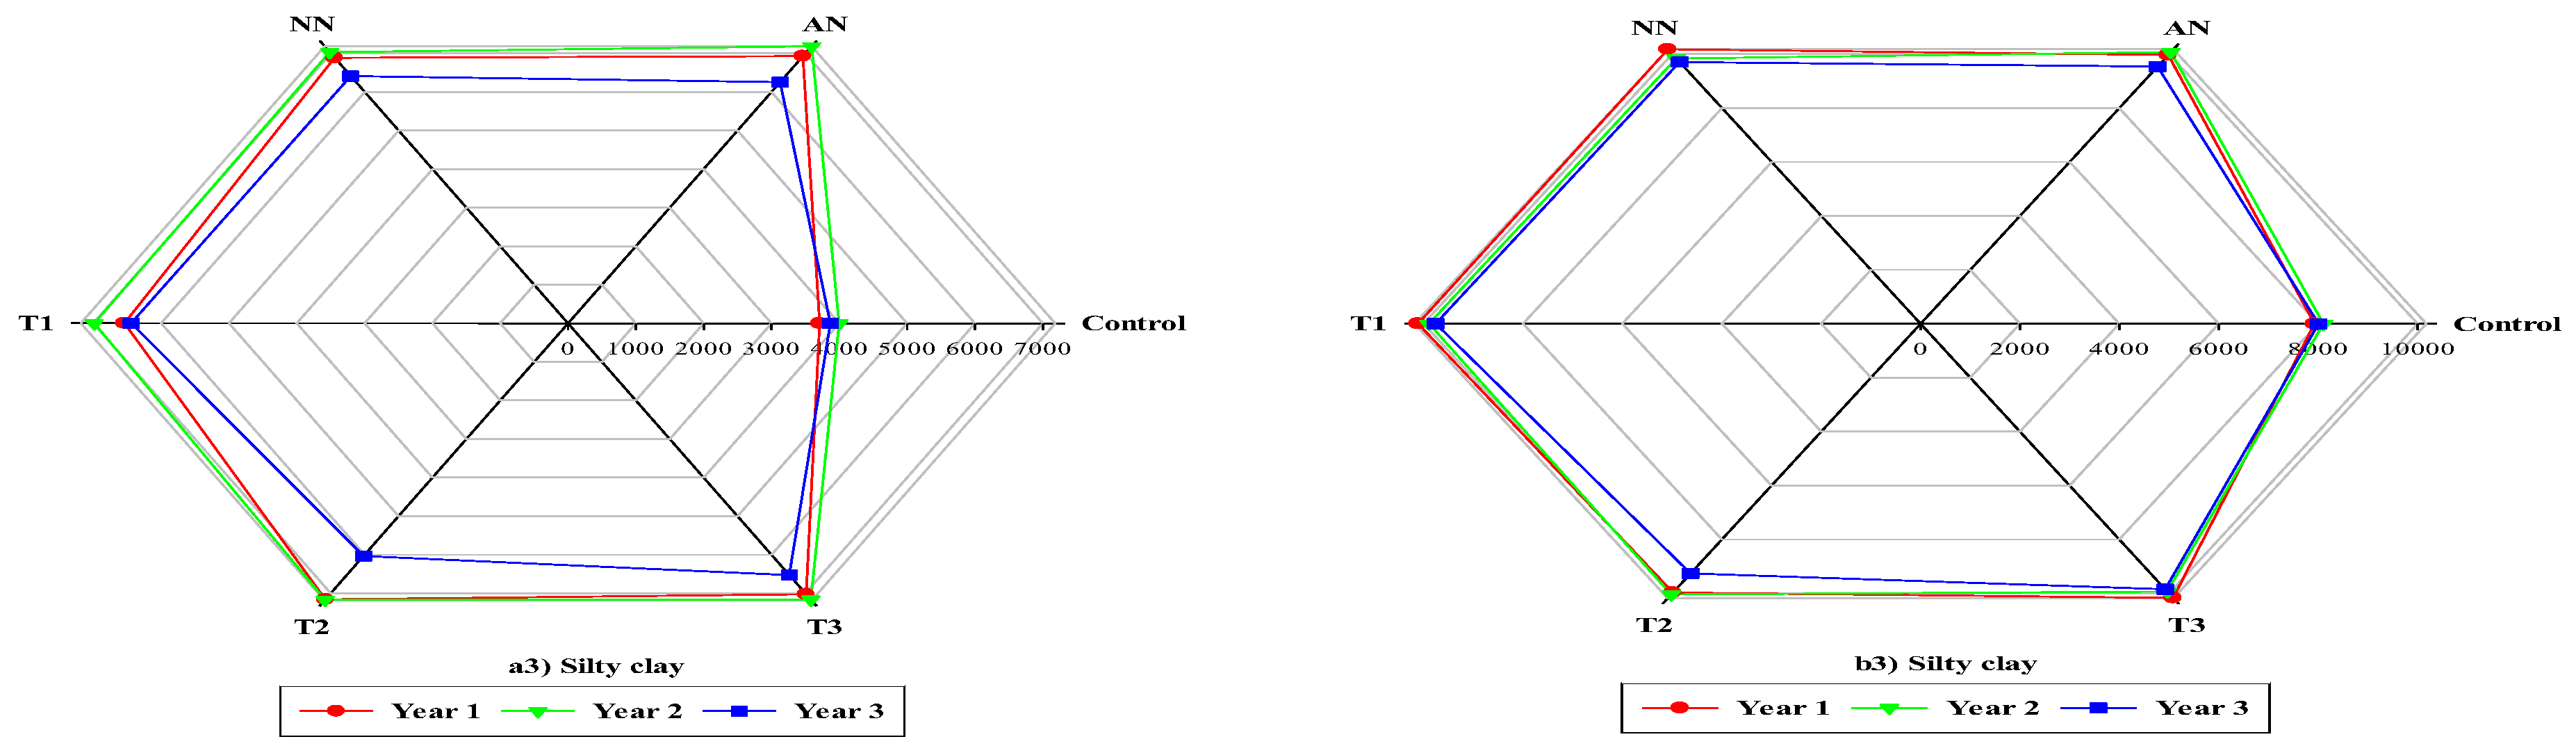
Figure 4.
The effects of year × N source × application time of fertilizer on a) protein percentage and b) nitrate leaching of wheat.
Figure 4.
The effects of year × N source × application time of fertilizer on a) protein percentage and b) nitrate leaching of wheat.
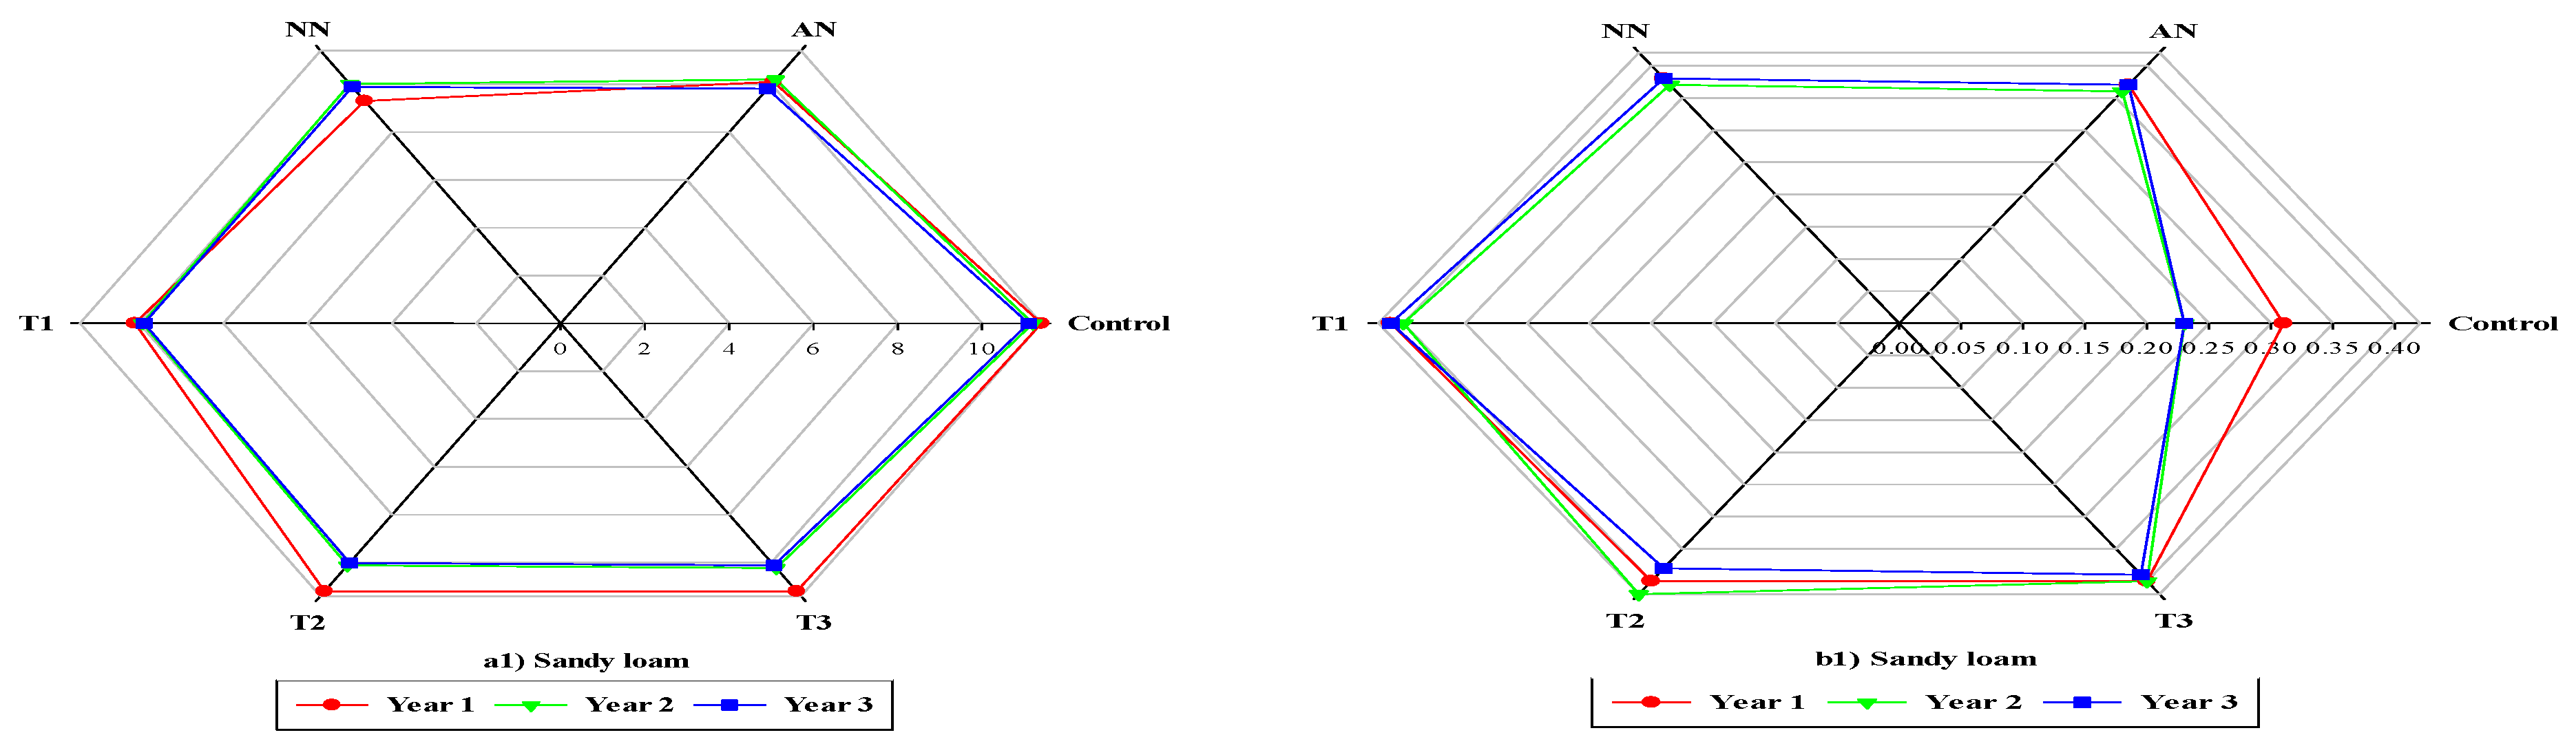
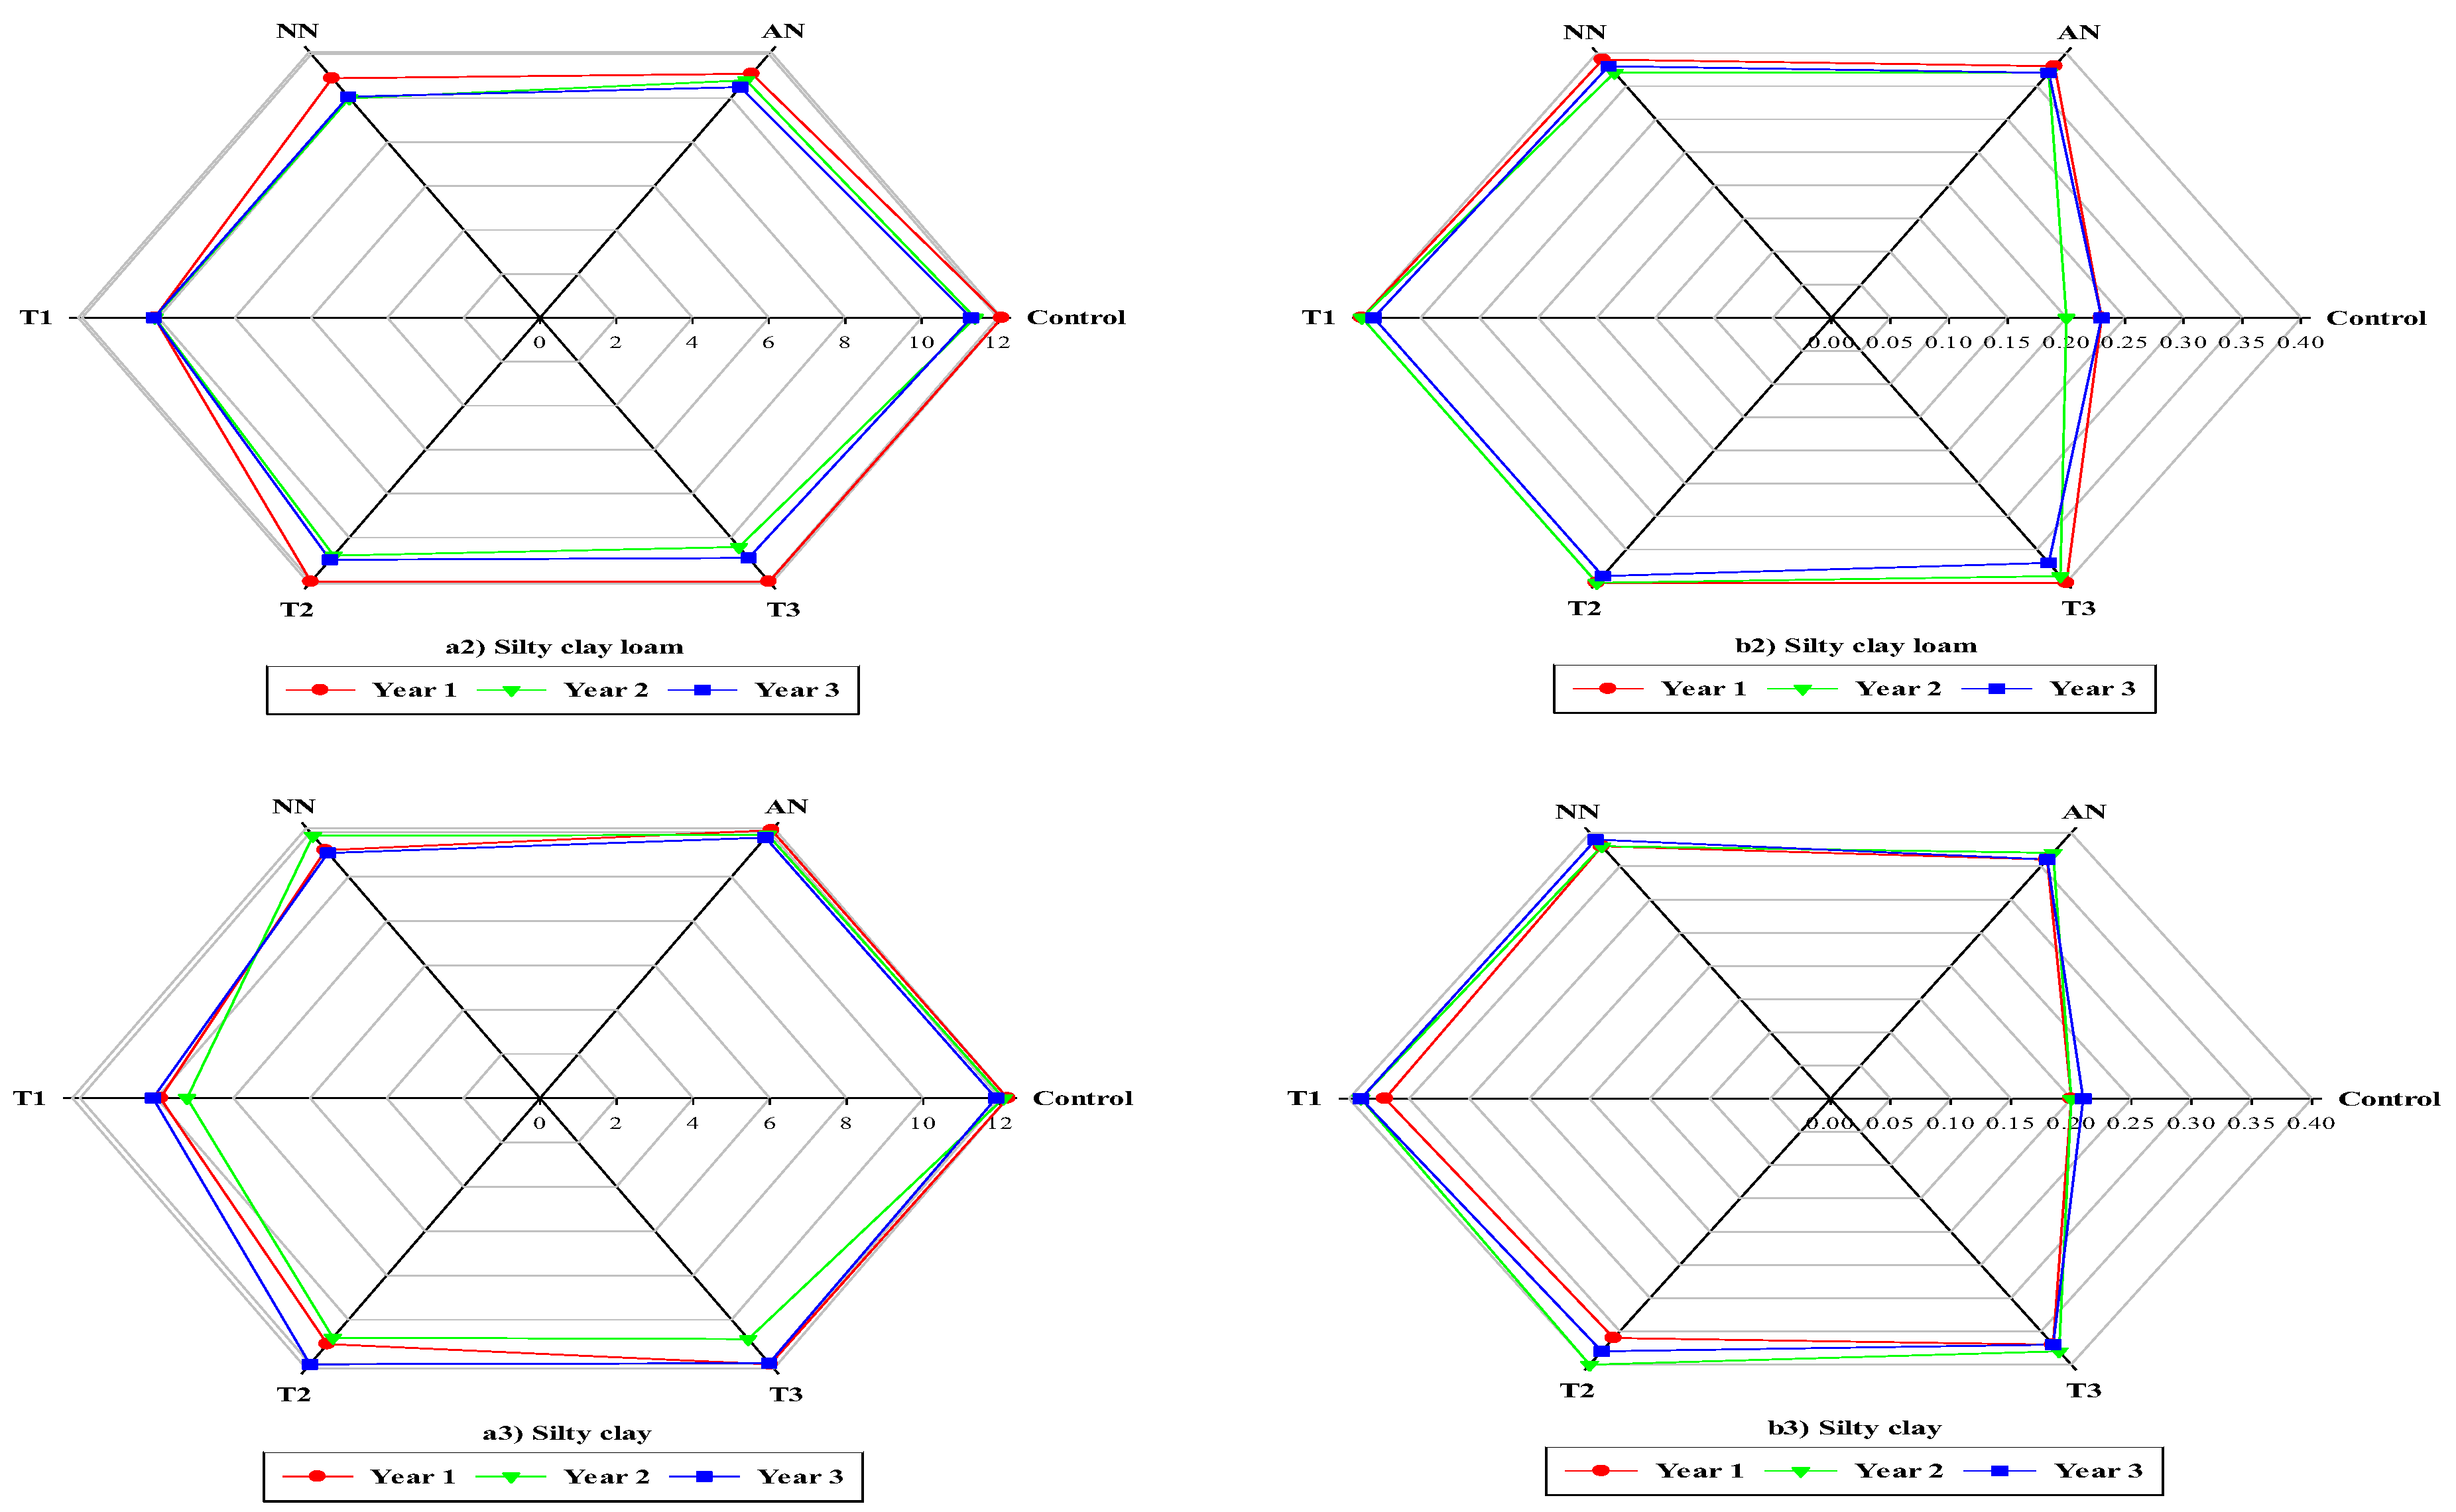
Figure 5.
Wheat grain yield using AN and NN at different fertilizer application times in various soil textures.
Figure 5.
Wheat grain yield using AN and NN at different fertilizer application times in various soil textures.
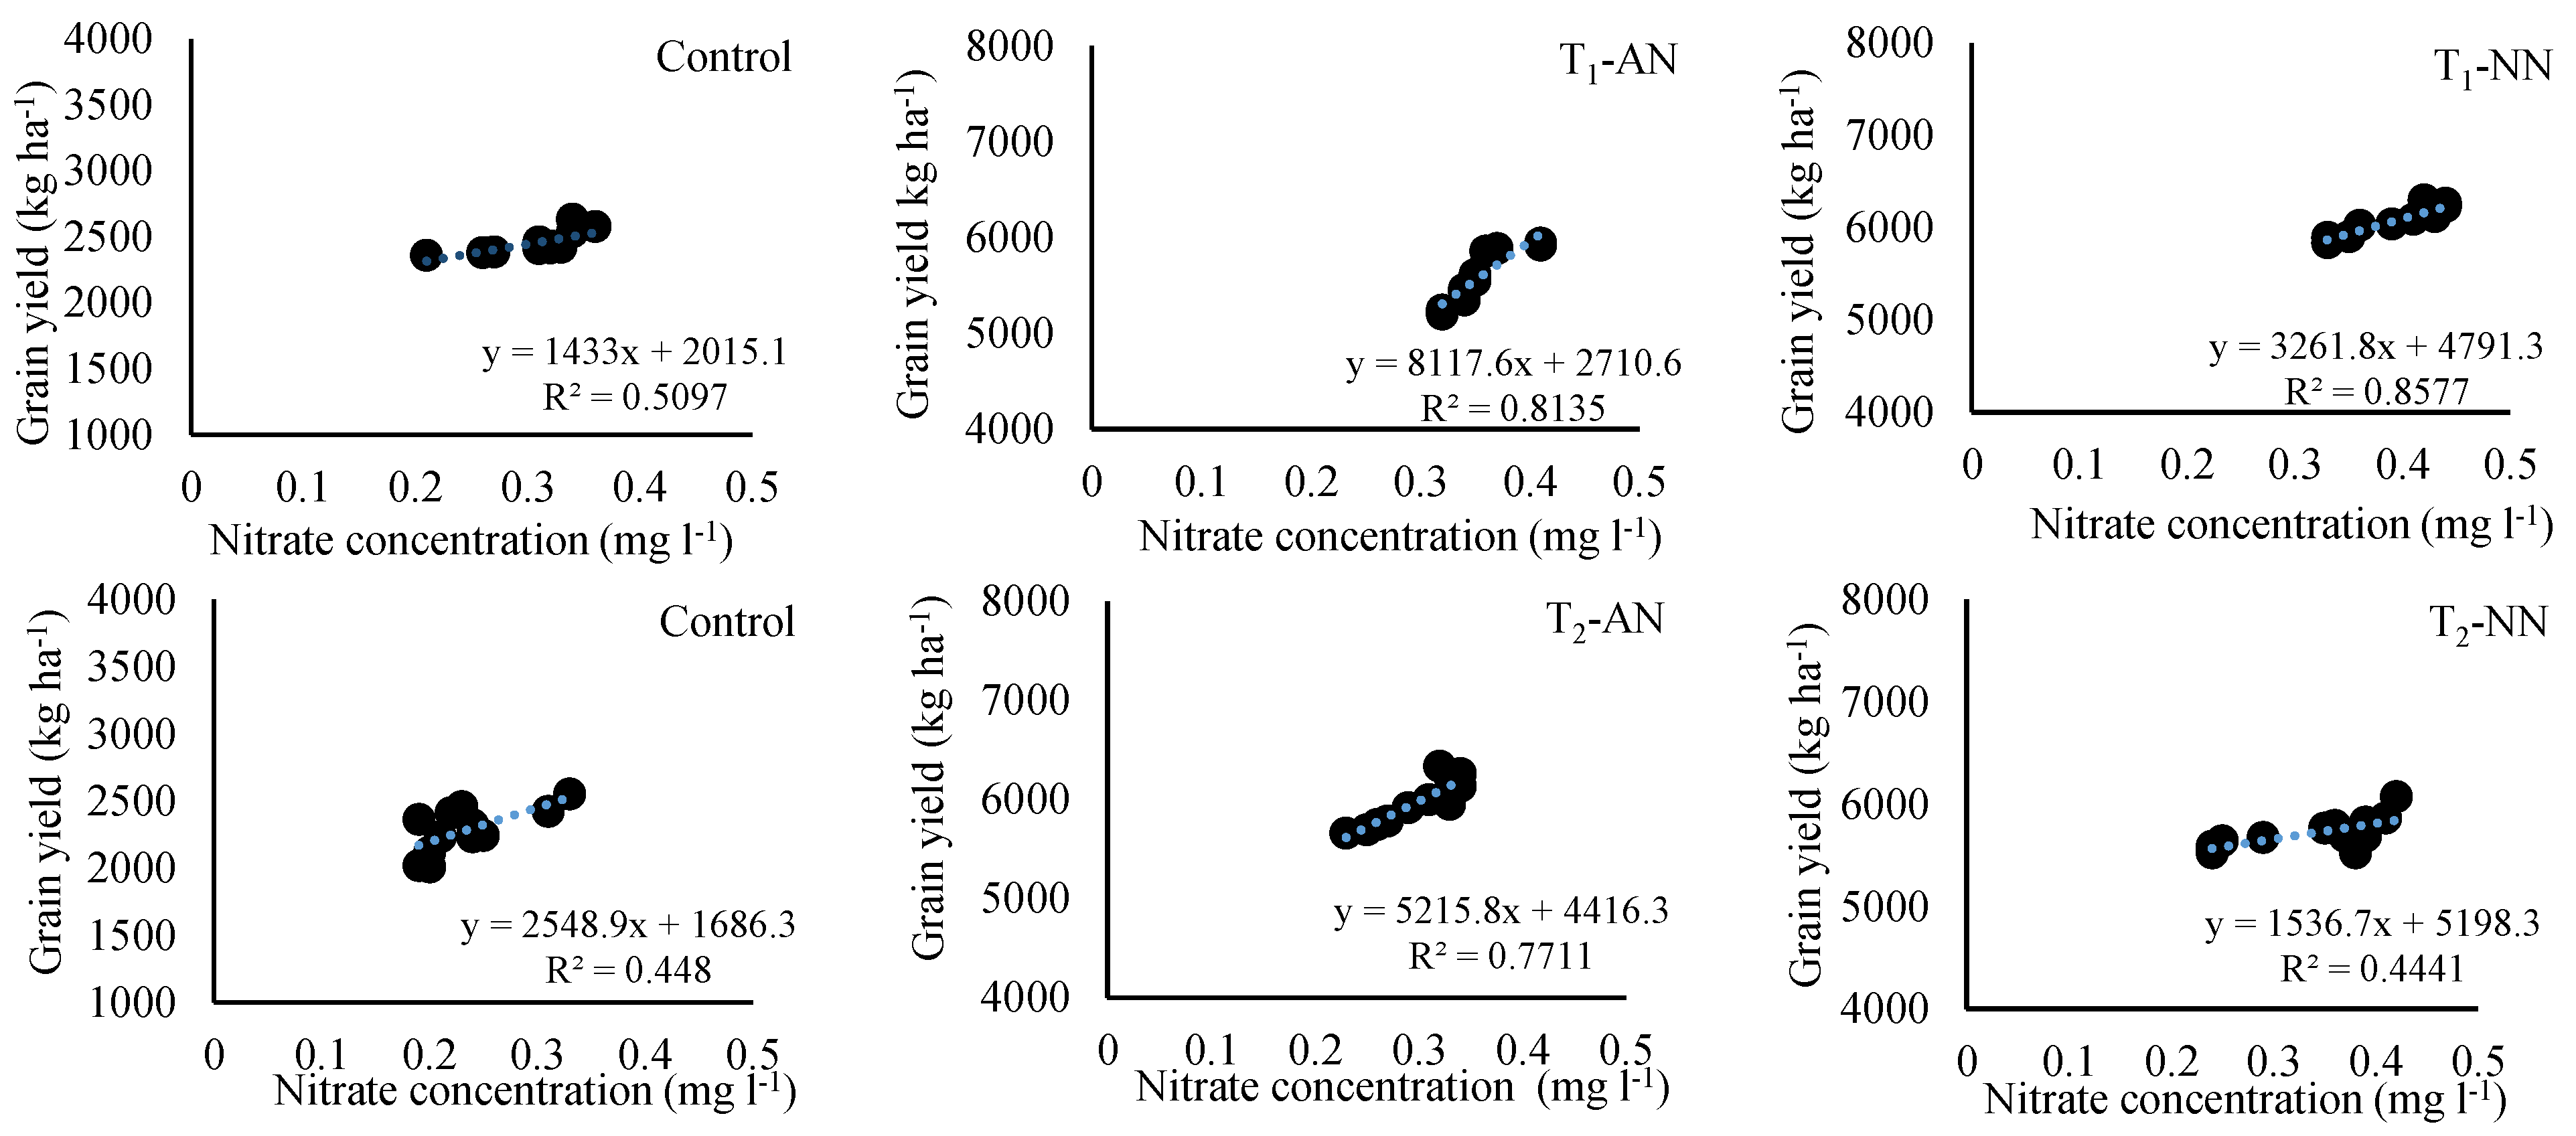
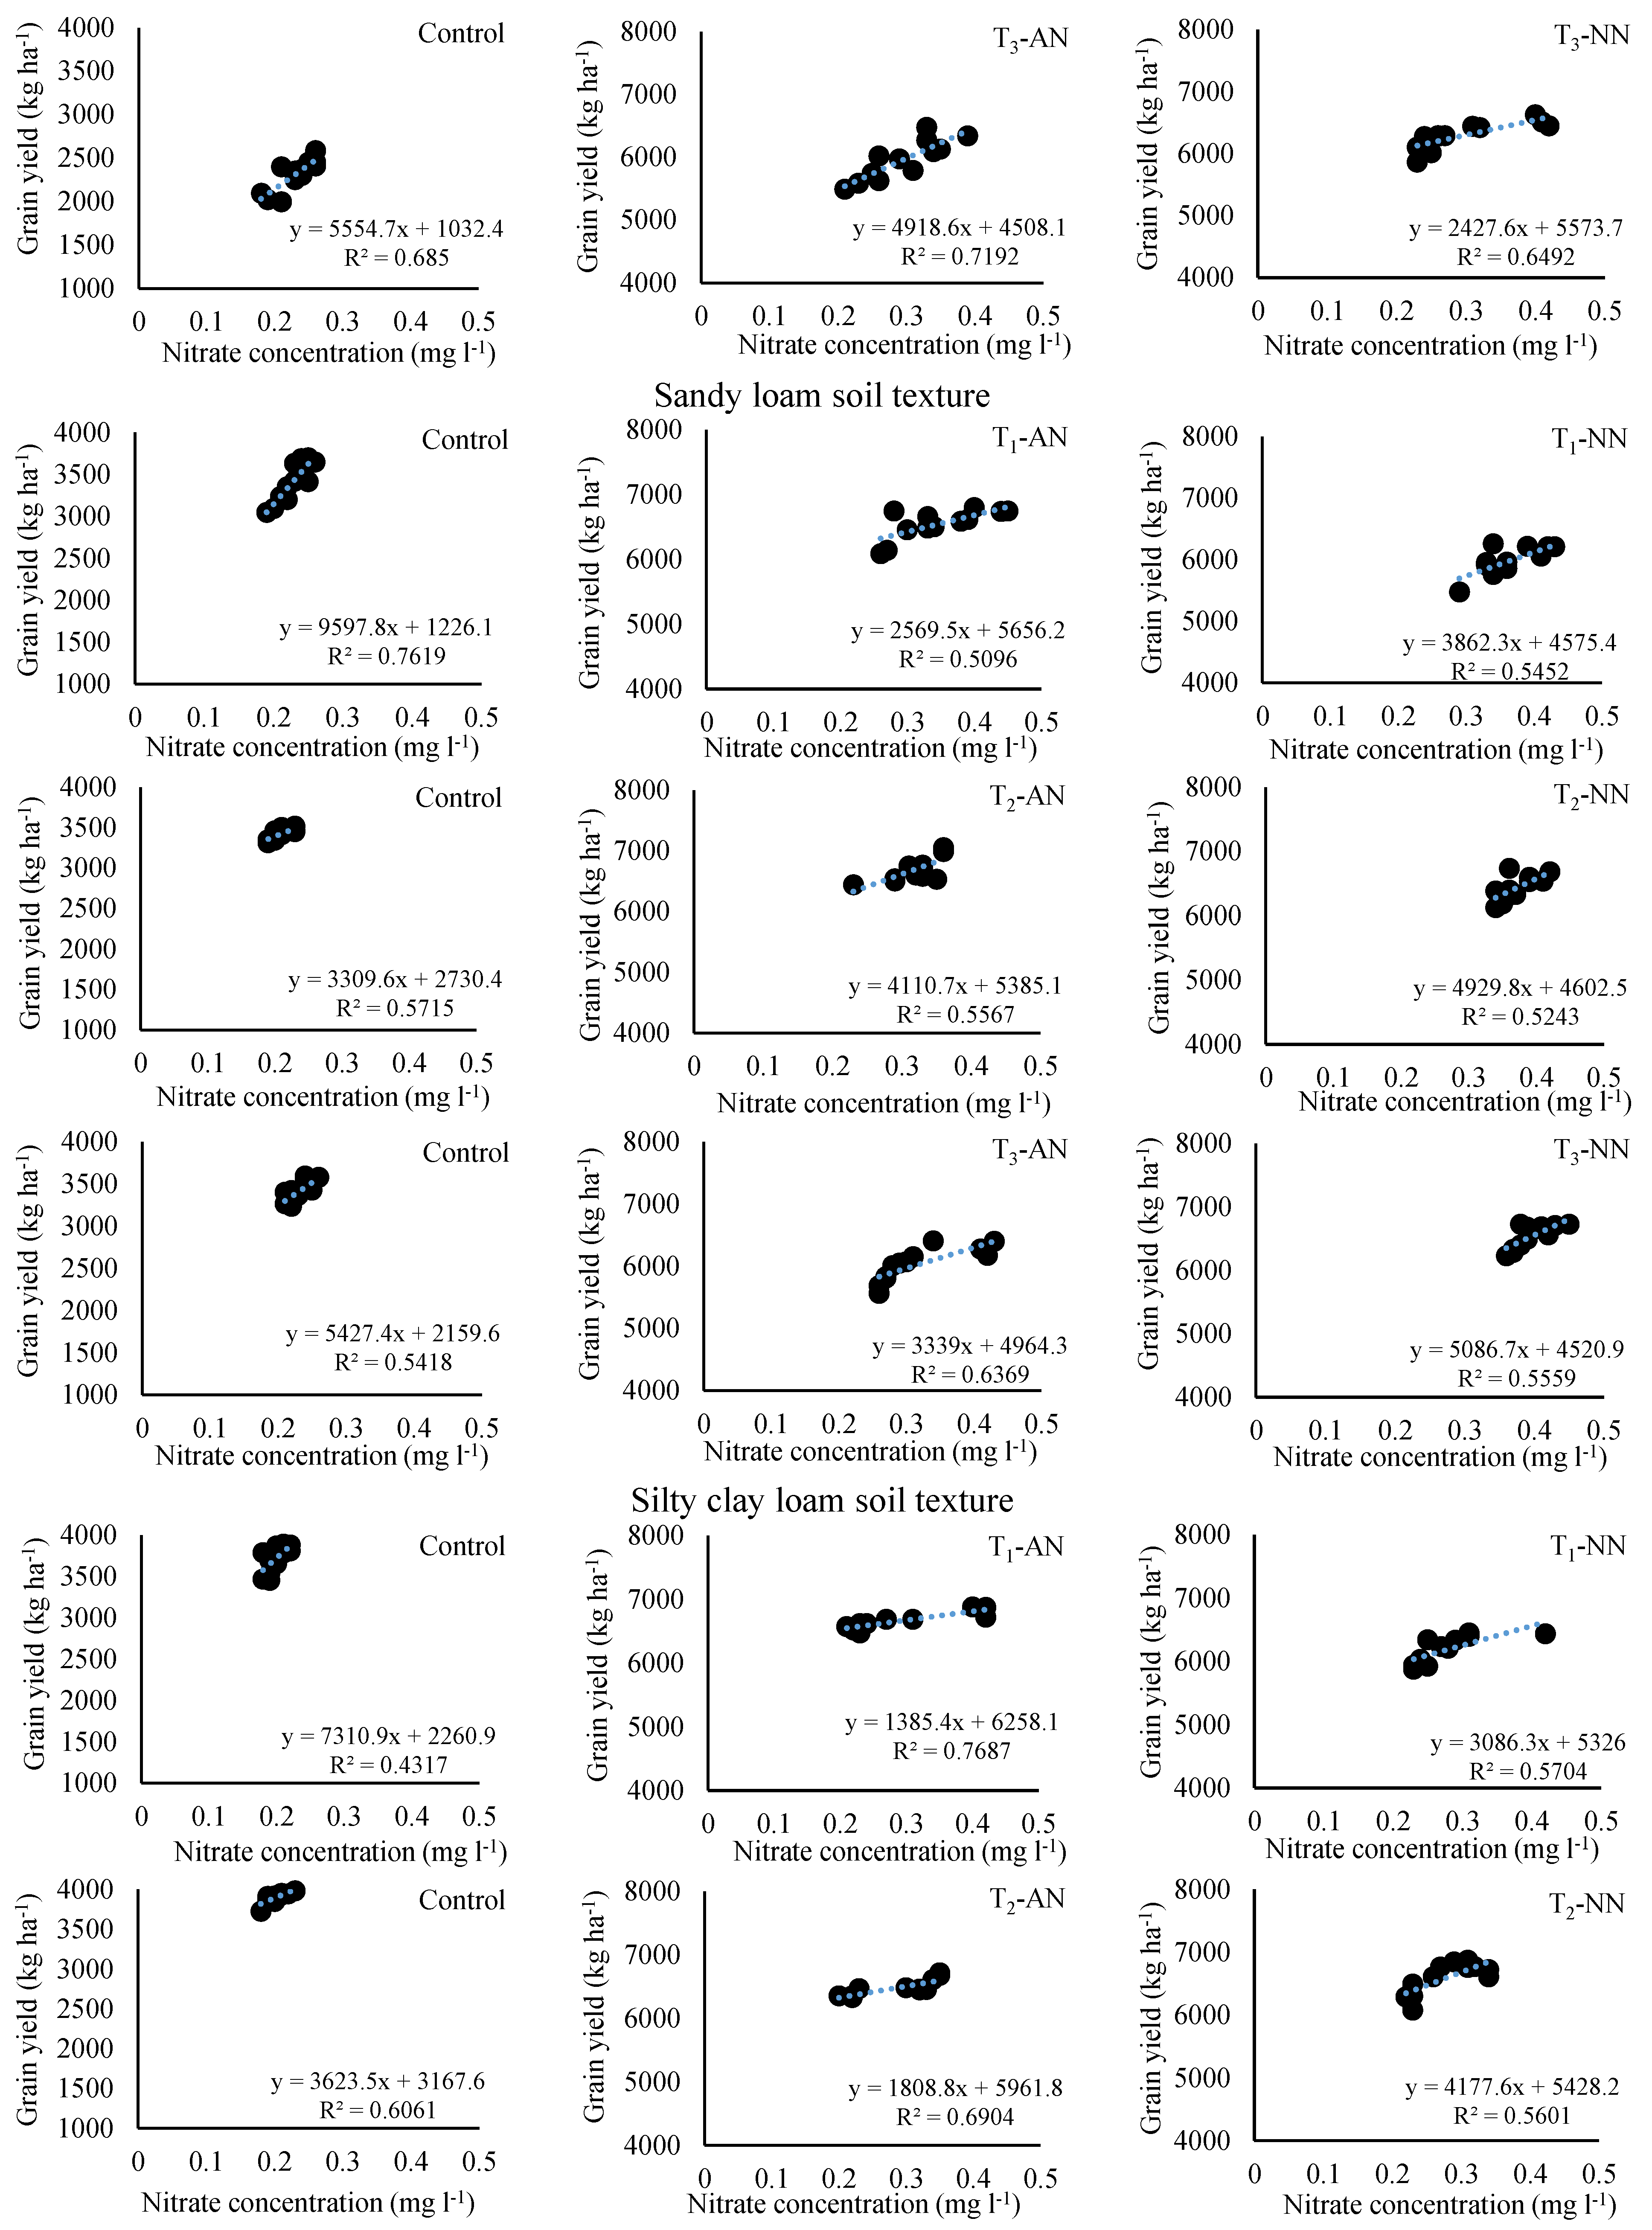
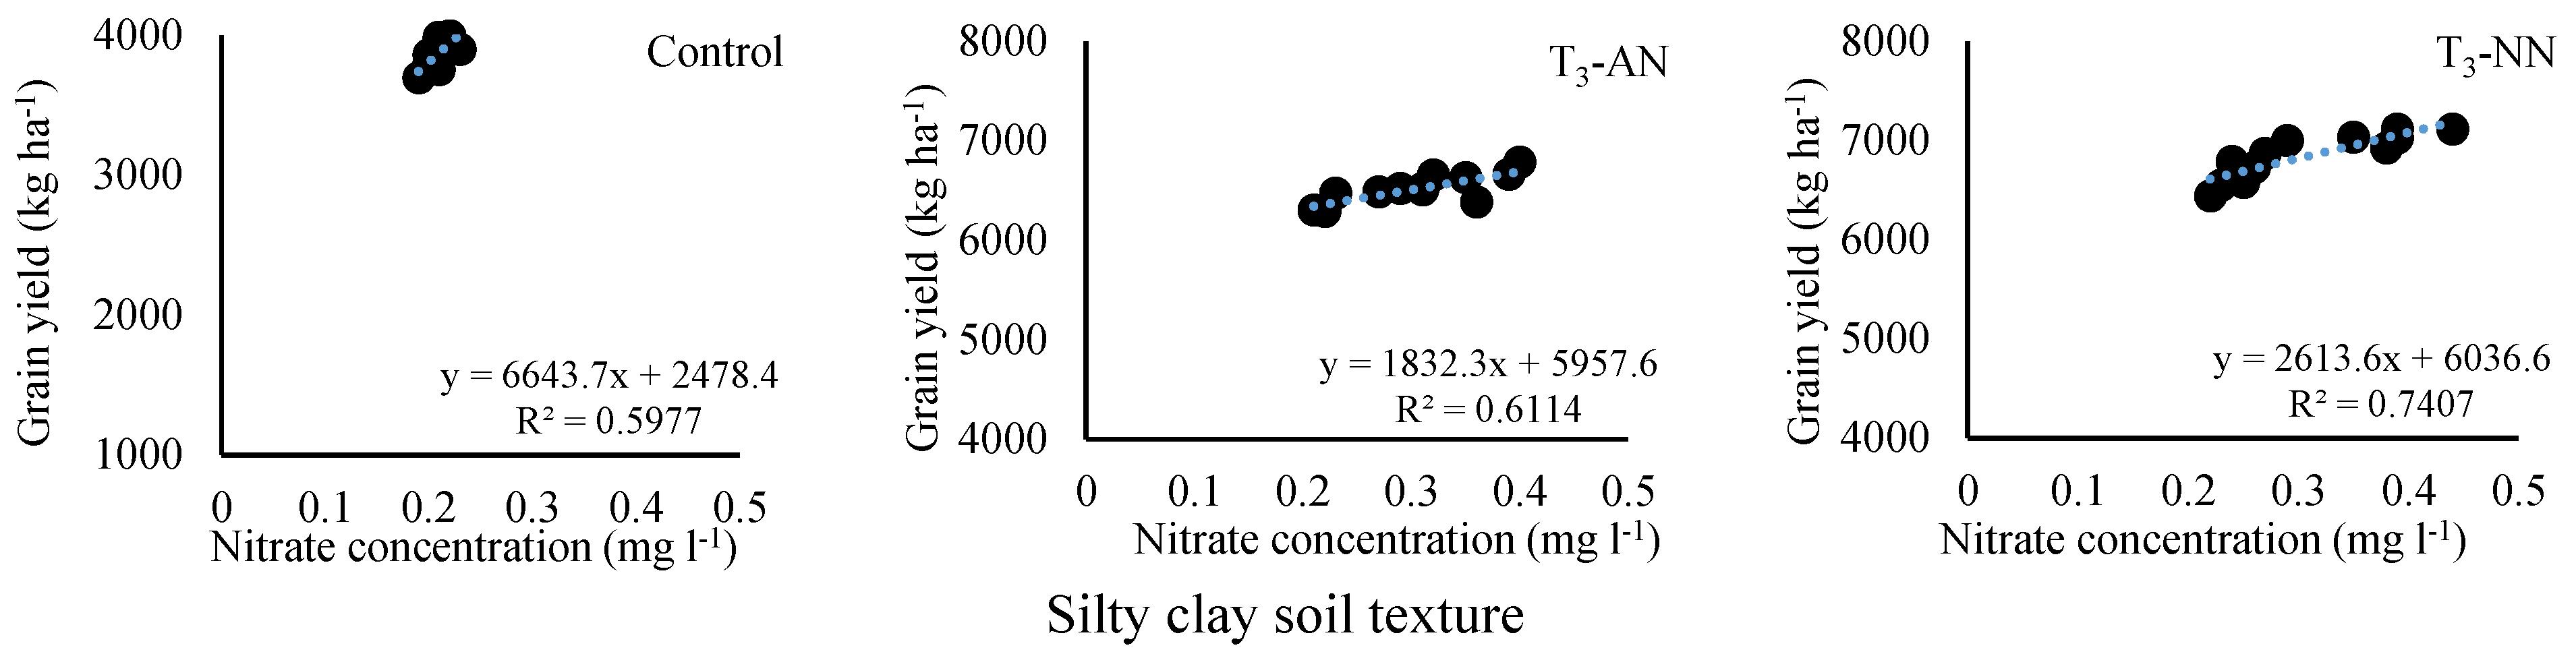
Table 1.
Soil texture properties of experimental areas.
| Experimental Site |
Soil texture | pH | EC (ds cm-3) |
Soil Bulk Density (g cm-3) | O.C (%) |
O.M (%) |
N (%) |
P (mg kg-1) |
K (mg kg-1) |
| 1 | Sandy loam | 7.4 | 1.54 | 1.56 | 1.02 | 1.76 | 0.09 | 13.1 | 235 |
| 2 | Silty clay loam | 7.32 | 1.51 | 1.51 | 1.21 | 2.08 | 0.1 | 14.2 | 281 |
| 3 | Silty clay | 7.12 | 1.52 | 1.51 | 1.53 | 2.63 | 0.12 | 15.2 | 301 |
Table 3.
Pearson’s correlation coefficients among measured traits of wheat.
| Traits | GY | DM | PP | N-L |
| GY | 1 | |||
| DM | 0.93** | 1 | ||
| PP | 0.24n.s | 0.34n.s | 1 | |
| N-L | -0.55* | -0.88** | -0.51* | 1 |
n.s: not significant; (*) and (**) represent significant difference over control at p<0.05 and p<0.01, respectively. Abbreviations: Grain yield (GY), dry matter (DM), protein percentage (PP) and nitrogen leaching (N-L).
Disclaimer/Publisher’s Note: The statements, opinions and data contained in all publications are solely those of the individual author(s) and contributor(s) and not of MDPI and/or the editor(s). MDPI and/or the editor(s) disclaim responsibility for any injury to people or property resulting from any ideas, methods, instructions or products referred to in the content. |
© 2023 by the authors. Licensee MDPI, Basel, Switzerland. This article is an open access article distributed under the terms and conditions of the Creative Commons Attribution (CC BY) license (http://creativecommons.org/licenses/by/4.0/).
Copyright: This open access article is published under a Creative Commons CC BY 4.0 license, which permit the free download, distribution, and reuse, provided that the author and preprint are cited in any reuse.


