Preprint
Article

A Nonequilibrium Thermodynamic Approach for Analysis of Power Conversion Efficiency in the Wind Energy System

Altmetrics

Downloads

111

Views

21

Comments

0

A peer-reviewed article of this preprint also exists.

This version is not peer-reviewed

Submitted:

07 June 2023

Posted:

08 June 2023

You are already at the latest version

Alerts
Abstract
In this paper, the linear nonequilibrium thermodynamic approach is used to analyze energy processes in the wind energy conversion system (WECS), with a directly connected vertical axis wind turbine (VAWT) and vector controlled permanent magnet synchronous generator (PMSG). Both elements are considered as linear universal energy converters (EC) linearized at the points of the given range of common to VAWT and PMSG angular velocity. The dependences on the angular velocity of the coupling coefficients between the ECs input and output and the dimensionless parameters of their operating modes were received. This allows for choosing the optimal points of ECs operation according to the specified criteria and obtaining indicators of their maximum efficiency. To assess the quality of the cascade connection of two ECs, the appropriate coefficient was introduced, the dimensionless parameters and characteristics of the equivalent EC were obtained, and the conditions of its maximum efficiency were determined. Analysis of the VAWT-PMSG connection quality showed reserves for improving WECS efficiency. The impact of VAWT and PMSG variable parameters on the quality of this connection is studied, and further research directions are shown. The proposed thermodynamic approach allows an effective search for solutions for the efficiency improvement of various systems with energy transfer and transformation.
Keywords: 
Subject: Engineering  -   Energy and Fuel Technology

1. Introduction

The efficiency of energy conversion is one of the main factors of energy saving in the technological processes of various industries. Renewable energy uses natural free energy, but increasing the efficiency of the transformation of this energy in renewable energy systems helps to increase the generation at a specific capacity of the equipment and reduce the cost of the received energy.
To analyze the energy efficiency of the various systems work, such a fundamental science as thermodynamics is used. At the beginning of its formation, which began with the work of Sadi Carnot in the first half of the 19th century, thermodynamics was used mainly to describe reversible processes and isolated systems with a significant share of thermal energy, which is where the name of the science comes from. Classical thermodynamics, which was developed by Rudolf Clausius in the second half of the 19th century, thanks to the phenomenological approach to the macroscopic description of systems of various physical and later chemical natures, became a fundamental science that allows the analysis of energy transformations in reversible processes without taking into account the time of their occurrence [1]. This makes it possible to outline the thermodynamic limits of process efficiency, which has not lost its relevance to this day. Linear nonequilibrium thermodynamics, which developed from classical thermodynamics in the middle of the 20th century thanks to the works of Lars Onsager, summarized the general theoretical foundations for the energy regularities of not only isolated, but also closed and open systems with real irreversible processes taking into account their flow speed. As a result, a clear mathematical apparatus was developed, especially for linear systems, which allows unifying the description of energy transformations [2]. Thermodynamics found its further development in the works of F. Curzon and B. Ahlborn on modeling real systems by combining reversible and irreversible subsystems. This section of thermodynamics was named endoreversible thermodynamics [3]. It makes it possible to establish relations between efficiency and power output, which is especially important for the study of natural biochemical processes. Currently, due to its fundamental nature, thermodynamics is used to describe energy transformations in all types of systems of various natures – physical, chemical, biological, and is even used to study regularities in informational, social systems, etc. Its comprehensiveness can be judged from the work [4], where all natural and anthropogenic processes taking place on planet Earth are subjected to thermodynamic analysis.
Renewable energy, which combines systems of different nature, between which energy exchange and energy transformation take place, has recently also become an object of thermodynamics research. This also applies to wind energy [5], where the energy of the wind flow (aerodynamic subsystem) is transformed into the mechanical energy of the wind turbine (WT), and then through an electromechanical transformation in the generator and electrical transformation in the power electronic system controlling its operation – into electrical energy. Further energy transformations in systems of its accumulation are also possible, for example, in the form of the potential energy of compressed air [6] or the production of hydrogen or ammonia [7]. The main research of recent years concerns the analysis of energy and exergy in renewable energy systems [8], including wind flow [9]. Energy and exergy terminology is also introduced for thermodynamic analysis. Comparison of impacts on WT efficiencies of four meteorological variables such as wind speed, pressure, temperature, and humidity ratio was investigated in [11], because of which it was shown that although wind speed dominates the turbine's efficiency performance, other meteorological variables also play important roles.
These studies analyze the flow of energy or exergy and its transformation in the abstract subsystems of the wind turbine, multiplicator, and generator, but do not determine ways to increase the energy efficiency of the entire wind energy conversion system (WECS). To identify the latter, a more detailed analysis is required, which is based on a mathematical description of the processes in the WECS components. However, a detailed description of interconnected processes of different physical natures that take place in WECS components – aerodynamic, mechanical, electromagnetic – complicates understanding and does not reveal all the problems associated with a decrease in energy efficiency. An effective approach to solving the problem of increasing WECS efficiency can be the application of methods of linear thermodynamics of non-equilibrium processes, which made it possible to successfully solve many complex problems, especially with coupled effects. A feature of linear thermodynamics of non-equilibrium processes is the ability to describe complex, including non-linear steady-state, processes of various physical, chemical and biological systems according to the universal principle of linearization of the relationship between input and output power coordinates at specific operating points. At the same time, the system is considered an energy converter (EC) with a certain number of inputs and outputs, but most often with one input and one output. For the latter case, a universal method of describing the EC by a system of dimensionless parameters and characteristics of its performance has been developed [2,12]. The most important indicator of EC is the degree of coupling between its input and output, which uniquely determines the maximum values of EC performance indicators, as well as the operating points at which these maximum values are reached. This makes it possible to optimize EC operation modes depending on the assumed optimization criteria [12]. This universal method was most widely used in bioenergetics to describe free energy transformations in biosystems, but it can be successfully used to analyze established processes of energy transformations in systems of any nature. For example, in [13], it was successfully applied to the analysis of energy conversion in electromechanics.
In this work, the systems of linear equations were obtained for the first time for the steady-state modes of operation of two main ECs, which are part of the WECS – WT with a vertical axis of rotation (VAWT) and vector controlled synchronous generator with permanent magnets (PMSG). Based on the obtained linear equations, these two ECs were described using a universal method. Taking into account the non-linear nature of steady-state processes in VAWT and PMSG, systems of linear equations are obtained by linearizing the characteristics of these devices at operating points, and the mathematical model provides multiple linearizations around the points of optimal VAWT angular velocity at different wind speeds. In this paper, a universal method of EC description was also developed in the direction of the regularities of the cascade connection of two ECs, which makes it possible to evaluate the quality indicator of a specific connection and its influence on the efficiency indicators of the obtained equivalent cascade EC. Numerous studies conducted on the example of the studied WECS with specific VAWTs and PMSGs showed the imperfection of the cascade connection of the latter, which increases with decreasing of wind speed. The influence of parameters and characteristics of VAWT and PMSG on the quality of this connection was studied and ways of its improvement were outlined.
The paper is structured as follows: in Section 2, the main provisions of linear non-equilibrium thermodynamics and the universal method of describing and evaluating the performance indicators of linear ECs are briefly highlighted, as well as this description is developed in relation to the cascade connection of two ECs and the method of energy optimization of the entire system steady-state operation mode is outlined; a mathematical description of the aeromechanical regularities of the WT as a linear EC and an evaluation of the effectiveness of the experimental VAWT is carried out in Section 3; in Section 4, a mathematical description of the regularities of the operation of the vector controlled PMSG as a linear EC was carried out and the efficiency of the generator for the experimental WECS was evaluated; in Section 5, an analysis of the efficiency of energy conversion in the "VAWT - PMSG" complex was carried out and the influence of its parameters and characteristics on improving the quality of the connection between the experimental VAWT and PMSG was investigated; concluding remarks are given in Section 6.

2. Indicators of EC Performance According to Linear Non-Equilibrium Thermodynamics

2.1. Basic Provisions of Linear Non-Equilibrium Thermodynamics

For any open system that exchanges energy and matter with the external environment, the entropy change is expressed by two components: d e S – external, due to the exchange with the external environment (entropy flow); d i S – internal, caused by non-equilibrium processes within the system (production of entropy). Based on this, the generalized form of the second law of thermodynamics for non-isolated systems is expressed by the following dependency rate of entropy production in the system [3]:
σ s = d i S d t 0 .
Since every real irreversible process is accompanied by some internal flow J k generated by the corresponding driving force X k , which expresses disequilibrium, it has been proved [3] that in the conditions of local thermodynamic equilibrium (LTE) the following equality takes place
J k = i L ki X i .
The principle of LTE or microscopic reversibility, which is the basis of linear non-equilibrium thermodynamics, is that, in the non-equilibrium state of the body during not very rapid processes, the state of its very small elements can be considered as equilibrium, and the equations of classical thermodynamics can be applied to it [2]. The product of σ s by the absolute temperature of the system is called the dissipative function, because it reflects the rate of dissipation (scattering, degradation) of the free energy of the system.
A phenomenological law is also valid for LTE conditions, which expresses the intensity of any flow in the form of products of thermodynamic forces X i and the corresponding kinetic coefficients L ki (Onsager principle of linearity) [2,3]:
σ s = i J k X k .
Expression (3) shows that one flow can be caused by different thermodynamic driving forces. However, according to the Curie principle [2], different driving forces can simultaneously affect the transfer if they are tensors of the same rank, for example, only scalars or only vectors. In expressions (2) and (3), flows and forces have a vector character, which often happens in practice.
According to the second law of thermodynamics (1), the sum in equation (2) must be greater than zero. But this does not mean that each of the members of this sum must be individually greater than zero. Cases are possible when some members are positive, that is, they produce entropy, while others are negative, that is, and they consume an excess amount of entropy. This phenomenon, which consists in the fact that some processes can induce other processes to flow in a thermodynamically unfavorable direction (against the driving force, "downhill"), was called thermodynamic coupling [12]. Thus, for two coupling processes to which any EC belongs, since its output parameters (o – output) are determined by input (i – input), the following system of equations can be written:
{ J i = L ii X i + L io X o J o = L oi X i + L oo X o ,
where the kinetic or "phenomenological" coefficients are from the expressions
L jk = ( J j X k ) X j = const .
By definition, X i , X o and J i are positive, and J o is negative, which means absorption of energy at the input and its formation at the output, therefore, L ii , L oo and - L io must be positive.
L. Onsager discovered a general principle called Onsager reciprocal relations and can be called the fourth law of thermodynamics [12]. He claims that L jk = L kj , meaning that in the vicinity of the equilibrium state, the linear dependence of any flow J j on any force X k coincides with a similar dependence of flow J k on force X j . Onsager reciprocity ratios make it possible to significantly reduce the number of independent coefficients in systems of type (4). The validity of Onsager reciprocal relations is not limited to quasi-equilibrium systems (the reciprocity relations relate to the first derivatives of (5) at the equilibrium point), but their strength is higher the closer the system is to equilibrium. For significantly non-equilibrium systems, linear dependences (4) and reciprocity relations are often verified due to the validity of the LTE principle for individual small parts into which each large system is divided, which is under the influence of gradients of thermodynamic forces [12]. According to the second law of thermodynamics (1), limitations are imposed on the permissible values of kinetic coefficients – the matrix of coefficients L must be integrally defined, i.e.
( L io ) 2 L ii L oo .
If mass and energy are transferred inside an isolated system under the influence of some forces, then the magnitude of this force decreases, and the system approaches a state of equilibrium, at which its entropy has a maximum value. The entropy of the system in any of its states is a measure of the system's approach to equilibrium, and the rate of its change over time (1), or the flow of entropy J S , gives a quantitative assessment of the results of the transfer, that takes place under the influence of some driving forces. The smaller these forces are, the smaller the imbalance and the smaller the energy dissipation (2) and energy losses. For non-isolated systems, according to I. Prigozhin's minimum principle, the flow of entropy will acquire its smallest value in stationary processes, and it is clear that it will be smaller the slower the speed of this process [14].

2.2. A Universal Method of Describing and Evaluating Performance Indicators of Linear ECs

The above-described provisions of linear non-equilibrium thermodynamics are the basis of the theory of thermodynamic analysis of ECs [2,12].
From the analysis of system (4), it is clear that the more negative the value of L io (compared to the values of the remaining L coefficients), the higher the degree of influence of the input force on the output flow. In addition, with more negative values L io the degree of suppression of the input flow by the force at the output increases. Thus, the coefficient L io is related to the degree of coupling q between the input and output processes in EC. To avoid the effect on q values of other kinetic coefficients, the degree of coupling was defined as the coefficient L io normalized to the coefficients L ii and L oo [12]:
q = L io L ii L oo .
According to this definition, q will be negative and will acquire, taking into account (6), values from –1 to 0.
To obtain universal EC characteristics in relative units, two more indicators are introduced [12]: relation of forces
χ = X o / X i ;
phenomenological relationship
Z = L oo / L ii .
Having normalized the input and output fluxes to the input flux at zero output force (short circuit), the system of equations (4) can be rewritten using the introduced notations
{ J i L ii X i = q ( Z χ ) + 1 J o Z L ii X i = ( Z χ ) + q
and determine the flow ratio as follows:
j = J o J i = Z ( Z χ ) + q q ( Z χ ) + 1 .
In expressions (10) and (11), the product ( Z χ ) is a dimensionless number that expresses the reduced force ratio. The content of q also becomes clear: when q = 1 the output flow differs from the input flow always by – Z times – therefore, the flows are rigidly (completely) coupled. When q = 0 the input and output flows are caused only by their own forces and flow in the direction of their decrease, which means that the flows are not coupled at all. For values of q from –1 to 0 the output flow is supported by the input flow in the "downhill" direction, but the ratio of these flows changes along with the change of ( Z χ ) , which means that the input and output processes in this case are partially coupled.
An important characteristic of EC is the thermodynamic efficiency of their operation, i.e. the ratio of the rate at which the EC produces free output energy to the rate at which it consumes free input energy:
η = J o X o J i X i = j χ = ( Z χ ) ( Z χ ) + q q ( Z χ ) + 1 .
Graphical dependence (12) at different values of q is shown in Figure 1(a). From (12), it is easy to find the optimal ratio of forces from the point of view of thermodynamic efficiency
( Z χ ) opt η = q 1 + 1 q 2 ,
at which the thermodynamic efficiency has a maximum value equal to
η max = ( Z χ ) opt η 2 .
The operation of EC at the point with maximum thermodynamic efficiency is attractive at first glance, but at high degrees of coupling ( | q | 1 ) it may be impractical, since the output flow approaches zero, meaning the output process proceeds at a very low speed. To achieve energy conversion at a higher speed, it is necessary to partially sacrifice thermodynamic efficiency.
One of the expedient options for choosing the EC operating point can be the maximum output power mode. The normalized value of the output power can be expressed as follows:
p = J o X o L ii X i 2 = [ ( Z χ ) + q ] ( Z χ ) .
Graphic dependence (15) at different q is shown in Figure 1(b). The maximum output power is reached at
( Z χ ) Р . max = q / 2
and is
p max = q 2 / 4 .
However, as can be seen from Figure 1(a, b), the maximum output power is accompanied by a rather low thermodynamic efficiency and can be recommended only for ECs connected to free energy sources, for example, natural renewable ones.
Using the obtained universal dependencies (10)-(12) and (15), combining two indicators, it is possible to easily form other optimal operation criteria appropriate for specific ECs [12], for example: maximum output flow at optimal thermodynamic efficiency, maximum output power at optimal thermodynamic efficiency, maximum product [ J o / ( Z L ii X i ) ] η (so-called "economically profitable output flow"), maximum product p η (so-called "economically profitable output power"), etc. The technique of ensuring the indicated optimal mode consists in changing the available kinetic coefficients of the original model (4) in such a way as to obtain the required combination of parameters ( Z χ ) and q, at which the selected criterion reaches its maximum value.

2.3. Performance Indicators of Cascaded Linear ECs

The analysis shows that elementary ECs in energy conversion systems are most often connected in cascade. For a mathematical description of the steady-state mode of operation at a given point of a system of two cascaded ECs (marked by indices 1 and 2), we will use the following systems of linear equations:
{ J 1 i = L 1 ii X i + L 1 io X o J 1 o = L 1 oi X i + L 1 oo X o ;   { J 2 i = L 2 ii X i + L 2 io X o J 2 o = L 2 oi X i + L 2 oo X o .
For the cascade connection of such ECs, the following conditions apply: X 1 o = X 2 i , J 1 o = J 2 i . If such a cascade is considered as a new equivalent EC, then after mathematical transformations, its parameters are found, which are determined by the parameters of the ECs, from which it is composed:
q Σ = q 1 q 2 ( 1 q 1 2 + γ ) ( 1 q 2 2 + γ 1 ) ;   Z Σ = Z 1 Z 2 γ 1 q 2 2 + γ 1 1 q 1 2 + γ ;   χ Σ = χ 1 χ 2 ,
where γ is the connection coefficient of two ECs in the cascade, which is equal to
γ = L 2 ii L 1 oo .
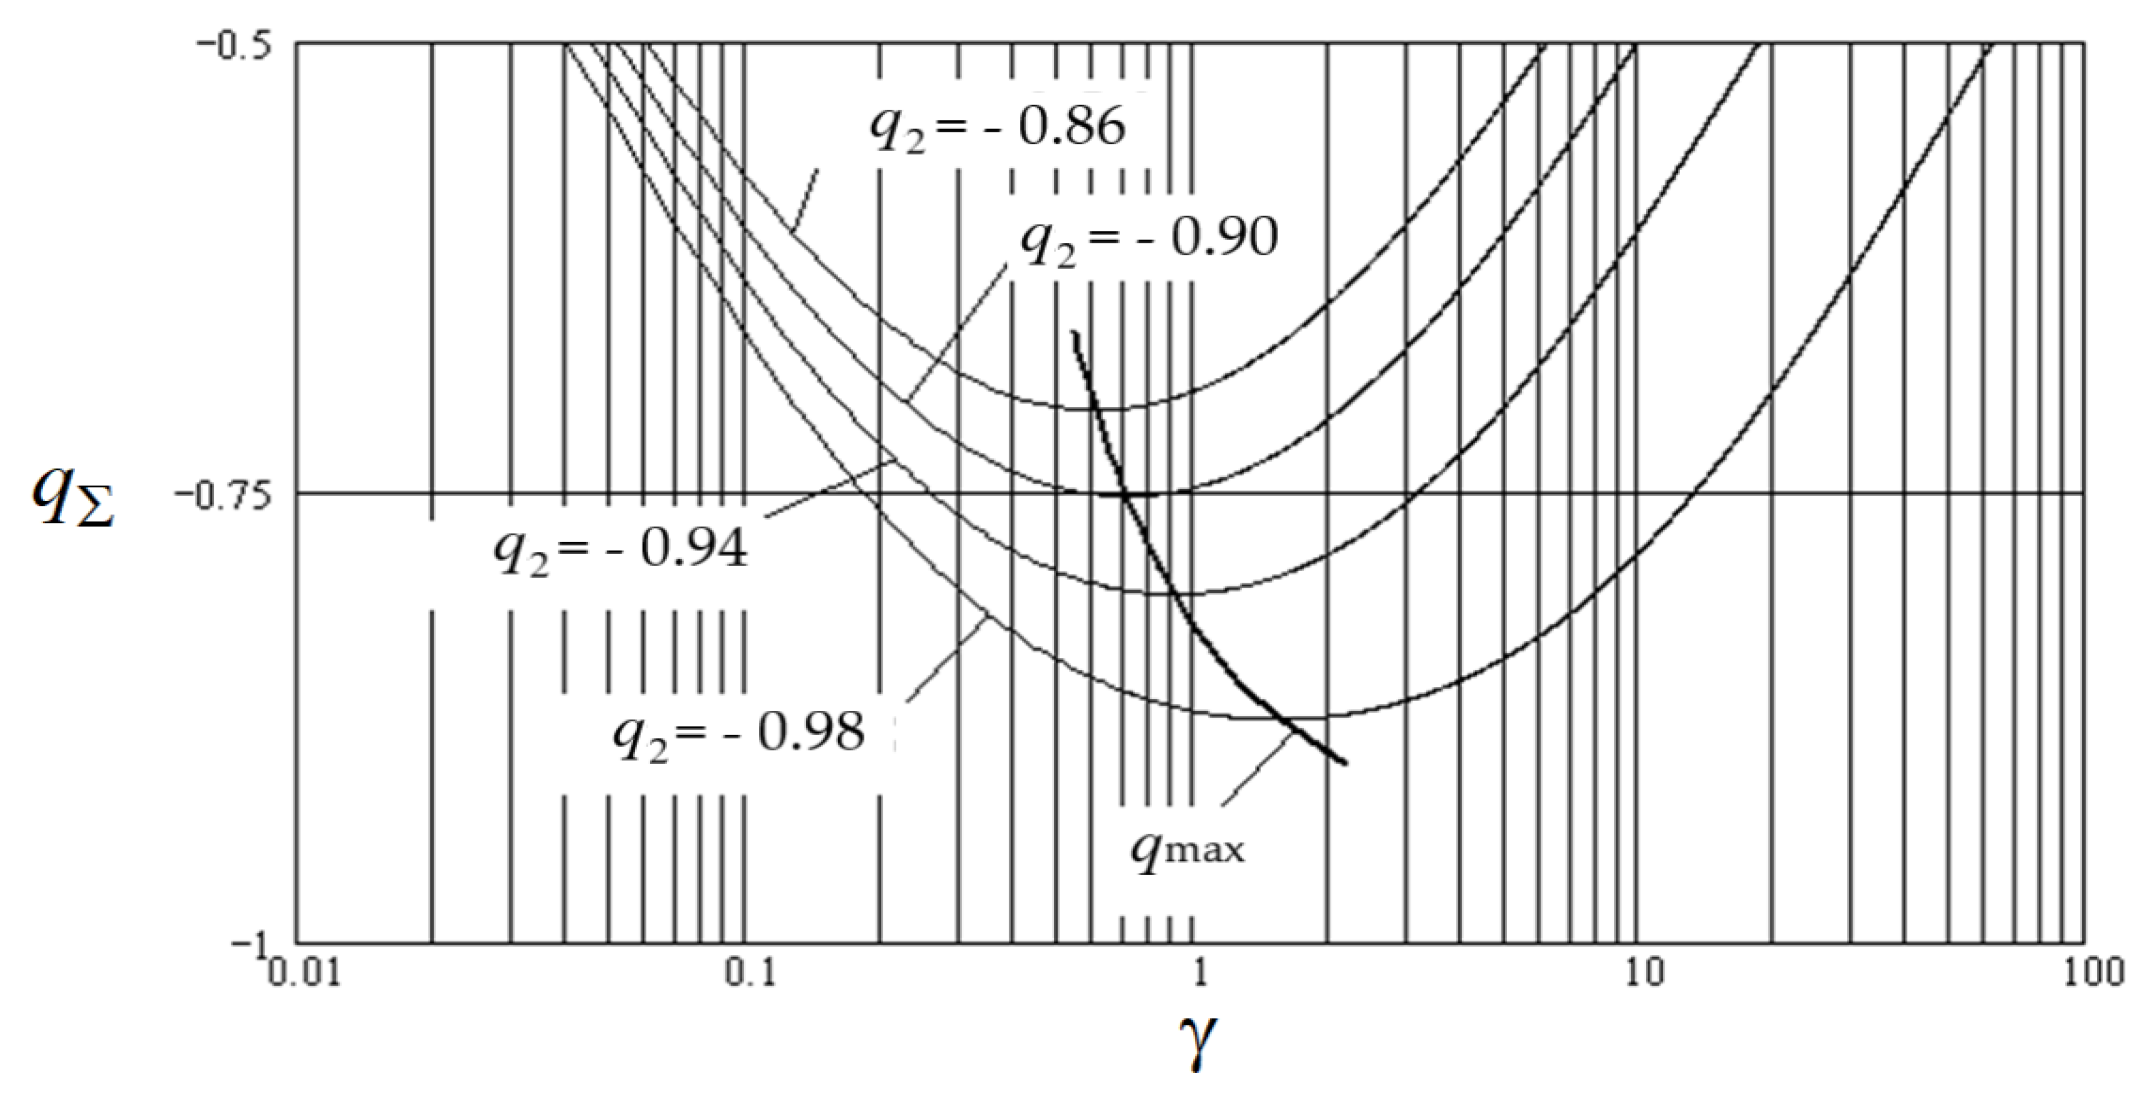
Figure 2 shows the graphical dependence q ( γ ) at given q 1 = 0.95 and q 2 = 0.86...0.98 (for better understanding, the abscissa axis is presented in a logarithmic scale). As can be seen, for any q 1 and q 2 exists some optimal connection coefficient at which the total degree of conjugation is maximal. This optimal value of the connection coefficient is obtained in the form
γ opt = 1 q 1 2 1 q 2 2 .
With an optimal connection, the maximum conjugation of two ECs is characterized by the following degree of coupling:
q Σ . max = q 1 q 2 ( 1 q 1 2 ) ( 1 q 2 2 ) + 1
and the optimal reduced force ratio is equal to
( Z χ ) Σ . opt = ( Z χ ) 1 ( Z χ ) 2 .

2.4. The Energy Optimization Method of the Stady-State Operation Mode of the System

Based on the above, it is possible to propose a method of energy optimization of the steady-state operation of the system under study, which consists of the following.
  • Based on the analysis of the physical processes that take place in a specific EC, and based on the determined dissipative function, it is necessary to select pairs of input and output thermodynamic forces and flows.
For the received input and output flows and forces, build a mathematical model and draw up Onsager linear equations (4) describing the studied EC, and find expressions for its main parameters: q, Z, χ. This stage has its characteristics depending on the type of system and its complexity:
In the case of the linearity of the system and the possibility of its mathematical description, provided that the selection of flows and forces is correct, the implementation of this stage does not pose special difficulties.
In the case of a nonlinear system, for each operating point ( X i , X o ) the system is characterized by its kinetic coefficients, the values of which can be found by expressions (5). Therefore, the nonlinear mathematical model of the system must be investigated for a number of operating points or the interval of change of the determining coordinate in the vicinity, which is of practical interest. Further, based on the obtained results, it is possible to calculate the values of parameters q, Z, χ at these operating points or their dependence on the selected defining coordinate.
In the case of the complexity of the mathematical description of the system, it should be investigated experimentally. Thermodynamic flows and forces can be correctly selected only after conducting a number of experiments and mathematically processing their results to obtain linear relationships between pairs of flows and forces. Next, the kinetic coefficients can be calculated from the system of equations (4) based on the results of short-circuit experiments ( X o = 0 ) and non-operating stroke ( J o = 0 ) or, in the case of their impossibility, based on the results of measurements at two points and calculations according to expressions (5), replacing the parameter differentials with the corresponding increments.
  • To justify the most appropriate energy optimization criterion and to formulate its mathematical expression.
  • Substitute the values of q, Z and χ into the expression of the optimization criterion and investigate it to the maximum in turn according to the available parameters of the original mathematical model.
  • Compare the obtained results and choose the best optimization option.
  • In the case of two cascade-connected ECs, perform steps 1-5 for each EC separately. Find the value of the connection coefficient γ of the two initial ECs at the operating points or the function γ of the determining coordinate and compare the obtained values with the optimal value determined for the degrees of coupling of each of the constituent ECs obtained above. In the case of a significant difference between the real and optimal values of the connection coefficient, it is advisable to conduct additional studies aimed at finding ways to reduce this difference.

3. Thermodynamic Analysis of Energy Conversion Efficiency in WT

3.1. Mathematical Description of the Aeromechanical Regularities of WT Operation as a Linear EC

The mechanical power on the axis of WT depends on wind velocity Vw and is determined by the following equation [15]:
P WT = 0.5 ρ S С Р ( λ ) V w 3 ,
where ρ is the air density, S is the swept area of WT, CP(λ) is the wind power conversion efficiency factor of WT, λ is the tip speed ratio (TSR), ω is the turbine angular velocity, and R is the radius of WT.
TSR is the linear speed of the blade edge relative to the wind speed:
λ = ω R V w .
The dimensionless aeromechanical characteristic CP(λ) uniquely determines the appearance of the characteristics PWT(ω,Vw), which are scaled along the PWT and ω axes depending on the power (dimensions) of the WT. The CP(λ) characteristic, which is obtained through complex experimental or model studies, is often represented by a polynomial dependence of the n-th degree:
С Р ( λ ) = i = 0 n a i λ i .
To provide maximum power extraction from the wind, according to equation (24), it is necessary to maintain the maximum value of the power factor CPmax(λopt), and therefore an optimal WT angular velocity
ω opt = λ opt R V w ,
which is achieved by the automatic regulation of the load torque at a WT shaft.
In the steady state, the torque of a WT is balanced by the load torque, which, based on (24) and (25), is described by the expression:
T WT = P WT ω = 0.5 ρ S R С Р ( λ ) λ V w 2 .
As a EC, the WT converts the power of the wind flow into the power of rotational motion on the WT shaft. At the input of this EC, there is a force in the form of the speed of the wind flow X i = V w , which determines the input flow in the form of a force acting on the WT J i = F . At the output of the EC, the force in the form of angular velocity determines the torque on the WT shaft: X o = ω , J o = T WT . Powers at the input and output of EC are respectively equal to Р i = V w F and P o = ω T WT .
Similarly to (4), the system of linear equations that describes the operation of the WT as a EC will have the form
{ F = L ii V w + L io ω Т WT = L oi V w + L oo ω .
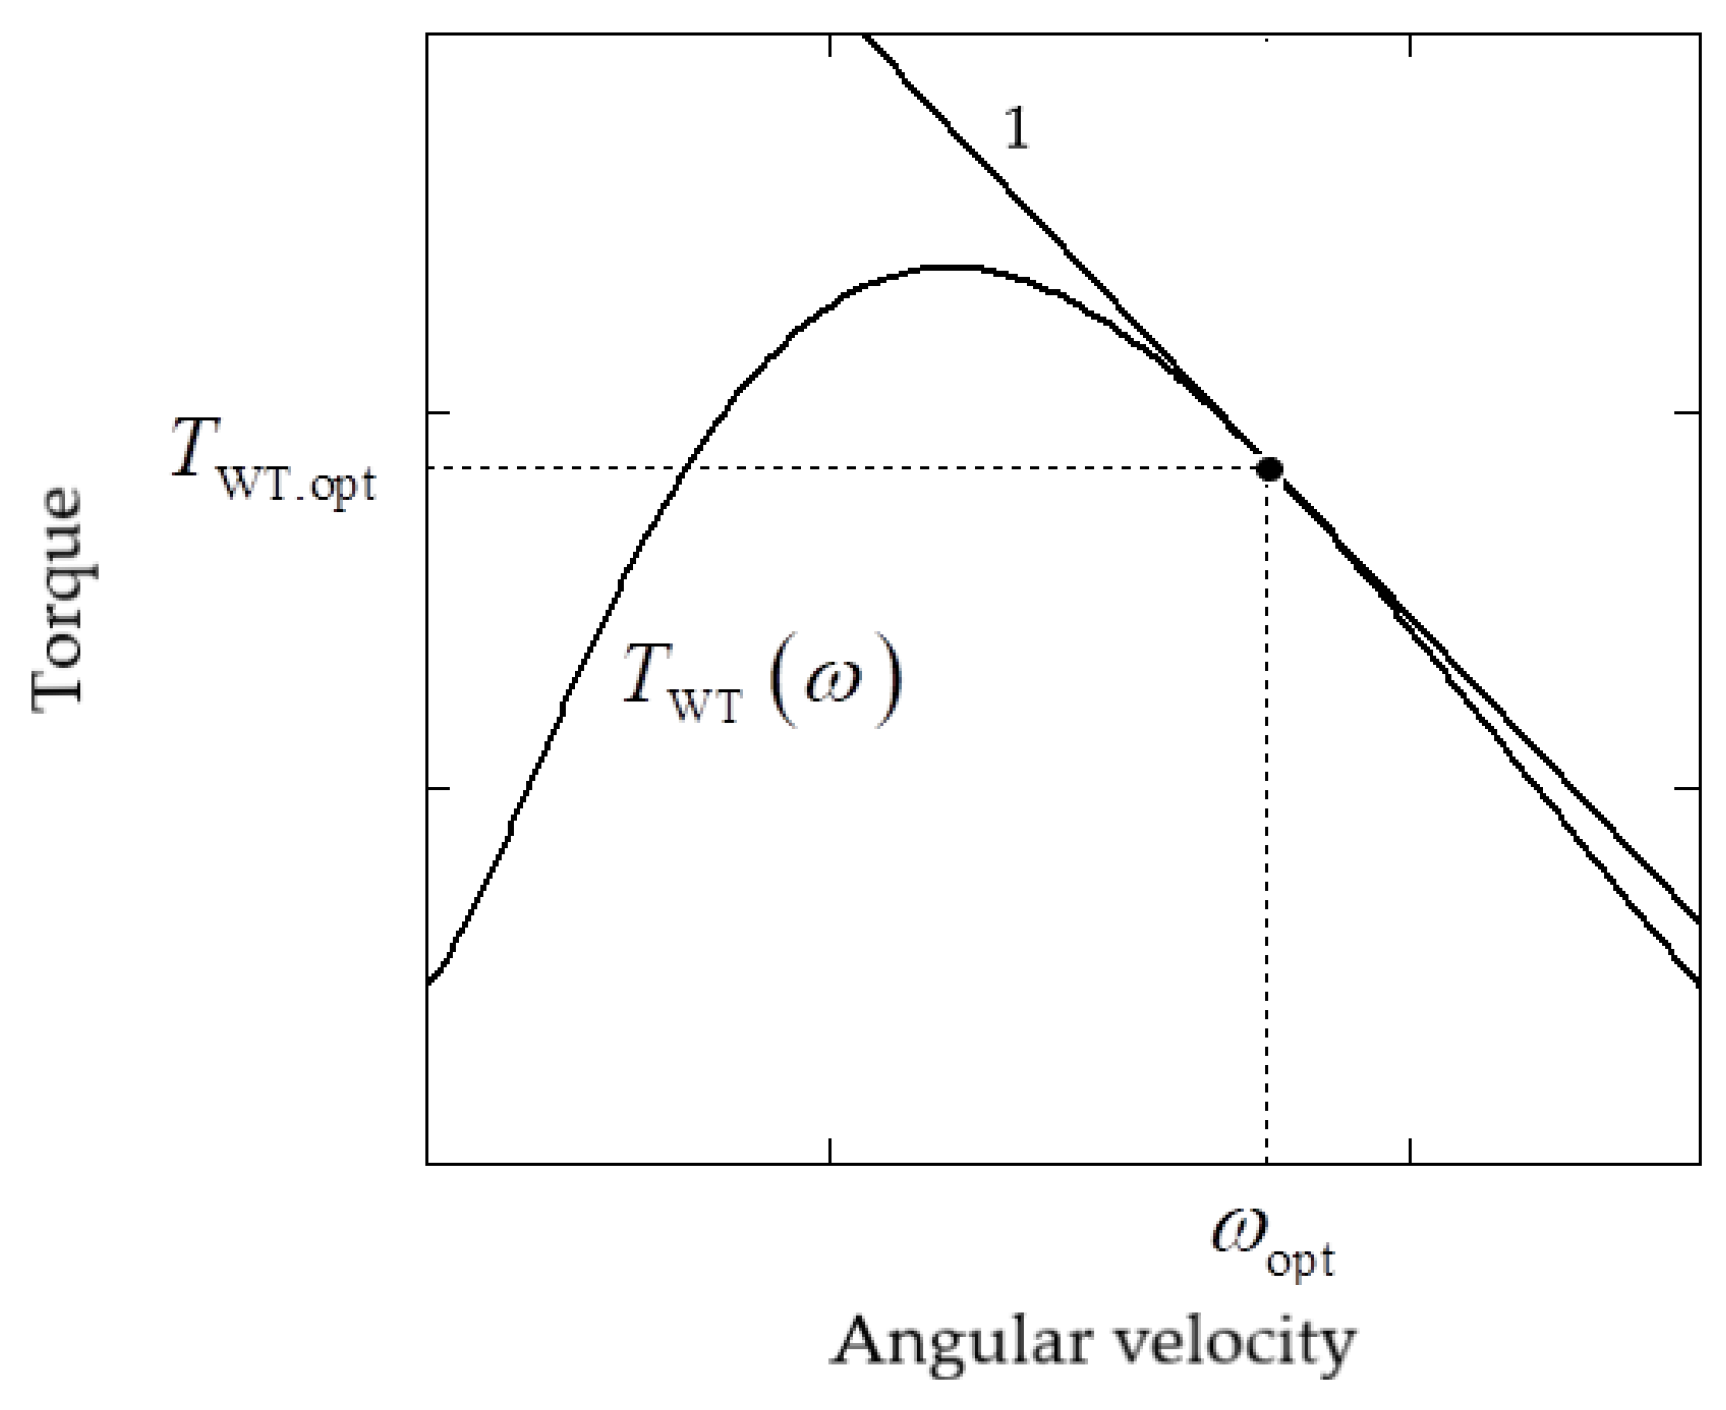
As can be seen from the mathematical description (24)-(28), the mathematical model of the processes in WT is significantly nonlinear, therefore the system of linear equations (29) is valid only in the vicinity of some given operating point. Figure 3 shows a typical dependence T WT ( ω ) with the point of optimal operation T WT . opt ( ω opt ) , in which the maximum WT power value (maximum power point – MPP) P WT . max is provided. Shown in Figure 2 tangent 1 to this point is described by the second equation of the system (29), if this system is intended to simulate the operation of the WT in the MPP. Let's determine the expressions for the kinetic coefficients in the system of equations (29) using the example of the WT operation at this point.
The equation of the tangent curve shown in the Figure3 has the form
T WT = k ω + b ,
where
k = d T WT d ω | ω = ω opt = 0.5 ρ S R V w 2 d d ω ( С Р ( λ ) λ ) | ω = ω opt = 0.5 ρ S R V w 2 [ d d λ ( С Р ( λ ) λ ) d λ d ω ] | ω = ω opt ,
b = T WT . opt + k ω opt .
Considering (25) and introducing the notation B = 0.5 ρ S R 2 V w , the equation (31) will have the form
k = В d d λ ( С Р ( λ ) λ ) | λ = λ opt .
For ω = 0, from the second equation of system (29) we obtain
L oi = T WT | ω = 0 V w = b V w .
For T WT = 0 , ω = b / k follows from equation (30). Then, from the second equation of system (29), we get
L oo = L oi V w ω = b ω = k .
For the estimated optimal operating point from the first equation of the system (29) we obtain
L ii = F L io ω opt V w ,
where F = 0.5 ρ S V w 2 is the value of the force of the wind flow pressure on the WT depending on the wind speed V w .

3.2. The Main Performance Indicators of the Experimental WT

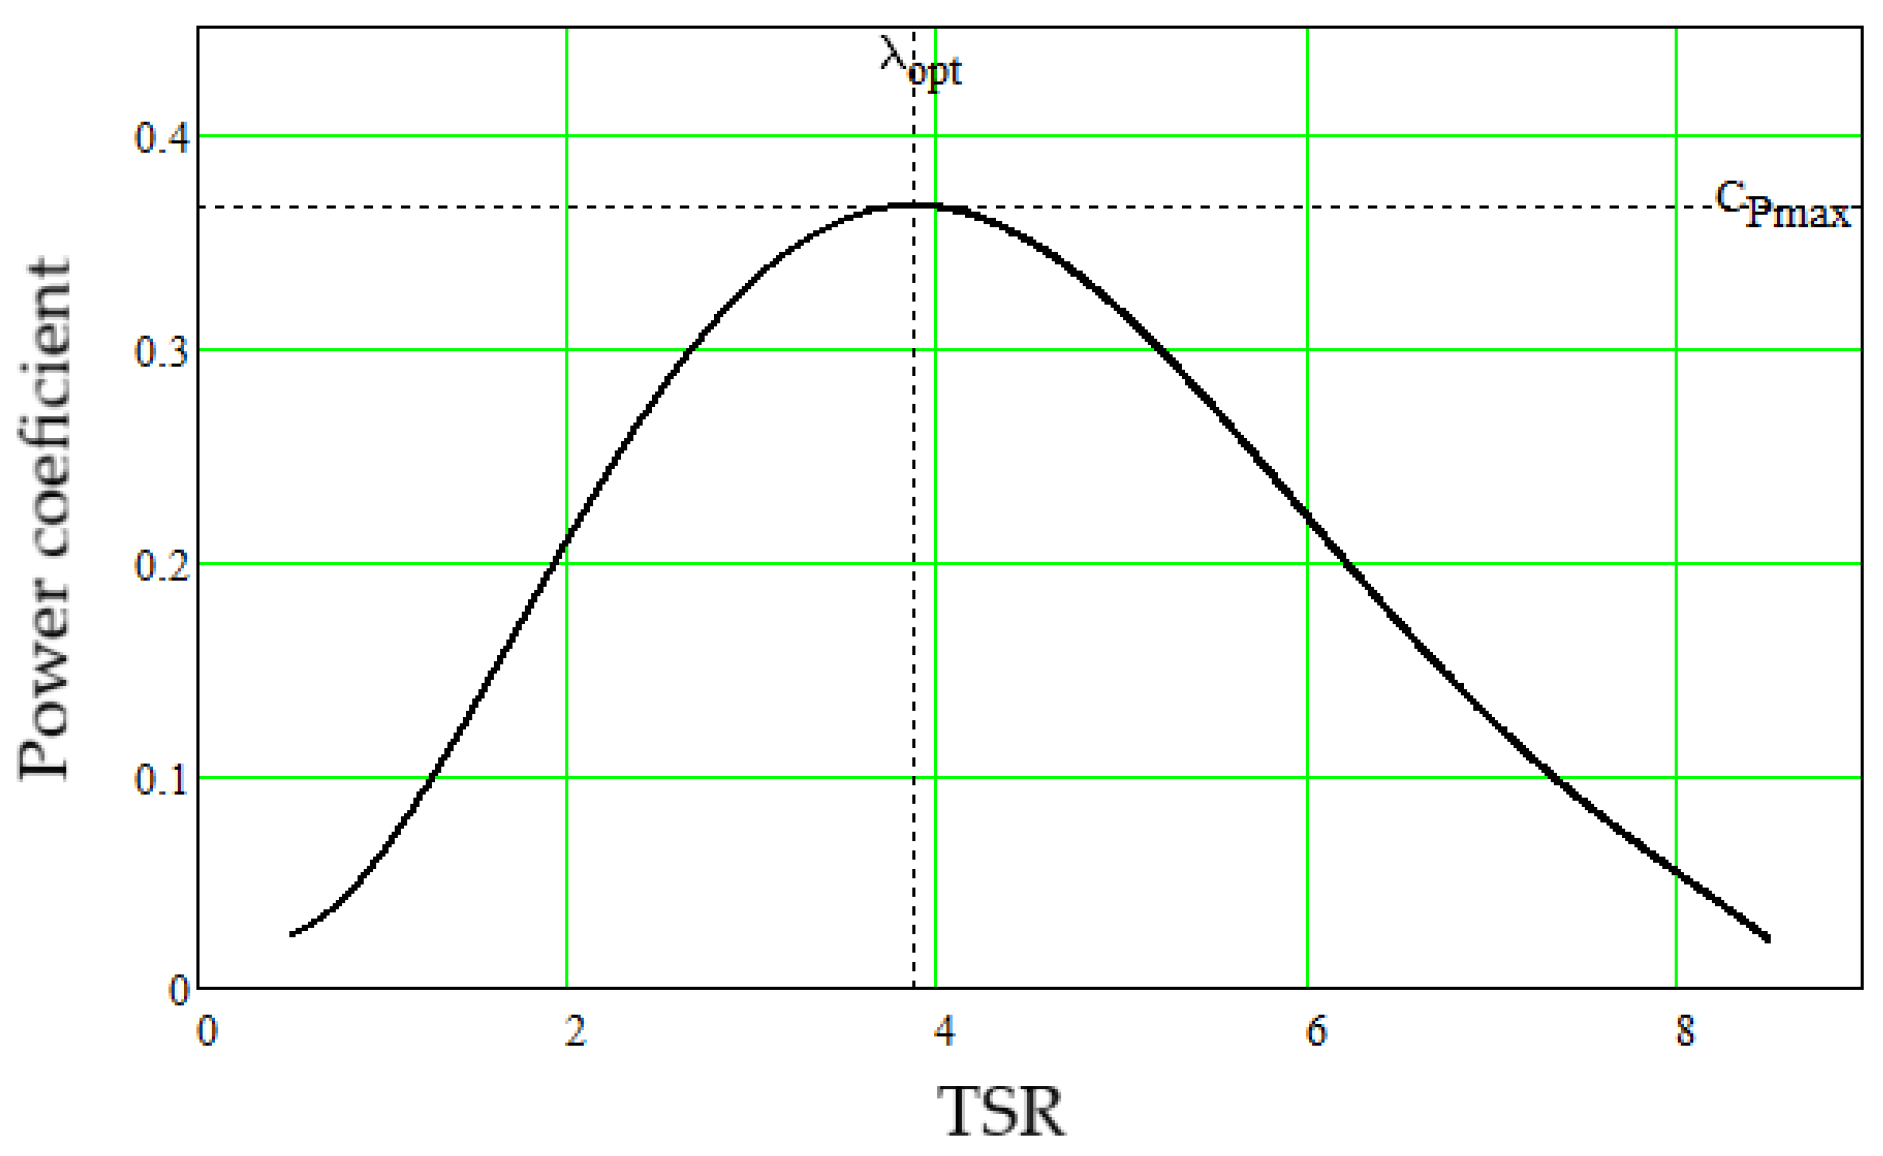
The aeromechanical characteristic of a VAWT taken for the study is shown in Figure 4 and is described by the following polynomial
С Р ( λ ) = i = 0 n a i λ i = 0 . 046977 0 . 128468 λ + 0 . 19596 λ 2 0 . 05705 λ 3 + 0 . 00621 λ 4 0 . 000236 λ 5 .
The main parameters of the experimental VAWT are given in Table 1.
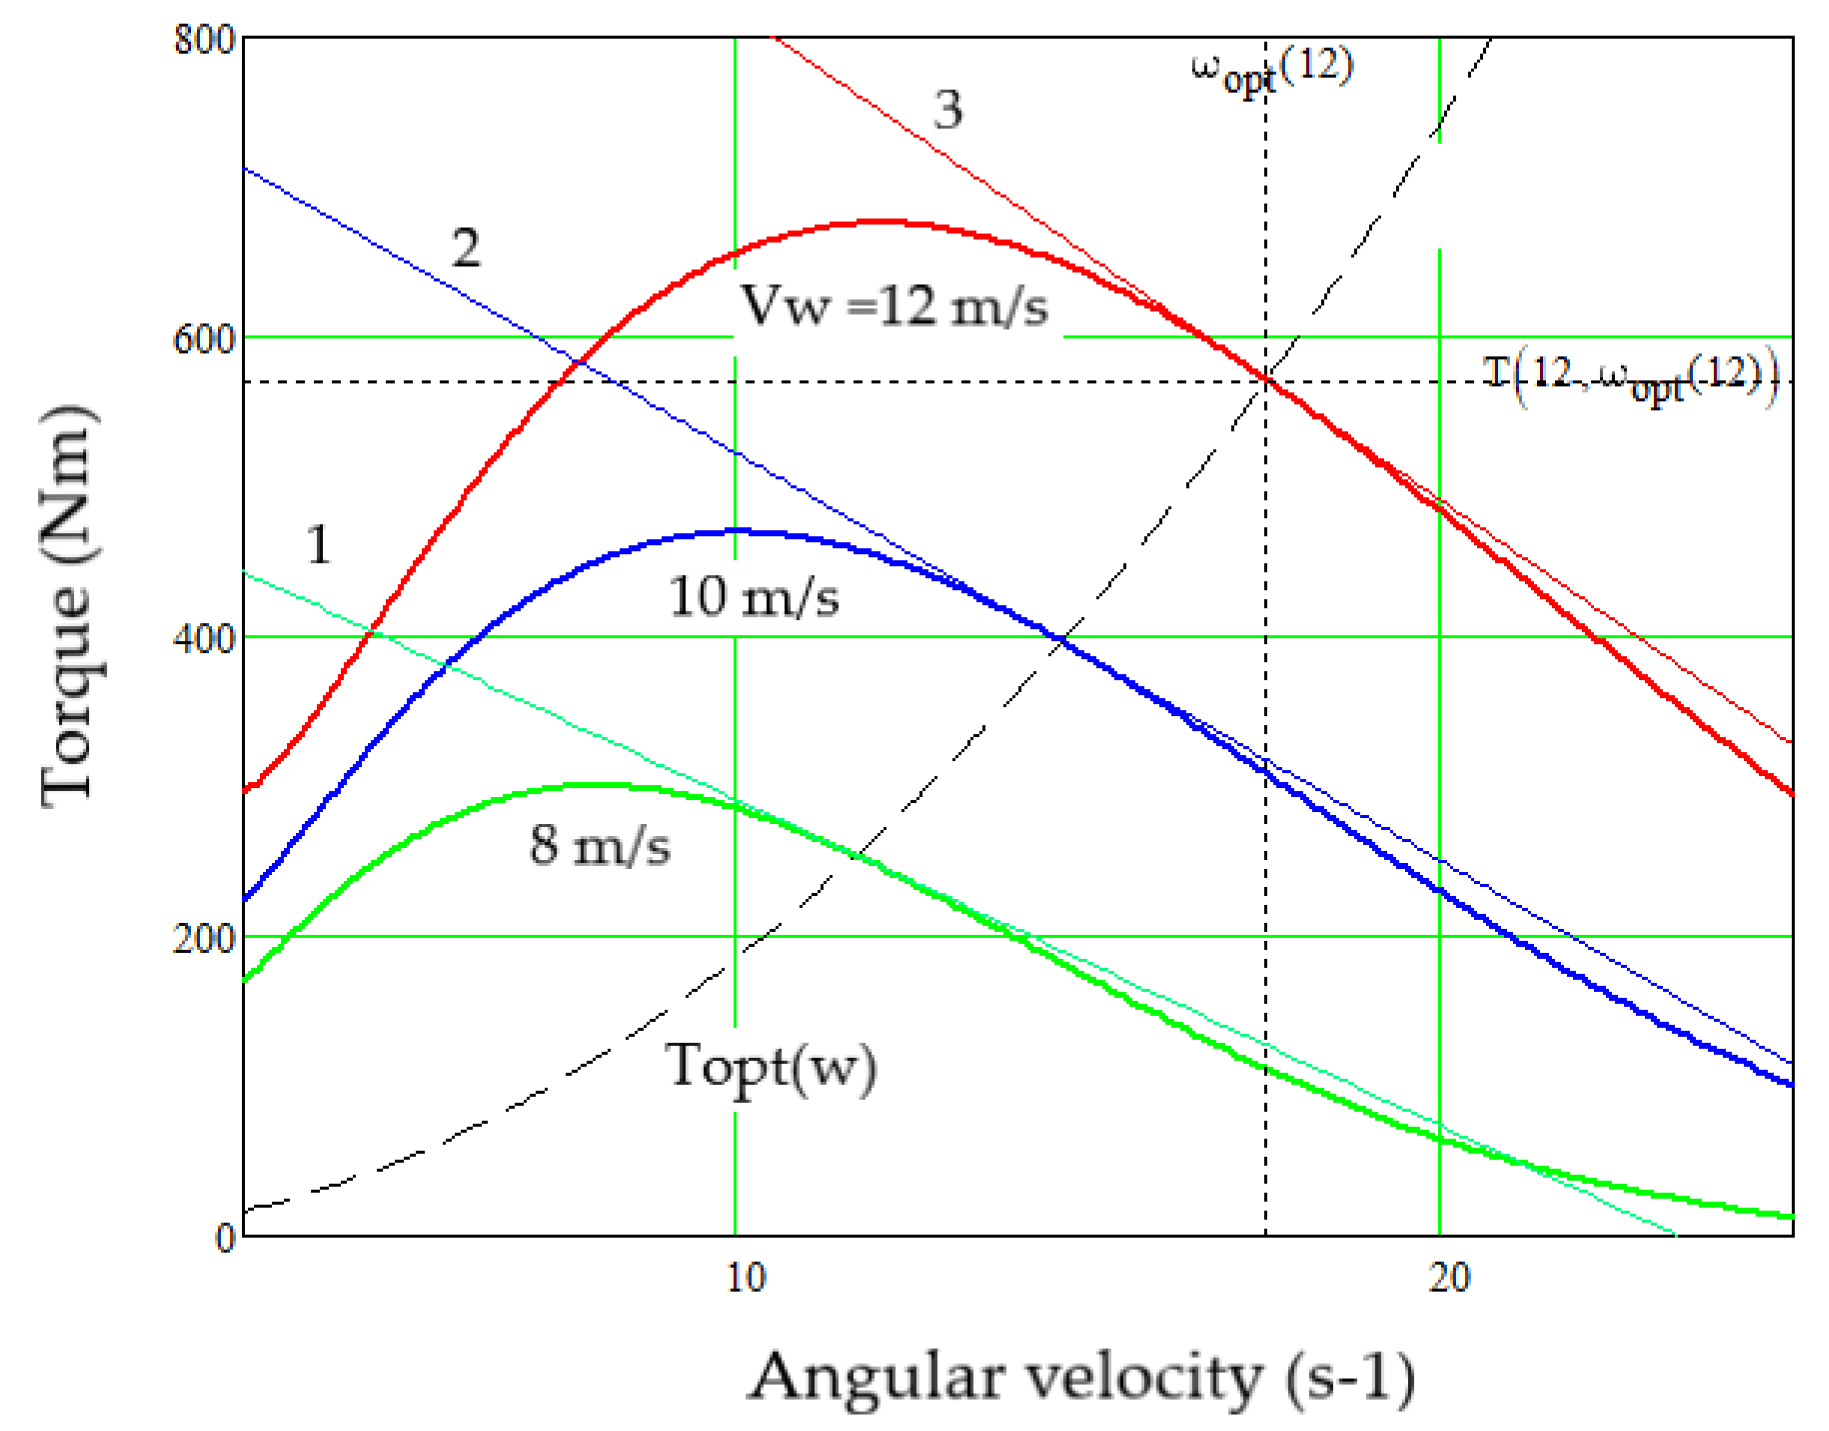
Figure 5 shows the dependences of the torque of the experimental VAWT on its angular velocity for three values of wind speed – 8 m/s, 10 m/s and 12 m/s. Similarly to the one shown in Figure 3, the linearized dependences T WT ( ω ) are shown by lines 1, 2 and 3, respectively, at the optimal points of the maximum VAWT power T WT . opt ( ω opt ) .
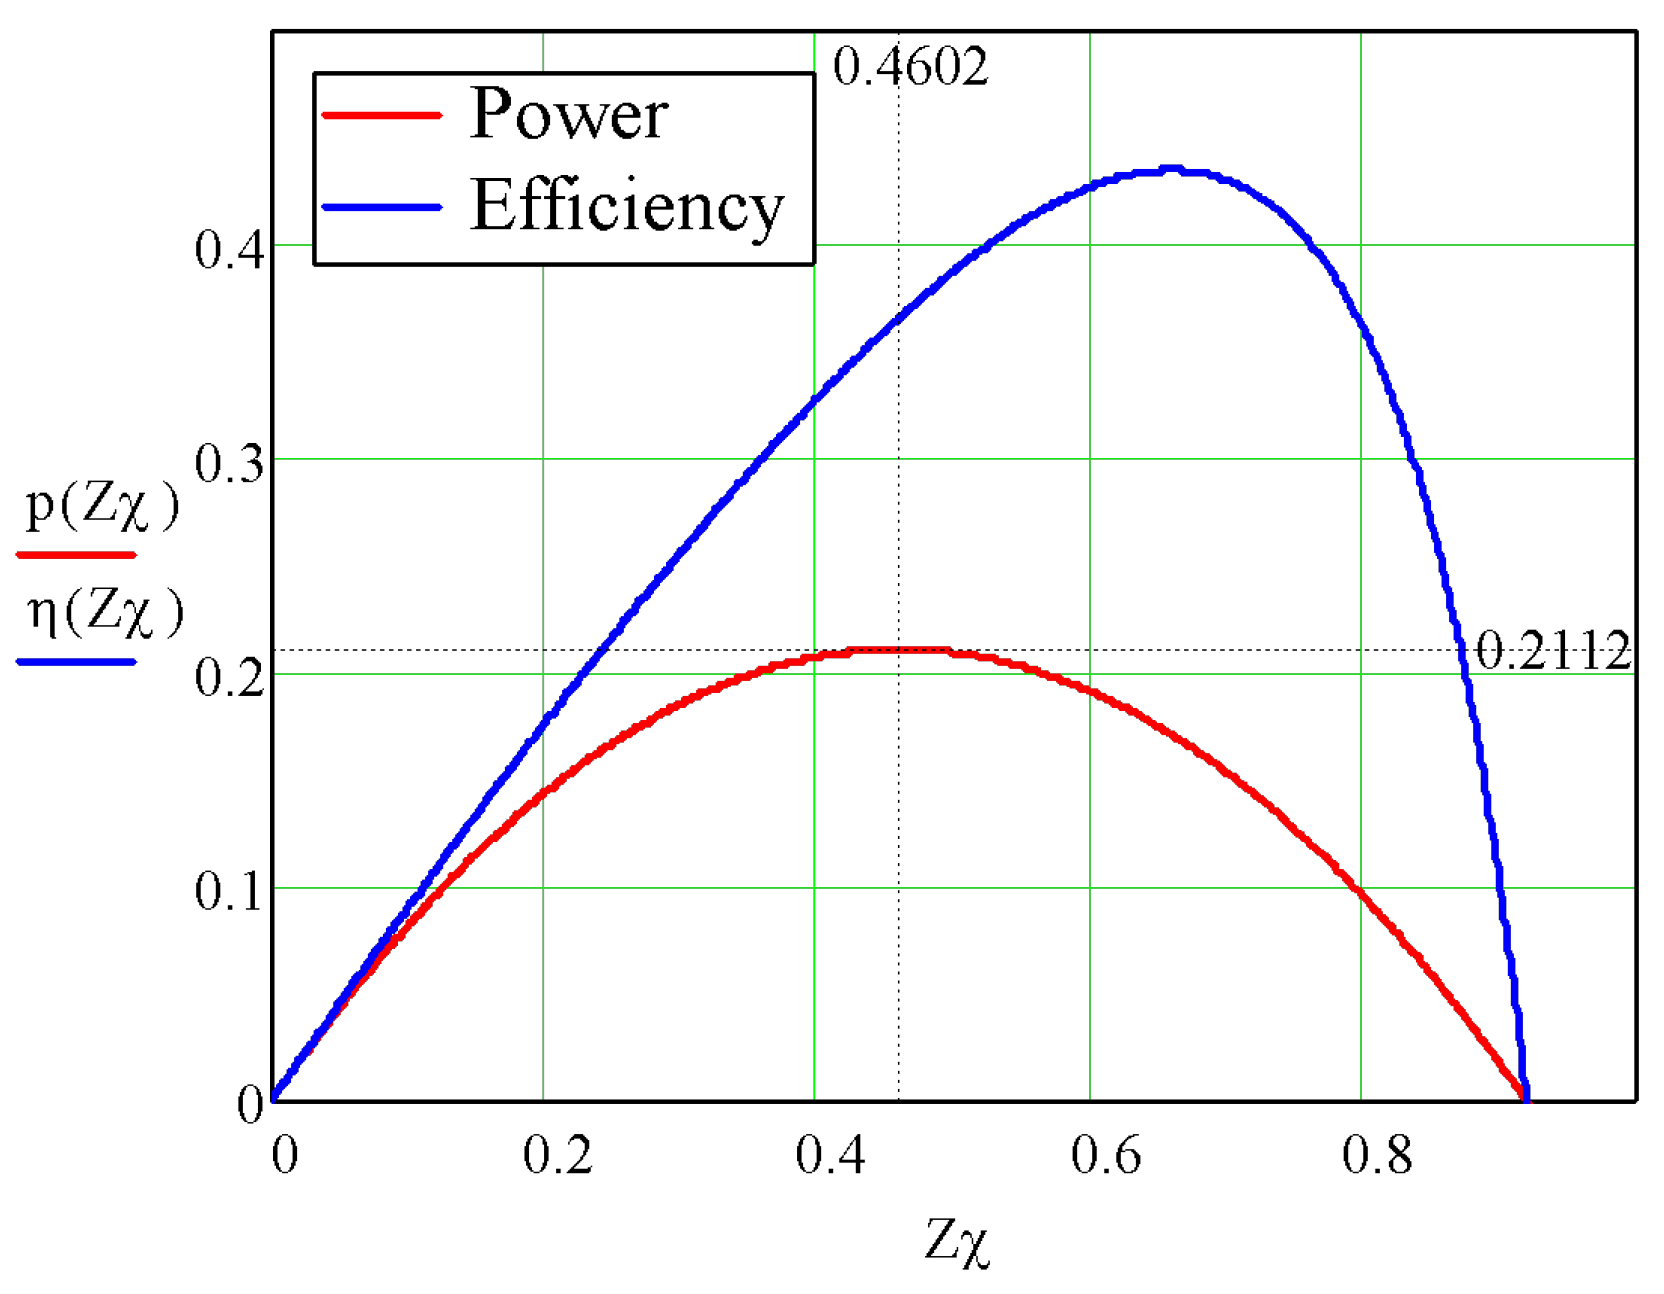
As can be seen from Figure 5, near the selected points, the obtained straight lines have small deviations from the linearized curves, and the parameters k and b of these straight lines are different. This is confirmed by the results of calculations based on expressions (33) and (32). However, regardless of this, calculations according to expressions (34)-(36) lead to the same results regarding the main parameters of the VAWT as a linear EC for linearized characteristics at the points of optimal operation of the experimental WT at different wind speeds: degree of coupling q = 0.9192 , reduced force ratio ( Z χ ) = 0 , 4602 . The dependences of the thermodynamic efficiency and the normalized value of the output power, obtained by expressions (12) and (15), respectively, for these parameters are shown in Figure 6. As can be seen from the figure, the value ( Z χ ) = 0 , 4602 is optimal for the normalized value of the output power, at which its maximum value p max = 0.2112 is reached according to (17). This corresponds to the optimal operation mode of the VAWT, designed to obtain the maximum power value from the wind at any wind speed (in the range of incomplete VAWT power – from the starting to the nominal wind speed). At the same time, given the obtained value ( Z χ ) = 0 , 4602 , the thermodynamic efficiency of converting wind power into mechanical power of the WT rotor is not maximal.
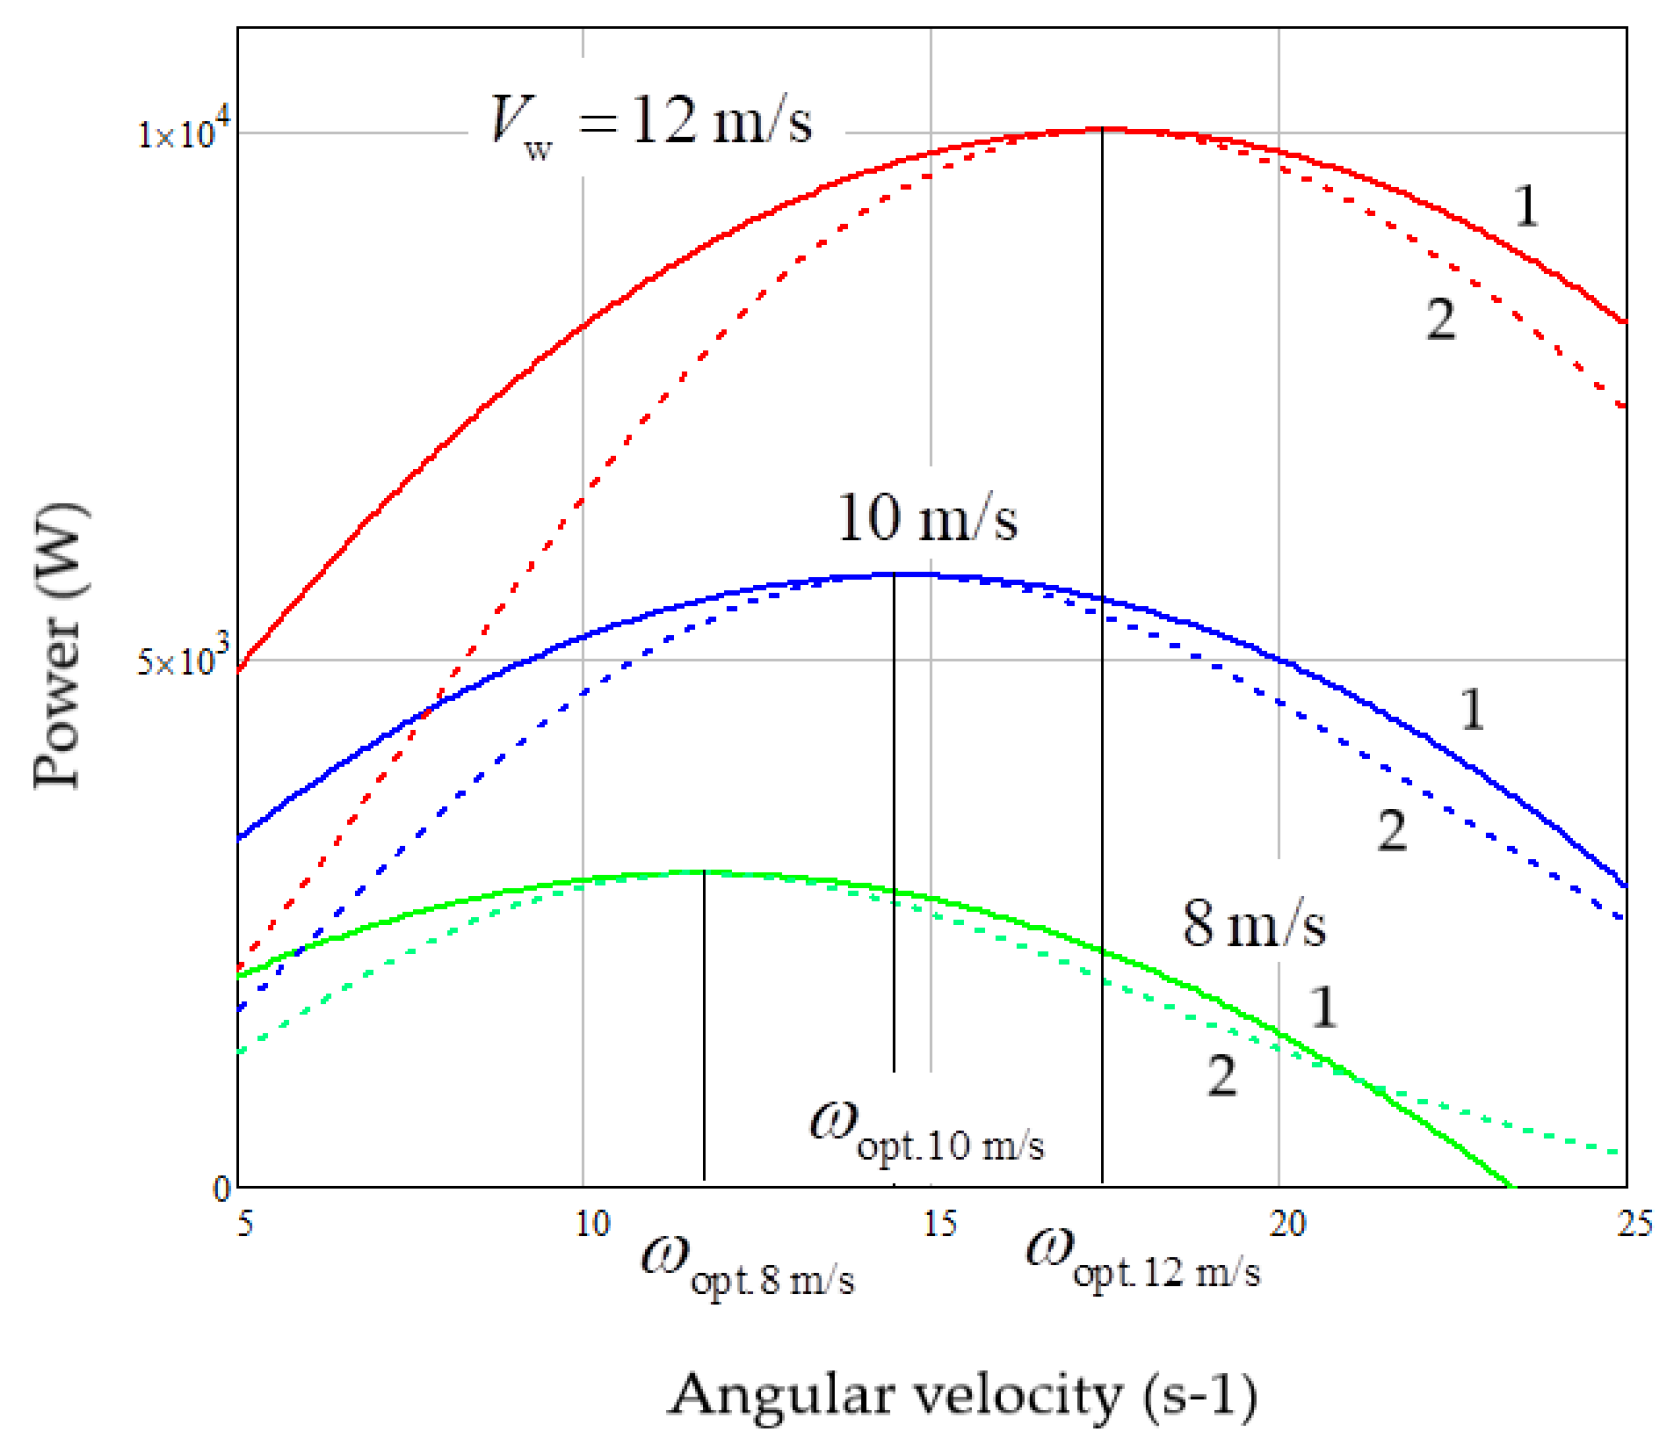
Figure 7 shows the dependences of the absolute power values of the studied VAWT on its angular velocity (curves 1), obtained based on (15) for three values of the wind speed according to the following expression:
P WT . opt ( ω ) = L ii ( V w , ω opt ) F ( V w ) 2 [ ( Z opt χ ( ω ) ) + q opt ] ( Z opt χ ( ω ) ) ,
where the index opt indicates the corresponding parameters determined for the points of optimal operation of the experimental VAWT, in which the maximum value of the output power is ensured at a specific wind speed.
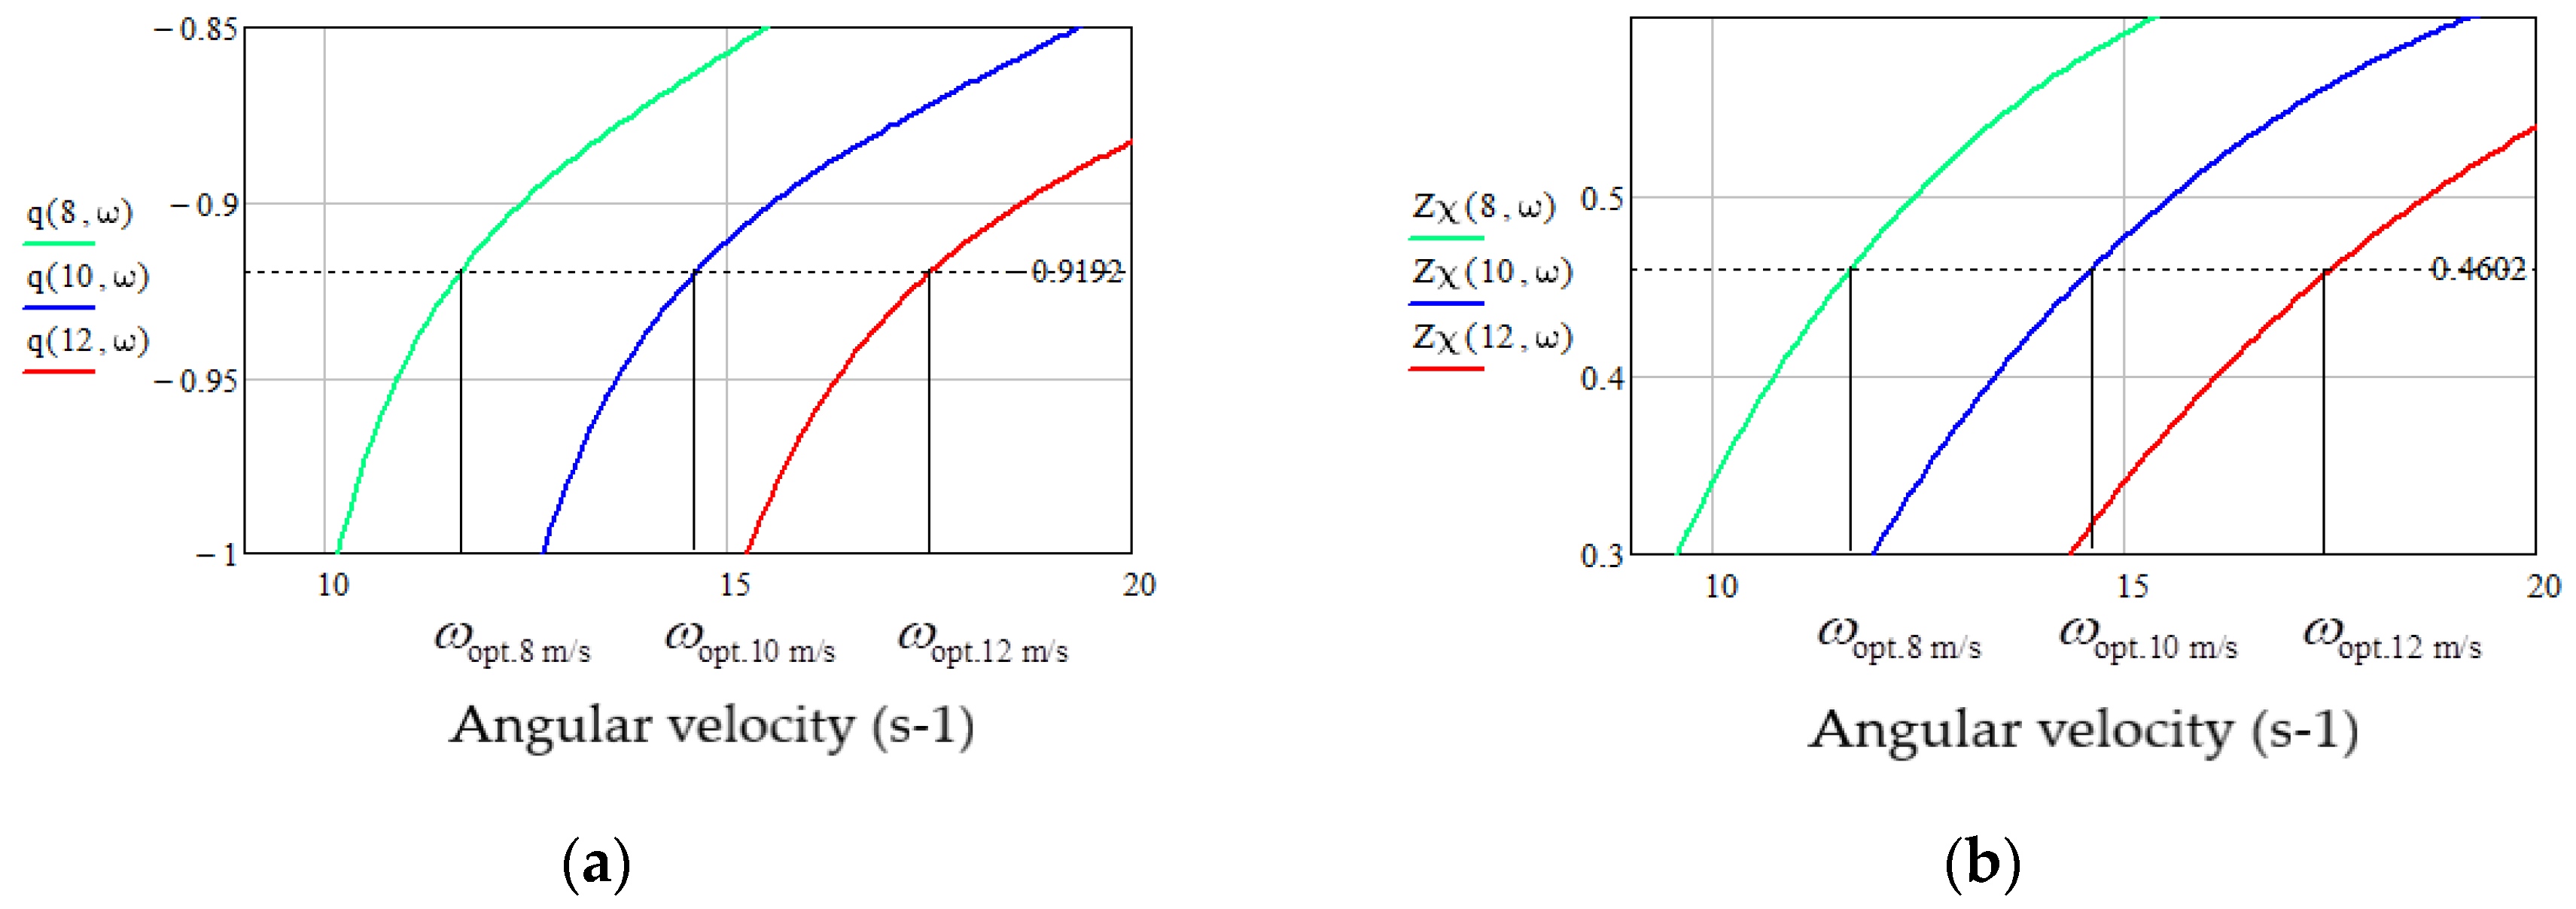
As expected, at optimal angular velocity values, the output power of the studied VAWT reaches its maximum value. However, as can be seen from Figure 3, when the angular velocity deviates from the optimum, the real WT torque decreases compared to the linearized values corresponding to straight line 1. This means, for deviations from the point of optimal operation, the accuracy of VAWT modeling by linear EC decreases. In the future, after consideration of the entire WECS, optimization of its operation will be ensured based on the system criterion – the maximum electrical power received at the output of the generator. This will mostly lead to some deviation of the operating point of the VAWT from its optimal mode. Therefore, in order to increase the accuracy of the mathematical description, it is advisable to model the VAWT not by one linear EC, as was done above, but by a whole series of ECs with slightly different parameters obtained for the current VAWT angular velocity by linearizing the characteristic T WT ( ω ) at this point. For this purpose, a special program has been developed in the MathCad environment, which determines the dependence of all parameters and variables on the angular velocity of the VAWT in the given vicinity of its MPP, i.e. performs multiple linearization of the characteristics T WT ( ω ) for the given wind speeds of 8 m/s, 10 m/s and 12 m/s. As a result of such modeling, the kinetic coefficients of the system of equations (29), determined for each wind speed, will also depend on the VAWT angular velocity. Consequently, this will also lead to the dependence of the main VAWT parameters as EC on the angular velocity – degree of coupling qWT and normalized force ratio ( Z χ ) WT . As a result of the conducted research, the following dependencies of the specified parameters for the studied VAWT at the three specified wind speeds are presented in Figure 8. As can be seen from the given dependencies, the trends of their change are in contradiction: with an increase in angular velocity, qWT decreases by a modulus, but ( Z χ ) WT increases and, conversely, with a decrease in angular velocity, qWT increases by a modulus, but ( Z χ ) WT decreases. In both cases, this will lead to a deviation from the points of optimal operation marked in the figures. As proof, numbers 2 in Figure 7 indicate the dependences of the output power of the studied VAWT on its angular velocity at different wind speeds, which are similar to those indicated by numbers 1 and obtained only for the MPP operation of the studied VAWT. As can be seen, curve 2 is characterized by a sharper decrease in VAWT output power than curve 1 for deviations from the MPP.

4. Thermodynamic Analysis of PMSG Energy Conversion Efficiency

3.1. Mathematical Description of Mechano-Electrical Regularities of PMSG Operation as a Linear EC

Taking into account losses in both copper and steel, the mathematical model of PMSG operation in a d-q orthogonal reference frame rotating with the rotor and oriented along the rotor field, can be obtained from the corresponding two-phase substitute circuit, which is shown in Figure 9 [16]. The diagram shows (the indices d and q refer to the corresponding axes of the coordinate system): u d , u q are the projections of the armature voltage vector at the generator output; i d , i q are the projections of the armature current vector at the generator output; i d 0 , i q 0 are the projections of the armature current vector, which forms the electromagnetic torque of the generator; R а is the active resistance of the armature winding; L d , L q are the armature winding inductances relative to the axes d and q; R с is the active resistance simulating losses in generator steel; i dc , i qc are the projections of the armature current vector, which simulates losses in the generator steel; ω is the angular speed of the generator rotor; р is the number of generator pole pairs; ψ pm is the flux coupling amplitude created by one pair of permanent magnet poles.
Based on the schemes presented in Figure 9, the equation of the electrical balance of currents and voltages in the d-q projections under the steady-state mode of operation of the PMSG can be described by the following systems of equations [17]:
{ i q = i q 0 + i d 0 p ω L d R c p ω ψ pm R c i d = i d 0 i q 0 p ω L q R c ;
{ u q = i q R a p ω L d i d 0 ( 1 + R a R c ) + p ω ψ pm ( 1 + R a R c ) u d = i d R a + p ω L q i q 0 ( 1 + R a R c ) .
We will assume that the permanent magnets are placed on the surface of the rotor (surface-mounted PMSM – SPMSM), for which L d = L q = L a , which mostly occurs in real WECS [18]. Then the electromagnetic torque created by the generator is the following
T G = 3 2 p ψ pm i q 0 .
Control of the PMSG load torque is carried out, most often, in a vector way using an active rectifier that is implemented by forming of the armature current in phase with the EMF of the generator, i.e., ensuring the condition i d = 0 [19].
As EC, PMSG converts the mechanical power of the WT on its shaft into electrical power at the output of the generator armature winding. At the input of this EC, there is a force in the form of the rotor angular velocity X i = ω , which determines the input flow in the form of the rotation WT torque, which in the steady-state is equal to the braking PMSG electromagnetic torque J i = T G . At the EC output, the force in the form of the armature voltage vector determines the armature current vector: X o = u a , J o = i a . The power at the EC input is Р i = ω T G , and the power at its output is the dot product of the armature voltage and current vectors. P o = ( u a i a ) . The last expression, taking into account the vector control strategy i d = 0 , will take the following form:
P o = ( u a i a ) = 3 2 ( u d i d + u q i q ) = ( 3 2 u q ) ( 3 2 i q ) ,
where the factor 3/2 is due to the transformation of the three-phase reference frame to the two-phase one.
Based on (42), the output force and flow of the EC will be: X o = 3 2 u q , J o = 3 2 i q .
Similarly to (4), the system of linear equations that describes the operation of the PMSG as a EC will have the form
{ Т G = L ii ω + L io ( 3 2 u q ) ( 3 2 i q ) = L oi ω + L oo ( 3 2 u q ) .
Let's determine the kinetic coefficients in the system of equations (43) using the PMSG mathematical model (39)-(41).
Given that i d = 0 , from the second equation of system (39) we obtain
i d 0 = i q 0 p ω L a R c .
The analysis of expression (44) shows that i d 0 has a much smaller value compared to i q 0 due to the small factor near the latter. When substituting i d 0 into the first equation of system (39), this small factor at i q 0 will already be squared, so the second terms on the right side of this equation can be neglected without the risk of losing the accuracy of the mathematical description. Having done this and substituting i q from the first equation of the system (39) into the first equation of the system (40), after transformations we get
i q 0 = u q A R a + p ω ψ pm A R a ( 1 + 2 R a R c ) ,
where
A = 1 + ( p ω L a ) 2 R a R c ( 1 + R a R c ) .
Substituting (45) into (41), we obtain the first equation of the system (43) in the form
T G = 3 2 ( p ψ pm ) 2 A R a ( 1 + 2 R a R c ) ω 3 2 p ψ pm A R a ( 3 2 u q ) .
Substituting (45) into the first equation of system (39), we get
i q = p ψ pm A R a ω [ 1 + R a R c ( 2 A ) ] + 1 A R a u q .
Analysis of the expression in square brackets shows that its value differs from unity by tenths of a percent, so it can be replaced by unity. Multiplying both parts of equation (48) by 3 / 2 , we obtain the second equation of system (43) in the form
( 3 2 i q ) = 3 2 p ψ pm A R a ω + 1 A R a ( 3 2 u q ) .
From the equations of the system composed of equations (47) and (49), we obtain the expressions for the kinetic coefficients of the EC, which describe the operation of the vector-controlled PMSG:
L ii = 3 2 ( p ψ pm ) 2 A R a ( 1 + 2 R a R c ) ,   L io = 3 2 p ψ pm A R a ,   L oo = 1 A R a .
Having the expressions for the kinetic coefficients (50), it is possible to obtain from (5)-(7) the expressions for the main dimensionless parameters of this EC:
q G = ( 1 + 2 R a R c ) 0.5 ,   Z G = ( p ψ pm ) 1 [ 3 2 ( 1 + 2 R a R c ) ] 0.5 ,   χ G = 3 2 u q ω .
Using equations (45) and (51), we finally get
( Z χ ) G = ( 1 + 2 R a R c ) 0.5 [ 1 A R a i q 0 p ω ψ pm ( 1 + 2 R a / R c ) ] .

4.2. Determination of the Parameters of the Studied PMSG

For further research, it is necessary to obtain the parameters of the studied PMSG, which will work together with the VAWT, the parameters of which are given in Table 1. Let's find, with a reasonable approximation, expressions for determining the main parameters of the generator, based on its given energy indicators – relative energy losses in copper δ Cu and steel δ Fe .
In the case of a PMSG with its specified nominal input parameters (torque T n and angular velocity ω n ) its parameters such as р and ψ pm determine the level of output parameters – nominal values of voltage and armature current, which in this study are of no fundamental importance. Therefore р and ψ pm can be chosen arbitrarily, within the limits of real values.
To determine the value of the resistance of the generator armature, we will neglect the losses in the steel and take R c = . Then the relative energy losses in copper in the case of a vector-controlled PMSG in the nominal mode will be as follows
δ Cu = Δ P Cu P mech + Δ P Cu = 3 / 2 i q 0 . n 2 R a 3 / 2 p ψ pm i q 0. n ω n + 3 / 2 i q 0 . n 2 R a = ( p ω n ψ pm i q 0. n R a + 1 ) 1 ,
where Δ P Cu is the absolute power loss in copper, P mech is the mechanical power of PMSG, and i q 0. n is the nominal value of the projection of the armature current onto the q axis.
From (53) we get
R a = p ω n ψ pm i q 0. n ( δ Cu 1 1 ) .
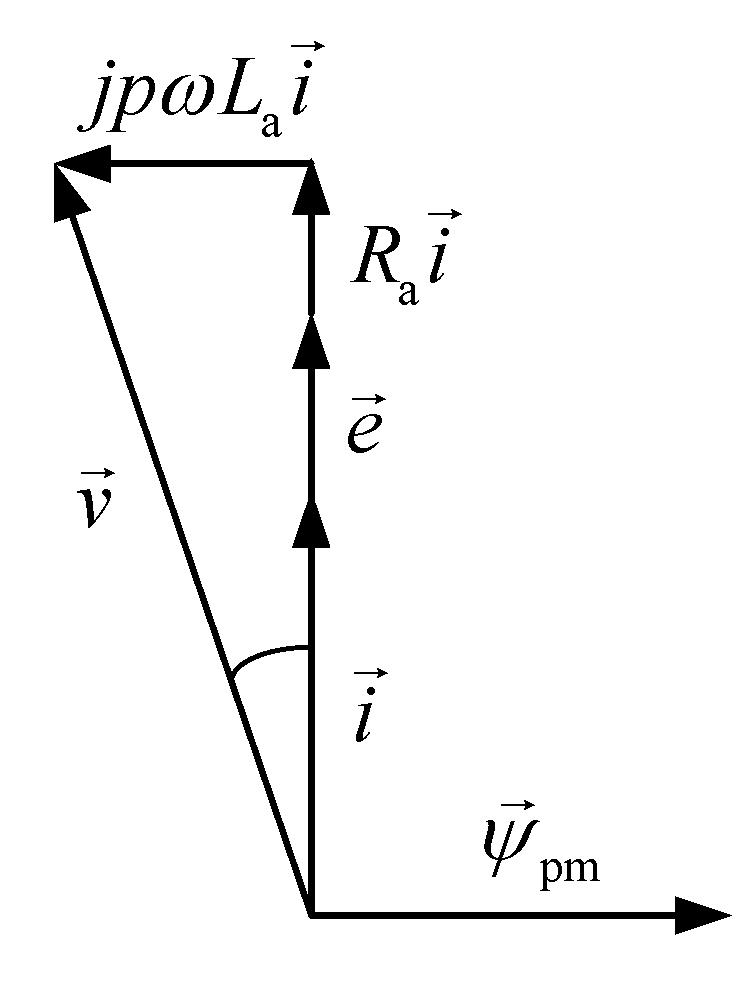
The inductance of the PMSG armature winding and other parameters affect the magnitude of the shift angle φ between the armature voltage v and current i vectors. From the vector diagram (Figure 10) for the nominal mode of a synchronous machine with magnets placed on the surface of the rotor, taking into account that its armature current i = i q 0. n , and EMF e = p ω n ψ pm , the following can be written
tg φ = p ω n L a i q 0. n p ω n ψ pm + i q 0. n R a .
From (55), we receive
L a = ( ψ pm i q 0. n + R a p ω n ) tg φ .
From the scheme shown in Figure 9(b), the relative power losses in PMSG steel can be represented by the power losses in the resistance R с . For the nominal mode of PMSG operation, the following can be written
δ Fe = ( p ω n ψ pm ) 2 R c . n P n ,
where R c . n is the resistance R с value at the nominal operation mode of the PMSG and P n is the rated power of PMSG.
Since power losses due to hysteresis and eddy currents, which together make up losses in steel, depend in different ways on the angular velocity of the machine, the resistance R с value decreases as the speed decreases. As shown in [20], such a trend can be modeled by the following equation:
R c = R c . n K f K h + 1 K f K h + 1 ω * ,
where K h and K f are the relative values of power losses due to hysteresis and eddy currents for the nominal PMSG mode (according to experimental data [20] we adopt K f / K h = 0,5694).
The PMSG parameters adopted and calculated by expressions (54), (56) and (57) are given in the Table 2.

4.3. Thermodynamic Performance Indicators of the Studied PMSG

To evaluate the parameters of the studied PMSG, the following computational experiment was conducted. The generator is set in motion by an external motor with such a torque as to ensure its given angular velocity regardless of the electrical load of the generator. Based on the obtained expressions (51) and (52), dependencies of the main parameters of the generator as EC on the given angular velocity were calculated for such three values of the electric load of the generator, which form its electromagnetic torque at the level of 0.25TG.n, 0.5TG.n and TG.n. According to (41), these torque values are provided by the following values of the armature current projection iq0: 10.5 А, 21.0 А and 42.0 А. The calculation results are presented in Figure 11.
As can be seen from Figure 11(a), as well as from the expression for qG (51), the degree of coupling depends on the resistance ratio R a / R c and does not depend on the electrical load of the generator. According to (58), as the angular velocity of the latter increases, the resistance Rc increases too, and therefore qG increases. According to (51), dependence ( Z χ ) G is more complicated, and Figure 11(b) reflects it. According to the optimal dependence ( Z χ ) G . opt ( ω ) shown in Figure 11(b) with a dotted line, the maximum generator efficiency η G ( ω ) possible for a specific value q G ( ω ) are provided and are shown in Figure 11(c). However, with a change in the electrical load of the generator, as can be seen from Figure 11(b), there are deviations ( Z χ ) G in one direction and the other from the optimal value, which, respectively, leads to a decrease of η G ( ω ) , as can be seen from Figure 11(c). From this figure, the highest efficiency values are obtained for 0.5TG.n, because for this torque of electrical load of the generator, the values of ( Z χ ) G are as close as possible to the optimal values (Figure 11(b)). The lowest efficiency values are observed when the optimal values ( Z χ ) G are exceeded that can be seen from the curve for 0.25TG.n and curves η ( Z χ ) shown in Figure 11(c). It is worth noting that the biggest decrease in efficiency occurs due to the reduction of coupling and deviation from the optimal for this degree of coupling operation point, and not due to the amount of load.

5. Thermodynamic Analysis of Energy Conversion Efficiency in the «VAWT – PMSG» Complex

5.1. Thermodynamic Performance Indicators of the Studied PMSG Driven by the Studied VAWT

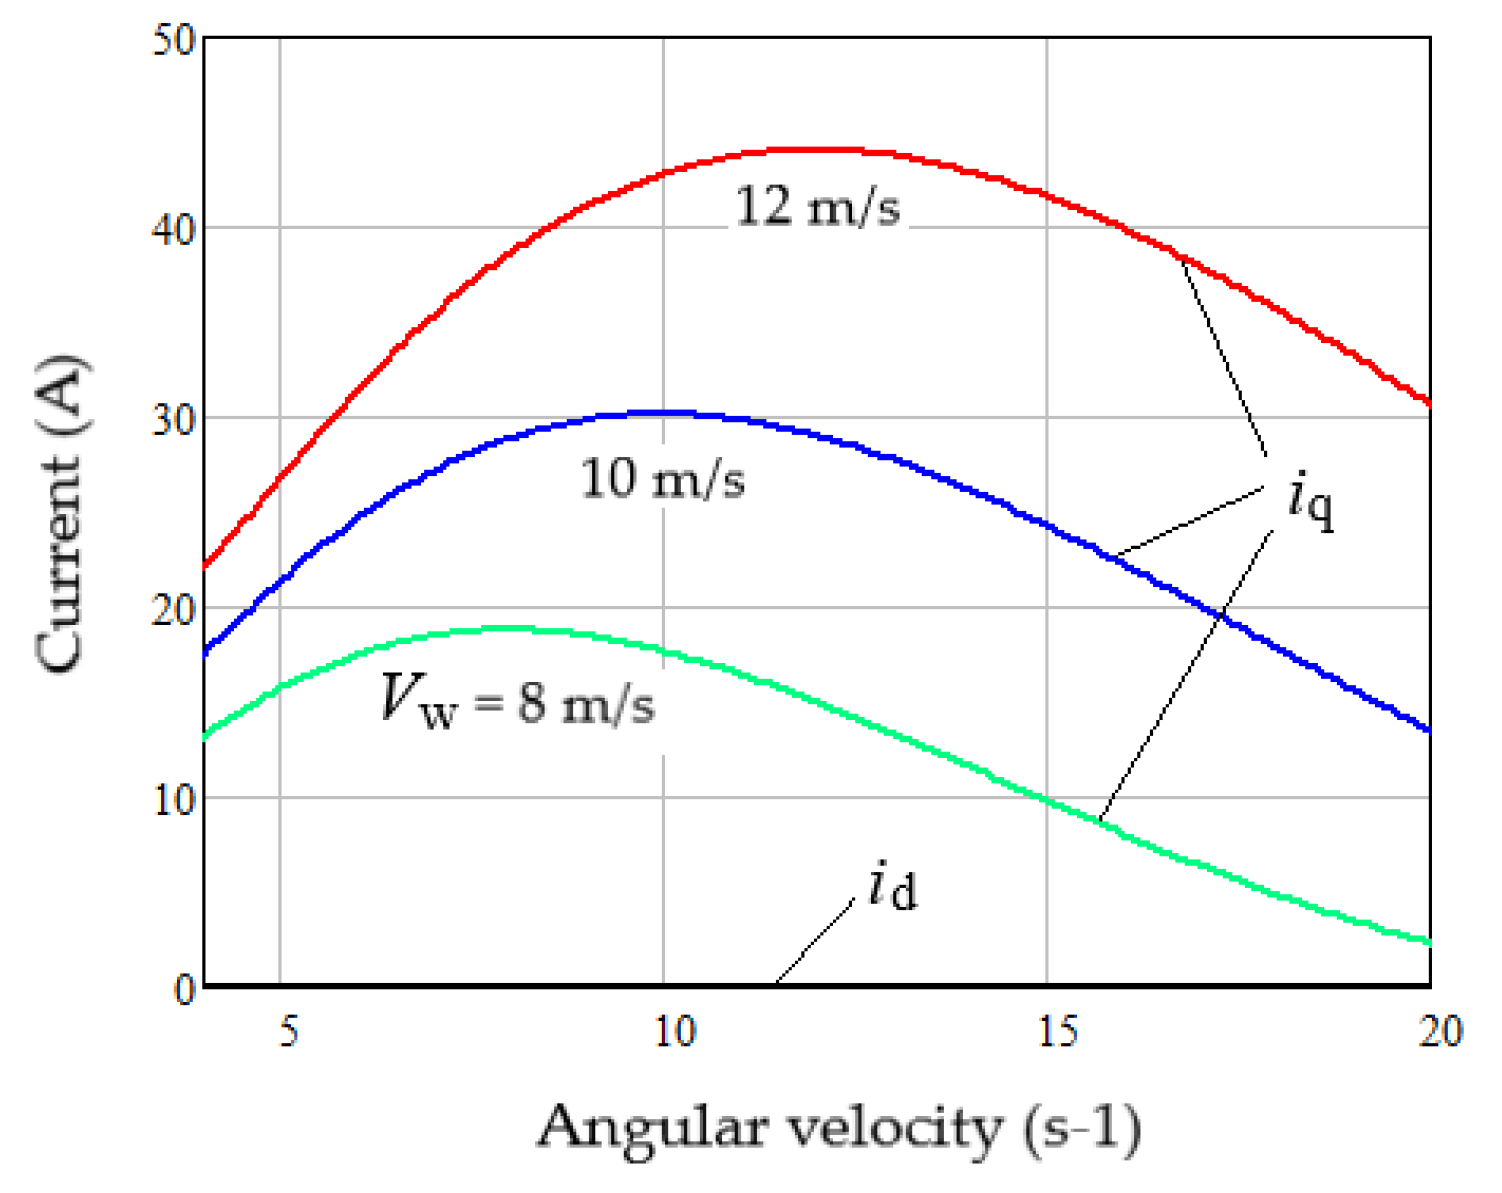
When the shaft of the studied VAWT (parameters in Table 1) is connected with the studied PMSG (parameters in Table 2), steady states of WECS at wind speeds of 8 m/s, 10 m/s, and 12 m/s will be ensured by vector control of generator armature current projections. Their dependences on the joint angular velocity of the VAWT and PMSG complex are shown in Figure 12.
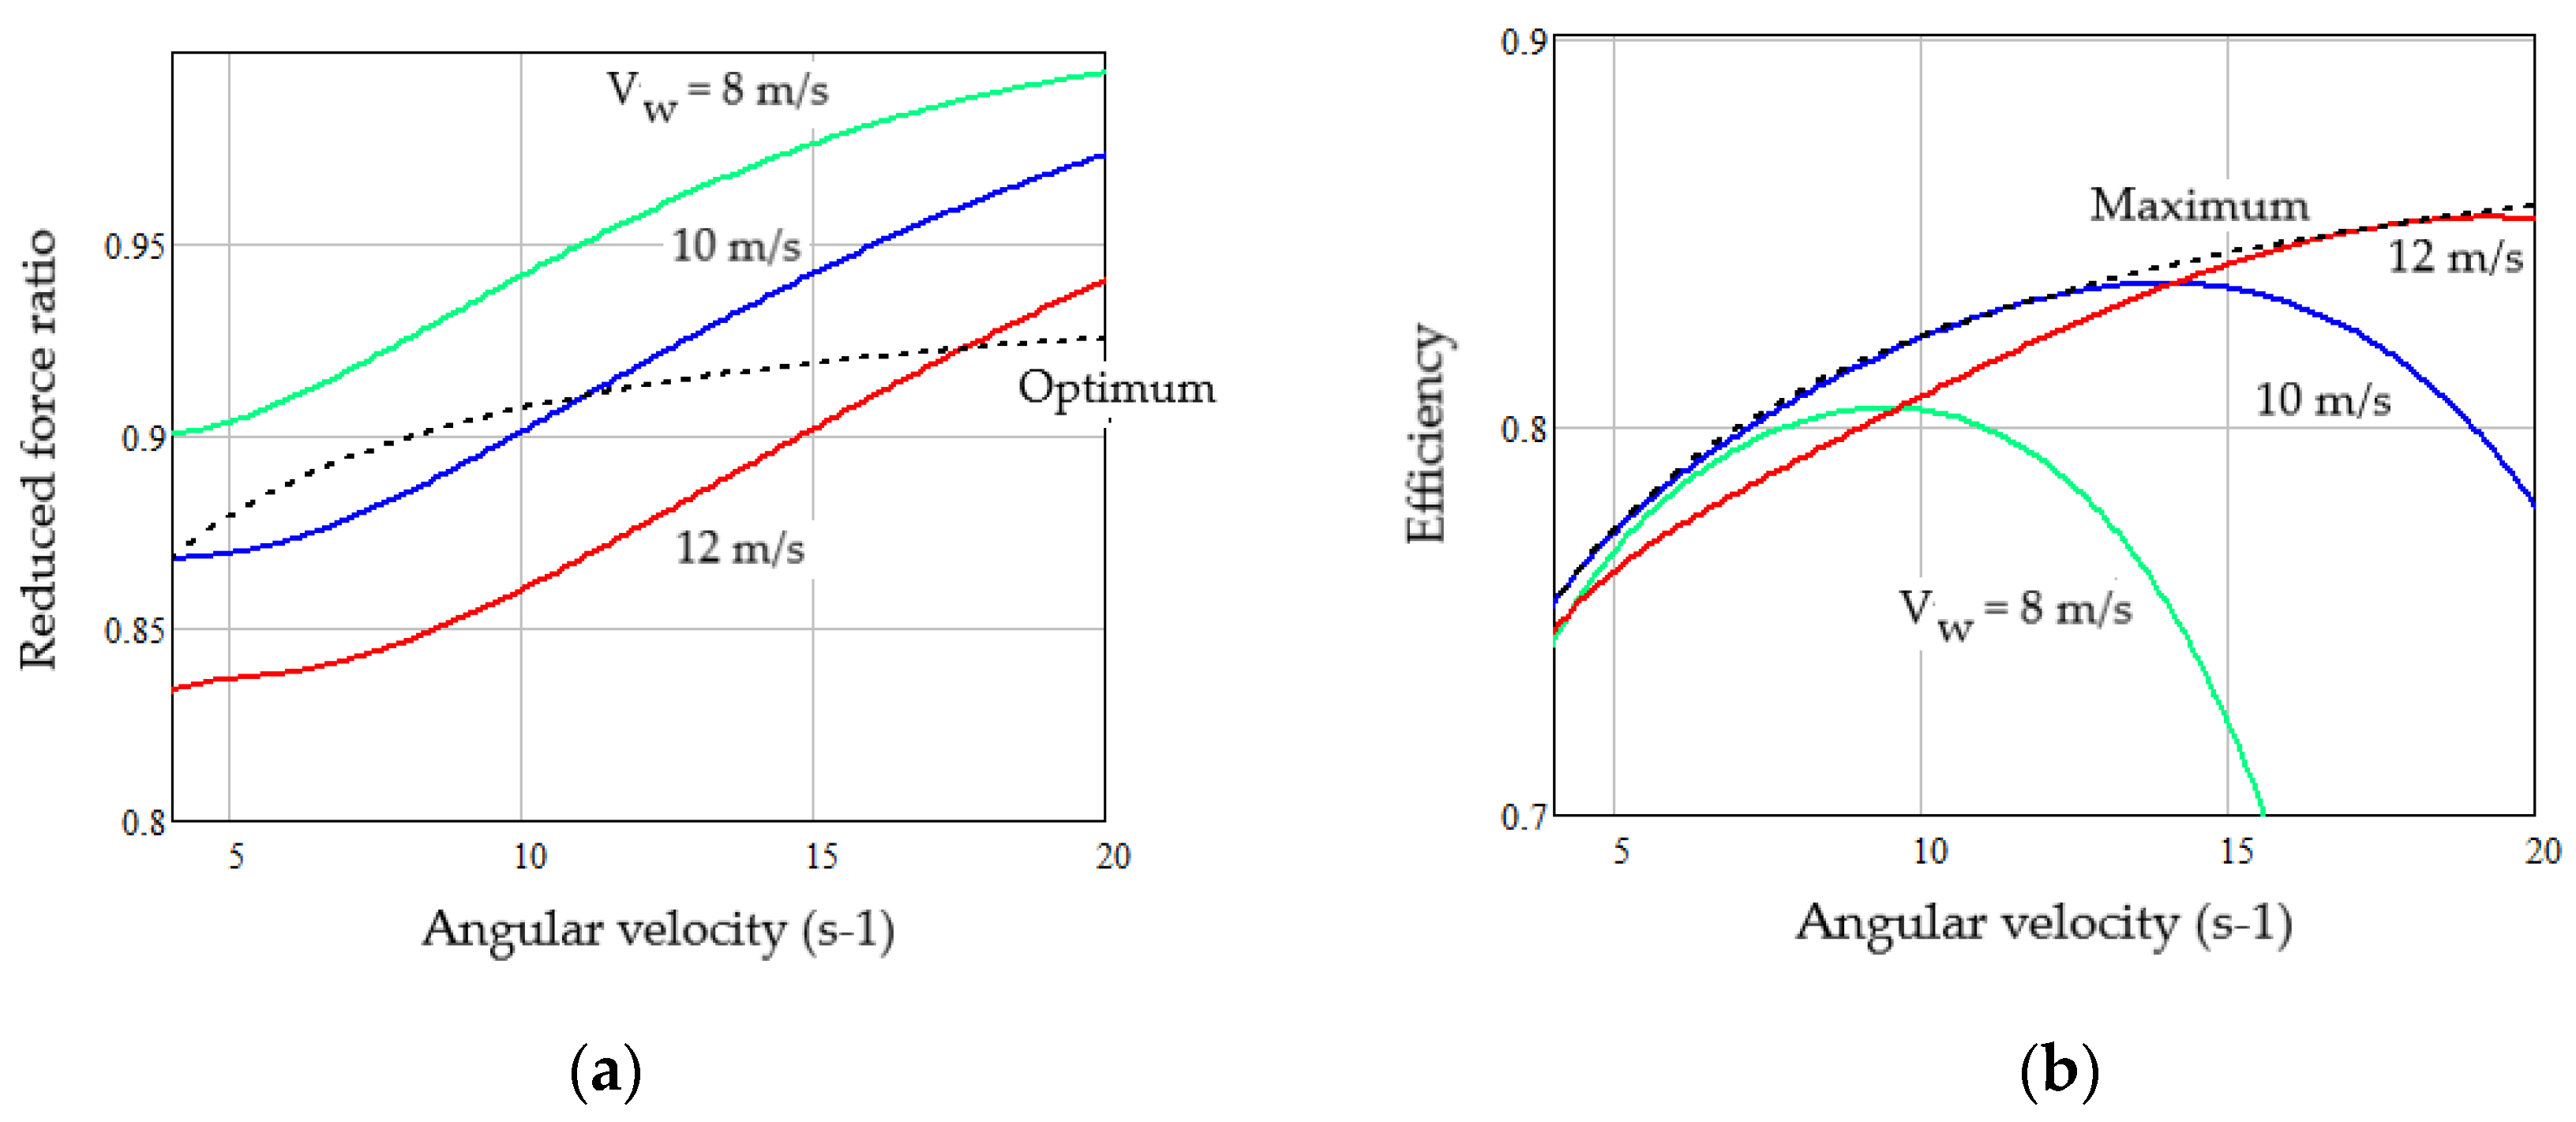
Under such conditions, the dependence q G ( ω ) for the generator remains the same as shown in Figure 11(a), and the dependences ( Z χ ) G and η G ( ω ) , unlike those shown in Figure 11(b) and 11(c), will have the form shown in Figure 13.
As can be seen from the obtained dependences, for every wind speed there is a significant range of variation of the VAWT angular velocity with PMSG, in which the generator efficiency is very close to the maximum possible. This is ensured by the fact that there is equality ( Z χ ) G = ( Z χ ) G . opt in the middle of these ranges (see Figure 13(a)).

5.2. Thermodynamic Parameters of WECS as a Cascade EC

The two ECs investigated above (VAWT and PMSG) are connected into one complex of WECS in a cascade manner, as evidenced by the obtained linear systems of equations (29) and (43), which describe the established operation mode of these EC components. In the following systems of equations, the necessary conditions for the cascade connection of the two investigated ECs are fulfilled: X 1 o = X 2 i = ω , J 1 o = J 2 i = T WT = T G . The new complex EC obtained by the cascade connection of the two ECs studied above is characterized by several indicators. The dependence of these indicators on the angular velocity ω of the complex is shown in Figure 14.
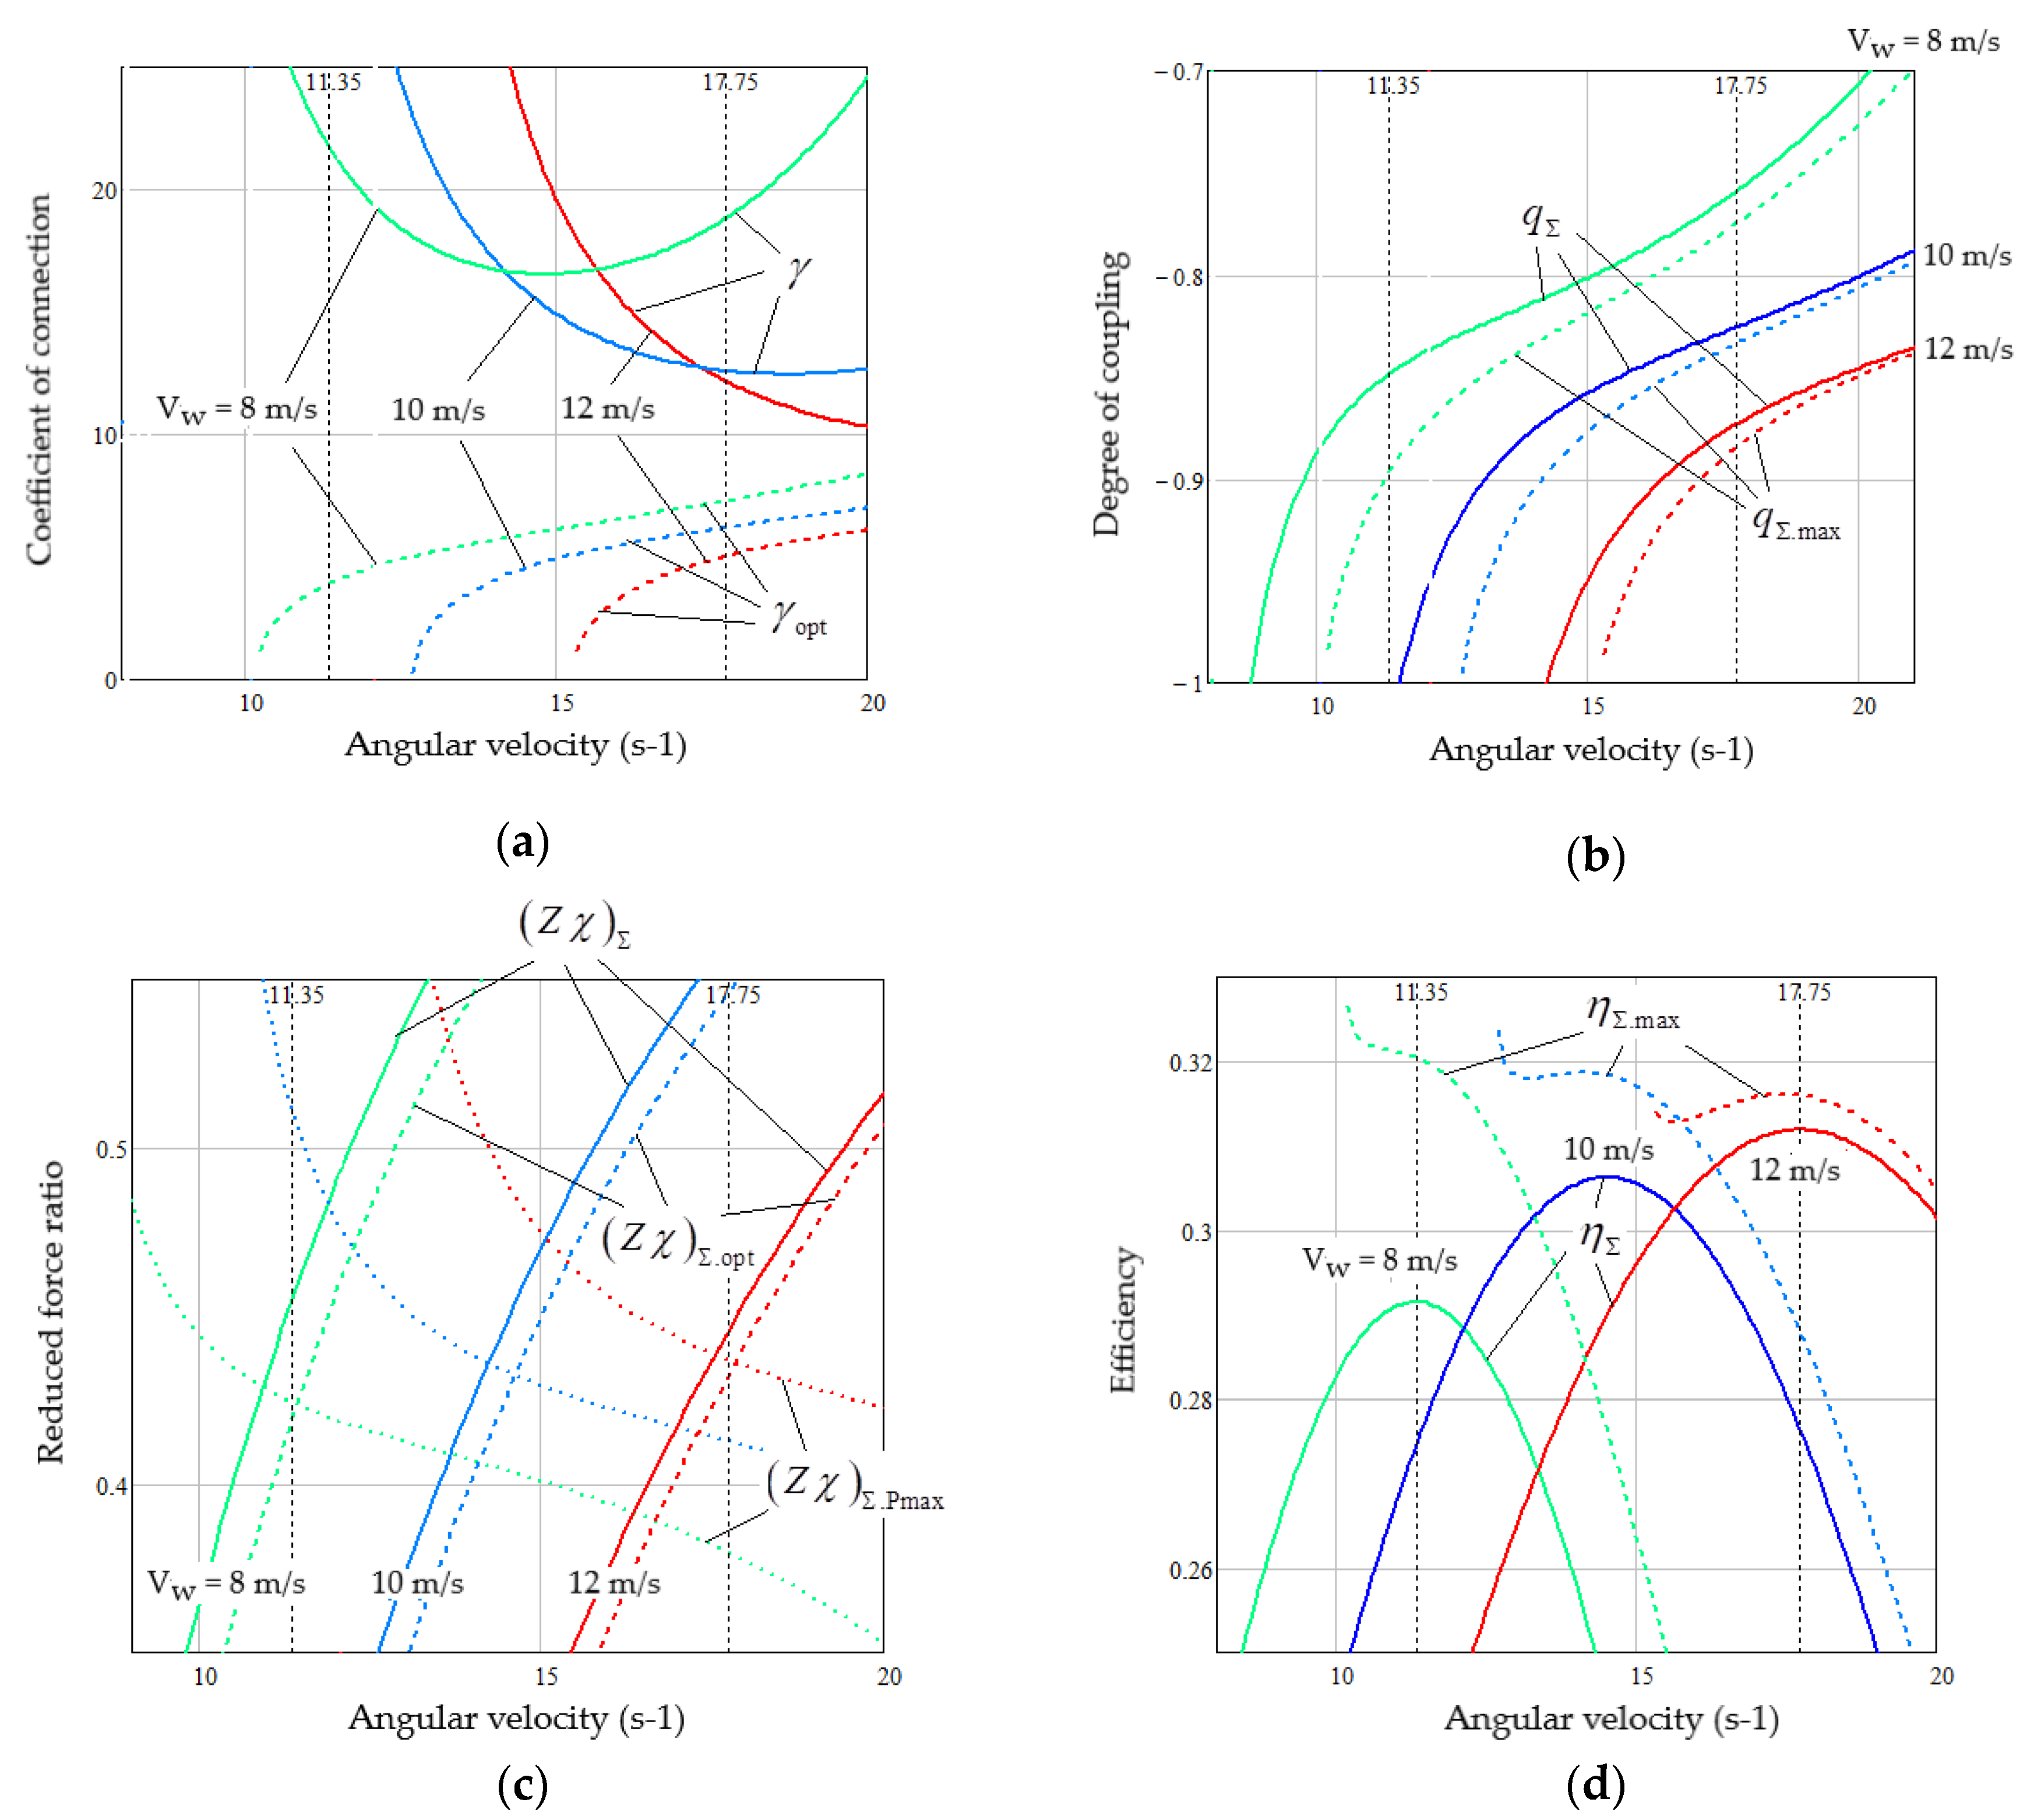
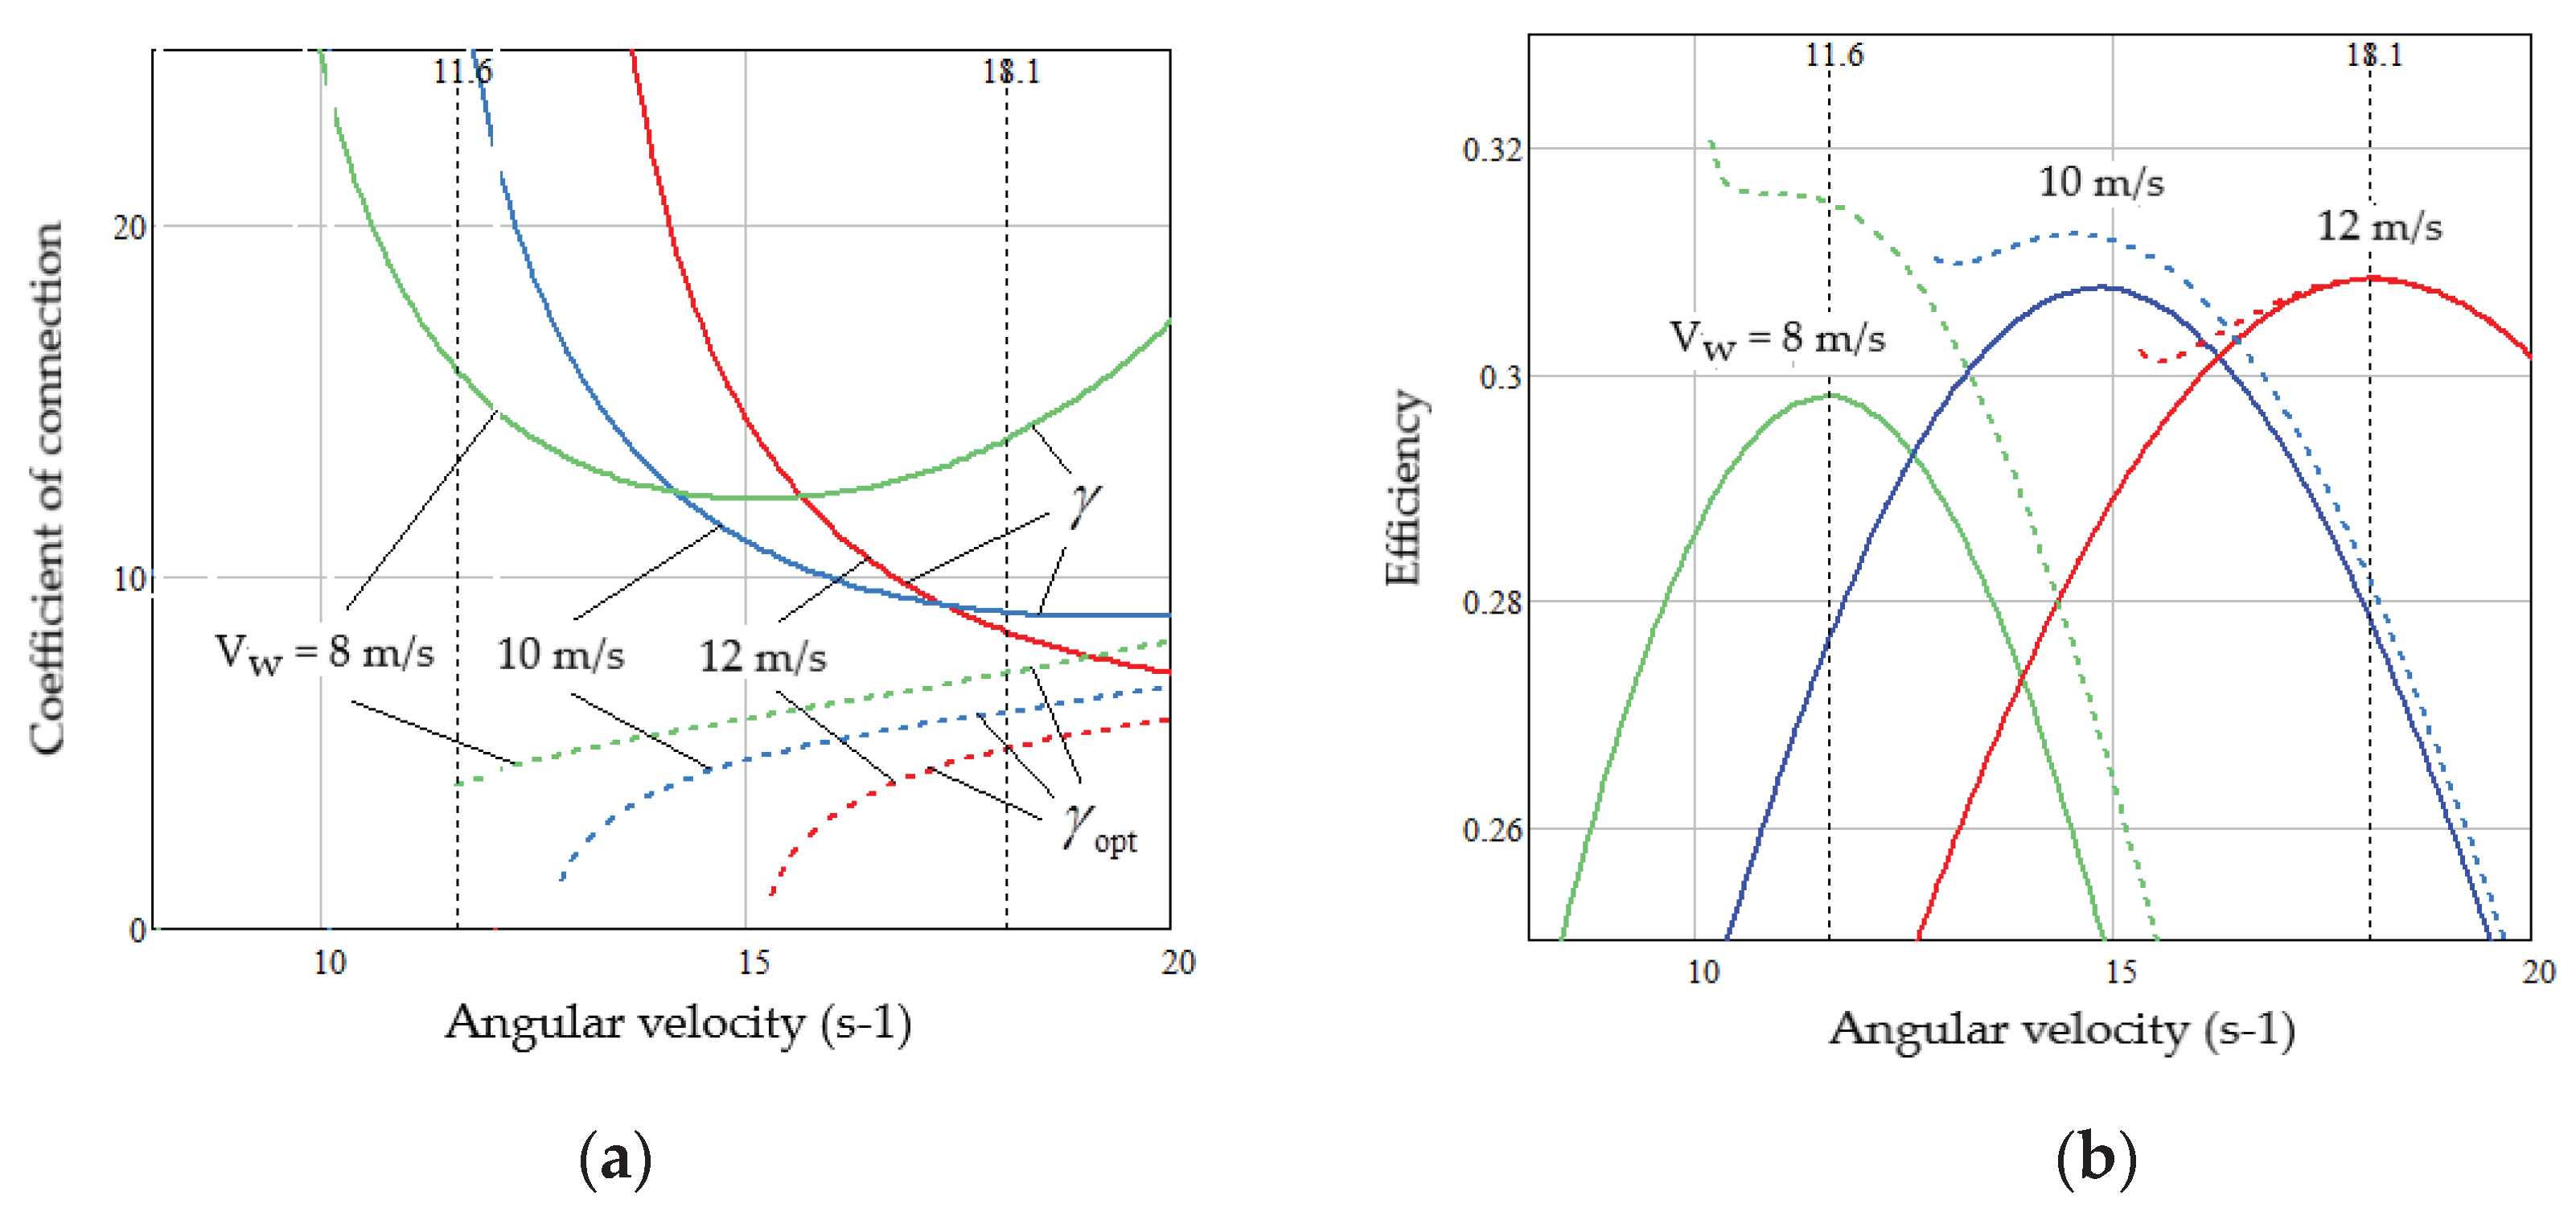
From the point of view of the degree of coupling of the complex EC, which most affects the efficiency of the complex, the quality of the cascade connection is characterized by the connection coefficient γ. The dependences of γ(ω) on the angular velocity of the complex are calculated according to expression (20) for the three investigated wind speeds and are presented in Figure 14(a). The same figure shows the dependences on the angular velocity of the optimal connection coefficients γopt(ω) of EC components calculated by expression (21) for the same values of the wind speed. They are shown with specific dependences on the angular velocity of the complex of their degrees of coupling, which are shown, respectively, in Figure 8(a) and 11(a). As can be seen from Figure 14(a), the corresponding pairs γ(ω) and γopt(ω) for each of the wind speeds differ from each other, but gradually approach each other as the angular velocity of the complex increases. This indicates the suboptimality of the cascade connection of the EC components into a complex, as can be seen from the dependences for the studied wind speeds of the degrees of coupling of the complex EC q Σ ( ω ) calculated according to expression (19), which are lower than the corresponding maximum possible values q Σ . max ( ω ) calculated according to (22).
In addition to the degree of coupling of the complex EC, the efficiency of its operation is also affected by the operating mode point, which is characterized by the reduced force ratio of the complex ( Z χ ) Σ . Dependencies ( Z χ ) Σ ( ω ) calculated by expression (19) for the three investigated wind speeds are shown in Figure 14(c). This figure also shows the dependences on the angular velocity for the optimal values of the reduced force ratios of the complex ( Z χ ) Σ . opt ( ω ) corresponding to the optimal operating modes of the complex EC with the optimal connection coefficients γopt(ω) of the two components of the EC calculated by expression (23) for the same values of the wind speeds. Since a source with free energy – VAWT powered by wind energy – is included at the input of the complex EC, it is advisable to take the maximum output power (15) as a criterion for the efficiency of the complex EC. The optimal reduced force ratios for such an EC are calculated according to expression (16) and are presented in Figure 14(c) by the curves ( Z χ ) Σ . Р max ( ω ) . At the intersection points of the corresponding curves ( Z χ ) Σ ( ω ) and ( Z χ ) Σ . opt ( ω ) with ( Z χ ) Σ . Р max ( ω ) , the optimal values of the angular velocity ωopt of the complex are obtained for the real and ideal connection of the two EC components, respectively.
Figure 14(d) shows the dependences of the wind power conversion efficiency η Σ ( ω ) of the complex EC – the studied WECS – on the angular velocity of the complex at different wind speeds, calculated according to expression (12) for the real obtained dependences q Σ ( ω ) and ( Z χ ) Σ ( ω ) . Since the power of the wind flow washing the wind rotor is constant for each of the wind speeds, the maximum values of the output power for each of the wind speeds are also provided at the maximum points of the curves η Σ ( ω ) . Also, Figure 14(d) shows the maximum possible efficiency dependencies on the angular velocity η Σ , max ( ω ) of the complex at the studied wind speeds. They are calculated according to expression (12) for the maximum values of the degree of coupling q Σ . max ( ω ) and the optimal values of the reduced force ratios ( Z χ ) Σ . opt ( ω ) of the complex, corresponding to the optimal operating modes of the complex EC with optimal connection coefficients γopt(ω). As can be seen from the obtained dependences, the optimal combination of two components of EC (VAWT and PMSG) provides a significant efficiency increase, especially at low wind speeds. So, for Vw = 8 m/s, the efficiency can increase by 9.2%.
Figure 14(d) shows the optimal values of the angular velocity of the complex ωopt for wind speeds of 8 m/s and 12 m/s – 11.35 s-1 and 17.75 s-1, respectively (due to Mathcad limitation of displaying only two markers on one axis). The same values of ωopt are also shown in all other Figure 14(a,b,c). As can be seen from Figure 14(c), at ωopt there is an intersection of the curves ( Z χ ) Σ . opt ( ω ) with the curves ( Z χ ) Σ . Р max ( ω ) , which, as mentioned above, corresponds to the ideal connection of the two components of the EC. For the intersection points of real curves ( Z χ ) Σ ( ω ) with curves ( Z χ ) Σ . Р max ( ω ) the obtained values ωopt are slightly higher, but these deviations are small.

5.3. Research of the Ways to Improve the WECS Efficiency

The simulation results obtained in Section 4 and Section 5 make it possible to determine the optimal operating points of the studied VAWT and PMSG, respectively, as well as the maximum performance indicators of their operation. The latter is conditioned by the given parameters of these devices: for the VAWT – by the characteristic С Р ( λ ) , and for the PMSG – by the relative losses in copper and steel (Table 2). However, having the cascade connection of the studied VAWT and PMSG, as shown by the results obtained in Subsection 5.2, the maximum values of the efficiency of the studied WECS are obtained as a compromise between the efficiencies of these devices. This is mainly due to the non-ideality of their cascade connection, which can be seen from the dependencies shown in Figure 14. At the same time, as can be seen from Figure 14(d), there are reserves for improving the efficiency of the studied WECS. This paragraph explores ways of realizing these reserves.
For the connection coefficient γ, it can be seen from the expression (20) that its deviation from the optimal value (21) depends on the ratio of the own kinetic coefficients – the output Loo for VAWT and the input Lii for PMSG, and this ratio is far greater than the optimal value γopt (Figure 14(a)).
As can be seen from (35), the value of Loo for a VAWT with a given characteristic can be changed only by changing the turbine power. However, at the same time, the power of the generator increases respectively, from which the resistance of its armature winding is determined according to (54) and (41). Studies have shown, that all these changes lead to the invariance of the ratio between γ and γopt for the optimal VAWT angular velocities ωopt at different wind speeds, however, ωopt decreases with increasing of VAWT power. Therefore, the reserves for changing the parameters of the VAWT to optimize its connection with the PMSG remain only the choice of a WT with a different characteristic С Р ( λ ) , which can be the subject of a separate study.
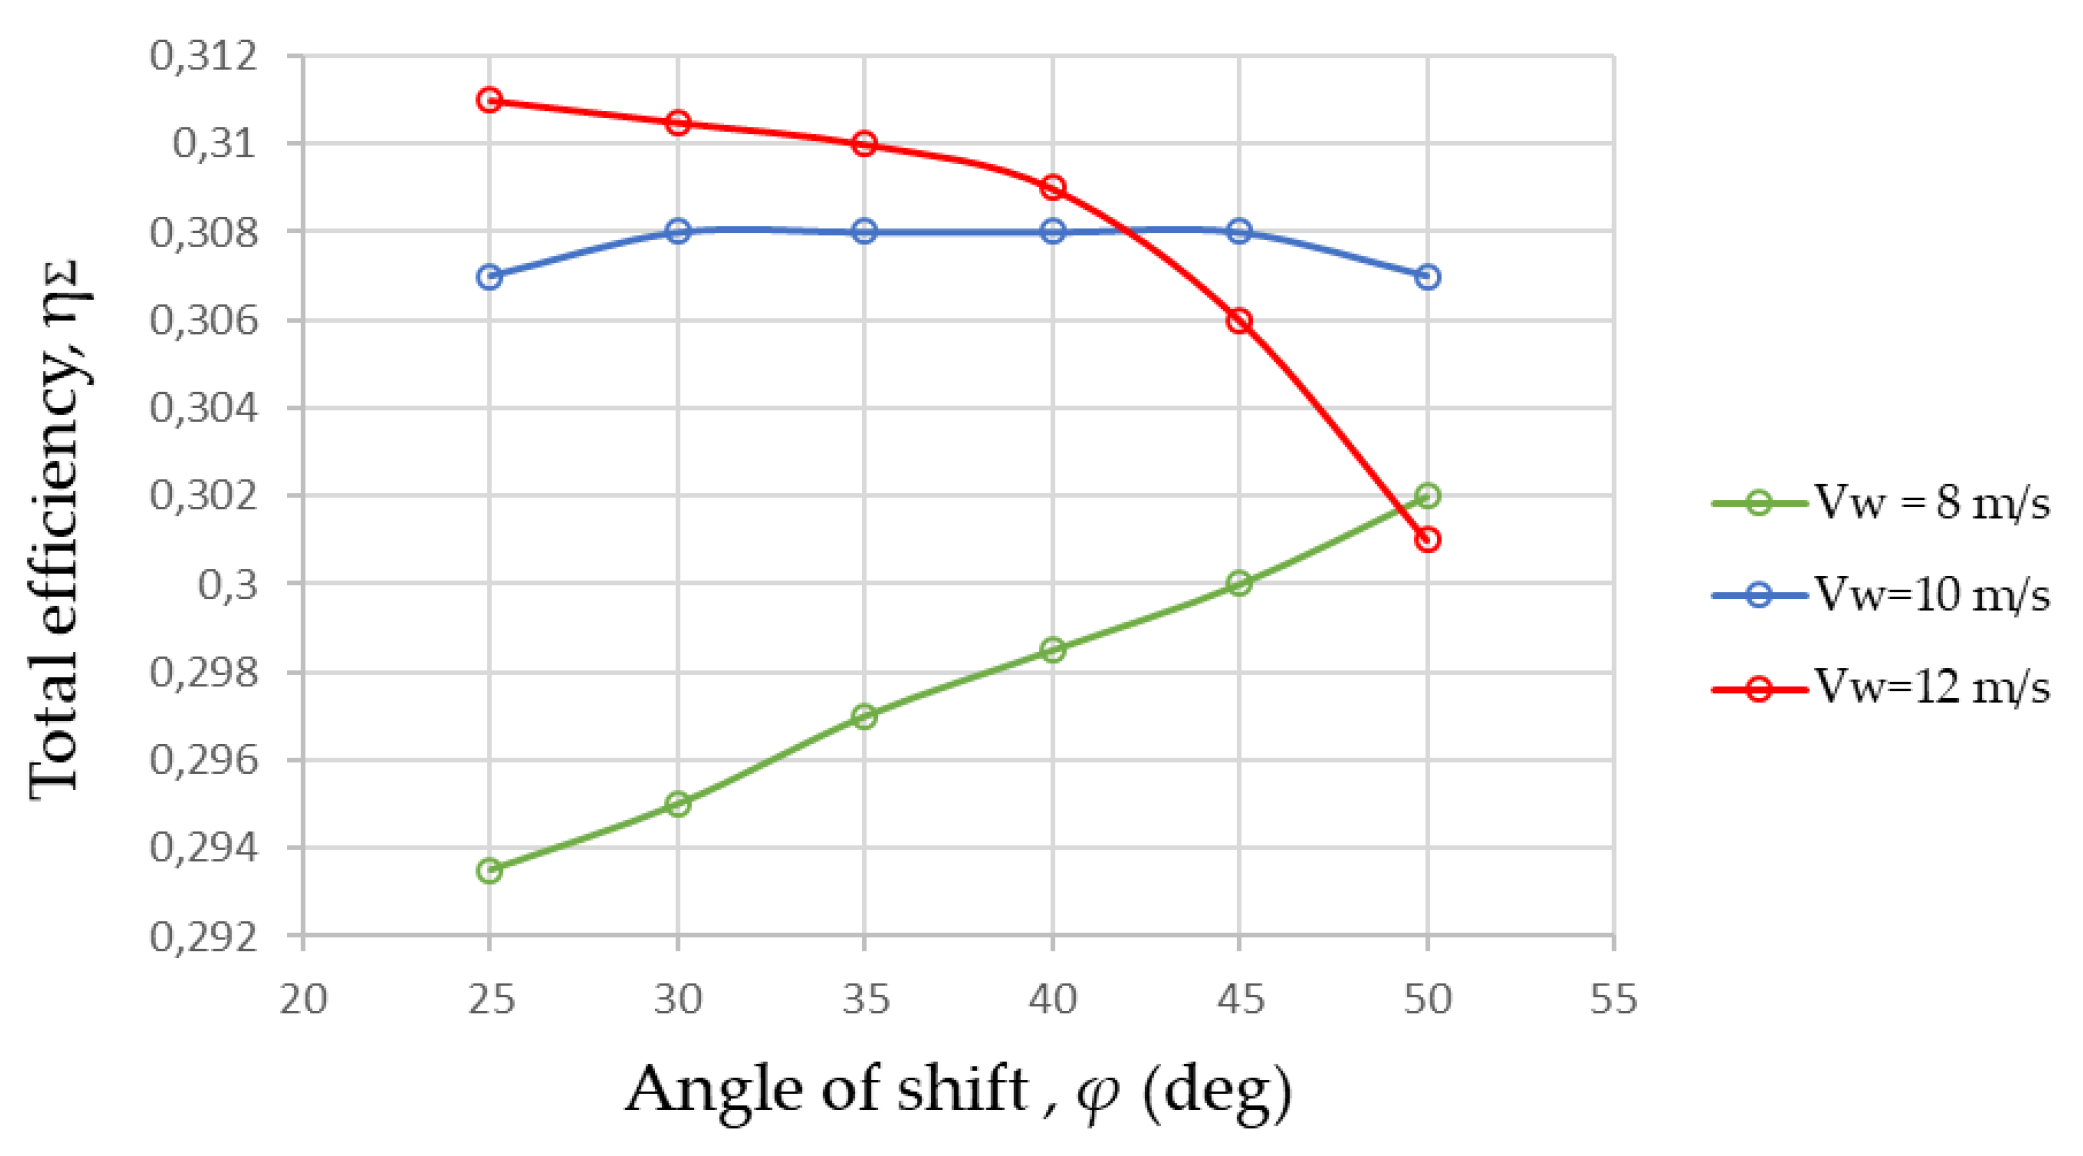
Regarding the change of Lii for PMSG, as can be seen from (50), the following parameters of the generator can be variable: р, ψpm, Ra, Rcn та La. As research has shown, the values of Ra and Rcn at given relative power losses in copper and steel are completely dependent on р and ψpm, which are independent parameters of PMSG. However, taking into account the dependencies (54) and (57), the change in wide ranges of р and ψpm has absolutely no effect on the Lii value obtained from (50) for PMSG that is easy to show analytically. The value of the inductance of the PMSG armature winding La, according to (56), also depends on the parameters р and ψpm. However, as shown above, this does not lead to a change in Lii. Nevertheless, there is another independent parameter in (56) – the shift angle φ between the voltage and current vectors of the generator armature at its nominal angular velocity and nominal load. The conducted studies showed a significant influence of this parameter on the quality of the connection of the studied VAWT and PMSG, as can be seen in Figure 15. It shows how the maximum values of the overall efficiency of the studied WECS change depending on the set value of the nominal shift angle φ between the voltage and current vectors of the PMSG armature at different wind speeds (correspond to the maximum of the curves shown in Figure 14(d)).
Analysis of the results shown in Figure 15, gives the possibility to choose the value φ = 40o as a compromise option. The dependences of the main indicators of the studied WECS obtained for this angle are shown in Figure 16. Based on Figure 16(a), it can be said that at the optimal VAWT angular velocities for each of the studied wind speeds (which are slightly different from those obtained in Figure 14), the values of γ are closer to γopt than in Figure 14(a). It ensures that the overall efficiency of the studied WECS is close to its maximum value (Figure 16(b)). It is almost perfect for Vw = 12 m/s, slightly worse for Vw = 10 m/s, and even worse for Vw = 8 m/s. However, it is a better option for the studied PMSG. An even closer option to the optimal one can be sought by taking a more complex type of PMSG, for example, with hybrid magnetoelectric and electromagnetic excitation [21], in which the parameters can be changed depending on the wind speed, which can be the subject of further research.

6. Conclusions

The application of the linear non-equilibrium thermodynamics approach to the analysis of the energy conversion efficiency in the WECS, which consists of two cascaded devices – VAWT and PMSG, made it possible to reveal new energy aspects of this system and outline ways to improve the efficiency of the entire complex. To the author's knowledge, it's the first time, that VAWT and PMSG were mathematically described as linear ECs with the possibility of linearizing them at the operating points in a given range of common angular velocity. Further application of the universal description of these ECs by a system of dimensionless parameters and characteristics made it possible to determine the connection coefficients between the input and output of these devices, to select the parameters of their optimal operating points according to the specified criteria, and to evaluate their efficiency indicators. The obtained models of VAWT and PMSG as linearized ECs will be used in the future for study of other power-generating complexes.
The method of universal description of the EC in the direction of assessing the regularities of the cascade connection of two ECs has received further development, which makes it possible to determine the quality indicator of a specific connection and its influence on the performance indicators of the obtained equivalent cascaded EC. Analysis of the connection quality of the studied VAWT and PMSG showed that there are reserves in increasing the efficiency of the studied WECS built on their basis. In particular, the study of the effect on the quality of this connection of the given shift angle between the voltage and current vectors of the generator in the nominal mode made it possible to justify the optimal value of this angle, equal to 40o. This value provides the best approximation to the optimal connection of the investigated ECs in the entire range of wind speeds, especially in medium and high winds.

Author Contributions

Conceptualization, I.S. and M.L.; methodology, I.S. and Y.B.; software, I.S. and Y.B.; validation, M.L.; formal analysis, I.S. and M.L.; investigation, I.S. and Y.B.; resources, I.S.; data curation, Y.B.; writing—original draft preparation, I.S. and Y.B.; writing—review and editing, I.S. and M.L.; visualization, Y.B.; supervision, I.S. and M.L.; project administration, I.S. and M.L.; funding acquisition, M.L. All authors have read and agreed to the published version of the manuscript.

Funding

This research received no external funding.

Data Availability Statement

Not applicable.

Conflicts of Interest

The authors declare no conflict of interest.

References

  1. Turns, S.R.; Pauley, L.L. Thermodynamics: Concepts and Applications, 2nd ed., Cambridge University Press: Cambridge, UK, 2020; 854 p.
  2. Demirel, Y. Nonequilibrium Thermodynamics: Transport and Rate Processes in Physical, Chemical and Biological Systems, 2nd ed., Elsevier Science & Technology Books: Amsterdam, Netherlands, 2007; 754p.
  3. Christen, T. Efficiency and Power in Energy Conversion and Storage: Basic Physical Concepts, CRC Press. Taylor & Francis Group: Boca Raton, USA, 2018; 178p. https://doi.org/10.1201/9780429454288. [CrossRef]
  4. Kleidon, A. Working at the limit: A review of thermodynamics and optimality of the Earth system. Preprint. Discussion started: 22 August 2022. https://doi.org/10.5194/esd-2022-38. [CrossRef]
  5. Perera, S.M.H.D.; Putrus, G.; Conlon, M.; Narayana, M.; Sunderland, K. Wind energy harvesting and conversion systems: A technical review. Energies 2022, 15, 9299. https://doi.org/10.3390/en15249299. [CrossRef]
  6. Zhang, Y.; Yang, K.; Li, X.; Xu, J. Thermodynamic analysis of energy conversion and transfer in hybrid system consisting of wind turbine and advanced adiabatic compressed air energy storage. Energy 2014, 77, 460-477. https://doi.org/10.1016/j.energy.2014.09.030. [CrossRef]
  7. Koschwitz, P.; Bellotti, D.; Sanz, M.C.; Alcaide-Moreno, A.; Liang, C.; Epple, B. Dynamic parameter simulations for a novel small-scale power-to-ammoniac. Processes 2023, 11, 680. https://doi.org/10.3390/pr11030680. [CrossRef]
  8. Vosough, A.; Vosough, S. Different kind of renewable energy and exergy concept. Int. J. Multidisciplinary Sciences and Engineering 2011, 2(9), 1-7.
  9. Sahin, A.D.; Dincer, I.; Rosen, M.A. Thermodynamic analysis of wind energy. Int. J. Energy Res. 2006, 30, 553–566. https://doi.org/10.1002/er.1163. [CrossRef]
  10. Kocer, A.A.; Yuksel, Y.E.; Ozturk, M. Thermodynamic and environmental assessment of a wind turbine system. In Proceedings of the 5th International Symposium of Sustainable Development, Sarajevo, Bosnia and Herzegovina, 15-18 May, 2014; pp. 219-228.
  11. Hu, W.; Liu, Z.; Tan, J. Thermodynamic analysis of wind energy systems. In Wind Solar Hybrid Renewable Energy System; Kenneth, O.E.; Tahour, A.; Aissaou, A.G.; IntechOpen: London, UK, 2019; pp. 1-19. http://doi.org/10.5772/intechopen.85067. [CrossRef]
  12. Westerhoff, H.V.; van Dam, K. Thermodynamics and Control of Biological Free-Energy Transduction. Elsevier: Amsterdam, The Netherlands, 1987; 298 p. https://doi.org/10.15490/fairdomhub.1.datafile.4954.1. [CrossRef]
  13. Shchur, I.; Rusek, A.; Lis, M. Optimal frequency control of the induction electric drive based on the thermodynamics of irreversible processes. Electrotechnic and Computer Systems 2011, 3(79), 377-380. https://eltecs.op.edu.ua/index.php/journal/article/view/751.
  14. Kondepudi, D.; Prigogine, I. Modern Thermodynamics: From Heat Engines to Dissipative Structures, 2nd ed.; John Wiley & Sons: NY, USA, 2015; 560 p. https://doi.org/10.1002/9781118698723.fmatter. [CrossRef]
  15. Li, Y.; Zheng, Y.; Zhao, S.; Feng, F.; Li, J.; Wang, N.; Bai, R. A review on aerodynamic characteristics of straight-bladed vertical axis wind turbine. Acta Aerodynamica Sinica 2017, 35(3), 368-382. https://doi.org/10.7638/kqdlxxb-2016.0189. [CrossRef]
  16. Krause, P.; Wasynczuk, O.; Sudhoff, S.; Pekarek, S. Analysis of Electric Machinery and Drive Systems, 3rd ed. Wiley: Hoboken NJ, USA, 2013; 688 p. https://doi.org/10.1002/9781118524336. [CrossRef]
  17. Majout, B.; El Alami, H.; Salime, H.; Zine Laabidine, N.; El Mourabit, Y.; Motahhir, S.; Bouderbala, M.; Karim, M.; Bossoufi, B. A review on popular control applications in wind energy conversion system based on permanent magnet generator PMSG. Energies 2022, 15, 6238. https://doi.org/10.3390/en15176238. [CrossRef]
  18. Shchur, I.; Rusek, A.; Biletskyi, Y. Energy-shaping optimal load control of PMSG in a stand-alone wind turbine as a port-controlled Hamiltonian system. Przegląd Elektrotechniczny (Electrical Review) 2014, 5, 50-55. http://dx.doi.org/10.12915/pe.2014.05.10. [CrossRef]
  19. Torki, W.; Grouz, F.; Sbita, L. Vector control of a PMSG direct-drive wind turbine. In Proceedings of 2017 International Conference on Green Energy Conversion Systems (GECS), Hammamet, Tunisia, 23-25 March 2017; pp. 1-6. https://doi.org/10.1109/GECS.2017.8066247. [CrossRef]
  20. Fernandez-Bernal, F.; García-Cerrada, A.; Faure, R. Determination of parameters in interior permanent-magnet synchronous motors with iron losses without torque measurement. IEEE Trans. Ind. Appl. 2001, 37(5), 1265-1272. http://dx.doi.org/10.1109/28.952501. [CrossRef]
  21. Golovko, V.M.; Ostroverkhov, M.Y.; Kovalenko, M.A.; Kovalenko, I.Y.; Tsyplenkov, D.V. Mathematical simulation of autonomous wind electric installation with magnetoelectric generator. Naukovyi Visnyk Natsionalnoho Hirnychoho Universytetuthis 2022, 5, 74–79. https://doi.org/10.33271/nvngu/2022-5/074. [CrossRef]
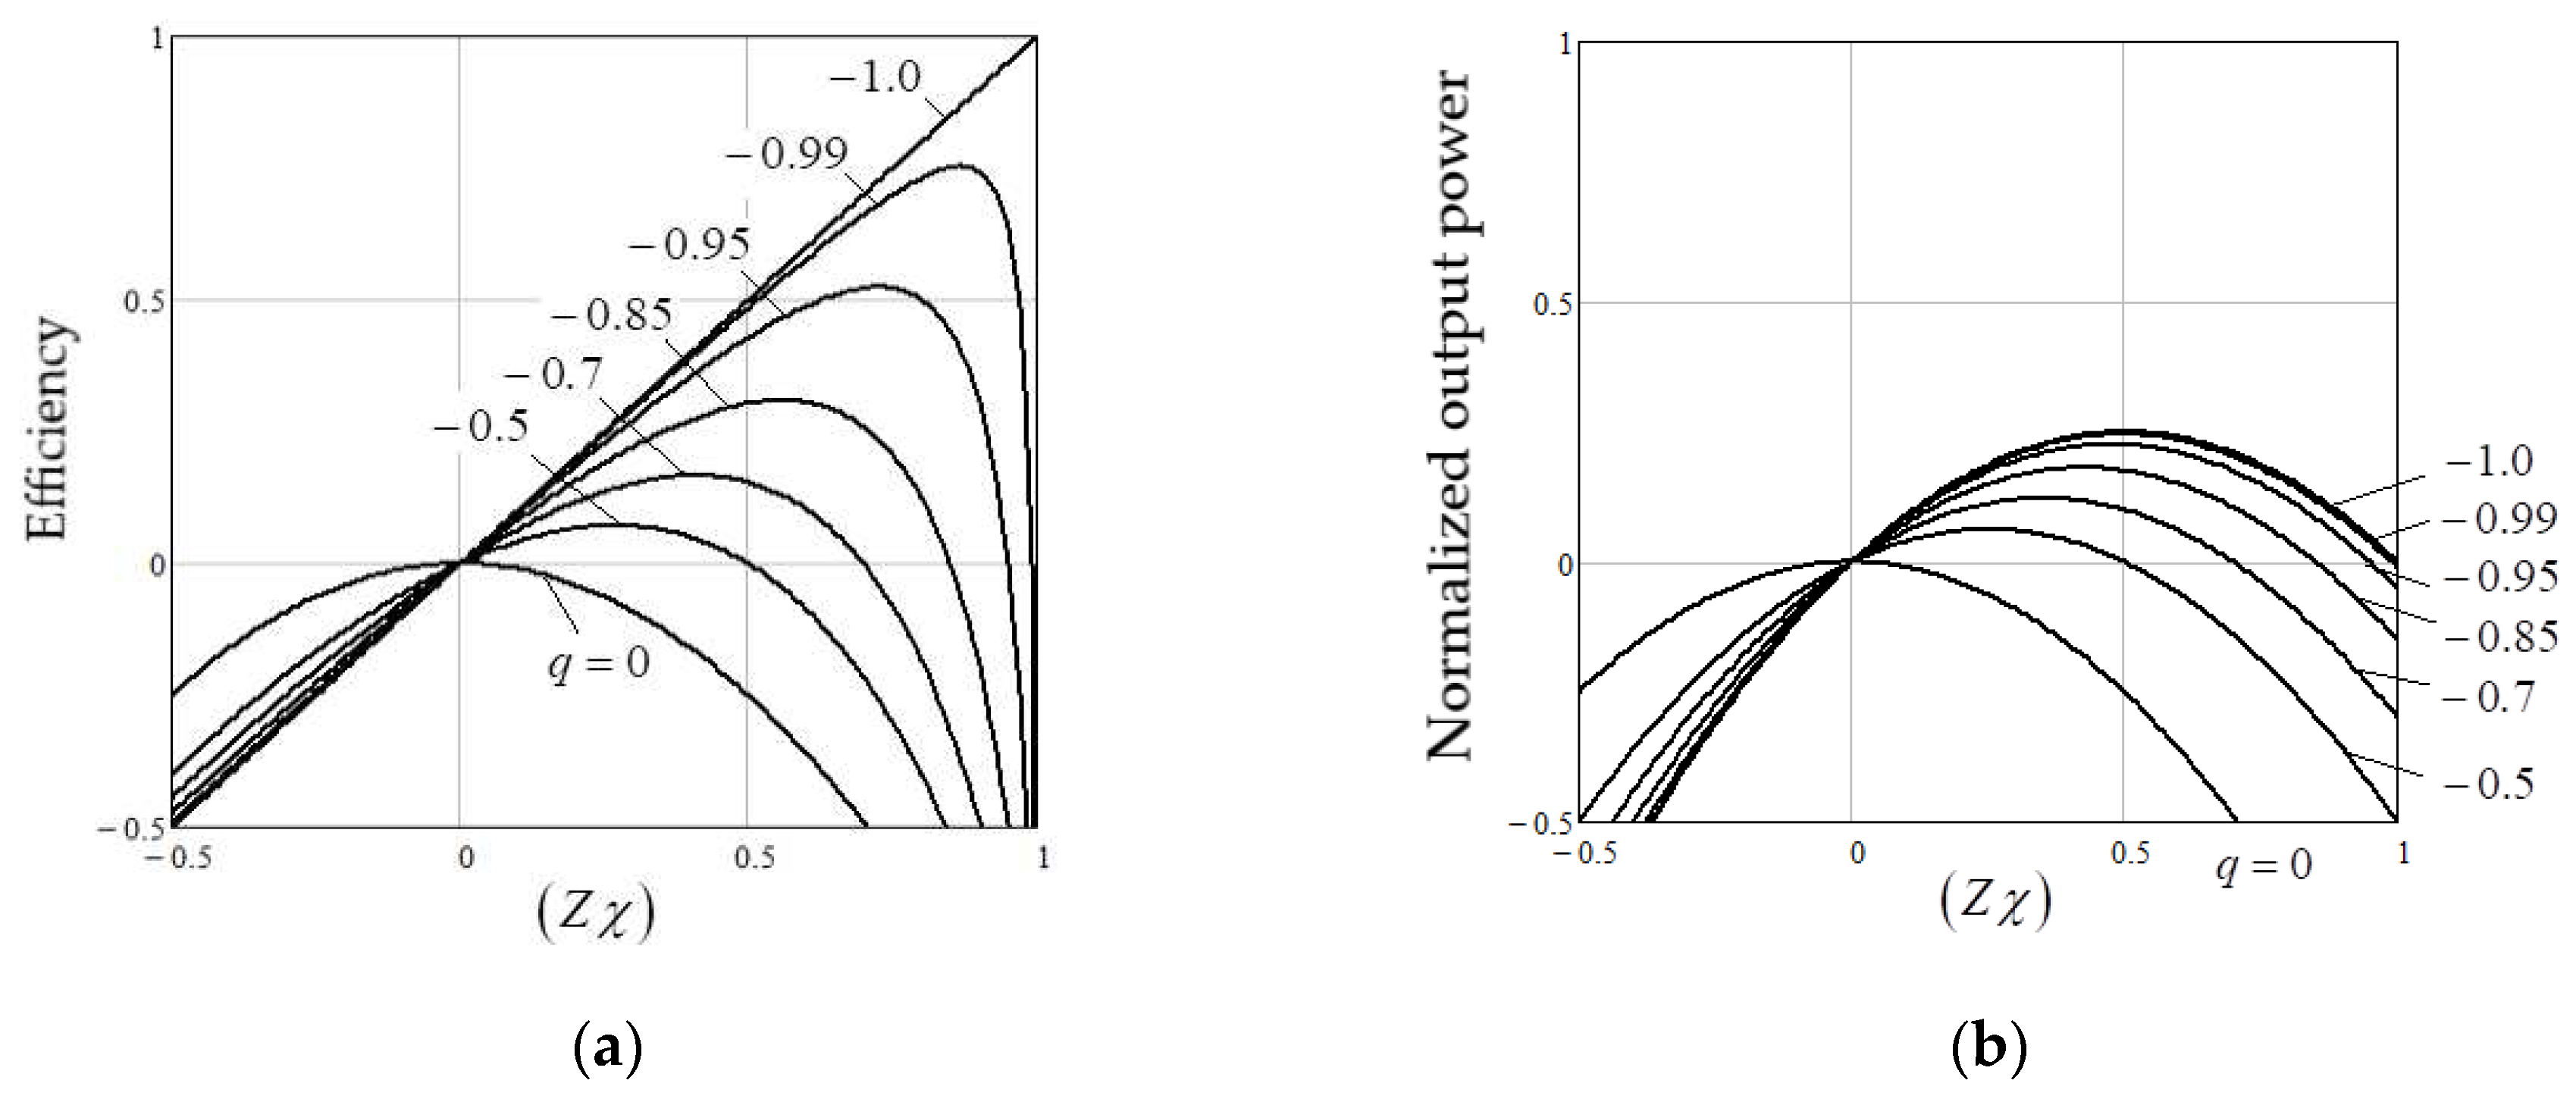
Figure 1. Dependencies of efficiency (a) and normalized output power (b) on the reduced force ratio at different degrees of coupling q.
Preprints 76018 g001
Figure 2. Dependencies of the degree of coupling for an equivalent EC on the connection coefficient of two ECs at given values of the degrees of coupling of EC 1 ( q 1 = 0.95 ) and EC 2 ( q 2 = 0.86...0.98 ).
Preprints 76018 g002
Figure 3. View of the T WT ( ω ) characteristic with its linearization at the point of optimal WT operation.
Preprints 76018 g003
Figure 4. Power coefficient vs TSR for the studied VAWT.
Preprints 76018 g004
Figure 5. VAWT torque vs its angular velocity at different wind speed.
Preprints 76018 g005
Figure 6. Dependencies р ( Z χ ) and η ( Z χ ) , obtained for the experimental VAWT as a EC linearized at the point of optimal operation of the VAWT.
Preprints 76018 g006
Figure 7. Dependences of the output power of the studied VAWT on its angular velocity at different wind speeds.
Preprints 76018 g007
Figure 8. Dependencies of the main parameters of ECs that simulate the operation of the studied VAWT at different wind speeds on the angular velocity of the VAWT: (a) the degree of coupling q, (b) the reduced force ratio ( Z χ ) .
Preprints 76018 g008
Figure 9. PMSG replacement scheme taking into account losses in steel.
Preprints 76018 g009
Figure 10. Vector diagram of a vector-controlled synchronous machine with permanent magnets placed on the surface of the rotor.
Preprints 76018 g010
Figure 11. Dependences of the main parameters of PMSG as EC on its angular velocity: (a) degree of coupling, (b) reduced force ratio, (c) efficiency.
Preprints 76018 g011
Figure 12. Dependencies of the PMSG armature current projections on the angular velocity of the VAWT with a generator at different values of the wind speed.
Preprints 76018 g012
Figure 13. Dependencies of the reduced force ratio (a) and efficiency (b) of the PMSG driven by the studied VAWT on the angular velocity.
Preprints 76018 g013
Figure 14. Dependencies of the main indicators of the experimental WECS as a cascade EC on the angular velocity of the VAWT with PMSG at different wind speeds: (a) the connection coefficient between two ECs, (b) total degree of coupling, (c) reduced force ratio, (d) efficiency.
Preprints 76018 g014
Figure 15. Dependencies of the overall efficiency of the studied WECS on the given value of the nominal shift angle φ between the voltage and current vectors of the PMSG armature at different wind speeds.
Preprints 76018 g015
Figure 16. Dependencies of the main indicators of the studied WECS on the angular velocity of the VAWT – PMSG complex with the optimally chosen nominal value of the angle φ at different wind speeds: (a) the connection coefficient between two ECs, (b) efficiency.
Preprints 76018 g016
Table 1. Parameters of VAWT.
Parameters Value
Rated power, PWT.n (kW) 10
Rated wind speed, Vw (m/s) 12
Maximum of power coefficient, Cp.max 0.3661
Optimum value of TSR, λopt 3.873
Rotor radius, R (m) 2.65
Rotor high, H (m) 1.25
Air density, ρ (kg/m3) 4.78
Table 2. Parameters of the experimental PMSG.
Parameters Value
Rated power, PG.n (kW) 10
Rated angular velocity, ωG.n (s-1) 17.54
Rated torque, TG.n (Nm) 570.2
Number of pole pairs, p 24
PM flux linkage, ψpm (Wb) 0.41
Relative losses in copper, δCu 0.07
Relative losses in steel, δFe 0.03
Angle of shift between armature voltage and current, φ (deg) 30
Winding resistance, Ra (Ω) 0.286
Winding inductance, La (mH) 6.1
Rated equivalent iron loss resistance, Rc.n (Ω) 84.4
Disclaimer/Publisher’s Note: The statements, opinions and data contained in all publications are solely those of the individual author(s) and contributor(s) and not of MDPI and/or the editor(s). MDPI and/or the editor(s) disclaim responsibility for any injury to people or property resulting from any ideas, methods, instructions or products referred to in the content.
Copyright: This open access article is published under a Creative Commons CC BY 4.0 license, which permit the free download, distribution, and reuse, provided that the author and preprint are cited in any reuse.
Prerpints.org logo

Preprints.org is a free preprint server supported by MDPI in Basel, Switzerland.

Subscribe

© 2024 MDPI (Basel, Switzerland) unless otherwise stated