Submitted:
31 May 2023
Posted:
31 May 2023
You are already at the latest version
Abstract
N-acetyl-L-cysteine (NAC), a sulfhydryl-containing compound, is mainly used as a mucolytic and as an antidote for acetaminophen overdose. Flow injection and sequential injection systems were designed and optimized with the aim of providing precise, accurate and reliable flow methods for NAC determination in pharmaceuticals with very low sample and reagent consumption. Proposed methods are based on a redox reaction wherein NAC reduces a complex of Cu(II) and bathocuproine disulfonate (BCS) to orange [Cu(BCS)2]3– complex, which absorption was measured at λmax = 483 nm. The optimized FIA and SIA configuration yielded a linear calibration curve with correlation coefficients (R2 = 0.9999 and R2 = 0.9996) in the concentration range of 3.0 × 10⁻⁷ – 3.0 × 10⁻⁵ mol L–1 and analytical frequency of 120 h–1 for the FIA method and 4.0 × 10⁻⁷ – 4.0 × 10⁻⁵ mol L–1, at sampling rate 60 h–1 for the SIA method. The proposed flow methods were successfully applied for the determination of NAC in pharmaceutical products, as the results showed good agreement with the standard method prescribed by Pharmacopoeia. Recoveries were in the range from 98.4% to 101.9% for the FIA method and from 97.2% to 101.8% for the SIA method.
Keywords:
N-acetyl-L-cysteine
; flow injection analysis
; sequential injection analysis
; spectrophotometric determination
; pharmaceuticals
1. Introduction
N-acetyl L-cysteine (NAC) is an acetylated form of the amino acid L-cysteine. It is a very important antioxidant thiol compound with small molecular weight. NAC is employed as a mucolytic agent commonly used to reduce sputum viscosity in chronic asthma and bronchitis and reduce the viscosity of ophthalmic secretions [1]. It was originally patented in 1960, and its use in medicine was first reported in 1967 [2]. Clinically it has been used in cystic fibrosis since 1969 [3]. Since then, NAC use has been expanded to acetaminophen overdose and lung disease, and its role has been expanding [4]. Due to its pharmaceutical and clinical importance, there is a need to develop fast and sensitive methods for the determination of NAC, particularly in drug analysis. British Pharmacopeia recommends iodimetric titration for the determination of NAC in pharmaceuticals as a standard method [5].
Analytical quality is a key factor in the success of programs for development, production and quality control of pharmaceuticals. In recent years the regulations related to the quality control of medicines required by international pharmacopoeias have become strict, demanding modern pharmaceutical analysis rapid, reliable and economic results [6]. Since the first paper on flow injection analysis (FIA) appeared in 1975 [7], FIA has proven to be a powerful instrumental tool and advanced analytical method in drug analysis. The advantages of this technique are mainly its simplicity, cost performance, high through capacities and flexibility [8]. Sequential injection analysis (SIA), the second-generation flow-based system, shares similarities with FIA [9]. However, the reduction of sample and reagent consumption is a significant SIA advantage, which reduces costs, especially when dealing with high-cost chemicals or hazardous reagents.
Flow analysis methods for the determination of NAC in pharmaceuticals, using different detectors, are listed, and compared in Table 1.
Compared to spectrophotometric detection, FIA and SIA in conjunction (tandem) with other detectors, especially chemiluminescence and fluorimetry, allow low sampling frequency, higher detection limits, and a narrower Beer’s Law range for the determination of NAC. From the analytical parameter data listed, it is apparent that both the FIA and SIA spectrophotometric methods enable the analysis of a significantly larger number of samples with a broader concentration range for the determination of NAC.
The methods listed in Table 1 are based on redox reactions and/or combined redox and complexometric reactions. The trend for new flow methods is to reduce the consumption of analyte and reagent and thus reduce the production of waste while keeping the sampling rate high.
The main objective of the present work is to develop and validate new flow methods for the determination of NAC in pharmaceutical formulations that meet laboratory quality control requirements. Based on a one-step colourimetric redox reaction using Cu(II) and BCS reagents in Britton Robinson buffer at pH 3.0 [25], both the FIA and SIA methods are characterised by their simplicity, versatility, low sample and reagent consumption and robustness. The ease of use is particularly justified in developing an automated (SIA) methodology for determining NAC in pharmaceutical formulations.
2. Results and Discussion
The development of the orange colour in the visible part of the spectrum, is based on a one step redox reaction in which NAC reduces [Cu(BCS)2]2– complex to [Cu(BCS)2]3– complex and the absorbance is measured at 483 nm [25].
During the development of the method, the chemical parameters and the parameters of the flow system were optimized using a univariate method.
2.1. Optimization of the chemical parameters
Preliminary FIA and SIA studies included optimization of chemical parameters: pH value and reagent molar ratio.
The effect of pH value was observed in both flow systems in the range of 2.0 to 8.0 using the Britton Robinson buffer (acetate-borate-phosphate buffer). The maximum signal was reached at a pH of 3.0. No significant increase in signal was observed at higher pH values. Since NAC is a thiol compound, it is more stable in an acidic medium, it showed the highest stability at lower pH values. Therefore, a pH value of 3.0 was chosen as the optimal value for further measurements.
The optimization of the molar ratio of BCS and Cu2+ was performed in such a way that the concentration of Cu2+ was kept constant and the concentration of BCS was changed. The molar ratio of BCS and Cu2+ varied in the range of 1:1 to 3:1. The results in the FIA system showed that the signal changed slightly at higher ratios, so 1:1 was selected as optimal. In the SIA system, the results showed that as the molar ratio increased, the absorbance also increased and reached a maximum when the molar ratio of BCS and Cu2+ was 2:1.
Based on previous kinetic measurements, the proposed redox reaction was found to be temperature independent. Therefore, for practical reasons (no need for termostating the flow systems), a room temperature of 25° C was chosen for this experiment.
2.2. Optimization of the FIA and SIA systems parameters
2.2.1. Optimization of the FIA system parameters
The optimal carrier flow rate selection determines the frequency of measurements, as it controls the quality of the formed product, which affects the sensitivity and sampling rate. The effect of the carrier flow rate in the FIA system on signal height was investigated in the range of 1000 to 6000 µL min‒1 using a peristaltic pump. 6000 µL min‒1 was chosen as the optimal value due to signal stability and satisfactory return to baseline. Although the maximum flow rate was chosen, the sensitivity of the method was not affected.
The effect of the flow rate of the reagent solution on signal height in the FIA system was examined in the range of 2.0 to 6.0 mL min‒1 using pump tubes of different internal diameters. The highest and most stable signal was obtained with a reagent flow rate of 2.0 mL min‒1 which was selected as the optimal value considering low reagent consumption.
Optimization of the injected sample volume in the FIA system was performed using sample injection valve loops with different volumes (from 100 to 1000 μL). As the injection volume increases up to 500 μL, the signal height increases and thus the sensitivity of the method increases. Consequently, the width of the peaks in the baseline also increases, which affects the frequency of the analyses since it takes more time to return to the baseline. Therefore, 500 μL was chosen as the optimal volume as a compromise between the sensitivity of the method and the frequency of analyses.
The effect of the reaction coil length was studied in the range of 30 to 400 cm for the FIA system. In order not to compromise the completeness of the chemical reaction and the stability of the signal, the reaction coil length of 50 cm for the FIA system was selected.
2.2.2. Optimization of the SIA system parameters
Optimization of the aspiration sequence in the SIA system was examined using the aspiration order of sample and reagent solutions into the holding coil. Two measurements were performed. In the first one, the reagent solution was injected into the holding coil, followed by the analyte; in the other, the aspiration order was reversed. The sequence in which the reagent solution was aspirated first and then the NAC solution showed the highest absorbance and the best precision. This order of injection was maintained for further measurements.
Flow rates ranging from 1000 µL min–1 to 8000 µL min–1 were investigated using the syringe-free pump in the SIA system. A 6000 µL min–1 flow rate of carrier flow was selected, as a compromise between time and reagent consumption, frequency, and sensitivity. At this flow rate, maximum absorbance was recorded with an acceptable peak width and return to baseline.
The aspirated volumes of reagent and sample (analyte) used for the optimization of the SIA system ranged from 50 µL to 450 µL. After measurement, the optimal reagent volume was set at 200 µL. Further increase of volume did not increase the analytical signal but it increased the amount of waste. Increasing the aspiration of sample volume up to 250 µL, the analytical signal increased and higher volumes had an insignificant effect. Higher volumes also decreased the frequency and required a longer runtime so the sample volume of 250 µL was chosen for subsequent studies as a compromise between the sensitivity of the method and the frequency of analyses.
Since the reaction in the SIA system starts in the holding coil, two volumes of holding coils were tested (500 μL and 1000 μL). The 500 μL volume was selected as optimal hence there was no difference in signal height, and the volume of the holding coil is sufficient for the total aspirated volume of sample and reagent. As well, the carrier consumption was lower with better signal repeatability.
The effect of the reaction coil length was studied in the range of 30 to 120 cm for the SIA system. The signal with the highest absorbance and the best repeatability was selected. Thus, the reaction coil length of 30 cm was chosen as the optimal value.
2.3. Analytical characteristics of the proposed flow methods for the determination of NAC
Considering the previously optimized experimental parameters (Table 2), the developed flow methods were used to construct a calibration curve by determining NAC standards in the range of 3.0 × 10⁻⁷ and 1.0 × 10⁻⁴ mol L–1.
The linear range of the calibration curve was determined by plotting the peak height against the NAC concentration.
Linearity was achieved in the concentration range between 3.0 × 10⁻⁷ and 3.0 × 10⁻⁵ mol L–1 for the FIA method and between 4.0 × 10⁻⁷ and 4.0 × 10⁻⁵ mol L–1 for the SIA method (see Figure 1 and 2).
Considerably effective analytical curves with good linearity (R2 = 0.9999 and R2 = 0.9996) were obtained for the FIA and SIA methods, respectively. The limit of detection (LOD) and limit of quantification (LOQ) were calculated (Table 3) according to the following expressions: LOD = 3σ/s and LOQ = 10σ/s, where σ is the standard deviation of ten reagent blank measures and s is the slope of the calibration curve.
The relative standard deviation (RSD) for ten replicate determinations of NAC was 0.61% at 3.0 × 10⁻⁵ mol L–1 by the FIA method. The SIA method also showed high reproducibility with acceptable values of RSD, that was, 2.62% at 4.0 × 10⁻⁵ mol L–1.
2.4. Effect of ions/interferences
The influence of interfering substances on the determination of NAC was investigated using the proposed methods under optimised conditions (Table 4).
To examine the selectivity of the FIA and SIA methods, the samples were analyzed from NAC standard concentrations of 3.0 × 10⁻⁵ mol L–1 and 4.0 × 10⁻⁵ mol L–1 containing substances commonly used in pharmaceutical formulations. The tolerance limit is defined as the molar ratio of NAC to the interfering species that has an error of less than ± 5% when measured. The initial concentrations of substances were tested at a concentration 500 times higher than the concentration of the analyte, except for acetylsalicylic acid, which was prepared at the same concentration as the analyte. For the substance that showed an error greater than ± 5%, the measurements were repeated in lower concentrations of interfering species, that is, in a smaller ratio according to the analysis. It should be noted that the concentrations of interfering substances were much higher than those in commercial pharmaceutical preparations.
2.5. Accuracy and analytical application
The proposed FIA and SIA methods have been applied for the determination of NAC concentrations in different pharmaceutical products. Recoveries were in the range from 98.4% to 101.9% for the FIA method and from 97.2% to 101.8% for the SIA method. (Table 5).
The results indicated the acceptable accuracy of the flow methods and confirmed that the developed flow methods are reliable for the determination of NAC in pharmaceutical preparations.
Finally, the optimized and evaluated methods were used for the determination of NAC in the pharmaceutical formulations and the results were compared with the standard method according to the Pharmacopoeia [5].
The results depicted in Table 6 showed a very good agreement between the results of measurements developed by the flow and sequential injection methods with a spectrophotometric detector and the results of the iodometric titration prescribed by Pharmacopoeia.
2.6. Comparison between the developed FIA and SIA methods for the determination of NAC
The two present methods, FIA and SIA, allow rapid, simple and inexpensive analytical determination of NAC in pharmaceutical products. Since they are coupled with a spectrophotometric detector, they are accessible to most laboratories.
An analytical comparison between the developed FIA and SIA methods for the determination of NAC (Table 3) shows that the sensitivity and reproducibility of analysis were higher for the FIA method (LOD = 9 × 10⁻⁸ mol L–1; RSD = 0.61%), as was the sampling rate (120 h–1). For the SIA method, there is a reduction in the sampling rate (60 h–1) because the time required for the analysis of a given sample is not only the time needed for the reaction and the measurement but also the time spent for the aspiration of the sample and reagent solutions. This is the main limitation (SIA) related to the FIA technique. On the other hand, the application of the SIA method significantly reduces sample consumption, more precisely, the consumption per sample is twice as low (Table 3).
Another advantage of the automated SIA method for the determination of NAC presented here is the reagent consumption reduced to 600 µl per sample, analysed in triplicate. In comparison, the FIA method consumed 6000 µl of reagent. Thus, the developed FIA analysis and classical iodometric titration [5] consume 10 and 100 times more reagents, respectively, compared to the SIA method.
However, retaining the benefits of the FIA, the methodology of SIA enables full computerization of the execution of analysis [9].
3. Materials and Methods
3.1. Reagents and Solutions
During this experimental work, Milli-Q (Millipore) double-deionized water was used. All chemicals were of analytical reagent grade.
The stock solution of 0.01 mol L−1 N-acetyl-L-cysteine (NAC) was prepared by dissolving 0.0816 g of NAC (Acros Organics, New Jersey, USA) into Britton-Robinson buffer solution (pH = 2.0) and diluted to 50.0 mL volume. The prepared stock solution was stable for at least 30 days and stored at 4 °C in a dark bottle. Working standards of lower concentration were prepared daily, diluting the above-mentioned stock solutions with Britton-Robinson buffer solution (pH = 3.0).
A stock solution of 0.001 mol L−1 Cu(II) was prepared by dissolving 0.0125 g of copper sulphate pentahydrate (Kemika, Zagreb, Croatia) in deionized water and diluting to the mark in a 50.0 mL standard flask.
0.002 mol L−1 bathocuproine disulfonate solution (BCS) was prepared by dissolving 0.0564 g of disodium salt (Sigma – Aldrich, Germany) up to 50.0 mL volume with deionized water.
The Britton-Robinson buffer solution (0.04 mol L–1, pH = 2.0) was prepared by dissolving 4.95 g of boric acid, mixing with 4.80 g of glacial acetic acid and 5.46 g of phosphoric acid and diluting with deionized water up to 2.0 L. pH values were adjusted using 2.0 mol L–1 sodium hydroxide solution. pH adjustments and measurements were carried out with a Mettler Toledo SevenMulti potentiometer (Mettler Toledo, Schwerzenbach, Switzerland) equipped with a combined glass electrode Mettler Toledo InLab®413.
Commercially available pharmaceutical products in the form of granules and tablets were selected and analyzed in this work: Fluimukan Junior 100 mg of NAC (Sandoz d.o.o., Zagreb, Hrvatska), Fluimukan 200 mg of NAC (Sandoz d.o.o., Zagreb, Hrvatska) and Naxil Forte 600 mg of NAC (Belupo d.d., Koprivnica, Hrvatska). Three tablets of solid preparations were weighed, thoroughly grounded into powder and mixed. Granules and tablets were dissolved and diluted with deionized water to the nominal volume in a 500 mL volumetric flask. The solutions prepared in this way were analyzed within 24 hours and in the given period were found to be stable.
Iodine solutions were prepared and standardized according to the literature for the validation part of the experiment [5].
3.2. Apparatus and procedure
For both FIA and SIA signal detection, a double beam UV-Vis spectrophotometer (Shimadzu UV – 1601, Kyoto, Japan) equipped with a 10 mm optical path flow cell (Hellma, Jamaica, NY) with an inner volume of 160 and 80 µL, respectively, connected to a personal computer equipped with Hyper UV-Vis software, Shimadzu, was used. The fluid transport through the system was provided by flexible PTFE tubing. The absorbance of the reduced orange [Cu(BCS)2]3– complex was measured at the maximum absorption wavelength of 483 nm.
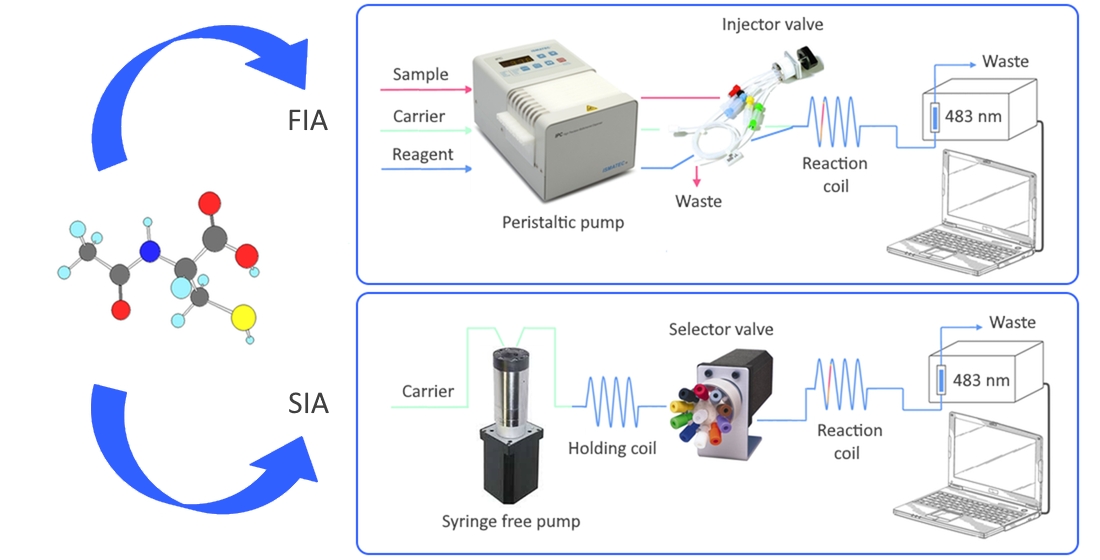
FIA instrumentation is equipped with a peristaltic pump (Ismatec, Zurich, Switzerland) and 6-port rotary valve (Rheodyne, Model 5020, Anachem, Luton, UK) connected to confluence point and reaction coil (Figure 3a). A more detailed description of the FIA manifold was previously reported [9, 20].
SIA instrumentation consists of a bi-directional syringe-free pump Cheminert® M50 (VICI Valco Instruments, Houston, Texas, USA) and a multi-position (10-port) selector valve (VICI Valco Instruments, Houston, Texas, USA) connected to a holding coil (0.5 mm inner diameter) and reaction coil (0.8 mm inner diameter). The SIA system used for the determination of NAC is shown in Figure 3b.
The central inlet of the 10-port valve was connected to a holding coil with an inner diameter of 0.5 and an inner volume of 500 µL. The high-precision syringe-free pump Cheminert® M50 was used to aspirate the samples and reagents. A computer was utilized to control the operation of the components of the SIA system and the commands were entered into the program according to the following procedure:
1. The syringe-free pump was filled using a 6000 μL min–1 flow rate. This step delivered 3000 μL of deionized distilled water at a 6000 μL min–1 flow rate through port 8 of the selector valve. This process was employed to adjust the blank signal of the detector.
2. To load the holding coil, 200 µL of reagent and 250 µL of standard or sample solution were passed through ports 7 and 6, respectively.
3. After the reaction of NAC with the [Cu(BCS)2]2– reagent solution, deionized water entered the syringe-free pump flushing the content of the holding coil at a rate of 6000 µL min–1 through port 8 and the reaction coil, delivering the reaction zone to the detector for absorbance reading. This step also includes flushing the system and signal return to baseline.
4. Steps 1–3 of the procedure were repeated three times (triplicate measurement).
4. Conclusions
The developed and validated flow methods, FIA (non-automated) and SIA (automated), for the determination of N-acetyl-L-cysteine (NAC) are sensitive, accurate, precise and robust, without interferences from a significant number of excipients accompanying commercial pharmaceutical products and without the need for sample pretreatment. In the proposed methods NAC reduces [Cu(BCS)2]2– complex to orange [Cu(BCS)2]3– complex in one step reaction. When comparing two developed flow methods, a time-saving advantage is on the side of the developed FIA system, the sampling rate was twice as high. The low sample and reagent consumption, as well as low waste production in the SIA system, led to a reduction in the cost of analysis. In addition, the SIA method for the determination of NAC was fully automated and required little operator intervention. This proves that the advantages of the SIA method compensate its disadvantages.
The reported flow methods of analysis have been successfully applied for the determination of NAC in pharmaceuticals, with results comparable to those obtained by the standard iodimetric method prescribed in the Pharmacopoeia. Enabling the analysis of a large number of samples with small sample and reagent consumption, both FIA and SIA methods for the determination of NAC are environmentally friendly analytical tools that can be used in quality control laboratories.
Author Contributions
Conceptualization, L.K.M. and D.M.; methodology, L.K.M and M.B..; software, M.B.; validation, L.K.M. and D.M.; formal analysis, M.B., D.K. and D.T.; investigation, L.K.M.; resources, L.K.M. and D.M.; data curation, L.K.M. and M.B.; writing—original draft preparation, M.B., D.K. and D.T.; writing—review and editing, L.K.M. and D.M.; visualization, M.B.; supervision, L.K.M; project administration, L.K.M; funding acquisition, L.K.M. and D.M.. All authors have read and agreed to the published version of the manuscript.
Funding
This research was supported by the Ministry of Science and Education, Republic of Croatia, through the institutional financing of researchers Lea Kukoc Modun and Darko Modun.
Institutional Review Board Statement
Not applicable.
Informed Consent Statement
Not applicable.
Data Availability Statement
The data presented in this study are available on request from the corresponding author.
Conflicts of Interest
Authors declare no conflict of interest.
Sample Availability
Samples of the compound NAC are available from the corresponding author.
References
- Kelly, G.S. Clinical applications of N-acetylcysteine. Altern Med Rev 1998, 3, 114–127. [Google Scholar] [PubMed]
- Lillibridge, C.B.; Docter, J.M.; Eidelman, S. Oral administration of n-acetyl cysteine in the prophylaxis of "meconium ileus equivalent". The Journal of pediatrics 1967, 71, 887–889. [Google Scholar] [CrossRef] [PubMed]
- Gracey, M.; Burke, V.; Anderson, C.M. Treatment of abdominal pain in cystic fibrosis by oral administration of n-acetyl cysteine. Archives of disease in childhood 1969, 44, 404–405. [Google Scholar] [CrossRef] [PubMed]
- Schwalfenberg, G.K. N-Acetylcysteine: A Review of Clinical Usefulness (an Old Drug with New Tricks). Journal of nutrition and metabolism 2021, 2021, 9949453. [Google Scholar] [CrossRef] [PubMed]
- British Pharmacopoeia. Volume I & II 2009, 109-113.
- Pimenta, A.M.; Montenegro, M.C.; Araujo, A.N.; Calatayud, J.M. Application of sequential injection analysis to pharmaceutical analysis. J Pharm Biomed Anal 2006, 40, 16–34. [Google Scholar] [CrossRef]
- Ṙuz̆ic̆ka, J.; Hansen, E.H. Flow injection analyses: Part I. A new concept of fast continuous flow analysis. Analytica Chimica Acta 1975, 78, 145–157. [Google Scholar] [CrossRef]
- Evgen'ev, M.I.; Garmonov, S.Y.; Shakirova, L.S. Flow-Injection Analysis of Pharmaceuticals. J. Anal. Chem. 2001, 56, 313–323. [Google Scholar] [CrossRef]
- Ruzicka, J.; Marshall, G.D. Sequential injection: a new concept for chemical sensors, process analysis and laboratory assays. Analytica Chimica Acta 1990, 237, 329–343. [Google Scholar] [CrossRef]
- Sánchez-pedreño, C.; Albero, M.I.; Garcia, M.S.; Rodenas, V. Determination of N-acetylcysteine in pharmaceutical samples by flow injection. Analyst 1992, 117, 925–928. [Google Scholar] [CrossRef]
- Fornazari, A.L.; Suarez, W.; Vieira, H.; Fatibello-Filho, O. Flow injection spectrophotometric system for N-acetyl-L-cysteine determination in pharmaceuticals. Acta Chimica Slovenica 2005, 52, 164–167. [Google Scholar]
- Suarez, W.T.; Vieira, H.J.; Fatibello-Filho, O. Generation and destruction of unstable reagent in flow injection system: determination of acetylcysteine in pharmaceutical formulations using bromine as reagent. J Pharm Biomed Anal 2005, 37, 771–775. [Google Scholar] [CrossRef] [PubMed]
- Kukoč-Modun, L.; Plazibat, I.; Radić, N. Flow-injection spectrophotometric determination of N-acetyl-L-cysteine based on coupled redox-complexation reaction. Croat. Chem. Acta 2011, 84, 81–86. [Google Scholar] [CrossRef]
- Suarez, W.T.; Pessoa-Neto, O.D.; Janegitz, B.C.; Vieira, H.J.; Faria, R.C.; Fatibello-Filho, O. Flow Injection Spectrophotometric Determination of N-Acetylcysteine and Captopril Employing Prussian Blue Generation Reaction. Analytical Letters 2011, 44, 2394–2405. [Google Scholar] [CrossRef]
- Waseem, A.; Yaqoob, M.; Nabi, A. Flow-injection Determination of Cysteine, N-Acetyl Cysteine and Glutathione in Pharmaceuticals via Potassium Ferricyanide-Fe(III) Spectrophotometric System. Chemical Research in Chinese Universities 2010, 26, 893–898. [Google Scholar]
- Vieira, H.J.; Fatibello-Filho, O. Indirect flow injection determination of N-acetyl-L-cysteine using cerium(IV) and ferroin. Quimica Nova 2005, 28, 797–800. [Google Scholar] [CrossRef]
- Medina Hernandez, M.J.; Garcia Alvarez-Coque, M.C.; Bonet Domingo, E.; Villanueva Camanas, R.M. FIA-spectrophotometric assay of N-acetylcysteine by o-phthalaldehyde derivatization. Die Pharmazie 1990, 45, 745–747. [Google Scholar] [PubMed]
- Suarez, W.T.; Madi, A.A.; Vicentini, F.C.; Fatibello-Filho, O. Flow-Injection Spectrophotometric Determination of N-acetylcysteine in Pharmaceutical Formulations with On-Line Solid-Phase Reactor Containing Zn(II) Phosphate Immobilized in a Polyester Resin. Analytical Letters 2007, 40, 3417–3429. [Google Scholar] [CrossRef]
- Kukoc-Modun, L.; Tsikas, D.; Biocic, M.; Radić, N. Flow injection analysis of N-acetyl-l-cysteine based on the reduction of copper(ii)-neocuproine reagent. Anal. Lett. 2016, 49, 607–617. [Google Scholar] [CrossRef]
- Suarez, W.T.; Vieira, H.J.; Fatibello-Filho, O. Flow injection turbidimetric determination of acetylcysteine in pharmaceutical formulations using silver nitrate as precipitant reagent. J Braz Chem Soc 2007, 18, 1028–1033. [Google Scholar] [CrossRef]
- García, I.L.; Viñas, P.; Gil, J.A.M. FIA titrations of sulphide, cysteine and thiol-containing drugs with chemiluminescent detection. Fresen. J. Anal. Chem. 1993, 345, 723–726. [Google Scholar] [CrossRef]
- Viñas, P.; Garcia, I.L.; Gil, J.A.M. Determination of thiol-containing drugs by chemiluminescence-flow injection analysis. J. Pharm. Biomed. Anal. 1993, 11, 15–20. [Google Scholar] [CrossRef] [PubMed]
- Nantaphol, S.; Chailapakul, O.; Siangproh, W. Ultrasensitive and Simple Method for Determination of N-Acetyl-L-Cysteine in Drug Formulations Using a Diamond Sensor. Electroanalysis 2014, 26, 1024–1030. [Google Scholar] [CrossRef]
- Tzanavaras, P.D.; Karakosta, T.D. Automated tagging of pharmaceutically active thiols under flow conditions using monobromobimane. J Pharm Biomed Anal 2011, 54, 882–885. [Google Scholar] [CrossRef] [PubMed]
- Kukoc-Modun, L.; Kraljevic, T.; Tsikas, D.; Radic, N.; Modun, D. Determination of N-Acetyl-L-cysteine Ethyl Ester (NACET) by Flow Injection Analysis and Spectrophotometric Detection Using Different Thiol-Sensitive Ligands. Molecules 2021, 26, 6826–6834. [Google Scholar] [CrossRef]
Figure 1.
Fiagram and calibration curve for spectrophotometric determination of NAC in the concentration range of 3.0 × 10⁻⁷ mol L–1 to 3.0 × 10⁻⁵ mol L–1. Experimental conditions: c(Cu2+) = 3.2 × 10⁻⁴ mol L–1; c(BCS) = 3.2 × 10⁻⁴ mol L–1; n(BCS) : n(Cu2+) = 1 : 1; t = 25 °C; pH = 5.0; carrier flow rate = 6000 µL min–1; reagent flow rate = 2000 µL min–1; analyte injection volume = 500 μL; length of the reaction coil = 50 cm.
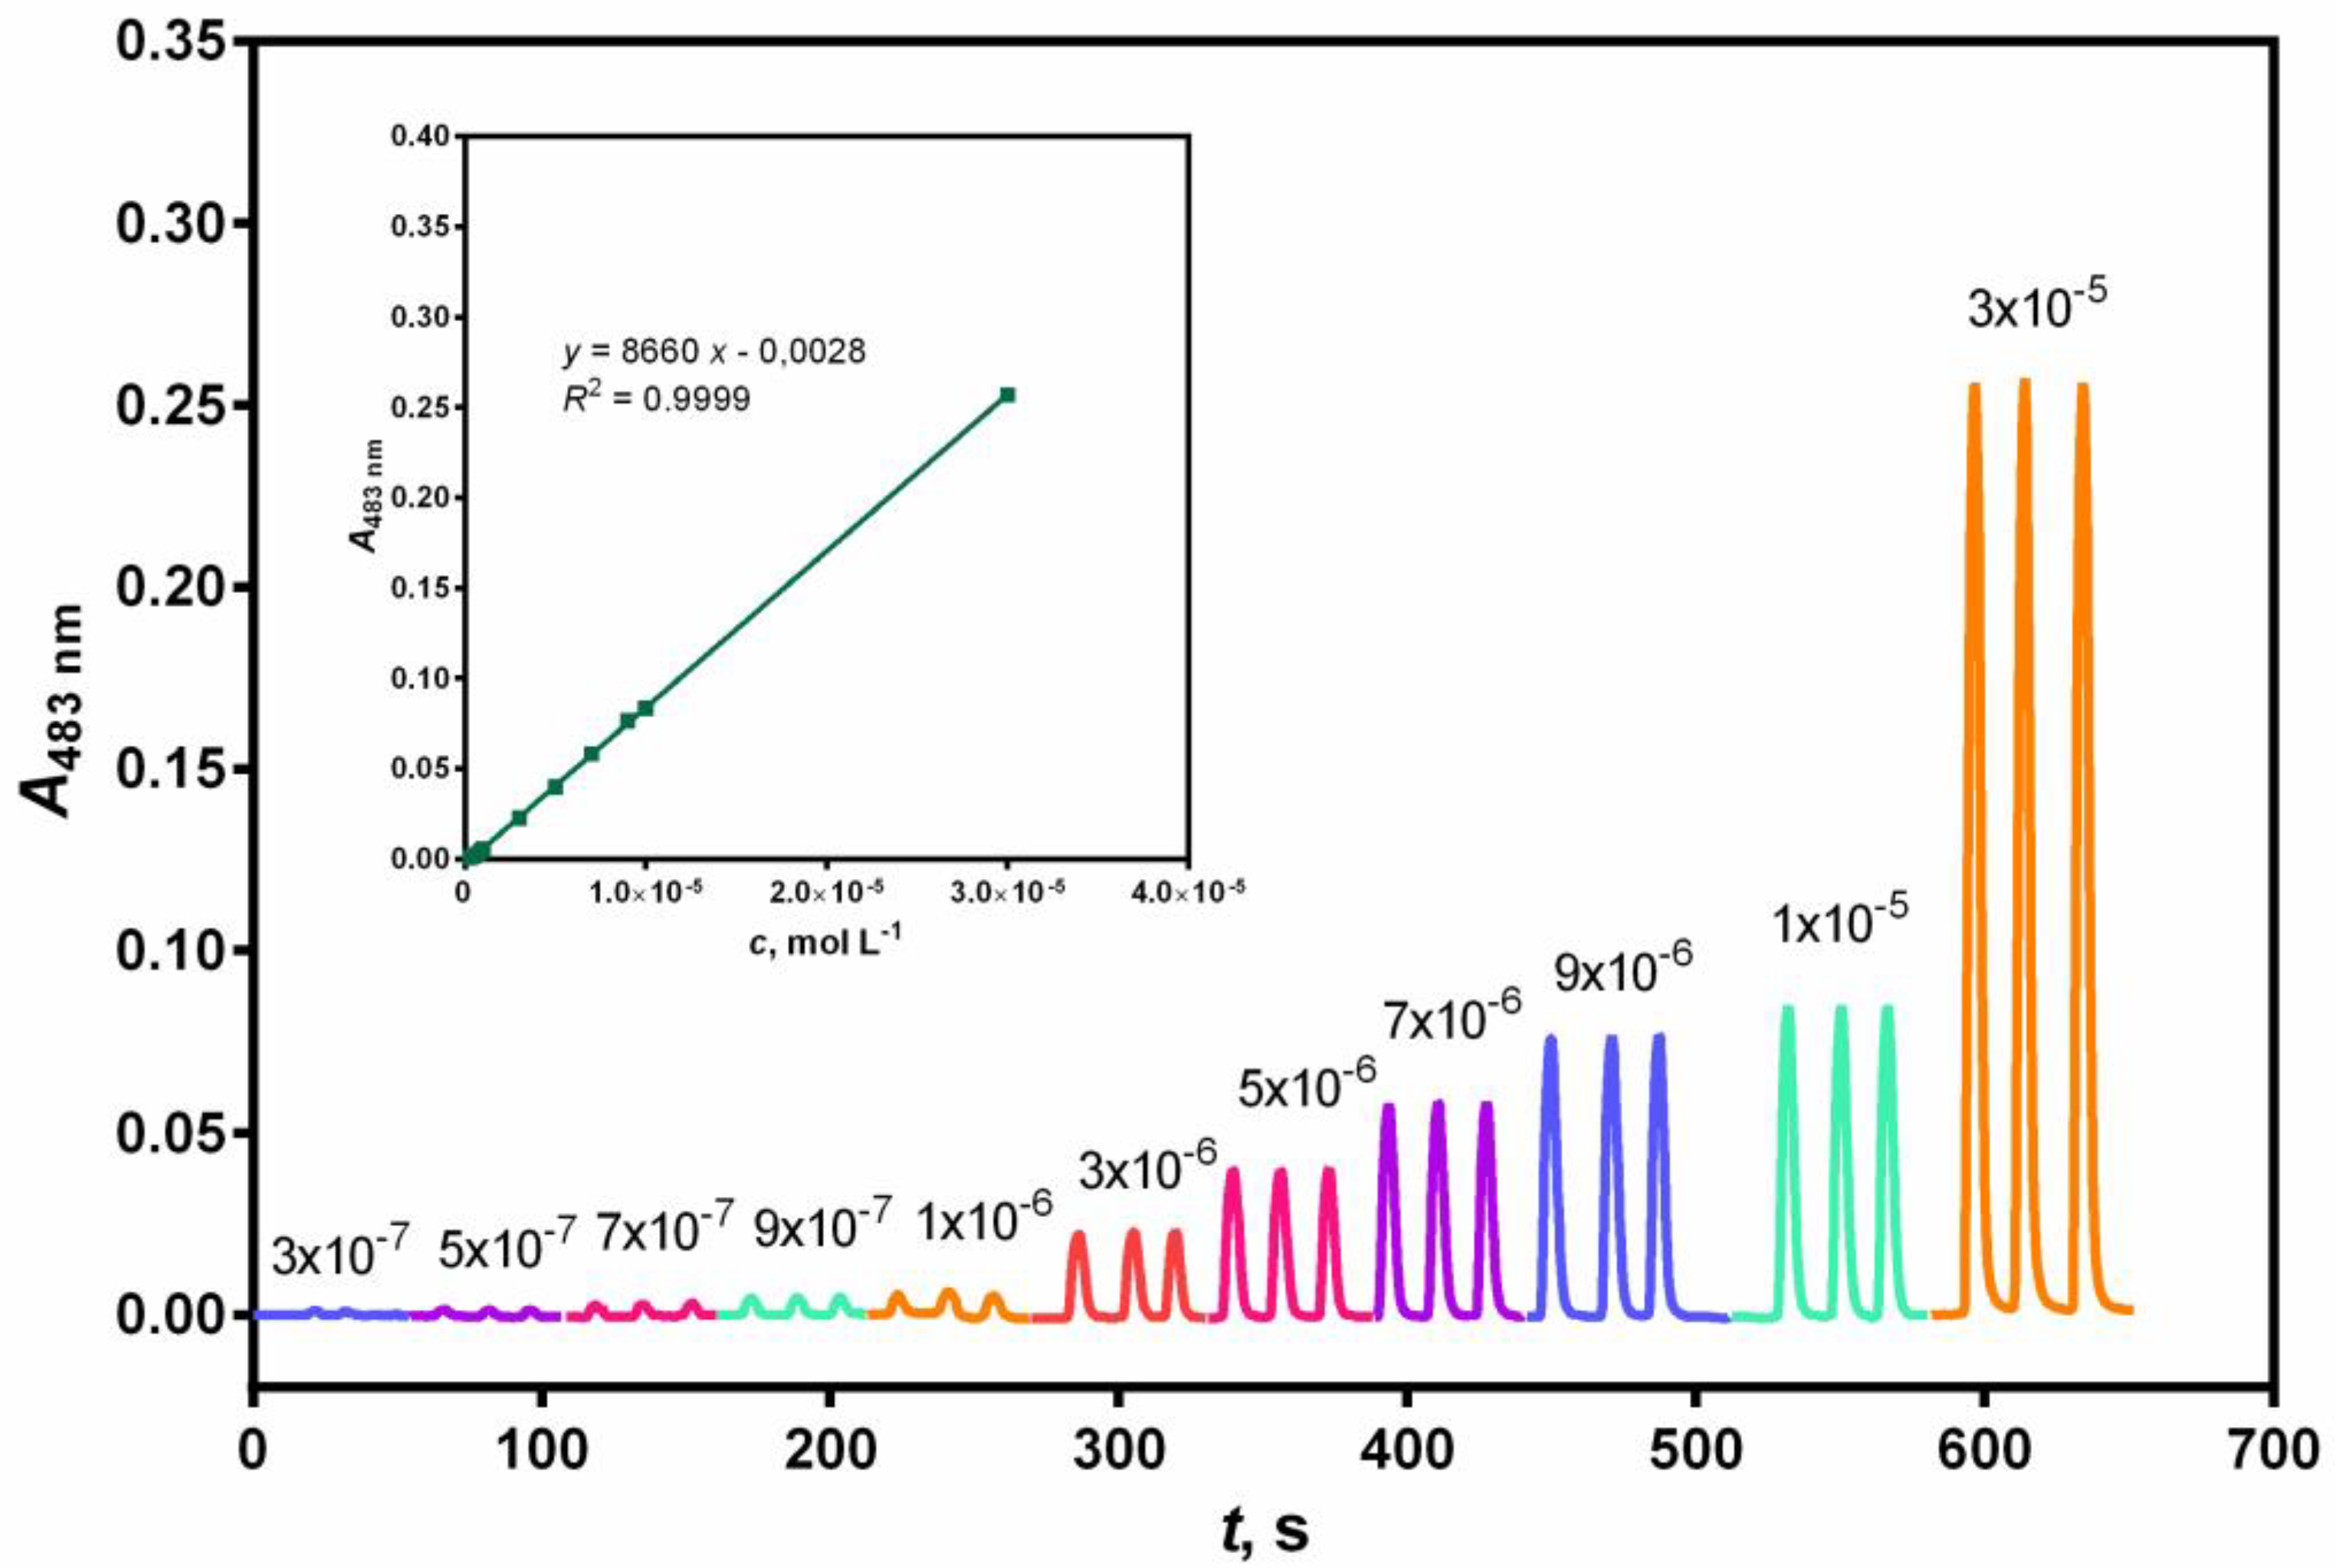
Figure 2.
Siagram and calibration curve for spectrophotometric determination of NAC in the concentration range of 4.0 × 10⁻⁷ mol L–1 to 4.0 × 10⁻⁵ mol L–1. Experimental conditions: c(Cu2+) = 6.4 × 10⁻⁴ mol L–1; c(BCS) = 3.2 × 10⁻⁴ mol L–1; n(BCS) : n(Cu2+) = 2 : 1; t = 25 °C; pH = 5.0; aspiration sequence = RS, S; carrier flow rate = 6000 µL min–1; reagent injection volume = 200 µL; analyte injection volume = 250 μL; volume of holding coil = 500 μL; length of the reaction coil = 30 cm.
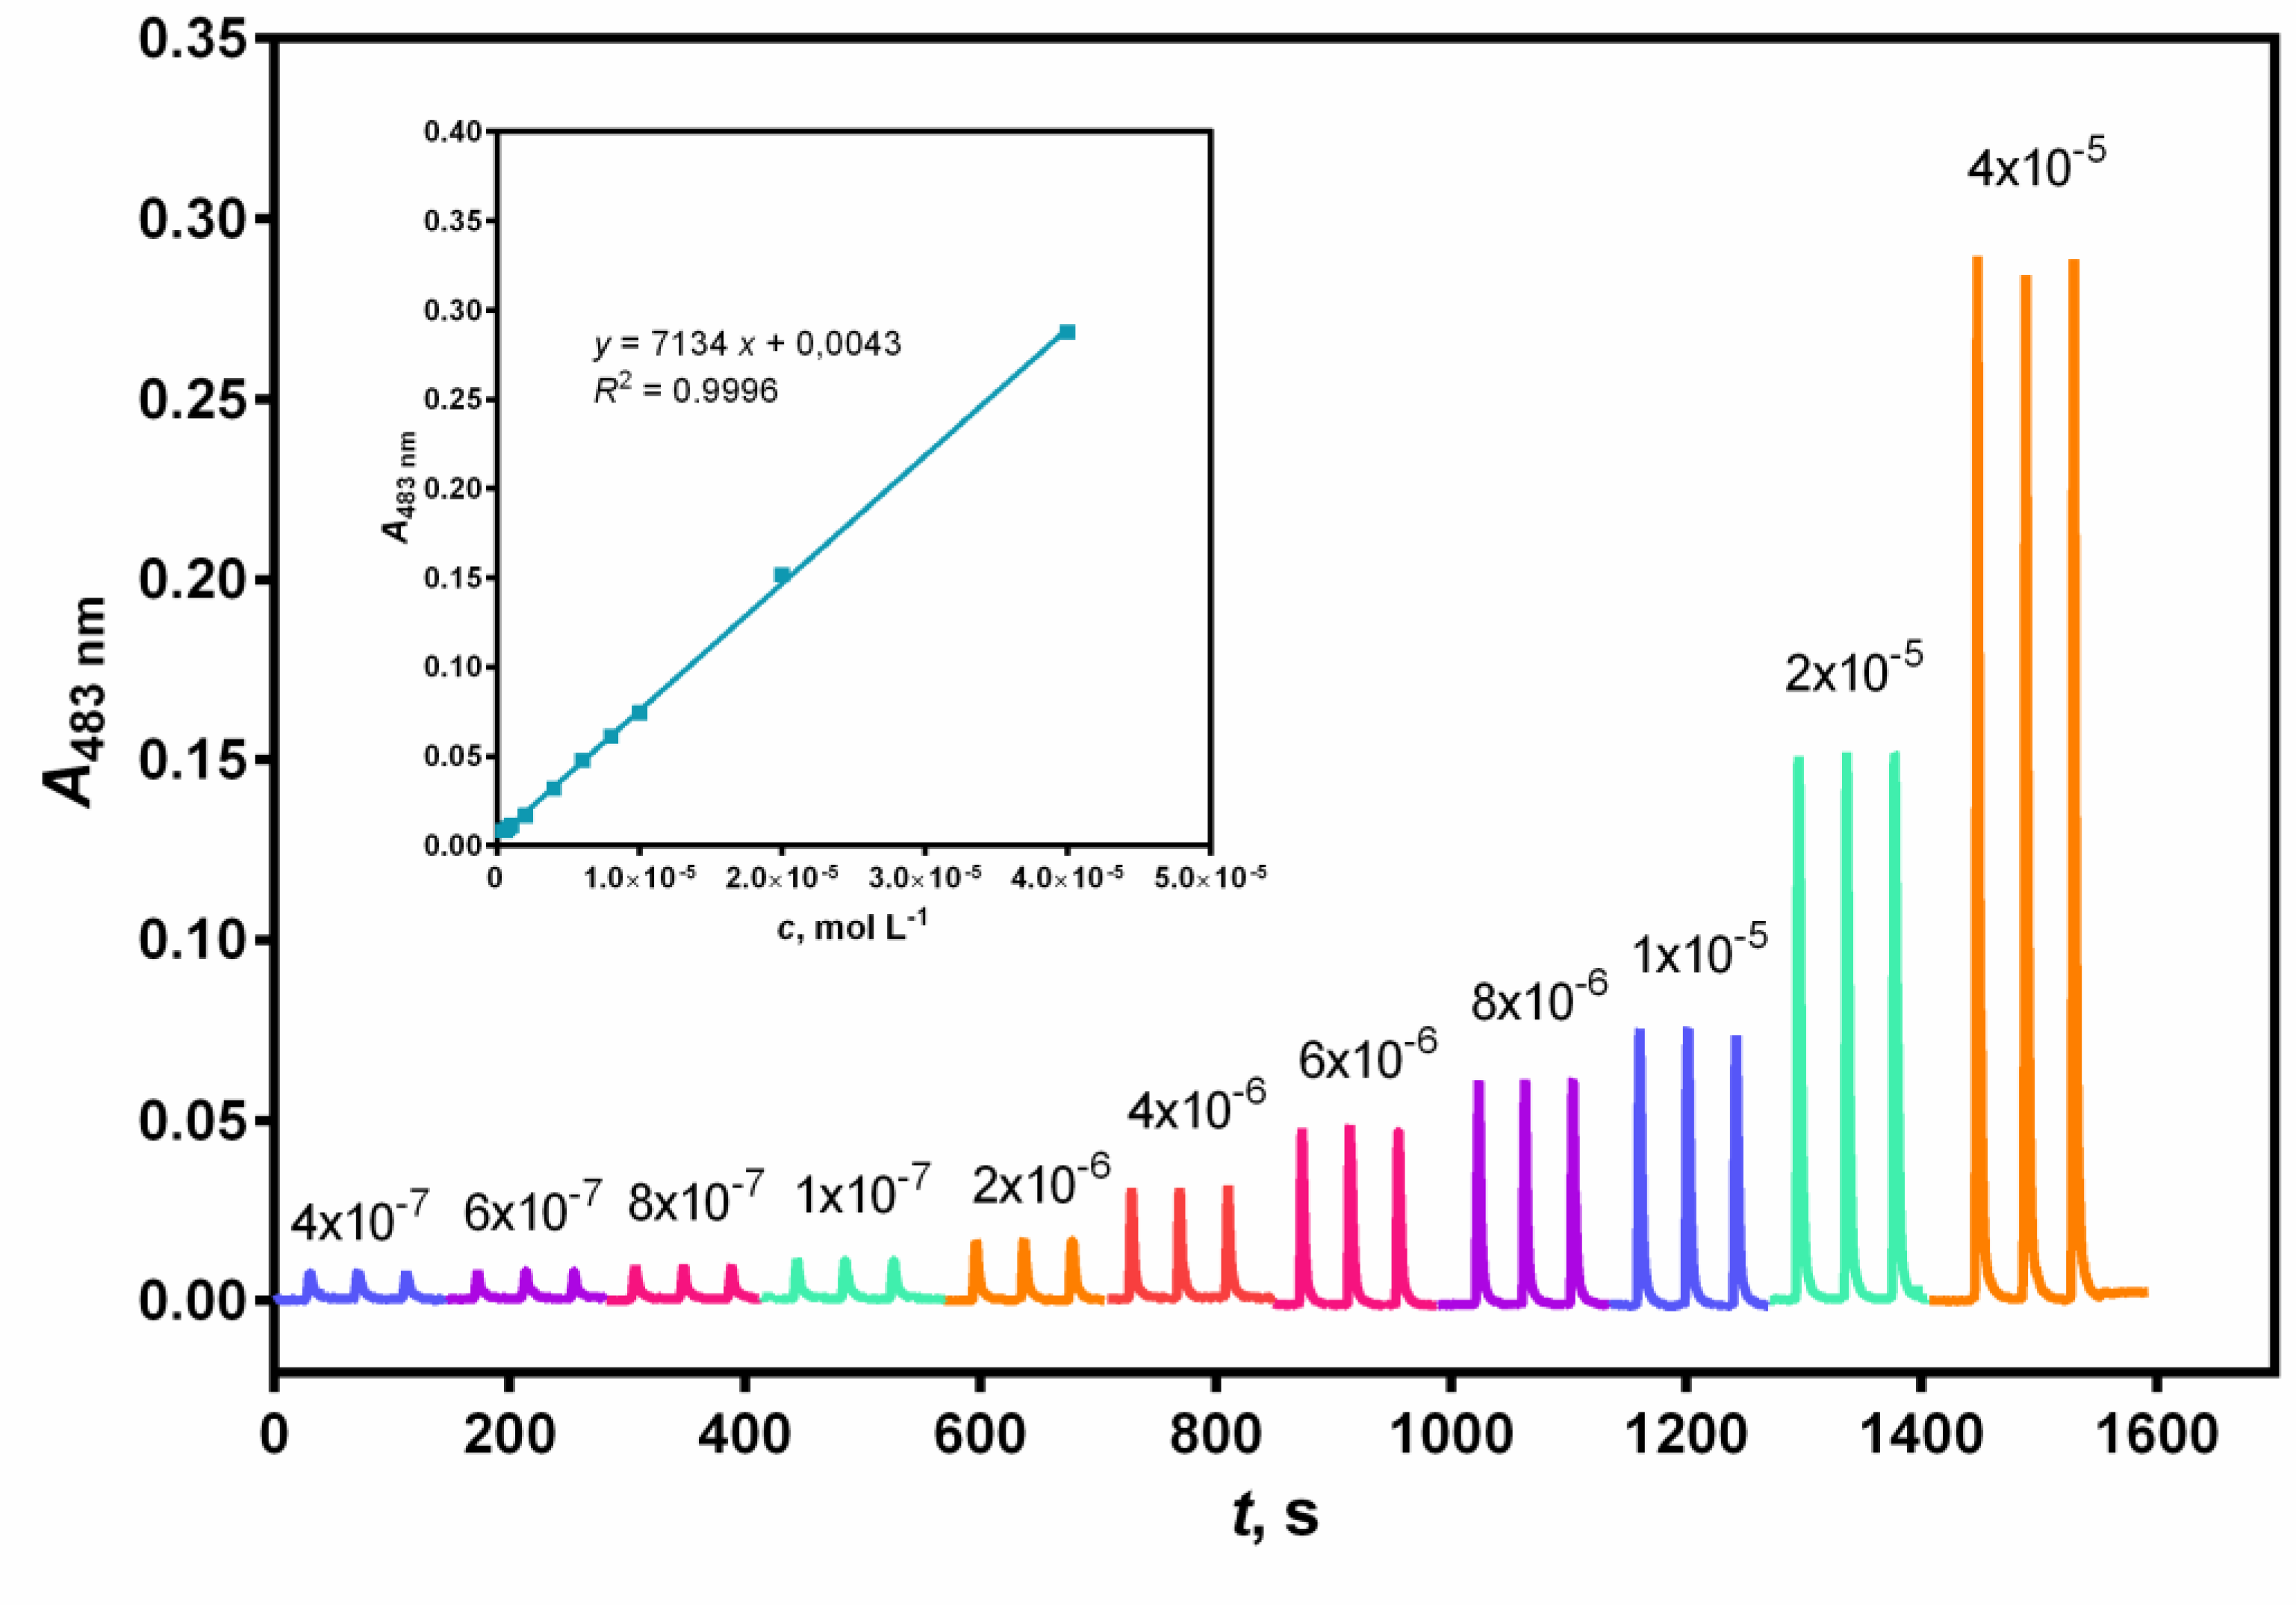
Figure 3.
Schematic diagram of the FIA system (a) and SIA system (b) for NAC determination: Sample solution (S); carrier stream (CS), reagent stream (RS), a peristaltic pump (P); injector valve (V); syringe-free pump (SFP), holding coil (HC), selector valve (SV), reaction coil (RC), flow cell (FC), waste (W); Inset: Sequence of the solutions in the holding coil and the direction of the flow in the SIA system.
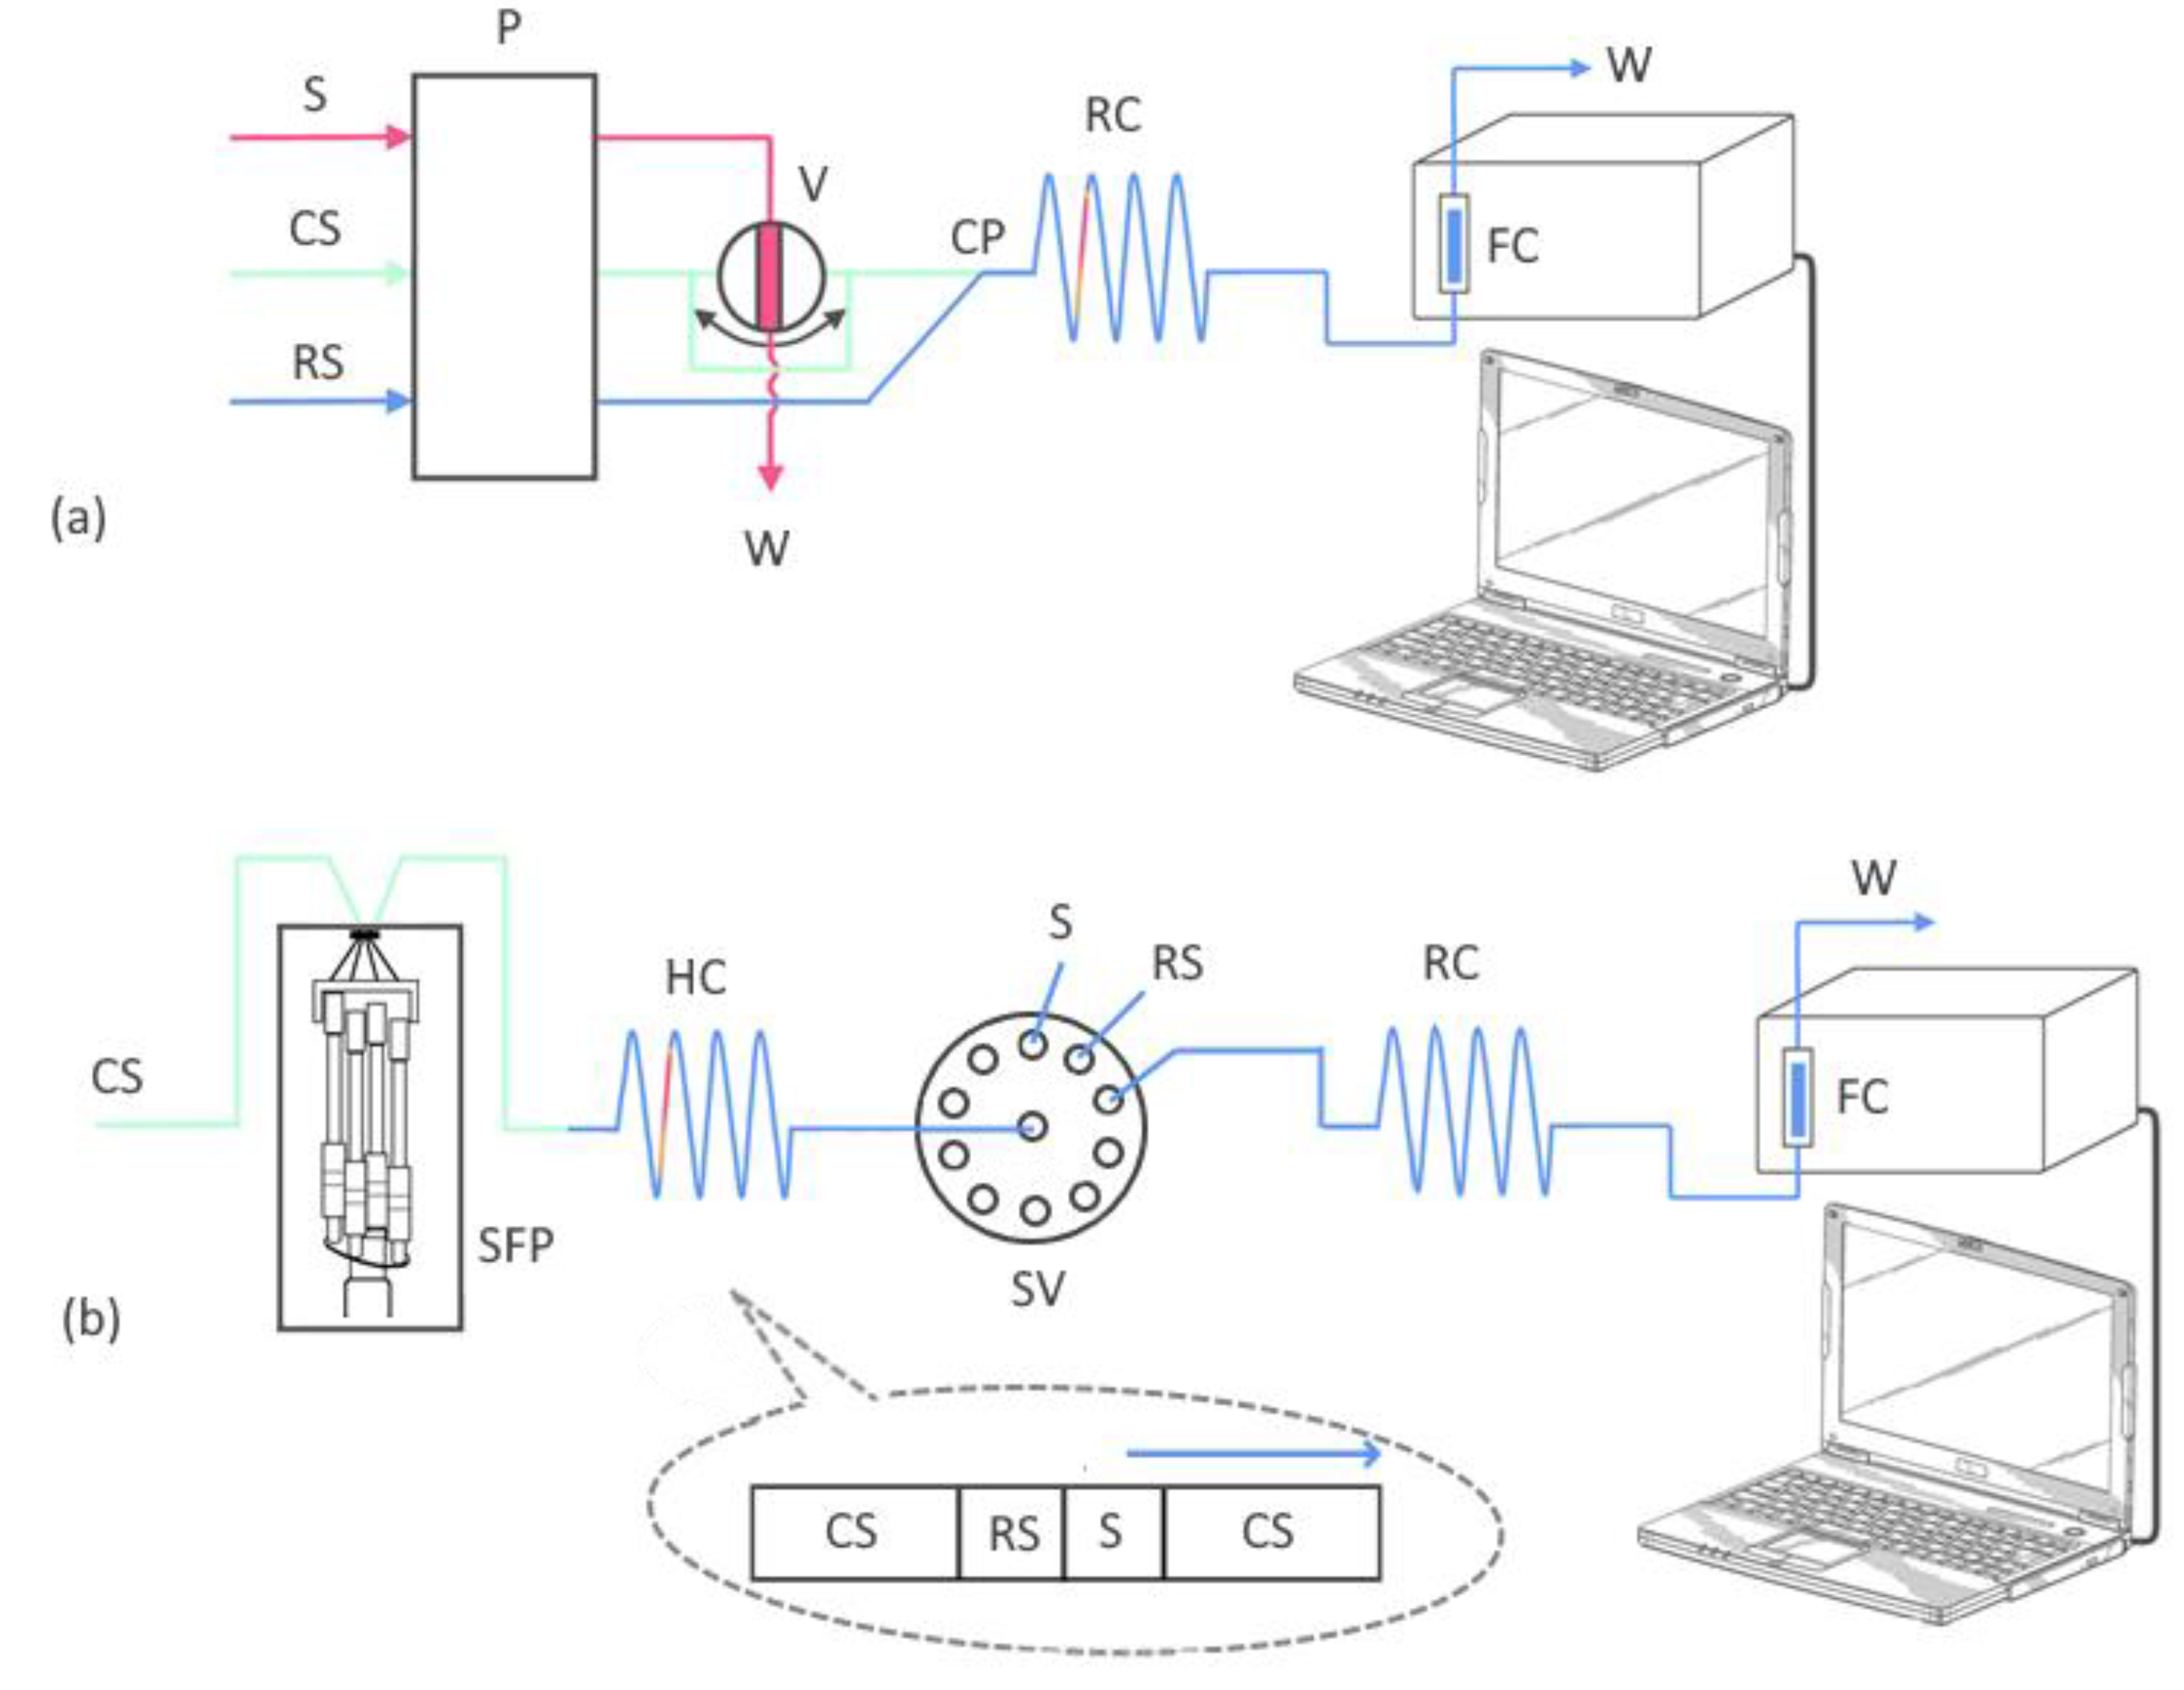

Table 1.
The comparison of the analytical parameters of the previously developed flow methods using different detectors for the determination of NAC.
Table 1.
The comparison of the analytical parameters of the previously developed flow methods using different detectors for the determination of NAC.
| Reference | Reagents | Analytical method (Sampling rate) | Beer’s Law (mol L‒1) |
LOD (mol L‒1) |
RSD (%) |
Detector |
|---|---|---|---|---|---|---|
| [10] | Palladium(II) chloride | FIA (45 h‒1) | 5.0×10‒5 – 5.0×10‒3 | 1.0×10‒5 | 1.40 | Spectrophotometric |
| [11] | Iron(III) and 1,10-phenantroline | FIA (60 h‒1) | 3.5×10‒6 – 4.3×10‒4 | 6.3×10‒7 | 1.50 | Spectrophotometric |
| [12] | Bromine | FIA (60 h‒1) | 1.6×10‒4 – 1.6×10‒3 | 8.0×10‒5 | 1.20 | Spectrophotometric |
| [13] | Iron(III) and 2,4,6-tripyridyl-s-triazine (TPTZ) | FIA (60 h‒1) | 6.0×10‒6 – 2.0×10‒4 | 2.0×10‒6 | 0.29 | Spectrophotometric |
| [14] | Iron(III) and hexacyanoferrate(III) | FIA (70 h‒1) | 3.0×10‒5 – 2.0×10‒4 | 1.0×10‒5 | No Data | Spectrophotometric |
| [15] | Iron(III) and ferricyanide | FIA (60 h‒1) | 1.0×10‒6 – 1.0×10‒4 | 3.0×10‒7 | 2.50 | Spectrophotometric |
| [16] | Cerium(IV) and ferroin | FIA (60 h‒1) | 6.5×10‒6 – 1.3×10‒4 | 5.0×10‒6 | 1.40 | Spectrophotometric |
| [17] | o-phthalaldehyde and isoleucine | FIA (126 h‒1) | 9.8×10‒5 – 9.8×10‒4 | No Data | 0.60 | Spectrophotometric |
| [18] | Zink(II) phosphate | FIA (60 h‒1) | 3.0×10‒5 – 1.5×10‒4 | 8.0×10‒6 | 0.50 | Spectrophotometric |
| [19] | Copper(II) and neocuproine | FIA (180 h‒1) | 6.0×10‒7 – 4.0×10‒5 | 1.4×10‒7 | 0.50 | Spectrophotometric |
| [20] | Silver nitrate | FIA (60 h‒1) | 1.0×10‒4 – 1.0×10‒3 | 5.0×10‒5 | 2.00 | Turbidimetric |
| [21] | Luminol and hypochlorite | FIA (No Data) | 1.0×10‒4 – 1.0×10‒1 | No Data | 1.09 | Chemiluminescence |
| [22] | Luminol and hydrogen peroxide with copper as catalyst | FIA (40 h‒1) | 2.0×10‒4 – 1.0×10‒2 | No Data | 1.44 | Chemiluminescence |
| [23] | Boron-doped diamond electrode | FIA (No Data) | 5.0×10‒7 – 5.0×10‒5 | 1.0×10‒8 | 4.10 | Amperometry |
| [24] | Monobromobimane | SIA (36 h‒1) | 1.5×10‒4 – 4.6×10‒4 | 1.3×10‒6 | 1.50 | Fluorimetry |
FIA - Flow Injection Analysis; SIA - Sequential Injection Analysis; LOD - Limit of Detection; RSD - Relative Standard Deviation.
Table 2.
Optimization of the FIA and SIA parameters for the determination of NAC.
| Variable | Studied range | Optimal conditions | |
|---|---|---|---|
| FIA | SIA | ||
| Temperature (°C) | 20; 25; 30; 40; 50 | 25 | 25 |
| pH | 2.0; 3.0; 4.0; 5.0; 6.0; 7.0; 8.0 | 3.0 | 3.0 |
| n(BCS) : n(Cu2+) | 1:1; 2:1; 3:1 | 1:1 | 2:1 |
| Aspiration sequence | RS, S; S, RS | / | RS, S |
| Carrier flow rate (µL min–1) | 1000; 2000; 3000; 4000; 5000; 6000; 7000; 8000 | 6000 | 6000 |
| Reagent flow rate (µL min–1) | 2000; 4000; 6000 | 2000 | / |
| Sample injection volume (µL) | 100; 200; 250; 500; 1000 | 500 | / |
| Aspiration of reagent volume (µL) | 50; 100; 150; 200; 250; 300; 350; 400; 450 | / | 200 |
| Aspiration of sample volume (µL) | 50; 100; 150; 200; 250; 300; 350; 400; 450 | / | 250 |
| Volume of holding coil (µL) | 500; 1000 | / | 500 |
| Length of the reaction coil (cm) | 30; 40; 50; 60; 70; 100; 120; 400 | 50 | 30 |
Table 3.
Analytical characteristics of the developed FIA and SIA methods for the determination of NAC.
Table 3.
Analytical characteristics of the developed FIA and SIA methods for the determination of NAC.
| Parameters | FIA method | SIA method |
|---|---|---|
| Linear range (mol L–1) | 3.0 × 10⁻⁷ – 3.0 × 10⁻⁵ | 4.0 × 10⁻⁷ – 4.0 × 10⁻⁵ |
| Regression equation | y = 8660x – 0.0028 | y = 7134x + 0.0043 |
| R2 | 0.9999 | 0.9996 |
| LOD (mol L–1) | 9.0 × 10⁻⁸ | 1.2 × 10⁻⁷ |
| LOQ (mol L–1) | 3.0 × 10⁻⁷ | 4.0 × 10⁻⁷ |
| RSD (%) | 0.61 | 2.62 |
| Analytical frequency (h–1) | 120 | 60 |
Table 4.
The effect of possible interfering substances commonly used in commercial pharmaceutical formulations.
Table 4.
The effect of possible interfering substances commonly used in commercial pharmaceutical formulations.
| Substance | Tolerance limit | |
|---|---|---|
| FIA | SIA | |
| Glucose | 1:500 | 1:500 |
| Fructose | 1:500 | 1:250 |
| KNO3 | 1:500 | 1:500 |
| Lactose | 1:500 | 1:400 |
| Sucrose | 1:500 | 1:500 |
| Citric acid | 1:100 | 1:5 |
| Tartaric acid | 1:100 | 1:5 |
| Na2SO4 | 1:500 | 1:50 |
| Na-citrate | 1:500 | 1:500 |
| Acetylsalicylic acid | 1:1 | 1:1 |
Table 5.
Evaluation of the accuracy of new flow methods for the determination of NAC.
| Sample | Added (µg mL–1) |
FIA | SIA | ||
|---|---|---|---|---|---|
| Found (µg mL–1)b |
Recovery (%) | Found (µg mL–1)b |
Recovery (%) | ||
| Fluimukan Juniora | 0 | 101.1 ± 0.6 | - | 100.3 ± 0.5 | - |
| 50 | 150.3 ± 0.7 | 98.4 | 148.9 ± 0.8 | 97.2 | |
| 100 | 202.8 ± 0.9 | 101.7 | 199.0 ± 1.2 | 98.7 | |
| 150 | 253.4 ± 1.7 | 101.5 | 252.7 ± 1.6 | 101.6 | |
| 200 | 304.9 ± 2.0 | 101.9 | 303.8 ± 2.2 | 101.8 | |
a Granules containing NAC 100 mg and excipients. b Average of three determinations ± standard deviation (SD).
Table 6.
Determination of NAC in pharmaceutical formulations by the developed FIA and SIA methods.
| Sample | Standard methodd (mg) | Proposed methodd (mg) | |
|---|---|---|---|
| FIA | SIA | ||
| Fluimukan Juniora | 101.3 ± 0.8 | 100.9 ± 0.6 | 101.5 ± 1.0 |
| Fluimukanb | 201.9 ± 1.2 | 201.5 ± 1.1 | 200.9 ± 1.4 |
| Naxil Fortec | 602.0 ± 1.7 | 603.2 ± 1.8 | 603.4 ± 2.1 |
a Granules containing NAC 100 mg. b Dispersible tablets containing NAC 200 mg. c Dispersible tablets containing NAC 600 mg. d Average ± standard deviation (SD) of three determinations per sample.
Disclaimer/Publisher’s Note: The statements, opinions and data contained in all publications are solely those of the individual author(s) and contributor(s) and not of MDPI and/or the editor(s). MDPI and/or the editor(s) disclaim responsibility for any injury to people or property resulting from any ideas, methods, instructions or products referred to in the content. |
© 2023 by the authors. Licensee MDPI, Basel, Switzerland. This article is an open access article distributed under the terms and conditions of the Creative Commons Attribution (CC BY) license (http://creativecommons.org/licenses/by/4.0/).
Copyright: This open access article is published under a Creative Commons CC BY 4.0 license, which permit the free download, distribution, and reuse, provided that the author and preprint are cited in any reuse.


