
Submitted:
29 May 2023
Posted:
30 May 2023
You are already at the latest version
Abstract
The purpose of this research was to analyze the moderating effect of clean energy innovation on the relationship between corporate carbon footprint and corporate profits in those industrial sectors associated with high demand for fossil fuels in which it is "hard to abate" CO₂e emissions. It used a longitudinal research design, in particular a panel study under a structural equation modeling (SEM) approach, based on partial least squares. For the longitudinal moderation analysis, this research employed the Bayesian method by defining a multiple-indicator latent growth curve model (B-LGC model). A global sample was used consisting of 7,827 firm-year observations between 2015 and 2021 corresponding to 167 international firms. The results revealed a very significant impact of the corporate carbon footprint on corporate profits. Likewise, the results showed that innovations in clean energy, when measured as the consumption of renewable energy, positively moderates the relationship between the greenhouse gas emissions from the value chain associated with Scope 3 of the Greenhouse Gas (GHG) Protocol, and the gross profit margin obtained. Besides the academic contribution represented by the moderating effect of clean energy innovation, these findings imply that a more detailed understanding of the emissions of the entire value chain (Scope 3 CO₂e) by executives and managers of high emitting CO₂e companies represents an effective mechanism to obtain higher profits, create competitive advantages and, at the same time, achieve a net zero emissions strategy. More importantly, public policy makers will be able to use these results to revise CO₂e-related policies paying more attention to the Scope 3 CO₂e emissions produced by these companies, to formulate regulatory and control mechanisms that stimulate clean energy innovation.
Keywords:
clean energy innovation
; corporate carbon footprint
; corporate profits
; high CO₂e emissions
; longitudinal model panel
; latent growth curve (LGC)
1. Introduction
The mitigation of climate change through the reduction of greenhouse gas emissions (GHG) is one of the most important challenges facing society today (Cadez et al., 2019). In this line, the Paris Agreement of 2015 seeks to limit the increase in global warming to less than 2 °C for which, among other objectives, the deep decarbonization is required of those industrial sectors with a high demand for conventional fossil fuels (Rissman et al., 2020; Wimbadi & Djalante, 2020). In particular, energy-intensive firms increasingly face demands to act decisively to reduce these emissions, and thus have a positive impact on climate change (Damert & Baumgartner, 2018), given that they are considered as the largest emitters of anthropogenic carbon dioxide and equivalent GHG (CO₂e), and therefore the main contributors to global warming (Boiral et al., 2012; Cadez et al., 2019; Lewandowski & Ullrich, 2023; Wang et al., 2014; Wesseling et al., 2017; Wright & Nyberg, 2017). As a consequence, these companies face the double challenge of generating profits for shareholders, but with lower CO₂ emissions in their production processes (BP, 2018; Chevron, 2018; Shell, 2018). To address these targets, clean and renewable energy sources can contribute to deep decarbonization, especially in those "hard-to-abate" CO₂ emissions sectors that are associated with high energy consumption (Capurso et al., 2022; Yan et al., 2023).
While there is a large body of recent literature with evidence of a direct relationship between corporate carbon footprint and corporate profits (e.g., Castro et al., 2021; Galama & Scholtens, 2021; Robaina & Madaleno, 2020; Russo et al., 2021; Wedari et al., 2023), the results are inconclusive. Therefore, the relationship between the carbon footprint and profits in fossil-based energy-intensive global companies from different sectors and countries is of particular interest in academia and in governments. On the other hand, technological innovation has been widely recognized as an effective means to combat negative environmental impacts (Zhou et al., 2019). Moreover, technological innovations take time to develop and implement, and their impact on companies’ performance is only perceived in the long term (Hang et al., 2019). This means that studies with a longitudinal research design are a particularly effective method for company-level research to examine the effect of clean energy innovation on GHG reduction and on increased profits. Thus, clean energy innovation has also gradually become an important topic in the business field (Bai et al., 2020).
The literature has so far paid little attention to the potential moderating effect of firms’ clean energy innovation on the link between their carbon footprint and profits and, in particular, in leading CO₂e-intensive global firms from various industrial sectors that are operating in different countries (Zhang et al., 2020). Hence, this study addressed the gap in the literature and examined the moderating effect of clean energy innovation on this relationship, focusing on large firms from the primary industries with the most intensive use of energy generated from fossil fuels. To accomplish this, this study developed a moderation model with longitudinal panel data obtained from the Carbon Disclosure Project (CDP) and the Thomson Reuters Refinitiv database, which is analyzed under the Bayesian growth curve model approach.
2. Literature Review and Hypothesis
2.1. Corporate Carbon Footprint
The corporate carbon footprint is dominated by carbon emissions and equivalent gases from the intensive consumption of energy (Nguyen et al., 2021), and often takes a size value expressed in absolute CO₂e emissions (Busch & Lewandowski, 2018; Dahlmann et al., 2019). As a result, a widely accepted taxonomy for accounting of and reporting absolute CO₂e emissions is based on the philosophy and classification of the Greenhouse Gas Protocol (or GHG Protocol for short) (Harangozo & Szigeti, 2017; Lewandowski, 2017). At the corporate level, the World Business Council for Sustainable Development (WBCSD) and World Resources Institute (WRI) Corporate Accounting and Reporting Standard (WBCSD & WRI, 2015) provided guidance for the preparation of a GHG emissions inventory. In particular, this study defined three types of scopes for CO₂e, Scope 1, Scope 2 and Scope 3. First, as defined by the WBCSD and WRI (2015), the Scope 1 CO₂e inventory consists of “direct GHG emissions from sources owned or controlled by the company” (p. 25). Second, Scope 2 CO₂e comprises indirect GHG emissions from electricity (Harangozo & Szigeti, 2017; Nguyen et al., 2021). More specifically, WBCSD and WRI (2015) stated that Scope 2 CO₂e “accounts for GHG emissions from the generation of purchased electricity consumed by the company” (p. 25). Third, Scope 3 CO₂e also refers to indirect GHG emissions, but from the upstream and downstream supply chain that are mostly related to the use of the products and services sold (Nguyen et al., 2021; Yagi & Managi, 2018; WBCSD & WRI, 2013). To this end, the WBCSD and WRI (2011)'s Corporate Value Chain (Scope 3 CO₂e) Accounting and Reporting Standard (WBCSD & WRI, 2011) enables companies to prepare a GHG emissions inventory that includes Scope 3 CO₂e emissions and to identify where to focus their activities to reduce these emissions (WBCSD & WRI, 2015).
2.2. Linking Corporate Carbon Footprint and Profits
Drawing from Barney 's (1991) resource-based view (RBV) theory of business and Freeman's (1984) stakeholder theory, it can be argued that reducing the carbon footprint is a way for companies to achieve a greater competitive advantage (Penz & Polsa, 2018). Although a significant body of both accounting-based (e.g. profits, sales, ROA, ROE, ROS, EBITDA, etc.) and market-based (e.g. Tobin's Q) empirical investigations (e.g., Busch & Lewandowski, 2018; Naranjo Tuesta et al., 2021; Robaina & Madaleno, 2020; Russo et al., 2021; Shahgholian, 2019; Yagi & Managi, 2018) has examined the direct relationship between the carbon footprint and some indicators of profitability, the results are still inconclusive. For instance, Busch and Lewandowski (2018), Robaina and Madaleno (2020), Russo et al. (2021), and Wedari et al. (2023) found a statistically significant positive relationship, while in Naranjo Tuesta et al. (2021) and Kim et al. (2021) found that this relationship was not statistically significant. On the other hand, Shahgholian (2019), Yagi and Managi (2018), and Busch et al. (2022) found mixed results. Furthermore, basically all research is based on transversal studies, a major limitation when it comes to reaching strong conclusions.
Consequently, there is a clear paucity of empirical studies that conduct longitudinal research between an (absolute) size value, such as carbon footprint, and a performance indicator based on a monetary metric, such as profit (Broadstock et al., 2017). Thus, the relationship between carbon footprint and profit in energy-intensive global companies is of particular interest in this study. In light of these arguments, the first hypotheses proposed are the following:
H1a
. Scope 1 CO₂e has a positive influence on the gross profit margin.
H1b
. Scope 1 CO₂e has a positive influence on the EBITDA margin.
H1c
. Scope 1 CO₂e has a positive influence on the operating margin.
H2a
. Scope 2 CO₂e has a positive influence on the gross profit margin.
H2b
. Scope 2 CO₂e has a positive influence on the EBITDA margin.
H2c
. Scope 2 CO₂e has a positive influence on the operating margin.
H3a
. Scope 3 CO₂e has a positive influence on the gross profit margin.
H3b
. Scope 3 CO₂e has a positive influence on the EBITDA margin.
H3c
. Scope 3 CO₂e has a positive influence on the operating margin.
H4a
. Scope 1+2 CO₂e has a positive influence on the gross profit margin.
H4b
. Scope 1+2 CO₂e has a positive influence on the EBITDA margin.
H4c
. Scope 1+2 CO₂e has a positive influence on the operating margin.
H5a
. Scope 1+2+3 CO₂e has a positive influence on the gross profit margin.
H5b
. Scope 1+2+3 CO₂e has a positive influence on the EBITDA margin.
H5c
. Scope 1+2+3 CO₂e has a positive influence on the operating margin.
2.3. Clean Energy Innovation
From an operational approach, Gallagher et al. (2006) defined clean energy innovation as “the set of processes leading to new or improved energy technologies that can increase energy resources; enhance the quality of energy services; and reduce the economic, environmental or political costs associated with the supply and use of energy” (p. 193). More specifically, Horbach and Rammer (2018) defined renewable energy innovations as “process innovations that lead to a substitution of fossil energy sources for renewable sources within companies” (p. 405). Underlying the concept of clean energy innovation are the evolutionary theory of innovation in Nelson and Sidney (1982) and the ecological modernization theory (EMT) of Joseph Huber (Spaargaren, 1997). The first holds that the activities that lead to technological change are the search for better technologies and the selection of successful innovations in the market (Ruttan, 1997). Porter & Linde (1995) argue that a truly competitive industry responds to global environmental challenges by reducing pollution through technological innovations that redesign industrial processes. More recently, Busch et al. (2018) stated that the neo-Schumpeterian approach (evolutionary model) raises the possibility that clean energy innovation is the important driver of a radical transformation towards a low-carbon economy. On the other hand, the EMT theory motivates industries that are energy intensive and therefore, highly polluting, to use clean energy technologies that enable them to reduce the environmental impact of their business activities (Jänicke, 2008).
2.4. Moderating Role of Clean Energy Innovation on the Relationship between Carbon Footprint and Profits
Porter's hypothesis (Porter & Linde, 1995) asserted that companies that design and execute environmental strategies that apply innovative technologies for pollution prevention can simultaneously improve their environmental performance and increase their competitiveness (Demirel & Kesidou, 2019). Subsequently, Alvarez et al. (2016) indicated that, at a corporate level, the management of the carbon footprint promotes cleaner and greener technological innovations. On the other hand, Harangozo and Szigeti (2017) argued that obtaining a lower carbon footprint requires companies to make greater efforts in clean energy technological innovation.
The ecological modernization theory (EMT), on the other hand, provides an approach for a corporate environmental strategy based on innovation and technology, also called "eco-efficient innovation" (or eco-innovation) (Jänicke, 2008). In this sense, clean energy innovation is a radical innovation that stems from the ecological modernization approach (Ding et al., 2019). Indeed, a fundamental tenet of this approach is that clean energy technological innovation helps improve the corporate environmental performance as well as its financial performance (Lin et al., 2019). Wedari et al. (2023) recently reviewed the current state of research on the relationship between environmental-related innovation, environmental and economic performance. Their findings shed new light on the role of innovation in the adoption of proactive environmental innovation strategies as a source of competitive advantage. As a result, according to Zhang et al. (2020), the influence of clean energy innovation in different industrial sectors has not yet been explicitly tested. Thus, the following research hypotheses were formulated:
H6a
. Clean energy innovation positively moderates the relationship between Scope 1 CO₂e and gross profit margin.
H6b
Clean energy innovation positively moderates the relationship between Scope 1 CO₂e and the EBITDA margin.
H6c
. Clean energy innovation positively moderates the relationship between Scope 1 CO₂e and the operating margin.
H7a
. Clean energy innovation positively moderates the relationship between Scope 2 CO₂e and gross profit margin.
H7b
. Clean energy innovation positively moderates the relationship between Scope 2 CO₂e and the EBITDA margin.
H7c
. Clean energy innovation positively moderates the relationship between Scope 2 CO₂e and the operating margin.
H8a
. Clean energy innovation positively moderates the relationship between Scope 3 CO₂e and the gross profit margin.
H8b
. Clean energy innovation positively moderates the relationship between Scope 3 CO₂e and the EBITDA margin.
H8c
. Clean energy innovation positively moderates the relationship between Scope 3 CO₂e and the operating margin.
H9a
. Clean energy innovation positively moderates the relationship between Scope 1+2) CO₂e and the gross profit margin.
H9b
. Clean energy innovation positively moderates the relationship between Scope 1+2 CO₂e and the EBITDA margin.
H9c
. Clean energy innovation positively moderates the relationship between Scope 1+2 CO₂e and the operating margin.
H10a
. Clean energy innovation positively moderates the relationship between Scope 1+2+3 CO₂e and the gross profit margin.
H10b
. Clean energy innovation positively moderates the relationship between Scope 1+2+3 CO₂e and the EBITDA margin.
H10c
. Clean energy innovation positively moderates the relationship between Scope 1+2+3 CO₂e and the operating margin.
Figure 1 presents an overview of the conceptual model used in this research.
3. Research Methodology
3.1. Data and Sample
The sample used is a set of the world’s largest companies that are part of the CDP reports and that have a high impact on climate change due to their high CO₂e. Data on CO₂e emissions and clean energy innovation were collected from the database of the CDP, which is a recognized international organization dedicated to improving the quality of information available worldwide on corporate carbon emissions (Haney, 2017). Detailed financial data was taken from the Thomson Reuters Eikon database. Likewise, following the industrial sector level classification of the Global Industry Classification Standard (GICS), five energy-intensive primary industries were obtained for analysis: materials, consumer discretionary, industrials, utilities, technology, energy, and health care. Table 1 summarizes the composition of the sample of companies by region and industry sector.
The final sample, as shown in Table 2, consists of 7,827 firm-year observations made between 2015 and 2021 that correspond to 167 large firms from 27 countries and from various energy-intensive industry sectors. This is an unbalanced panel, since the number of firm-year observations is not always the same for each company. The firm-year observations with missing values in more than two consecutive years were removed from the data set. Following previous studies (Fernández-Cuesta et al., 2019; Lewandowski, 2017; Shahab et al., 2018), outlier distortions were taken into account by winsorizing the lowest and highest percentiles of all continuous variables used in the study. Winsorization reached 2.41% of the total data points in this research.
3.2. Data Collection
3.2.1. Corporate Carbon Footprint
The independent variable is the corporate carbon footprint (hereafter, CCFP). Following the practices of previous research (i.e., Naranjo Tuesta et al., 2021; Robaina & Madaleno, 2020; Yagi & Managi, 2018), this study used absolute metrics to measure the CCFP, specifically absolute firm-level carbon emissions expressed in CO₂ equivalent units, that is, in total tons of CO₂e reported annually. This means that not only carbon dioxide (CO₂) is considered, but also included are other GHGs with great global warming potential, which are then transformed into carbon dioxide equivalent (CO₂e) (Hertwich & Peters, 2009; Nguyen et al., 2021). Precisely, this metric is appropriate to measure the carbon footprint in those companies and industries with a high absolute GHG intensity (Bataille et al., 2018). Furthermore, following Dahlmann et al. (2019), the Scope 1+2 CO₂e were added to annually capture the total carbon footprint of a company. Similarly, following the model proposed by Yagi and Managi (2018) for the decomposition of corporate carbon emissions, which broadens the firm’s total carbon footprint by including indirect Scope 3 CO₂e emissions in order to address the entire GHG supply chain, all emissions were added to capture the total absolute annual CO₂e (Scope 1 + 2 + 3).
3.2.2. Corporate Profits
Given its multidimensional nature, corporate profits (hereafter, CP) tend to adopt different proxy measures in empirical research, with accounting-based performance measures being the most prevalent (Shahgholian, 2019; Smith et al., 2019). In this line, Broadstock et al. (2017) distinguished two types of measures: money-metric performance measures and measures based on ratios. For convenience and the current availability of detailed and reliable financial data for the same period (2015-2021) as the corporate carbon footprint panel data, this study measured profits by gross profit margin (Pr Mrg), EBITDA margin (EBITDA Mrg) and operating margin (Op Mrg). Gross profit margin (Pr Mrg) was also included because profits are significantly influenced by operational costs (Rentschler & Kornejew, 2017), and are therefore suitable for examining the effect of corporate carbon footprint reduction. Likewise, the EBITDA used in similar studies (e.g., Broadstock et al., 2017; Galama & Scholtens, 2021; Makridou et al., 2019) was included as a way of capturing the financial cost-benefit ratio in companies that result from climate initiatives to reduce GHG emissions (Jackson & Belkhir, 2018). Finally, the operating margin (Op Mrg) was also used, since it is another indicator widely used in previous studies (e.g., Maama et al., 2021; Russo et al., 2021; Velte et al., 2020), but mainly because it is an effective financial indicator for decision making at the managerial level (Pons et al., 2013).
3.2.3. Clean Energy Innovation
The moderating variable of our model is clean energy innovation (hereinafter, CEI), quantitatively measured through renewable energy consumption (RENC) and quantified in billions of kilowatt hours (kWh). Although output metrics are usually used (Gallagher et al., 2006), such as the number of new technologies used, the energy consumption from renewable sources and the number of patents granted (Gallagher et al., 2011; Cheng & Yao, 2021; Zhang et al., 2021), in the final stages of clean energy technology innovation processes, not all of these are appropriate. Instead, the use of renewable energy sources is a proxy measure of the development of clean energy technology innovation (Cheng & Yao, 2021). More importantly, renewable energy consumption is more plausible as an indicator of progress in the adoption of clean energy technologies in energy-intensive industries with a high level of environmental pollution (Trencher et al., 2022; Yang et al., 2019).
Table 3 contains the definitions and a brief explanation of the measurements being examined.
3.3. Data Analyses
The present study used a longitudinal research design, in particular a panel study under a structural equation modeling (SEM) approach. In this regard, an approach widely adopted in the literature is the latent growth curve (LGC) model, based on the maximum likelihood estimation (MLE) method (Byrne, 2012; Geiser, 2021; Newsom, 2015). Moreover, the Bayesian method of multi-indicator latent growth curve models was used, which is an increasingly popular specialized model (Depaoli et al., 2017), mainly in longitudinal research in the field of developmental psychology (e.g., Depaoli et al., 2017); Oravecz & Muth, 2018; Zhang et al., 2007). The Bayesian LGC approach was adopted for three reasons. First of all, according to Muthén and Asparouhov (2012) and Oravecz and Muth (2018), this method is appropriate to improve the accuracy of the estimation in the modeling of latent variables. Secondly, compared to the MLE method, the Bayesian estimation is a more plausible technique for analyzing longitudinal data sets in small sample sizes (Muthén & Asparouhov, 2012; Zhang et al., 2007). Third, the availability of the Bayesian computational methods in software packages (e.g., Mplus, Amos, among others) is driving their application in different fields of social research (Van de Schoot et al., 2014), in particular, in social science research on climate change. Lastly, we analyzed the longitudinal data collected with version 8.8 of the Mplus statistical software, mainly because it permits the moderation of latent variables.
3.3.1. Bayesian LGC Model implemented
The statistical model used for the moderation analysis is a Bayesian latent growth curve model (hereafter, B-LGC model) with structural equations (Little, 2013; McArdle & Nesselroade, 2014). Figure 2 presents the longitudinal structural model for this B-LGC model, which involves three continuous latent variables measured by multiple observed indicators. In particular, following the latent growth models proposed by Li et al. (2000), Wen et al. (2002) and Wen et al. (2014), this B-LGC model contains six time-changing latent growth predictors, that is, five latent exogenous variables (i=1,2,3…,5) and one latent moderation variable Z, as well as three latent growth outcome variables (j=1,2,3) and an cross-product indicator representing the interaction (moderation) of Z. Because the observed measurements of the predictor variables and Z correspond to the same point in time, the product indicator is formed by the cross product of the latent growth factors (slopes) and of and Z, respectively. Furthermore, and correspond to the initial level (intercept) and the rate of change (slope) of . In this case, being a linear growth model, all intercept factors are restricted to a constant value of 1 as a starting point (initial state) for any change (growth) over time. Likewise, all slope factors are specified using fixed-value restrictions (i.e., 0, 1, 2, 3,…, 6) that represent straight-line growth in order to capture the rate of change of the trajectories over time (Li et al., 2000). On the other hand, the and Z growth curve factors interact with each other to influence the endogenous growth factors. Lastly, the model’s three latent variables (, and ) were measured in total with 63 observed variables, each measured at seven equidistant points in time ().
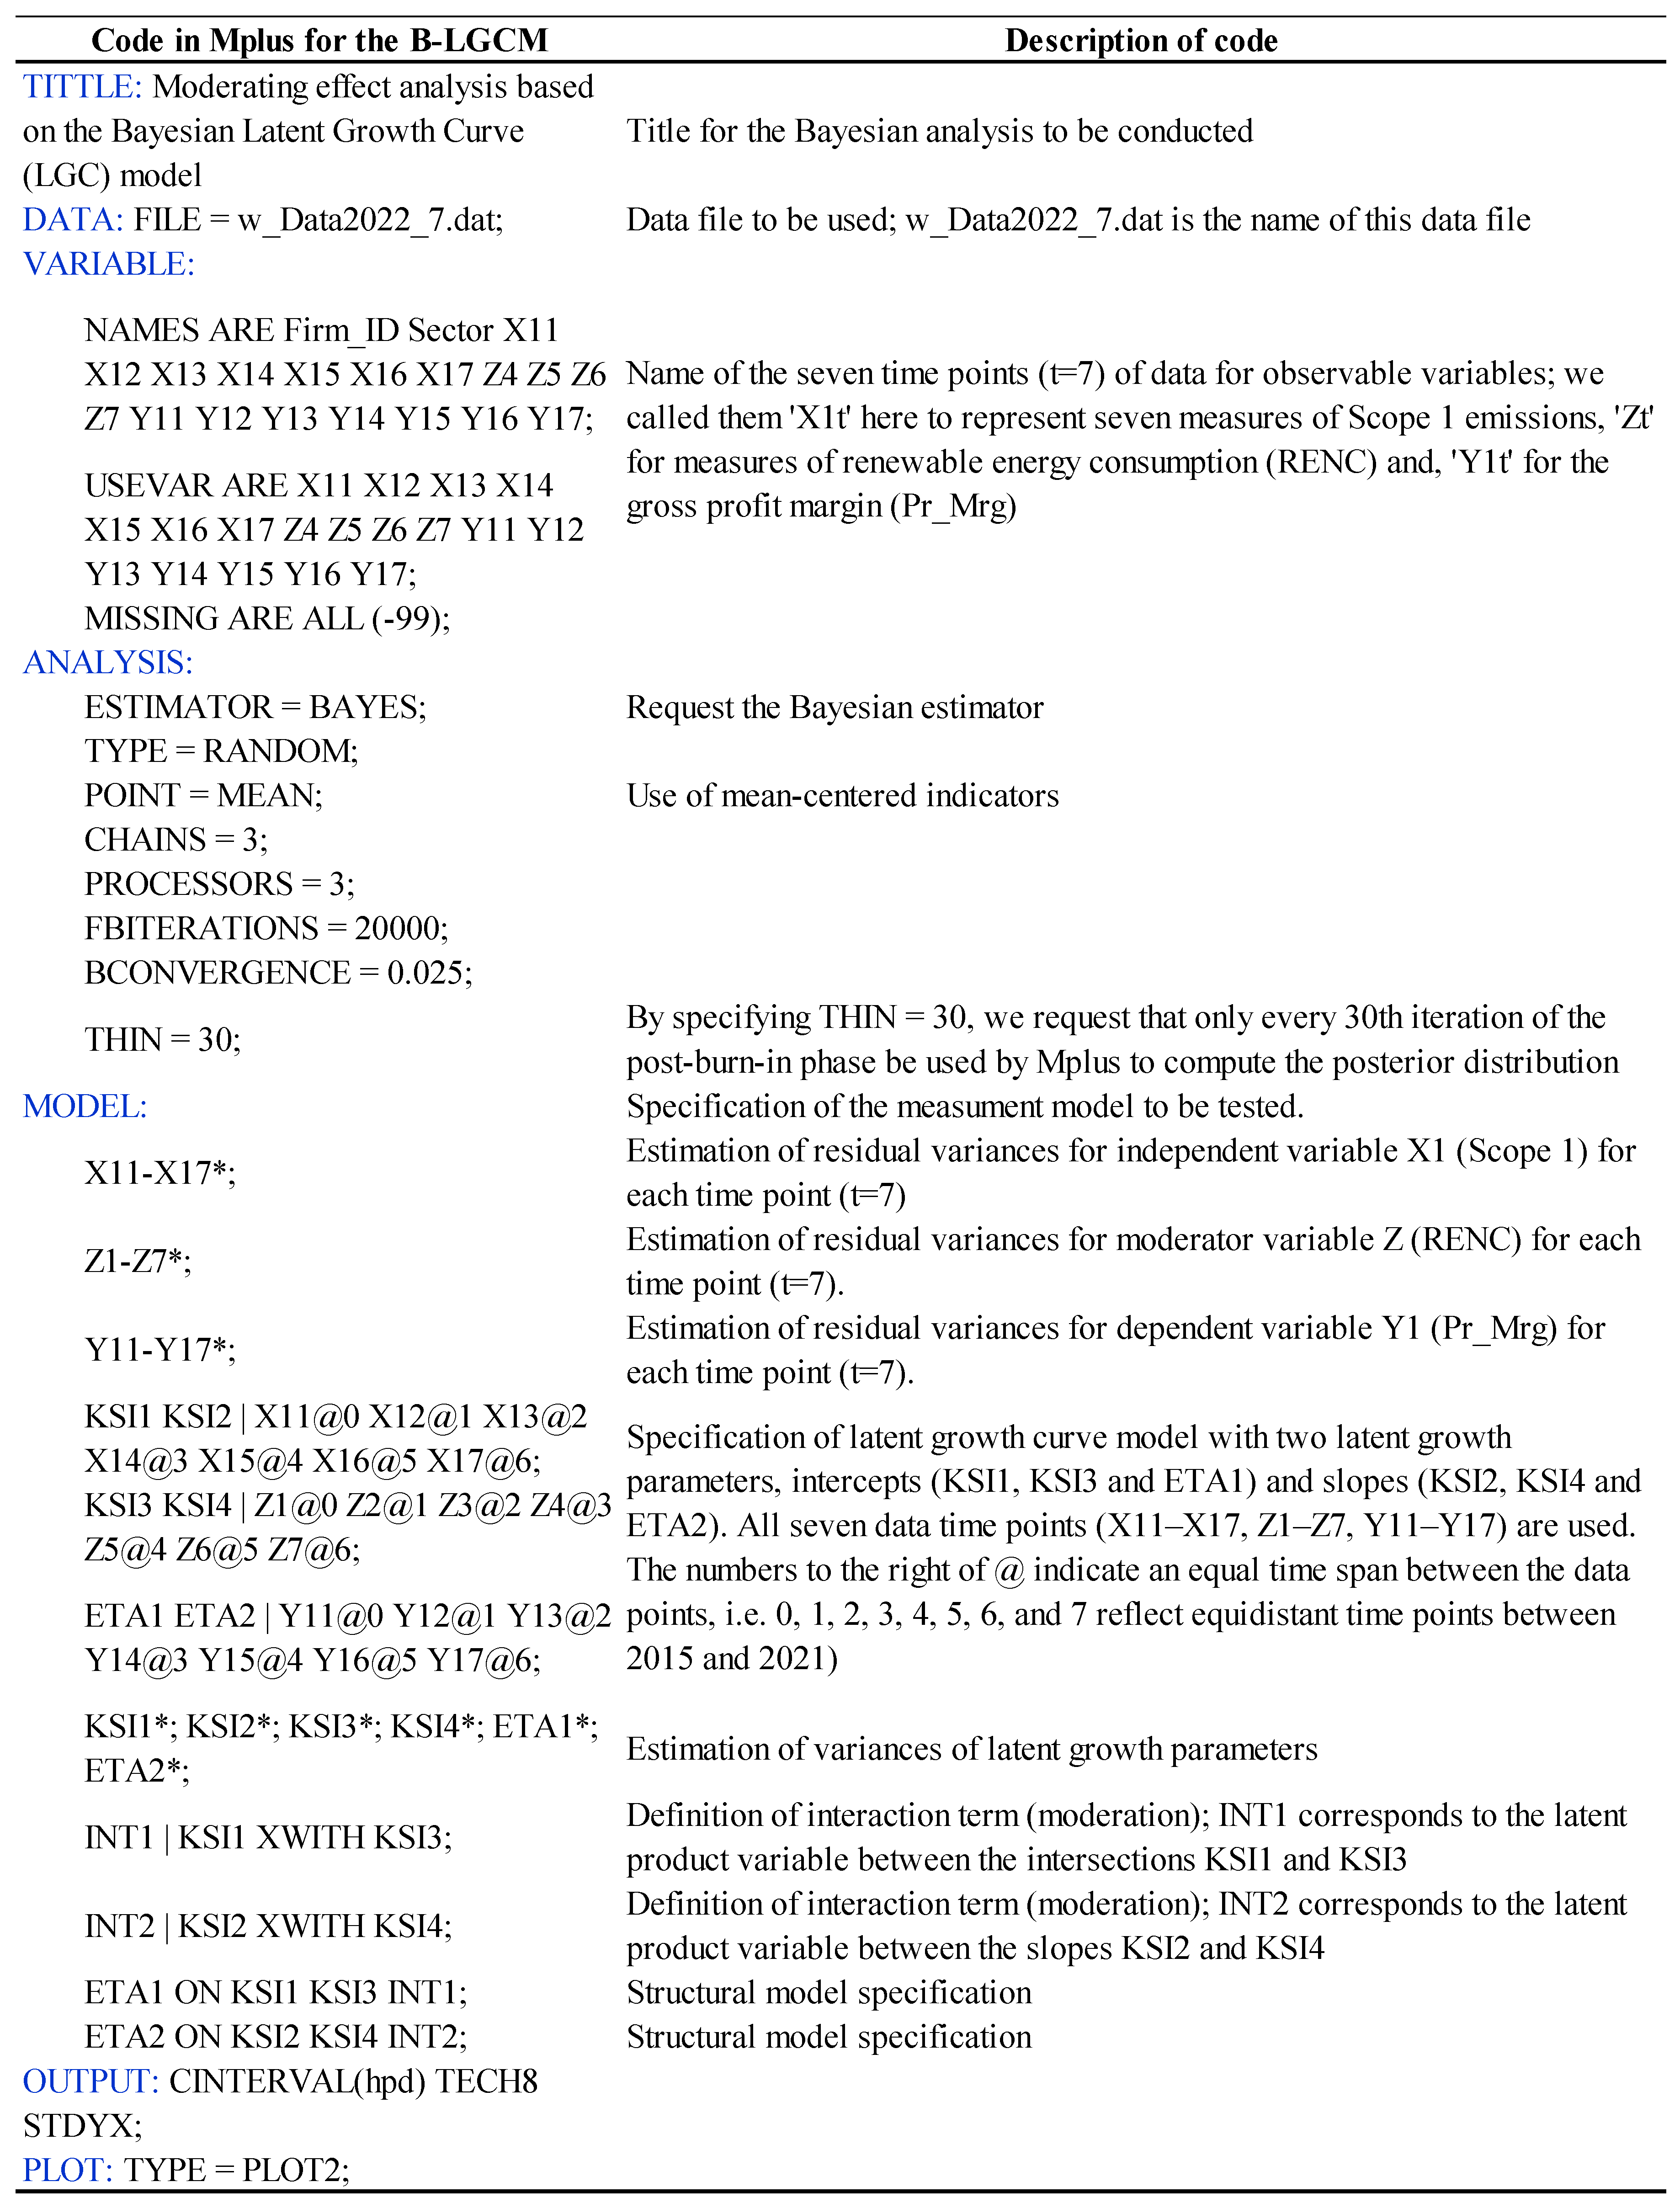
Appendix A shows all the codes needed to estimate the hypothesized B-LGC model, in particular for the corporate carbon footprint (Scope 1 CO₂e), clean energy innovation (RENC) and profits (Pr Mrg) relationships. Likewise, Appendix A shows the Mplus-specific syntax for this multiple-indicator measurement model, which describes the relationships between the latent moderation (𝑍), the latent interaction terms ( and ), the latent growth predictor (), and the latent growth outcome () as well as the structural model specification, using the Mplus commands. With respect to the distribution parameters (priors) used in the Bayesian estimation, this study adopts previous non-informative priors, that is, Mplus default priors (Muthén & Asparouhov, 2012).
4. Empirical Results
4.1. Diagnostic Test of B-LGC Model Fit
To verify the reliability of the results of the B-LGC model, this study employed two diagnostic tools. First, posterior predictive verification was used together with posterior predictive p-values (PPP) (Muthén & Asparouhov, 2012; Oravecz & Muth, 2018; Van de Schoot et al., 2014). In essence, this approach is based on the notion that Bayesian p-values seek to assess the quality of the model, that is, that the data generated by the model should closely resemble the observed data. Any deviation would suggest an incorrect specification of the model (Gelman et al., 2013; Hoyle, 2012). For the proposed B-LGC model, the model’s fit is acceptable for calculated PPP greater than zero and close to 0.5 (Muthén & Asparouhov, 2012; Van de Schoot et al., 2014).
Secondly, from the Bayesian perspective, using Markov chain Monte Carlo (MCMC) algorithms, we examined whether the B-LGC model converges correctly, using the potential scale reduction (PSR) factor (Gelman et al., 2013), which is a specific numerical measure of the default convergence criterion in Mplus (Geiser, 2021; Kruschke, 2014). The B-LGC model is estimated with a larger number of MCMC iterations (between 20,000 and 30,000) where PSR values close to 1 are considered evidence of convergence, which "means that convergence is achieved when the between-chain variation is smaller than the within-chain variation” (Muthén & Asparouhov, 2012, p. 335). However, it is recommended to examine model convergence using other diagnostic tools, such as trace plots, autocorrelation plots, and posterior parameter distribution plots (Van de Schoot et al., 2014).
4.2. Hypotheses tests
The numerical results of the analysis are shown in Table 4a and Table 4b. Both Tables provide the standardized parameter estimates of the B-LGC model for each of the proposed hypotheses. For example, the fifth column presents the mean obtained from the posterior distribution in each simulation. In the sixth column, the posterior standard deviation (S.D) for the mean of each interaction is reported. In the seventh column, one-tailed PPP, based on the posterior distribution, is provided for the significance test of each of the proposed hypotheses. Shown for each interaction parameter is the posterior probability interval (Muthén & Asparouhov, 2012; Van de Schoot et al., 2014), also known as the Bayesian 95% credibility interval (CI). Lastly, the level of statistical significance is shown for each of the proposed hypotheses. More specifically, "significant interaction" in the Bayesian context must be interpreted when the credibility interval does not contain zero (Muthén & Asparouhov, 2012).
Table 4a corresponds to the results of the hypotheses of direct interaction between CCFP and CP. This Table shows that the PSR measures dropped rapidly to values close to 1.0 and remained at 1.0 between 10,000 and 20,000 MCMC iterations, which indicates that the convergence of the B-LGC model was achieved in all the MCMC hypotheses. Moreover, all the point estimates of the mean slope parameters reached PPP values greater than zero and below 0.05, which indicates an absolute fit of the B-LGC model in the Bayesian framework. With respect to the statistically significant results of the direct CCFP→CP interaction, only the hypotheses H1b, H3a, H4b, H4c, H5a, H5b and H5c obtained plausible values at a significance level of 5%, since their corresponding CI, [-0.602, -0.101], [0.167, 0.643], [-0.647, -0.101], [-0.512, -0.020], [-0.521, -0.004], [-0.635, -0.098] and [-0.501, - 0.014], do not contain zero.
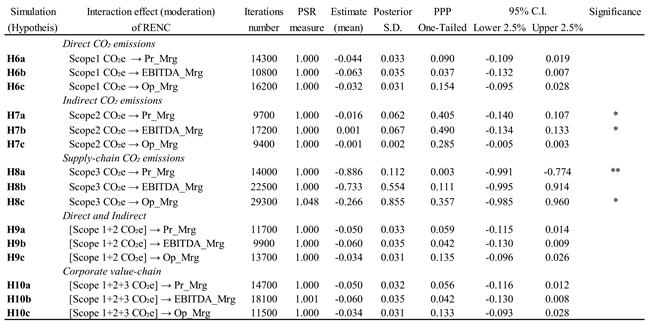
Table 4b presents the results of longitudinal moderation of clean energy innovation (CEI) in the direct CCFP→CP relationship. All the hypotheses reached convergence for the estimated parameter (mean), including the H8c hypothesis, which at 29,300 iterations reached a PSR value of 1.048. Nonetheless, according to Muthén and Asparouhov (2012), PSR values less than or equal to 1.1 are also considered evidence of convergence. Similarly, all the PPP indicated a good-fit of the B-LGC model and of the moderating effect of the CEI construct in the relationship between the exogenous (corporate carbon footprint) and endogenous variable (corporate profits). In fact, only the H8a hypothesis presented statistical significance on the moderating effect of the CEI construct, measured by the continuous observed moderator variable RENC, in the direct relationship between the observed variables Scope3 CO₂e →Pr Mrg, since its Bayesian 95% CI of [-0.991, -0.774] does not include zero, implying a positive intervention (moderation) effect. Figure 4 shows the standardized solution, confidence intervals, variance estimates, and standard errors provided by Mplus diagram for H8a. This output diagram shows a value of 0.886 and an interval confidence (-0.991, -0.774) for the . However, the hypotheses H7a, H7b and H8c showed PPP of 0.405, 0.490 and 0.357, respectively, close to 0.5, but very narrow CI that includes zero, which can be interpreted as marginal effects of moderating interaction of the CEI variable (Muthén & Asparouhov, 2012).
4.3. Graphical illustrations of Longitudinal Moderating Effect
Figure 3 shows the Bayesian trace plot on each chain of the MCMC process during the 20,000 iterations, which indicates a proper convergence of the autoregressive slope parameter corresponding to the moderating interaction term () of the B-LGC model. This is seen in the fact that there are no trends or large fluctuations in the trace plot, which confirms that there was no abnormality in the convergence of the model (Zhou et al., 2021). On the other hand, Figure 5 presents the autocorrelation plot of the autoregressive slope parameter, also corresponding to the interaction term , where the autocorrelation value is shown on the y-axis and the time lag between the 20,000 MCMC iterations, on the x-axis. More specifically, this plot shows a relatively high autocorrelation (just over 0.5) for shorter lags between iterations, but as the time lag increases, the autocorrelation becomes smaller (close to zero). This is a good result, considering that "ideally, each MCMC iteration should result in independent information for the posterior distribution of a parameter (autocorrelation of zero)" (Geiser, 2021, p. 267). Lastly, Figure 6 shows the posterior distribution of the mean slope parameter of the term. It can be seen that this distribution is roughly symmetric; in fact, these distributions do not need to be normal or symmetric in the Bayesian analysis (Kruschke, 2014). The mean, median, and mode were 0.886, 0.902, and 0.927, respectively. The posterior S.D. was relatively small (0.112), indicating negligible uncertainty about the true value of the mean slope parameter of the term. This is reflected in the narrow range of CI obtained, which goes from -0.99108 to -0.77367 and does not cover zero. Consequently, it can be argued that the number of data points used (N = 167: 4,509 total data points) to test hypothesis H8a was sufficient to obtain small uncertainty and high statistical power.
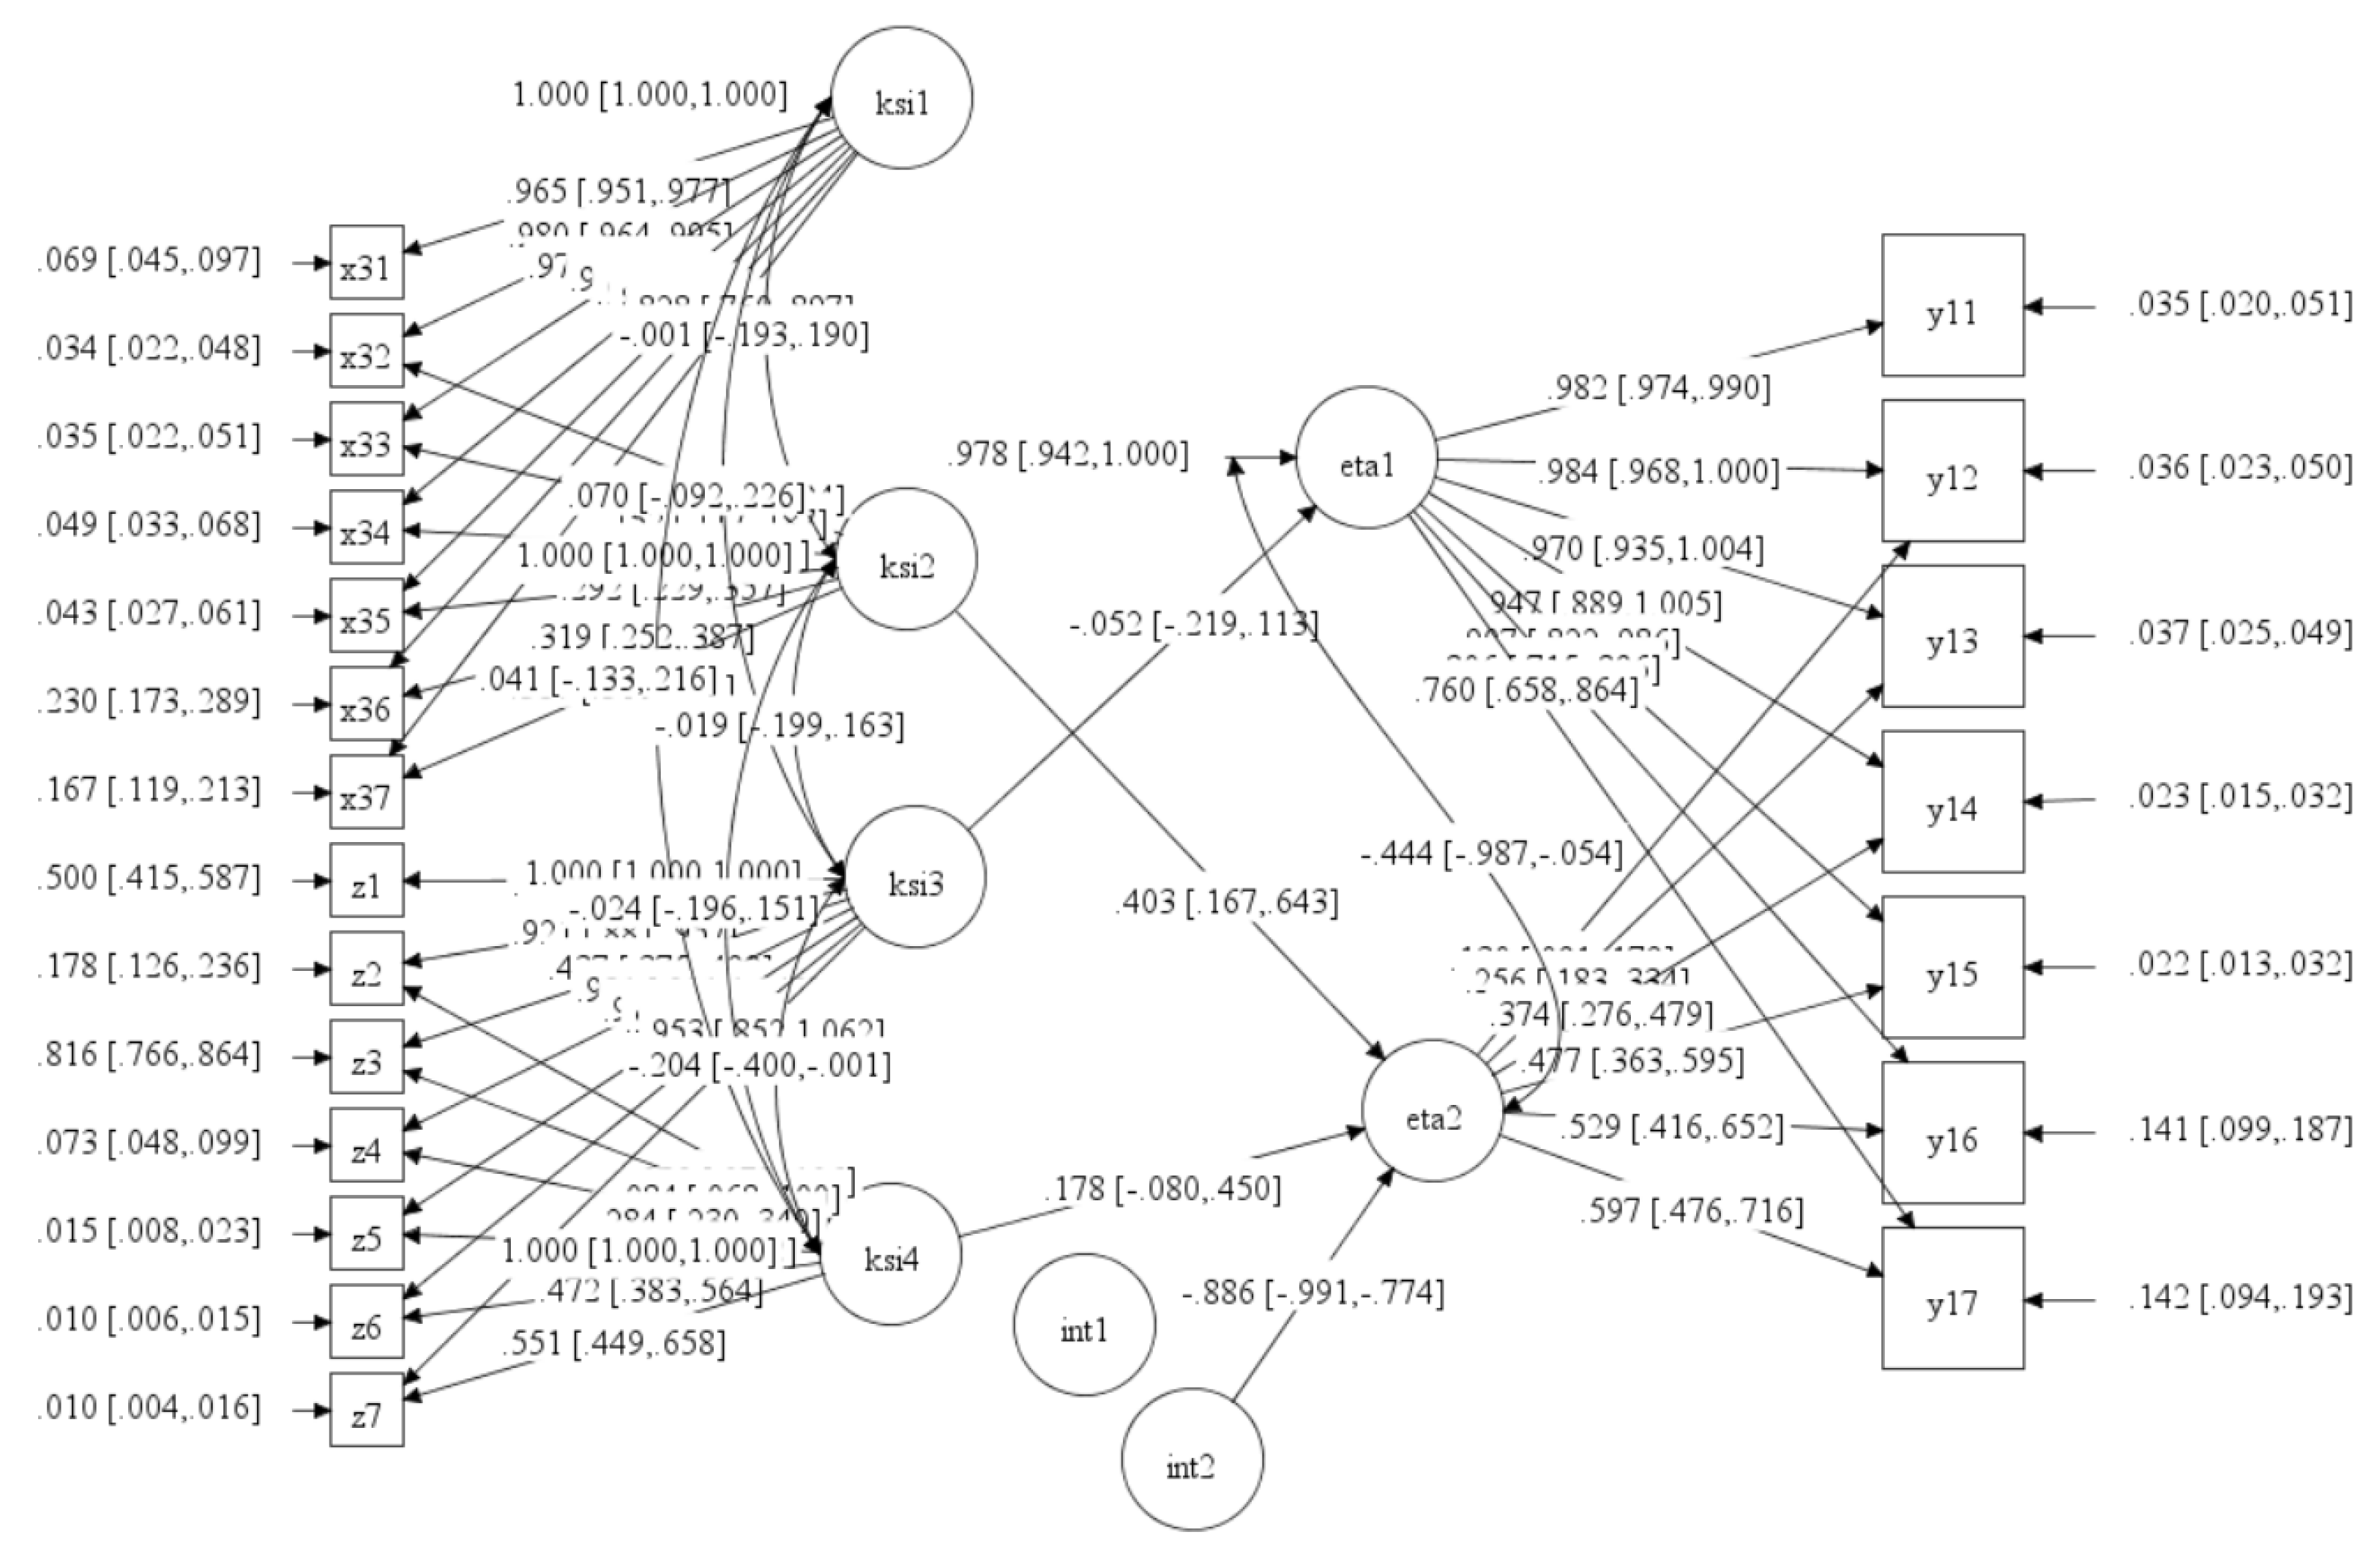
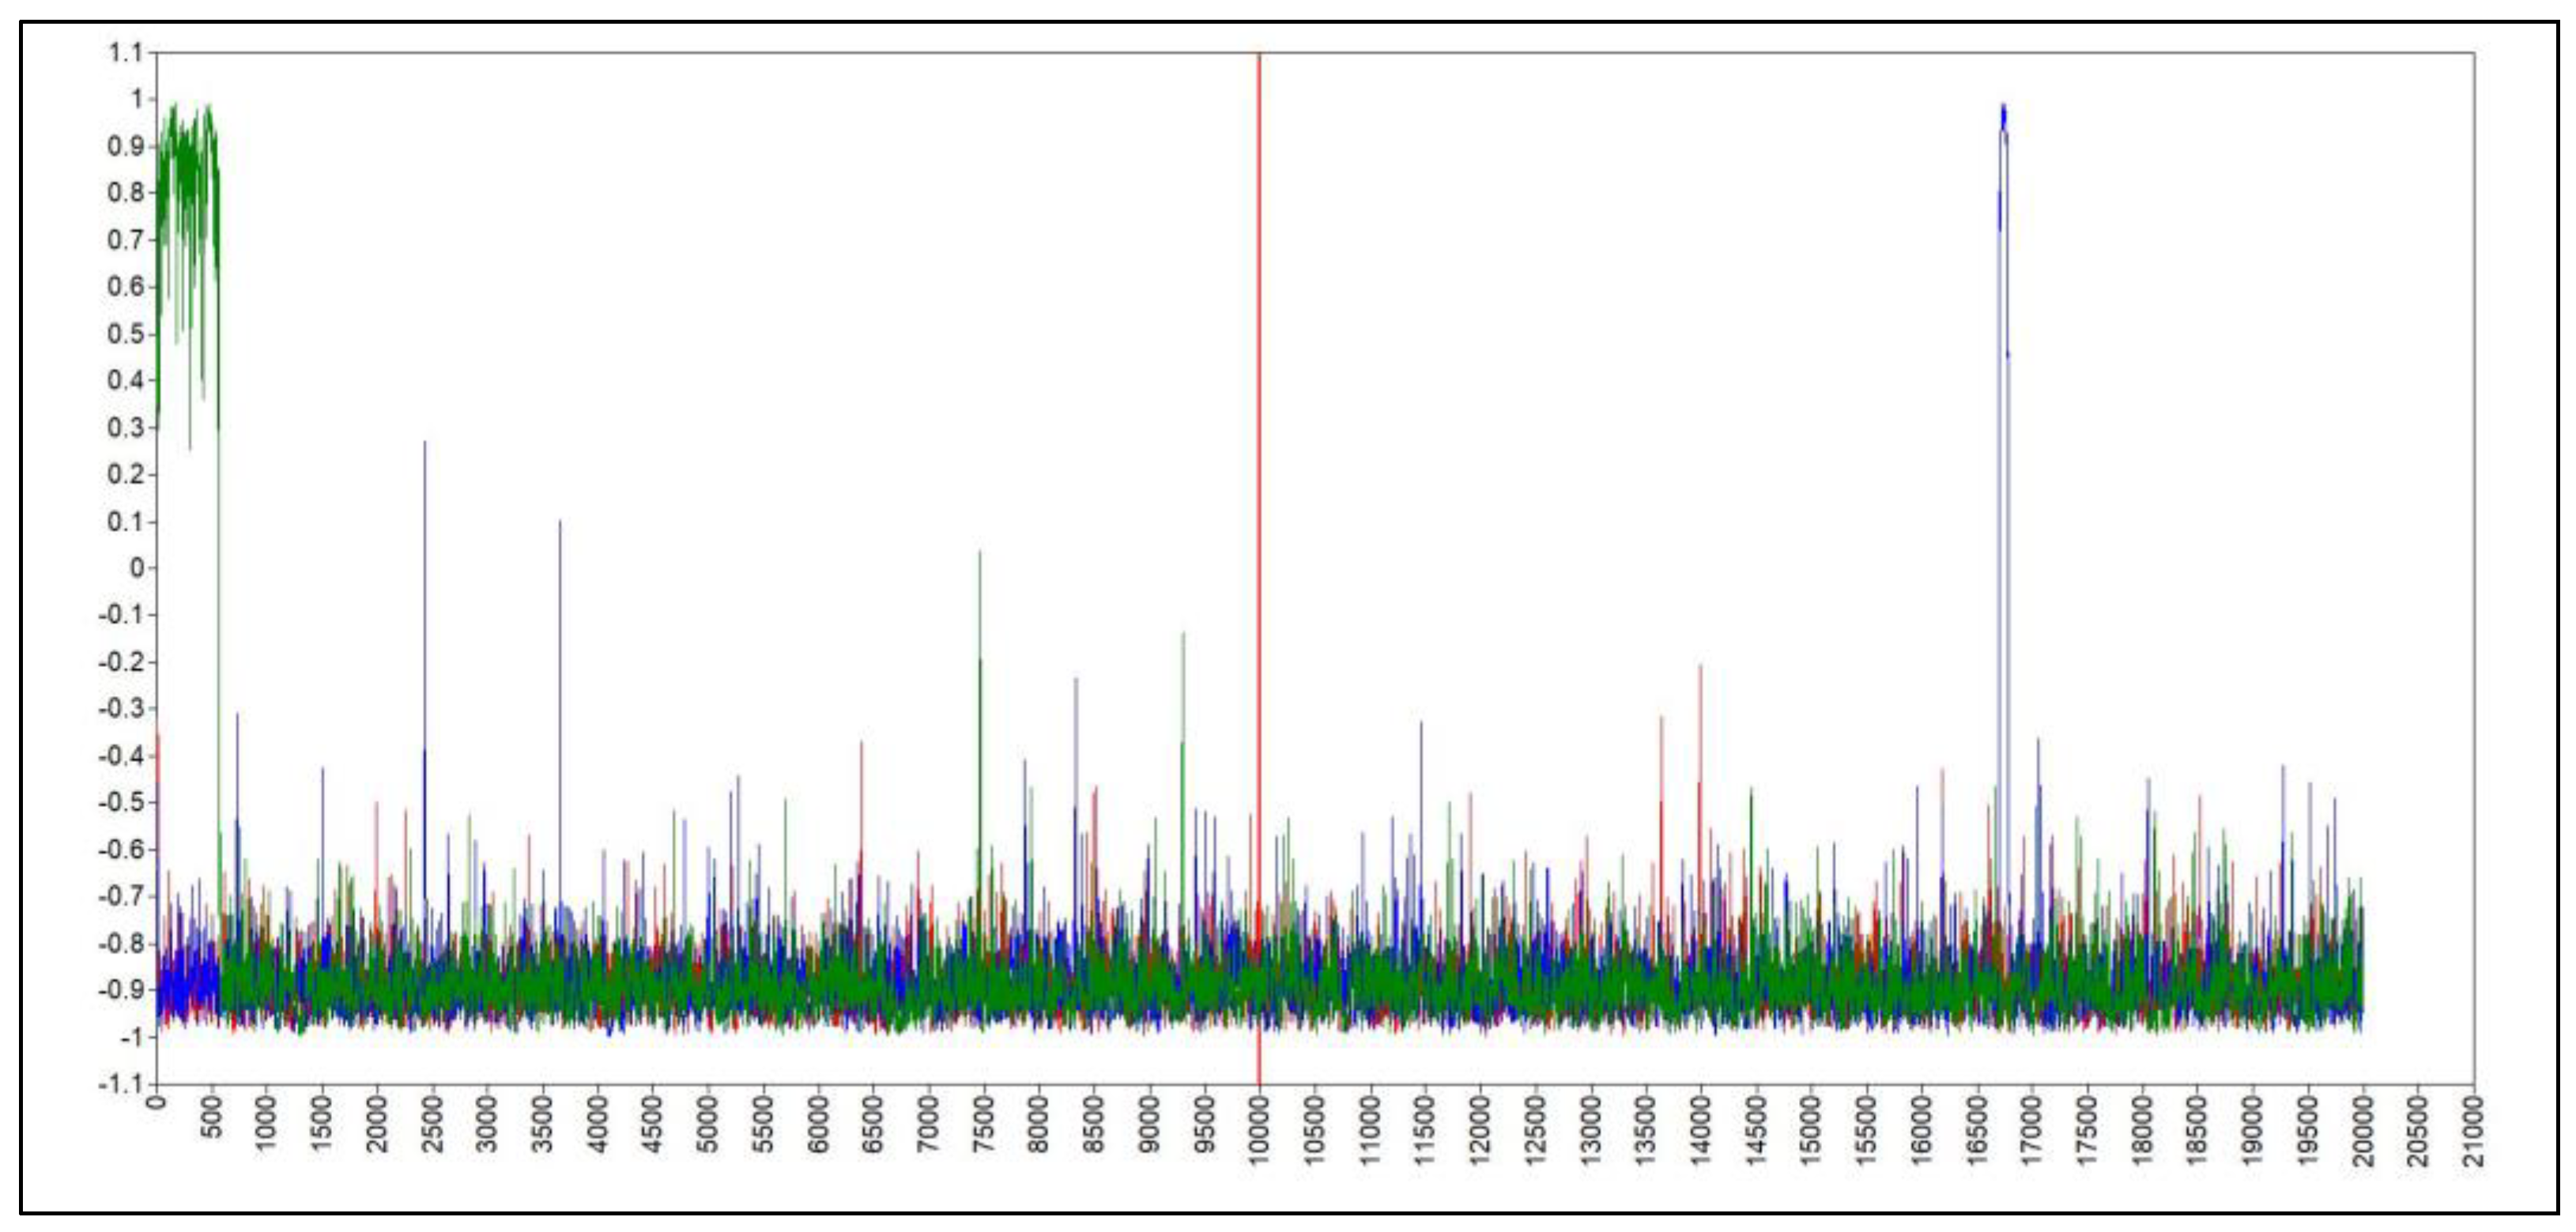
Figure 3.
Mplus Output Diagram Obtained for B-LGC Model Examined in Hypothesis H8a.
Figure 4.
Bayesian Trace Plot Obtained for Slope Factor of the Moderation Interaction Term (INT) Examined in H8a.
Figure 4.
Bayesian Trace Plot Obtained for Slope Factor of the Moderation Interaction Term (INT) Examined in H8a.
5. Discussion
These results clearly illustrate that reducing the inventory of CO₂e emissions in those industrial sectors with a high consumption of fossil-based energy sources helps to improve corporate environmental as well as financial performance. The interpretation of these results can be twofold. First, continuing to focus on measuring and reducing only emissions from their own operations (Scope 1 CO₂e) and from their own electricity consumption (Scope 2 CO₂e) continues to be profitable for these companies in the short term. Secondly, the world's largest energy-intensive companies appear to derive greater economic benefits from having a more accurate and detailed understanding of GHG emissions from their supply chain (Scope 3 CO₂e). Consequently, these empirical results are consistent with the resource-based view (RBV) of the firm.
On the other hand, this study suggests that, although clean and renewable energies can help deep decarbonization in the sample of companies studied, the results show that the change to new sources of clean and renewable energy is a gradual process that requires considerable capital investment (Castro et al., 2021), which dampens the effect of the reduction of Scope 2 CO₂e and Scope 3 CO₂e emissions on the efficiency of energy- and CO₂e -intensive firms to generate greater profits. Likewise, our results indicate that innovation based on clean and on renewable energy technologies, when driven by government environmental policies aimed at reducing emissions from the corporate value chain (Scope 3 CO₂e), represents an effective mechanism for these companies to achieve the objectives of net zero emissions and increasing the profitability of the business, since the emissions of the value chain (Scope 3 CO₂e) represent most of companies’ total carbon footprint (Downie & Stubbs, 2012). In this regard, based on the ecological modernization theory (EMT), this result is consistent with an “eco-innovation” strategy (Jänicke, 2008; Lin et al., 2019).
This paper makes three main contributions to the literature on business and environmental sustainability. First, it integrates two theoretical frameworks, the eco-innovation theory (Arranz et al., 2021; Bitencourt et al., 2020; Hojnik & Ruzzier, 2016) and the ecological modernization theory (Huber, 2000; Jänicke, 2008), using a structural equation model, which has predictive and explanatory power (Hair et al., 2017). Second, it provides empirical evidence of the positive moderating effect of clean energy innovation on the efforts of high-polluting industries to reduce their carbon footprint while generating higher returns for their shareholders, at the same time reducing this negative impact on climate change. Third, it identifies the importance of technological innovation in clean energy in the transition towards a deep and accelerated decarbonization in these industries.
6. Conclusion and Implications
The findings reveal a significantly positive impact of corporate carbon footprint on profits. More specifically, we found a significant positive relationship among the following direct interactions: (a) Scope 1 CO₂e on EBITDA Mrg, (b) Scope 3 CO₂e on Pr Mrg, (c) Scope 1+2 CO₂e on EBITDA Mrg and Pr Mrg and d) Scope 1+2 +3 CO₂e on EBITDA Mrg, Pr Mrg and Op Mrg. On the other hand, the results of the B-LGC model also support the hypothesis that clean energy innovation, when measured using renewable energy consumption, positively moderates the relationship between value chain emissions (Scope 3 CO₂e) and the gross profit margin in energy- and CO₂e -intensive industries. Furthermore, we found only marginal effects of moderating interaction of renewable energy consumption in the relationships of Scope 2 CO₂e emissions with the gross profit margin, and EBITDA margin, as well as in the relationship between Scope 3 CO₂e emissions and the operating margin.
This paper has several important implications for academics, for senior executives of companies with significant fossil CO₂e emissions, and for those who make public policy associated with GHG emissions and climate change. For researchers and academics, this study provides empirical evidence of the impact of clean energy innovation on CO₂e-intensive companies in a global context of deep industrial decarbonization, and also supports the importance of the concept of eco-innovation coming from the ecological modernization approach (Ding et al., 2019) in management practices and in corporate environmental strategies. For executives and managers of CO₂e-intensive companies, consideration of the importance of the emissions of the entire business’s value chain (Scope 3 CO₂e), and not only Scope 1 and Scope 2 CO₂e emissions, represents an effective mechanism to obtain greater competitive advantages. Policy makers must pay particular attention to Scope 3 CO₂e emissions that are produced by CO₂e-intensive companies and industries in order to formulate regulatory and control mechanisms that stimulate clean energy innovation.
However, this study has some limitations that could be resolved by future research. Firstly, given the evidently sparse literature on metrics for clean energy innovation at the level of the firm, we used a single output metric as an indicator of this construct. Future studies could include additional input metrics, that is, those corresponding to the first stages of the innovation process for clean energy technologies. Secondly, due to the scarcity of reliable statistical data, this is a longitudinal study whose time horizon is limited to 7 years (2015 to 2021), while the existing literature on longitudinal studies suggests the need for a minimum timeframe of 10 years to overcome random variation (Richard et al., 2009). Therefore, future research might explore extensions of this timeframe, even using data containing missing values.
Funding
This research received no external funding.
Conflicts of Interest
The authors declare no conflict of interest.
Appendix A
Mplus-specific syntax for the B-LGC model
Note: Based on “An introduction to Bayesian statistics in health psychology,” by S. Depaoli, H. M. Rus, J. P. Clifton, R. van de Schoot, & J. Tiemensma, 2017, Health Psychology Review, 11(3), 248–264.
References
- Alvarez, S. , Carballo-Penela, A., Mateo-Mantecón, I., & Rubio, A. (2016). Strengths-Weaknesses-Opportunities-Threats analysis of carbon footprint indicator and derived recommendations. Journal of Cleaner Production, 121. [CrossRef]
- Arranz, N. , Arguello, N. L., & Fernández de Arroyabe, J. C. (2021). How do internal, market and institutional factors affect the development of eco-innovation in firms? Journal of Cleaner Production, 297. [CrossRef]
- Bai, C. , Feng, C., Du, K., Wang, Y., & Gong, Y. (2020). Understanding spatial-temporal evolution of renewable energy technology innovation in China: Evidence from convergence analysis. Energy Policy, 143. [CrossRef]
- Barney, J. (1991). Firm Resources and Sustained Competitive Advantage On behalf of: Southern Management Association can be found at: Journal of Management Additional services and information for. Journal of Management, 17(1). [CrossRef]
- Bataille, C. , Åhman, M., Neuhoff, K., Nilsson, L. J., Fischedick, M., Lechtenböhmer, S., Solano-Rodriquez, B., Denis-Ryan, A., Stiebert, S., Waisman, H., Sartor, O., & Rahbar, S. (2018). A review of technology and policy deep decarbonization pathway options for making energy-intensive industry production consistent with the Paris Agreement. In Journal of Cleaner Production (Vol. 187). [CrossRef]
- Bitencourt, C. C. , de Oliveira Santini, F., Zanandrea, G., Froehlich, C., & Ladeira, W. J. (2020). Empirical generalizations in eco-innovation: A meta-analytic approach. Journal of Cleaner Production, 245, 118721. [CrossRef]
- Boiral, O. , Henri, J. F., & Talbot, D. (2012). Modeling the Impacts of Corporate Commitment on Climate Change. Business Strategy and the Environment, 21. [CrossRef]
- BP (2018). Advancing the energy transition. Available online: https://www.bp.com/content/dam/bp/business-sites/en/global/corporate/pdfs/sustainability/group-reports/bp-advancing-the-energy-transition.pdf.
- Broadstock, D. C. , Collins, A., Hunt, L., & Vergos, K. (2017). Voluntary disclosure, greenhouse gas emissions and business performance: Assessing the first decade of reporting. British Accounting Review, 50, 48–59.
- Busch, J., Foxon, T. J., & Taylor, P. G. (2018). Designing industrial strategy for a low carbon transformation. Environmental Innovation and Societal Transitions, 29, 114–125. [CrossRef]
- Busch, T. , Bassen, A., Lewandowski, S., & Sump, F. (2022). Corporate Carbon and Financial Performance Revisited. Organization and Environment, 35(1). [CrossRef]
- Busch, T. , & Lewandowski, S. (2018). Corporate Carbon and Financial Performance: A Meta-analysis. Journal of Industrial Ecology, 22(4), 745–759. [CrossRef]
- Byrne, B. M. (2012). Structural Equation Modeling with Mplus. Basic Concepts, Applications n Programming. In Structural Equation Modeling with Mplus.
- Cadez, S., Czerny, A., & Letmathe, P. (2019). Stakeholder pressures and corporate climate change mitigation strategies. Business Strategy and the Environment, 28(1), 1–14. [CrossRef]
- Capurso, T. , Stefanizzi, M., Torresi, M., & Camporeale, S. M. (2022). Perspective of the role of hydrogen in the 21st century energy transition. In Energy Conversion and Management (Vol. 251). [CrossRef]
- Castro, P., Gutiérrez-López, C., Tascón, M. T., & Castaño, F. J. (2021). The impact of environmental performance on stock prices in the green and innovative context. Journal of Cleaner Production, 320, 128868. [CrossRef]
- Cheng, Y. , & Yao, X. (2021). Carbon intensity reduction assessment of renewable energy technology innovation in China: A panel data model with cross-section dependence and slope heterogeneity. Renewable and Sustainable Energy Reviews, 135 110157. [CrossRef]
- Chevron. (2018). Climate change resilience: A framework for decision making. Available online: https://www.chevron.com/-/media/shared-media/documents/chevron-sustainability-report-2022.pdf.
- Dahlmann, F. , Branicki, L., & Brammer, S. (2019). Managing Carbon Aspirations: The Influence of Corporate Climate Change Targets on Environmental Performance. Journal of Business Ethics, 158. [CrossRef]
- Damert, M. , & Baumgartner, R. J. (2018). Intra-Sectoral Differences in Climate Change Strategies: Evidence from the Global Automotive Industry. Business Strategy and the Environment, 27. [CrossRef]
- Demirel, P. , & Kesidou, E. (2019). Sustainability-oriented capabilities for eco-innovation: Meeting the regulatory, technology, and market demands. Business Strategy and the Environment, 28. [CrossRef]
- Depaoli, S. , Rus, H. M., Clifton, J. P., van de Schoot, R., & Tiemensma, J. (2017). An introduction to Bayesian statistics in health psychology. Health Psychology Review, 11. [CrossRef]
- Ding, L. , Ye, R. M., & Wu, J. xi. (2019). Platform strategies for innovation ecosystem: Double-case study of Chinese automobile manufactures. Journal of Cleaner Production, 209. [CrossRef]
- Downie, J. , & Stubbs, W. (2012). Corporate carbon strategies and greenhouse gas emission assessments: The implications of scope 3 emission factor selection. Business Strategy and the Environment, 21. [CrossRef]
- Fernández-Cuesta, C., Castro, P., Tascón, M. T., & Castaño, F. J. (2019). The effect of environmental performance on financial debt. European evidence. Journal of Cleaner Production, 207. [CrossRef]
- Freeman, R. E. (1984). Strategic Management: A Stakeholder Approach. Pitman: London. In Business Ethics Quarterly (Vol. 4, Issue 4).
- Galama, J. T. , & Scholtens, B. (2021). A meta-analysis of the relationship between companies’ greenhouse gas emissions and financial performance. In Environmental Research Letters (Vol. 16, Issue 4). [CrossRef]
- Gallagher, K. S. , Anadon, L. D., Kempener, R., & Wilson, C. (2011). Trends in investments in global energy research, development, and demonstration. In Wiley Interdisciplinary Reviews: Climate Change (Vol. 2, Issue 3). [CrossRef]
- Gallagher, K. S. , Holdren, J. P., & Sagar, A. D. (2006). Energy-Technology Innovation. Annual Review of Environment and Resources, 31. 193–237. [CrossRef]
- Geiser, C. (2021). Longitudinal structural equation modeling with Mplus: A latent state–trait perspective. In Longitudinal structural equation modeling with Mplus: A latent state–trait perspective. The Guilford Press.
- Gelman, A. , Carlin, J., Stern, H., Dunson, D., Aki, Vehtari., & Rubin, D. (2013). Bayesian data analysis Gelman. In Texts in Statistical Science (Vol. 53, Issue 9).
- Haney, A. B. (2017). Threat Interpretation and Innovation in the Context of Climate Change: An Ethical Perspective. Journal of Business Ethics, 143. [CrossRef]
- Hang, M. , Geyer-Klingeberg, J., & Rathgeber, A. W. (2019). It is merely a matter of time: A meta-analysis of the causality between environmental performance and financial performance. Business Strategy and the Environment, 28. [CrossRef]
- Harangozo, G. , & Szigeti, C. (2017). Corporate carbon footprint analysis in practice – With a special focus on validity and reliability issues. Journal of Cleaner Production, 167. [CrossRef]
- Hertwich, E. G. , & Peters, G. P. (2009). Carbon footprint of nations: A global, trade-linked analysis. Environmental Science and Technology, 43(16). [CrossRef]
- Hojnik, J. , & Ruzzier, M. (2016). What drives eco-innovation? A review of an emerging literature. Environmental Innovation and Societal Transitions, 19. [CrossRef]
- Horbach, J. , & Rammer, C. (2018). Energy transition in Germany and regional spillovers: The diffusion of renewable energy in firms. Energy Policy, 121. [CrossRef]
- Hoyle R., H. (2012). Handbook of structural equation modeling.
- Huber, J. (2000). Towards industrial ecology: Sustainable development as a concept of ecological modernization. Journal of Environmental Policy and Planning, 2. [CrossRef]
- Jackson, J. , & Belkhir, L. (2018). Assigning firm-level GHGE reductions based on national goals - Mathematical model & empirical evidence. Journal of Cleaner Production, 170. [CrossRef]
- Jänicke, M. (2008). Ecological modernisation: new perspectives. Journal of Cleaner Production, 16. [CrossRef]
- Kim, S. , Terlaak, A., & Potoski, M. (2021). Corporate sustainability and financial performance: Collective reputation as moderator of the relationship between environmental performance and firm market value. Business Strategy and the Environment, 30. [CrossRef]
- Kruschke, J. K. Doing Bayesian data analysis: A tutorial with R, JAGS, and Stan, second edition. In Doing Bayesian Data Analysis: A Tutorial with R, JAGS, and Stan, Second Edition. [CrossRef]
- Lewandowski, S. (2017). Corporate Carbon and Financial Performance: The Role of Emission Reductions. Business Strategy and the Environment, 26. [CrossRef]
- Lewandowski, S. , & Ullrich, A. (2023). Measures to reduce corporate GHG emissions: A review-based taxonomy and survey-based cluster analysis of their application and perceived effectiveness. In Journal of Environmental Management (Vol. 325). [CrossRef]
- Li, F. , Duncan, T. E., & Acock, A. (2000). Modeling interaction effects in latent growth curve models. Structural Equation Modeling, 7. [CrossRef]
- Lin, W. L. , Cheah, J. H., Azali, M., Ho, J. A., & Yip, N. (2019). Does firm size matter? Evidence on the impact of the green innovation strategy on corporate financial performance in the automotive sector. Journal of Cleaner Production, 229. [CrossRef]
- Little, T. D. (2013). Longitudinal structural equation modeling. In Longitudinal structural equation modeling. Guilford Press.
- Maama, H., Doorasamy, M., & Rajaram, R. (2021). Cleaner production, environmental and economic sustainability of production firms in South Africa. Journal of Cleaner Production, 298. [CrossRef]
- Makridou, G., Doumpos, M., & Galariotis, E. (2019). The financial performance of firms participating in the EU emissions trading scheme. Energy Policy, 129. [CrossRef]
- McArdle, J. J. , & Nesselroade, J. R. (2014). Longitudinal data analysis using structural equation models. In Longitudinal data analysis using structural equation models. [CrossRef]
- Muthén, B. , & Asparouhov, T. (2012). Bayesian structural equation modeling: A more flexible representation of substantive theory. Psychological Methods, 17. [CrossRef]
- Naranjo Tuesta, Y. , Crespo Soler, C., & Ripoll Feliu, V. (2021). Carbon management accounting and financial performance: Evidence from the European Union emission trading system. Business Strategy and the Environment, 30. [CrossRef]
- Nelson, R. , & Sidney, W. (1982). An Evolutionary Theory of Economic Change (Belknap Press, Ed.). Harvard University Press.
- Newsom, J. T. (2015). Longitudinal Structural Equation Modeling. In Longitudinal Structural Equation Modeling. [CrossRef]
- Nguyen, Q. , Diaz-Rainey, I., & Kuruppuarachchi, D. (2021). Predicting corporate carbon footprints for climate finance risk analyses: A machine learning approach. Energy Economics, 95. [CrossRef]
- Oravecz, Z. , & Muth, C. (2018). Fitting growth curve models in the Bayesian framework. Psychonomic Bulletin and Review, 25(1). [CrossRef]
- Penz, E. , & Polsa, P. (2018). How do companies reduce their carbon footprint and how do they communicate these measures to stakeholders? Journal of Cleaner Production, 195. [CrossRef]
- Pons, M., Bikfalvi, A., Llach, J., & Palcic, I. (2013). Exploring the impact of energy efficiency technologies on manufacturing firm performance. Journal of Cleaner Production, 52. [CrossRef]
- Porter, M. E. , & Linde, C. Van Der. (1995). Green and Competitive : Ending the Stalemate Green and Competitive. Harvard Business Review, 73(5).
- Rentschler, J. , & Kornejew, M. (2017). Energy price variation and competitiveness: Firm level evidence from Indonesia. Energy Economics, 67. [CrossRef]
- Richard, P. J. , Devinney, T. M., Yip, G. S., & Johnson, G. (2009). Measuring organizational performance: Towards methodological best practice. In Journal of Management (Vol. 35, Issue 3). [CrossRef]
- Rissman, J. , Bataille, C., Masanet, E., Aden, N., Morrow, W. R., Zhou, N., Elliott, N., Dell, R., Heeren, N., Huckestein, B., Cresko, J., Miller, S. A., Roy, J., Fennell, P., Cremmins, B., Koch Blank, T., Hone, D., Williams, E. D., de la Rue du Can, S., … Helseth, J. (2020). Technologies and policies to decarbonize global industry: Review and assessment of mitigation drivers through 2070. In Applied Energy (Vol. 266). [CrossRef]
- Robaina, M. , & Madaleno, M. (2020). The relationship between emissions reduction and financial performance: Are Portuguese companies in a sustainable development path? Corporate Social Responsibility and Environmental Management, 27. [CrossRef]
- Russo, A. , Pogutz, S., & Misani, N. (2021). Paving the road toward eco-effectiveness: Exploring the link between greenhouse gas emissions and firm performance. Business Strategy and the Environment, 30. [CrossRef]
- Ruttan, V. W. (1997). Induced innovation, evolutionary theory and path dependence: Sources of technical change. Economic Journal, 107. [CrossRef]
- Shahab, Y. , Ntim, C. G., Chengang, Y., Ullah, F., & Fosu, S. (2018). Environmental policy, environmental performance, and financial distress in China: Do top management team characteristics matter? Business Strategy and the Environment, 27. [CrossRef]
- Shahgholian, A. (2019). Unpacking the relationship between environmental profile and financial profile; literature review toward methodological best practice. In Journal of Cleaner Production (Vol. 233). [CrossRef]
- Shell. (2018). Shell Energy Transition Report. Available online: https://www.shell.com/about-us/annual-publications/annual-reports-download-centre/_jcr_content/root/main/section/list_1340539940/list_item_copy_copy_.multi.stream/1658493306964/3f2ad7f01e2181c302cdc453c5642c77acb48ca3/web-shell-energy-transition-report.pdf.
- Smith, W. L. , Hillon, Y. C., & Liang, Y. (2019). Reassessing measures of sustainable firm performance: A consultant’s guide to identifying hidden costs in corporate disclosures. Business Strategy and the Environment, 28. [CrossRef]
- Spaargaren, G. (1997). The ecological modernization of production and consumption. Prof.Dr.A.T.J. de Nooij (Supervisor), Wageningen Agricultural University, the Netherlands.
- Trencher, G. , Rinscheid, A., Rosenbloom, D., & Truong, N. (2022). The rise of phase-out as a critical decarbonisation approach: a systematic review. Environmental Research Letters, 17(12). [CrossRef]
- Van de Schoot, R. , Kaplan, D., Denissen, J., Asendorpf, J. B., Neyer, F. J., & van Aken, M. A. G. (2014). A Gentle Introduction to Bayesian Analysis: Applications to Developmental Research. Child Development, 85. [CrossRef]
- Velte, P. , Stawinoga, M., & Lueg, R. (2020). Carbon performance and disclosure: A systematic review of governance-related determinants and financial consequences. In Journal of Cleaner Production (Vol. 254). [CrossRef]
- Wang, L. , Li, S., & Gao, S. (2014). Do greenhouse gas emissions affect financial performance? - An empirical examination of Australian public firms. Business Strategy and the Environment, 23. [CrossRef]
- WBCSD, & WRI. (2011). The GHG Protocol The Corporate Value Chain (Scope 3) Accounting and Reporting Standard. Available online: https://ghgprotocol.org/sites/default/files/standards/Corporate-Value-Chain-Accounting-Reporing-Standard_041613_2.pdf.
- WBCSD, & WRI. (2013). Technical Guidance for Calculating Scope 3 Emissions (version1.0): Supplement to the Corporate Value Chain (Scope 3) Accounting & Reporting Standard. Available online: https://ghgprotocol.org/sites/default/files/standards/Scope3_Calculation_Guidance_0.pdf.
- WBCSD, & WRI. (2015). The GHG Protocol Corporate Accounting and Reporting Standard, revised edition. Available online: https://ghgprotocol.org/sites/default/files/standards/Scope3_Calculation_Guidance_0.pdf.
- Wedari, L. K. , Moradi-Motlagh, A., & Jubb, C. (2023). The moderating effect of innovation on the relationship between environmental and financial performance: Evidence from high emitters in Australia. Business Strategy and the Environment, 32. [CrossRef]
- Wen, Z. , Marsh, H. W., & Hau, K. T. (2002). Interaction effects in growth modeling: A full model. Structural Equation Modeling, 9. [CrossRef]
- Wen, Z. , Marsh, H. W., Hau, K. T., Wu, Y., Liu, H., & Morin, A. J. S. (2014). Interaction Effects in Latent Growth Models: Evaluation of Alternative Estimation Approaches. Structural Equation Modeling, 21. [CrossRef]
- Wesseling, J. H. , Lechtenböhmer, S., Åhman, M., Nilsson, L. J., Worrell, E., & Coenen, L. (2017). The transition of energy intensive processing industries towards deep decarbonization: Characteristics and implications for future research. In Renewable and Sustainable Energy Reviews (Vol. 79). [CrossRef]
- Wimbadi, R. W. , & Djalante, R. (2020). From decarbonization to low carbon development and transition: A systematic literature review of the conceptualization of moving toward net-zero carbon dioxide emission (1995–2019). In Journal of Cleaner Production (Vol. 256). [CrossRef]
- Wright, C. , & Nyberg, D. (2017). An inconvenient truth: How organizations translate climate change into business as usual. Academy of Management Journal, 60. [CrossRef]
- Yagi, M. , & Managi, S. (2018). Decomposition analysis of corporate carbon dioxide and greenhouse gas emissions in Japan: Integrating corporate environmental and financial performances. Business Strategy and the Environment, 27. [CrossRef]
- Yan, X. , He, Y., & Fan, A. (2023). Carbon footprint prediction considering the evolution of alternative fuels and cargo: A case study of Yangtze river ships. Renewable and Sustainable Energy Reviews, 173. [CrossRef]
- Yang, F. , Cheng, Y., & Yao, X. (2019). Influencing factors of energy technical innovation in China: Evidence from fossil energy and renewable energy. Journal of Cleaner Production, 232. [CrossRef]
- Zhang, F. , Gallagher, K. S., Myslikova, Z., Narassimhan, E., Bhandary, R. R., & Huang, P. (2021). From fossil to low carbon: The evolution of global public energy innovation. In Wiley Interdisciplinary Reviews: Climate Change (Vol. 12, Issue 6). [CrossRef]
- Zhang, F. , Tang, T., Su, J., & Huang, K. (2020). Inter-sector network and clean energy innovation: Evidence from the wind power sector. Journal of Cleaner Production, 263. [CrossRef]
- Zhang, Z. , Hamagami, F., Wang, L., Nesselroade, J. R., & Grimm, K. J. (2007). Bayesian analysis of longitudinal data using growth curve models. International Journal of Behavioral Development, 31(4). [CrossRef]
- Zhou, L., Wang, M., & Zhang, Z. (2021). Intensive Longitudinal Data Analyses With Dynamic Structural Equation Modeling. Organizational Research Methods, 24(2), 219–250. 2). [CrossRef]
- Zhou, Y. , Shu, C., Jiang, W., & Gao, S. (2019). Green management, firm innovations, and environmental turbulence. Business Strategy and the Environment, 28. [CrossRef]
Figure 1.
Conceptual Model.
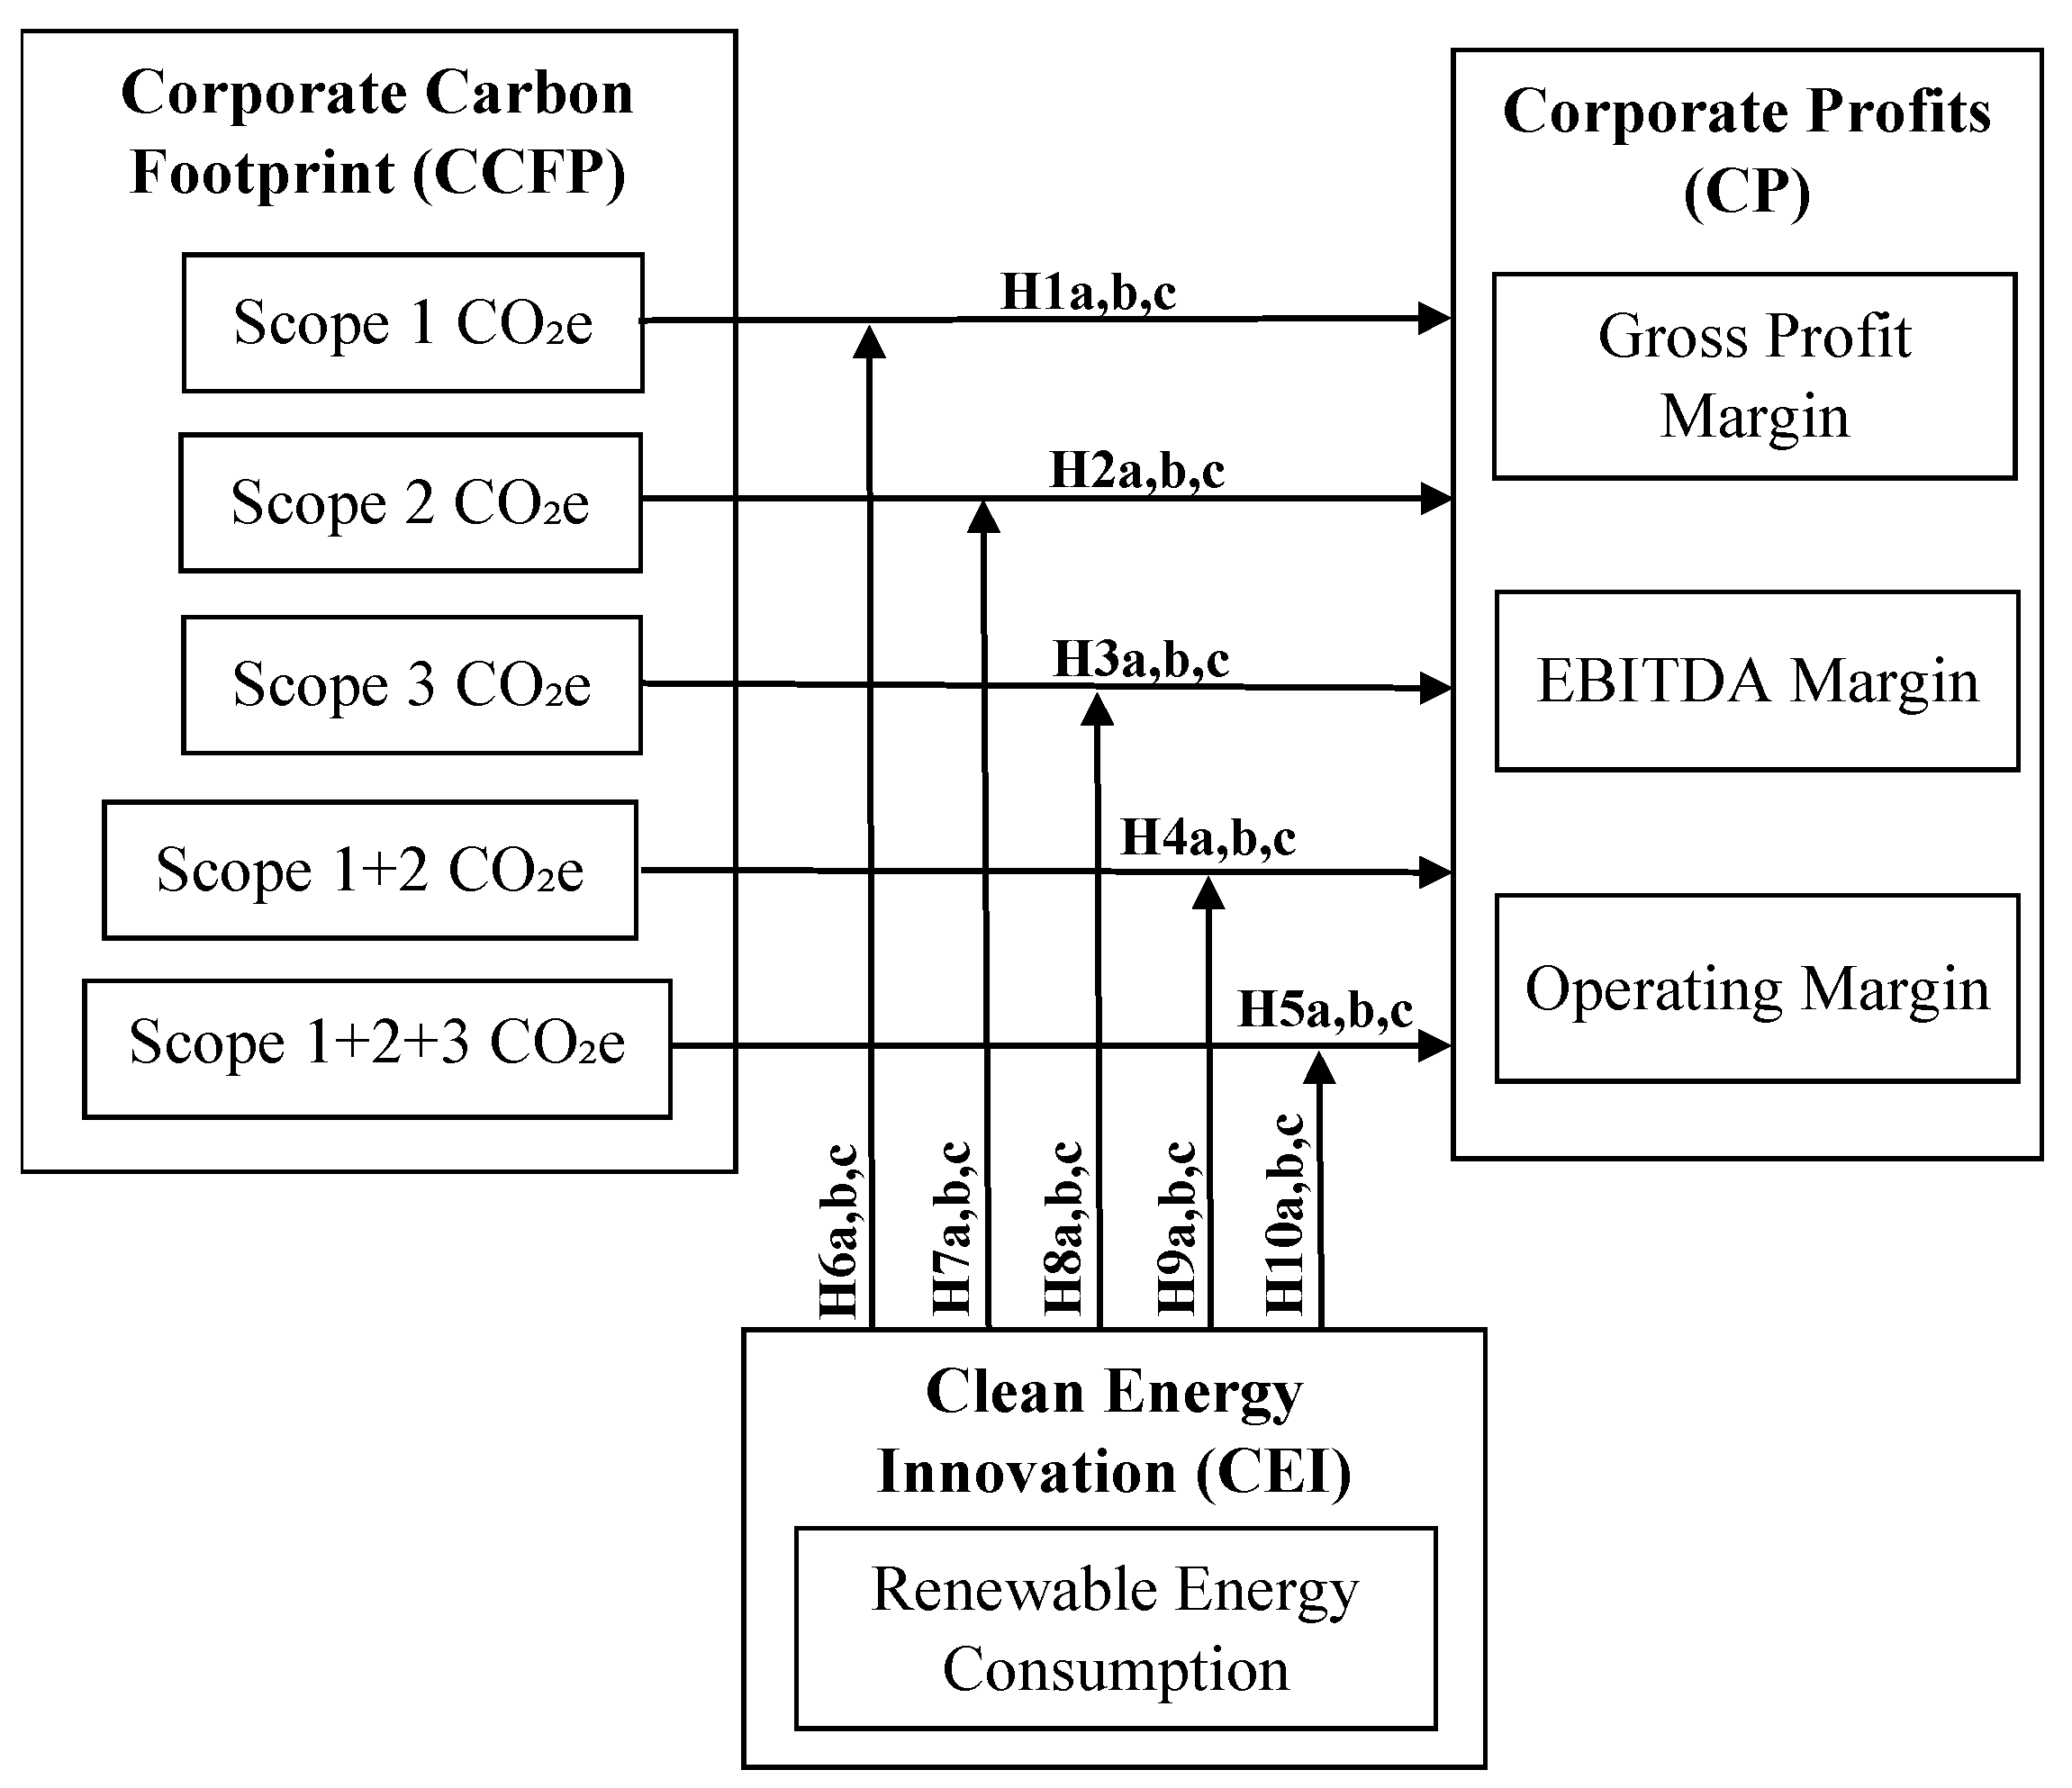
Figure 2.
Path Diagram of the B-LGC Model Pertaining to a Latent Growth Curve Model for Three Constructs and Seven Time Points (𝑡=.1,2,…7). Note. = latent growth outcome variables (𝑗=1,2,3); = latent growth predictor (i=1,2,3,..,5); 𝑍 = latent moderation variable; , = intercept and slope factors for 𝑍; , = intercept and slope factors for ; = latent product indicator for slope factor of moderating interaction term; , = latent residual variables; , = measurement error variables. Adapted from “Interaction effects in latent growth models: Evaluation of alternative estimation approaches,” by Z. Wen et al., 2014, Structural Equation Modeling: A Multidisciplinary Journal, 21(3), 361–374, and “Modeling interaction effects in latent growth curve models,” by F. Li et al., 2000, Structural Equation Modeling: A Multidisciplinary Journal, 7, 497–533.
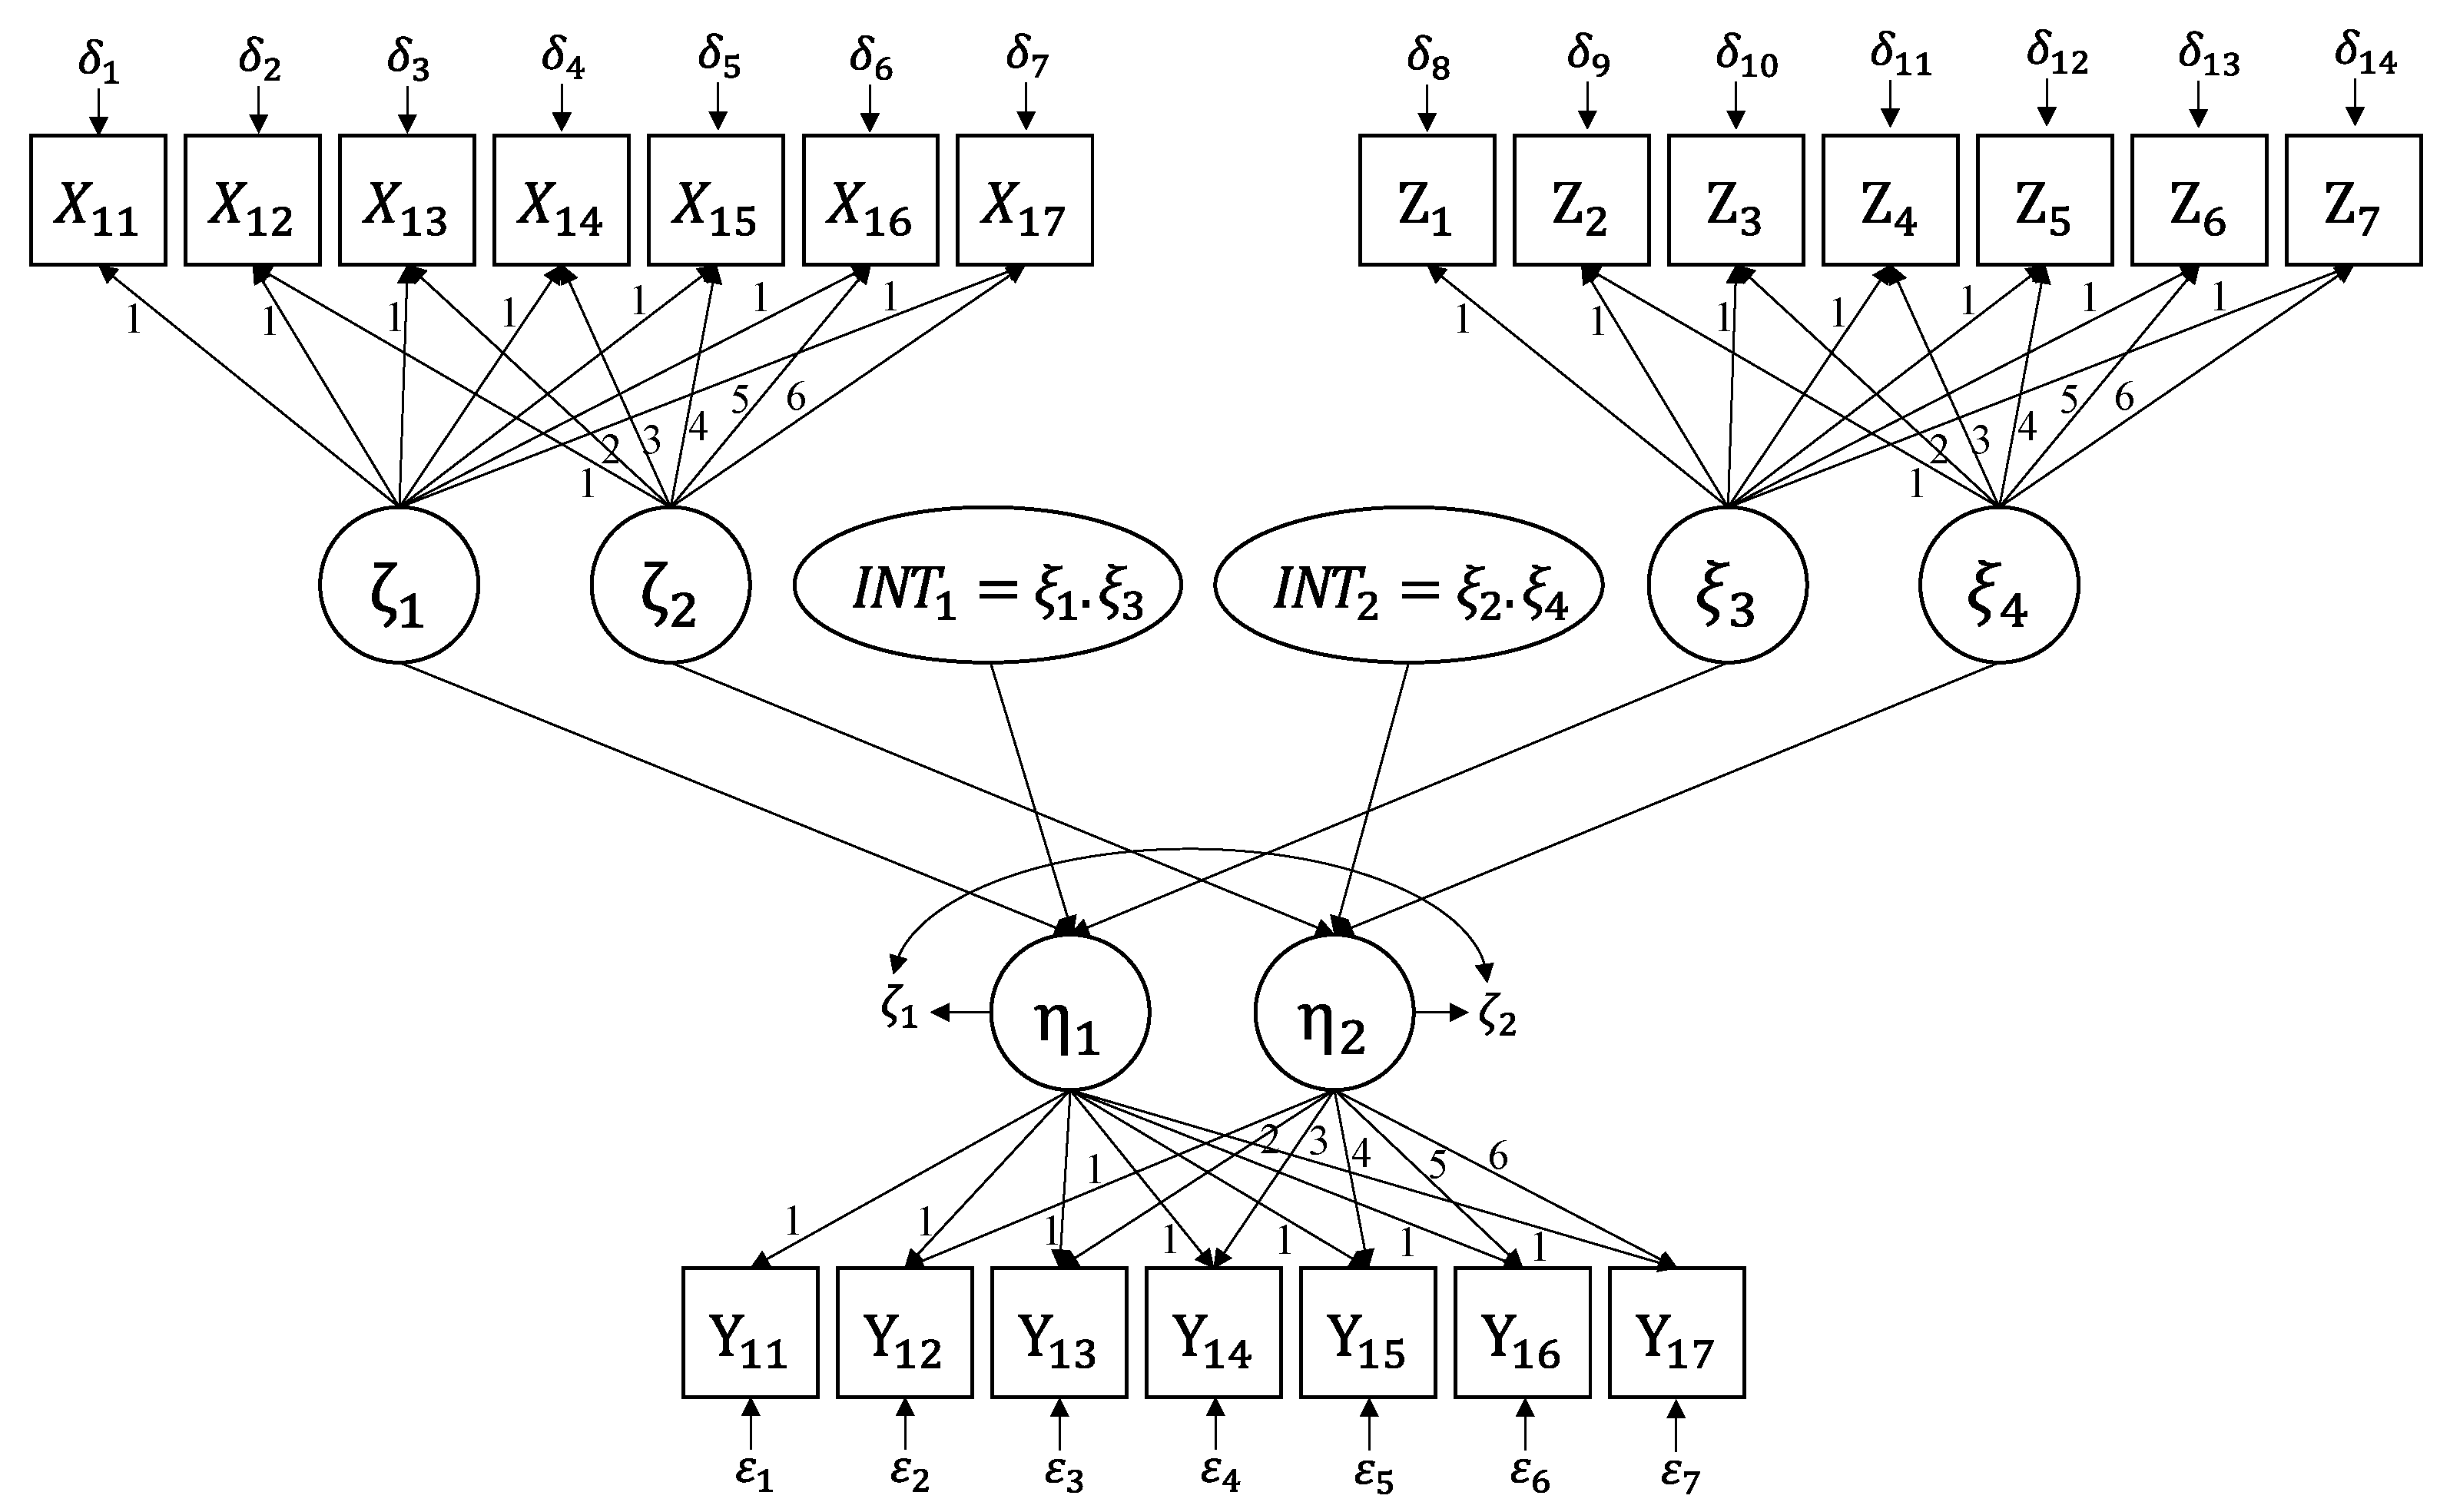
Figure 5.
Parameter Autocorrelation Plot Obtained for Slope Factor of the Moderation Interaction Term (INT) Examined in H8a.
Figure 5.
Parameter Autocorrelation Plot Obtained for Slope Factor of the Moderation Interaction Term (INT) Examined in H8a.
Figure 6.
Posterior Parameter Distribution Plot Obtained for Slope Factor of the Moderation Interaction Term () Examined in H8a.
Figure 6.
Posterior Parameter Distribution Plot Obtained for Slope Factor of the Moderation Interaction Term () Examined in H8a.
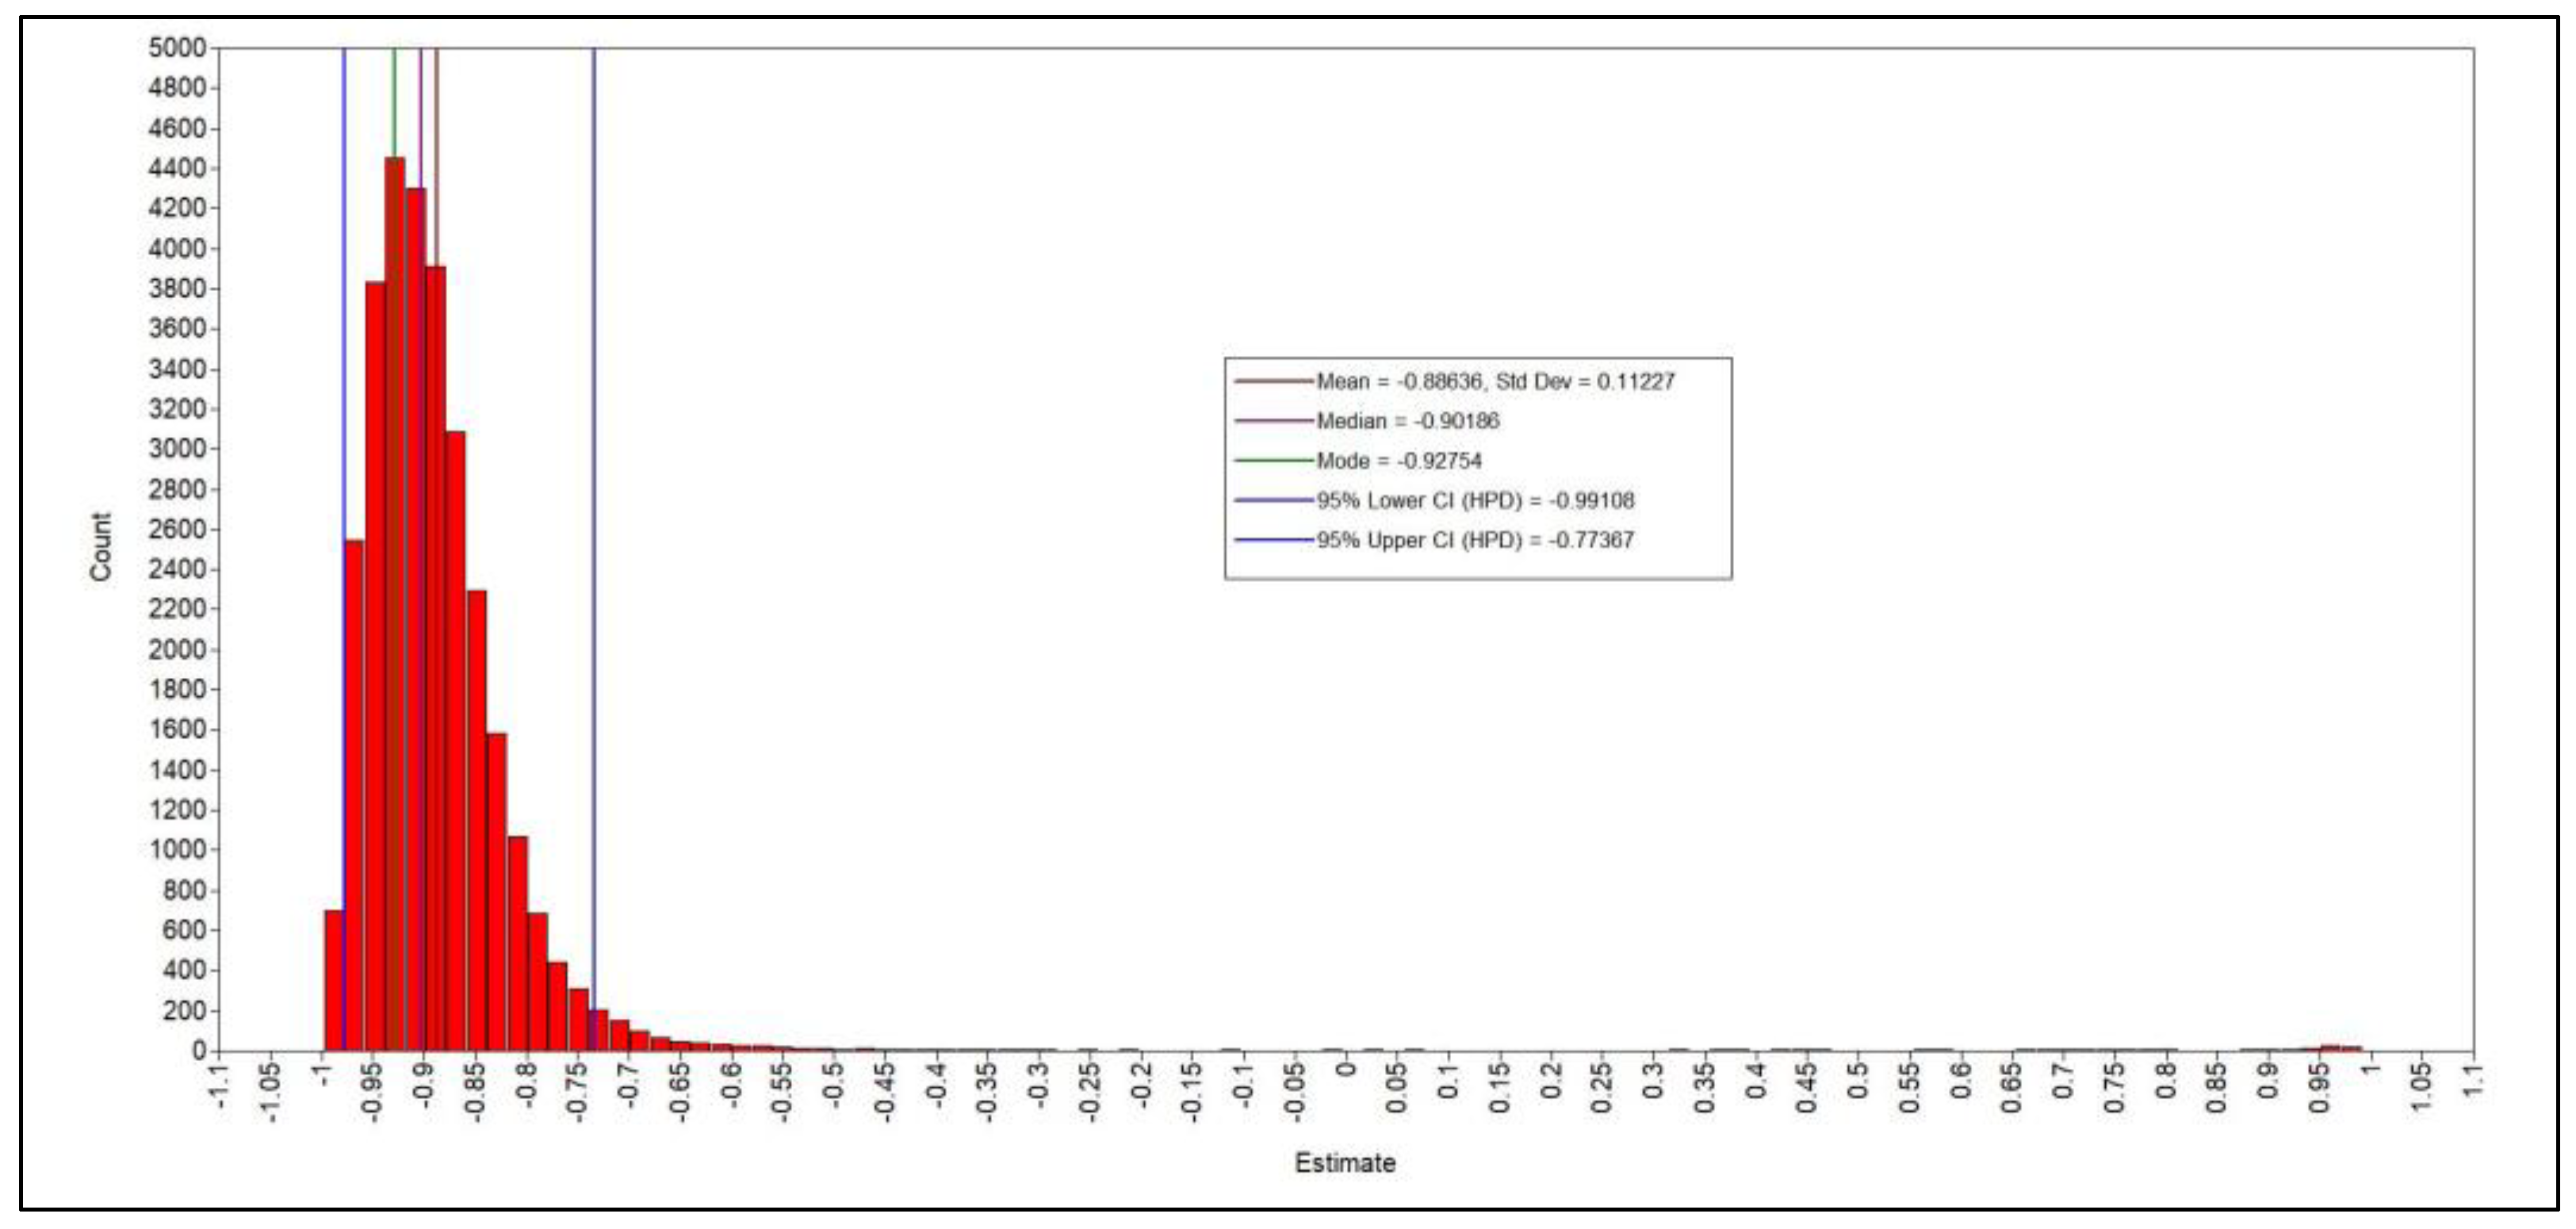

Table 1.
Distribution of the Sample of Firms by Sector and Region.
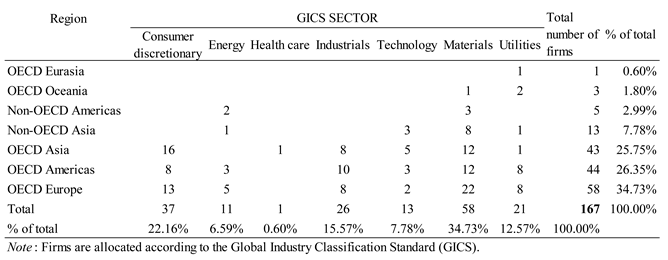 |
Table 2.
Sample Description.
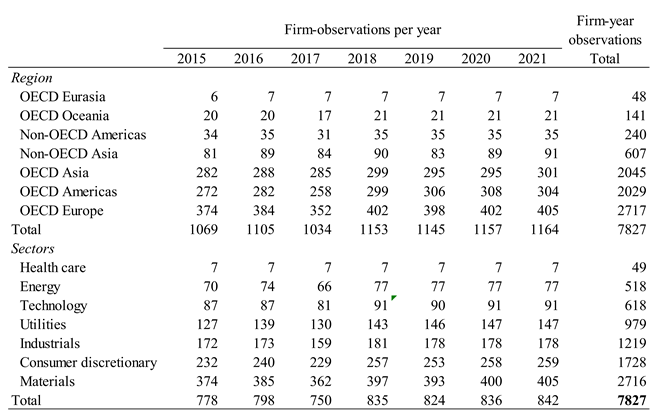 |
Table 3.
Operational Definitions of the Variables Used in this Research.
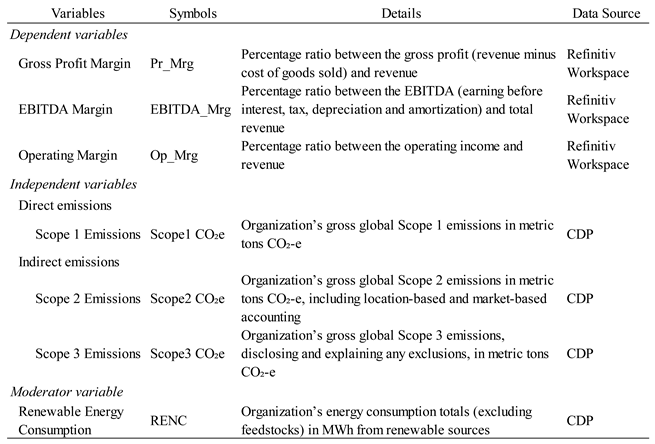 |
Table 4a.
Numerical Summary of B-LGC Model Estimate Parameters of Direct Interaction Effects between Corporate Carbon Footprint (CCFP) and Profits (CP).
Table 4a.
Numerical Summary of B-LGC Model Estimate Parameters of Direct Interaction Effects between Corporate Carbon Footprint (CCFP) and Profits (CP).
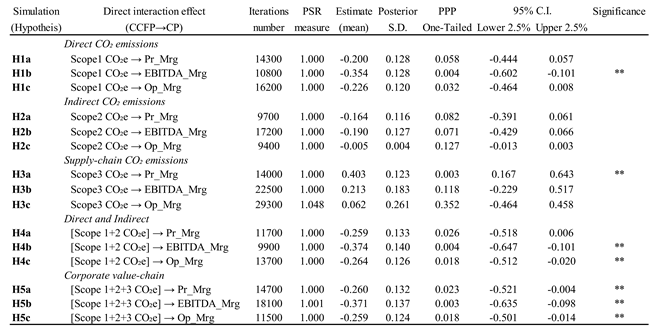 |
Table 4b.
Numerical Summary of B-LGC Model Estimate Parameters of the Interaction Moderating Effects of CEI (measured by RENC) in the CCFP→CP Relationship.
Table 4b.
Numerical Summary of B-LGC Model Estimate Parameters of the Interaction Moderating Effects of CEI (measured by RENC) in the CCFP→CP Relationship.
 |
** p-value ≤ 0.05 and C.I does not include zero, implying a positive moderating effect. * p-value ≤ 0.05 and C.I include zero, implying a marginal and positive moderating effect. Note. all estimates are standardized model results. RENC = Renewable energy consumption; Pr_Mg = Gross Profit Margin %; EBITDA = EBITDA Margin %; Op_Mrg = Operating Margin %; C.I. = Credible interval; S.D. = Standard deviation; PSR = Potential scale reduction; PPP = Posterior predictive p-value.
Disclaimer/Publisher’s Note: The statements, opinions and data contained in all publications are solely those of the individual author(s) and contributor(s) and not of MDPI and/or the editor(s). MDPI and/or the editor(s) disclaim responsibility for any injury to people or property resulting from any ideas, methods, instructions or products referred to in the content. |
© 2023 by the authors. Licensee MDPI, Basel, Switzerland. This article is an open access article distributed under the terms and conditions of the Creative Commons Attribution (CC BY) license (http://creativecommons.org/licenses/by/4.0/).
Copyright: This open access article is published under a Creative Commons CC BY 4.0 license, which permit the free download, distribution, and reuse, provided that the author and preprint are cited in any reuse.


