
Submitted:
29 May 2023
Posted:
30 May 2023
You are already at the latest version
Abstract
Objectives: Understanding the intersection of age, ethnicity, and disability will become increasingly important as the global population ages and becomes more diverse. By 2060, Hispanics will comprise 28% of the U.S. population. This study examines critical associations between sensory impairment, social isolation, and cognitive functioning among Hispanic older adults.
Methods: Our sample consisted of 557 Hispanic older adults that participated in Rounds 1-3 or Rounds 5-7 of the National Health and Aging Trends Study. Longitudinal mediation models across a three-year span were estimated using Mplus with vision, hearing, and dual sensory impairment predicting cognitive functioning directly and indirectly through social isolation.
Results: Findings indicated that cognitive functioning was concurrently and, in certain cases, longitudinally predicted by vision and dual sensory impairment, and by social isolation. Contrary to expectations, vision and hearing impairment were not predictive of social isolation. Dual sensory impairment was associated with social isolation, yet no significant indirect associations were found for sensory impairments predicting cognitive functioning through social isolation.
Discussion: The finding that social isolation did not mediate the relationship between sensory impairment and cognitive decline among Hispanic older adults in the U.S. is contrary to findings from other studies that were not specifically focused on this population. This finding may be evidence that culturally motivated family support and intergenerational living buffer the impact of sensory impairments in later life. Findings suggest that Hispanic older adults experiencing dual sensory impairments may benefit from interventions that foster social support and include family members.
Keywords:
Hispanic
; Familism
; Vision Impairment
; Hearing Impairment
; Social Isolation
; Cognitive Functioning
1. Introduction
Consistent with population trends in the United States (U.S.), the median age of Hispanics is increasing, but at a more rapid pace than in the general population (Noe-Bustamante et al., 2020). Hispanics are the largest ethnic group in the U.S., comprised of 60.6 million individuals, accounting for 18% of the population. Demographic trends predict that by the year 2060 Hispanics will comprise 28% of the U.S. population (111 million individuals) (US Census, 2021). At the same time, the proportion of non-Hispanic White older adults is projected to decrease by 10% for those age 65 and older and 9% by those age 85 and older (Vincent & Velkoff, 2010). Although a heterogenous group, Hispanics may share some common cultural values. Understanding the intersection of age, ethnicity, and disability will become increasingly important as the U.S. population ages and becomes more diverse.
While vision loss affects 9% of the U.S. population (Patel et al, 2020) health disparities increase the risk and impact of vision loss for Hispanics. Hispanics are approximately two times more likely to have diabetes and are the most likely racial-ethnic group in the United States to have undiagnosed and untreated hypertension, both of which are causes of retinopathy (Campos et al., 2019; Cheng et al., 2019). By 2050, half of people living with glaucoma will be Hispanic (Nathan & Joos, 2016). These disparities seem to be especially true for Hispanic women (Herren & Kohanim, 2016).
Hispanics may lack access to vision screening despite being at increased risk for vision loss. Brown (2005) estimated that 75% of Hispanic older adults living with glaucoma were undiagnosed and untreated. Similarly, 63% of the participants in the Los Angeles Latino Eye Study who had vision impairments had never been diagnosed or sought treatment prior to the study (Varma et al., 2004).
When the need for refractive correction is unmet, vision impairment is compounded. While up to 64% of Hispanics over age 40 have a need for glasses or contact lenses, 20% of those lack access, especially those with lower rates of acculturation, education level, and the uninsured (Uribe et al., 2011).
Hearing loss affects 27% of adults 60-69 and 63.1% of adults 70 and older (Goman & Lin, 2016). Although the prevalence of hearing loss among Hispanic and non-Hispanic samples is similar (Cruickshanks et al., 2015), those of Hispanic ethnicity will live a greater proportion of their lives hearing impaired (West & Lynch, 2021). The impact of hearing impairment among Hispanics is further compounded by underuse of hearing aids, which is correlated with lack of health insurance (Arnold et al., 2019).
Dual sensory impairment (DSI) consists of concurrent vision and hearing loss. Approximately 1.5 million adults in the U.S. aged 20 years and older have DSI, with the majority being older adults (Swenor et al. 2013). Among older adults in the U.S. age 80 and older, 11.3% are likely to experience DSI (Swenor et al. 2013). In one longitudinal study Hispanic participants reported a higher proportion of dual sensory impairment (Kuo et al. 2021). Findings indicate that those with DSI are more likely to experience cognitive decline and report loneliness (Davidson & Guthrie, 2019). Additionally, one international study has shown that DSI can have associations of higher social disconnectedness and increased loneliness in certain populations (Liu et al., 2023). Social isolation has been associated with increased risk for dementia (Livingston et al, 2020).
Sensory impairments, including vision impairment (VI) and Hearing Impairment (HI) increase the risk for social isolation by limiting social participation and impacting psychosocial health (Shah et al., 2020; Shukla et al., 2020). Social isolation is associated with myriad negative health outcomes including increased risk for anxiety and depression (Santini et al., 2020), declines in cognitive functioning (Read et al., 2020), overall poorer physical and emotional health (Hawton et al., 2011), and mortality (Holt-Lunstad et al., 2015). Research is lacking that explores the links between sensory impairments and social isolation among older Hispanic individuals.
While sensory impairments generally increase risk for social isolation, certain cultural factors may buffer this impact. Hispanics are twice as likely to live in intergenerational households compared to non- Hispanic whites (Cohn & Passel, 2018). The term familism is defined as a reliance on and prioritization of family relationships and describes “a cul tural frame of reference about the centrality of the family that is enacted in attitudes and behaviors” (Hernandez & Bamaca-Colbert, 2016, p. 464). Many cultures and ethnicities around the world may be considered familistic (Schwartz, et al. 2010), including Hispanics, who may prefer to receive social support from family rather than from community resources (Min & Barrio, 2009, Trujillo Tanner et al., 2022). Past research has identified a link between the cultural value of familism and perceived social support as well as psychological well-being (Campos et al., 2014). Although some research has explored how social iso lation differs among older adults based on ethnic origins (Locher et al., 2005), little is known about the direct in fluence of culture. The buffering effect of family support among Hispanics may partly explain the cultural health advantage described by the Hispanic Paradox (Markides & Eschbach, 2005, Gallegos & Segrin, 2022).
In a meta-analysis, 91 of 110 studies found a significant positive association between vision impairment and cognitive decline (Nagarajan et al., 2022). Sensory impairments (VI, HI and DSI), are each independently associated with an increased risk of cognitive decline (Lin & Albert, 2014; Whitson et al., 2018). These relationships are complex and various mechanisms have been hypothesized (Whitson et al., 2018). Yet social isolation, commonly associated with sensory impairments could partially explain this relationship (Livingston et al., 2020). Longitudinal, population-based research has identified social isolation as a mechanism linking sensory impairment with cognitive functioning among a national sample of older adults with sensory impairments in the US. (Yorgason et al., 2022).
Although Hispanics are a highly diverse group of individuals of various religions, socio-economic backgrounds and education levels, persistent health disparities including less access to healthcare, lower rates of insurance, higher poverty rates, and discrimination may play a role in long term health outcomes (Arnold et al., 2019; Vargas Bustamante et al., 2009; Vega et al., 2009; West & Lynch, 2021). Among Hispanics over the age of 65, 14% have a diagnosis of Alzheimer’s disease (Rajan, et al, 2021). While Hispanics are 1.5 times more likely to experience dementia compared with non- Hispanic whites (Samper-Ternent et al., 2012), the reasons are not well understood. Minority groups often experience delayed diagnosis and inadequate treatment of dementia (Chin, et al., 2011). Additionally, misunderstanding among Hispanics about what constitutes normal aging, and issues of trust between minority groups and the medical establishment further compound these issues (Chin et al. 2011).
Increased ethnic diversity and rapidly shifting demographics present a need for research on the unique challenges faced by Hispanic older adults to inform health care, policy, and funding priorities. We hypothesized that among Hispanic older adults, having one or more self-reported sensory impairments would be associated with poorer cognitive functioning cross-sectionally, and longitudinally, across 1 and 2 years and that these relationships would be associated indirectly through social isolation.
2. Methods
Our sample consisted of 557 Hispanic older adults that participated in the National Health and Aging Trends Study (NHATS). NHATS is a nationally representative study of Medicare beneficiaries in the United States ages 65 and older. NHATS began in 2011 with a total of 8,245 participants, with data collection administered annually. To compensate for attrition, the sample was replenished at Round 5 (2015), boosting the sample to include a total of 8,334 participants. The current study combined Hispanic participants from Rounds 1, 2, and 3 (N = 342) and Rounds 5, 6, and 7 (N = 215) to create a total sample size of 557 Hispanic participants measured across three years. We only retained participants from Rounds 5-7 who were not included in the sample from Rounds 1-3, and so all 557 participants were unique.
2.1. Measures
2.1.1. Cognitive Functioning
We used cognitive measures collected in NHATS corresponding to orientation, executive function, and learning/memory (Kasper et al., 2013). To measure orientation, respondents were asked to recite the date, president, and vice president of the U.S. Higher scores represent higher levels of cognitive orientation. Executive function was assessed using a clock drawing test. Respondents were given a blank piece of paper and asked to draw a clock with hands placed at 11:10. Drawings were scored ranging from 0 (not recognizable as a clock) to 5 (accurate depiction) (specific criteria are found in the NHATS User Guide, page 88-89). Higher scores indicated better executive function. Learning/memory was evaluated using a delayed word recall test. Interviewers read a list of 10 words to respondents, who were then asked to recall as many of the words as possible. After a 5-minute delay, respondents were again asked to recall as many of the words as possible. Higher scores for the delayed word recall measure indicated better learning/memory.
2.1.2. Sensory Impairment
Three separate variables were used to assess self-reported vision impairment (VI), hearing impairment (HI), and dual sensory impairment (DSI). VI was measured using a total of three items. If the participant reported being blind or that they were unable to see well enough (including when using corrective lenses – glasses or contact lenses) to recognize someone across the street or to read newspaper print, they were then coded as having a VI. This method was used in prior studies using NHATS data (Xiang et al., 2020).
A dichotomous measure of HI was constructed using four items. If the respondent reported difficulty with any of the items, they were then coded as having hearing impairment. Hearing impairment questions related to whether respondents could “hear well enough to carry on a conversation in a quiet room,” “hear well enough to carry on a conversation in a room with a radio or TV playing,” and “hear well enough to use the telephone,” and an item assessing whether participants were deaf (“yes” coded as 1, “no” coded as 0). Individuals were characterized as having HI only if hearing problems were severe enough to impact their functioning (whether or not they wore a hearing aid). People with hearing aids but who did not report problems with these listed items were not coded as having a hearing impairment for this study.
Self-reported DSI was indicated if the participant reported having both HI and VI. In the current sample, 22% (n = 114) reported HI, 15% (n = 85) reported VI, and 7% (n = 37) reported DSI.
2.1.3. Social Isolation
We measured social isolation with the goal of identifying elements of familial and other support which might be more relevant to Hispanic individuals (Trujillo Tanner et al., 2022). Social isolation scores were calculated by aggregating each of the following possibilities with “yes” coded as 1 and “no” coded as 0 for each of the following: (a) living alone, (b) having one or fewer people who he/she talked to in the last year about important things, (c) not attending religious services, (d) not visiting with friends/family in the participant’s home or in the home of the friend/family member, and (e) not living in an intergenerational household. The resulting measure had a scale ranging from zero to five, with higher scores indicating greater social isolation.
2.1.4. Covariates
We included conceptually relevant covariates, and descriptive information about each of these constructs can be found in Table 1. Covariates included chronological age, biological sex (labeled gender), marital status, education, smoking status, and self-rated health. Education, rather than income, was included as an indicator of socioeconomic status (Darin-Mattsson et al., 2017) because of its association with cognitive functioning (Heyl & Wahl, 2014) and strong correlation with income.
2.2. Analysis
Longitudinal models that examined indirect associations between sensory impairment, social isolation, and cognitive functioning across a three-year span were estimated using Mplus. We first estimated models with sensory impairments predicting cognitive functioning with social isolation modeled as a mediator to that relationship. We then added covariates. More specifically, Models 1 included separate models for vision and hearing impairments or dual sensory impairments predicting each measure of cognitive functioning directly and indirectly through social isolation (see Figure 1). Models 2 included each of those models with covariates added, including age, gender, marital status, education, smoking status, and illness comorbidities. Full information maximum likelihood was used to address missing data. We used bootstrapping with 5,000 draws to adjust the standard errors of indirect associations.
3. Results
3.1. Preliminary Analyses
As seen in Table 1, our sample of Hispanic older adults had an age range of 65 to greater than 90, and consisted of about 57% females. The majority of our sample (77%) had at least a high school diploma, and almost half had at least some college education. The average income was a little over $56,000 per year. Correlations between the main study variables were in expected directions and of anticipated magnitudes (see Table 2).
3.2. Direct Associations
- How do sensory impairments relate to social isolation concurrently and across time? Contrary to our expectations, neither VI nor HI were significantly associated with social isolation concurrently or across time. Unlike VI and HI alone, DSI was associated with higher social isolation one year later in both Model 1 (β = .079, p < .05) and Model 2 (β = .086, p < .05).
- How do sensory impairments relate to cognitive functioning across time among Hispanic older adults? As seen in Model 1 of Table 3, VI was negatively associated with concurrent orientation (β = -.111, p < .01) and executive function scores (β = -.109, p < .05), as well as with learning/memory (β = -.124, p < .05) and executive function (β = -.103, p < .01) one year later. VI was also associated with lower executive function scores one year later when covariates were added in Model 2 (β = -.079, p < .05). HI was not associated with measures of cognitive functioning in this sample. As seen in Table 4, DSI was negatively associated with orientation scores concurrently in Model 1 (β = -.094, p < .05) and with learning/memory across one year in Model 1 (β = -.143, p < .01) and Model 2 (β = -.091, p < .05).
- What is the relationship between social isolation and cognitive functioning among Hispanic older adults? As displayed in Table 3, social isolation was negatively associated with concurrent orientation in Model 2 (β = -.091, p < .05) and executive function in Model 1 (β = -.099, p < .05) and Model 2 (β = -.113, p < .05). Social isolation was also related to lower learning/memory across one year in Model 1 (β = -.084, p < .05) and Model 2 (β = -.111, p < .01).
3.3. Indirect Associations
- 4.
- Are sensory impairments related indirectly to cognitive functioning through social isolation? There were no significant indirect associations between VI, HI, or DSI and cognitive functioning through social isolation.
In summary, as anticipated, VI and DSI were associated with cognitive functioning, but unexpectedly, HI was not. Social isolation was associated with lower cognitive functioning. However, aside from DSI, individual sensory impairments were not related to social isolation among this Hispanic sample. Between 30% and 43% of the variance (as per r-squared) in cognitive functioning measures was accounted for in the statistical models.
4. Discussion
Given the increasingly diverse U.S. population, this study examined associations between sensory impairments, social isolation, and cognitive functioning among Hispanics who comprise the largest ethnic group in the US. We hypothesized that having one or more sensory impairments would be associated with poorer cognitive functioning cross-sectionally, and longitudinally, across 1 and 2 years and that these relationships would be mediated by social isolation.
We began by exploring how sensory impairments relate to social isolation, and found that VI and HI were not related to social isolation concurrently or across 1 or 2 years. This finding was unexpected as VI and HI have historically been shown to be associated with social isolation (Shah et al., 2020; Shukla et al., 2020). The lack of correlation between sensory impairments and social isolation in this study may suggest an effect modification by culture. Hispanics are twice as likely to live in intergenerational households than their non-Hispanic white peers (Cohn & Passel, 2018) and are known to rely on family for many types of support (Min & Barrio, 2009). Familism is not unique to Hispanics and is described as filial piety in Asian cultures, and communalism in African cultures (Schwartz et al., 2010). In addition to social benefits, familism is associated with better physical and psychological outcomes (Fuller-Iglesias, et al, 2016). High levels of familism are related to less loneliness, physical health symptoms, and depression (Corona et al., 2017).
Unlike VI and HI alone, DSI was associated with social isolation, but only across 1 year and beyond, not cross sectionally. One interpretation of this finding is that DSI does not have an immediate impact on social isolation, but over time it may start to impact connection with others in important ways (Wang et al., 2022). Social isolation can have profound negative impacts on older individuals’ (age 65+) health and is associated with increased risk for anxiety, depression, and dementia (Ehrlich et al., 2022; Santini et al., 2020).
We also explored how sensory impairments relate to cognitive functioning across time among Hispanic older adults. The present study found that VI was associated with concurrent and longitudinal impacts on cognitive function. This is consistent with metanalyses which have linked VI with cognitive decline and clinically diagnosed dementia (e.g., Nagarajan et al., 2022). Cao et al. (2023) reports similar findings longitudinally as well as cross-sectionally regardless of subjective or objective measures of VI.
Despite abundant research linking HI to cognitive decline, we did not find an association between HI and cognitive functioning. There may be certain protective factors, such as familism, which are buffering the impacts of hearing loss on cognitive decline, among Hispanics. Another possible explanation of the different findings is variation in the definition and measurement of vision loss across studies.
We explored the relationship between social isolation and cognitive functioning among Hispanic older adults with sensory impairments. Social isolation was related to lower orientation and executive functioning concurrently and to lower learning/memory one year later. Social isolation among other potentially modifiable risk factors is associated with 40% of dementia cases globally (Ehrlich et al., 2022). The Lancet Commission on Dementia cites social isolation as a key risk factor for dementia with social isolation having a significant population attributable fraction (PAF) of 3.5% (Livingston et al., 2020).
Finally, we explored whether sensory impairments related indirectly to cognitive functioning through social isolation. No indirect associations were significant for VI or HI predicting cognitive functioning through social isolation. Past research has identified social isolation as an important mediator of the relationship between sensory impairments and cognitive functioning (Yorgason et al., 2022). This non-finding may, again, be evidence of an effect modification by culture, owing to familism.
Hispanic older adults may experience the benefits of familism on health outcomes. The cultural values and community could act as a safeguard from negative health outcomes that other groups experience. Familism, religiosity, and allocentrism found among Hispanic populations can create a barrier between stress and adversity, and negative health outcomes (Gallo et al., 2009).
4.1. Strengths and Limitations
This research fills a gap in the current research landscape by exploring the intersection of ethnicity, aging and disability in a national sample of Hispanic older adults with sensory impairments. Understanding the influence of culture, and dynamics impacting family caregiving should inform health programs and the delegation and prioritization of resources. To our knowledge, this is the first paper to explore social isolation accruing from sensory impairments among a uniquely Hispanic sample.
Due to the smaller sample size these analyses had lower power than could be achieved with a larger sample size.
4.2. Future Directions
Beginning in 2022, future rounds of the NHATS data will oversample Hispanic participants to achieve a proportion more consistent with what is seen in the general population. NHATS data currently includes self-reported sensory impairment. Future rounds of NHATS data (beginning with data collection in 2021) will include objective measures of both vision and hearing. This may allow for analyses which focus on the spectrum severity of sensory impairment as it relates to long term outcomes. Future studies may compare samples from the U.S. with samples from outside the U.S. such as those in the Mexican Health and Aging Study (MHAS). We recommend future research on the qualitative nature of family support among Hispanic families as it relates to living with sensory loss. Future measures of social isolation could include measures of social activities which are relevant to those of Hispanic ethnicity, e.g. going on picnics, attending dances, visiting family, etc.
5. Conclusions
Familism buffers stress and is associated with higher self-esteem and subjective wellbeing in times of stress (Corona et al., 2017). In the present study, social isolation was not immanent among those experiencing sensory impairments, when family support was present. Our findings suggest that familism may play a significant role on health trajectories among Hispanic older adults living with sensory impairments.
Culture is an important part of the context in which health events occur. As we improve our understanding of the dynamic relationship between culture, aging and disability we are better able to develop targeted intervention to support Hispanic Older adults towards positive outcomes.
References
- Arnold, M.L.; Hyer, K.; Small, B.J.; Chisolm, T.; Saunders, G.H.; McEvoy, C.L.; Lee, D.J.; Dhar, S.; Bainbridge, K.E. Hearing aid prevalence and factors related to use among older adults from the Hispanic Community Health Study/Study of Latinos. JAMA Otolaryngol.—Head Neck Surg. 2019, 145, 501–508. [CrossRef]
- Brown, M.M. Prevalence of open-angle glaucoma and ocular hypertension in Latinos: The Los Angeles Latino eye study. Evid. -Based Eye Care 2005, 6, 14–15. [CrossRef]
- Campos, B.; Ullman, J.B.; Aguilera, A.; Dunkel Shetter, C. Familism and psychological health: The intervening role of closeness and social support. Cult. Divers. Ethn. Minor. Psychol. 2014, 20, 191–201. [CrossRef]
- Campos, C.L.; Rodriguez, C.J. High blood pressure in Hispanics in the United States. Curr. Opin. Cardiol. 2019, 34, 350–358. [CrossRef]
- Cao, G. -Y.; Chen, Z.-S.; Yao, S.-S.; Wang, K.; Huang, Z.-T.; Su, H.-X.; Luo, Y.; De Fries, C.M.; Hu, Y.-H.; Xu, B. The association between vision impairment and cognitive outcomes in older adults: a systematic review and meta-analysis. Aging & Mental Health 2023, 27, 350–356. [CrossRef]
- Cheng, Y.J.; Kanaya, A.M.; Araneta, M.R.; Saydah, S.H.; Kahn, H.S.; Gregg, E.W.; Fujimoto, W.Y.; Imperatore, G. Prevalence of diabetes by race and ethnicity in the United States 2019, 2011-2016. JAMA, 322, 2389. [CrossRef]
- Chin, A.L.; Negash, S.; Hamilton, R. Diversity and disparity in dementia: the impact of ethnoracial differences in Alzheimer disease. Alzheimer Dis. Assoc. Disord. 2011, 25, 187–195. [CrossRef]
- Corona, K.; Campos, B.; Chen, C. Familism is associated with psychological wellbeing and physical health. Hisp. J. Behav. Sci. 2017, 39, 46–65. [CrossRef]
- Cohn, D.; Passel, J.S. (2018). A record 64 million Americans live in multigenerational households. https://www.pewresearch.org/fact-tank/2018/04/05/a-record-64-million-americans-liveinmultigenerational- households/.
- Cruickshanks, K.J.; Dhar, S.; Dinces, E.; Fifer, R.C.; Gonzalez, F.; Heiss, G.; Hoffman, H.J.; Lee, D.J.; Newhoff, M.; Tocci, L.; Torre, P.; Tweed, T.S. Hearing impairment prevalence and associated risk factors in the Hispanic Community Health Study/Study of Latinos. JAMA Otolaryngol. —Head Neck Surg. 2015, 141, 641–648. [CrossRef]
- Darin-Mattsson, A.; Fors, S.; Karcholt, I. Different indicators of socioeconomic status and their relative importance as determinants of health in older age. Int. J. Equity Health 2017, 16, 173. [CrossRef]
- Davidson, J.G. S.; Guthrie, D.M. Older adults with a combination of vision and hearing impairment experience higher rates of cognitive impairment, functional dependence, and worse outcomes across a set of quality indicators. J. Aging Health 2019, 31, 85–108. [CrossRef]
- Ehrlich, J.R.; Goldstein, J.; Swenor, B.K.; Whitson, H.; Langa, K.M.; Veliz, P. (2022) Addition of vision impairment to a life-course model of potentially modifiable dementia risk factors in the US. JAMA Neurology, 79 623-626. [CrossRef]
- Fuller-Iglesias, H.R.; Antonucci, T.C. Familism, social network characteristics, and well-being among older adults in Mexico. J. Cross-Cult. Gerontol. 2016, 31, 1–17. [CrossRef]
- Gallegos, M.L.; Segrin, C. Family connections and the Latino health paradox: Exploring the mediating role of loneliness in the relationships between the Latina/o cultural value of familism and health. Health Commun. 2022, 37, 1204–1214. [CrossRef]
- Gallo, L.C.; Penedo, F.J.; Espinosa de los Monteros, K.; Arguelles, W. Resiliency in the face of disadvantage: Do Hispanic cultural characteristics protect health outcomes? J. Personal. 2009, 77, 1707–1746. [CrossRef]
- Goman, A.M.; Lin, F.R. Prevalence of hearing loss by severity in the United States. Am. J. Public Health 2016, 106, 1820–1822. [CrossRef]
- Hawton, A.; Green, C.; Dickens, A.P.; Richards, S.H.; Taylor, R.S.; Edwards, R.; Greaves, C.J.; Campbell, J.L. The impact of social isolation on the health status and health-related quality of life of older people. Qual. Life Res. 2011, 20, 57–67. [CrossRef]
- Hernandez, M.M.; Bamaca-Colbert, M.Y. A behavioral process model of familism. J. Fam. Theory Rev. 2016, 8, 463–483. [CrossRef]
- Herren, D. J.; Kohanim, S. Disparities in vision loss due to cataracts in Hispanic women in the United States. Seminars in Ophthalmology 2016, 31, 353–357. [CrossRef]
- Heyl, V.; Wahl, H.-W. Experiencing age-related vision and hearing impairment: The psychosocial dimension. J. Clin. Outcomes Manag. 2014, 21, 323–335.
- Holt-Lunstad, J.; Smith, T.B.; Baker, M.; Harris, T.; Stephenson, D. Loneliness and social isolation as risk factors for mortality: A meta-analytic review. Perspect. Psychol. Sci. 2015, 10, 227–237. [CrossRef]
- Kasper, J.D.; Freedman, V.A.; Spillman, B.C. (2013). Classification of persons by dementia status in the National Health and Aging Trends Study. Technical Paper #5.
- Kuo, P.-L.; Huang, A.R.; Ehrlich, J.R.; Kasper, J.; Lin, F.R.; McKee, M.M.; Reed, N.S.; Swenor, B.K.; Deal, J.A. Prevalence of concurrent functional vision and hearing impairment and association with dementia in community-dwelling medicare beneficiaries. JAMA Netw. Open 2021, 4, e211558. [CrossRef]
- Lin, F.R.; Albert, M. Hearing loss and dementia–who is listening? Aging Ment. Health 2014, 18, 671–673. [CrossRef]
- Liu, Y.; Sun, Q.; Abuduxukuer, K.; Hou, Y.; Wei, J.; Liu, H.; Luo, J.; Gao, G.; Zhou, Y. Is there a correlation between sensory impairments and social isolation in middle-aged and older Chinese population? Cross-sectional and longitudinal evidence from a nationally representative survey. Front. Public Health 2023, 11, 1098109. [CrossRef]
- Livingston, G.; Huntley, J.; Sommerlad, A.; Ames, D.; Ballard, C.; Banerjee, S.; Brayne, C.; Burns, A.; Cohen-Mansfield, J.; Cooper, C.; Costafreda, S.G.; Dias, A.; Fox, N.; Gitlin, L.N.; Howard, R.; Kales, H.C.; Kivimäki, M.; Larson, E.B.; Ogunniyi, A.;... Mukadam, N. Dementia prevention, intervention, and care: 2020 report of the Lancet Commission. Lancet 2020, 396, 413–446. [CrossRef]
- Locher, J.L.; Ritchie, C.S.; Roth, D.L.; Baker, P.S.; Bodner, E.V.; Allman, R.M. Social isolation, support, and capital and nutritional risk in an older sample: Ethnic and gender differences. Soc. Sci. Med. 2005, 60, 747–761. [CrossRef]
- Markides, K.S.; Eschbach, K. Aging, migration, and mortality: Current status of research on the Hispanic Paradox. The Journals of Gerontology: Series B 2005, 60, S68– S75. [CrossRef]
- Min, J.W.; Barrio, C. Cultural values and caregiver preference for Mexican-American and non-Latino White elders. J. Cross-Cult. Gerontol. 2009, 24, 225–239. [CrossRef]
- Nagarajan, N.; Assi, L.; Varadaraj, V.; Motaghi, M.; Sun, Y.; Couser, E.; Ehrlich, J.R.; Whitson, H.; Swenor, B.K. Vision Impairment and cognitive decline among older adults: A systematic review. BMJ Open 2022, 12. [CrossRef]
- Nathan, N.; Joos, K.M. Glaucoma disparities in the Hispanic population. Semin. Ophthalmol. 2016, 31, 394–399. [CrossRef]
- Noe-Bustamante, L.; Lopez, M.H.; Krogstad, J.M. (2020, July 7). U.S. Hispanic population surpassed 60 million in 2019, but growth has slowed. Pew Research Center. https://www.pewresearch.org/fact-tank/2020/07/07/u-shispanic- population-surpassed-60-million-in-2019-but-growth-has-slowed/.
- Patel, N.; Stagg, B.C.; Swenor, B.K.; Zhou, Y.; Talwar, N.; Ehrlich, J.R.; (2020). Association of co-occurring dementia and selfreported visual impairment with activity limitations in older adults. JAMA Ophthalmology, 138, 756-763. [CrossRef]
- Rajan, K.B.; Weuve, J.; Barnes, L.L.; McAninch, E.A.; Wilson, R.S.; Evans, D.A. Population estimate of people with clinical Alzheimer’s disease and mild cognitive impairment in the United States (2020-2060). Alzheimer’s and Dementia. 17 2021, 1873-2056. [CrossRef]
- Read, S. ; Comas-Herrera, A.; Grundy, E. Social isolation and memory decline in later life. The J. Gerontol. : Ser. B 2020, 75, 367–376. [CrossRef]
- Samper-Ternent, R.; Kuo, Y.F.; Ray, L.A.; Ottenbacher, K.J.; Markides, K.S.; Al Snih, S. (2012) Prevalence of health conditions and predictors of mortality in oldest old Mexican Americans and non-Hispanic whites. Journal of the American Medical Directors Association, 13 254-9. [CrossRef]
- Santini, Z.I.; Jose, P.E.; Cornwell, E.Y.; Koyanagi, A.; Nielsen, L.; Hinrichsen, C.; Meilstrup, C.; Madsen, K.R.; Koushede, V. Social disconnectedness, perceived isolation, and symptoms of depression and anxiety among older Americans (NSHAP): A longitudinal mediation analysis. Lancet Public Health 2020, 5, e62–e70. [CrossRef]
- Shah, K.; Frank C. R.; Ehrlich, J.R. The association between vision impairment and social participation in community-dwelling adults: A systematic review. Eye 2020, 34, 290– 298. [CrossRef]
- Shukla, A.; Harper, M.; Pedersen, E.; Goman, A.; Suen, J.J.; Price, C.; Applebaum, J.; Hoyer, M.; Lin, F.R.; Reed, N.S. Hearing loss, loneliness, and social isolation: A systematic review. Otolaryngol. —Head Neck Surg. 2020, 162, 622–633. [CrossRef]
- Schwartz, S.J.; Weisskirch, R.S.; Hurley, E.A.; Zamboanga, B.L.; Park, I.J. K.; Kim, S.Y.; Umaña-Taylor, A.; Castillo, L.G.; Brown, E.; Greene, A.D. Communalism, familism, and filial piety: Are they birds of a collectivist feather? Cult. Divers. Ethn. Minor. Psychol. 2010, 16, 548–560. [CrossRef]
- Swenor, B.K.; Ramulu, P.Y.; Willis, J.R.; Friedman, D.; Lin, F.R. Research letters: The prevalence of concurrent hearing and vision impairment in the United States. JAMA Intern. Med. 2013, 173, 312–313. [CrossRef]
- Trujillo Tanner, C.; Yorgason, J; Richardson, S.; White, A.; Redelfs, A.; Stagg, B.; Erlich, J; Markides, K (2022). Social isolation among Hispanic older adults with sensory impairments: Toward culturally sensitive measurement. The Journals of Gerontology: Series B, 77, 2091-2100. [CrossRef]
- US Census, B. (2021). Hispanic population to reach 111 million by 2060. Retrieved from https://www.census.gov/library/visualizations/2018/comm/hispanic-projectedpop. html#:~:text=Hispanic%20Population%20to%20Reach%20111%20Million%20by%202060.
- Uribe, J.A.; Swenor, B.K.; Muñoz, B.E.; West, S.K. Uncorrected refractive error in a Latino population: Proyecto VER. Ophthalmology 2011, 118, 805–811. [CrossRef]
- Vargas Bustamante, A.; Fang, H.; Rizzo, J.A.; Ortega, A.N. (2009). Understanding observed and unobserved health care access and utilization disparities among US Latino adults. Medical Care Research and Review. 66 561–577. [CrossRef]
- Varma, R.; Paz, S.H.; Azen, S.P.; Klein, R.; Globe, D.; Torres, M.; Shufelt, C.; Preston-Martin, S.; Los Angeles Latino Eye Study Group. The Los Angeles Latino Eye Study: Design, methods, and baseline data. Ophthalmology 2004, 111, 1121–1131. [CrossRef]
- Vega, W.A.; Rodriguez, M.A.; Gruskin, E. (2009). Health disparities in the Latino Population. Epidemiologic Reviews. 31 99-112. [CrossRef]
- Vincent, G.K.; Velkoff, V.A. (2010). The next four decades: The older population in the United States: 2010 to 2050. U.S. Department of Commerce, Economics and Statistics Administration, U.S. Census Bureau. https://www.census.gov/content/dam/Census/library/publications/2010/demo/p25-1138.pdf.
- Wang, Q. ; Zhang, S.; Wang, Y.; Zhao, D.; Zhou, C. Dual sensory impairment as a predictor of loneliness and isolation in older adults: National Cohort Study. JMIR Public Health Surveill. 2022, 8, e39314. [CrossRef]
- Whitson, H.E.; Cronin-Golomb, A.; Cruickshanks, K.J.; Gilmore, G.C.; Owsley, C.; Peelle, J.E.; Recanzone, G.; Sharma, A.; Swenor, B.; Yaffe, K.; Lin, F.R. American Geriatrics Society and National Institute on Aging bench-to-bedside conference: Sensory impairment and cognitive decline in older adults. J. Am. Geriatr. Soc. 2018, 66, 2052–2058. [CrossRef]
- West, J.S.; Lynch, S.M. Demographic and socioeconomic disparities in life expectancy with hearing impairment in the United States. J. Gerontol. : Ser. B 2021, 76, 944–955. [CrossRef]
- Xiang, X.; Freedman, V.A.; Shah, K.; Hu, R.X.; Stagg, B.C.; Ehrlich, J.R. Selfreported vision impairment and subjective well-being in older adults: A longitudinal mediation analysis. J. Gerontol. : Ser. A 2020, 75, 589–595. [CrossRef]
- Yorgason, J.; Trujillo Tanner, C.; Richardson, S.; Burch, A.; Stagg, A.; Wettstein, M.; Hill, M. The longitudinal association of late-life visual and hearing difficulty and cognitive function: The role of social isolation. J. Aging Health Sage Publ. 2022, 34, 765–774. [CrossRef]
Figure 1.
Conceptual Model. Notes. Time 1 was in 2011 or 2015, Time 2 was in 2012 or 2016, Time 3 was in 2013 or 2017.
Figure 1.
Conceptual Model. Notes. Time 1 was in 2011 or 2015, Time 2 was in 2012 or 2016, Time 3 was in 2013 or 2017.
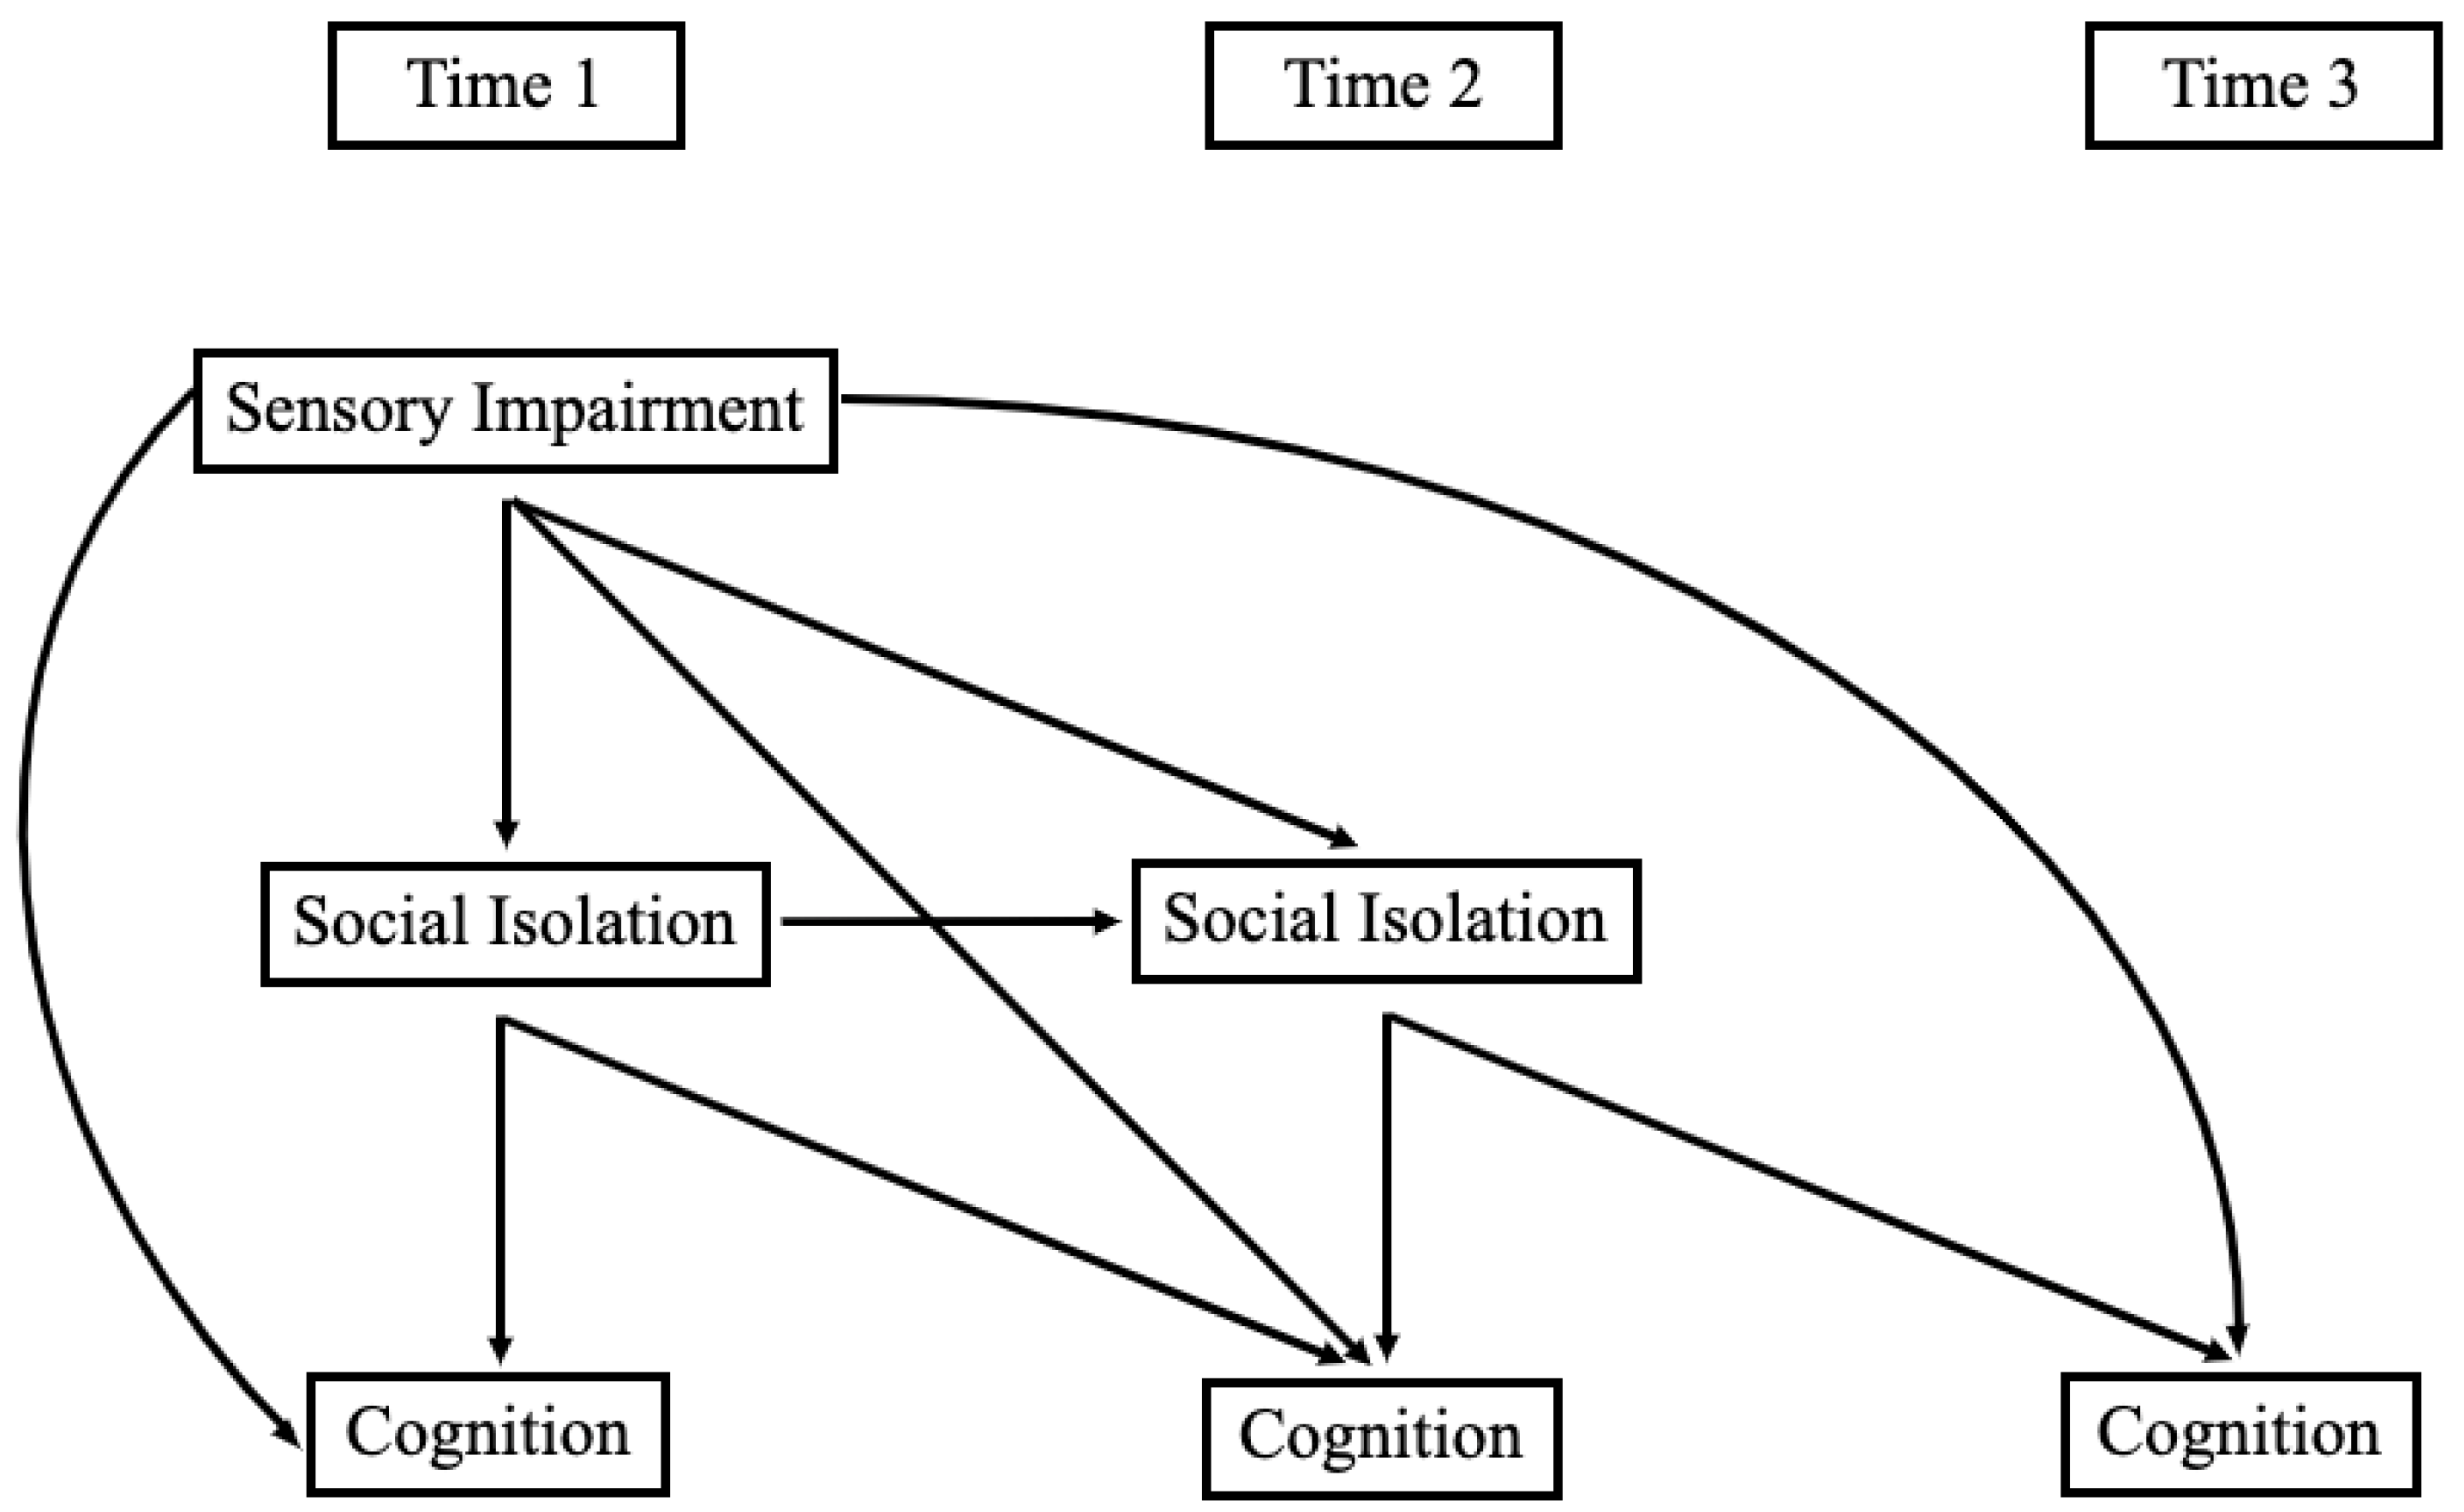

Table 1.
Descriptive Statistics from Main Study Variables among Hispanic Participants of NHATS (N = 557).
Table 1.
Descriptive Statistics from Main Study Variables among Hispanic Participants of NHATS (N = 557).
| Variable | N (%) or Mean (SD) | Range |
|---|---|---|
| Age Groups 65–69 70–74 75–79 80–84 85–89 ≥ 90 |
151 (27.11%) 141 (25.31%) 106 (19.03%) 88 (15.80%) 46 (8.26%) 25 (4.49%) |
|
| Sex Male (coded as 1) Female (coded as 0) |
246 (44.17%) 311 (55.83%) |
|
| Education Level Less than High School High School Trade/Some college College degree |
318 (57.09%) 87 (15.62%) 83 (14.90%) 69 (12.39%) |
|
| Marital Status | ||
| Married | 276 (49.64%) | |
| Not Married | 280 (50.36%) | |
| Smoking Status | ||
| Smoker | 19 (5.57%) | |
| Non-Smoker | 322 (94.43) | |
| Hearing Disability | ||
| Hearing Loss | 117 (21.47%) | |
| No Hearing Loss | 417 (78.53%) | |
| Vision Disability | ||
| Vision Loss | 85 (15.29%) | |
| No Vision Loss | 471 (84.71%) | |
| Dual Sensory Disability | ||
| Hearing/Vision Loss | 37 (6.98%) | |
| No Hearing/Vision Loss | 493 (93.02%) | |
| Social Isolation | 0-4 | |
| Time 1 | 1.88 (.98) | |
| Time 2 | 1.81 (.98) | |
| Executive Function | 0-5 | |
| Time 1 | 3.19 (1.17) | |
| Time 2 | 3.22 (1.32) | |
| Time 3 | 3.10 (1.37) | |
| Learning/Memory | 0-9 | |
| Time 1 | 3.01 (1.76) | |
| Time 2 | 2.95 (1.87) | |
| Time 3 | 2.83 (1.89) | |
| Orientation | 0-8 | |
| Time 1 | 5.50 (1.42) | |
| Time 2 | 5.63 (1.58) | |
| Time 3 | 5.42 (1.62) | |
| Health | 1.20 (.89) | 0-4 |
Table 2.
Correlations Between Main Study Variables Among Hispanic Participants of the NHATS study (N = 557).
Table 2.
Correlations Between Main Study Variables Among Hispanic Participants of the NHATS study (N = 557).
| 1 | 2 | 3 | 4 | 5 | 6 | 7 | 8 | 9 | 10 | 11 | 12 | 13 | |
|---|---|---|---|---|---|---|---|---|---|---|---|---|---|
| 1. T1 HL | 1 | ||||||||||||
| 2. T1 VL | .25*** | 1 | |||||||||||
| 3. T1 DI | .52** | .65** | 1 | ||||||||||
| 4. T1 Social Iso | .04 | -.05 | -.05 | 1 | |||||||||
| 5. T2 Social Iso | .06 | .00 | .06 | .56*** | 1 | ||||||||
| 6. T1 Exec Fun | -.00 | -.08* | -.05 | -.08* | -.10* | 1 | |||||||
| 7. T2 Exec Fun | -.02 | -.15** | -.10* | -.13** | -.06 | .56*** | 1 | ||||||
| 8. T3 Exec Fun | -.04 | -.12* | -.06 | -.04 | .01 | .50*** | .56*** | 1 | |||||
| 9. T1 Learning | -.07 | -.05 | -.04 | .01 | .04 | .14** | .16*** | .15** | 1 | ||||
| 10. T2 Learning | -.11* | -.15** | -.17*** | -.05 | -.07 | .16*** | .29*** | .32*** | .44*** | 1 | |||
| 11. T3 Learning | -.12* | -.01 | -.08 | -.05 | -.06 | .18*** | .24*** | .35*** | .37*** | .57*** | 1 | ||
| 12. T1 Orient | -.09* | -.11* | -.07 | -.04 | -.01 | .20*** | .25*** | .23*** | .20*** | .25*** | .20*** | 1 | |
| 13. T2 Orient | -.06 | -.12** | -.11* | -.01 | -.06 | .22*** | .29*** | .34*** | .21*** | .36*** | .32*** | .60*** | 1 |
| 14. T3 Orient | -.10 | -.10 | -.11* | .04 | .01 | .28*** | .41*** | .39*** | .17** | .31*** | .36*** | .41*** | .49*** |
Notes. HL = Hearing Loss. VL = Vision Loss. DI = Dual Sensory Impairment (Hearing and Vision Loss). Social Iso = Social Isolation. Exec Fun = Executive Function. Orient = Orientation. * p < .05, ** p < .01, *** p < .001.
Table 3.
Standardized Regression Coefficients from Structural Equation Model of Vision and Hearing Impairment Predicting Cognitive Functioning Indirectly Through Social Isolation.
Table 3.
Standardized Regression Coefficients from Structural Equation Model of Vision and Hearing Impairment Predicting Cognitive Functioning Indirectly Through Social Isolation.
| Learning/Memory B (SE) |
Orientation B (SE) |
Executive Function B (SE) |
||||
|---|---|---|---|---|---|---|
| Predictor Variables | Model 1 | Model 2 | Model 1 | Model 2 | Model 1 | Model 2 |
| VI -> T1 CF | -.035 (.04) | .009 (.04) | -.111** (.04) | -.045 (.04) | -.109* (.05) | -.056 (.04) |
| VI -> T2 CF | -.124* (.05) | -.077 (.05) | -.045 (.04) | -.020 (.04) | -.103** (.04) | -.079* (.04) |
| VI -> T3 CF | .073 (.05) | .093† (.05) | -.046 (.04) | -.029 (.04) | -.057 (.05) | -.046 (.05) |
| HI -> T1 CF | -.070 (.05) | -.022 (.05) | -.076† (.05) | -.030 (.04) | .022 (.05) | .065 (.04) |
| HI -> T2 CF | -.037 (.05) | -.001 (.05) | -.003 (.04) | .020 (.04) | .004 (.04) | .035 (.04) |
| HI -> T3 CF | -.080† (.04) | -.056 (.04) | -.035 (.05) | -.017 (.04) | -.031 (.05) | -.012 (.05) |
| T1 Social Isolation -> T1 CF | .009 (.04) | .008 (.04) | -.045 (.04) | -.091* (.04) | -.099* (.04) | -.113* (.05) |
| T2 Social Isolation -> T2 CF | -.084* (.04) | -.111** (.04) | -.047 (.04) | -.037 (.04) | .002 (.04) | -.042 (.04) |
| T2 Social Isolation -> T3 CF | -.010 (.04) | -.037 (.04) | .047 (.05) | -.017 (.05) | .078† (.04) | .084† (.05) |
| VI -> T1 Social Isolation | -.066 (.05) | -.058 (.05) | -.066 (.05) | -.056 (.05) | -.064 (.05) | -.055 (.05) |
| VI -> T2 Social Isolation | .009 (.04) | .022 (.04) | .009 (.04) | .022 (.04) | .009 (.04) | .022 (.04) |
| HI -> T1 Social Isolation | .056 (.05) | .049 (.05) | .057 (.05) | .051 (.05) | .055 (.05) | .048 (.05) |
| HI -> T2 Social Isolation | .044 (.04) | .051 (.04) | .043 (.04) | .050 (.04) | .043 (.04) | .050 (.04) |
| VI -> T1 Social Isolation -> T1 CF | -.001 (.00) | .000 (.00) | .003 (.00) | .005 (.01) | .006 (.01) | .006 (.01) |
| VI -> T2 Social Isolation -> T2 CF | -.001 (.00) | -.002 (.01) | .000 (.00) | -.001 (.00) | .000 (.00) | -.001 (.00) |
| VI -> T2 Social Isolation -> T3 CF | .000 (.00) | -.001 (.00) | .000 (.00) | .000 (.00) | .001 (.00) | .002 (.00) |
| HI -> T1 Social Isolation -> T1 CF | .001 (.00) | .000 (.00) | -.003 (.00) | -.005 (.01) | -.005 (.01) | -.005 (.01) |
| HI -> T2 Social Isolation -> T2 CF | -.004 (.01) | -.006 (.01) | -.002 (.00) | -.002 (.00) | .000 (.00) | -.002 (.00) |
| HI -> T2 Social Isolation -> T3 CF | .000 (.00) | -.002 (.00) | .002 (.00) | -.001 (.00) | .003 (.00) | .004 (.01) |
| Sample Size (N) | 557 | 557 | 557 | 557 | 557 | 557 |
| Chi-Square Model Fit | .70 | .27 | 1.19 | 1.81 | 7.90* | 10.19* |
| RMSEA | .00 | .00 | .00 | .00 | .05 | .07 |
| CFI | 1.00 | 1.00 | 1.00 | 1.00 | .99 | .99 |
| R2 of T3 CF | .35*** | .43*** | .30*** | .38*** | .37*** | .40*** |
Notes. †p < .01, *p < .05, **p < .01, ***p < .001. VI = Vision Impairment, HI = Hearing Impairment, CF = Cognitive Functioning; RMSEA = Root Mean Squared Error of Approximation, CFI = Comparative Fit Index; T = Time, T1 was in 2011 or 2015, T2 was in 2012 or 2016, T3 was in 2013 or 2017; Arrows (dash and greater than sign) denote a directional regression and multiple arrows denote an indirect effect relationship. Models 2 included covariates of age, education, biological sex, health, marital status, and smoking status.
Table 4.
Standardized Regression Coefficients from Structural Equation Model of Dual Sensory Impairment Predicting Cognitive Functioning Indirectly Through Social Isolation.
Table 4.
Standardized Regression Coefficients from Structural Equation Model of Dual Sensory Impairment Predicting Cognitive Functioning Indirectly Through Social Isolation.
| Learning/Memory B (SE) |
Orientation B (SE) |
Executive Function B (SE) |
||||
|---|---|---|---|---|---|---|
| Predictor Variables | Model 1 | Model 2 | Model 1 | Model 2 | Model 1 | Model 2 |
| DSI -> T1 CF | -.041 (.04) | .013 (.04) | -.094* (.04) | -.031 (.04) | -.064 (.05) | -.015 (.05) |
| DSI -> T2 CF | -.143** (.04) | -.091* (.04) | -.060 (.05) | -.026 (.05) | -.081† (.04) | -.042 (.04) |
| DSI -> T3 CF | -.001 (.04) | .013 (.04) | -.050 (.05) | -.031 (.05) | -.017 (.05) | .000 (.05) |
| T1 Social Isolation -> T1 CF | .006 (.04) | .008 (.04) | -.047 (.04) | -.091* (.04) | -.097* (.04) | -.110* (.05) |
| T2 Social Isolation -> T2 CF | -.077* (.04) | -.106* (.04) | -.044 (.04) | -.034 (.04) | .008 (.04) | -.038 (.04) |
| T2 Social Isolation -> T3 CF | -.012 (.04) | -.039 (.04) | .048 (.05) | -.017 (.05) | .077† (.04) | .083† (.05) |
| DSI -> T1 Social Isolation | -.05 (.05) | -.056 (.05) | -.052 (.05) | -.055 (.05) | -.051 (.05) | -.056 (.05) |
| DSI -> T2 Social Isolation | .079* (.04) | .086* (.04) | .079* (.04) | .086* (.04) | .079* (.04) | .086* (.04) |
| DSI -> T1 Social Isolation -> T1 CF | .000 (.00) | .000 (.00) | .002 (.00) | .005 (.01) | .005 (.01) | .006 (.01) |
| DSI -> T2 Social Isolation -> T2 CF | -.006 (.01) | -.009 (.01) | -.003 (.00) | -.003 (.00) | .001 (.00) | -.003 (.00) |
| DSI -> T2 Social Isolation -> T3 CF | -.001 (.00) | -.003 (.00) | .004 (.00) | -.001 (.01) | .006 (.00) | .007 (.01) |
| Sample Size (N) | 557 | 557 | 557 | 557 | 557 | 557 |
| Chi-Square | .90 | .27 | 1.05 | 1.80 | 7.94* | 10.14* |
| RMSEA | .00 | .00 | .00 | .00 | .05 | .07 |
| CFI | 1.00 | 1.00 | 1.00 | 1.00 | .99 | .99 |
| R2 of T3 CF | .34*** | .42*** | .30*** | .38*** | .36*** | .40*** |
Notes. †p < .01, *p < .05, **p < .01, ***p < .001. DSI = Dual Sensory Impairment, CF = Cognitive Functioning; RMSEA = Root Mean Squared Error of Approximation, CFI = Comparative Fit Index; T = Time, T1 was in 2011 or 2015, T2 was in 2012 or 2016, T3 was in 2013 or 2017; Arrows (dash and greater than sign) denote a directional regression and multiple arrows denote an indirect effect relationship. Models 2 included covariates of age, education, biological sex, health, marital status, and smoking status.
Disclaimer/Publisher’s Note: The statements, opinions and data contained in all publications are solely those of the individual author(s) and contributor(s) and not of MDPI and/or the editor(s). MDPI and/or the editor(s) disclaim responsibility for any injury to people or property resulting from any ideas, methods, instructions or products referred to in the content. |
© 2023 by the authors. Licensee MDPI, Basel, Switzerland. This article is an open access article distributed under the terms and conditions of the Creative Commons Attribution (CC BY) license (http://creativecommons.org/licenses/by/4.0/).
Copyright: This open access article is published under a Creative Commons CC BY 4.0 license, which permit the free download, distribution, and reuse, provided that the author and preprint are cited in any reuse.


