
Submitted:
24 May 2023
Posted:
26 May 2023
You are already at the latest version
Abstract
Liability to prevent consequences of an unhealthy situation due to accumulating toxic and hazardous emissions caused by open dumping of municipal solid waste with increasing urbanization has necessitated a renewed thinking on waste disposal. Grate fired incineration systems were adopted by urban managements in past and present but with criticisms due to formation of air borne emissions. Improved combustion methods like fluidized bed are now propagated because of current requirements like efficient energy recovery potential, stricter emission norms, adaptability with urban growth, adaptability to co-firing with other waste like biomass, edible oil wastes or industrial effluent and integration with conventional energy generation. Such a comprehensive and futuristic approach is more sustainable for the community. Multi-criteria decision-making tool is used to identify the best technology option among grate combustion and fluidized bed combustion for disposing and energy recovery from waste. Ten different collection and disposal options involving two combustion methods, namely, grate combustion and fluidized bed method are considered. Utilization of the energy is done for three end uses, namely, power generation, water distillation and district cooling. Two different regions in Saudi Arabia are considered for this study under two types of scenario, namely with recycling and without recycling. The different options are prioritized based on their overall ranking using five major performance factors.
Keywords:
waste combustion
; grate combustion
; fluidized bed combustion
; energy from waste
; desalination from waste
; district cooling from waste
; multi criteria decision analysis
1. Introduction
Waste produced by all levels of human settlements can be primary reasons for air, land and water pollution as well as the cause for diseases in man and other living things. Effective disposal is an integral part of urban, semi-urban and rural management. Currently, the option of simultaneous disposal and energy generation from the municipal solid waste (MSW) is being considered as essential by policy makers in order to overcome excessive energy costs resulting from higher generation cost along with increased demand. Energy demand from different consumption sectors depends on the economic and geographical conditions prevailing in a country. Saudi Arabia consumes 8% of the total desalinated water produced worldwide [1]. The total power consumption for cooling is more than doubled in summer compared to the winter consumption [2].
Employment prospects in urban regions and availability of better amenities has ended up in growing urban boundaries all over the world for the past several decades. Waste quantities generated by cities worldwide add up to 1.3 billion tons per year as on 2018 and it is expected to rise to 2.2 billion tons per year by 2025 [3]. Out of the total MSW generated, roughly, 70% is landfilled, 19% is recycled and 11% is used to produce energy [4]. Waste to energy supply chains mitigate both disposal problem and energy demands in economies [5]. Dumping of waste in open areas can cause public health problems and communicable diseases. About 20 to 50% of the waste is still dumped by unsanitary methods in the developed countries and about 90% in the case of developing countries [6]. Food dumping produces methane which is much more harmful than carbon dioxide. Proper waste management not only prevents environmental damage and diseases but also has benefits of the recycling and energy generation. Recycling is an environmentally sustainable activity with positive impact on resource availability and economy. Waste management activities involve investment and earnings over millions of Euros in Germany [7]. The recycling goal has been fixed at 50% in the US [8]. The Australian government has a target of reducing the waste generation per person by 10% and achieving a 80% recovery rate from all waste streams by 2030 [9].
Incineration offers an effective means for reducing the volume of MSW generated to much smaller volumes and simultaneous recovery of energy for useful applications. The weight is reduced by up to 60% and volume reduction is up to 90% [10]. Since incineration produces certain harmful gaseous products, several combustion and emissions control measures are employed to meet the regulations. Each ton of MSW that is incinerated produces 15-40 kg of hazardous waste [11]. Incineration of MSW is usually achieved by mass burn using grate firing or fluidized bed firing. Grate firing is further classified as sloping grate and vibrating grate depending on the method used to move the waste within the furnace. Fluidized bed systems use either the bubbling bed technology or the circulating fluidized bed technology. Developments in reducing the emissions like dioxins is encouraging the adoption of incineration as the best waste to energy option [12]. Incineration is the primary waste treatment option practiced in Taiwan. In the year 2008, a total quantity of 24000 tons per day of waste was incinerated through 24 power plants to produce 622.5 MW of power [13]. Between 2013 and 2014, the waste to energy capacity in China was 46 million tons per year with an energy generation of 18.7 billion kWh, accounting for 1.2% of total renewable energy production [14]. Energy from waste in the European Union in terms of generation was highest in Germany with 5768 GWh, followed by UK with 2782 GWh, Italy 2344 GWh, France 1999 GWh, and Netherlands 1997 GWh as on the year 2015 [15]. Grate firing requires less fuel preparation before firing and can handle a wide range of fuel quality in terms of its chemical composition as well as its moisture content. Grate firing has seen a long period of development and improvement in terms of the heat transfer aspects and cleaning mechanisms [16]. Grate-firing of some biomass fuels with a high chlorine content (e.g., straw) may suffer from severe deposition and corrosion problems. Biomass fuels have low melting point characteristics because of high content of potassium and hence ash fusion occurs [17]. Fluidized beds (FB) are more adaptable to a wide range of fuel and they can be simultaneously used for different types of fuel [18]. They are considered to be more environmentally favorable and emissions can be controlled better due to lesser bed temperatures compared to the grate fired systems. The bed material can be used to reduce certain undesirable emission and agglomerate forming material by adding suitable chemical agents [19]. FB systems that use MSW as fuel, need proper pre-treatment of the waste in order to reduce its size and to remove heavy particles, which can cause difficulties during fluidization. Several pre-treatment methods are adopted to meet required specifications [20].
Desalination processes using thermal energy can be achieved by Multi Stage Flash method (MSF), Multiple effect Desalination (MED) method and Thermal Vacuum Compression (TVC) method. The requirement of heat for desalination can be meted out from the heat rejected after generating the required electricity. District heating or cooling systems involve a number of individual consumers who can extract the heat or cold from a centralized supply system. The heating load or cooling load depends on the geographical conditions and this can be provided by combustion of municipal waste [21,22]. Cooling is more efficient through the use of vapor absorption cooling method which operates either using heat rejected during power production process or by direct use of the combustion heat [23]. Power generation from MSW can be achieved by using grate firing or fluidized beds in which water is converted to steam to drive the turbo generators for power generation [24]. The capacity of such an installation needs consideration of primary factors like MSW generation rate, the quality in terms of heating value and emissions and the requirements of the power in the location apart from several secondary factors.
Thus, multiple options are available for disposing of MSW and energy recovery from waste. It is evident that technology selection of the appropriate method to dispose of MSW and subsequently recovering energy from that treated or non-treated waste; requires a scientific tool to analyze and determine the ideal choice. Multi criteria decision analysis is an ideal tool which has been successfully used under such situations. In order to have an efficient, sustainable, environment friendly and economic method one should evaluate the trade-offs between the fuel supply requirements, performance opportunities, costs and environmental risks of alternatives. There is a need to incorporate qualitative and quantitative multiple criterion to compare and assess and do ranking of the alternative methods. Wherein, qualitative evaluation methods have expert evaluation method, safety check list method, fault hypothesis analysis method, etc. Quantitative evaluation methods have exponential method, probability method, fuzzy synthetic evaluation method, artificial neural network method, etc. [19]. These methods not only have their own characteristics and feasibility, but also have some drawbacks. Multi-criteria decision making (MCDM) received much attention from researchers and practitioners in evaluating, assessing and ranking alternatives across diverse industrial and non-industrial sectors. For example, to evaluate urban sustainable development in China [25]; to evaluate the strategies for sustainable energy planning [26]; to optimize renewable energy systems [27]. One of the principal objectives here is to adopt multi-criteria decision analysis is to compare and assess multiple options for disposing of MSW and energy recovery from waste.
This study makes a quantification of the different factors used to assess the performance of different MSW incineration to utilization routes for three specific uses, namely, power generation, desalination and district cooling system. These factors are calculated from available theoretical methods or taken from published data. Multi criteria decision analysis (MCDA) is used to analysis the different utilization routes in order to rank them and identify the position of the different methods in terms of their overall performance. The MCDA is applied under two different scenarios, namely, with and without recycling for two different geographical locations in Saudi Arabia, namely, Central region and Eastern region.
2. Multiple Criteria and Performance Assessment Factors
Analysis of 10 different utilization options involving 18 factors of performance assessment is done as described in Figure 1. Apart from the 6 utilization options involving dedicated systems, four other routes involving 50% electricity generation and 50% desalination or cooling is also considered. Utilization options can be further subdivided based on different utilization technologies available but is limited to primary options only. End use options are electricity generation, district cooling and desalination. Multi Effect Desalination (MED) and Vapor Absorption Refrigeration (VAR) cooling methods are considered in this study. Energy generation options are the grate firing and fluidized bed firing. Utilization options are named from A to J. For example, route D indicates power generation option using fluidized bed incineration system.
2.1. Electricity Consumption
The electricity consumption statistics for Saudi Arabia was used to determine the projected monthly electricity consumption in the two designated regions [28]. Per capita energy consumption is 8840 kWh in 2021 and total energy generation in Saudi Arabia as on 2020 is 338031 GWh. The central region consumed at total power of 91470 GWh of electrical energy in 2021 which is 30% of total. The eastern region consumed at total power of 83280 GWh of electrical energy in 2021 which is 28% of the total [26]. Saudi energy demand is expected to rise to 365.4 TWh in 2030 [29]. Figure 2 gives the projected monthly electrical energy consumption in the two regions of Saudi Arabia, namely, the central region and the Eastern region. The consumption during the summer months of July or August is almost double the consumption during the winter months of December or January due to the high-power consumption for cooling application. A large percentage of the power is used for air conditioning in domestic, commercial and government buildings at both the regions shown in the Figure 2. About 65% of the electricity consumed by the residential sector is taken by air conditioning systems [29].
2.2. Cooling Energy Requirement
The use of air conditioners to overcome the hot summers in Saudi Arabia is highest in the world with 100% use of air-conditioners in households [30]. During the year 2015, the generation was 23 GW and it increased by 1.18 GW for every degree rise in temperature and during this year the energy consumed was 294,612 GWh. Air-conditioning accounts for 66%vof the electricity consumption in Saudi Arabia [31,32]. Summers in the central region of Saudi Arabia are very hot and dry, ranging from 27°C to 43°C and in the coastal regions like the eastern region the temperature ranges from 27°C to 38°C [33,34]. After assuming the maximum temperatures and the weather variations are similar in 2030, the projected consumption of electricity for air conditioning for cooling in summer is given in Figure 3 for central region and Figure 4 for the eastern region.
The monthly cooling energy requirement is calculated based on the following criteria:
- Monthly energy required for cooling is calculated based on difference between actual average maximum temperature in the region and minimum temperature required to be maintained.
- The total cooling energy required is 66% of monthly energy consumption
2.3. Fresh Water Requirement
Saudi Arabia has the third highest per capita water consumption in spite of the absence of natural fresh water availability. So sea water desalination is the available option for meeting the domestic and industrial water requirements. Thermal energy consumption for MSF method is about 290 kJ/kg, MED requires about 260 kJ/kg and TVC method consumes about 270 kJ/kg of fresh water produced [37,38]. MED uses heating steam at lower temperatures between 600C and 900C, MED-TVC requires less than 700C and MSF requires 900C to 1200C. Figure 5 gives the population growth in the two regions of interest in Saudi Arabia and the yearly per capita fresh water consumption from 2020 to year 2030 [39,40]. The lines in the Figure 5 indicate the annual per capita water consumption requirement up to the year 2030.
3. Municipal Waste Collection, Disposal and Characteristics
Centralized waste collection and disposal requires extensive infrastructure and associated investment and management requirements. Transportation and control mechanisms are more complicated especially in mega cities. Usually a large quantity of waste is dumped in a single location which is occupied by socio-economically backward people and which can damage ecological balance, social wellbeing and economic prosperity of these locations [41]. Some of the advantages of this method are availability of sufficient stock in case of centralized incineration, single point management and facility to share and maintain the logistic resources. In the case of decentralized disposal responsibility to manage the waste is distributed in the community apart from reduction in the transportation cost of the waste. Simpler technologies and smaller capacity disposal mechanisms can be implemented thereby reducing the effects of temporary stoppages or problems. The disposal methods can also be different according to the quality of waste generated like installation of bio-methane plants where excessive organic waste is produced in food or market areas or composting units where suitable waste is available. Controlling the waste generated, classification and procurement are easier in the case of decentralized method [42]. Moreover, decentralized methods are the only feasible method in case of rural areas and areas that are spread widely apart [43]. MSW disposal systems are moving to a combined centralized cum decentralized method to reap the advantages of both. Increasing urban regions and high waste generation rates required increasing the waste collection fleets resulting traffic problems and road deterioration. Various techniques of waste disposal have come up based on the differences in the quality and quantity of waste produced requiring specialized approaches in certain regions necessitating a combined approach for waste handling [44]. A large centralized incineration-based power plant that caters to the electricity needs combined with a series of decentralized waste treatment facilities for gas generation, composting as well as sanitary and filling in certain areas is a practical approach adopted by certain urban managements [45]. Selective collection and disposal of MSW involves collection based on the composition of waste required for a particular disposal mechanism from producers of the prescribed quality. This method is ideally suited when recycling is possible to recover secondary raw material that are present in the waste. About 47.7% of the waste is collected selectively in the European union [38,46]. Selective collection reduces the combustibles in MSW making them more suitable for other methods of disposal rather than incineration. The other technologies include anaerobic digestion or composting. Forecast of the solid waste generation was reported for the period 2020 to 2030 [47] and the data is given in Figure 6. The data is obtained by extrapolating the published data for both the central region and the eastern region.
Analysis of the different components of the MSW produced in Saudi Arabia was done as per ASTM D5231-92 standards and the results are given in Table 1. This data was similar for waste samples collected in the central region as well as the eastern region and hence the data is applied for both the regions.
Energy produced per day by combustion of MSW is a function of the waste generation rate ( ,the lower heating value of the waste (LHV in kWh/kg) and the efficiency of the turbine, generator and combustion device ( ).
Energy required for water desalination in the case of MED method depends on the thermal and electrical energy produced. I m3 of fresh water production requires 1.5-2.5 kWh of electrical energy and 5-8.5 kWh equivalent of thermal energy [44]. The total energy produced from waste combustion can be utilized for water production or a part of it (kw) can be used. Taking a maximum total value of 11 kWh, the water production rate can be determined from Equation 2.
Vapor absorption cooling machines utilize heat for achieving the cooling with the help of a generator/absorber mechanism. A refrigerant absorbent pair of fluids are used where the absorbent absorbs the vapor refrigerant gas coming out of the evaporator (cooling area) and the strong solution of absorber/refrigerant is pumped to the generator. The external heat is applied on the generator thereby boiling away the refrigerant at a higher pressure for further condensation and evaporation in the evaporator. Figure 6 shows the basic cycle of a Lithium bromide-water VAR two stage cooling system in which ammonia acts as the refrigerant and water acts as the absorbent. The cooling rate produced with the above waste generation capacity of kg per day depends on the coefficient of performance (COP) of the VAR cooling system. The total energy produced from waste combustion can be utilized for cooling or a part of it (kc) can be used. COP of two stage VAR systems, as given in Figure 7, can reach up to 1.2 for Lithium bromide/water absorbent/refrigerant combination [48].
The output of the end processes from different options are calculated and presented in Table 2 using above equations 1-3.
4. Performance Assessment Factors
The performance assessment factors used for the analysis are classified into the following categories in order to apply the MCDA method (Table 3):
4.1. Fuel Supply Requirements
MSW heating value (kJ/kg) must meet the requirements for combustion without affecting the furnace temperature and heat output. Recycling of the waste reduces the net lower heating value of the waste. Combustion air preheating is an effective option in this case apart from the fuel drying option. The fuel characteristics in a region is determined by the economic level, weather conditions, collection and storage conditions. Grate combustion of MSW is adopted in several countries and it is the most developed in terms of technology advancements. The minimum lower heating value required for grate fired systems is 4 MJ/kg [49]. In the case of FB it is possible to go for lower heating value fuel with the help of support fuel. Also higher levels of water in waste lead to reduction in the heat output [50]. Grate fired systems are more tolerable to fuel moisture variation compared to FB systems. The end use application also determines the fuel heating value requirement. In the case of dedicated water distillation and district cooling requirements, the heat and temperature requirements are much lesser compared to steam generation for power generation. Considering these factors, maximum heating value is required by power generation options using grate firing A, C, E followed by power generation options using FBC, namely, F, H, J. This is followed by the desalination options namely, B, G and then the district cooling option D, I. Moisture in the fuel reduces combustion temperature and efficiency because heat is used to evaporate the moisture in the fuel. Higher moisture content resulted in decrease in ignition front velocity during combustion and overall burning rate with permissible limit between 20 and 40% [51]. Fuel preparation is required extensively in the case of fluidized bed firing due to the fuel size and moisture content limitations. Power generation plants using fluidized bed combustion require maximum fuel preparation through size reduction and drying followed by grate fired systems. Dedicated distillation and cooling systems do not require very high combustion temperatures due to their lower operating temperature requirements. Hence, the fuel preparations are relatively lesser. Storage of MSW is associated with problems of formation of methane and undesirable odors as well as leachates. Additional costs are incurred due to the requirement of continuous monitoring of the waste during storage. Storage becomes essential when MSW is used for cooling or desalination process due to variation in the plant loads during different seasons. The rank for storage problem for power generation is 1 due to minimum storage requirement, 3 for combined power generation and distillation or cooling and 4 for dedicated distillation or cooling systems.
4.2. Incinerator Performance
The incinerators used for energy generation from MSW as well the end user equipment will have variations in the supply and demand due to operational and external conditions. Power supply stoppages due to maintenance or temporary increase in demand, increase in fresh water demand or cooling loads due to climatic conditions are some of the conditions. Hence the capacity to hand these variations is necessary in order to ensure smooth operation. FBC systems can handle these variations better than grate combustion systems due to their design features [52]. Cooling systems using vapor absorption methods are highly flexible in their operation capacities compared to vapor compression systems [53]. The ranks are provided accordingly for the different options. Efficiency of GF systems is less than that of FBC systems mainly due to the lower level of losses from the flue gas produced [54]. Conversion of this heat produced to directly operate a water distillation system or a cooling system has higher exergy efficiency compared to use of electricity for the same, since, lower grade energy is used. Power production using Rankine cycle shows maximum efficiency compared to utilization of the heat for distillation or cooling. FB systems are highly adaptable to co-firing with alternate conventional or non-conventional fuel compared to GF systems. Operation and maintenance cost for FB systems are higher due to gas cleaning systems required due to high fly ash.
4.3. End Use Performance:
Power generation, water desalination and district cooling systems are the three end uses considered in this study. Combustion in incinerators used for power generation through Rankine cycle depends on the maximum temperature of the combustion system due to which the flue gas loss that carries away maximum heat is the primary factor that determines boiler efficiency. This boiler efficiency, η, is given by Equation 4.
LHV
In the above equation is the mass of flue gas produced per kilogram of the combustibles in the MSW, is the specific heat of the flue gas, is the outlet temperature of the flue gas, is the ambient temperature and LHV is the lower heating value of the MSW. GF systems operate at higher temperatures resulting in higher efficiencies compared to FB systems. In the case of exergy efficiency, higher temperatures produce better performance in the case of power generation but exergy efficiency of desalination system is lesser due to operation at lesser than the maximum possible temperature range and is still lesser for cooling systems which require minimum temperature.
Exergy efficiency (ψ) of steam power plant depends on the net output work produced and is given by Equation (5).
In the above equation, is the mass flow rate of the fuel used and LHV is the lower calorific vale of the fuel.
Percentage of total requirement is the percentage of the energy shared by the different end used out of the total energy required for the 2030 projected energy requirement.
4.4. Emissions Factors:
The ratio of the bottom ash to fly ash quantity in the case of fluidized bed is 30/70 and for grate firing it is 90/10 [55]. Fly is more of an environmental problem compared to bottom ash. Removal of the fly ash requires extensive arrangements to rove the particles. Hence, this value is to be maximized. Atmospheric emissions depend on the characteristics of the MSW used as well as inclusion of other fuels, if any. On an average every 1000 kg of MSW produces 1200 kg of carbon dioxide in the case of grate firing and 1250 kg in the case of fluidized bed firing. The combustion efficiency improvement in the fluidized bed results in higher emission [56]. However, the large quantity of bottom ash carries higher levels of unburnt in the case of grate fired systems. Carbon monoxide is another pollutant which is produced in waste combustion. Recent developments in fluidized bed systems has resulted in negligible carbon monoxide generation [56]. Methane is another emission which is 23 times more harmful than carbon dioxide in terms of global warming impact. Improvement in the combustion process has resulted in the completed prevention of methane generation during combustion. However, during the storage and handling process of the waste, the possibility of methane generation still exists and it is necessary to make suitable preventive measures. Formation of nitrous oxide is much lesser in fluidized bed combustion compared to grate firing mainly due to lower bed temperatures. Levels of up to 12 mg/m3 has been noted in the case of grate fired incineration plant with a 50% reduction in FB firing [57]. Leachate problems are high during the storage of MSW in the yards. Grate firing systems required more storage compared to FB systems that can operate with alternate solid, liquid or gaseous fuel. Usage of the waste for cooling purpose requires storage especially in winters and hence the consequent leachate issues are relatively higher. This give and ranking of 1 for FB systems, 2 for FB systems for district cooling, 3 for grate fired systems and 4 for grate firing district cooling application.
4.5. Economic Factors:
MSW collection cost depends on different factors like the investment and maintenance of the collection bins and collection vehicles, operating and administrative cost and costs involved in maintaining the legal restrictions during handling and transportation [58,59]. Investment cost of Fb systems are normally 10% less than grate fired systems. Pre-treatment of the waste is essential in the case of FB systems in order to meet the fluidization requirements as well as to maintain the combustion requirements. Fuel sizes are to be in the range of 5-10 cm [60]. Costs reported in year 2015 have been adjusted to present day cost with an appreciation rate of 10% per year. The average fuel preparation costs are claimed to be between 21.24 USD per ton of waste [61]. The levelized cost of energy (LCOE) is calculated from the Eq.4 which considers the investment, operation and maintenance cost as well as the energy equivalent of the different end use technologies considered above for a 15-year duration [62]. The fresh water production and the cooling requirements are converted to equivalent energy values.
| It | : | investment expenditures in the year t |
| Mt | : | operations and maintenance expenditures in the year t |
| Ft | : | fuel expenditures in the year t |
| Et | : | electrical energy generated in the year t |
| r | : | discount rate taken as 10% |
| n | : | expected lifetime of system or power station taken as 15 years |
5. MCDM Approach to Evaluate Ideal MSW Incineration and Utilization Technology
The objective is to determine suitable weights of evaluation of ideal MSW incineration and utilization technology, the entropy weight method by Shannon is used. The smaller the entropy value is, the smaller the disorder degree of the selection criterion is. Here in the paper, the entropy weight method is adopted to determine the weight of the criterion and sub criterion related to evaluation of ideal MSW incineration and utilization technology for energy recovery from waste. MCDM approach that can be applied when a set of alternatives waste treatment methods is to be ranked according to a set of criteria. The adopted MCDM approach is straightforward and the concept permits the pursuit of best alternatives for each criterion depicted in a simple mathematical form, and the criteria weights are incorporated into the comparison procedures. Selected the alternative disposing of MSW and energy recovery from waste method that is the closest to the ideal disposing of MSW and energy recovery from waste and farthest from negative ideal disposing of MSW and energy recovery from waste method. For a given set of m alternatives (options) and n attributes/criteria and the score of each available disposing of MSW and energy recovery from waste method with respect to each criterion, refer to the Table 3. The details of the evaluation method using MCDM approach is presented in the following subsections.
5.1. Structure of the Decision Matrix and Its Standardization
Supposing there are m MSW incineration options on hand and n evaluation criteria for their evaluation, Xij is the jth evaluation criterion’s value in the ith MSW incineration option. In order to eliminate the influence of criteria dimension on incommensurability, it is necessary to standardize criteria using the equations of relative optimum membership degree. To the benefit (maximize) criterion, the attribute value of the jth criterion in the ith MSW incineration option can be standardized by using Equation (6), whereas for a minimization criterion, the attribute value of the jth criterion in the ith MSW incineration option can be standardized by using Equation (7).
In equations 6 and 7, Sij is the standardized criterion value for the jth criterion of the ith alternative MSW incineration option; Xij is the jth criterion’s value for the ith alternative MSW incineration option; and (i = 1, …, m) and (j = 1, …, n). Supposing evaluation set of multi-attribute decision making problem has the jth criterion’s value in the ith MSW incineration option is Xij, then the decision matrix is X=[Xij]m×n; refer to below Table 5.

Table 3.
Decision matrix for ith MSW incineration option and jth criterion.
| Evaluation Criterion (j)→ Alternative MSW Incineration Option (i)↓ |
1 | 2 | . | n |
|---|---|---|---|---|
| 1 | X11 | X12 | . | X1n |
| 2 | X21 | X22 | . | X2n |
| . | . | . | . | . |
| . | . | . | . | . |
| M | Xm1 | Xm2 | . | Xmn |
| Criterion Weight → | W1 | W2 | . | Wn |
Standardization of all evaluation criteria for the given set of MSW incineration option, the structure of decision matrix is expressed as Equation 8.
After standardization of all evaluation criteria for all given MSW incineration option (refer Equations from 6 to 8), the decision matrix is expressed for each MSW incineration option type as here below in Table 4.
Table 4.
Standardized Decision matrix for alternative MSW incineration option.
| Option | A | B | C | D | E | F | G | H | I | J | |
|---|---|---|---|---|---|---|---|---|---|---|---|
| Fuel supply requirement | |||||||||||
|
C1 |
Fuel heating value requirement, MJ/kg(min) | 4 | 4 | 4 | 4 | 4 | 3 | 3 | 3 | 3 | 3 |
|
C2 |
Fuel drying requirement, % (max) | 3 | 3 | 3 | 3 | 3 | 2 | 2 | 2 | 2 | 2 |
|
C3 |
Fuel handling requirement (max) | 2 | 2 | 2 | 2 | 2 | 1 | 1 | 1 | 1 | 1 |
|
C4 |
Storage (max) | 1 | 1 | 1 | 1 | 1 | 2 | 2 | 2 | 2 | 2 |
| Incinerator performance | |||||||||||
|
C5 |
Capacity flexibility (min) |
1 | 1 | 1 | 1 | 1 | 3 | 3 | 3 | 3 | 3 |
|
C6 |
Conversion efficiency (max) | 40% | 40% | 40% | 40% | 40% | 60% | 60% | 60% | 60% | 60% |
|
C7 |
Co-firing adaptability (min) |
3 | 3 | 3 | 3 | 3 | 1 | 1 | 1 | 1 | 1 |
|
C8 |
Operation and Maintenance requirement (min) |
2 | 2 | 2 | 2 | 2 | 3 | 3 | 3 | 3 | 3 |
| End Use Performance | |||||||||||
|
C9 |
Energy efficiency (min) | 3 | 3 | 3 | 3 | 3 | 2 | 2 | 2 | 2 | 2 |
|
C10 |
Exergy Efficiency (min) |
2 | 2 | 2 | 2 | 2 | 3 | 3 | 3 | 3 | 3 |
|
C11 |
% of existing usage | 8.07 | 28.34 | 14.17 | 20.00 | 10.00 | 10.5 | 37.7 | 18.85 | 26.4 | 13.2 |
| Emission factors | |||||||||||
|
C12 |
Bottom Ash/Fly ash ratio (max) | 90/10 | 90/10 | 90/10 | 90/10 | 90/10 | 30/70 | 30/70 | 30/70 | 30/70 | 30/70 |
|
C13 |
emissions (CO2) kg/kg (min) |
1200 | 1200 | 1200 | 1200 | 1200 | 1250 | 1250 | 1250 | 1250 | 1250 |
|
C14 |
emissions (CO) mg/m3 (min) |
50 | 50 | 50 | 50 | 50 | 20 | 20 | 20 | 20 | 20 |
|
C15 |
NOX formation mg/m3. (min) |
12 | 12 | 12 | 12 | 12 | 6 | 6 | 6 | 6 | 6 |
|
C16 |
Leachates problems (min) |
3 | 3 | 3 | 4 | 4 | 1 | 1 | 1 | 2 | 2 |
| Economic factors | |||||||||||
|
C17 |
Investment cost of incinerator USD per ton (min) |
83.40 | 83.40 | 83.40 | 83.40 | 83.40 | 75.06 | 75.06 | 75.06 | 75.06 | 75.06 |
|
C18 |
Waste Collection cost USD per ton (min) |
37.9 | 37.9 | 37.9 | 37.9 | 37.9 | 37.9 | 37.9 | 37.9 | 37.9 | 37.9 |
|
C19 |
Fuel preparation cost (USD per ton) (min) |
21.43 | 21.43 | 21.43 | 21.43 | 21.43 | 42.87 | 42.87 | 42.87 | 42.87 | 42.87 |
|
C20 |
Levelized cost of Energy (USD) (min) |
2450 | 2350 | 2430 | 2600 | 2500 | 2200 | 2150 | 2350 | 2300 | 2130 |
5.2. Estimation of Criterion Entropy Weights
The entropy weight represents useful information of the criterion related MSW incineration and utilization technology evaluation. Note that higher the entropy weight of the evaluation criterion, the more important the criterion and vice versa. Whereas the entropy weight Ej of the jth criterion of the ith alternative MSW incineration and utilization technology is determined by Equation (9). Subsequently, based on Ej of the jth criterion, Wj, the criterion entropy weights, is determined by using Equation (10).
Using standardization of all evaluation criteria, Wj an entropy weight of the jth criterion is determined by Equations 9 and 10. Obtained Ej values for each MSW incineration and utilization technology evaluation criterion (j) are presented here below in Table 5.
Table 5.
Ej entropy weight values for criterion related to various MSW incineration and utilization technology for a given operating conditions.
Table 5.
Ej entropy weight values for criterion related to various MSW incineration and utilization technology for a given operating conditions.
| Evaluation Criterion (j) ↓ | Ej Entropy Weight Values | |||
|---|---|---|---|---|
| Scenario1 | Scenario2 | Scenario3 | Scenario4 | |
| C1 | 0.0215 | 0.0175 | 0.0210 | 0.0211 |
| C2 | 0.0432 | 0.0440 | 0.0422 | 0.0423 |
| C3 | 0.0200 | 0.0204 | 0.0464 | 0.0465 |
| C4 | 0.0389 | 0.0397 | 0.0380 | 0.0381 |
| C5 | 0.0365 | 0.0372 | 0.0357 | 0.0357 |
| C6 | 0.0200 | 0.0204 | 0.0196 | 0.0196 |
| C7 | 0.0475 | 0.0204 | 0.0464 | 0.0465 |
| C8 | 0.0475 | 0.0484 | 0.0464 | 0.0465 |
| C9 | 0.0475 | 0.0484 | 0.0464 | 0.0465 |
| C10 | 0.0475 | 0.0484 | 0.0464 | 0.0465 |
| C11 | 0.0110 | 0.0112 | 0.0107 | 0.0108 |
| C12 | 0.0475 | 0.0484 | 0.0464 | 0.0465 |
| C13 | 0.0475 | 0.0484 | 0.0464 | 0.0465 |
| C14 | 0.0475 | 0.0484 | 0.0464 | 0.0465 |
| C15 | 0.0475 | 0.0484 | 0.0464 | 0.0465 |
| C16 | 0.0215 | 0.0484 | 0.0210 | 0.0211 |
| C17 | 0.0475 | 0.0484 | 0.0464 | 0.0465 |
| C18 | 0.0475 | 0.0484 | 0.0464 | 0.0465 |
| C19 | 0.0475 | 0.0484 | 0.0464 | 0.0465 |
| C20 | 0.2648 | 0.2571 | 0.2553 | 0.2535 |
5.3. Normalization of the Decision Matrix
In order to eliminate the influence of criteria dimension and its variation range on MSW incineration and utilization technology evaluation results, it is necessary to normalize the original matrix to ensure that all the attributes are equivalent and the same format, then the normalized decision matrix is Rij is obtained using equation (11).
After normalization of all evaluation criteria for all given MSW incineration and utilization technologies (refer Equation 11), the decision matrix is expressed for each operating scenario a sample results for a scenario are as here below in Table 6.
5.4. Determine Best and Worst MSW Incineration and Utilization Technologies for a Given Criterion
Multiply each element of the above normalized decision matrix by its associated entropy weight Wj, decision matrix is obtained using below equation 12.
The outcome of above equation 12 results to set of best and worst solutions, and are obtained using Equations 13 and 14, respectively.
In equation (13)
In equation (14)
5.5. Determine the Closeness to Ideal Solution for Each Alternative MSW Incineration and Utilization Technologies for a Given Criterion and Ranking the Alternative
For a given alternative MSW incineration and utilization technology for a given criterion, its distance from the best ideal incineration and utilization technology strategy is obtained using the equation 15.
For a given MSW incineration and utilization technology, its distance from the worst ideal MSW incineration and utilization technology is obtained using the equation 16.
For a given MSW incineration and utilization technology, its closeness to ideal MSW incineration and utilization technology is obtained using equation 17.
In above equation 17, Ci value ranges in between one and zero. The alternative MSW incineration and utilization technology i with maximum positive value of Ci is ranked number one. Thus decision matrix of four operating scenarios and corresponding ten MSW incineration and utilization technologies and 20 evaluation criterions are established according to the data in the Table 6. The normalized decision matrix is established and weighted decision matrix is estimated (refer to Table 8), and when the best solution and the worst solution values are obtained by using equations 13 and 14 respectively.
6. Results and Discussion
Table 7 and Table 8 give the values of the relative ranks or the actual values of the different performance assessment factors for the different options for no recycling scenario for the central region and eastern region of Saudi Arabia. The options involving power generation, A, C, E, F, H and J, require high heating values and hence given poor ranking, 3 and 4, due to low heating values as determined from Equation 1. The options E and J which are cooling with power generation have better rankings for eastern region compared to central region because of lower total cooling load in the eastern region as given in Figure 3 and Figure 4. The two areas are different primarily in terms of MSW components resulting in difference in the heating value of the fuel as well as the cost of waste collection. Differences in composition results in difference in the heating value. The geographical area of the two regions result in difference in collection cost. Also the difference in the climatic conditions prevailing in the two region gives difference in the fuel moisture content resulting in differences in the efficiencies of the combustion systems. The cooling days required for the Eastern region (Cooling degree days=5953) is higher compared to the Central region (Cooling degree days=5688) resulting in comparatively more energy requirement for cooling application options, D, E and I, J.
Table 7.
Values of performance assessment factors for no recycling scenario for Central region.
| Option → | A | B | C | D | E | F | G | H | I | J |
|---|---|---|---|---|---|---|---|---|---|---|
| Meeting Fuel supply requirement | ||||||||||
| Heating value requirement ranking (min) | 4 | 2 | 4 | 1 | 4 | 3 | 2 | 3 | 1 | 3 |
| Fuel drying requirement, % (max) | 4 | 2 | 4 | 1 | 4 | 4 | 4 | 4 | 1 | 4 |
| Fuel handling requirement (max) | 3 | 2 | 2 | 2 | 2 | 4 | 1 | 1 | 1 | 1 |
| Storage problems ranking (max) | 3 | 1 | 4 | 4 | 1 | 3 | 1 | 4 | 1 | 4 |
| Incinerator performance | ||||||||||
| Capacity flexibility ranking (min) |
3 | 3 | 3 | 2 | 2 | 1 | 1 | 1 | 1 | 1 |
| Conversion efficiency ranking (max) | 2 | 3 | 3 | 3 | 3 | 1 | 2 | 2 | 2 | 2 |
| Co-firing adaptability ranking (min) | 3 | 3 | 3 | 3 | 3 | 1 | 1 | 1 | 1 | 1 |
| Operation and Maintenance requirement ranking (min) | 2 | 2 | 2 | 2 | 2 | 3 | 3 | 3 | 3 | 3 |
| End Use Performance | ||||||||||
| Energy efficiency ranking (min) | 3 | 3 | 3 | 3 | 3 | 2 | 2 | 2 | 2 | 2 |
| Exergy Efficiency ranking (min) |
2 | 2 | 2 | 2 | 2 | 3 | 3 | 3 | 3 | 3 |
| % of existing usage (max) | 8.07 | 28.34 | 14.17 | 20.00 | 10.00 | 10.5 | 37.7 | 18.85 | 26.4 | 13.2 |
| Emission factors | ||||||||||
| Bottom Ash/Fly ash ratio (max) |
90/10 | 90/10 | 90/10 | 90/10 | 90/10 | 30/70 | 30/70 | 30/70 | 30/70 | 30/70 |
| emissions (CO2) kg/kg (min) |
1200 | 1200 | 1200 | 1200 | 1200 | 1250 | 1250 | 1250 | 1250 | 1250 |
| emissions (CO) mg/m3 (min) |
50 | 50 | 50 | 50 | 50 | 20 | 20 | 20 | 20 | 20 |
| NOX formation mg/m3. (min) |
12 | 12 | 12 | 12 | 12 | 6 | 6 | 6 | 6 | 6 |
| Leachates problems ranking (min) |
3 | 3 | 3 | 4 | 4 | 1 | 1 | 1 | 2 | 2 |
| Economic factors | ||||||||||
| Investment cost of incinerator USD per ton (min) |
83.40 | 83.40 | 83.40 | 83.40 | 83.40 | 75.06 | 75.06 | 75.06 | 75.06 | 75.06 |
| Waste Collection cost USD per ton (min) |
37.9 | 37.9 | 37.9 | 37.9 | 37.9 | 37.9 | 37.9 | 37.9 | 37.9 | 37.9 |
| Fuel preparation cost (USD per ton) (min) |
21.43 | 21.43 | 21.43 | 21.43 | 21.43 | 42.87 | 42.87 | 42.87 | 42.87 | 42.87 |
| Levelized cost of Energy (USD) (min) |
0.16 | 0.18 | 0.18 | 0.19 | 0.18 | 0.17 | 0.20 | 0.20 | 0.21 | 0.20 |
Relative ranking indicators 1-Very high, 2-high. 3-average, 4-low. In column 1, (min) indicates minimization and (max) indicates maximization.
Table 8.
Values of performance assessment factors for no recycling scenario for Eastern region.
| Option → | A | B | C | D | E | F | G | H | I | J |
|---|---|---|---|---|---|---|---|---|---|---|
| Fuel supply requirement | ||||||||||
| Heating value requirement ranking (min) | 4 | 2 | 4 | 1 | 3 | 3 | 2 | 3 | 1 | 2 |
| Fuel drying requirement, % (max) | 4 | 2 | 4 | 1 | 4 | 4 | 4 | 4 | 1 | 4 |
| Fuel handling requirement (max) | 3 | 2 | 2 | 2 | 2 | 4 | 1 | 1 | 1 | 1 |
| Storage problems ranking (max) | 3 | 1 | 4 | 4 | 1 | 3 | 1 | 4 | 1 | 4 |
| Incinerator performance | ||||||||||
| Capacity flexibility ranking (min) | 3 | 3 | 3 | 2 | 2 | 1 | 1 | 1 | 1 | 1 |
| Conversion efficiency ranking (max) | 2 | 3 | 3 | 3 | 3 | 1 | 2 | 2 | 2 | 2 |
| Co-firing adaptability ranking (min) |
2 | 3 | 3 | 3 | 3 | 1 | 2 | 2 | 2 | 2 |
| Operation and Maintenance requirement ranking (min) |
3 | 3 | 3 | 3 | 3 | 1 | 1 | 1 | 1 | 1 |
| End Use Performance | ||||||||||
| Energy efficiency ranking (min) | 3 | 3 | 3 | 3 | 3 | 2 | 2 | 2 | 2 | 2 |
| Exergy Efficiency ranking (min) |
2 | 2 | 2 | 2 | 2 | 3 | 3 | 3 | 3 | 3 |
| % of existing usage (max) | 7.63 | 26.78 | 13.39 | 18.90 | 9.45 | 9.92 | 35.63 | 17.81 | 24.95 | 12.47 |
| Emission factors | ||||||||||
| Bottom Ash/Fly ash ratio (max) |
90/10 | 90/10 | 90/10 | 90/10 | 90/10 | 30/70 | 30/70 | 30/70 | 30/70 | 30/70 |
| emissions (CO2) kg/kg (min) | 1134 | 1134 | 1134 | 1134 | 1134 | 1181 | 1181 | 1181 | 1181 | 1181 |
| emissions (CO) mg/m3 (min) | 1134 | 1134 | 1134 | 1134 | 1134 | 1181 | 1181 | 1181 | 1181 | 1181 |
| NOX formation mg/m3 (min) | 11 | 11 | 11 | 11 | 11 | 6 | 6 | 6 | 6 | 6 |
| Leachates problems (min) | 50 | 50 | 50 | 50 | 50 | 20 | 20 | 20 | 20 | 20 |
| Economic factors | ||||||||||
| Investment cost of incinerator USD per ton (min) |
78.81 | 78.81 | 78.81 | 78.81 | 78.81 | 70.93 | 70.93 | 70.93 | 70.93 | 70.93 |
| Waste Collection cost USD per ton (min) |
36 | 36 | 36 | 36 | 36 | 36 | 36 | 36 | 36 | 36 |
| Fuel preparation cost (USD per ton) (min) |
20 | 20 | 20 | 20 | 20 | 41 | 41 | 41 | 41 | 41 |
| Levelized cost of Energy (USD) (min) |
0.15 | 0.17 | 0.17 | 0.18 | 0.17 | 0.17 | 0.19 | 0.19 | 0.20 | 0.19 |
Relative ranking indicators 1-Very high, 2-high. 3-average, 4-low. In column 1, (min) indicates minimization and (max) indicates maximization.
Table 9 and Table 10 gives the values of performance assessment factors for recycling scenario for Central region and Eastern region respectively. The heating value of the fuel is reduced due to the absence of some of the combustible material like paper and plastics and hence the ash content in the fuel is increased per kilogram of MSW considerably. The heating value of the fuel and the storage related issues are same as in the case of no recycling scenario. The fuel preparation cost is reduced since only organics are involved due to which additional cost incurred for fluidized bed firing is not there. Hence all options carry equal rank for fuel preparation. Also the moisture content in the organic waste component is much higher causing reduced combustion efficiency in all the options and are given the poorest rank of 4 for all cases. Incinerator performance factors are equally impacted by the difference in the fuel quality and hence the same ranks are retained.
Collection point separation or disposal site separation are two available options for separating the organic content from the waste. In the former case, the transportation cost is reduced considerably but in the case of disposal site separation, extensive machinery and labor is involved. In the present study, collection point separation is considered and costs are proportionally altered as per the weight fraction of the organic material. This is taken as 37% as per the data provided in Table 1.
The best and worst MSW incineration and utilization technology method are given in Table 11 here below. It is seen that the district cooling option using fluidized bed combustion (option I) is the best choice in terms of fuel drying requirement criteria (C3). This is because, dedicated cooling system using vapor absorption system operated efficiently at low combustion temperatures and therefore fuel drying requirement is minimum. The option of power generation with fluidized bed combustion (option F) is the best option for the criteria of fuel preparation requirement because of adaptability of variable fuel properties (C3) in the case of fluidized bed combustion. Desalination using heat from fluidized bed combustion (option G) is the best option with reference to the criteria of sharing the share of existing fresh water requirements (C11) in all the scenarios.
From Table 11 it is evident that for various criterion few MSW incineration and utilization technologies are best and whereas another set of MSW incineration and utilization technologies are worst for respective criterions. Now as a decision maker, it is very difficult to reach a unique preference under multiple criterions. So, the closeness to ideal solution for each alternative MSW incineration and utilization technology for a given criterion and the alternative MSW incineration and utilization technology ranking is must.
Various weighting scenarios are adopted in Table 12 and the rankings are obtained. Three types of allotting weights, namely, entropy weights, expert weights and equal weights are followed. There are differences in the results for different weights and the decision maker determines the conditions most favorable to the existing situation in order to make the decision.
Figure 8 and Figure 9 gives the average ranking considering all the three weights for the two regions considered in this study. In the case of non-recycling scenario, the first three positions are held by options D, F and B respectively. Similarity in the waste characteristics and other attributes is the reason for similar trends. In the case of recycling scenario, options D holds the first position in both regions. The second position is held by option F in the central region and G, H and I have equal second ranking for the eastern region.
7. Conclusion
Ten different MSW utilization technologies have been analyzed for the best option using 20 different performance attributes using the MCDA method. Two different regions in Saudi Arabia, namely, the Central region and the Eastern region are considered for this study under two types of scenario, namely with recycling and without recycling. The different options are prioritized based on their overall ranking using five major performance factors. As can be seen from the above Table 14, evaluation ranks of MSW incineration and utilization technologies are sensitive when various sets of weights are assigned to each criterion. In our analysis, focus is also on various scenarios that are expected to arise as per demand of MSW management. From the above Table 14 it is also evident that ranks/selection of MSW incineration and utilization technologies are sensitive to demand scenario. A comparison of the different scenarios indicates option D, which is district cooling with grate firing incineration, ranks well in most of the cases. Thus, selection of the best option for a particular application is one of the most challenging problems in when it comes to overall energy economics and environmental benefit. This has become more complex and should facilitate dynamically incorporating changing energy demand requirements and external conditions. It is observed that experts are having diverse preference weights for the evaluation criterion. Thus, decision maker needs to select the most suitable MSW incineration and utilization technological option in order to achieve the desired global energy output with minimum cost and specific application ability. This paper mainly focuses on MSW incineration and utilization technologies for meeting different requirements using MCDM. The entropy weight and MCDM method which have high resolution and simple calculation process could objectively evaluate the MSW incineration and utilization technologies. This approach is different as compared to the other known approaches.
Author Contributions
Conceptualization, Z.K; methodology, Z.K and A.R; software, A.R.; formal analysis, Z.K. and A.R.; investigation, A.R.; resources, Z.K.; writing—original draft preparation, Z.K., A.R. and Y.U.; writing—review and editing, Z.K., A.R. and Y.U.; visualization, Z.K.; project administration, Z.K.; funding acquisition, Z.K.
Funding
This research was funded by Deputyship for Research and Innovation, “Ministry of Education” in Saudi Arabia, grant number IFKSUDR_E155 and “The APC was funded by Deputyship for Research and Innovation, “Ministry of Education” in Saudi Arabia.
Acknowledgments
The authors extend their appreciation to the Deputyship for Research and Innovation, “Ministry of Education” in Saudi Arabia doe funding this research through the project number IFKSUDR_E155.
Conflicts of Interest
The authors declare no conflict of interest.
References
- Saudi Arabia’s Mobile Desalination Plants Achieving a New World Record “2.27 KW per m3” Lowest Energy Consumption Available online: https://idadesal.org/saudi-arabias-mobile-desalination-plants-achieving-a-new-world-record-2-27-kw-per-cubic-meter-lowest-energy-consumption/ (accessed on 15 May 2023).
- Howarth, N.; Odnoletkova, N.; Alshehri, T.; Almadani, A.; Lanza, A.; Patzek, T. Staying Cool in A Warming Climate: Temperature, Electricity and Air Conditioning in Saudi Arabia. Climate 2020, 8, 4. [CrossRef]
- Carlos Escobar Palacio, J.; Joaquim Conceição Soares Santos, J.; Luiza Grillo Renó, M.; Corrêa Furtado Júnior, J.; Carvalho, M.; Martín Martínez Reyes, A.; José Rúa Orozco, D. Municipal Solid Waste Management and Energy Recovery. In Energy Conversion - Current Technologies and Future Trends; H. Al-Bahadly, I., Ed.; IntechOpen, 2019 ISBN 978-1-78984-904-2.
- Una Nowling, P. POWER Magazine. September 1 2016,.
- Trindade, A.B.; Palacio, J.C.E.; González, A.M.; Rúa Orozco, D.J.; Lora, E.E.S.; Renó, M.L.G.; del Olmo, O.A. Advanced Exergy Analysis and Environmental Assesment of the Steam Cycle of an Incineration System of Municipal Solid Waste with Energy Recovery. Energy Conversion and Management 2018, 157, 195–214. [CrossRef]
- Guerrero, L.A.; Maas, G.; Hogland, W. Solid Waste Management Challenges for Cities in Developing Countries. Waste Management 2013, 33, 220–232. [CrossRef]
- €70 Billion Trash Business: Lessons from Germany’s Waste Management System. UNEP/UNESCO/BMUV course program 2020.
- US EPA, O. U.S. National Recycling Goal Available online: https://www.epa.gov/circulareconomy/us-national-recycling-goal (accessed on 15 May 2023).
- Reaching 2030’s Residual Municipal Waste Target — Why Recycling Is Not Enough — European Environment Agency Available online: https://www.eea.europa.eu/publications/reaching-2030s-residual-municipal-waste (accessed on 15 May 2023).
- National Waste Policy Action Plan - DCCEEW Available online: https://www.dcceew.gov.au/environment/protection/waste/publications/national-waste-policy-action-plan (accessed on 15 May 2023).
- Cheng, H.; Hu, Y. Curbing Dioxin Emissions from Municipal Solid Waste Incineration in China: Re-Thinking about Management Policies and Practices. Environmental Pollution 2010, 158, 2809–2814. [CrossRef]
- Holmes, T.; Baker, B.; Shoemaker, L. Materials for Service in Municipal Waste- & Biomass-Fired Power Generation … a Review of Recent Experience.; March 6 2016; p. NACE-2016-7493.
- Tsai, W.-T.; Kuo, K.-C. An Analysis of Power Generation from Municipal Solid Waste (MSW) Incineration Plants in Taiwan. Energy 2010, 35, 4824–4830. [CrossRef]
- Scarlat, N.; Dallemand, J.-F.; Monforti-Ferrario, F.; Nita, V. The Role of Biomass and Bioenergy in a Future Bioeconomy: Policies and Facts. Environmental Development 2015, 15, 3–34. [CrossRef]
- Scarlat, N.; Fahl, F.; Dallemand, J.-F. Status and Opportunities for Energy Recovery from Municipal Solid Waste in Europe. Waste Biomass Valor 2019, 10, 2425–2444. [CrossRef]
- McKay, G. Dioxin Characterisation, Formation and Minimisation during Municipal Solid Waste (MSW) Incineration: Review. Chemical Engineering Journal 2002, 86, 343–368. [CrossRef]
- Leckner, B.; Lind, F. Combustion of Municipal Solid Waste in Fluidized Bed or on Grate – A Comparison. Waste Management 2020, 109, 94–108. [CrossRef]
- Shao, Y.; Wang, J.; Preto, F.; Zhu, J.; Xu, C. Ash Deposition in Biomass Combustion or Co-Firing for Power/Heat Generation. Energies 2012, 5, 5171–5189. [CrossRef]
- Bolhar-Nordenkampf, M.; Nummelin, T.; Luomaharju, T.; Viljanen, J. Operating Experience from the World´s Largest Waste Fired Circulating Fluidized Bed Reactor in Västerås. In; 2015; pp. 167–178 ISBN 978-3-944310-22-0.
- Fitzgerald, G.C. Pre-Processing and Treatment of Municipal Solid Waste (MSW) Prior to Incineration. In Waste to Energy Conversion Technology; Elsevier, 2013; pp. 55–71 ISBN 978-0-85709-011-9.
- Tozlu, A.; Abusoglu, A.; Ozahi, E.; Anvari-Moghaddam, A. Municipal Solid Waste-Based District Heating and Electricity Production: A Case Study. Journal of Cleaner Production 2021, 297, 126495. [CrossRef]
- Udomsri, S.; Martin, A.R.; Martin, V. Thermally Driven Cooling Coupled with Municipal Solid Waste-Fired Power Plant: Application of Combined Heat, Cooling and Power in Tropical Urban Areas. Applied Energy 2011, 88, 1532–1542. [CrossRef]
- Fabricius, M.; Øland Tarp, D.; Wehl Rasmussen, T.; Arabkoohsar, A. Utilization of Excess Production of Waste-Fired CHP Plants for District Cooling Supply, an Effective Solution for a Serious Challenge. Energies 2020, 13, 3319. [CrossRef]
- Nubi, O.; Morse, S.; Murphy, R.J. Prospective Life Cycle Costing of Electricity Generation from Municipal Solid Waste in Nigeria. Sustainability 2022, 14, 13293. [CrossRef]
- Ding, L.; Shao, Z.; Zhang, H.; Xu, C.; Wu, D. A Comprehensive Evaluation of Urban Sustainable Development in China Based on the TOPSIS-Entropy Method. Sustainability 2016, 8, 746. [CrossRef]
- Almutairi, K.; Almutairi, M.S.; Harb, K.M.; Marey, O. A Thorough Investigation of Renewable Energy Development Strategies through Integrated Approach: A Case Study. Energy Sources, Part A: Recovery, Utilization, and Environmental Effects 2023, 45, 708–726. [CrossRef]
- Yu, Y.; Li, C.; Fu, Y.; Yang, W. A Group Decision-Making Method to Measure National Energy Architecture Performance: A Case Study of the International Energy Agency. Applied Energy 2023, 330, 120285. [CrossRef]
- Electrical Energy Production and Consumption Increase in 2020 Available online: https://www.argaam.com/en/article/articledetail/id/1611319 (accessed on 17 May 2023).
- ArgaamPlus Saudi Arabia’s Electricity Consumption Rises 4.2% in 2021 Available online: https://www.argaam.com/en/article/articledetail/id/1611319 (accessed on 17 May 2023).
- Aoun, M.-C.; Nachet, S. The Saudi Electricity Sector: Pressing Issues and Challenges. 2015.
- Krarti, M.; Howarth, N. Transitioning to High Efficiency Air Conditioning in Saudi Arabia: A Benefit Cost Analysis for Residential Buildings. Journal of Building Engineering 2020, 31, 101457. [CrossRef]
- Energy-Efficient Air Conditioning: A Case Study of the Maghreb Available online: https://documents1.worldbank.org/curated/en/754361472471984998/pdf/105360-REVISED-PUBLIC-MENA-Digital-Print-English-sep-2016.pdf (accessed on 15 May 2023).
- Saudi Arabia Climate Data Historical Available online: https://climateknowledgeportal.worldbank.org/country/saudi-arabia/climate-datahistorical#:~:text=Summers%20in%20the%20central%20region,coastal%20areas%20of%20Red%20Sea (accessed on 3 January 2023).
- Dammam Climate, Weather By Month, Average Temperature (Saudi Arabia) - Weather Spark Available online: https://weatherspark.com/y/104953/Average-Weather-in-Dammam-Saudi-Arabia-Year-Round (accessed on 17 May 2023).
- King Abdullah Petroleum Studies and Research Center (KAPSARC) The Future of Cooling in Saudi Arabia: Technology, Market and Policy Options; King Abdullah Petroleum Studies and Research Center, 2020;
- Ammar, E.A.; Dayil, A.B. Window Air Conditioners Transition and Restriction in Saudi Arabia. JPEE 2022, 10, 1–21. [CrossRef]
- Alessi, Y.M.; Al-Rabiah, A.A. A Feasibility Study of Utilizing Nuclear Energy for an Existing MED-TVC Desalination Plant. Applied Sciences 2022, 12, 9506. [CrossRef]
- Encyclopedia of Desalination and Water Resources: Energy Requirements of Desalination Processes Available online: https://www.desware.net/Energy-Requirements-Desalination-Processes.aspx (accessed on 17 May 2023).
- General Authority of Statistics Environmental indicators Available online: https://www.stats.gov.sa/ar/node/10131 (accessed on 17 May 2023).
- Population Estimates by Region, Sex and Nationality for Saudi Arabia - Public Knoema Data Hub Available online: https://public.knoema.com/qfkyjsf/population-estimates-by-region-sex-and-nationality-for-saudi-arabia (accessed on 17 May 2023).
- Jayakumar Menon, V.; Palackal, A. Centralized Anddecentralized Approaches to Solid Waste Management – a Case Study. Holist. approach environ. 2022, 12, 155–164. [CrossRef]
- Xie, Y.; Lu, J.-W.; Xie, B.; Shi, L.; Zhou, J.; Hai, J. Systematic Evaluation of Decentralized Thermal Treatment of Rural Solid Waste: Status, Challenges, and Perspectives. Resources, Conservation & Recycling Advances 2022, 15, 200116. [CrossRef]
- Xiong, J.; Ng, T.S.A.; Wang, S. An Optimization Model for Economic Feasibility Analysis and Design of Decentralized Waste-to-Energy Systems. Energy 2016, 101, 239–251. [CrossRef]
- Kuznetsova, E.; Cardin, M.-A.; Diao, M.; Zhang, S. Integrated Decision-Support Methodology for Combined Centralized-Decentralized Waste-to-Energy Management Systems Design. Renewable and Sustainable Energy Reviews 2019, 103, 477–500. [CrossRef]
- Latosińska, J.; Miłek, D.; Komór, A.; Kowalik, R. Selective Collection of Municipal Waste in a Residential District with Multi-Family Buildings—Case Study from Poland. Resources 2021, 10, 83. [CrossRef]
- Rada, E.C. Effects of MSW Selective Collection on Waste-to-Energy Strategies.; Bucharest, Romania, June 19 2013; pp. 3–13.
- Al-Waked, R.; Ouda, O.K.M.; Raza, S.A. Potential value of waste-to-energy facility in Riyadh city - Saudi Arabia. 2014. [CrossRef]
- Kong, X.; Meng, X.; Li, J.; Shang, Y.; Cui, F. Comparative Study on Two-Stage Absorption Refrigeration Systems with Different Working Pairs. J. Shanghai Jiaotong Univ. (Sci.) 2021, 26, 155–162. [CrossRef]
- Huang, Q.; Chi, Y.; Themelis, N.J. A Rapidly Emerging WTE Technology: Circulating Fluid Bed Combustion. In Proceedings of the Conference proceedings, international thermal treatment technologies (IT3) 33rd, Air and Waste Management Association, San Antonio; 2013.
- Dong, J.; Chi, Y.; Tang, Y.; Ni, M.; Nzihou, A.; Weiss-Hortala, E.; Huang, Q. Effect of Operating Parameters and Moisture Content on Municipal Solid Waste Pyrolysis and Gasification. Energy Fuels 2016, 30, 3994–4001. [CrossRef]
- Liang, L.; Sun, R.; Fei, J.; Wu, S.; Liu, X.; Dai, K.; Yao, N. Experimental Study on Effects of Moisture Content on Combustion Characteristics of Simulated Municipal Solid Wastes in a Fixed Bed. Bioresource Technology 2008, 99, 7238–7246. [CrossRef]
- Sarkar, D.K. Fluidized-Bed Combustion Boilers. In Thermal Power Plant; Elsevier, 2015; pp. 159–187 ISBN 978-0-12-801575-9.
- Khan, M.S.; Kadam, S.T.; Kyriakides, A.-S.; Papadopoulos, A.I.; Hassan, I.; Rahman, M.A.; Seferlis, P. A New Correlation for Performance Prediction of Small and Large Capacity Single-Effect Vapor Absorption Refrigeration Systems. Cleaner Energy Systems 2022, 1, 100002. [CrossRef]
- Yin, C.; Li, S. Advancing Grate-Firing for Greater Environmental Impacts and Efficiency for Decentralized Biomass/Wastes Combustion. Energy Procedia 2017, 120, 373–379. [CrossRef]
- Saqib, N.; Bäckström, M. Distribution and Leaching Characteristics of Trace Elements in Ashes as a Function of Different Waste Fuels and Incineration Technologies. Journal of Environmental Sciences 2015, 36, 9–21. [CrossRef]
- Understanding the Carbon Impacts of Waste to Energy Incineration Available online: https://zerowasteeurope.eu/2020/03/understanding-the-carbon-impacts-of-waste-to-energy/ (accessed on 17 May 2023).
- Thunman, H.; Lind, F.; Breitholtz, C.; Berguerand, N.; Seemann, M. Using an Oxygen-Carrier as Bed Material for Combustion of Biomass in a 12-MWth Circulating Fluidized-Bed Boiler. Fuel 2013, 113, 300–309. [CrossRef]
- Campos-Alba, C.M.; Garrido-Rodríguez, J.C.; Plata-Díaz, A.M.; Pérez-López, G. The Selective Collection of Municipal Solid Waste and Other Factors Determining Cost Efficiency. An Analysis of Service Provision by Spanish Municipalities. Waste Management 2021, 134, 11–20. [CrossRef]
- Leckner, B. Fluidized Bed Combustion. In Reference Module in Chemistry, Molecular Sciences and Chemical Engineering; Elsevier, 2016; p. B9780124095472122000 ISBN 978-0-12-409547-2.
- Boskovic, G.; Jovicic, N.; Jovanovic, S.; Simovic, V. Calculating the Costs of Waste Collection: A Methodological Proposal. Waste Manag Res 2016, 34, 775–783. [CrossRef]
- Āriņa, D.; Kļavenieks, K.; Burlakovs, J. The Cost-Estimation of Mechanical Pre-Treatment Lines of Municipal Solid Waste in Latvia. Proceedings of the Latvia University of Agriculture 2014, 32, 17–28. [CrossRef]
- Short, W.; Packey, D.J.; Holt, T. A Manual for the Economic Evaluation of Energy Efficiency and Renewable Energy Technologies; National Renewable Energy Lab.(NREL), Golden, CO (United States), 1995;
Figure 1.
The different utilization options available from MSW incineration.
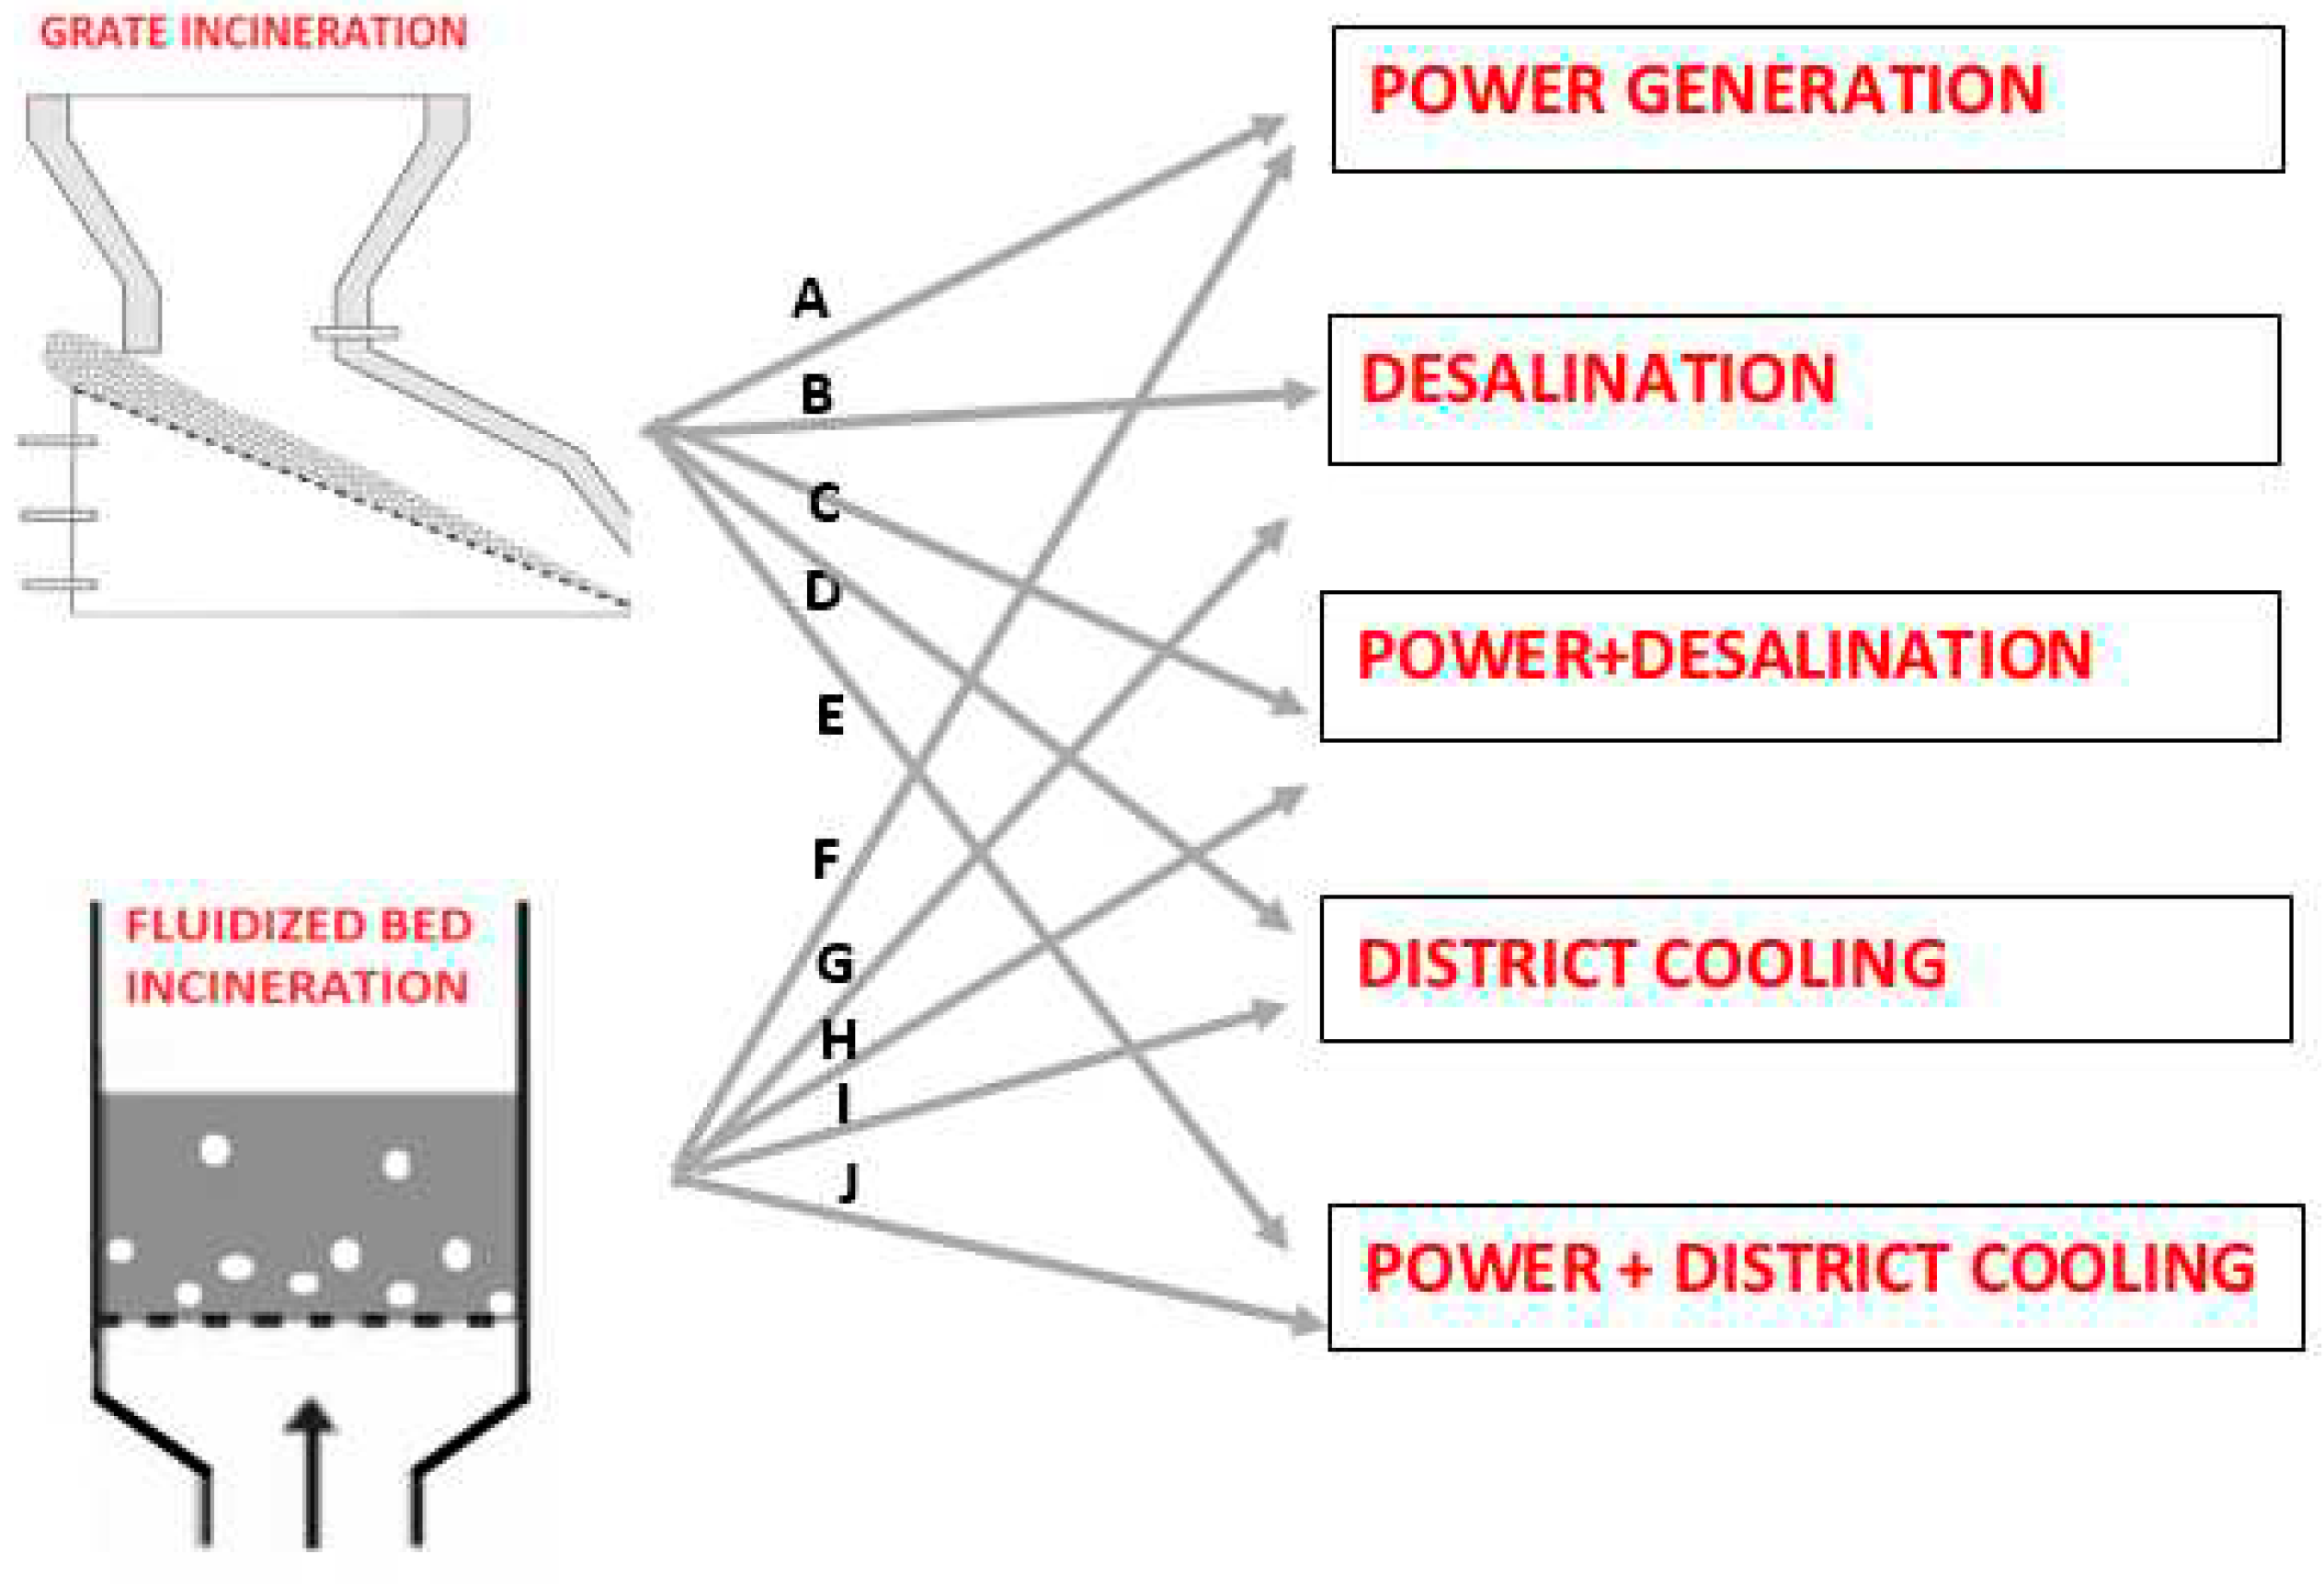
Figure 2.
Projected monthly energy consumption in Central and Eastern region (2030).
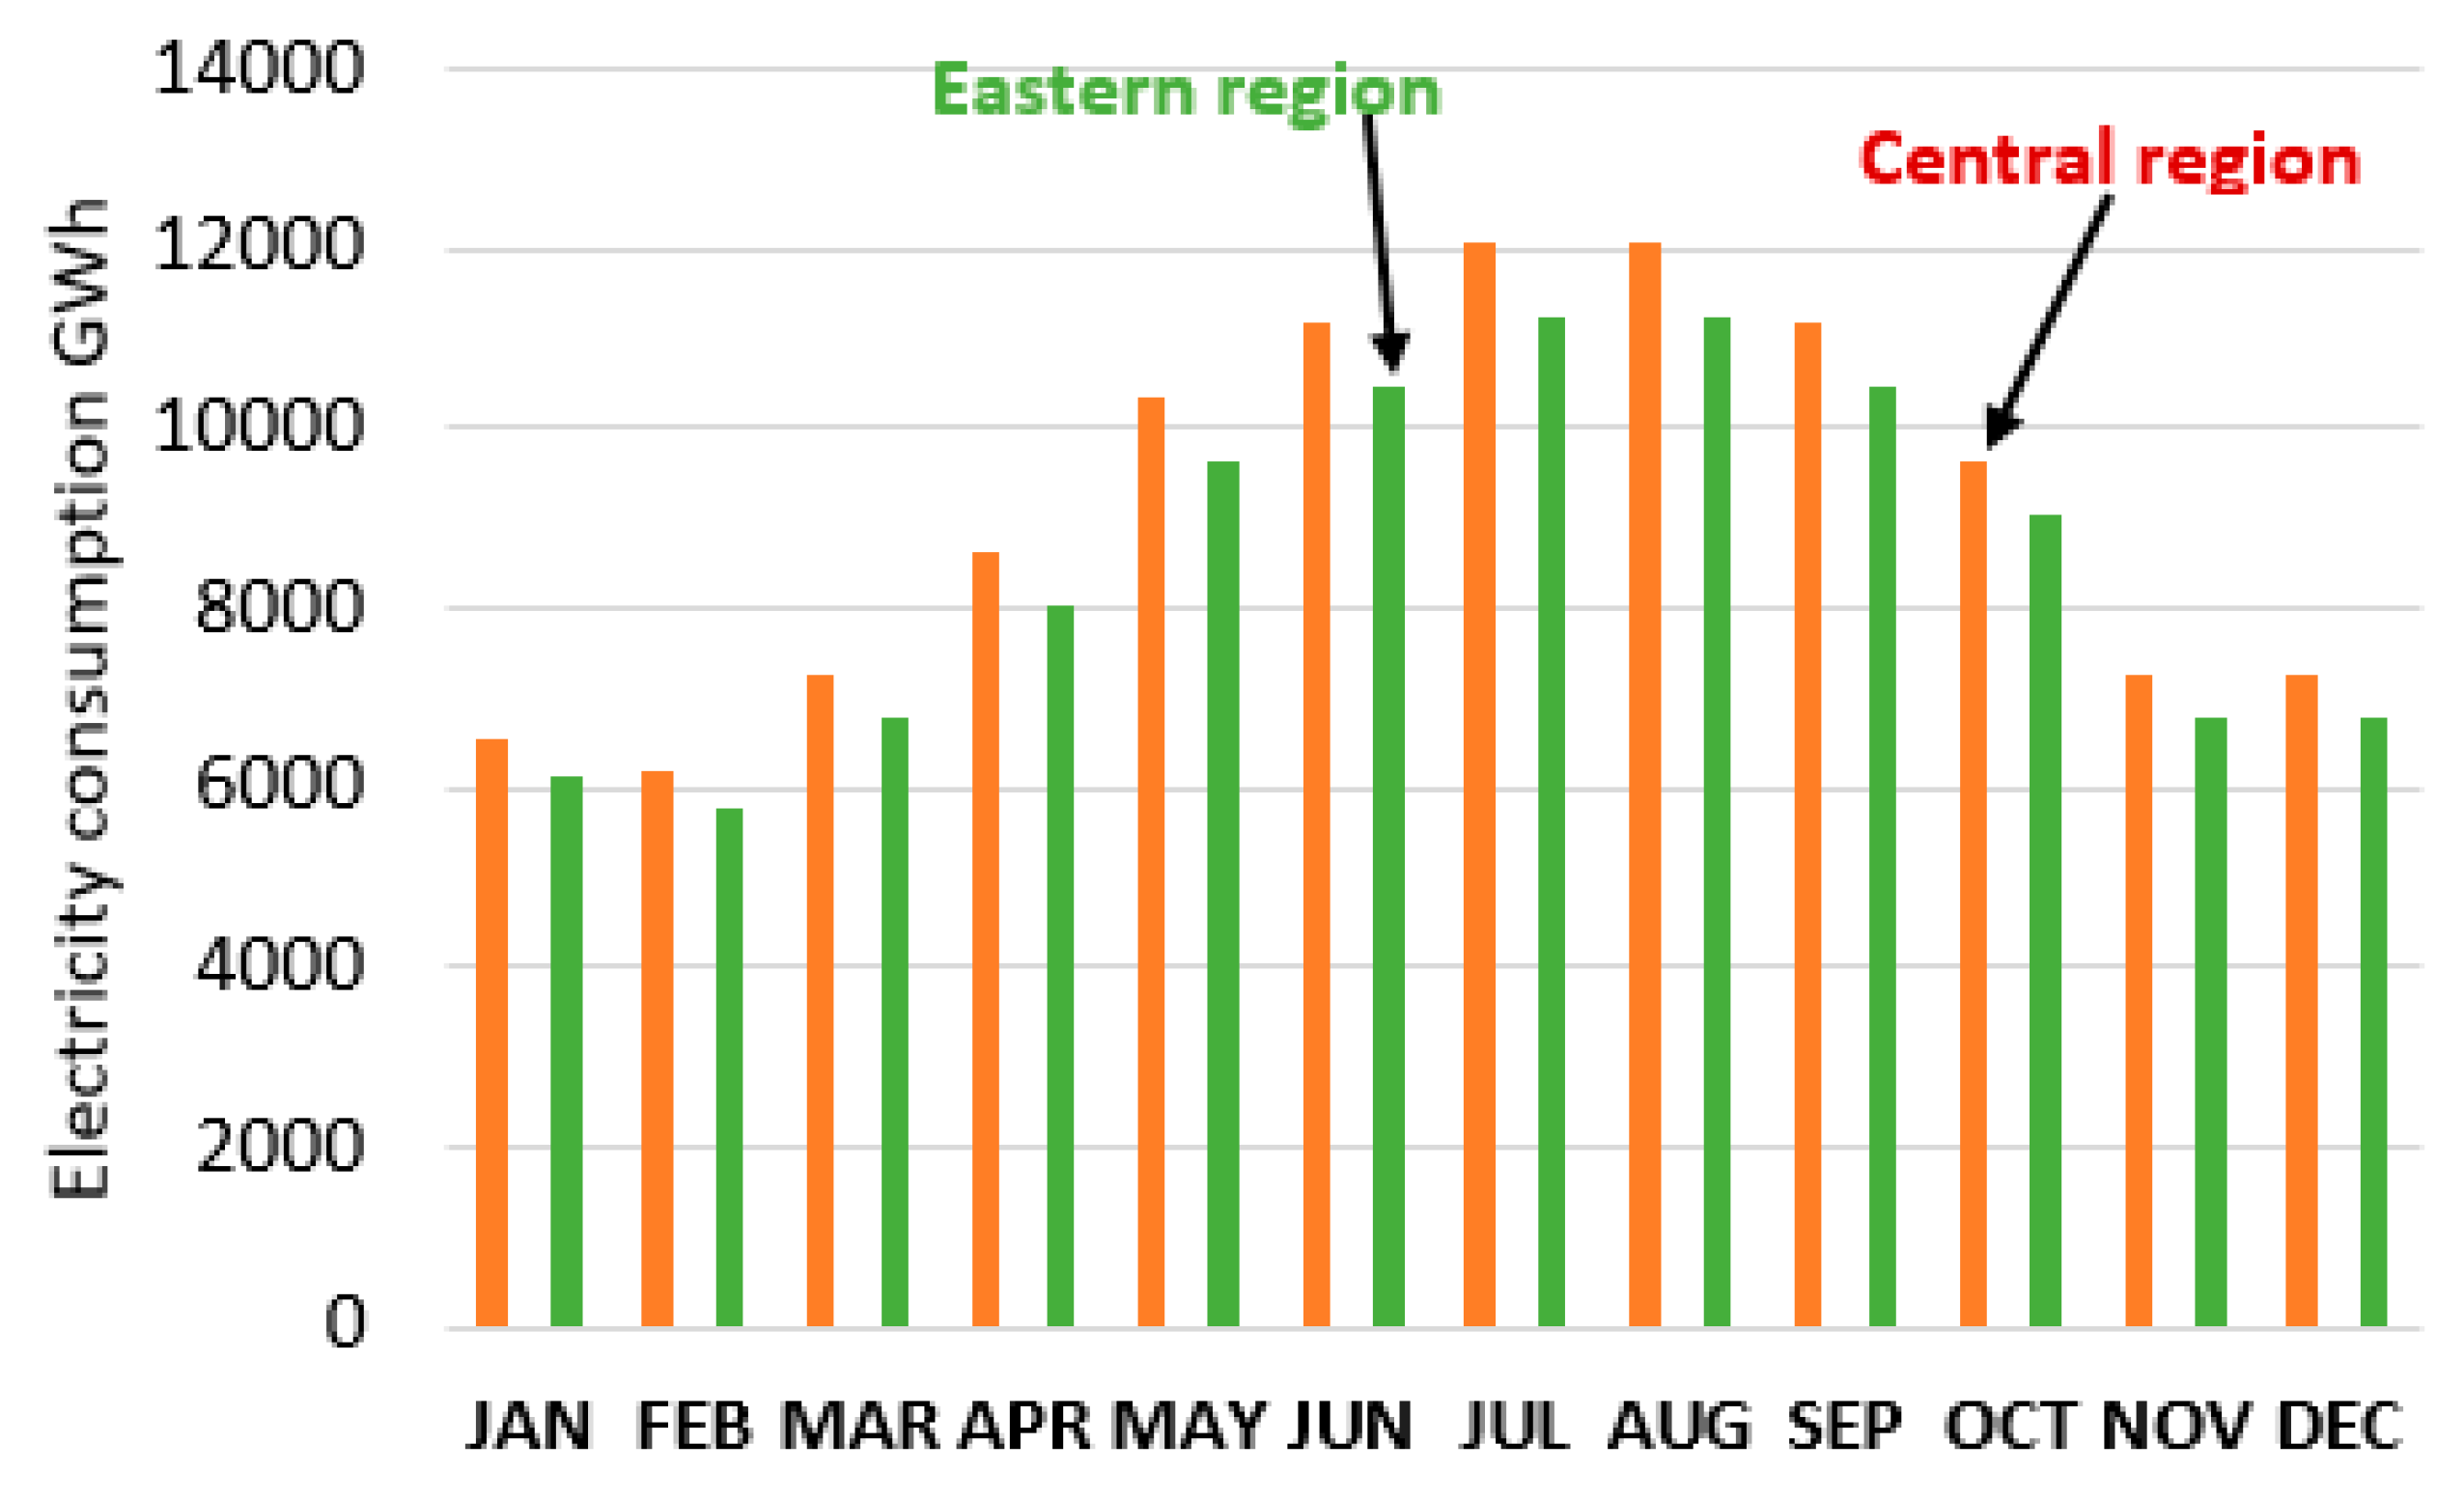
Figure 3.
Projected monthly energy consumption for Air-conditioning in Central region along with maximum ambient temperatures (2030) [35].
Figure 3.
Projected monthly energy consumption for Air-conditioning in Central region along with maximum ambient temperatures (2030) [35].
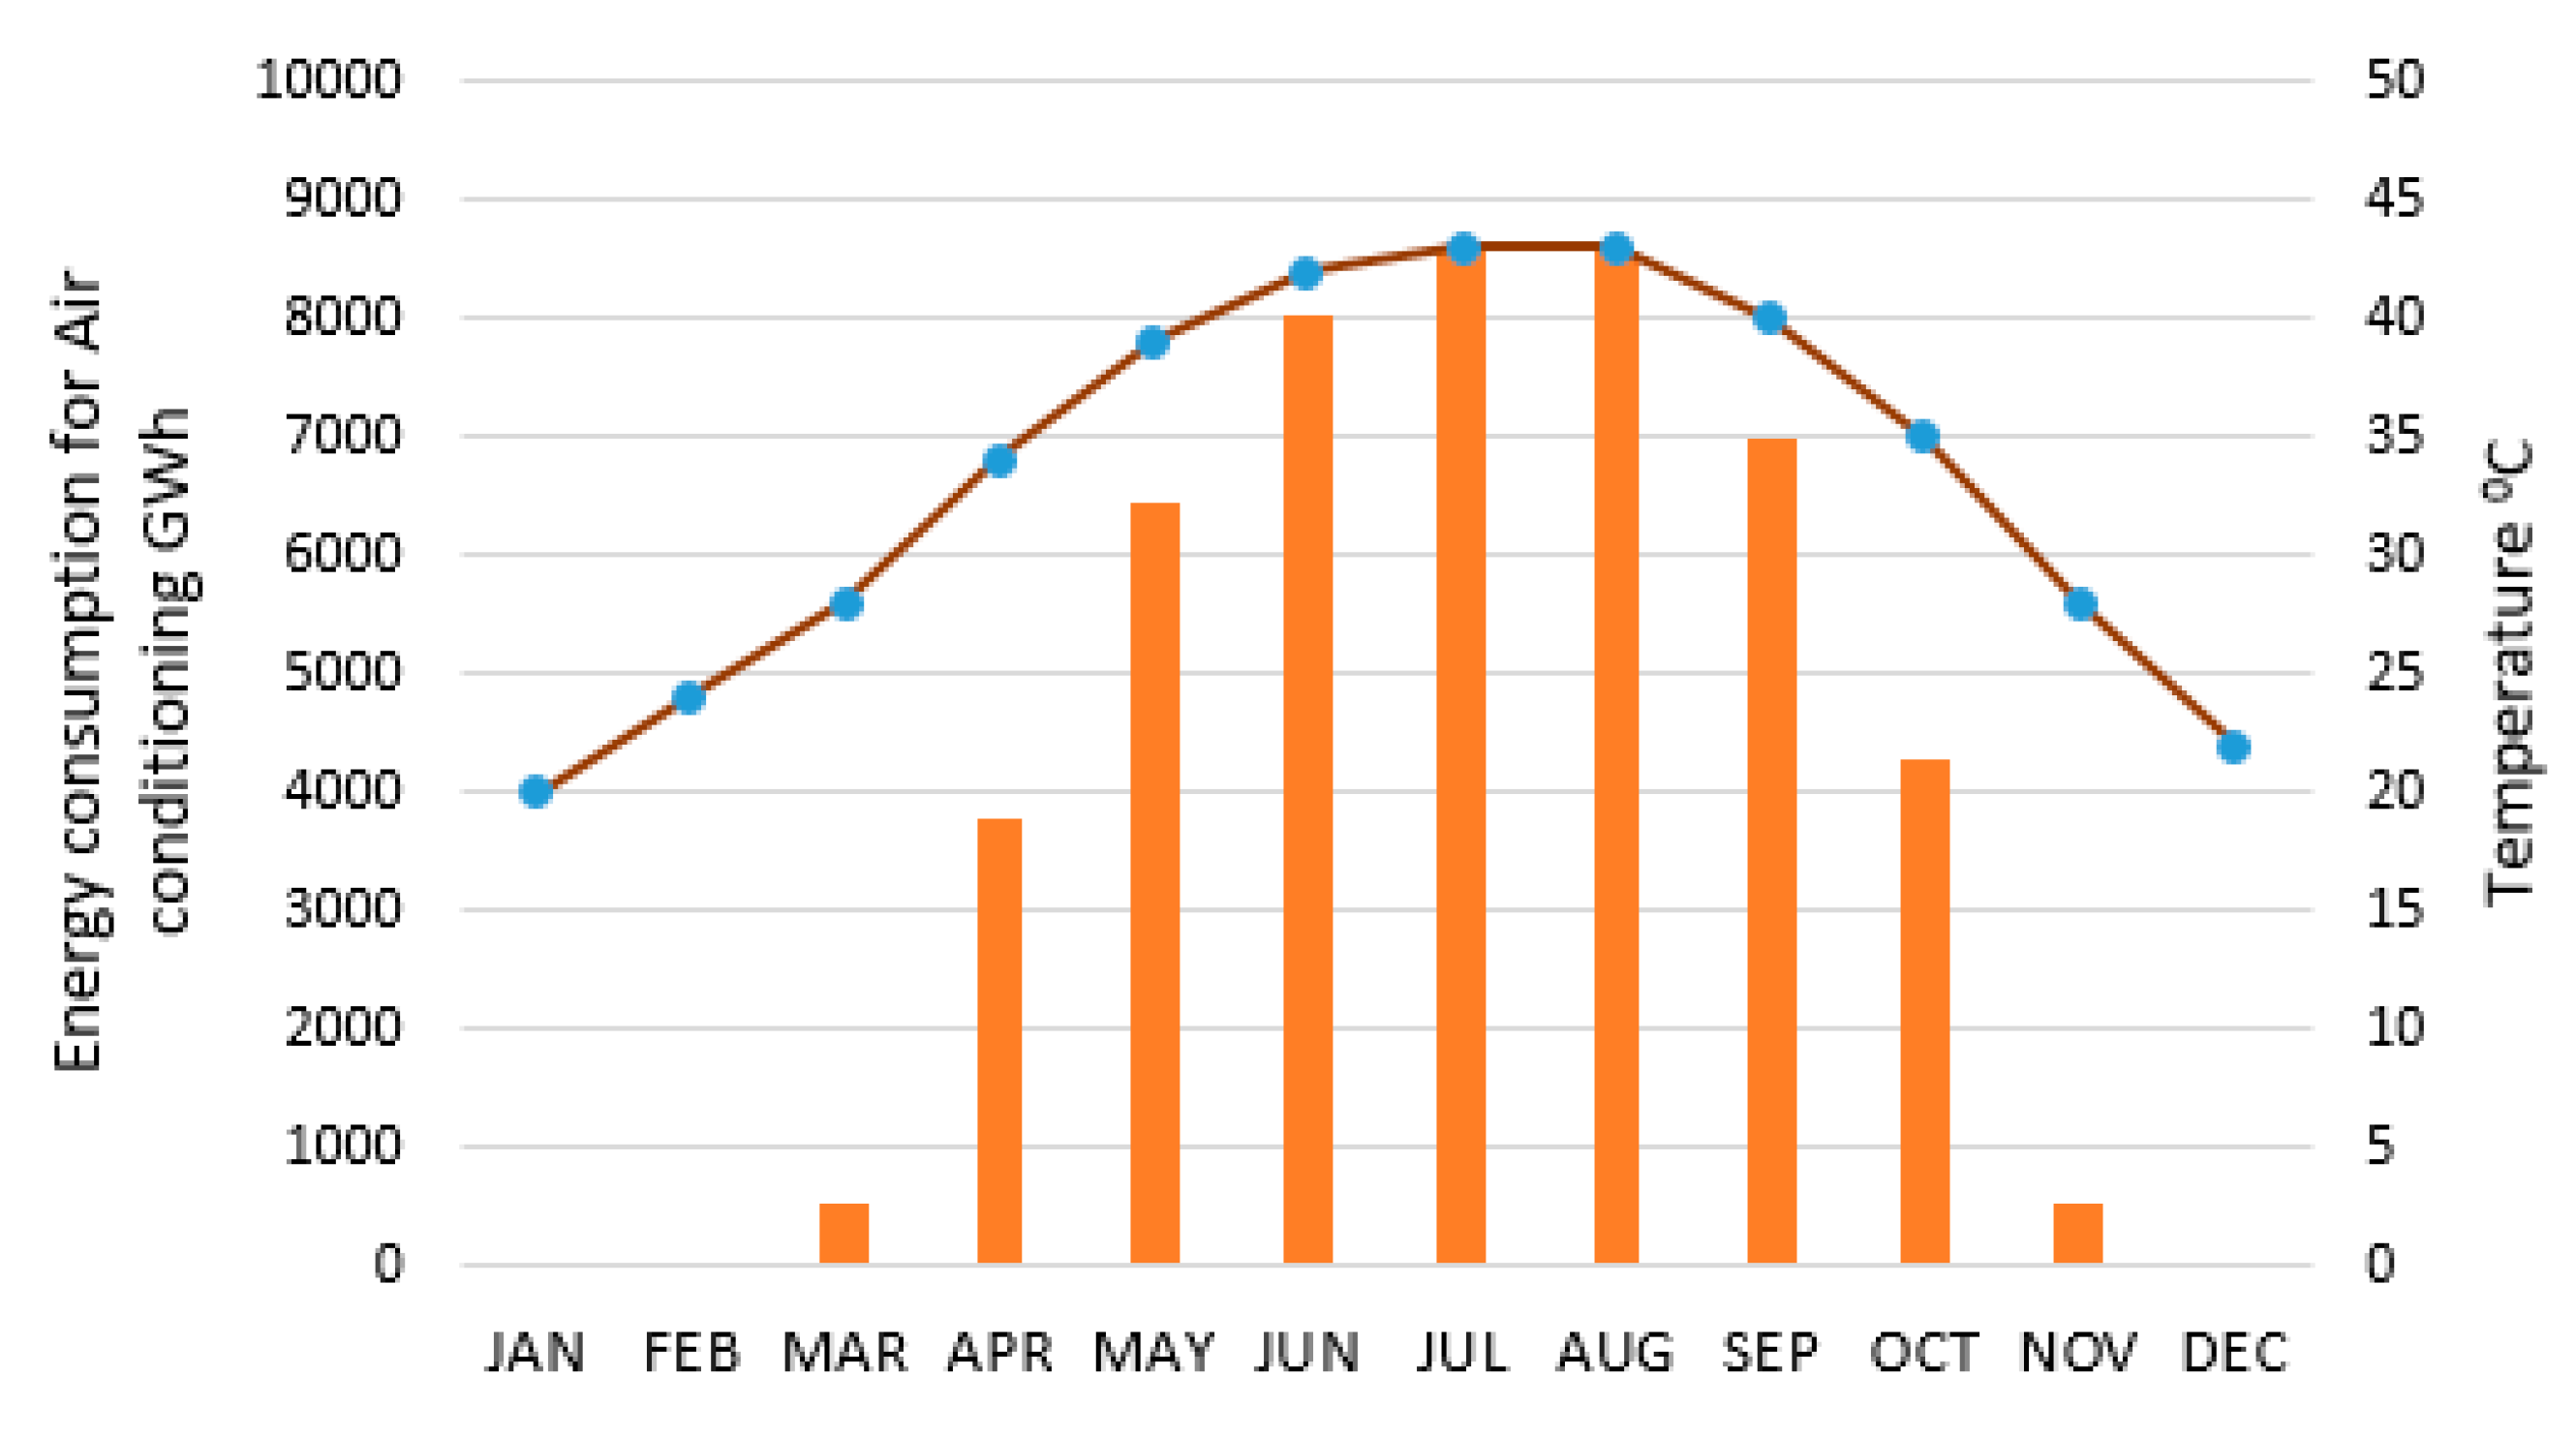
Figure 4.
Projected monthly energy consumption for Air-conditioning in Eastern region along with maximum ambient temperatures (2030) [36].
Figure 4.
Projected monthly energy consumption for Air-conditioning in Eastern region along with maximum ambient temperatures (2030) [36].
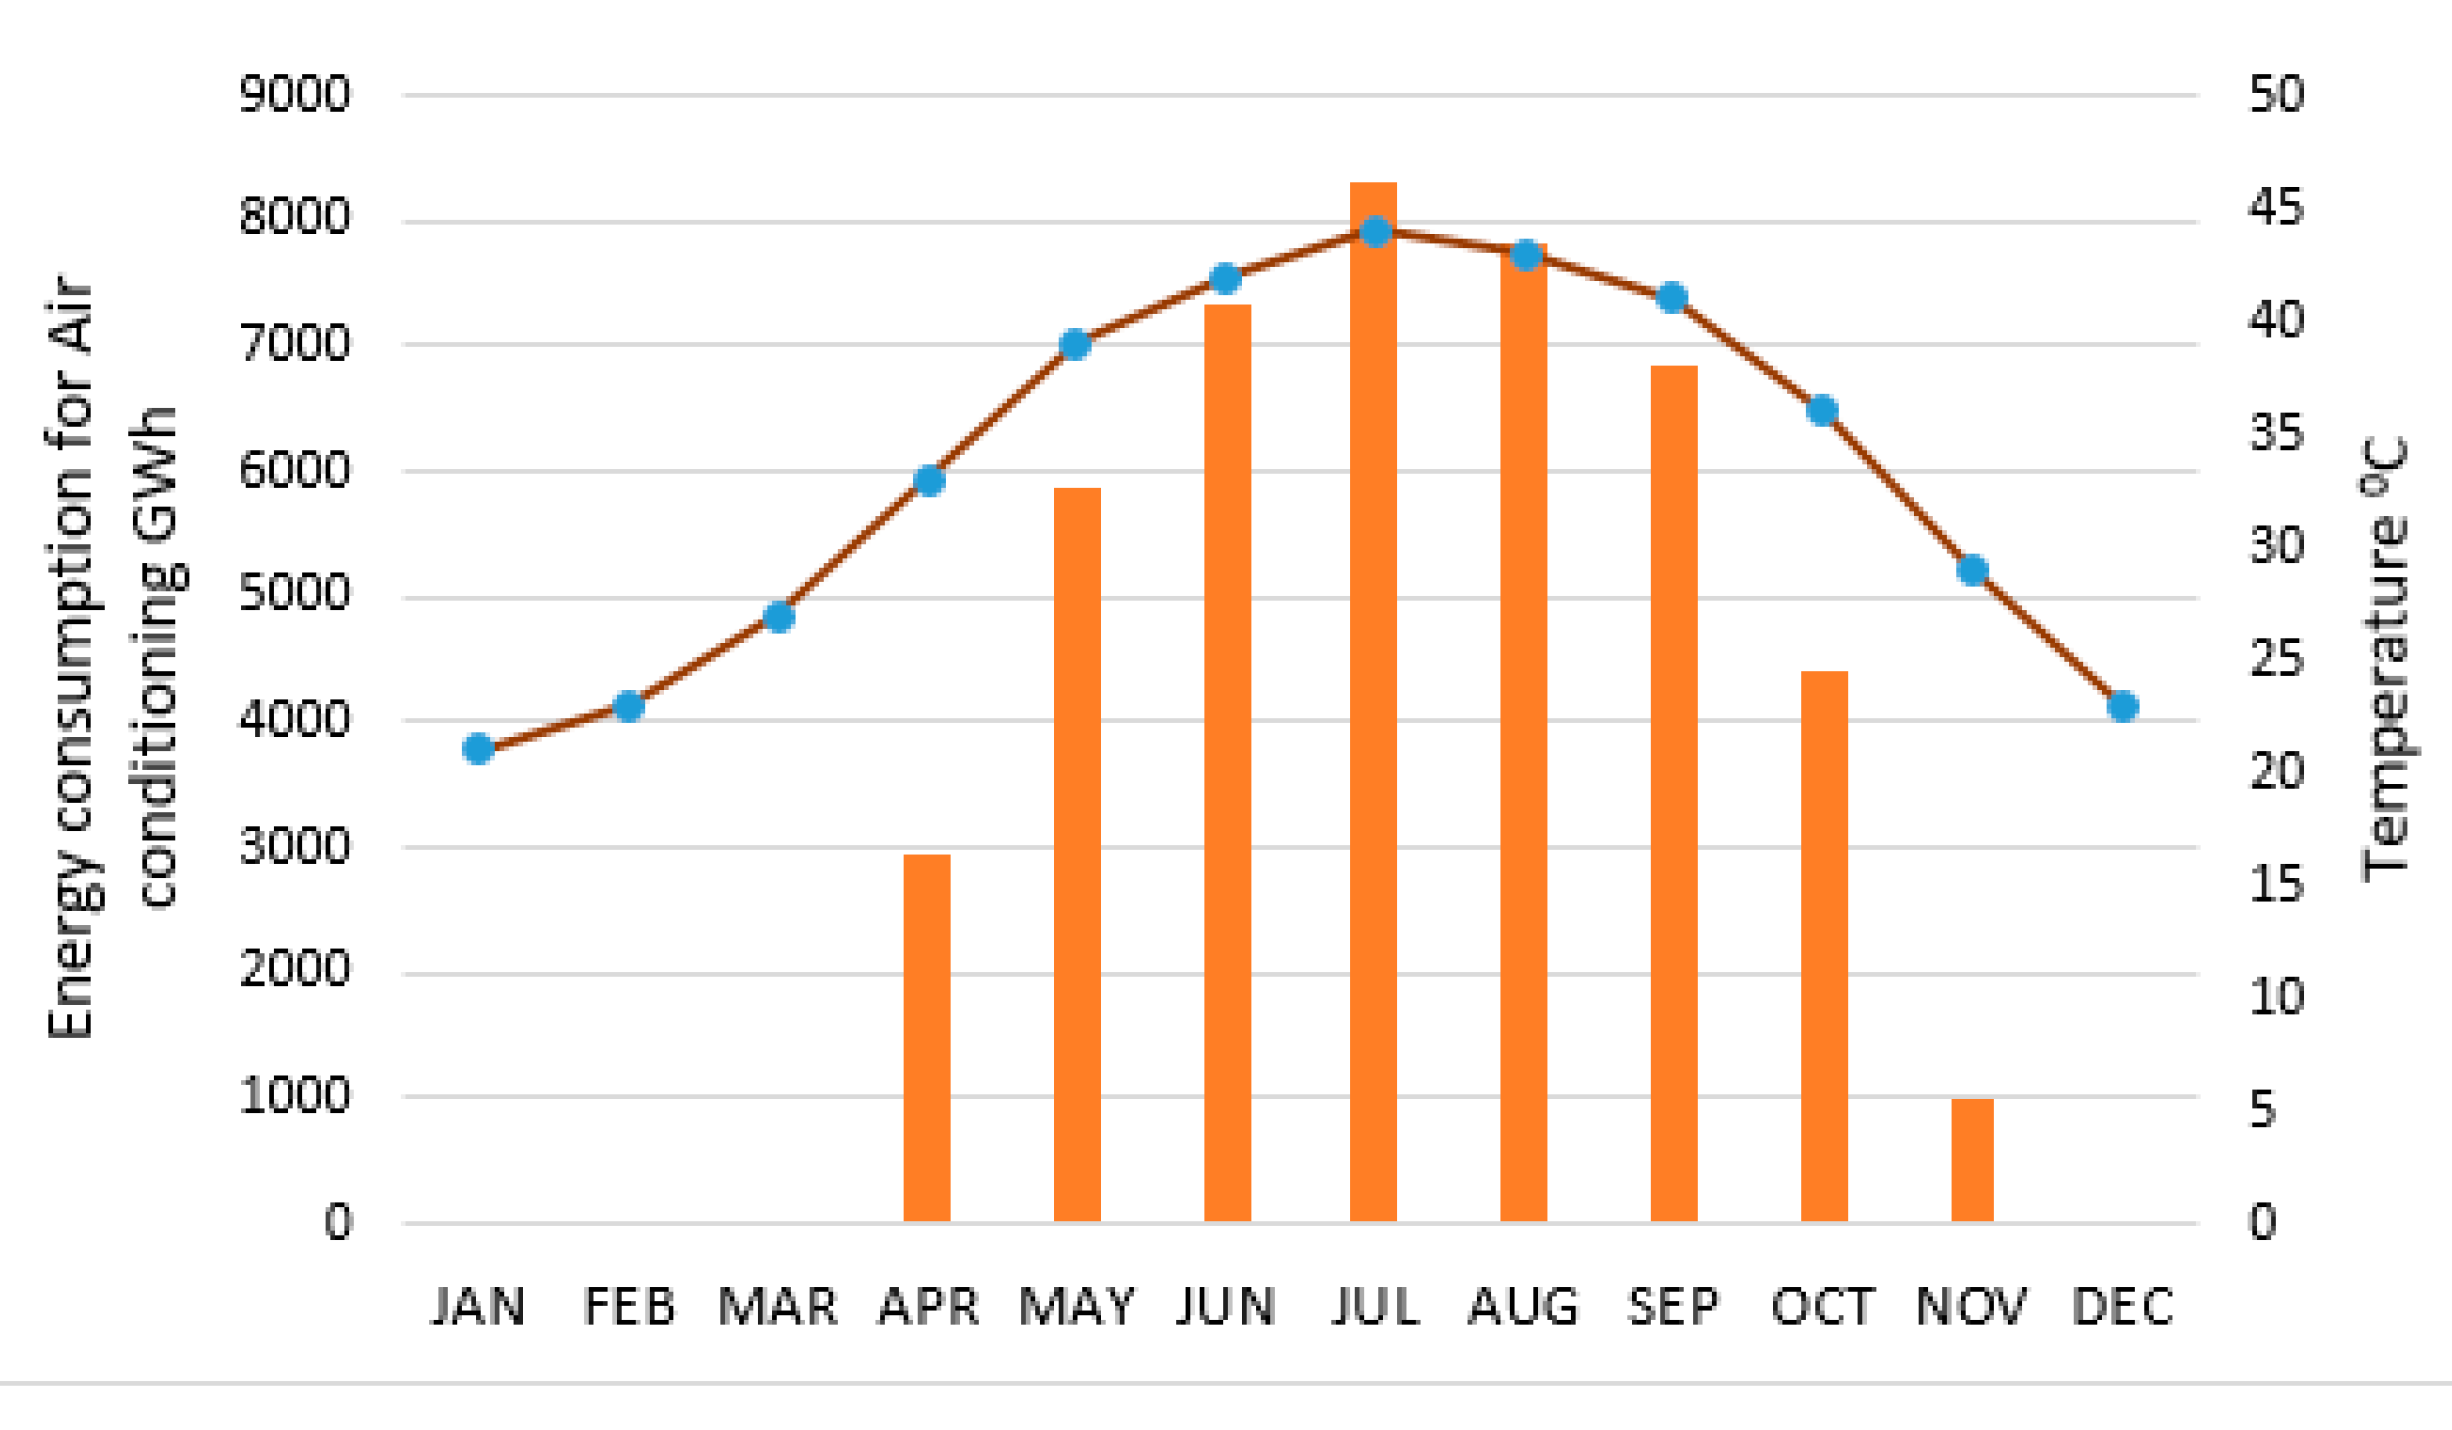
Figure 5.
Yearly water consumption and population of central and eastern region (2030).
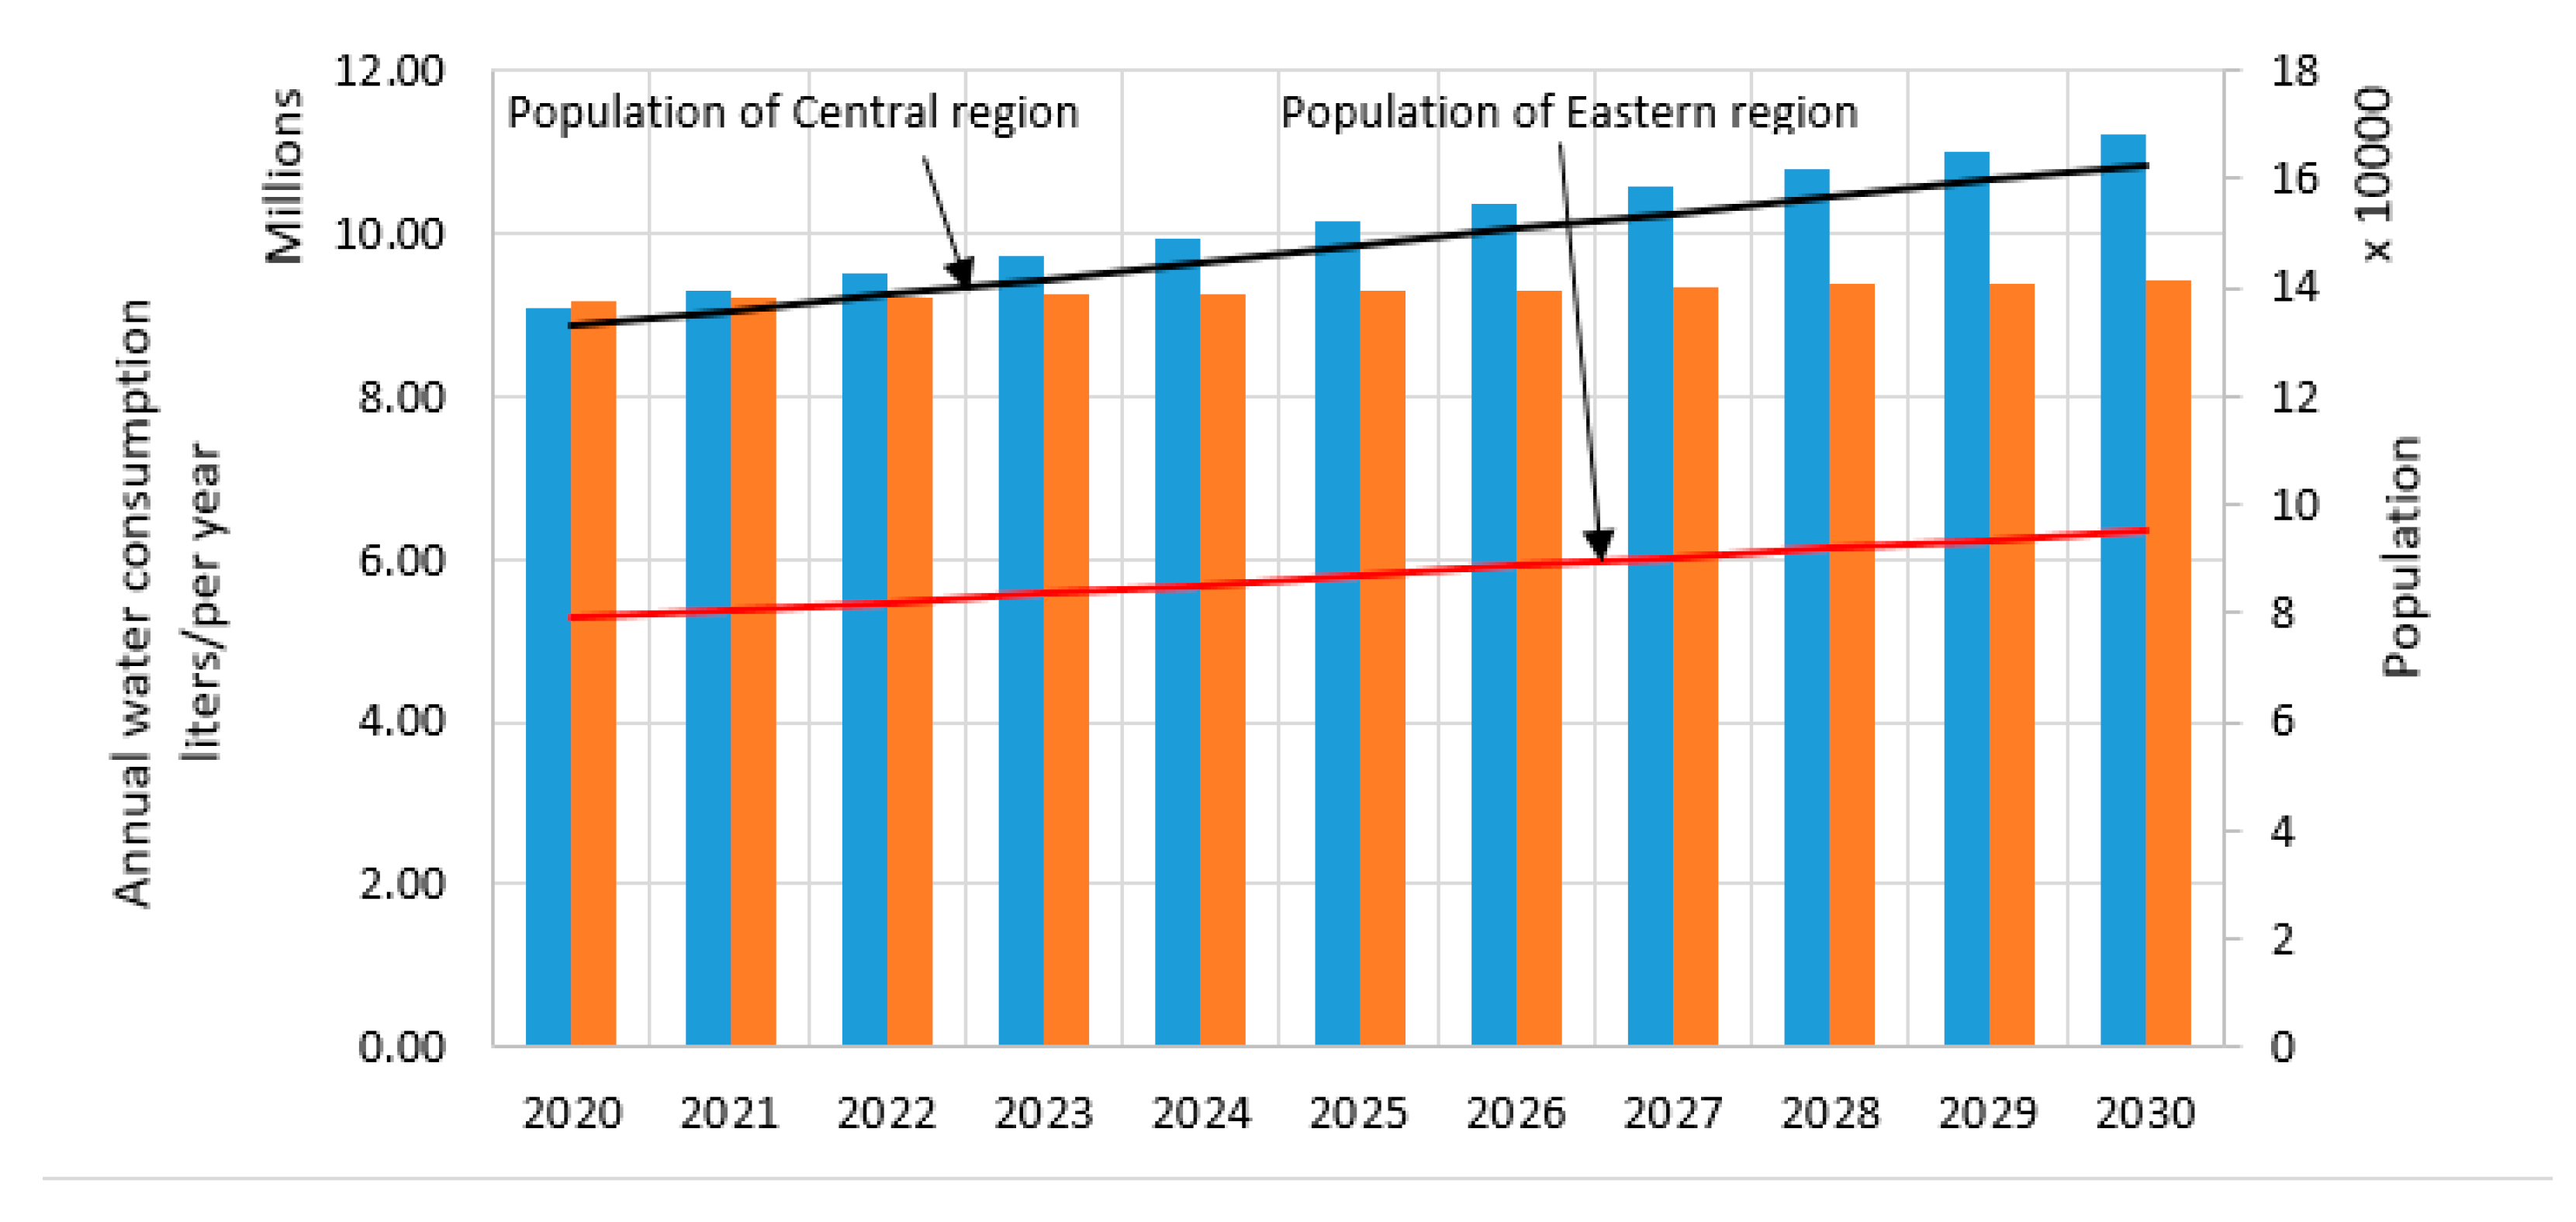
Figure 6.
Municipal solid waste generation in Central and eastern region from 2020 to 2030.
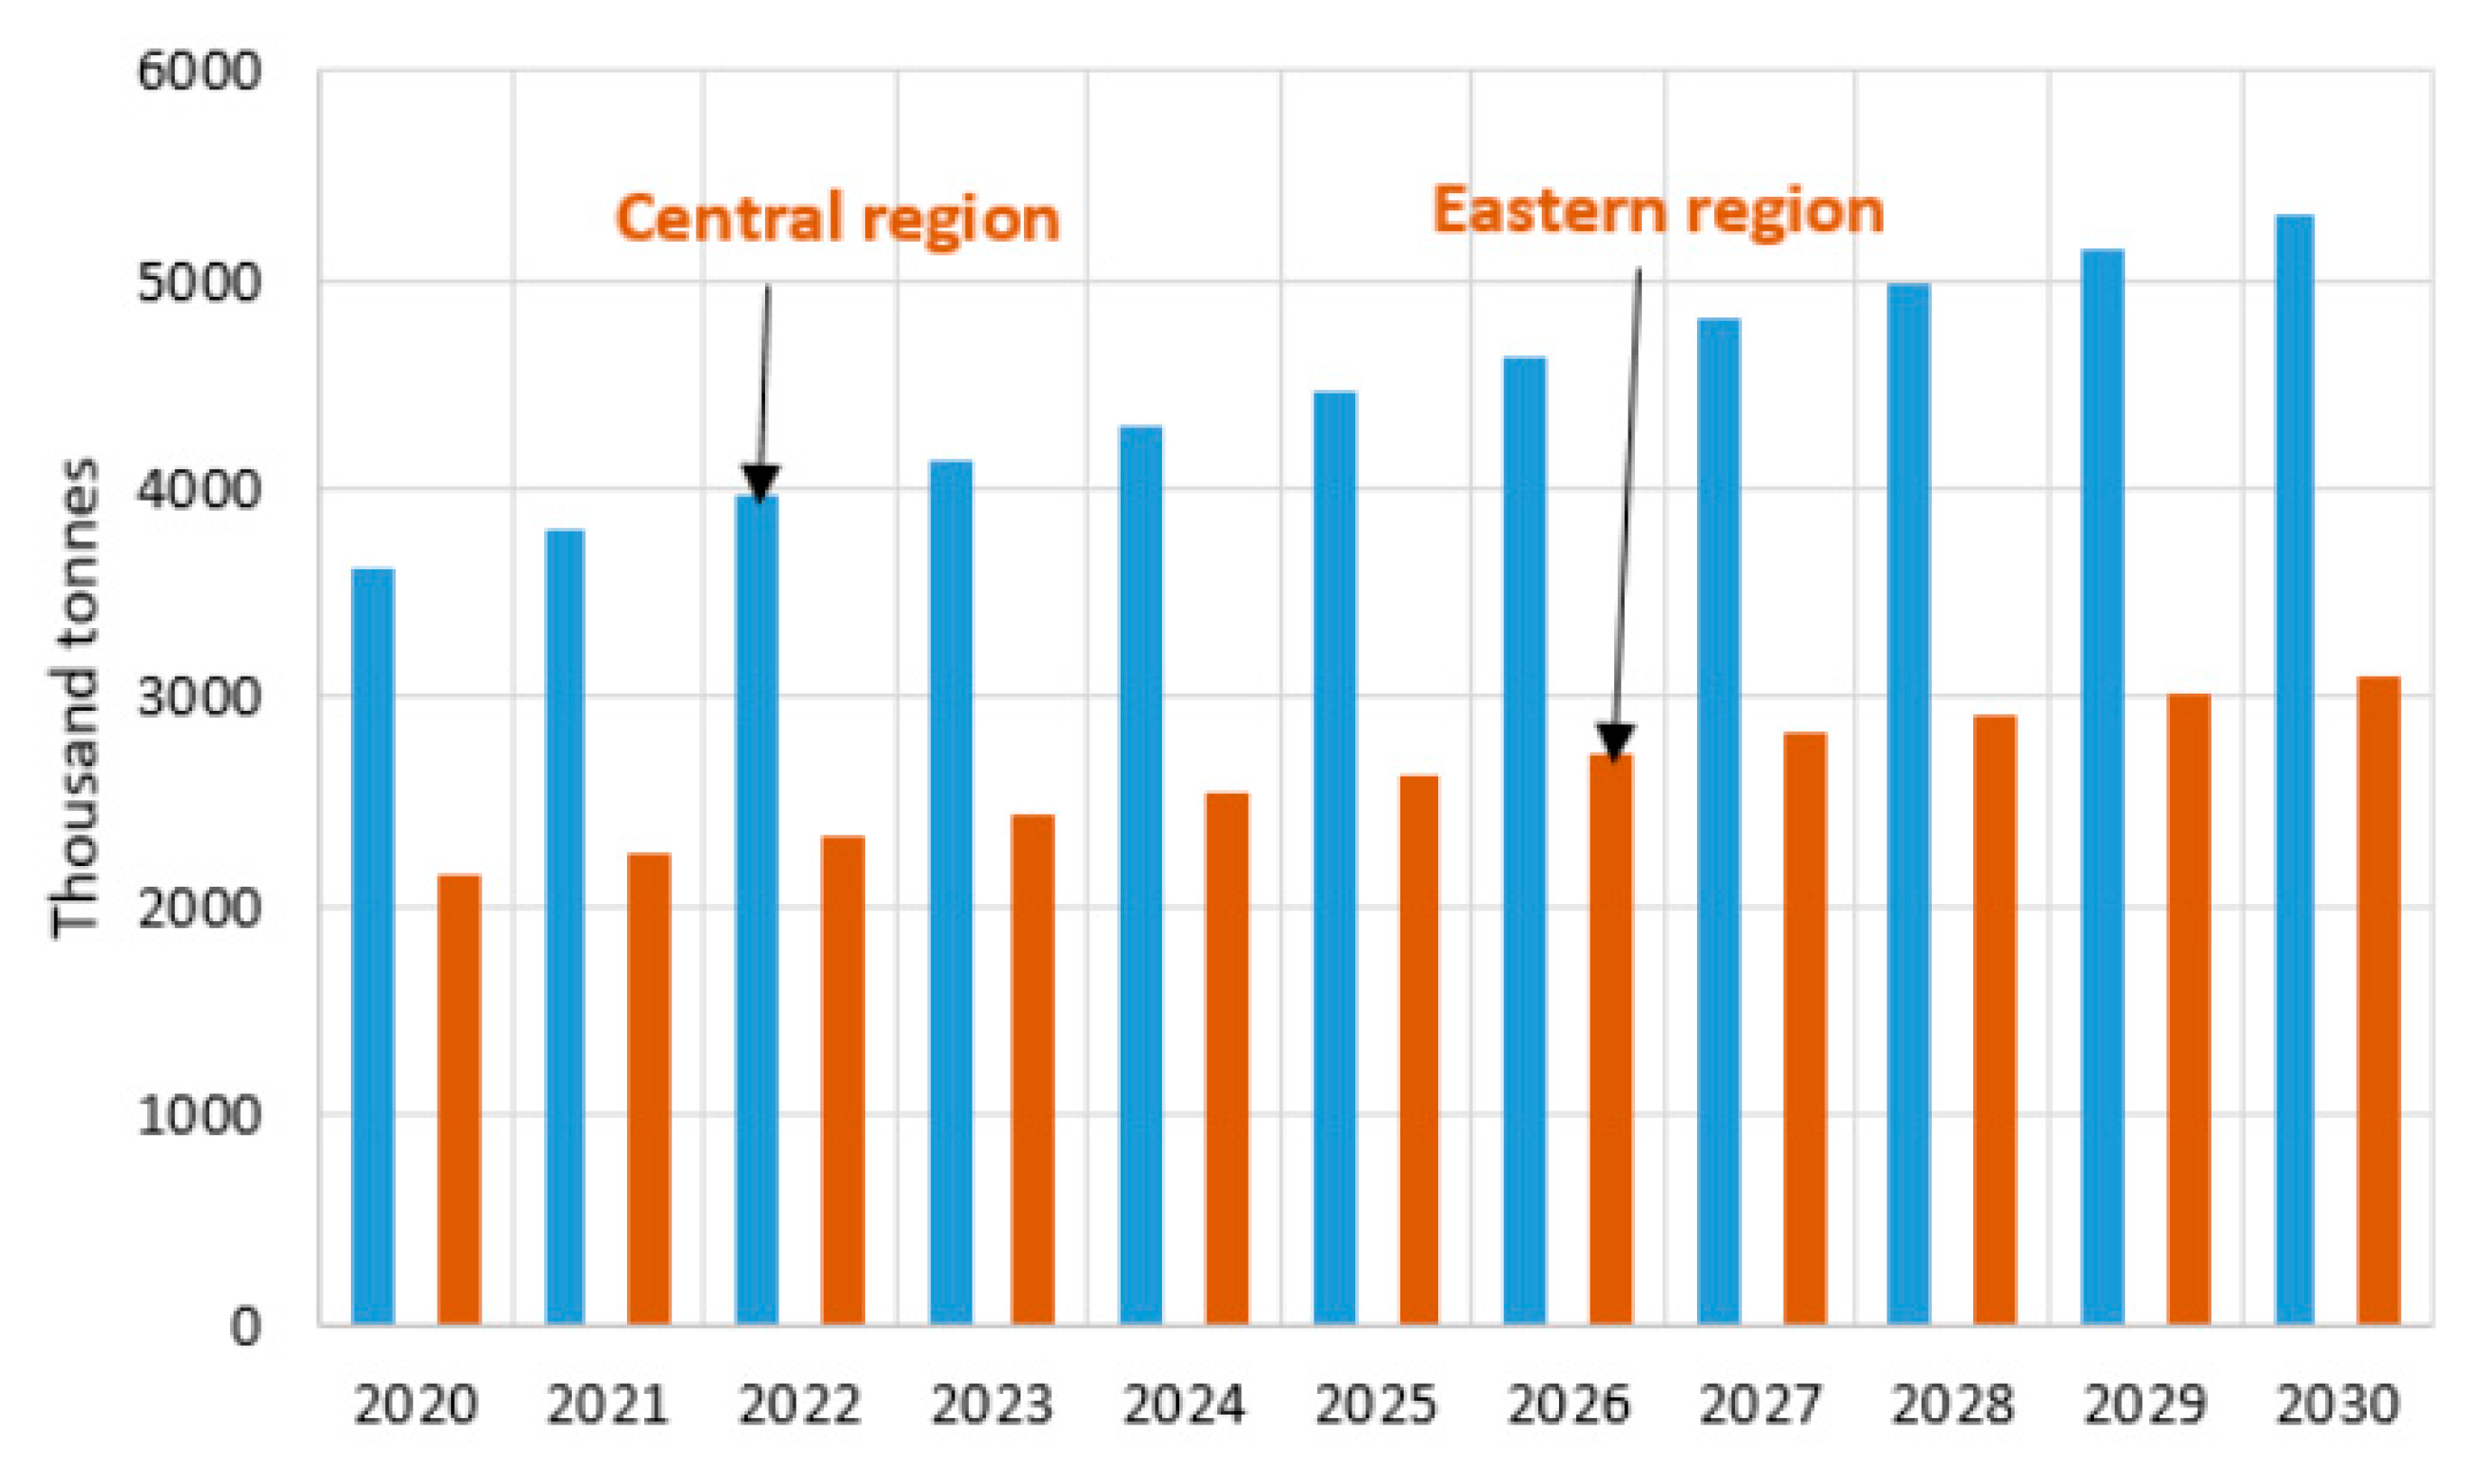
Figure 7.
Basic cycle of a Lithium bromide-water VAR two stage cooling system [47].
Figure 7.
Basic cycle of a Lithium bromide-water VAR two stage cooling system [47].
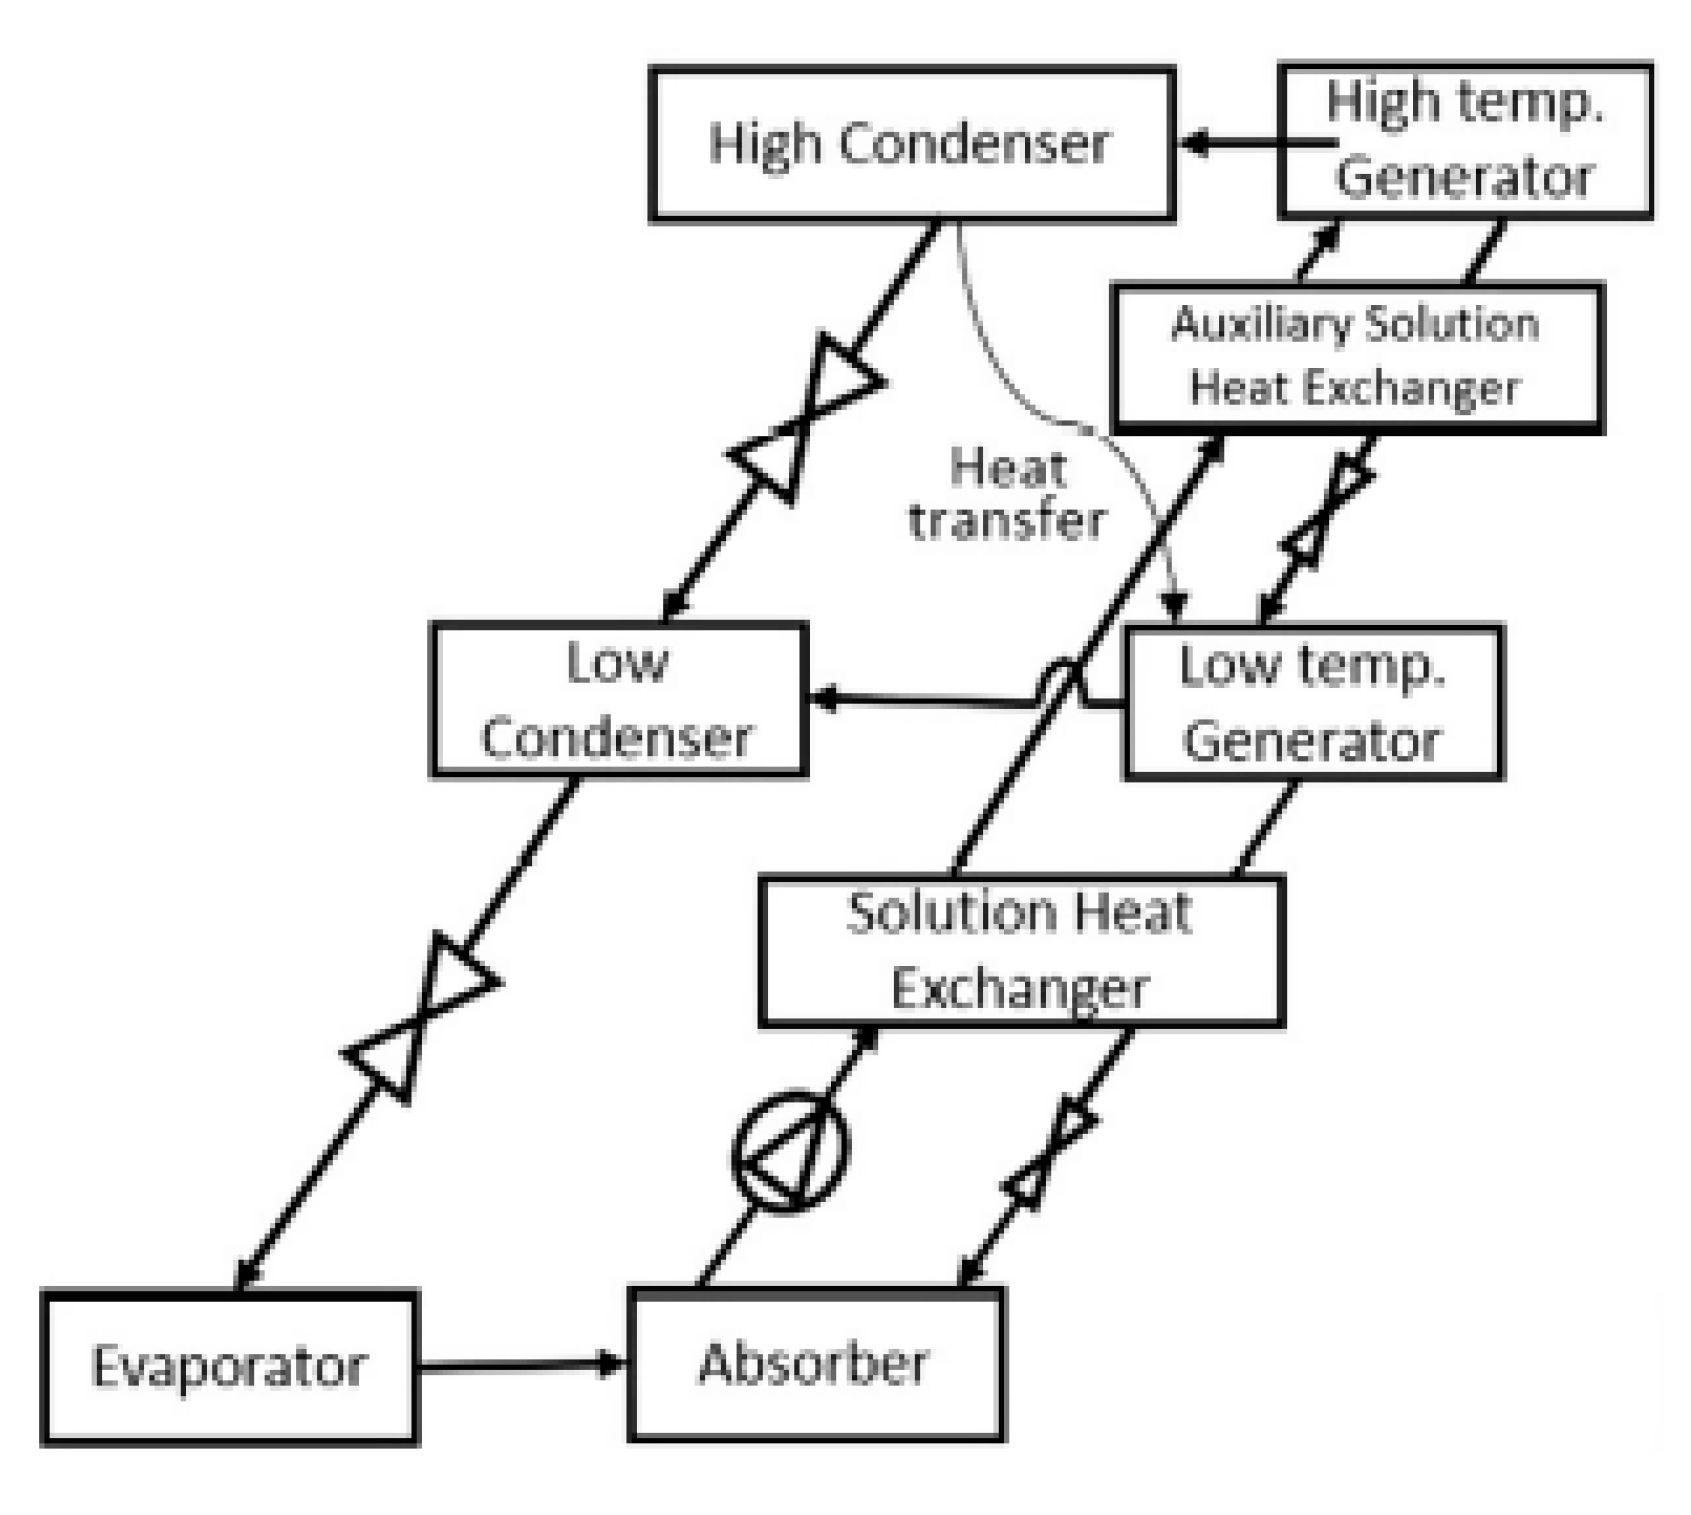
Figure 8.
Average ranking of options for non-recycling scenario (a) Central Region (b) Eastern region.
Figure 8.
Average ranking of options for non-recycling scenario (a) Central Region (b) Eastern region.
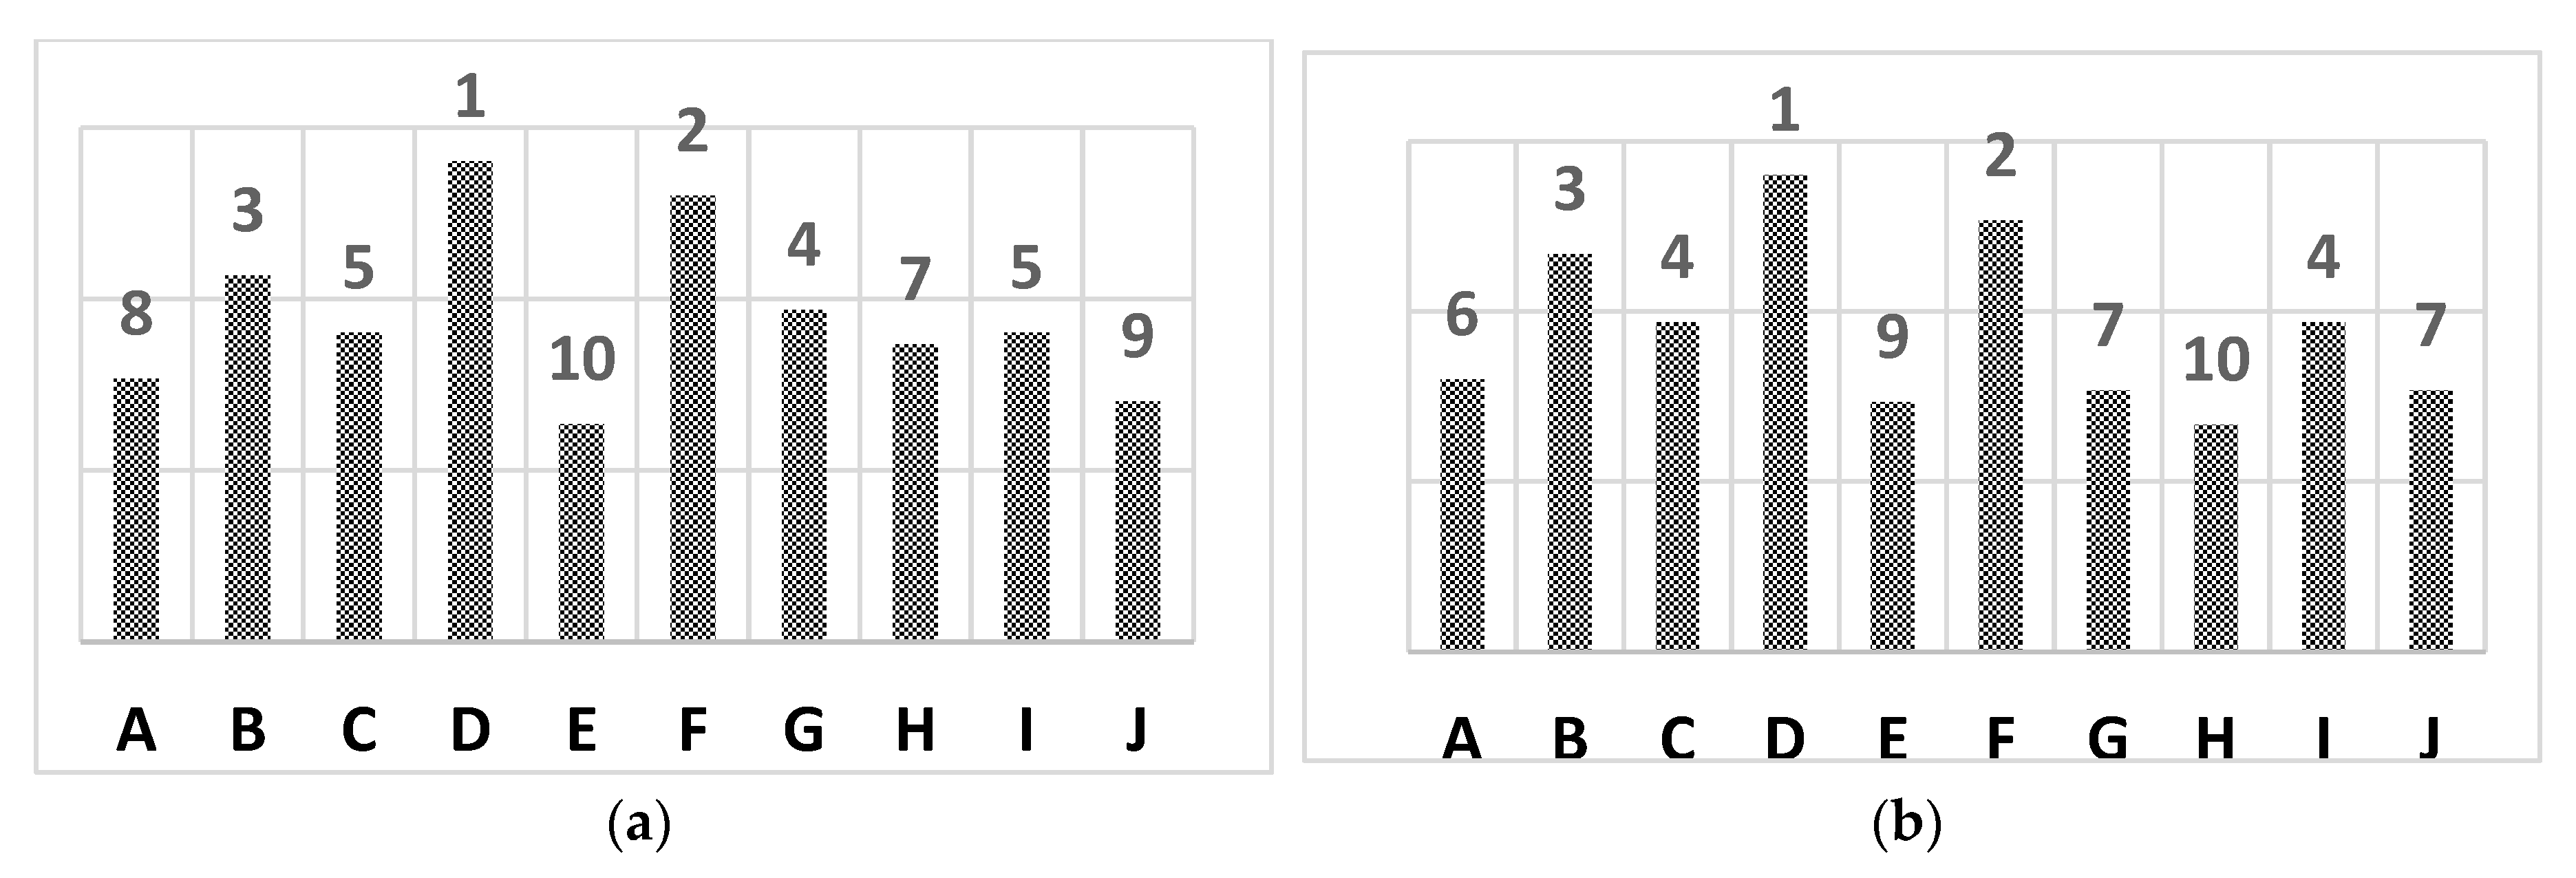
Figure 9.
Average ranking of options for non-recycling scenario (a) Central Region (b) Eastern region.
Figure 9.
Average ranking of options for non-recycling scenario (a) Central Region (b) Eastern region.
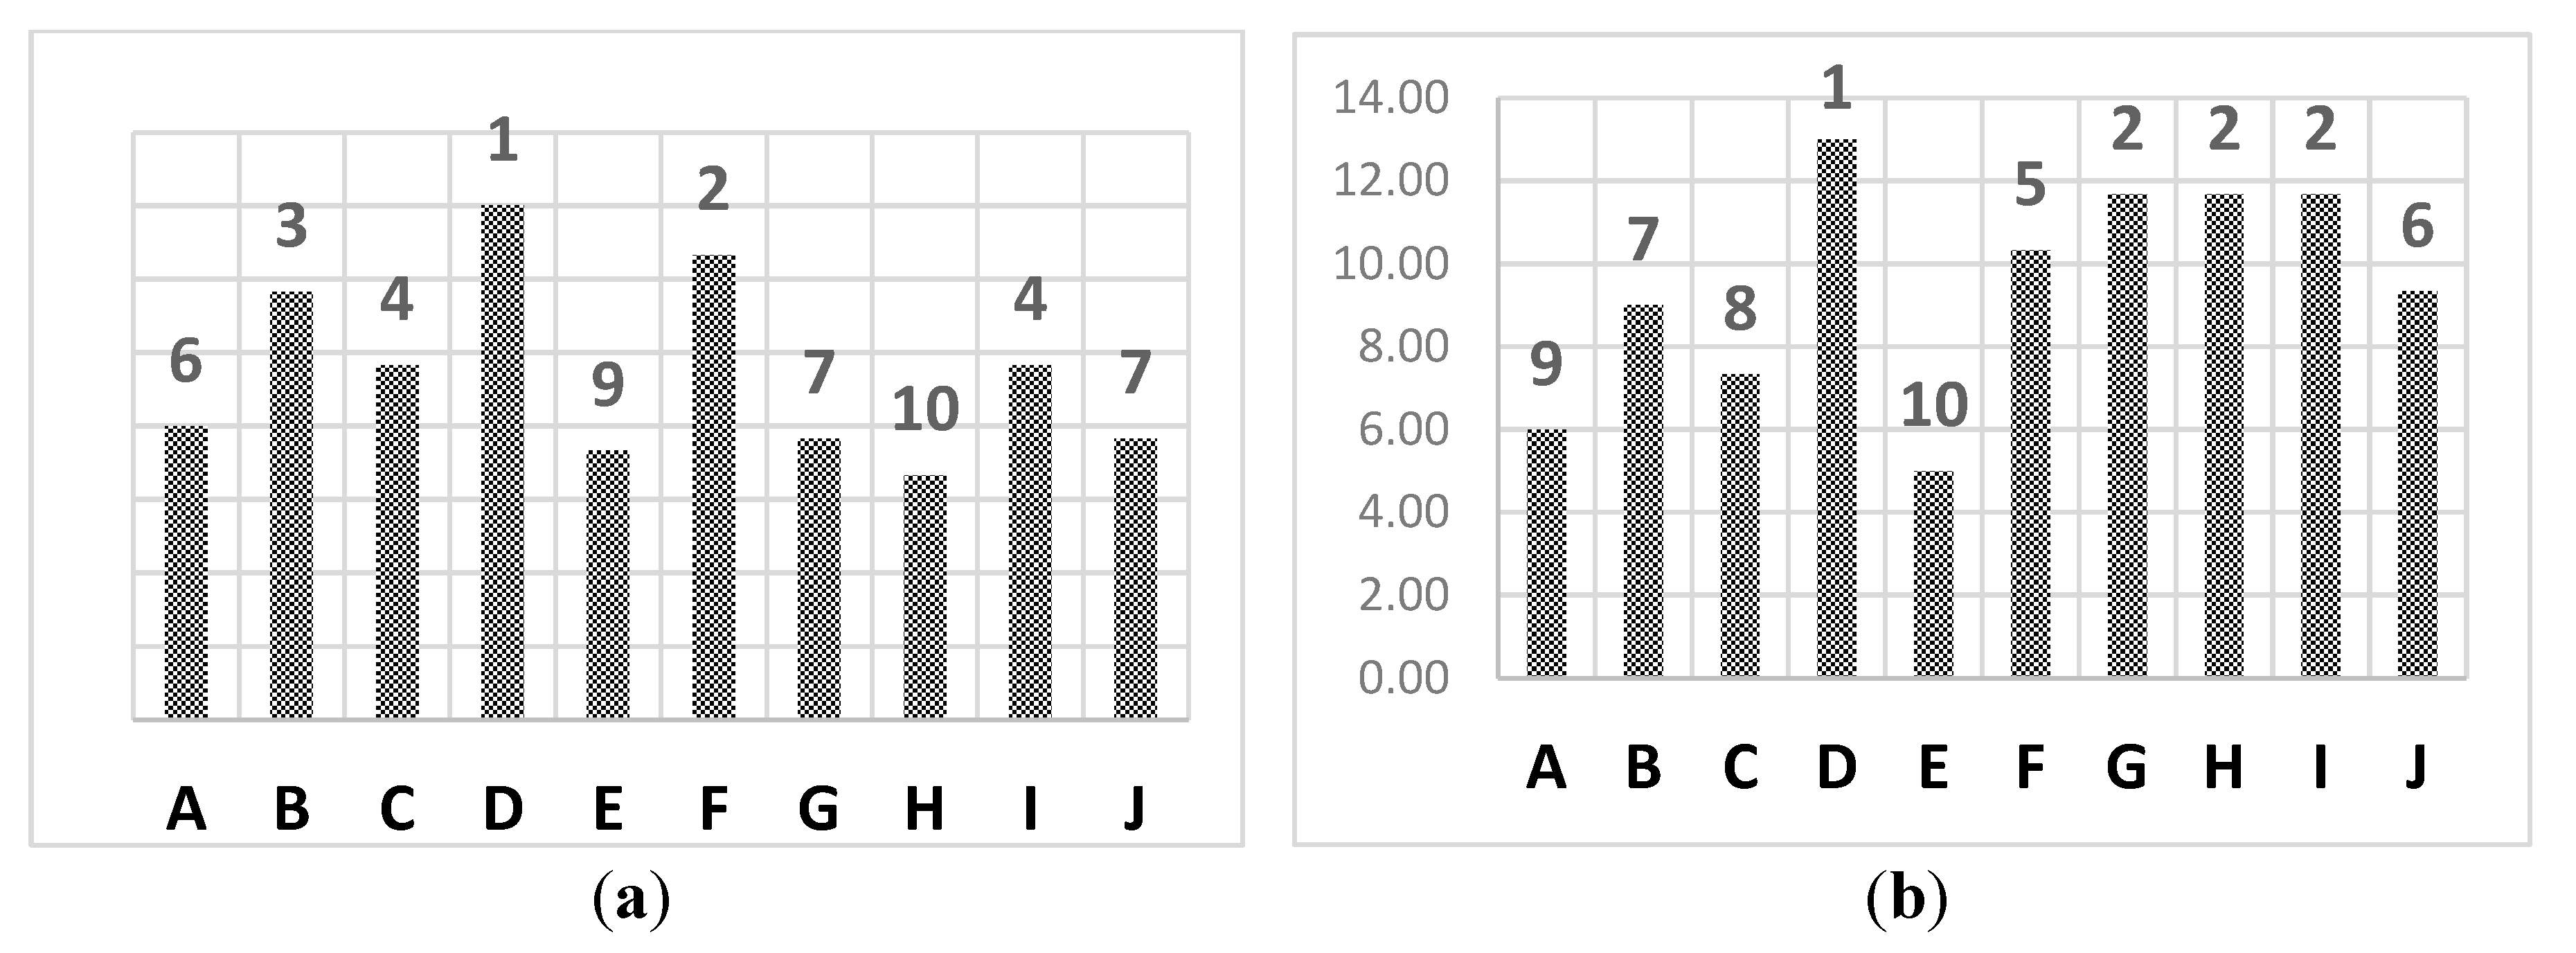
Table 1.
Components of the MSW produced in the two regions of Saudi Arabia.
| Central region | Eastern region | ||||||
|---|---|---|---|---|---|---|---|
| Components | LHV kJ/kg |
LHV kWh/kg |
% | LHV per Kg |
% | LHV per Kg |
Contents of the Components |
| Paper | 13484 | 3.75 | 28.5 | 1.03 | 16.03 | 0.60 | Wasted Papers, cardboard, box board, bags, magazines, tissue, newspapers, tissues |
| Plastic | 35000 | 9.72 | 5.2 | 0.60 | 5.8 | 0.56 | Disposable glass, spoons, plates, wrapping films, wrapping film, plastic bottle, polythene |
| Glass | 0 | 0.00 | 4.6 | 0.00 | 6.86 | 0.00 | Bottles, glassware, bulbs, ceramics etc. |
| Wood | 16979.8 | 4.72 | 8 | 0.38 | 9.63 | 0.45 | Bottles, glassware, bulbs, ceramics etc. |
| Textiles | 18840.6 | 5.23 | 6.4 | 0.39 | 5.77 | 0.30 | Cloths, diapers, etc. |
| Organics | 5582.4 | 1.55 | 37 | 0.56 | 37 | 0.57 | Food stuff, fruits and vegetable refuse, peel etc. |
| Others | 12095.2 | 3.36 | 10.3 | 0.35 | 18.91 | 0.64 | Leathers, rubber, fibers, rubber, yard waste, soils, tire, appliances, electronics |
| Total Energy content (kWh/kg) | 3.31 | 3.13 | |||||
| Total Energy content after recycling(kWh/kg) | 1.297 | 1.66 | |||||
Table 2.
The quantity of end product produced by different options for 2030 MSW generation.
| Options→ | A | B | C | D | E | F | G | H | I | J |
|---|---|---|---|---|---|---|---|---|---|---|
| Output→ | Energy GWh | Water m3 | Water m3 | Cooling kW | Cooling kW | Energy GWh | Water m3 | Water m3 | Cooling kW | Cooling kW |
| Central region | 16 | 1452024 | 726012 | 292 | 146 | 21 | 1936033 | 968017 | 389 | 122 |
| Eastern region | 9 | 849557 | 424778 | 171 | 85 | 12 | 1132743 | 566372 | 228 | 114 |
Table 6.
Normalized Decision matrix for MSW incineration and utilization technologies.
| Evaluation Criterion (j) ↓ | Alternative MSW Incineration and Utilization Technologies (I) | ||||||||
|---|---|---|---|---|---|---|---|---|---|
| A | B | C | D | E | G | H | I | J | |
| C1 | 0.4339 | 0.2169 | 0.4339 | 0.1085 | 0.4339 | 0.3254 | 0.2169 | 0.3254 | 0.1085 |
| C2 | 0.3682 | 0.1841 | 0.3682 | 0.0921 | 0.3682 | 0.3682 | 0.3682 | 0.3682 | 0.0921 |
| C3 | 0.4472 | 0.2981 | 0.2981 | 0.2981 | 0.2981 | 0.5963 | 0.1491 | 0.1491 | 0.1491 |
| C4 | 0.3235 | 0.1078 | 0.4313 | 0.4313 | 0.1078 | 0.3235 | 0.1078 | 0.4313 | 0.1078 |
| C5 | 0.4743 | 0.4743 | 0.4743 | 0.3162 | 0.3162 | 0.1581 | 0.1581 | 0.1581 | 0.1581 |
| C6 | 0.2649 | 0.3974 | 0.3974 | 0.3974 | 0.3974 | 0.1325 | 0.2649 | 0.2649 | 0.2649 |
| C7 | 0.4243 | 0.4243 | 0.4243 | 0.4243 | 0.4243 | 0.1414 | 0.1414 | 0.1414 | 0.1414 |
| C8 | 0.2481 | 0.2481 | 0.2481 | 0.2481 | 0.2481 | 0.3721 | 0.3721 | 0.3721 | 0.3721 |
| C9 | 0.3721 | 0.3721 | 0.3721 | 0.3721 | 0.3721 | 0.2481 | 0.2481 | 0.2481 | 0.2481 |
| C10 | 0.2481 | 0.2481 | 0.2481 | 0.2481 | 0.2481 | 0.3721 | 0.3721 | 0.3721 | 0.3721 |
| C11 | 0.1227 | 0.4308 | 0.2154 | 0.3040 | 0.1520 | 0.1596 | 0.5731 | 0.2866 | 0.4013 |
| C12 | 0.4467 | 0.4467 | 0.4467 | 0.4467 | 0.4467 | 0.0213 | 0.0213 | 0.0213 | 0.0213 |
| C13 | 0.3097 | 0.3097 | 0.3097 | 0.3097 | 0.3097 | 0.3226 | 0.3226 | 0.3226 | 0.3226 |
| C14 | 0.4152 | 0.4152 | 0.4152 | 0.4152 | 0.4152 | 0.1661 | 0.1661 | 0.1661 | 0.1661 |
| C15 | 0.4000 | 0.4000 | 0.4000 | 0.4000 | 0.4000 | 0.2000 | 0.2000 | 0.2000 | 0.2000 |
| C16 | 0.3586 | 0.3586 | 0.3586 | 0.4781 | 0.4781 | 0.1195 | 0.1195 | 0.1195 | 0.2390 |
| C17 | 0.3324 | 0.3324 | 0.3324 | 0.3324 | 0.3324 | 0.2992 | 0.2992 | 0.2992 | 0.2992 |
| C18 | 0.3162 | 0.3162 | 0.3162 | 0.3162 | 0.3162 | 0.3162 | 0.3162 | 0.3162 | 0.3162 |
| C19 | 0.2000 | 0.2000 | 0.2000 | 0.2000 | 0.2000 | 0.4000 | 0.4000 | 0.4000 | 0.4000 |
| C20 | 0.2697 | 0.3034 | 0.3034 | 0.3203 | 0.3034 | 0.2866 | 0.3371 | 0.3371 | 0.3540 |
Table 9.
Values of performance assessment factors for recycling scenario for Eastern region.
| Option → | A | B | C | D | E | F | G | H | I | J |
|---|---|---|---|---|---|---|---|---|---|---|
| Meeting Fuel supply requirement | ||||||||||
| Heating value requirement ranking (min) | 4 | 2 | 4 | 1 | 4 | 3 | 2 | 3 | 1 | 3 |
| Fuel drying requirement, % (max) | 4 | 2 | 4 | 1 | 4 | 4 | 4 | 4 | 1 | 4 |
| Fuel handling requirement (max) | 2 | 2 | 2 | 2 | 2 | 2 | 2 | 2 | 2 | 2 |
| Storage problems ranking (max) | 3 | 1 | 4 | 4 | 1 | 3 | 1 | 4 | 1 | 4 |
| Incinerator performance | ||||||||||
| Capacity flexibility ranking (min) |
3 | 3 | 3 | 2 | 2 | 1 | 1 | 1 | 1 | 1 |
| Conversion efficiency ranking (max) | 2 | 3 | 3 | 3 | 3 | 1 | 2 | 2 | 2 | 2 |
| Co-firing adaptability ranking (min) | 3 | 3 | 3 | 3 | 3 | 1 | 1 | 1 | 1 | 1 |
| Operation and Maintenance requirement ranking (min) | 2 | 2 | 2 | 2 | 2 | 3 | 3 | 3 | 3 | 3 |
| End Use Performance | ||||||||||
| Energy efficiency ranking (min) | 4 | 4 | 4 | 4 | 4 | 3 | 3 | 3 | 3 | 3 |
| Exergy Efficiency ranking (min) | 3 | 3 | 3 | 3 | 3 | 4 | 4 | 4 | 4 | 4 |
| % of existing usage (max) | 3.22 | 11.33 | 5.66 | 8 | 4 | 4.2 | 15.08 | 7.54 | 10.56 | 5.28 |
| Emission factors | ||||||||||
| Bottom Ash/Fly ash ratio (max) | 90/10 | 90/10 | 90/10 | 90/10 | 90/10 | 30/70 | 30/70 | 30/70 | 30/70 | 30/70 |
| emissions (CO2) kg/kg (min) | 480 | 480 | 480 | 480 | 480 | 500 | 500 | 500 | 500 | 500 |
| emissions (CO) mg/m3 (min) | 20 | 20 | 20 | 20 | 20 | 8 | 8 | 8 | 8 | 8 |
| NOX formation mg/m3 (min) | 4.8 | 4.8 | 4.8 | 4.8 | 4.8 | 2.4 | 2.4 | 2.4 | 2.4 | 2.4 |
| Leachates problems ranking (min) |
3 | 3 | 3 | 4 | 4 | 1 | 1 | 1 | 2 | 2 |
| Economic factors | ||||||||||
| Investment cost of incinerator USD per ton (min) |
83.4 | 83.4 | 83.4 | 83.4 | 83.4 | 75.06 | 75.06 | 75.06 | 75.06 | 75.06 |
| Waste Collection cost USD per ton (min) |
14.02 | 14.02 | 14.02 | 14.02 | 14.02 | 14.02 | 14.02 | 14.02 | 14.02 | 14.02 |
| Fuel preparation cost (USD per ton) (min) |
7.92 | 7.92 | 7.92 | 7.92 | 7.92 | 15.87 | 15.87 | 15.87 | 15.87 | 15.87 |
| Levelized cost of Energy (USD)(min) | 0.14 | 0.15 | 0.15 | 0.16 | 0.15 | 0.13 | 0.14 | 0.14 | 0.15 | 0.14 |
Relative ranking indicators 1-Very high, 2-high. 3-average, 4-low. In column 1, (min) indicates minimization and (max) indicates maximization.
Table 10.
Values of performance assessment factors for recycling scenario for Eastern region.
| Option → | A | B | C | D | E | F | G | H | I | J |
|---|---|---|---|---|---|---|---|---|---|---|
| Meeting Fuel supply requirement | ||||||||||
| Heating value requirement ranking (min) | 4 | 2 | 4 | 1 | 4 | 3 | 2 | 3 | 1 | 3 |
| Fuel drying requirement, % (max) | 4 | 2 | 4 | 1 | 4 | 4 | 4 | 4 | 1 | 4 |
| Fuel handling requirement (max) | 2 | 2 | 2 | 2 | 2 | 2 | 2 | 2 | 2 | 2 |
| Storage problems ranking (max) | 3 | 1 | 4 | 4 | 1 | 3 | 1 | 4 | 1 | 4 |
| Incinerator performance | ||||||||||
| Capacity flexibility ranking (min) |
3 | 3 | 3 | 2 | 2 | 1 | 1 | 1 | 1 | 1 |
| Conversion efficiency ranking (max) | 2 | 3 | 3 | 3 | 3 | 1 | 2 | 2 | 2 | 2 |
| Co-firing adaptability ranking (min) | 3 | 3 | 3 | 3 | 3 | 1 | 1 | 1 | 1 | 1 |
| Operation and Maintenance requirement ranking (min) | 2 | 2 | 2 | 2 | 2 | 3 | 3 | 3 | 3 | 3 |
| End Use Performance | ||||||||||
| Energy efficiency ranking (min) | 4 | 4 | 4 | 4 | 4 | 3 | 3 | 3 | 3 | 3 |
| Exergy Efficiency ranking (min) | 3 | 3 | 3 | 3 | 3 | 4 | 4 | 4 | 4 | 4 |
| % of existing usage (max) | 3.07 | 10.77 | 5.38 | 7.60 | 3.80 | 3.99 | 14.33 | 7.16 | 10.03 | 5.02 |
| Emission factors | ||||||||||
| Bottom Ash/Fly ash ratio (max) |
90/10 | 90/10 | 90/10 | 90/10 | 90/10 | 30/70 | 30/70 | 30/70 | 30/70 | 30/70 |
| emissions (CO2) kg/kg (min) |
456 | 456 | 456 | 456 | 456 | 475 | 475 | 475 | 475 | 475 |
| emissions (CO) mg/m3 (min) | 19 | 19 | 19 | 19 | 19 | 7.6 | 7.6 | 7.6 | 7.6 | 7.6 |
| NOX formation mg/m3 (min) | 4.6 | 4.6 | 4.6 | 4.6 | 4.6 | 2.3 | 2.3 | 2.3 | 2.3 | 2.3 |
| Leachates problems ranking (min) |
3 | 3 | 3 | 4 | 4 | 1 | 1 | 1 | 2 | 2 |
| Economic factors | ||||||||||
| Investment cost of incinerator USD per ton (min) |
79.2 | 79.2 | 79.2 | 79.2 | 79.2 | 71.3 | 71.3 | 71.3 | 71.3 | 71.3 |
| Waste Collection cost USD per ton (min) |
13.32 | 13.32 | 13.32 | 13.32 | 13.32 | 13.32 | 13.32 | 13.32 | 13.32 | 13.32 |
| Fuel preparation cost (USD per ton) (min) |
7.5 | 7.5 | 7.5 | 7.5 | 7.5 | 15.1 | 15.1 | 15.1 | 15.1 | 15.1 |
| Levelized cost of Energy (USD)(min) | 0.13 | 0.14 | 0.14 | 0.15 | 0.14 | 0.12 | 0.13 | 0.13 | 0.14 | 0.13 |
Relative ranking indicators 1-Very high, 2-high. 3-average, 4-low. In column 1, (min) indicates minimization and (max) indicates maximization.
Table 11.
Best V+ and worst V- solution for MSW incineration and utilization technology using corresponding Ej entropy weight values.
Table 11.
Best V+ and worst V- solution for MSW incineration and utilization technology using corresponding Ej entropy weight values.
| Evaluation Criterion (j) ↓ | V+ | MSW Incineration and Utilization Technology | V- | MSW Incineration and Utilization Technology |
|---|---|---|---|---|
| C1 | 0.0023 | D/I | 0.0093 | A/C/E |
| C2 | 0.0040 | I | 0.0159 | A/C/E/F/G/H/J |
| C3 | 0.0119 | F | 0.0030 | G/H/I/J |
| C4 | 0.0168 | C/D/H/J | 0.0042 | B/G/I |
| C5 | 0.0058 | FGHIJ | 0.0173 | AB |
| C6 | 0.0080 | BCD | 0.0027 | F |
| C7 | 0.0067 | FGHIJ | 0.0202 | ABCDE |
| C8 | 0.0118 | ABCDE | 0.0177 | FGHIJ |
| C9 | 0.0118 | FGHIJ | 0.0177 | ABCDE |
| C10 | 0.0118 | ABCDE | 0.0177 | FGHIJ |
| C11 | 0.0063 | G | 0.0013 | A |
| C12 | 0.0212 | ABCDE | 0.0010 | FGHIJ |
| C13 | 0.0147 | ABCDE | 0.0153 | FGHIJ |
| C14 | 0.0079 | FGHIJ | 0.0197 | ABCDE |
| C15 | 0.0095 | FGHIJ | 0.0190 | ABCDE |
| C16 | 0.0026 | FGH | 0.0103 | DE |
| C17 | 0.0142 | FGHIJ | 0.0158 | ABCDE |
| C18 | 0.0150 | ABCDEFGHIJ | 0.0150 | ABCDEFGHIJ |
| C19 | 0.0095 | ABCDE | 0.0190 | FGHIJ |
| C20 | 0.0714 | A | 0.0938 | I |
Table 12.
MSW incineration and utilization technologies distance from the best ideal and worst and their ranks using various weighting scenario.
Table 12.
MSW incineration and utilization technologies distance from the best ideal and worst and their ranks using various weighting scenario.
| Central Region (Not Recycled) | Central Region (Not Recycled) | |||||||||
|---|---|---|---|---|---|---|---|---|---|---|
| MSW Incineration and Utilization Technologies (i) ↓ | Scenario 1: Entropy Weights | |||||||||
| Di+ (Distance from the Best Ideal) | Di- (Distance from the Worst Ideal) | Di- /(Di++ Di-) | Rank Ci | |||||||
| A | 0.0293 | 0.0262 | 0.4725 | 5 | ||||||
| B | 0.0301 | 0.0298 | 0.4976 | 4 | ||||||
| C | 0.0305 | 0.0308 | 0.5028 | 3 | ||||||
| D | 0.0276 | 0.0327 | 0.5422 | 1 | ||||||
| E | 0.0321 | 0.0286 | 0.4716 | 6 | ||||||
| F | 0.0286 | 0.0334 | 0.5386 | 2 | ||||||
| G | 0.0358 | 0.0267 | 0.4275 | 10 | ||||||
| H | 0.0339 | 0.0289 | 0.4603 | 7 | ||||||
| I | 0.0364 | 0.0286 | 0.4399 | 9 | ||||||
| J | 0.0341 | 0.0283 | 0.4534 | 8 | ||||||
| MSW incineration and utilization technologies (i) ↓ | Scenario 1: Experts Weights | |||||||||
| Di+ (distance from the best ideal) | Di- (distance from the worst ideal) | Di- /(Di++ Di-) | Rank Ci | |||||||
| A | 0.0410 | 0.0342 | 0.4547 | 8 | ||||||
| B | 0.0365 | 0.0371 | 0.5044 | 4 | ||||||
| C | 0.0402 | 0.0356 | 0.4696 | 7 | ||||||
| D | 0.0365 | 0.0402 | 0.5239 | 1 | ||||||
| E | 0.0449 | 0.0326 | 0.4210 | 10 | ||||||
| F | 0.0388 | 0.0406 | 0.5109 | 2 | ||||||
| G | 0.0398 | 0.0405 | 0.5047 | 3 | ||||||
| H | 0.0401 | 0.0382 | 0.4879 | 6 | ||||||
| I | 0.0393 | 0.0375 | 0.4883 | 5 | ||||||
| J | 0.0419 | 0.0341 | 0.4488 | 9 | ||||||
| MSW incineration and utilization technologies (i) ↓ | Scenario 1: Equal weights to all | |||||||||
| Di+ (distance from the best ideal) | Di- (distance from the worst ideal) | Di- /(Di++ Di-) | Rank Ci | |||||||
| A | 0.0445 | 0.0324 | 0.4211 | 9 | ||||||
| B | 0.0384 | 0.0366 | 0.4881 | 5 | ||||||
| C | 0.0435 | 0.0344 | 0.4420 | 8 | ||||||
| D | 0.0359 | 0.0415 | 0.5363 | 1 | ||||||
| E | 0.0476 | 0.0305 | 0.3907 | 10 | ||||||
| F | 0.0396 | 0.0416 | 0.5119 | 2 | ||||||
| G | 0.0408 | 0.0417 | 0.5052 | 3 | ||||||
| H | 0.0412 | 0.0383 | 0.4820 | 6 | ||||||
| I | 0.0395 | 0.0398 | 0.5016 | 4 | ||||||
| J | 0.0433 | 0.0352 | 0.4485 | 7 | ||||||
| Eastern Region (Not Recycled) | Eastern Region (Not Recycled) | |||||||||
| MSW incineration and utilization technologies (i) ↓ | Scenario 2: Entropy weights | |||||||||
| Di+ (distance from the best ideal) | Di- (distance from the worst ideal) | Di- /(Di++ Di-) | Rank Ci | |||||||
| A | 0.0289 | 0.0262 | 0.4748 | 6 | ||||||
| B | 0.0303 | 0.0296 | 0.4942 | 4 | ||||||
| C | 0.0306 | 0.0308 | 0.5020 | 3 | ||||||
| D | 0.0272 | 0.0327 | 0.5456 | 1 | ||||||
| E | 0.0313 | 0.0287 | 0.4782 | 5 | ||||||
| F | 0.0296 | 0.0310 | 0.5115 | 2 | ||||||
| G | 0.0361 | 0.0257 | 0.4159 | 10 | ||||||
| H | 0.0341 | 0.0281 | 0.4520 | 8 | ||||||
| I | 0.0367 | 0.0282 | 0.4346 | 9 | ||||||
| J | 0.0340 | 0.0283 | 0.4541 | 7 | ||||||
| MSW incineration and utilization technologies (i) ↓ | Scenario 2: Experts Weights | |||||||||
| Di+ (distance from the best ideal) | Di- (distance from the worst ideal) | Di- /(Di++ Di-) | Rank Ci | |||||||
| A | 0.0388 | 0.0336 | 0.4641 | 6 | ||||||
| B | 0.0350 | 0.0364 | 0.5100 | 2 | ||||||
| C | 0.0392 | 0.0347 | 0.4692 | 5 | ||||||
| D | 0.0311 | 0.0404 | 0.5649 | 1 | ||||||
| E | 0.0395 | 0.0328 | 0.4536 | 8 | ||||||
| F | 0.0388 | 0.0357 | 0.4789 | 3 | ||||||
| G | 0.0400 | 0.0346 | 0.4636 | 7 | ||||||
| H | 0.0404 | 0.0316 | 0.4389 | 10 | ||||||
| I | 0.0388 | 0.0351 | 0.4747 | 4 | ||||||
| J | 0.0407 | 0.0322 | 0.4412 | 9 | ||||||
| MSW incineration and utilization technologies (i) ↓ | Scenario 2: Equal weights to all | |||||||||
| Di+ (distance from the best ideal) | Di- (distance from the worst ideal) | Di- /(Di++ Di-) | Rank Ci | |||||||
| A | 0.0436 | 0.0320 | 0.4230 | 9 | ||||||
| B | 0.0387 | 0.0360 | 0.4821 | 4 | ||||||
| C | 0.0441 | 0.0334 | 0.4313 | 8 | ||||||
| D | 0.0335 | 0.0417 | 0.5542 | 1 | ||||||
| E | 0.0444 | 0.0306 | 0.4077 | 10 | ||||||
| F | 0.0395 | 0.0395 | 0.5002 | 2 | ||||||
| G | 0.0410 | 0.0382 | 0.4820 | 5 | ||||||
| H | 0.0416 | 0.0343 | 0.4520 | 7 | ||||||
| I | 0.0392 | 0.0388 | 0.4972 | 3 | ||||||
| J | 0.0421 | 0.0350 | 0.4545 | 6 | ||||||
| Central Region (Recycled) | Central Region (Recycled) | |||||||||
| MSW incineration and utilization technologies (i) ↓ | Scenario 3: Entropy weights | |||||||||
| Di+ (distance from the best ideal) | Di- (distance from the worst ideal) | Di- /(Di++ Di-) | Rank Ci | |||||||
| A | 0.0287 | 0.0246 | 0.4618 | 9 | ||||||
| B | 0.0293 | 0.0261 | 0.4710 | 8 | ||||||
| C | 0.0297 | 0.0273 | 0.4782 | 7 | ||||||
| D | 0.0280 | 0.0304 | 0.5200 | 3 | ||||||
| E | 0.0313 | 0.0248 | 0.4425 | 10 | ||||||
| F | 0.0273 | 0.0308 | 0.5296 | 1 | ||||||
| G | 0.0293 | 0.0277 | 0.4866 | 6 | ||||||
| H | 0.0270 | 0.0297 | 0.5240 | 2 | ||||||
| I | 0.0286 | 0.0282 | 0.4961 | 5 | ||||||
| J | 0.0273 | 0.0292 | 0.5170 | 4 | ||||||
| MSW incineration and utilization technologies (i) ↓ | Scenario 3: Experts Weights | |||||||||
| Di+ (distance from the best ideal) | Di- (distance from the worst ideal) | Di- /(Di++ Di-) | Rank Ci | |||||||
| A | 0.0404 | 0.0316 | 0.4392 | 9 | ||||||
| B | 0.0341 | 0.0363 | 0.5156 | 5 | ||||||
| C | 0.0381 | 0.0348 | 0.4771 | 8 | ||||||
| D | 0.0343 | 0.0395 | 0.5357 | 2 | ||||||
| E | 0.0430 | 0.0317 | 0.4246 | 10 | ||||||
| F | 0.0387 | 0.0358 | 0.4809 | 6 | ||||||
| G | 0.0347 | 0.0405 | 0.5381 | 1 | ||||||
| H | 0.0351 | 0.0381 | 0.5207 | 4 | ||||||
| I | 0.0341 | 0.0373 | 0.5227 | 3 | ||||||
| J | 0.0371 | 0.0340 | 0.4781 | 7 | ||||||
| MSW incineration and utilization technologies (i) ↓ | Scenario 3: Equal weights to all | |||||||||
| Di+ (distance from the best ideal) | Di- (distance from the worst ideal) | Di- /(Di++ Di-) | Rank Ci | |||||||
| A | 0.0437 | 0.0284 | 0.3941 | 9 | ||||||
| B | 0.0352 | 0.0356 | 0.5025 | 5 | ||||||
| C | 0.0406 | 0.0333 | 0.4502 | 8 | ||||||
| D | 0.0325 | 0.0406 | 0.5558 | 1 | ||||||
| E | 0.0450 | 0.0292 | 0.3935 | 10 | ||||||
| F | 0.0394 | 0.0348 | 0.4688 | 7 | ||||||
| G | 0.0337 | 0.0415 | 0.5517 | 3 | ||||||
| H | 0.0342 | 0.0382 | 0.5273 | 4 | ||||||
| I | 0.0321 | 0.0396 | 0.5520 | 2 | ||||||
| J | 0.0367 | 0.0350 | 0.4881 | 6 | ||||||
| Eastern Region (Recycled) | Eastern Region (Recycled) | |||||||||
| MSW incineration and utilization technologies (i) ↓ | Scenario 4: Entropy weights | |||||||||
| Di+ (distance from the best ideal) | Di- (distance from the worst ideal) | Di- /(Di++ Di-) | Rank Ci | |||||||
| A | 0.0288 | 0.0247 | 0.4614 | 9 | ||||||
| B | 0.0297 | 0.0263 | 0.4696 | 8 | ||||||
| C | 0.0301 | 0.0274 | 0.4767 | 7 | ||||||
| D | 0.0288 | 0.0305 | 0.5144 | 4 | ||||||
| E | 0.0316 | 0.0250 | 0.4415 | 10 | ||||||
| F | 0.0274 | 0.0314 | 0.5342 | 1 | ||||||
| G | 0.0294 | 0.0281 | 0.4886 | 6 | ||||||
| H | 0.0272 | 0.0301 | 0.5254 | 2 | ||||||
| I | 0.0290 | 0.0283 | 0.4941 | 5 | ||||||
| J | 0.0274 | 0.0295 | 0.5185 | 3 | ||||||
| MSW incineration and utilization technologies (i) ↓ | Scenario 4: Experts Weights | |||||||||
| Di+ (distance from the best ideal) | Di- (distance from the worst ideal) | Di- /(Di++ Di-) | Rank Ci | |||||||
| A | 0.0404 | 0.0317 | 0.4394 | 9 | ||||||
| B | 0.0342 | 0.0364 | 0.5156 | 5 | ||||||
| C | 0.0382 | 0.0348 | 0.4772 | 8 | ||||||
| D | 0.0343 | 0.0395 | 0.5356 | 2 | ||||||
| E | 0.0430 | 0.0318 | 0.4247 | 10 | ||||||
| F | 0.0387 | 0.0358 | 0.4809 | 6 | ||||||
| G | 0.0348 | 0.0405 | 0.5379 | 1 | ||||||
| H | 0.0351 | 0.0381 | 0.5206 | 4 | ||||||
| I | 0.0341 | 0.0373 | 0.5224 | 3 | ||||||
| J | 0.0372 | 0.0340 | 0.4780 | 7 | ||||||
| MSW incineration and utilization technologies (i) ↓ | Scenario 4: Equal weights to all | |||||||||
| Di+ (distance from the best ideal) | Di- (distance from the worst ideal) | Di- /(Di++ Di-) | Rank Ci | |||||||
| A | 0.0437 | 0.0284 | 0.3943 | 9 | ||||||
| B | 0.0352 | 0.0356 | 0.5026 | 5 | ||||||
| C | 0.0406 | 0.0333 | 0.4503 | 8 | ||||||
| D | 0.0325 | 0.0406 | 0.5556 | 1 | ||||||
| E | 0.0450 | 0.0292 | 0.3936 | 10 | ||||||
| F | 0.0394 | 0.0348 | 0.4689 | 7 | ||||||
| G | 0.0338 | 0.0415 | 0.5515 | 3 | ||||||
| H | 0.0342 | 0.0382 | 0.5271 | 4 | ||||||
| I | 0.0321 | 0.0396 | 0.5517 | 2 | ||||||
| J | 0.0367 | 0.0350 | 0.4881 | 6 | ||||||
Disclaimer/Publisher’s Note: The statements, opinions and data contained in all publications are solely those of the individual author(s) and contributor(s) and not of MDPI and/or the editor(s). MDPI and/or the editor(s) disclaim responsibility for any injury to people or property resulting from any ideas, methods, instructions or products referred to in the content. |
© 2023 by the authors. Licensee MDPI, Basel, Switzerland. This article is an open access article distributed under the terms and conditions of the Creative Commons Attribution (CC BY) license (http://creativecommons.org/licenses/by/4.0/).
Copyright: This open access article is published under a Creative Commons CC BY 4.0 license, which permit the free download, distribution, and reuse, provided that the author and preprint are cited in any reuse.


