
Submitted:
24 May 2023
Posted:
25 May 2023
You are already at the latest version
Abstract
Multicriteria decision aid requires a database as a decision matrix, in which two or more alternatives are evaluated according to two or more variables selected as decision criteria. Several problems of this nature use measures by Likert scales. Depending on the method, parameters from these data (e.g. means, modes or medians) are required for calculations. This parameterization of data in ordinal scales has fueled controversy for decades between authors who favor mathematical/statistical rigor and argue against the procedure, stating that ordinal scales should not be parameterized, and scientists from other areas who have shown gains from the process that compensate for this relaxation. The aim of this article is to demonstrate the advantages of the Composition of Probabilistic Preferences (CPP) method in multicriteria problems with data from Likert scales. The CPP is capable of allaying the protests raised and obtaining more accurate results than descriptive statistics or parametric models can bring. The proposed algorithm in R-code involves the use of CPP with empirical distributions and fitting histograms of data measured by Likert scales. Two case studies with simulated datasets having peculiar characteristics and a real case illustrate the advantages of the CPP.
Keywords:
Probabilistic Preferences
; CPP
; Likert Scales
; Empirical Distributions.
1. Introduction
In multicriteria decision aid problems, it is necessary to compose a decision matrix, in which two or more alternatives are evaluated according to two or more variables selected as decision criteria [1]. To solve the problem, those variables must be measured on some scale, so that a calculation algorithm can generate results and reach the objective of the research.
The scientific literature contains several studies on multicriteria decision aid problems, in which these variables are measured by psychometric scales, also called Likert scales, in reference to that author's research [2]. However, Likert assigned numerical values to a scale of five respondent perceptions (from “totally agree” to “totally disagree”) and considered the questionnaire responses through normal distributions, resorting to the use of means and standard deviation, for example, to draw conclusions.
From a statistical point of view, the use of parametric models (like the normal distribution, which depends on the mean and standard deviation of the data) with variables measured in ordinal scales is an error [3,4,5,6]. This common practice in scientific studies was even described as the first mathematical “sin” on a list of seven [7].
In general, the main criticism is the lack of mathematical/statistical rigor in relation to the measurement of variables on an ordinal scale. In this case, it is inappropriate to calculate averages, standard deviations, and other measures of central tendency to draw conclusions that have little or no meaning in the real world. For example, if a certain surgical procedure is rated on a four-point psychometric scale (e.g., poor, fair, good or excellent), it would not make sense to average the responses to the procedure, yielding a "fair and medium" result [7].
However, there are several authors who defend the use of descriptive statistics and parametric models in structured problems with Likert scales. Some argue that the use of scales with more than five points can better approximate the results to a normal distribution [8,9], or favor parametric models over nonparametric ones [10]. Other authors have mentioned the amount of research that “violates” the principles of statistics and obtained satisfactory results [11], the constraints on the use of parametric models with Likert scales [12], or the context in which such restrictions were proposed for the use of these scales [13], criticizing relaxation of mathematical rigor to the detriment of practical benefits.
The parameterization of data measured on ordinal scales has fueled controversy for decades between authors who favor mathematical/statistical rigor and argue against the procedure, considering that ordinal scales should not be parameterized, and academics from other areas who have reported gains in their studies that compensate for the relaxation of this rigor. We selected some studies defending the use of more flexible measures of central tendency in data generated by Likert scales and others against the relaxation of mathematical/statistical rigor in these problems to provide a better understanding of the arguments.
One of the most interesting papers on this controversy is from [13]. The author describes these discussions in the early 1900s, when physics was the model science and measurement followed mathematical principles to draw empirical conclusions about psychological data. Thomas [13] argued that psychology should treat measurement as the recording of empirical facts, which may not meet the mathematical properties of real numbers. There was then some error of interpretation, adaptation or excess of rigor in the use of the four measurement scales (nominal, ordinal, interval and ratio), proposed by Stevens [14], according to Table 1.
Thomas [13] pointed out that the article of Stevens [14] helped create a bridge to the use of mathematics to draw empirical conclusions about data without the properties of real numbers. However, this study was a product of its time and urged limitations on the mathematical operations for each scale, without explicitly anchoring those limitations in mathematics. Thomas [13] continued this criticism, noting that Stevens scales are flawed and encouraging the production of academic works that do not conform to the epistemology of science or the logic of mathematics.
Other authors have focused their research on finding solutions that allow the use of parameters based on Likert scales. Wu and Leung [8] tried to adapt ordinal scales as interval scales, increasing the number of points on the scale, preferably to eleven, to facilitate the adjustment of data to normal and other parametric distributions. Along the same lines, Awang et al [9] explored a parametric model of structural equations to suggest the use of ten-point Likert scales instead of the traditional five-point scales, to obtain more consistent results. Harpe [12] reviewed the literature, and based on empirical evidence, concluded that parametric analytical approaches are acceptable as long as certain criteria are met. The author also explored histogram densities, similar to the proposal of this article, but with adjustments to normal distributions instead of nonparametric ones. Mircioiu and Atkinson [15] analyzed ordinal data on Likert scales with high response rates, demonstrating that analysis using nonparametric methods causes loss of information. The addition of parametric methods, graphical analysis, subset analysis and data transformation leads to deeper analysis and better conclusions.
The authors who defend greater mathematical/statistical rigor condemn the use of models and parametric measures with data collected from Likert scales, regardless of the number of points on the scale. Pornel and Saldaña [16] discussed the characteristics and proper use of a Likert scale, examining 53 theses and dissertations in the Philippines. They identified four common misuses of the Likert scale, namely: unjustified length of the scale; asymmetrical verbal anchoring; uneven spacing in the verbal anchor; and unjustified interpretation of the mean. Jamieson [17] emphasized the common practice of assuming that the Likert scale is an interval scale, condemning the calculation of parametric measures, exemplifying the means and standard deviations, since these are typical of ordinal scales. Allen and Seaman [18] followed the same line. Sullivan and Artino [19] analyzed research in the medical field and made use of parametric tests more flexible, although they also criticized the use of means and standard deviations.
As can be seen, the subject is still controversial in the scientific literature. Thus, the purpose of this article is to illustrate the advantages of the Composition of Probabilistic Preferences (CPP) method in multicriteria decision aid problems, where the decision matrix uses evaluations measured on ordinal scales. CPP is capable of allaying the critiques described above and obtaining more precise results than descriptive statistics or parametric models can bring. There are basically three advantages of the proposed algorithm: (1) it is a nonparametric procedure, maintaining adherence to statistics with regard to the treatment of data in ordinal scales, without resorting to parameters to solve the problem (e.g., mean, deviation-default, etc.); (2) it dispenses with assigning numerical values to the Likert scale, since the frequency of responses to each item of the scale is sufficient; and (3) it explores an important property of the CPP, which probabilistically models responses to consider the uncertainty intrinsic to human opinion or judgment due to prejudices, doubts and biases, among other aspects that indicate a nondeterministic approach to the problem.
Two partial conclusions can be drawn from the studies for and against the full use of statistical tools with data measured on Likert scales: (1) the nonparametric approach of these data avoids difficulties present in parametric procedures; and (2) ranking of alternatives is consistent with the possible answers of ordinal scales, as defined by Stevens. The use of CPP fulfills these needs, since it is flexible regarding the choice of parametric or nonparametric models and can be used to define the probability of an alternative being better or worse than others, which corresponds to the empirical possibilities described in the ordinal scale of Stevens [14]. We present two cases to illustrate these characteristics numerically.
2. Materials and Methods
The proposed model is based on the CPP, originally developed by Sant’Anna and Sant’Anna [20] and later expanded by Sant’Anna [1]. This method incorporates the probabilistic nature of preference assessment into the multicriteria decision aid problem. The probabilistic characteristic can arise as a result of inaccuracies caused by subjective factors, leading decision makers to attribute different meanings to the same attributes of alternatives in different circumstances, or as a result of measurement errors that affect the evaluations of such attributes.
An initial and critical step in CPP is the transformation of the numerical vector, containing the evaluations of the various alternatives according to each criterion, into a vector containing preference probabilities. This transformation of exact values into probabilities is illustrated in the upper portion of Figure 1, where a triangular distribution emulates the preferences of an expert. The exact value that corresponds to an expert's assessment becomes the mode of a distribution of preferences, which varies between the extremes of the assessments by the criterion. In this example, the exact value “2” attributed to Alternative A and the range from “1” to “5” of Criterion 1 are converted into the triangular distribution of parameters (1,2,5), which indicate the minimum value “1”, the mode “2” and the maximum value “5”.
The new approach, in the lower portion of Figure 1, proposes a nonparametric procedure for this first stage of the CPP, for cases in which the respondents' original assessments are based on a Likert scale. Thus, instead of considering each respondent's preference for conversion into a parametric distribution, the histogram of the dataset is transformed into a nonparametric distribution. This conversion of the histogram into a nonparametric distribution is found in the literature [21,22,23,24], but its adaptation to the CPP is unprecedented.
This approach values CPP. The choice of nonparametric PDF avoids the aforementioned controversy, as it does not use descriptive statistics to extract parameters from the dataset. In addition, the new model simplifies CPP calculations in problems with a high number of respondents. For example, hundreds of evaluations of an alternative in a criterion can be generalized in a single histogram, avoiding the same number of calculations or the need to resort to a measure of central tendency to represent them.
The nonparametric distribution chosen in this approach is an empirical distribution, in which each point on the Likert scale is associated with a probability, calculated from the responses obtained from questionnaires or interviews. The R software provides several applications for fitting data to probability functions. The empirical distributions fitted here are based on the “mc2d” package [25].
The two subsequent stages of the CPP remain unchanged, and are described in detail in several published articles and books, with a wide range of applications, including sports science [26], management systems [27,28], security and defense [29], public health and social assistance [30,31], risk management [32], and bioenergy processes [33], among others. In summary, in the second stage, the joint probabilities of each alternative being superior or inferior to the others are calculated, maximizing or minimizing the preferences, respectively. In the third stage, these probabilities are aggregated according to some model, so that the order of individual or class preference is defined. These models range from the simplest, such as a weighted sum, to the most complex, such as aggregation by Choquet integrals [1].
Table 2 reports the pseudocode used to calculate the preference probabilities, referring to the second stage of the CPP, according to the proposed approach. The calculations were performed with the R software, with the code registered as open access on the Zenodo.org platform [34] (and available in the Appendix here). The third stage of the CPP was not included in the algorithm, since the examples in this article refer to the evaluation of alternatives under one criterion. This final aggregation of the third stage of the CPP requires evaluations of two or more criteria, beyond the scope of this proposal. Automation of the complete CPP procedure is available with open access in the “CPP” package [35].
The code registered on the Zenodo.org platform offers two functions: “PMax.Emp.Likert” to calculate the joint probabilities of maximizing the alternatives and “PMin.Emp.Likert” for minimizing the alternatives. Both are required for certain CPP compositions [1]. However, additional care must be taken when applying them to problems of ranking alternatives evaluated on Likert scales, related to the type of evaluation criterion. The “benefit” criteria indicate that the higher the score on the scale, the better the performance of the alternative is. In this case, evaluations with a value of “5” are more important than those with a value of “4”, and so on. On the other hand, the “cost” criteria indicate that the lower scores on the scale represent better performance of the alternative. Finally, it should be noted that the joint probabilities of maximizing and minimizing, considering three or more alternatives, are not complementary.
3. Applications
3.1. Dataset with the Same Means and Medians
We generated two datasets to illustrate the usefulness of the proposal in multicriteria decision aid problems with the alternatives measured by Likert scales. The first case contains ten alternatives, evaluated by 500 respondents, on a symmetrical five-point scale: “totally disagree”, “disagree”, “neutral”, “agree” and “totally agree”. The peculiar aspect of this case is that the responses of the ten alternatives (“A” to “J”) have the same average and the same median for any scale of values assigned to the five points, as long as they are equidistant. For example, if the five points assume values from “1” to “5”, the mean and median will be equal to “3”; if the points assume values (1, 3, 5, 7 and 9), the mean and median will be “5”. We chose this setup to demonstrate the limitation of descriptive statistics in comparison with the proposed model. Equations (1) to (10) indicate the frequencies of responses for each alternative, in which the first represents the option “totally disagree” and the last “totally agree”. For example, Alternative “A” received 50 “totally disagree”, 175 “disagree” responses and so on.
A = {50, 175, 100, 75, 100}
B = {150, 75, 75, 25, 175}
C = {100, 100, 125, 50, 125}
D = {100, 100, 75, 150, 75}
E = {75, 50, 200, 150, 25}
F = {25, 175, 175, 25, 100}
G = {75, 0, 325, 50, 50}
H = {100, 100, 100, 100, 100}
I = {125, 75, 125, 25, 150}
J = {150, 0, 175, 50, 125}
Figure 2 illustrates the histograms of Alternatives “A” and “B”, in which each column indicates the proportion of choice of the respective scale point, in relation to the 500 responses. The curve to the right of each histogram is the empirical PDF, which is nonparametric in nature. An interesting aspect to visualize is that the PDFs are unique for each dataset, differentiating them even for the situation of equality of their means and medians. This kind of data “DNA” is sensitive to the CPP, as its calculations depend on the PDF and its related cumulative function (CDF) to identify which alternative is likely to be superior or inferior to the others.
The PDF of the histograms in Figure 2 were defined by the “dempiralC” function, available in the “mc2d” package [25], according to Equation (11), where “x” are the scale values and “p” denotes their probabilities of occurrence, based on their frequencies. The “p” values are normalized to give the distribution one unit of area. The functions “dempiralC” and “pempiricalC” (CDF) were used in the calculations of PMax and PMin, according to the R code in the Appendix.
Once the probability distributions that fit the evaluations represented by the histograms have been defined, the next step of the CPP refers to the calculation of the probabilities that the alternatives maximize or minimize their preferences, considering the type of criterion. Based on the code registered on the Zenodo.org platform, the functions “PMax.Emp.Likert” and “PMin.Emp.Likert” were applied to the ten alternatives, generating the results in Table 3. The highest frequency of extreme values of Alternative “B”, with 150 “totally disagree” and 175 “totally agree” responses, were decisive for its priority, both to maximize and minimize its preference over the others.
3.2. CPP Sensitivity to Likert Scale Cardinality
The second illustration of the usefulness of the model proposed here explores two alternatives (“K” and “M”), with variants K* and M*, according to the frequencies indicated in Equations (12) to (15). Alternatives “K” and “M” were rated on a 5-point scale and alternatives K* and M* on a 9-point scale. The extreme options remain with the indications “totally disagree” and “totally agree” and the intermediate ones as “neutral”. The K* and M* frequencies repeat the values of the “K” and “M” evaluations, only representing greater rigor on the part of the evaluators by using the 9-point scale. Both “K” and “M” and K* and M* have the same medians, but different means and modes, which would be enough to define the priority for K or K*, if decision-making privileged these measures of descriptive statistics.
K = {150, 50, 100, 25, 175}
M = {75, 50, 200, 150, 25}
K*= {150, 50, 100, 25, 175, 0, 0, 0, 0}
M* = {75, 50, 200, 150, 25, 0, 0, 0, 0}
Figure 3 and Figure 4 describe the histograms and empirical densities of alternatives K, M and their variants K* and M*.
In the literature review, we identified studies that sought to make the use of descriptive statistics more flexible in problems with Likert scales of higher cardinality, arguing that ten-point [9] or eleven-point [8] scales, for example, would be sufficient to relax the mathematical rigor /statistics of the scales of Stevens [14]. This application shows that the CPP is able to confirm this argument, but without resorting to statistical parameters for decision making.
Table 4 indicates that the expansion of the Likert scale points was not enough to change the parameters of the variables (median, mean and mode) in order to change the decision. However, the change in scale gives a new density to the data, even if the density profiles of K* and M* are similar (shifted to the left) to the respective ones of K and M. The CPP is able to capture this change in scale due to its nonlinear property, valuing the highest evaluations in the PMax calculations and valuing the smallest ones in the PMin calculations, as described in Gavião et al [36]. Thus, in the new 9-point scale, the PMax of Alternative K* becomes higher than that of M*, confirming the order of priority indicated by means and modes, without eliciting the historical critiques of using descriptive statistics in ordinal scales.
3.3. Unified Health System (SUS)
The national health system in Brazil is called the Unified Health System (SUS in the Portuguese abbreviation), ranging from basic care to complex procedures such as organ transplants. The SUS guarantees full, universal and free access to the country's population. Its chain of health units includes federal university hospitals, which are reference centers of medium and high complexity for the SUS. In addition, these hospitals are important training centers for human resources in the health area and provide support to teaching, research and extension of the federal institutions of higher education to which they are linked.
The network of federal university hospitals comprises 51 hospitals linked to 36 federal universities. Of these, 41 hospitals are linked to the Brazilian Hospital Service Company (Ebserh). This company was created by the federal government and is responsible for the management of federal university hospitals. Among the attributions assumed by Ebserh are the coordination and evaluation of execution of the hospitals' activities; technical support for the elaboration of management improvement instruments; and the distribution of resources to the hospitals. Several reports of satisfaction surveys carried out by Ebserh are made available for public access (https://www.gov.br/ebserh/pt-br/acesso-a-informacao/participacao-social/ouvidoria-geral/pesquisas-de-satisfacao).
In 2022, Ebserh published a panel of results with the satisfaction rates of different users of university hospitals, which included resident physicians in their units. The study consolidated the responses on a 5-point Likert scale, but drew conclusions based on calculating the averages of these responses. Thus, in this case study we sought to apply the proposed method to reassess the final ranking of teaching hospitals, based on the opinion of resident physicians.
Table 5 presents the results of calculating the PMax for each hospital, compared with the final ranking tallied by Ebserh. Kendall's ordinal statistical correlation was applied to the two rankings, indicating a moderate relationship of 49.2%. Three hospitals had the same position in the satisfaction assessment, while 18, highlighted in this table, improved their order in the probabilistic calculations. The results illustrate the greater discriminant power of the CPP for the final calculation. This is relevant, since these 18 hospitals could have priority in the distribution of public resources or in public educational policies, receiving new diagnostic equipment and medicines, among other benefits.
4. Conclusions
The purpose of this article was to illustrate with examples the advantages of the CPP in multicriteria decision aid problems that have used databases measured on Likert scales. Without addressing the criticisms and controversies that have fueled the debate for decades in the scientific literature, the CPP offers a model with full adherence to the characteristics of an ordinal scale, without involving any of the points raised for and against the use of data with that type of scale. The CPP can be used with empirical distributions that are nonparametric, or for data adjustment without the need to resort to data parameters, but only the histogram.
The code in R language was used to calculate the most important parameters of the proposal, namely the probabilities of preference of the alternatives in the criteria. To complete the CPP, it is necessary to collect data referring to more than one criterion and compose the probabilities under some rule. In this article, we did not extend the analysis to the last stage, instead identifying the literature on different forms and models of the CPP for this conclusion, including the “CPP” package of the R software.
A possible deepening of this study is the use of other nonparametric distributions in the code, such as kernel density models, comparing the results with those of the empirical distribution explored here.
Author Contributions
Conceptualization, L.O.G. and A.P.S.; methodology, L.O.G. and A.P.S.; software, L.O.G., A.P.S., G.B.A.L and P.A.A.G.; validation, L.O.G., A.P.S., G.B.A.L and P.A.A.G.; formal analysis, L.O.G. and A.P.S.; investigation, L.O.G.; resources, L.O.G., A.P.S., G.B.A.L and P.A.A.G.; data curation, L.O.G. and A.P.S.; writing—original draft preparation, L.O.G. and A.P.S.; writing—review and editing, L.O.G., A.P.S., G.B.A.L and P.A.A.G.; visualization, L.O.G.; supervision, A.P.S. All authors have read and agreed to the published version of the manuscript.
Funding
This research received no external funding.
Conflicts of Interest
The authors declare no conflict of interest.
Appendix A
Probabilistic Preferences in Likert Scales with Empirical Distributions.
This R-code is intended for multicriteria decision support problems solved by the Composition of Probabilistic Preferences (CPP). The two functions calculate the joint probabilities of alternatives maximizing (PMax) and minimizing (PMin) their prefer-ences in a criterion. The measures of the problem's decision matrix are the frequencies of responses to the Likert scale values used in the questionnaires.
This R-code is registered (DOI: 10.5281/zenodo.7950538) [34]
# Function 1: joint probabilities of an alternative maximize preferences by criterion
PMax.Emp.Likert = function (values,probs) {
require(mc2d)
PMax = rep(0,nrow(probs))
for (i in 1:nrow(probs)) {
PMax[i]=(integrate(Vectorize(function(x) {prod(pempiricalC(x, min(values), max(values), values, prob=probs[-i,])) * dempiricalC(x, min(values), max(values), values, prob=probs[i,])}), min(values)-3, max(values)+3))$value}
PMax
r = rank(-PMax)
Result = list(PMax=PMax, Rank=r)
Result}
# Function 2: joint probabilities of an alternative minimize preferences by criterion
PMin.Emp.Likert = function (values,probs) {
require(mc2d)
PMin = rep(0,nrow(probs))
for (i in 1:nrow(probs)){
PMin[i]=(integrate(Vectorize(function(x) {prod(1-pempiricalC(x, min(values), max(values), values, prob=probs[-i,])) * dempiricalC(x, min(values), max(values), values, prob=probs[i,])}), min(values)-3, max(values)+3))$value}
PMin
r = rank(-PMin)
Result = list(PMin=PMin, Rank=r)
Result}
# Example:
values = 1:5 # equidistant values of the Likert scale, used to evaluate alternatives
prob.a = c(2, 7, 4, 3, 4) # frequency of responses for each Likert scale value
prob.b = c(6, 3, 3, 1, 7)
prob.c = c(4, 4, 5, 2, 5)
prob.d = c(4, 4, 3, 6, 3)
prob.e = c(3, 2, 8, 6, 1)
probs = rbind(prob.a, prob.b, prob.c, prob.d, prob.e) # matrix of frequencies and values
PMax.Emp.Likert (values,probs)
PMin.Emp.Likert (values,probs)
References
- Sant’Anna, AP. Probabilistic Composition of Preferences, Theory and Applications. 1st ed. New York: Springer, 2015.
- Likert, R. A technique for the measurement of attitudes. Arch Psychol 1932, 22, 5–55. [Google Scholar]
- Williams, MN. Levels of measurement and statistical analyses. Meta-Psychology 2021, 5, 1–14. [Google Scholar] [CrossRef]
- Bishop PA, Herron RL. Use and misuse of the Likert item responses and other ordinal measures. Int J Exerc Sci 2015, 8, 297. [Google Scholar]
- Tanujaya B, Prahmana RCI, Mumu J. Likert scale in social sciences research: Problems and difficulties. FWU J Soc Sci 2022, 16, 89–101. [Google Scholar]
- Hair JF, Black WC, Babin BJ, et al. Multivariate data analysis. Cengage Learning. 8th ed. London: Cengage Learning EMEA, 2018.
- Kuzon W, Urbanchek M, McCabe S. The seven deadly sins of statistical analysis. Ann Plast Surg 1996, 37, 265–272. [Google Scholar] [CrossRef]
- Wu H, Leung S-O. Can Likert scales be treated as interval scales?—A Simulation study. J Soc Serv Res 2017, 43, 527–532. [Google Scholar] [CrossRef]
- Awang Z, Afthanorhan A, Mamat M. The Likert scale analysis using parametric based Structural Equation Modeling (SEM). Comput Methods Soc Sci 2016, 4, 13–21. [Google Scholar]
- Baran, T. Comparison of parametric and non-parametric methods to analyse the data gathered by a likert-type scale. In: Handbook of Research on Applied Data Science and Artificial Intelligence in Business and Industry. IGI Global, 2021, pp. 414–430.
- Norman, G. Likert scales, levels of measurement and the “laws” of statistics. Adv Heal Sci Educ 2010, 15, 625–632. [Google Scholar] [CrossRef] [PubMed]
- Harpe, SE. How to analyze Likert and other rating scale data. Curr Pharm Teach Learn 2015, 7, 836–850. [Google Scholar] [CrossRef]
- Thomas, MA. Mathematization, Not Measurement: A Critique of Stevens’ Scales of Measurement. J Methods Meas Soc Sci 2019, 10, 76–94. [Google Scholar] [CrossRef]
- Stevens, SS. On the theory of scales of measurement. Science (80- ) 1946, 103, 677–680. [Google Scholar] [CrossRef] [PubMed]
- Mircioiu C, Atkinson J. A comparison of parametric and non-parametric methods applied to a Likert scale. Pharmacy 2017, 5, 1–12. [Google Scholar]
- Pornel JB, Saldaña GA. Four common misuses of the Likert scale. Philipp J Soc Sci Humanit 2013, 18, 12–19. [Google Scholar]
- Jamieson, S. Likert scales: How to (ab) use them? Med Educ 2004, 38, 1217–1218. [Google Scholar] [CrossRef] [PubMed]
- Allen IE, Seaman CA. Likert scales and data analyses. Qual Prog 2007, 40, 64–65. [Google Scholar]
- Sullivan GM, Artino Jr AR. Analyzing and interpreting data from Likert-type scales. J Grad Med Educ 2013, 5, 541–542. [Google Scholar] [CrossRef]
- Sant’Anna AP, Sant’Anna LAFP. Randomization as a stage in criteria combining. In: International Conference on Industrial Engineering and Operations Management - VII ICIEOM. Salvador, 2001, pp. 248–256.
- Wandresen RR, Netto SP, Koehler HS, et al. Nonparametric method: Kernel density estimation applied to forestry data. Floresta 2019, 49, 561–570. [Google Scholar] [CrossRef]
- Jiang T, Li D. Approximation of rectangular beta-Laguerre ensembles and large deviations. J Theor Probab 2015, 28, 804–847. [Google Scholar] [CrossRef]
- Chalabi Y, Scott DJ, Würtz D. The generalized lambda distribution as an alternative to model financial returns. Inst Für Theor Phys Univ Auckland, Zürich, Auckland, available www Rmetrics Org/Sites/Default/Files/Glambda Pdf or www rmetrics org/sites/default/files/2009-01-glambdaDist pdf.
- Zhou Z, Azam SS, Brinton C, et al. Efficient Federated Domain Translation. In: International Conference on Learning Representations. 2023, pp. 1–31.
- Pouillot R, Delignette-Muller ML. Evaluating variability and uncertainty separately in microbial quantitative risk assessment using two R packages. Int J Food Microbiol 2010, 142, 330–340. [Google Scholar] [CrossRef] [PubMed]
- Gavião LO, Sant’Anna AP, Lima GBA, et al. Evaluation of soccer players under the Moneyball concept. J Sports Sci 2020, 38, 1221–1247. [Google Scholar] [CrossRef]
- Garcia PA de A, Sant’Anna AP. Vendor and logistics provider selection in the construction sector: a Probabilistic Preferences Composition approach. Pesqui Operacional 2015, 35, 363–375. [Google Scholar] [CrossRef]
- Sant’Anna AP, Meza LA, Ribeiro ROA. Probabilistic composition in quality management in the retail trade sector. Int J Qual Reliab Manag 2014, 31, 718–736. [Google Scholar] [CrossRef]
- Gaviao LO, SantAnna AP, Lima GBA, et al. Selecting a Cargo Aircraft for Humanitarian and Disaster Relief Operations by Multicriteria Decision Aid Methods. IEEE Trans Eng Manag 2020, 67, 631–640. [Google Scholar] [CrossRef]
- Sant’Anna AP, Faria F, Costa HG. Aplicação da Composição Probabilística e do método das K-Médias à classificação de municípios quanto à oferta de creches. Cad do IME-Série Estatística 2013, 34, 17. [Google Scholar]
- Gavião LO, Silva RF da, Sant’Anna AP, et al. Ordenação de Municípios por Potencial de Contaminação de Águas com Fármacos Oncológicos por Composição Probabilística de Preferências [Powerpoint slides in Portuguese]. In: XLVIII Simpósio Brasileiro de Pesquisa Operacional. Vitória, 2016, p. 12.
- Garcia PA de A, Garcia VS, Saldanha PLC, et al. Combined use of composition of probabilistic preferences and entropy weighting for failure mode prioritization. In: European Safety and Reliability Conference - ESREL 2015. Zurique: CRC Press, 2015, pp. 381–386.
- Gavião LO, Meza LA, Lima GBA, et al. Improving discrimination in efficiency analysis of bioethanol processes. J Clean Prod 2017, 168, 1525–1532. [Google Scholar] [CrossRef]
- Gavião LO, Sant´Anna AP, Lima GBA, et al. Probabilistic preferences of Likert scale data by empirical distributions. Version 2.0. 2023; 1.
- Gavião LO, Sant’Anna AP, Lima GBA, et al. CPP: Composition of Probabilistic Preferences. R package version 0.1.0. 2022; 1–24.
- Gavião LO, Sant’Anna AP, Lima GBA, et al. Selecting distribution centers in disaster management by Network Analysis and Composition of Probabilistic Preferences. In: Amorim AMTT, Barbastefano RG, Scavarda LF, et al. (eds) Industrial Engineering and Operations Management. Rio de Janeiro-RJ: PUC-RJ, 2020, pp. 1–11.
Figure 1.
New Approach of the First Stage. Abbreviations: TD (totally disagree), D (disagree), N (neutral), A (agree), TA (totally agree).
Figure 1.
New Approach of the First Stage. Abbreviations: TD (totally disagree), D (disagree), N (neutral), A (agree), TA (totally agree).
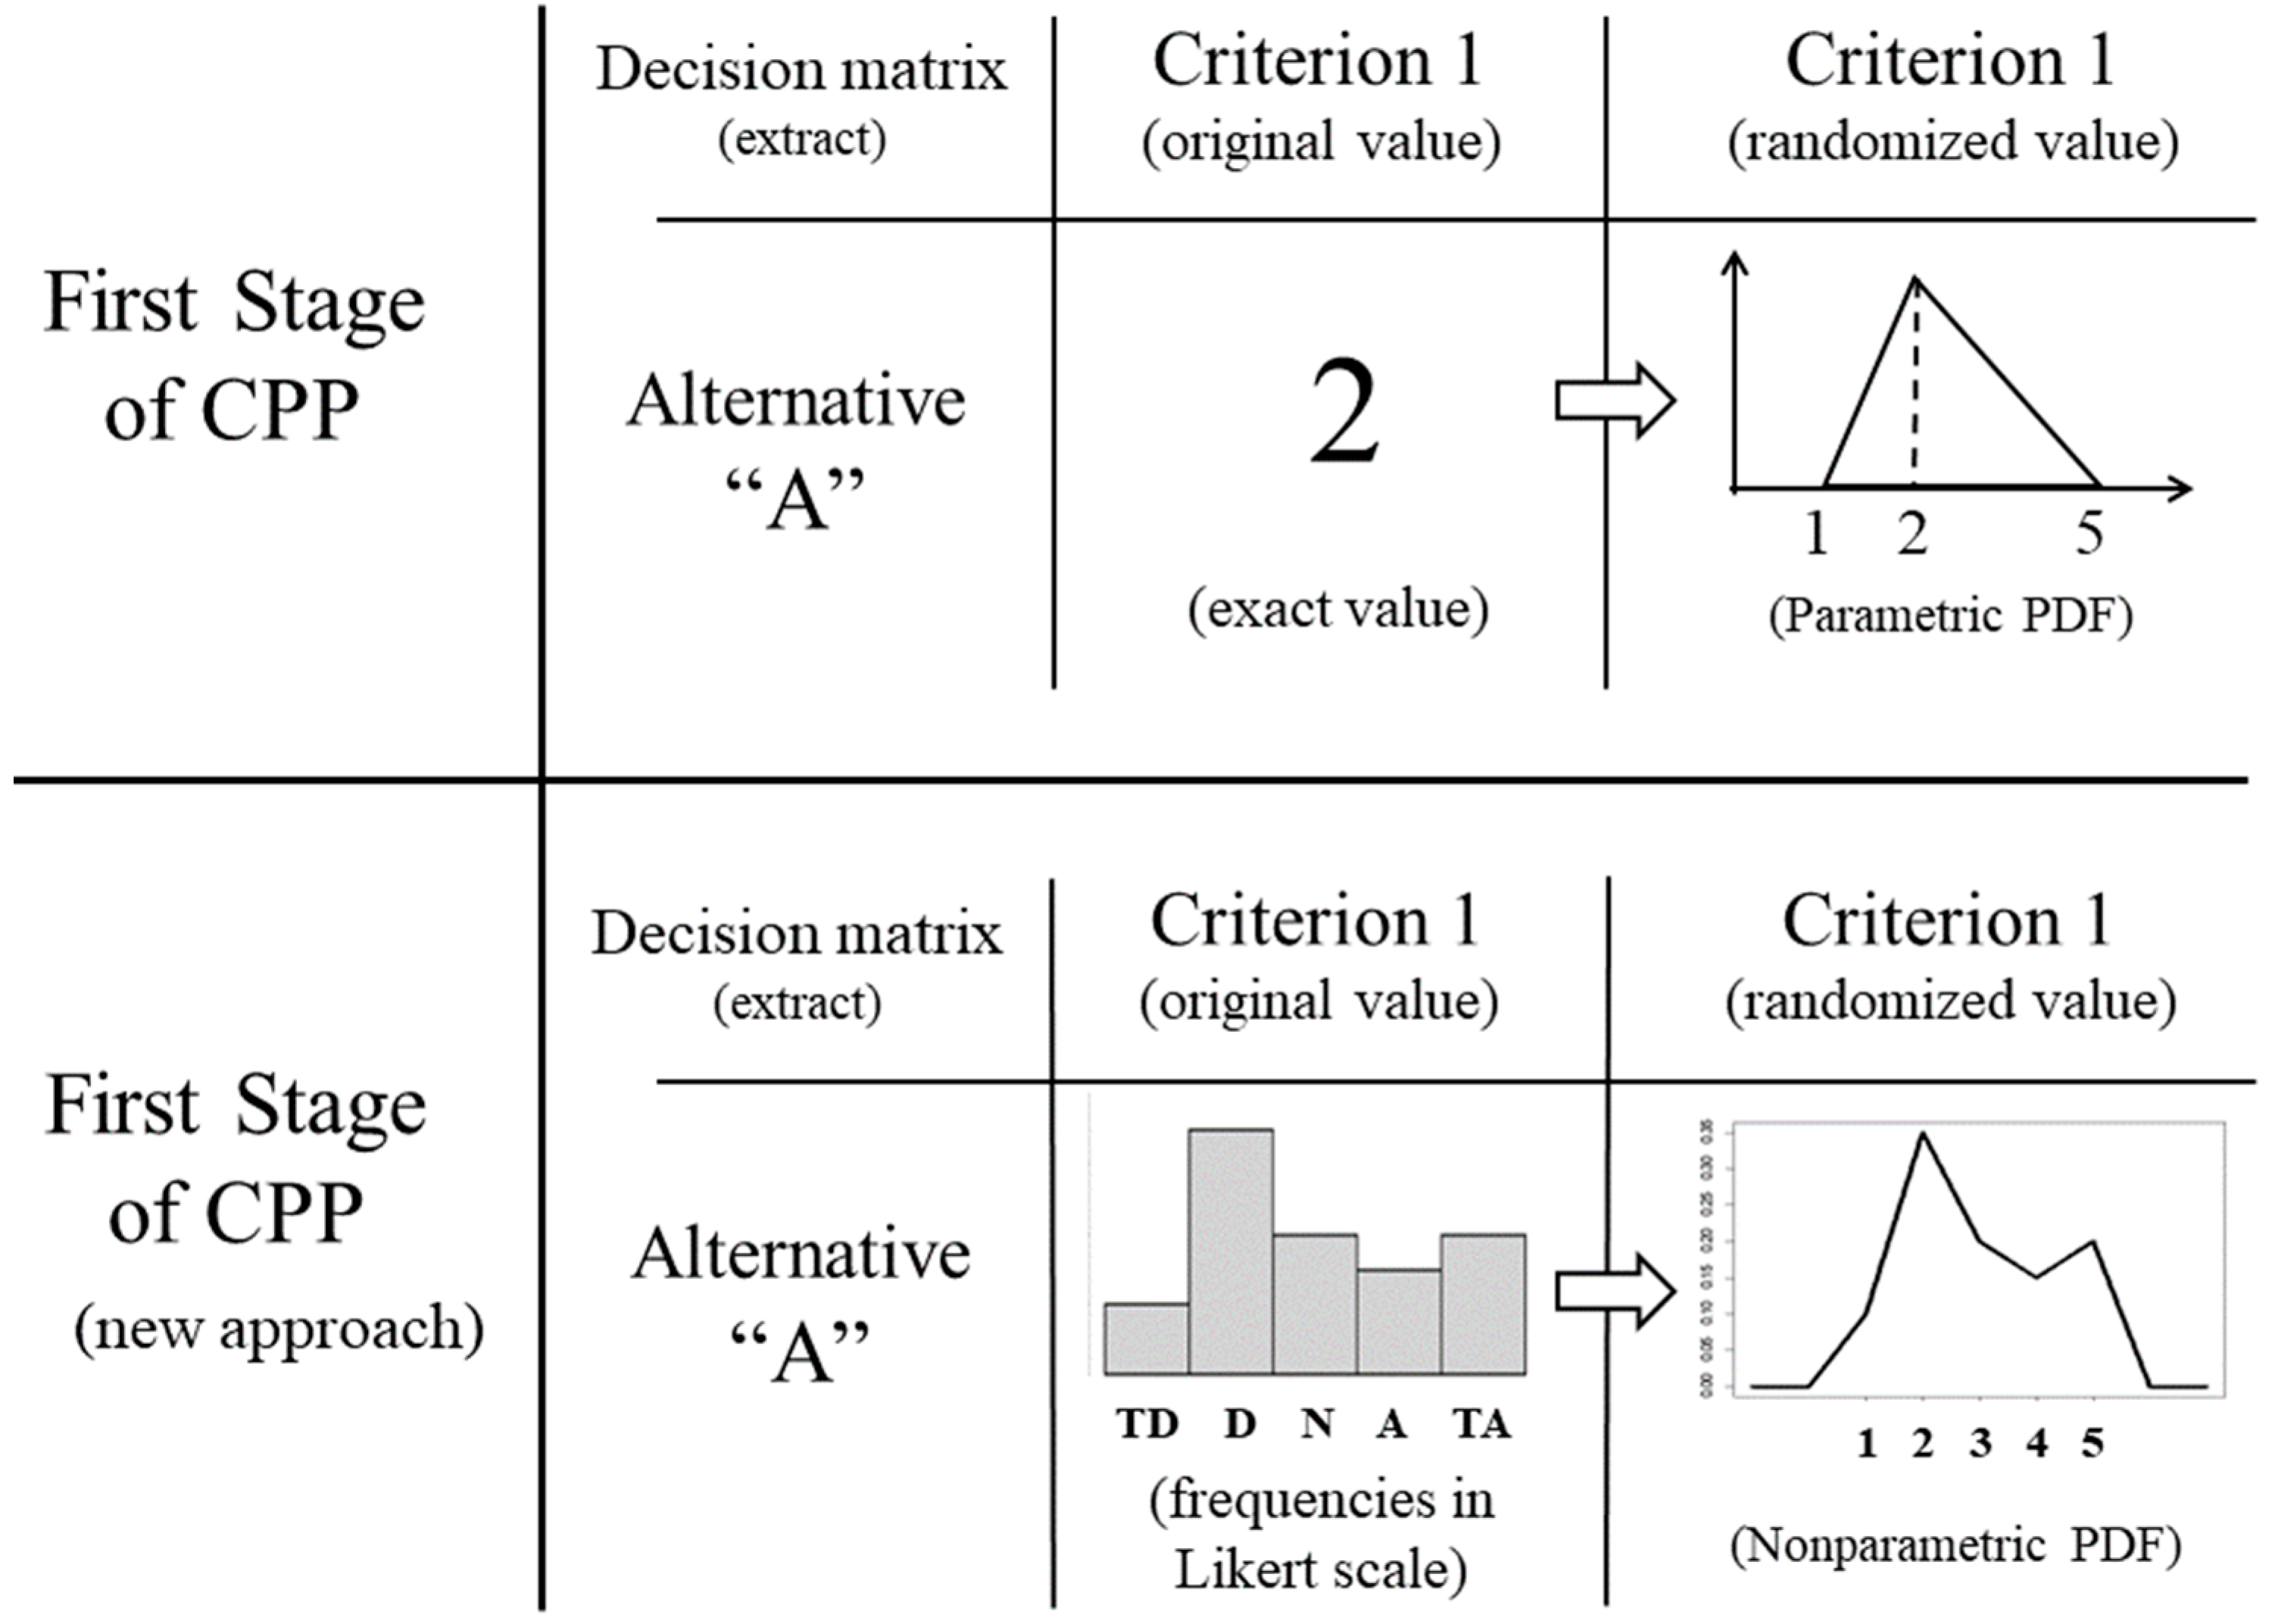
Figure 2.
Histograms and densities of alternatives "A" and "B". Abbreviations: TD (totally disagree), D (disagree), N (neutral), A (agree), TA (totally agree).
Figure 2.
Histograms and densities of alternatives "A" and "B". Abbreviations: TD (totally disagree), D (disagree), N (neutral), A (agree), TA (totally agree).
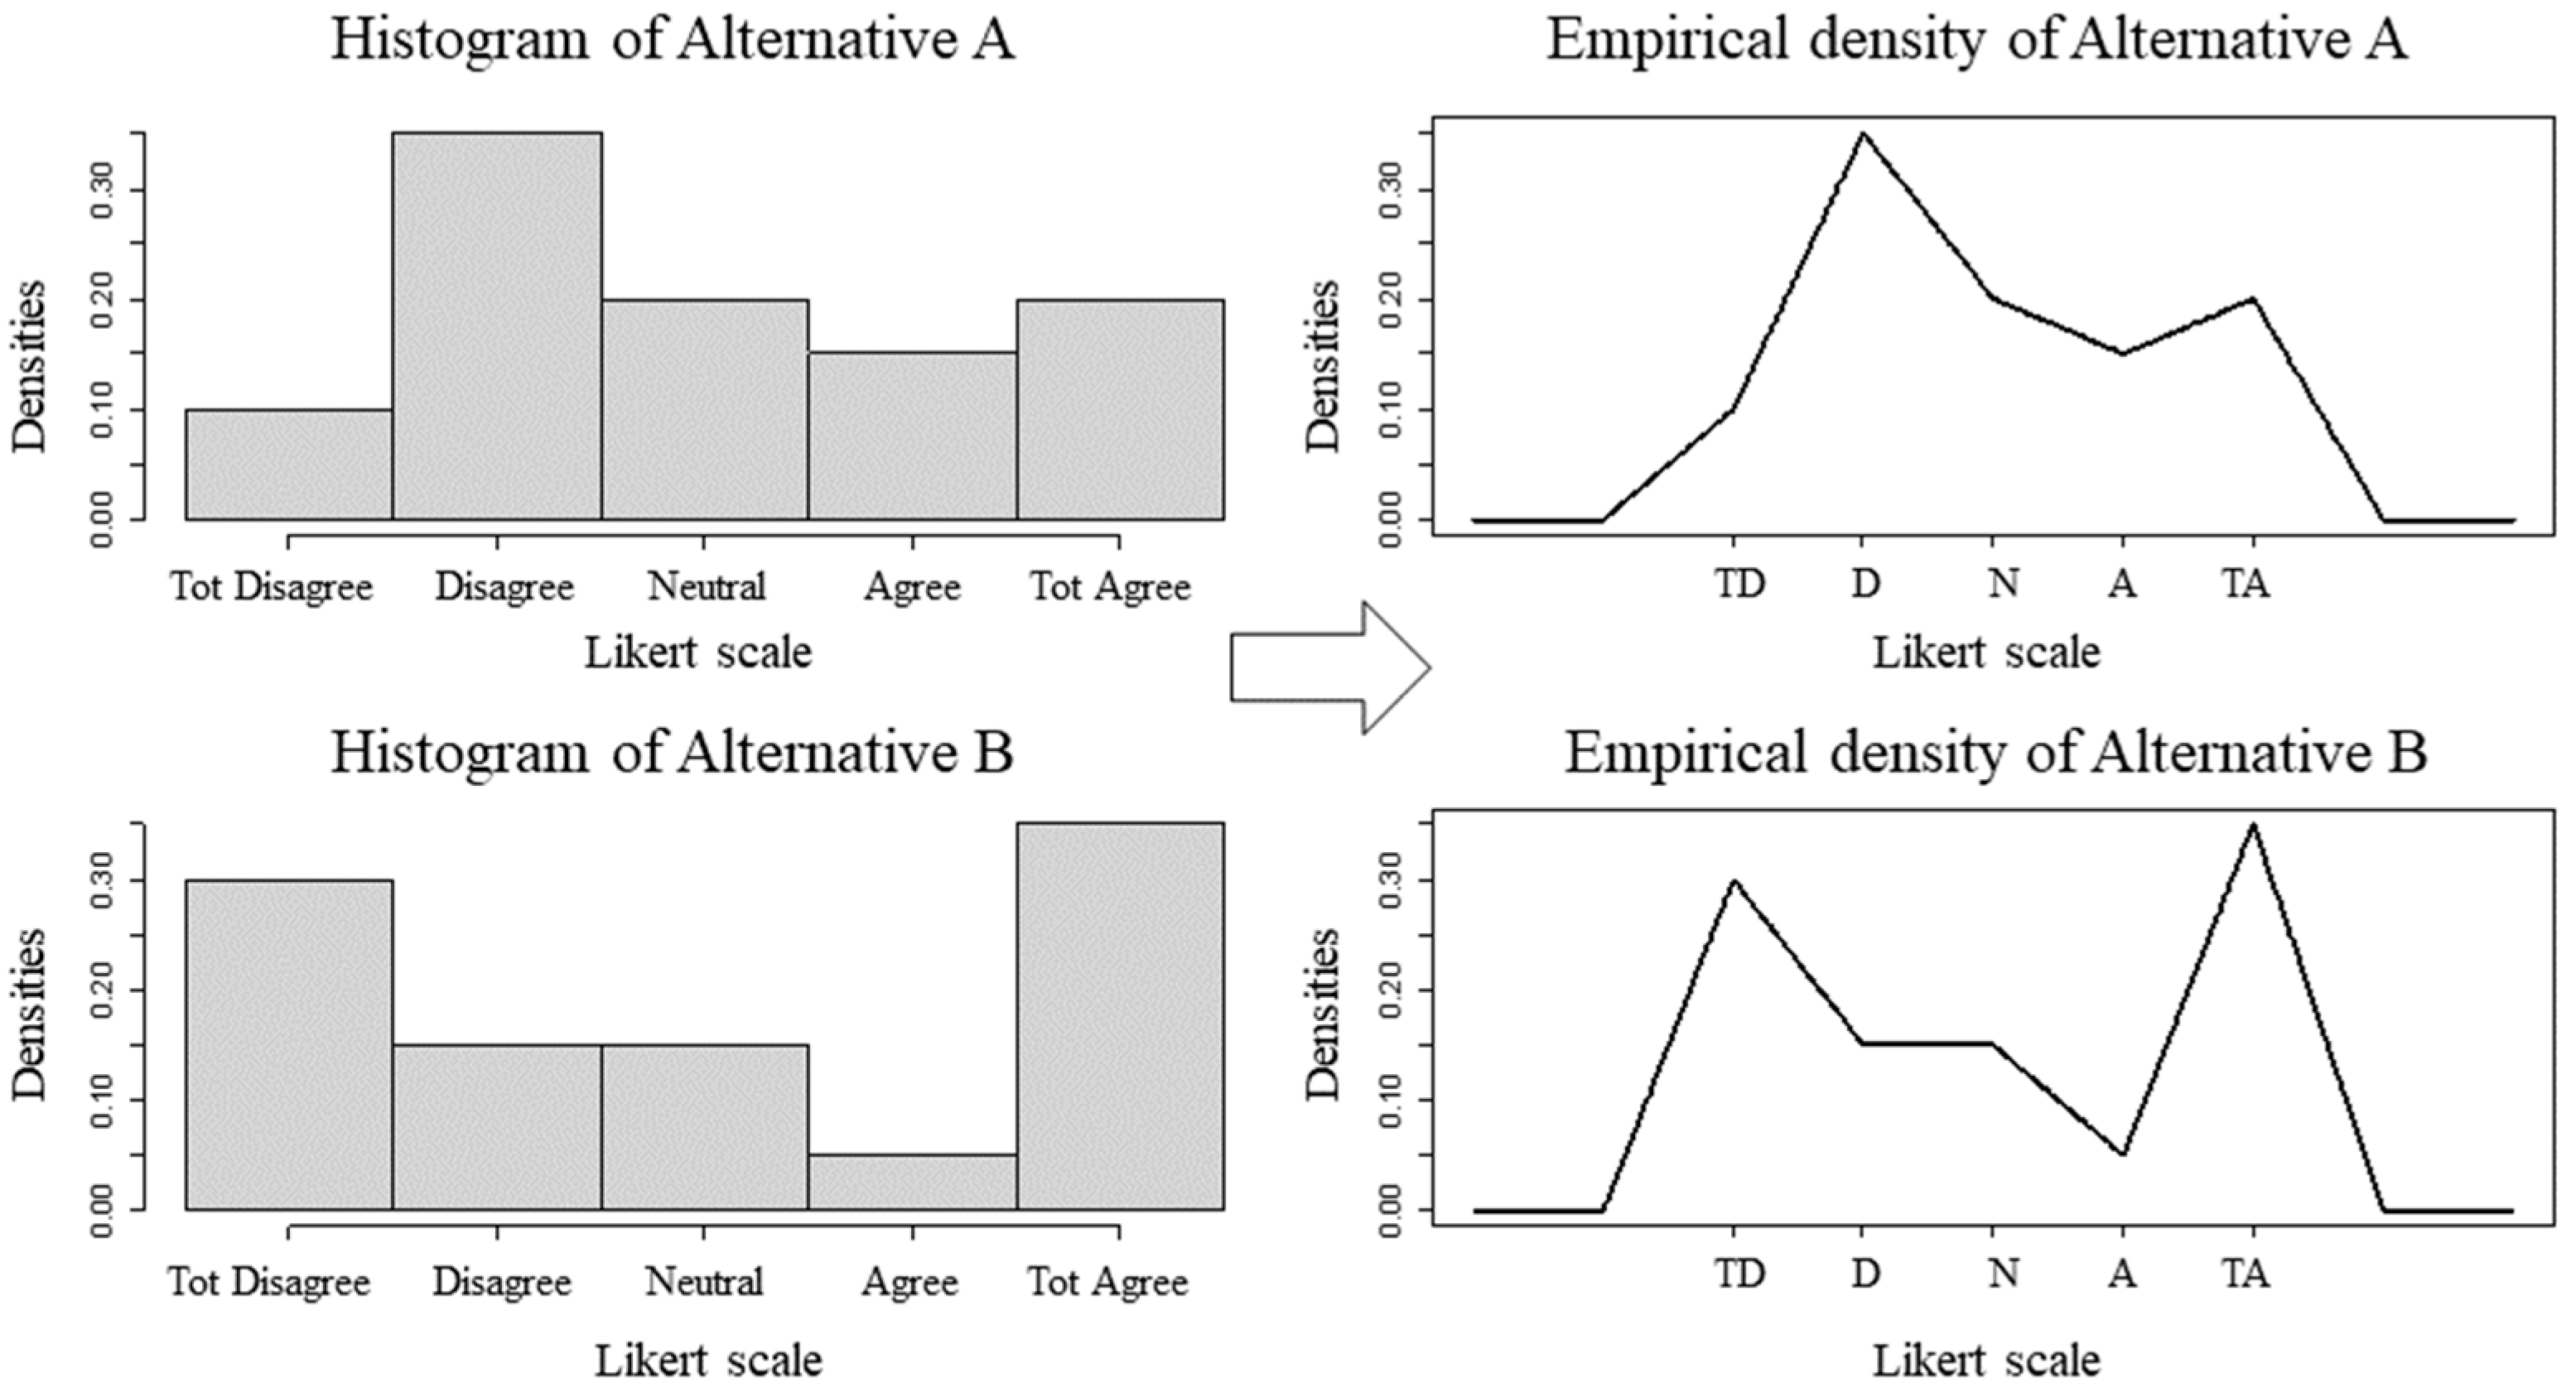
Figure 3.
Histograms and Densities of Alternatives “K” and “M” (5-point scale). Abbreviations: TD (totally disagree), D (disagree), N (neutral), A (agree), TA (totally agree).
Figure 3.
Histograms and Densities of Alternatives “K” and “M” (5-point scale). Abbreviations: TD (totally disagree), D (disagree), N (neutral), A (agree), TA (totally agree).
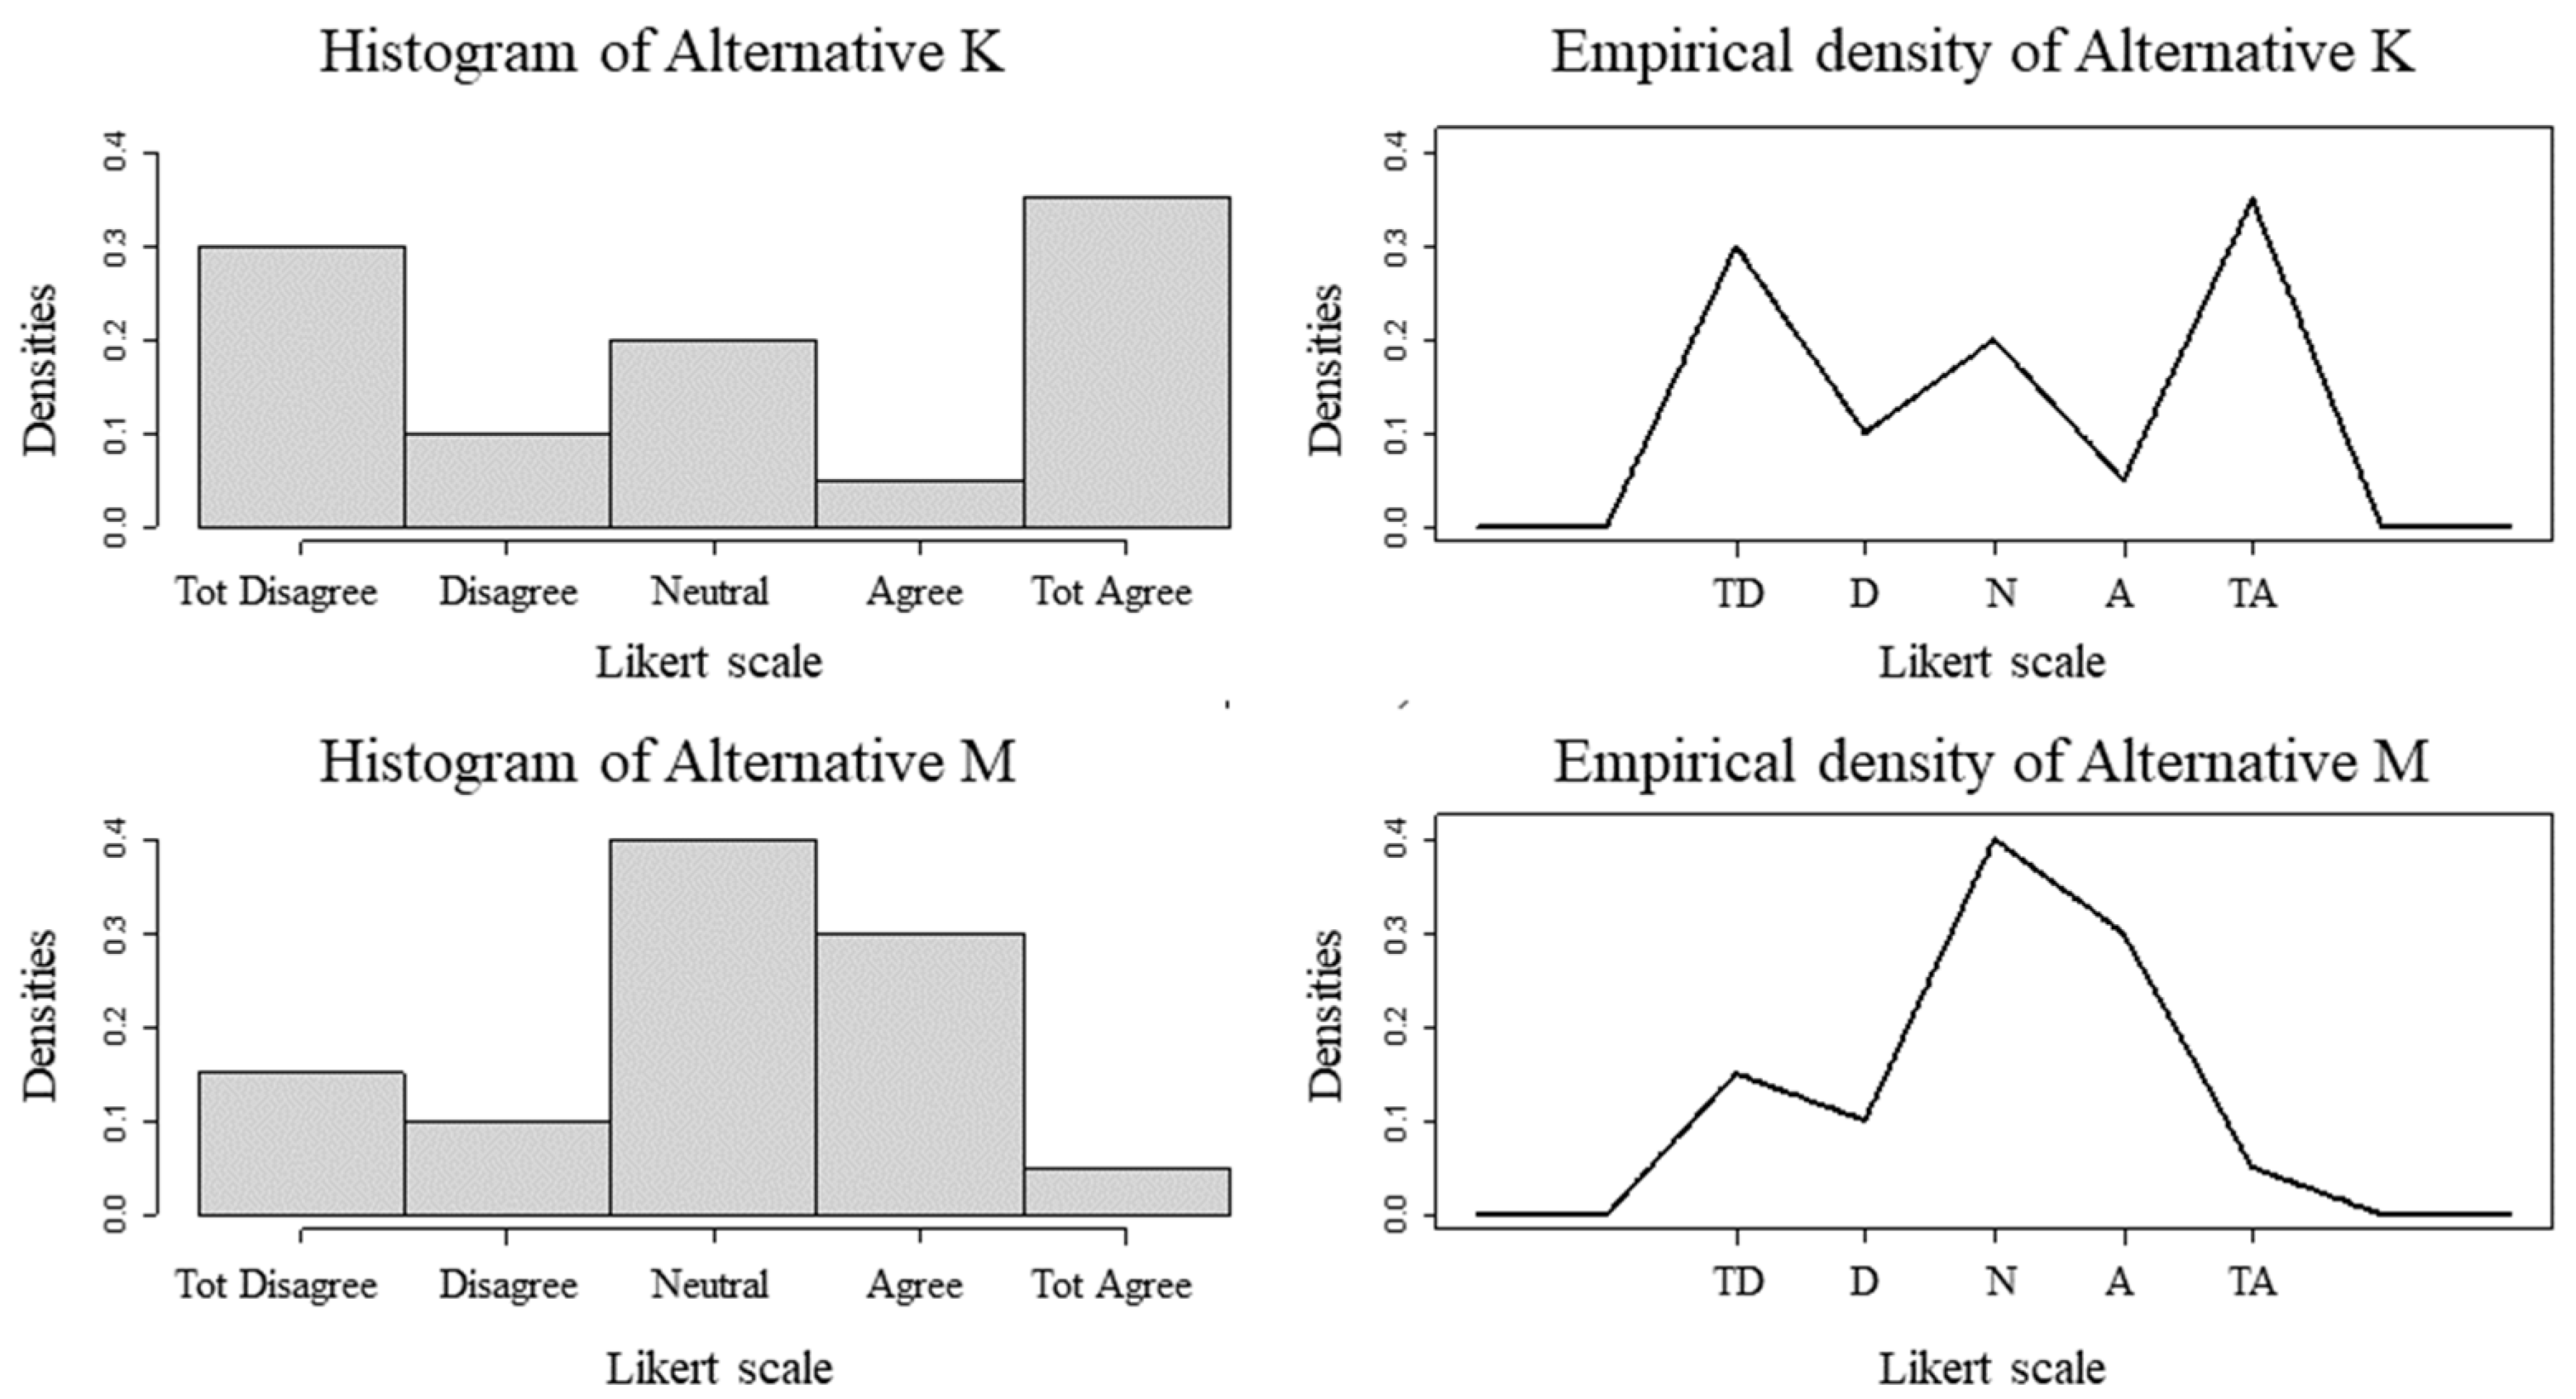
Figure 4.
Histograms and Densities of Alternatives “K*” and “M*” (9-point scale). Abbreviations: TD (totally disagree), D (disagree), N (neutral), A (agree), TA (totally agree).
Figure 4.
Histograms and Densities of Alternatives “K*” and “M*” (9-point scale). Abbreviations: TD (totally disagree), D (disagree), N (neutral), A (agree), TA (totally agree).
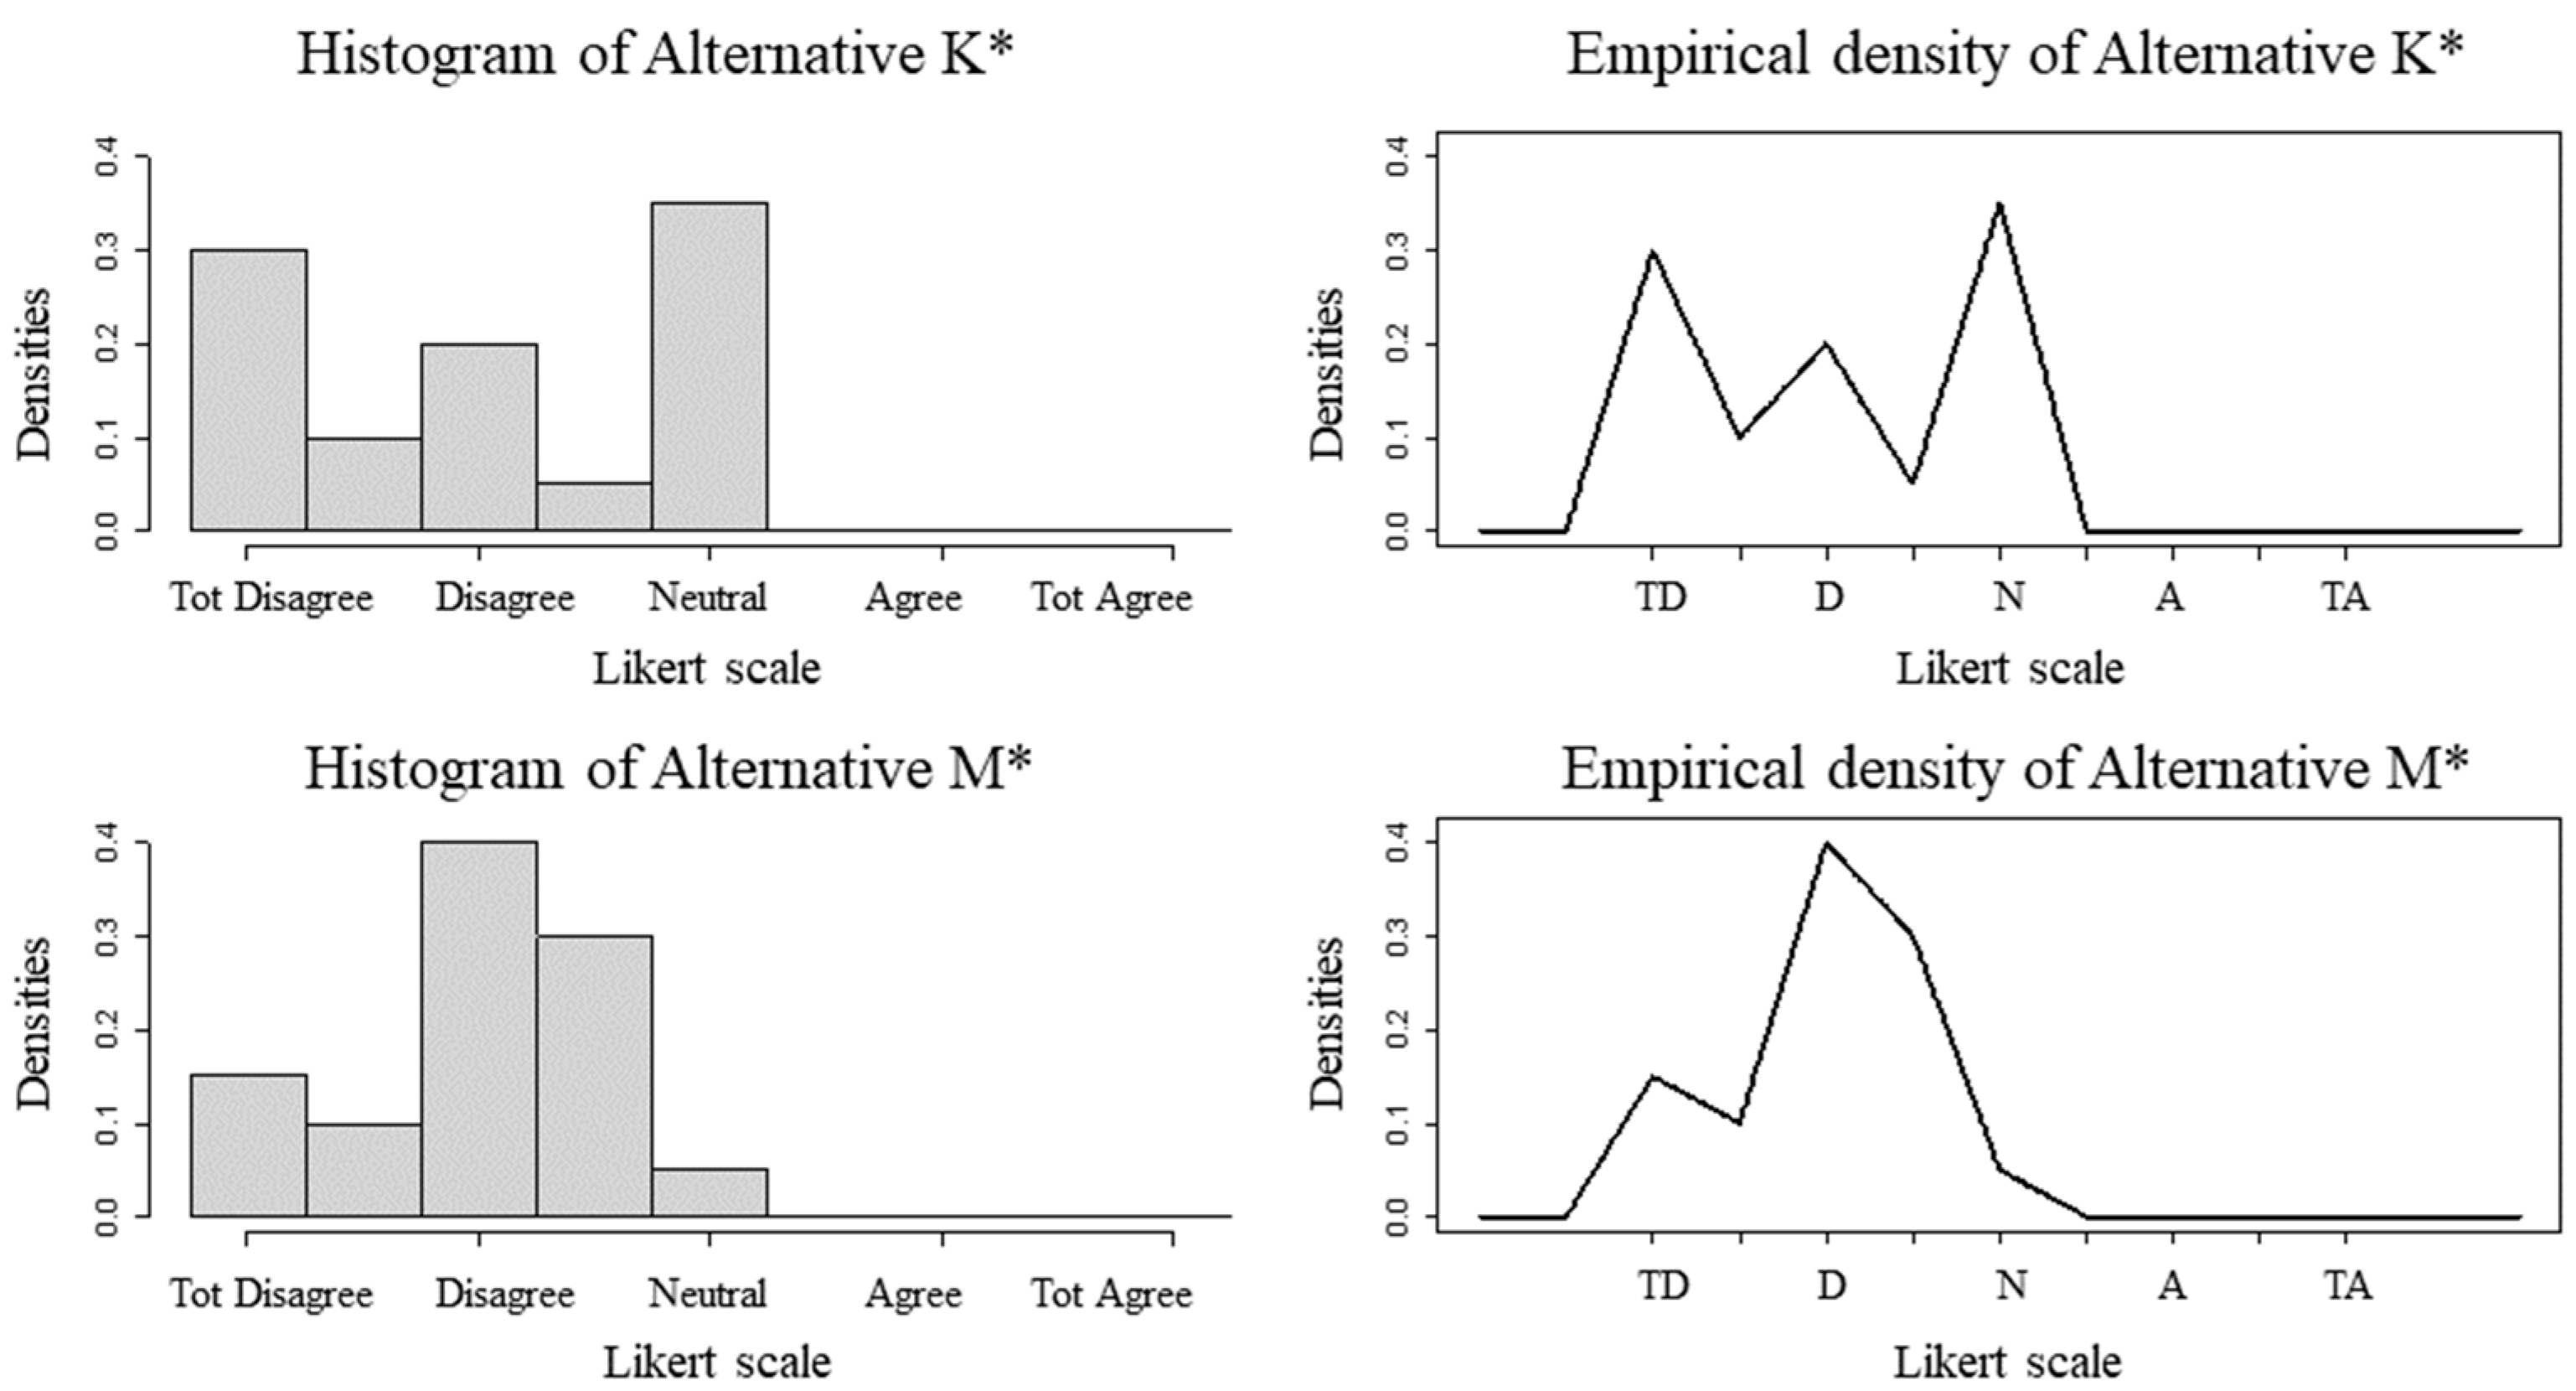

Table 1.
Types of Scales [14].
Table 1.
Types of Scales [14].
| Scale | Basic Empirical Operations | Permissible Statistics |
|---|---|---|
| Nominal | Determination of equality | Number of cases Mode Contingency correlation |
| Ordinal | Determination of greater or less | Median Percentiles |
| Interval | Determination of equality of intervals or differences | Mean Standard deviation Product-moment correlation |
| Ratio | Determination of equality of ratios | Coefficient of variation |
Table 2.
Pseudocode for Second Stage of the CPP.
| Algorithm: “Empirical probabilities of preference on Likert scales” |
|---|
| 1. Description: ranking alternatives evaluated on a criterion |
| 2. Variables > values – vector with numerical sequence of Likert scale options > freqs – Likert scale option frequency matrix: - matrix rows: problem alternatives - matrix columns: frequencies of Likert scale options |
| 3. Commands > open the R software console > install the R software "mc2d" library > load the database "values” and “freqs” > run the " PMax.Emp.Likert " function, for “benefit” type criteria > run the " PMin.Emp.Likert " function, for “cost” type criteria > rank alternatives in the criteria |
| 4. End |
Table 3.
Results of the Second Stage of the CPP.
| Alternative | PMAx | PMin |
|---|---|---|
| A | 0.08981332 | 0.09327040 |
| B | 0.15662032 | 0.16098827 |
| C | 0.10803823 | 0.10993096 |
| D | 0.10599313 | 0.10154487 |
| E | 0.06747378 | 0.06140966 |
| F | 0.07062573 | 0.07502867 |
| G | 0.05176373 | 0.04871787 |
| H | 0.10671008 | 0.10557457 |
| I | 0.12501971 | 0.12782754 |
| J | 0.11794092 | 0.11570593 |
Table 4.
Results of the Second Stage of the CPP.
| Scales | Alternative | Median | Mean | Mode | PMax | PMin |
|---|---|---|---|---|---|---|
| 5 points | K | 3 | 3.05 | 5 | 0.4667357 | 0.5332673 |
| M | 3 | 3 | 3 | 0.5332673 | 0.4667357 | |
| 9 points | K* | 3 | 3.05 | 5 | 0.5637278 | 0.4362749 |
| M* | 3 | 3 | 3 | 0.4362749 | 0.5637278 |
Table 5.
Case Study Results.
| Hospital | Likert scale (% of evaluations) |
PMax | Rank PMax | Rank Ebserh | Ebserh result (%) | ||||
|---|---|---|---|---|---|---|---|---|---|
| 1 | 2 | 3 | 4 | 5 | |||||
| CHC-UFPR | 8 | 19 | 5 | 52 | 16 | 3,09E-02 | 11 | 21 | 66,9 |
| CH-UFC | 6 | 7 | 6 | 57 | 25 | 4,61E-02 | 3 | 5 | 82,2 |
| CHU-UFPA | 4 | 17 | 14 | 52 | 13 | 2,57E-02 | 19 | 24 | 64,3 |
| HC-UFG | 7 | 16 | 10 | 52 | 14 | 2,79E-02 | 15 | 22 | 66,3 |
| HC-UFMG | 4 | 11 | 5 | 61 | 19 | 3,66E-02 | 7 | 8 | 79,9 |
| HC-UFPE | 5 | 19 | 9 | 58 | 9 | 2,09E-02 | 27 | 20 | 67,3 |
| HC-UFTM | 8 | 11 | 11 | 56 | 14 | 2,85E-02 | 14 | 18 | 70,1 |
| HC-UFU | 8 | 17 | 11 | 53 | 11 | 2,34E-02 | 21 | 25 | 63,6 |
| HDT-UFT | 0 | 12 | 6 | 82 | 0 | 1,21E-02 | 35 | 10 | 77,8 |
| HE-UFPEL | 22 | 31 | 3 | 25 | 19 | 3,37E-02 | 8 | 34 | 44,4 |
| HUAB-UFRN | 6 | 8 | 12 | 54 | 21 | 3,86E-02 | 5 | 15 | 72,2 |
| HUAC-UFCG | 0 | 12 | 5 | 67 | 17 | 3,33E-02 | 10 | 6 | 81,4 |
| HUAP-UFF | 10 | 25 | 7 | 50 | 9 | 1,99E-02 | 30 | 29 | 57,9 |
| HUB-UnB | 4 | 21 | 8 | 53 | 14 | 2,73E-02 | 16 | 23 | 65,3 |
| HUCAM-UFES | 3 | 9 | 6 | 59 | 23 | 4,27E-02 | 4 | 7 | 81,4 |
| HU-FURG | 13 | 19 | 9 | 44 | 16 | 3,00E-02 | 12 | 28 | 59,4 |
| HUGD-UFGD | 17 | 28 | 10 | 38 | 7 | 1,59E-02 | 33 | 35 | 44,1 |
| HUGG-Unirio | 8 | 23 | 15 | 48 | 8 | 1,78E-02 | 31 | 31 | 55 |
| HUGV-UFAM | 11 | 24 | 9 | 51 | 5 | 1,47E-02 | 34 | 32 | 54,3 |
| HUJB-UFCG | 0 | 11 | 0 | 78 | 11 | 2,65E-02 | 17 | 1 | 88,9 |
| HUJM-UFMT | 7 | 11 | 4 | 69 | 9 | 2,30E-02 | 22 | 9 | 78 |
| HUL-UFS | 19 | 38 | 10 | 29 | 5 | 1,15E-02 | 36 | 36 | 31,8 |
| HULW-UFPB | 5 | 17 | 5 | 58 | 15 | 2,99E-02 | 13 | 12 | 72,7 |
| HUMAP-UFMS | 7 | 17 | 3 | 64 | 9 | 2,22E-02 | 23 | 13 | 72,5 |
| HUOL-UFRN | 6 | 16 | 10 | 55 | 13 | 2,65E-02 | 18 | 19 | 67,8 |
| HUPAA-UFAL | 6 | 15 | 6 | 65 | 9 | 2,20E-02 | 24 | 16 | 71,4 |
| HUPES-UFBA | 15 | 22 | 6 | 51 | 7 | 1,77E-02 | 32 | 30 | 57 |
| HUSM-UFSM | 2 | 9 | 1 | 62 | 26 | 4,82E-02 | 2 | 2 | 86,3 |
| HU-UFJF | 3 | 9 | 7 | 64 | 17 | 3,37E-02 | 9 | 11 | 77,3 |
| HU-UFMA | 14 | 23 | 8 | 45 | 10 | 2,13E-02 | 26 | 33 | 54,1 |
| HU-UFPI | 3 | 7 | 8 | 62 | 20 | 3,82E-02 | 6 | 4 | 82,5 |
| HU-UFS | 1 | 17 | 8 | 64 | 9 | 2,17E-02 | 25 | 14 | 72,4 |
| HU-UFSC | 7 | 22 | 7 | 56 | 9 | 2,06E-02 | 29 | 26 | 63 |
| HU-UFSCar | 17 | 0 | 0 | 50 | 33 | 6,52E-02 | 1 | 3 | 83,3 |
| HU-UNIVASF | 2 | 22 | 13 | 50 | 13 | 2,50E-02 | 20 | 27 | 60,4 |
| MCO-UFBA | 8 | 21 | 0 | 63 | 8 | 2,07E-02 | 28 | 17 | 70,8 |
Disclaimer/Publisher’s Note: The statements, opinions and data contained in all publications are solely those of the individual author(s) and contributor(s) and not of MDPI and/or the editor(s). MDPI and/or the editor(s) disclaim responsibility for any injury to people or property resulting from any ideas, methods, instructions or products referred to in the content. |
© 2024 by the authors. Licensee MDPI, Basel, Switzerland. This article is an open access article distributed under the terms and conditions of the Creative Commons Attribution (CC BY) license (https://creativecommons.org/licenses/by/4.0/).
Copyright: This open access article is published under a Creative Commons CC BY 4.0 license, which permit the free download, distribution, and reuse, provided that the author and preprint are cited in any reuse.


