
Submitted:
23 May 2023
Posted:
25 May 2023
You are already at the latest version
Abstract
Many studies of hypervelocity impact craters have described the characteristics of quartz grains shock-metamorphosed at high pressures of >10 GPa, but in contrast, few studies have investigated shock metamorphism at lower shock pressures. In this study, we test the hypothesis that low-pressure shock metamorphism occurs in near-surface nuclear airbursts and that this process shares important characteristics with impact-cratering events. To investigate low-grade shock microstructures, we compared quartz grains from Meteor Crater, a 1.2-km-wide impact crater, to those from near-surface nuclear airbursts at the Alamogordo Bombing Range, New Mexico in 1945 and Kazakhstan in 1949/1953. This investigation utilized a comprehensive analytical suite of high-resolution techniques, including transmission electron microscopy (TEM) and electron backscatter diffraction (EBSD). Meteor Crater and the nuclear test sites all exhibit metamorphosed quartz grains with closely-spaced, sub-micron-wide fractures that appear to have formed at low shock pressures. Importantly, these micro-fractures are closely associated with Dauphiné twins and are filled with amorphous silica (glass), widely considered to be a classic indicator of shock metamorphism. Thus, this study confirms that glass-filled shock fractures in quartz form during near-surface nuclear airbursts, as well as crater-forming impact events, and by extension, it suggests they also may form in near-surface cosmic airbursts.
Keywords:
nuclear/atomic detonations
; impact craters
; shocked quartz
; shock fractures
; planar deformation features
; planar fractures
; tectonic deformation lamellae
; electron backscatter diffraction (EBSD)
; transmission electron microscopy (TEM)
; cathodoluminescence (CL)
1. Introduction
A few investigations (e.g., Eby et al. [1] and Lussier et al. [2]) have explored the characteristics and formation mechanism of shocked quartz grains resulting from the 1945 Trinity nuclear detonation at the Alamogordo Bombing Range, New Mexico. These studies revealed the presence of linear fractures considered to result from the high shock pressures of these detonations, leading Lussier et al. [2] to conclude that they may represent the initial deformational feature of quartz formed in a progression of increasing shock pressures. In another investigation related to the 1945 Hiroshima nuclear detonation, Wannier et al. [3] investigated glassy spherules but found that any shocked quartz grains that may have been present in the melt had been fully amorphized due to the extremely high temperatures.
Several laboratory experiments have investigated the shock-related transformation of quartz to amorphous silica at pressures of <10 GPa. In one study, Ebert et al. [4] reported that the experimental amorphization of rocks occurs mainly upon decompression of shocked material when the temperature remains high as the pressure decreases. In quartz grains experimentally shocked at 5 to 17.5 GPa, Fazio et al. [5] observed glass veins composed of amorphous silica that extend across several microns in length and that are generally thicker than 50 nm. Wilk et al. [6] found amorphous silica in experimentally shocked rocks called shatter cones that formed at low shock pressures of 0.5–5 GPa. In addition, Carl et al. [7] conducted experiments demonstrating that extensive amorphization of quartz begins at ~10 GPa. Regarding the importance of amorphous silica in studies of shock metamorphism, French and Koeberl [8] wrote “amorphous or ‘glassy’ phases ... constitute another set of unique and distinctive criteria for the recognition of shock-metamorphosed rocks....” Similarly, Bohor et al. [9] wrote “the formation of quartz glass within fractures ... allows a definitive distinction ... between these shock PDFs and the glass-free dislocation trails marking slow tectonic deformation.”
Even with these pioneering investigations, numerous questions remain about the formation of shock fractures and amorphous silica associated with nuclear airbursts. Is the process of formation similar to that of planar fractures (PFs) and planar deformation features (PDFs) found in shocked quartz grains associated with cosmic impact craters? Are these features similar to or different from tectonic lamellae found in some deformed metamorphic rocks? In this contribution, we explore these and other questions.
We investigated quartz grains exposed to near-surface nuclear airbursts, in which the blast wave and fireball intersected the ground surface. For comparison, we also investigated shocked quartz grains from Arizona’s Meteor Crater, a relatively small (1.2-km-wide) impact cratering event. Our objective was to compare quartz grains exposed to pressures and temperatures associated with these two different types of high-temperature, high-pressure events. The hypothesis we explored is that low-altitude nuclear airbursts marked by relatively-low pressures can produce shock fractures in quartz grains that became filled with amorphous silica. Secondarily, we investigated whether these characteristic shock fractures in quartz grains formed similarly to those during crater-forming impacts, such as at Meteor Crater.
1.1. Shock metamorphism in quartz.
Previous studies of impact cratering events have described relatively low shock fractures in quartz and given them various names, including shock extension fractures (SEFs) [10,11,12,13]; shock fractures [14,15]; and vermicular (i.e., wormlike) microfractures [11,13,16]. Here, we adopt the term “shock fractures” to denote non-planar, shock-induced microfractures in quartz. We also use the term “amorphous silica” interchangeably with “glass.”
Multiple studies have reported characteristics of the different types of shock metamorphism observed in quartz, including planar deformation features (PDFs) [8,9,17,18,19,20,21,22,23,24,25,26], planar fractures (PFs) [8,27], tectonic deformation lamellae (DLs) [8,9,14,19,21,24,28,29,30,31], and sub-planar shock micro-fractures [26,32,33,34,35,36,37]. Here, the term “lamellae” is used to denote typically closed high-pressure stress features in quartz, whereas “fractures” denote typically open lower-pressure stress features.
Table 1 compares some of the commonalities and differences among the types of shock features. Our analysis of this previous work shows that shock fractures share 2 of 10 characteristics with PDFs, 4 of 10 are shared with PFs, and 2 of 10 with DLs. Thus, shock fractures are substantially different from the other shock metamorphic features: PDFs, PFs, and DLs. The most important reported differences are that shock fractures are typically sub-planar, non-parallel, not crystallographically oriented, and form at lower shock pressures.
1.2. Key analytical studies of shock fractures.
Kieffer [32] performed analyses of shocked sandstone from Meteor Crater and concluded that impact-related microfractures began to form at 5.5 GPa (Table 1, adapted from Table 2 of ref. [32]). Later, Kieffer et al. [33] described rocks weakly shocked at <10 GPa and displaying fractured quartz grains that were partially transformed into amorphous silica. In moderately and strongly shocked rocks, they observed a process called “jetting,” in which molten quartz was extruded under pressure into shock-formed fractures in the grains.
Christie et al. [18] performed laboratory experiments on quartz by generating slow-strain conditions to produce glassy lamellae using a confining pressure of 1.5 GPa and a stress differential of up to 3.6 GPa. Their experiment attempted to replicate the features known to form in quartz grains during tectonic motion along fault planes. They reported the presence of deformation lamellae closely associated with amorphous silica at low pressures under laboratory conditions. Their experiment suggests that glass-filled lamellae may form in quartz at pressures as low as 1.5 GPa.
Importantly, Christie et al. [18] did not report amorphous silica associated with naturally-formed tectonic deformation lamellae in quartz [19], suggesting that their laboratory experiments did not replicate natural, real-world conditions. Co-author H.-R.W. has performed multiple analyses of tectonic lamellae and notably, never observed amorphous silica associated with tectonic lamellae in quartz grains [40,41,42,43,44]. In addition, Houser et al. [45] described finding tectonically-formed, nano- to micro-scale amorphous silica particles and nanofilms along active fault planes, but they reported no quartz grains with fractures containing amorphous silica. Multiple studies have observed amorphous silica within fractures, but only in impact-related shocked quartz and not in tectonic deformation lamellae [9,14,19].
For the Trinity nuclear airburst (24.8 ± 2 kiloton (kt); previously estimated at 20-22 kt [1]), numerous studies determined the requisite formation pressures for various minerals: ~8 to <10 GPa for shocked quartz [1,2]; ~7-10 GPa for shocked zircon [46]; <25–60 GPa for vesiculated feldspar [47]; >8 GPa based on the fractionation of zinc [48]; and 5-8 GPa based on quasi-crystalline minerals in trinitite [49].
Laboratory experiments by Kowitz et al. [11,15,50] investigated the shock alteration of quartz grains when a steel plate was explosively driven into cylinders of quartz-rich sandstone at pressures of ~5, 7.5, 10, and 12.5 GPa (Figure 1). Visible shock fractures and amorphous silica (~1.6 wt%) first appeared at ~5 GPa [11]. Scanning electron microscopy (SEM) images reveal shock fractures that they called “sub-planar, intra-granular fractures [11].” This result is important because most shocked material within small impact craters forms within this lower shock pressure range. The combined shock effects from studies by Kieffer [32,33] and Kowitz et al. [11,15,50] are summarized in Table 2.
2. Methods
Samples were collected as described in the Appendix, Methods-Samples. Candidate grains were processed as described in the Appendix, Methods-Processing Steps. Selected grains were investigated using multiple standard analytical techniques and preparation methods, as described here and in the Appendix, Methods-Analytical Techniques. The Appendix also lists the locations of laboratories where analyses were performed.
2.1. Sample Locations
2.1.1. Meteor Crater, Arizona
This site, also known as the Barringer Crater, is a 1.2-km-wide hypervelocity impact feature located east of Flagstaff, Arizona [51]. The 180-m-deep crater is surrounded by an ejecta blanket that is elevated ~30 to 60 m above the local surface (Figure 2). The 50,000-year-old impact crater is estimated to have been produced by an ~50-m-wide bolide, now known as the Canyon Diablo meteorite [51]. The bedrock inside Meteor Crater contains shocked quartz with high-pressure planar deformation features (PDFs) [32,51], but we limited our study to shock-fractured quartz grains embedded in samples of meltglass that had been ejected from the crater. They were collected in 1966 by Bunch [51] on the rim ~500 m north of the center of the crater at ~35.032206° N, 111.023988° W.
2.1.2. Russia, Joe-1/4 nuclear test, near-surface airburst
The first Soviet nuclear bomb test, nicknamed “Joe 1” by the Americans, was conducted in 1949 in Kazakhstan (~50.590664° N, 77.847319° E). The ~20-kt nuclear test was detonated aerially on a 30-m-tall tower (Figure 3). “Joe 4” is the American nickname for a 400-kt Russian test that was detonated on a 30-m-tall tower at the same location in 1953. This study analyzed fractured quartz grains in loose sediment and embedded in multi-mm-sized fragments of meltglass. A surface sediment sample was collected by Byron Ristvet on 9/1/2012 at ~100 meters from ground zero for both tests. It could not be determined which nuclear test produced the sample that was collected and investigated.
2.1.3. U.S., Trinity nuclear test, near-surface airburst
The Trinity nuclear bomb was detonated aerially in 1945 at the Alamogordo Bombing Range, New Mexico on a tower at an altitude of 30 m [1] with an estimated energy of 24.8 kilotons (kt) of TNT equivalent [52]. The fireball was ~300-m-wide at ~25 ms after detonation (Figure 4A). A blast zone of the ejected materials extended more than 400 m radially from ground zero [1]. The airburst formed a crater that was ~80 m in diameter [53] and ~1.4 m deep [54] (Figure 4B). This study analyzed fractured quartz grains embedded in meltglass, called trinitite, which was collected by co-author, R.E.H., on 9/30/2011 from the ground surface ~400 m north of ground zero (33.68100° N, 106.4756° W). R.E.H. also processed another sample (JIE) of loose quartz grains found on an anthill near ground zero, collected by Jim Eckles in 2003.
2.2. Analytical techniques
This investigation has required a robust series of analyses using a wide range of sophisticated, high-resolution techniques.
Optical transmission microscopy (OPT). For this study, we made polished thin sections of quartz grains and meltglass to search for potentially shocked quartz grains at three sites. For Meteor Crater, 36 quartz grains were analyzed at concentrations of 600 grains/cm2 (Appendix, Figure S1); for the Joe-1/4 site, 24 grains at 150/cm2 (Appendix, Figure S2) and for Trinity, 42 grains at 700/cm2 (Appendix, Figure S3).
Epi-illumination microscopy (EPI). This optical technique uses reflected light to image the surfaces of the grains investigated.
Scanning electron microscopy (SEM). Standard practices were used for SEM analyses.
Scanning transmission electron microscopy (STEM). STEM images were acquired on focused ion beam foils. Standard practices were used for STEM analyses.
Focused ion beam milling (FIB). This is a technique to prepare a thin specimen (avg: ~175 nanometers (nm) thick) by milling a quartz grain with focused gallium (Ga) ions. The resulting specimen, called a foil, is then analyzed using TEM.
Transmission electron microscopy (TEM). TEM images were also acquired on the FIB foils. Standard practices were used for TEM analyses.
Fast-Fourier transform (FFT). The diffraction characteristics of the FIB foils were investigated using FFT, an image processing technique for analyzing high-resolution TEM (HRTEM) images in reciprocal space. The FFT algorithm calculates the frequency distribution of pixel intensities in an HRTEM image, and then, any periodicity is displayed as spots in an output image, thus revealing the crystal’s structure. HRTEM and FFT allow the measurement of interatomic spacings, which are known as d-spacings and are measured in nm or angstroms (Å).
TEM energy dispersive spectroscopy (TEM-EDS). Standard practices were used for TEM analyses.
Cathodoluminescence (CL). We used SEM-mounted CL to explore the luminescence properties of the same areas of quartz grains as imaged with SEM. Standard practices were used for CL analyses.
SEM energy dispersive spectroscopy (SEM-EDS). SEM-based EDS exposes a specimen to an electron beam that generates X-rays that vary according to the elements present in the sample.
Electron backscatter diffraction (EBSD). EBSD is an SEM-based analytical technique, in which an electron beam scans across a crystalline sample tilted at 70°. The diffracted electrons produce what are called Kikuchi patterns that reveal the microstructural properties of the sample. EBSD was also used to determine the quartz grains’ crystallographic orientations.
At the University of California, Berkeley, SEM analyses were performed with a Zeiss EVO for imaging operated at 20 kV and EDS analyses used an EDAX-AMETEK spectrometer with corresponding Genesis software. EBSD mapping used a Digiview detector and TSL-OIM software. At the University of Utah, a Velocity Super EBSD camera (EDAX, Pleasanton, CA) was used to collect diffracted electrons for crystal structure analysis.
Micro-Raman. Although we attempted investigations using micro-Raman, the fracturing and extensive amorphization of quartz grains precluded acquiring usable Raman spectra.
Universal stage. We also attempted the analysis of shock fractures using the universal stage but the results were poor because most fractures are non-planar and not oriented along quartz’s crystallographic planes.
Figures. Most Figures were globally adjusted for balance, brightness, contrast, and sharpness, and some images were cropped to fit the space. A few images were rotated for clarity and the legends and scale bars were repositioned at the bottom of the Figures. For RGB images and some resized images, legends sometimes became unreadable and so, they were replaced with the original legible legend. EDS Figures were composited from multiple printouts. No data within the Figures were changed or obscured in making any adjustments.
3. Results and Interpretations
We employed ten analytical techniques to investigate shock fractures containing amorphous silica, as follows:
Optical transmission microscopy (OPT). Using this technique, we observed that >50% of the grains examined for each of the three sites displayed shock fractures. Representative optical and SEM images of quartz grains are shown in Figure 5. These images are comparable to those from the experimental study shown in Figure 1. Most displayed a single set of shock fractures, meaning all are oriented in approximately the same direction. However, a few grains display multiple sets that are oriented along different axes.
Some grains with shock fractures display undulose extinction (Figure 5), defined as a grain’s failure to become uniformly extinct (dark) when rotated under crossed polars. Instead, the grains exhibit waves of extinction that are typically oriented perpendicular to the trend of the grain’s lamellae. Kowitz et al. [15] reported that the extinction of quartz grains is sharp in unshocked sandstone. In contrast, they noted that undulose extinction becomes apparent in sandstone shocked to 5 GPa, transitioning to weak but still prominent mosaicism (i.e., irregular patchwork extinction) (Figure 5).
Epi-illumination microscopy (EPI). This analytical technique is particularly useful in viewing HF-etched quartz grains (Figure 5) that display previously hidden glass-filled fractures. Multiple studies [9,14,19,21,55,56] have demonstrated the usefulness of performing analyses after etching quartz grains with HF. According to Gratz et al. [19], the HF-etching removes some amorphous silica filling the shock features, allowing for the “unambiguous visual distinction between glass-filled PDFs and glass-free tectonic deformation arrays in quartz.” Other techniques are necessary to identify and characterize the filled material as amorphous silica, a key indicator of shock metamorphism [9,19].
In contrast, lamellae in tectonically-deformed grains are not visible in EPI as open fractures but may appear as shallow, closed depressions without filling material. Our investigations of six tectonically-deformed quartz grains and six unshocked natural quartz grains reveal that none contain amorphous silica. See Appendix, Figures S4 and S5.
Scanning electron microscopy (SEM). Analyses using SEM revealed filled fractures in quartz grains that appeared mostly as linear features, although some were curvilinear. Here, too, other analyses are necessary to identify and characterize the material filling the fractures.
Scanning transmission electron microscopy (STEM). FIB locations on the grains analyzed are shown in Figure 5. Using STEM, the 8- to 15-µm-wide foils display inter-fracture spacings ranging from ~250 nm to 3 μm (Figure 6). Nearly all shock fractures were observed to contain material that was shown to be amorphous silica discontinuously filling the fractures, while, in contrast, HF-etched grains with visible tectonic deformation lamellae have not been observed to display any associated amorphous silica (Appendix, Figure S4A). Similarly, unshocked, HF-etched, natural quartz grains display no visible lamellae (Appendix, Figure S5).
Transmission electron microscopy (TEM). Images acquired using TEM show sub-planar shock fractures containing thin bands of amorphous silica (Figure 6). We confirmed the amorphous state of the fill material using high-resolution TEM that can image individual atoms (Figure 7).
Numerous inclusions, also known as decorations or vesicles, are filled with glass or gases and are closely associated with shock fractures (Figure 6). Madden et al. [57] reported that multi-phase inclusions of glass, gases, and fluids are common at Meteor Crater in sandstone lightly shocked at ≥5.5 to 13 GPa. In contrast, that study observed no multi-phase inclusions in samples formed at >13 GPa in shock stages 3 or 4, suggesting that the high shock pressures collapsed the inclusions [57]. Thus, the evidence suggests that these grains with shock fractures formed at low shock pressures of 5 to 13 GPa at shock stages 1 to 2. In contrast, unshocked tectonically-deformed quartz grains may display lines of bubbles, known as decorations, that instead, form by the dissolution of quartz by water rather than by shock-related processes (Appendix, Figure S4).
Fast-Fourier transform (FFT).The areas of the grains from which the foils were extracted are shown in Figure 5. In this study, the FFT analyses commonly displayed crystalline structure in the quartz matrix away from the shock fractures, but most shock fractures displayed a diffuse halo or ring indicative of amorphous material [33,58,59], especially in the thin bands of glass along the shock fractures (Figure 6 and Figure 7).
FFTs of the filling along these thin fractures display the diffuse halo-like patterns characteristic of amorphous material [33,58,59]. The halos have average d-spacings of ~3.72 Å for Meteor Crater, ~3.90 Å for Joe-1/4; and ~3.95 Å for Trinity (Figure 6). Other average halo d-spacings for Meteor Crater are 3.42 and 3.34 Å and for Trinity, they are 3.45 and 3.79 Å (Figure 7). The mean value of 10 grains is 3.60 Å with a range of 3.34 to 3.95 Å. Plots of average halo d-spacings are 3.50, 3.60, and 3.70 Å for each of the three sites, showing close correspondence to a reported halo d-spacing of 4.2 Å for quartz glass [60] (Figure 8).
Gleason et al. [61] conducted experiments on amorphous silica and noted that unshocked amorphous silica had a d-spacing of about 4.20 Å. In contrast, quartz that had been exposed to shock pressures ranging from 4.7 to 33.6 GPa transformed into amorphous silica that permanently densified, causing the normal glass d-spacing to decrease to within a range of 3.36 to 4.00 Å. Thus, in our study, the d-spacing values (mean = 3.62 Å) are consistent with Gleason’s range, supporting our interpretation that amorphous silica from the three sites was shocked and densified at high pressures.
TEM energy dispersive spectroscopy (TEM-EDS). Energy-dispersive X-ray spectroscopy (EDS) is an analytical technique used to determine the elemental composition of materials. EDS analyses of multiple grains demonstrated that most of the material filling fractures is predominantly composed of silicon and oxygen (range: 98-99 wt%). Together with the presence of the diffuse rings exhibited in the FFT results (Figure 6, Figure 7 and Figure 8), this finding confirms that the material filling the fractures is amorphous silica. On the other hand, this Si-rich material is inconsistent with being hydrated silica (opal, hyalite) that potentially can precipitate into fractures, because the filling lacks spherical micro-structures typically present in opal [62]. Furthermore, TEM-EDS analyses reveal insufficient levels of oxygen to account for the hydration of silica (opal, hyalite) [62]. Concentrations typically total ~66 wt% oxygen in opal and hyalite [62], compared with ~28 to 48 wt% in the filling of our samples. For EDS spectra and other details, see Appendix, Figures S6–S9.
Most material that fills the fractures is amorphous silica, but some fractures are intermittently filled with C, Al, Mg, Fe, or Ca. These represent secondary materials possibly injected into the fractures during their formation, precipitated later into the fractures, or introduced during the preparation and polishing of samples.
Cathodoluminescence (CL). The areas of grains analyzed for CL are shown in Figure 5. Representative CL images are shown in Figure 9, Figure 10 and Figure 11. Under CL, fractures filled with amorphous silica have been reported to be commonly non-luminescent, i.e., black [21,59,63], although some defect structures in amorphous silica have been reported to luminesce red [64]. Alternately, natural, open fractures also appear black, and therefore, the possible presence of amorphous silica must be confirmed by TEM and EDS. According to previous studies [21,59,63,65], if quartz luminesces red, it has been heated or melted and re-crystallized but does not contain amorphous silica. In addition, tectonic deformation lamellae may appear red but never black [21,59,63,65]. Typically, non-shocked quartz lattice luminesces blue under CL but never black [21,59,63,65].
SEM energy dispersive spectroscopy (SEM-EDS). For these analyses, we selected multiple areas that displayed fractures filled with material (Figure 7 and Figure 8). In most cases, EDS analyses indicated the quartz matrix and filling material were predominantly silica and oxygen (range: 89-98 wt%). The balance was made up of carbon, presumably from the carbon-coating that was evenly dispersed across the area analyzed. For EDS spectra and other details, see Appendix, Figures S10–S14.
Electron backscatter diffraction (EBSD). Analyses performed using EBSD rely on varying comparisons of the Kikuchi patterns in a given grain, as shown in Appendix, Figures S15–S18. We used multiple EBSD routines, including one called “virtual backscatter,” and the images produced by this routine reveal an extensive network of oriented shock fractures for all three sites (Figure 12). Importantly, the majority of the hundreds of quartz grains in each sample from the three sites display these shock fractures. These images closely match those from shock experiments at ≥5.5 GPa by Kowitz et al. [11] (Figure 1).
Each grain’s crystallographic orientation is indicated for each image in the left column by the lattice diagram in the lower right corner (Figure 12A–C). The red-colored plane represents (0001), the basal plane, with the c-axis perpendicular to it. Although the shock fractures are non-planar, their general orientations correspond well with the crystallographic planes depicted on each pole Figure. This suggests that the shock fractures form similarly to high-shock planar deformation features (PDFs) and planar fractures (PFs) but are unlike tectonically-deformed lamellae [8,66].
EBSD “local orientation spread” (LOS). The high pressures during shock metamorphism damage and distort the crystalline lattice of quartz grains. To identify and quantify any potential grain damage, we used an EBSD routine called “local orientation spread” that generates Kikuchi patterns of the quartz lattice. The EDAX EBSD software compares these short-range patterns to reveal possible rotations or misorientations of the crystalline lattice, after which, the average misorientation of any given point is calculated relative to neighboring points. For the three sites, we observed values ranging from 0° to ~5° of misorientation, and this misoriented lattice tends to be concentrated along the shock fractures (Figure 12). We found that such misorientations are common in quartz with shock fractures but are atypical in unshocked quartz grains (e.g., Appendix, Figure S5).
Trinity grain 32x08 was scanned with a scanning electron microscope (Figure 13A) that recorded EBSD data from a ~20 nm area and indexed the crystallographic patterns automatically (Figure 13B). This provides information about the orientation of the crystal at that spot relative to sample coordinates, generally defined by three Euler angles that relate sample and crystal coordinate systems. Figure 13C is a map over the same Trinity quartz grain with colors indicative of Euler angle f2; the Kikuchi pattern is shown in Figure 13D. The pole figure in Figure 13B shows that across the selected area, two main orientations are present. The quartz grain has a c-axis roughly perpendicular to the sample surface (001 pole figure) and two orientations of rhombohedral planes (101 and 011) related by a 60° (180°) rotation around the c-axis. This orientation relationship is known as Dauphiné twinning which can form in multiple ways: during growth; during the phase transition from hexagonal high quartz to trigonal low quartz; during mechanical deformation; or during recrystallization after thermal shock. Several studies have observed Dauphiné twins in quartz subjected to stress (e.g. Schubnikow and Zinserling [67]; Tullis [68]; and Wenk et al. [41]). From the Euler angle relationships, twin boundaries can be defined and the Dauphiné twin boundaries are plotted as black lines in Figure 13C.
EBSD “grain reference orientation deviation” values superimposed on EBSD “image quality” values. Orientation deviation maps (Figure 14) assist with visualizing the distribution of local lattice angular misorientations by color-coding the variations. EDAX’s EBSD software analyzes and colorizes individual points to illustrate any rotation of the crystalline lattice around an arbitrary common point on the grain with a wide range of colors that each represents areas with short-range misorientations relative to the common point. In contrast, unshocked grains and tectonically-deformed grains display few misorientations (Appendix, Figures S4 and S5).
Several of the grains in Figure 14 exhibit shock fractures that are curved. As the shock fractures formed, the lattice may have become distorted at high ambient temperatures or by shock melting, as suggested by Buchanan and Reimold [16] and Reimold and Koeberl [13].
EBSD “inverse pole Figure” values superimposed on EBSD “image quality” values. The inverse pole Figures (right column of Figure 14) reveal variations in the lattice axes of quartz relative to a frame of reference, which, in these examples, is the (0001) basal plane. The EBSD results indicate that these are monocrystalline grains. In each case, measurements show that areas of quartz grains known as Dauphiné twins are rotated 60° relative to the c-axis. Dauphiné twinning is undetectable by standard optical microscopy and SEM but can easily be seen using EBSD.
Our analyses indicate that, although Dauphiné twins are nearly ubiquitous in all quartz grains, including unshocked or tectonically deformed grains, they are typically distributed randomly in the latter (Appendix, Figures S4 and S5). In contrast, for the shocked quartz analyzed in our study, Dauphiné twins typically align with the trend of the shock fractures, suggesting that they crystallized as the fractures formed under high stress. It has long been recognized that Dauphiné twins form when quartz is subjected to mechanical stress [67]. Later, Wenk et al. [41] further concluded that Dauphiné twinning occurs under high thermal stress, as well as mechanical stress. Subsequently, Wenk et al. [42] reported that Dauphiné twinning provides evidence for an impact-related origin of shocked quartzite collected from the Vredefort crater in South Africa.
Additional supporting evidence. In the Appendix, we provide additional images in support of the presence of glass-filled shock fractures in quartz grains from Trinity, Joe, and Meteor Crater. These include images acquired using the same analytical techniques presented above (optical, epi, SEM, TEM, STEM, CL, and EBSD). See Appendix, Figures S19–S21.
3. Discussion
This investigation supports the hypothesis that glass-filled shock fracturing can occur both in nuclear detonations and in impact-cratering events. Next, we discuss potential formation mechanisms.
Shock fracturing by compression. Evidence indicates that shock fractures, as well as shock PDFs and PFs, form when quartz grains are subjected to shock pressures above their Hugoniot elastic limit (HEL), which, for quartz, ranges from ~3–8 GPa [27]. This pressure range corresponds with that estimated for the nuclear tests of Trinity and Joe-1/4. For shock metamorphism to occur, the shockwave must exceed the velocity of the elastic wave for quartz. A pressure database [69] reveals that in quartz, velocities of the pressure wave range from 6.3 to 6.9 km/sec, depending on a quartz grain’s orientation.
When quartz is exposed to a high-pressure shockwave, the crystalline lattice compresses only in the propagating direction, while the other two perpendicular directions remain at ambient pressure. At the moment of greatest pressure, the grain cannot fracture easily because it is constrained by the confining pressure. The lattice, unable to transmit the shockwave elastically, develops a set of microfractures to accommodate the additional stress. When quartz grains are embedded in porous bedrock, such as sandstone, the rock medium may reflect the shockwave in different directions and this leads to multiple sets of shock fractures and to amorphization that can form at lower pressures in porous rock [4].
High shock pressures commonly produce quartz phases called coesite or stishovite. However, we found no evidence of these phases, which have been previously observed at Meteor Crater [1,2,32,47,48,70,71,72,73]. This supports the hypothesis that the shocked grains investigated in this study from Trinity, Joe, and Meteor Crater formed at the lower range of shock pressures, estimated to be ≤8 GPa.
Shock fracturing by tension. In both airbursts and crater-forming events, the fracturing of quartz grains may also occur from tensile forces or, more specifically, due to spallation [26,35,37,74,75,76]. This shock process occurs when a compressive shockwave enters a material, such as a quartz grain, and then is reflected off the grain boundary, producing a rarefaction wave. This wave can exceed the tensile strength of the material, thus producing multiple oriented fractures. This process frequently produces the most mechanical damage, because the tensile strength of quartz is typically lower than its compressive strength.
Thermal shock fracturing. For shock fractures to form in quartz, the crystalline lattice must experience high stress and strain, not just from high pressures but also typically from high-temperature gradients. Nuclear tests like Trinity generate fireballs with extreme temperatures that rise to ~200,000 °C within 10-4 sec but then after 3 sec, drop to below the melting point of quartz [77]. Such extreme, short-lived temperatures followed by rapid quenching are capable of fracturing quartz grains due to sudden thermal expansion followed by rapid cooling. In addition, the intense thermal and gamma radiation may heat the quartz grains to near-melting and thus, reduce the pressures needed to form shock fractures.
Most importantly, the high temperatures appear to vaporize quartz grains and sediment, after which the high blast pressures inject molten silica vapor and other molten material into fractures and any other zones of weakness in exposed quartz grains [33,37]. Molten silica appears to enter the grains along multiple possible pathways: (i) fractures produced by the shockwave; (ii) fractures produced by high temperatures; (iii) pre-existing quartz fractures; (iv) pre-existing PDFs and PFs; (v) pre-existing tectonic lamellae; and (vi) pre-existing subgrain boundaries. In the cases of the pre-existing features, the shock fracturing overprints and modifies the existing features. Even though these types of fractures may form under substantially different shock and non-shock conditions, all have one common characteristic: they eventually become injected with amorphous silica.
Proposed model for producing shock fractures. To summarize, we propose that shock fractures in nuclear airbursts and cratering events form in the following sequence. (i) Fractures in quartz grains either pre-exist or are produced by the high-pressure shockwave and thermal pulse; (ii) some quartz grains are vaporized by the blast and this vapor is transported away from ground zero in the expanding fireball; (iii) the outer surfaces of some quartz grains melt at >1720 °C, the melting point of quartz; (iv) the extreme pressures inject molten silica or silica vapor into the fractures; and (v) both thermal and pressure shock may cause further random melting in the interior of some grains.
Future studies. Several studies [34,36,37,75,78] have reported evidence that shock fractures are produced in cosmic airbursts when a high-pressure, high-temperature fireball intersects the surface, similar to the nuclear airbursts described here. These cosmic airbursts may produce shallow craters rather than classic hard-impact craters. It is recommended that future studies further investigate the hypothesis that low-shock, glass-filled shock fractures are produced in quartz grains during near-surface cosmic airbursts. Similarly, we suggest further research to better understand glass-filled fractures in hard-impact craters of all sizes.
4. Conclusions
Glass-filled shock lamellae and fractures are considered to be definitive indicators of a crater-forming impact event and are widely accepted to form at extreme pressures of ~5 to >30 GPa. However, most previous studies of shocked quartz were conducted on large craters and on easily recognizable quartz grains that had been shocked at the higher end of that pressure range. Consequently, there is limited knowledge about the characteristics of quartz grains minimally shocked at lower shock pressures.
In this study, we confirmed previously reported low-shock fractures in quartz at Meteor Crater, a relatively small 1.2-km-wide impact event. Most importantly, we confirmed that similar low-shock fractures also form in near-surface nuclear airbursts, in which the fireball and the blast wave reach the surface and no hard-impact crater is formed. Despite being static instead of moving at high velocity, these nuclear airbursts create ambient conditions of high pressures and temperatures that are proposed to be similar to near-surface cosmic airbursts.
We observed that these low-grade shock fractures: (i) are either void or filled with glass; (ii) range from near-planar to curvilinear; (iii) are commonly sub-parallel in orientation; (iv) are commonly spaced less than a few microns apart; (v) are typically less than one micron thick; (vii) are typically closely aligned with Dauphiné twins; and (viii) appear to form at <5 GPa. Notably, most quartz grains appear to have been exposed to temperatures high enough to partially melt the grains, after which portions of the grains recrystallized as Dauphiné twins in alignment with the fracture patterns. Multiple studies have concluded that when amorphous silica is present within fractures, it allows for the unequivocal differentiation between impact-related shock fractures and the glass-free lamellae that mark slow-strain tectonic deformation. The same principle applies to shock fractures formed in nuclear detonations. Thus, we conclude that these shock fractures cannot be of tectonic origin.
The discovery of shock fractures in quartz exposed to nuclear airbursts has important implications. It suggests that shock metamorphism may also occur during a near-surface airburst of an asteroid or comet if the bolide disintegrates close enough to the Earth’s surface to generate large shock pressures. The protocol reported here may help identify low-shock fractures in quartz from previously unknown, near-surface cosmic airbursts and small crater-forming impact events in the past.
Supplementary Materials
The following supporting information can be downloaded at the website of this paper posted on Preprints.org.
Author Contributions
Conceptualization: R.E.H., H.-R.W., J.P.K., T.E.B., G.K., A.W. Formal analysis: R.E.H., H.-R.W., J.P.K., T.E.B., C.R.M., M.A.L., G.K., A.V.A., K.L., J.J.R., M.W.G., S.M., J.P.P., R.P., M.N., A.W. Investigation: R.E.H., H.-R.W., J.P.K., T.E.B., C.R.M., M.A.L., G.K., A.V.A., K.L., J.J.R., M.W.G., S.M., J.P.P., R.P., M.N., A.W. Writing-original draft: R.E.H., H.-R.W., J.P.K., T.E.B., C.R.M., M.A.L., G.K., A.W. Writing-review and editing: R.E.H., H.-R.W., J.P.K., C.R.M., M.A.L., G.K., A.W. Funding acquisition: R.E.H., H.-R.W., J.P.K., G.K., A.W. All authors reviewed and approved this manuscript.
Funding
Comet Research Group (grant number: 23-06), National Science Foundation (grant number: EAR1343908; EAR1464014), United States Department of Energy (grant number: DE-FG02-05ER15637), Czech Science Foundation (grant number: 23-06).
Data Availability Statement
All essential data are published here. No more sample material is available from the authors for Trinity, Joe-1/4, or Meteor Crater.
Acknowledgments
We gratefully acknowledge the long-standing contributions of co-author Ted Bunch, a highly valued colleague and contributor, who passed away during the writing of this manuscript. We thank Yiming Zhang, University of California, Berkeley, for contributing to EBSD analyses. We also gratefully acknowledge Jim Eckles and Byron Ristvet for providing crucial samples from the Trinity and the Joe-1/4 site, respectively (for details, see Appendix, Methods). We greatly appreciate constructive comments from Maartje Hamers, Universiteit Utrecht; Susan Kieffer, the University of Illinois at Urbana-Champaign; and Peter Schultz, Brown University. We also appreciate the use of the CAMCOR facilities at the University of Oregon and the Electron Microscopy and Surface Analysis Laboratory at the University of Utah, along with assistance from EDAX, LLC. This work made use of the University of Utah USTAR shared facilities supported, in part, by the MRSEC Program of the NSF under Award #DMR-1121252. H.-R.W. is appreciative of the support from NSF (Grants EAR 1343908 and EAR1464014) and DOE (Grant DE-FG02-05ER15637). G.K. is appreciative of the support from the Czech Science Foundation (Grant 23-06075S). We also thank the thousands of donors and members of the Comet Research Group, who have been crucial in making this research possible. In particular, we thank Eugene Jhong who provided substantial gifts to the University of South Carolina and the University of California, Santa Barbara in support of this research.
Conflicts of Interest
The Comet Research Group (CRG), a 501(c) (3) nonprofit charitable organization provided research funding. J.P.K., M.A.L., C.R.M., and A.W. volunteer their time as cofounders and directors of CRG. No co-author receives a salary, compensation, stock, or any other financial benefit from CRG, except for co-authors A.W. and M.A.L., who benefit from tax deductions for donations to CRG. A.W. is a co-author of a book unrelated to the focus of this study; he donates all proceeds to CRG. A.W. is a Guest Editor of Geosciences but recused himself and played no role in the review and acceptance of this submission.
Abbreviations
CL: cathodoluminescence; DLs: tectonic deformation lamellae; EBSD: electron backscatter diffraction; EDS: energy-dispersive x-ray spectroscopy; EPI: epi-illumination microscopy; FFT: fast-Fourier transform; FIB: focused ion beam milling; GPa: gigapascal; OPT: optical microscopy; PDFs: planar deformation features; PFs: planar fractures; SEM: scanning electron microscopy; STEM: scanning transmission electron microscopy; TEM: transmission electron microscopy.
References
- Eby, G.N.; Charnley, N.; Pirrie, D.; Hermes, R.; Smoliga, J.; Rollinson, G. Trinitite redux: Mineralogy and petrology. American Mineralogist 2015, 100, 427–441. [Google Scholar] [CrossRef]
- Lussier, A.J.; Rouvimov, S.; Burns, P.C.; Simonetti, A. Nuclear-blast induced nanotextures in quartz and zircon within Trinitite. American Mineralogist 2017, 102, 445–460. [Google Scholar] [CrossRef]
- Wannier, M.M.; de Urreiztieta, M.; Wenk, H.-R.; Stan, C.V.; Tamura, N.; Yue, B. Fallout melt debris and aerodynamically-shaped glasses in beach sands of Hiroshima Bay, Japan. Anthropocene 2019, 25, 100196. [Google Scholar] [CrossRef]
- Ebert, M.; Kowitz, A.; Schmitt, R.T.; Reimold, W.U.; Mansfeld, U.; Langenhorst, F. Localized shock-induced melting of sandstone at low shock pressures (< 17.5 GP a): An experimental study. Meteoritics & Planetary Science 2018, 53, 1633–1643. [Google Scholar]
- Fazio, A.; Pollok, K.; Langenhorst, F. Experimental evidence for mechanical Brazil twins as an indicator of low-pressure shock metamorphism (< 17.5 GPa). Geology 2018, 46, 787–790. [Google Scholar]
- Wilk, J.; Hamann, C.; Fazio, A.; Luther, R.; Hecht, L.; Langenhorst, F.; Kenkmann, T. Petrographic investigation of shatter cone melt films recovered from MEMIN impact experiments in sandstone and iSALE modeling of their formation boundary conditions. Meteoritics & Planetary Science 2018, 53, 1569–1593. [Google Scholar]
- Carl, E.R.; Mansfeld, U.; Liermann, H.P.; Danilewsky, A.; Langenhorst, F.; Ehm, L.; Trullenque, G.; Kenkmann, T. High-pressure phase transitions of α-quartz under nonhydrostatic dynamic conditions: A reconnaissance study at PETRA III. Meteoritics & Planetary Science 2017, 52, 1465–1474. [Google Scholar]
- French, B.M.; Koeberl, C. The convincing identification of terrestrial meteorite impact structures: What works, what doesn’t, and why. Earth-Science Reviews 2010, 98, 123–170. [Google Scholar] [CrossRef]
- Bohor, B.; Fisler, D.; Gratz, A.J. Distinguishing between shock and tectonic lamellae with the SEM. In Proceedings of the Lunar and Planetary Science Conference; 1995; p. 145. [Google Scholar]
- Koeberl, C.; Reimold, W.U.; Cooper, G.; Cowan, D.; Vincent, P.M. Aorounga and Gweni Fada impact structures, Chad: remote sensing, petrography, and geochemistry of target rocks. Meteoritics & Planetary Science 2005, 40, 1455–1471. [Google Scholar]
- Kowitz, A.; Schmitt, R.T.; Uwe Reimold, W.; Hornemann, U. The first MEMIN shock recovery experiments at low shock pressure (5–12.5 GPa) with dry, porous sandstone. Meteoritics & Planetary Science 2013, 48, 99–114. [Google Scholar]
- Reimold, W.U.; Crósta, A.P.; Hasch, M.; Kowitz, A.; Hauser, N.; Sanchez, J.P.; Simões, L.S.A.; de Oliveira, G.J.; Zaag, P.T. Shock deformation confirms the impact origin for the Cerro do Jarau, Rio Grande do Sul, Brazil, structure. Meteoritics & Planetary Science 2019, 54, 2384–2397. [Google Scholar]
- Reimold, W.U.; Koeberl, C. Impact structures in Africa: A review. Journal of African Earth Sciences 2014, 93, 57–175. [Google Scholar] [CrossRef]
- Gratz, A. Deformation in laboratory-shocked quartz. Journal of non-crystalline solids 1984, 67, 543–558. [Google Scholar] [CrossRef]
- Kowitz, A.; Güldemeister, N.; Schmitt, R.T.; Reimold, W.U.; Wünnemann, K.; Holzwarth, A. Revision and recalibration of existing shock classifications for quartzose rocks using low-shock pressure (2.5–20 GP a) recovery experiments and mesoscale numerical modeling. Meteoritics & Planetary Science 2016, 51, 1741–1761. [Google Scholar]
- Buchanan, P.; Reimold, W. Planar deformation features and impact glass in inclusions from the Vredefort Granophyre, South Africa. Meteoritics & Planetary Science 2002, 37, 807–822. [Google Scholar]
- Goltrant, O.; Cordier, P.; Doukhan, J.-C. Planar deformation features in shocked quartz; a transmission electron microscopy investigation. Earth and Planetary Science Letters 1991, 106, 103–115. [Google Scholar] [CrossRef]
- Christie, J.; Ardell, A. Substructures of deformation lamellae in quartz. Geology 1974, 2, 405–408. [Google Scholar] [CrossRef]
- Gratz, A.J.; Fisler, D.K.; Bohor, B.F. Distinguishing shocked from tectonically deformed quartz by the use of the SEM and chemical etching. Earth and Planetary Science Letters 1996, 142, 513–521. [Google Scholar] [CrossRef]
- Gratz, A.J.; Tyburczy, J.; Christie, J.; Ahrens, T.; Pongratz, P. Shock metamorphism of deformed quartz. Physics and chemistry of minerals 1988, 16, 221–233. [Google Scholar] [CrossRef]
- Hamers, M.; Drury, M. Scanning electron microscope-cathodoluminescence (SEM-CL) imaging of planar deformation features and tectonic deformation lamellae in quartz. Meteoritics & Planetary Science 2011, 46, 1814–1831. [Google Scholar]
- Stöffler, D.; Gault, D.; Wedekind, J.; Polkowski, G. Experimental hypervelocity impact into quartz sand: Distribution and shock metamorphism of ejecta. Journal of Geophysical Research 1975, 80, 4062–4077. [Google Scholar] [CrossRef]
- Stöffler, D.; Langenhorst, F. Shock metamorphism of quartz in nature and experiment: I. Basic observation and theory. Meteoritics 1994, 29, 155–181. [Google Scholar] [CrossRef]
- Vernooij, M.G.; Langenhorst, F. Experimental reproduction of tectonic deformation lamellae in quartz and comparison to shock-induced planar deformation features. Meteoritics & Planetary Science 2005, 40, 1353–1361. [Google Scholar]
- Langenhorst, F. Shock metamorphism of some minerals: Basic introduction and microstructural observations. Bulletin of the Czech Geological Survey 2002, 77, 265–282. [Google Scholar]
- Ernstson, K.; Mayer, W.; Neumair, A.; Rappenglück, B.; Sudhaus, D. The Chiemgau crater strewn field: Evidence of a Holocene large impact event in Southeast Bavaria, Germany. Журнал Сибирскoгo федеральнoгo университета. Техника и технoлoгии 2010, 3, 72–103. [Google Scholar]
- Ferriere, L.; Osinski, G.R. Shock metamorphism. In Impact Cratering: Processes and Products, Osinski, G.R., Pierazzo, E., Eds.; John Wiley & Sons: 2012; pp. 106-124.
- Christie, J.; Griggs, D.; Carter, N. Experimental evidence of basal slip in quartz. The Journal of Geology 1964, 72, 734–756. [Google Scholar] [CrossRef]
- Christie, J.M.; Raleigh, C.B. The origin of deformation lamellae in quartz. American Journal of Science 1959, 257, 385–407. [Google Scholar] [CrossRef]
- McLaren, A.; Retchford, J.; Griggs, D.; Christie, J. Transmission electron microscope study of Brazil Twins and dislocations experimentally produced in natural quartz. Physica Status Solidi (B) 1967, 19, 631–644. [Google Scholar] [CrossRef]
- McLaren, A.; Turner, R.; Boland, J.; Hobbs, B. Dislocation structure of the deformation lamellae in synthetic quartz; a study by electron and optical microscopy. Contributions to Mineralogy and Petrology 1970, 29, 104–115. [Google Scholar] [CrossRef]
- Kieffer, S.W. Shock metamorphism of the Coconino sandstone at Meteor Crater, Arizona. Journal of Geophysical Research 1971, 76, 5449–5473. [Google Scholar] [CrossRef]
- Kieffer, S.W.; Phakey, P.P.; Christie, J.M. Shock processes in porous quartzite: Transmission electron microscope observations and theory. Contributions to Mineralogy and Petrology 1976, 59, 41–93. [Google Scholar] [CrossRef]
- Ernstson, K. Evidence of meteorite impact-induced thermal shock in quartz. In Proceedings of the Lunar and Planetary Science Conference; 2017; p. 1423. [Google Scholar]
- Ernstson, K.; Bauer, F.; Hiltl, M. A Prominent Iron Silicides Strewn Field and Its Relation to the Bronze Age/Iron Age Chiemgau Meteorite Impact Event (Germany). Earth 2023, 12, 26–40. [Google Scholar] [CrossRef]
- Ernstson, K.; Sideris, C.; Liritzis, I.; Neumair, A. The Chiemgau meteorite impact signature of the Stöttham archaeological site (Southeast Germany). Mediterranean Archaeology & Archaeometry 2012, 12, 249–259. [Google Scholar]
- Ernstson, K. Meteorite impact spallation: from mega-to micro-scale. Available online: http://www.impact-structures.com/impact-educational/meteorite-impact-spallation-from-mega-to-micro-scale/ (accessed on May 3, 2023).
- Stöffler, D. Glasses formed by hypervelocity impact. Journal of Non-Crystalline Solids 1984, 67, 465–502. [Google Scholar] [CrossRef]
- Stöffler, D.; Grieve, R. Metamorphic Rocks: A Classification and Glossary of Terms, Recommendation of the International Union of Geological Sciences. 2007.
- Wenk, H.-R.; Chandler, B.C.; Chen, K.; Li, Y.; Tamura, N.; Yu, R. Residual lattice strain in quartzites as a potential palaeo-piezometer. Geophysical Journal International 2020, 222, 1363–1378. [Google Scholar] [CrossRef]
- Wenk, H.-R.; Janssen, C.; Kenkmann, T.; Dresen, G. Mechanical twinning in quartz: shock experiments, impact, pseudotachylites and fault breccias. Tectonophysics 2011, 510, 69–79. [Google Scholar] [CrossRef]
- Wenk, H.-R.; Lonardelli, I.; Vogel, S.; Tullis, J. Dauphiné twinning as evidence for an impact origin of preferred orientation in quartzite: an example from Vredefort, South Africa. Geology 2005, 33, 273–276. [Google Scholar] [CrossRef]
- Wenk, H.-R.; Yu, R.; Vogel, S.; Vasin, R. Preferred orientation of quartz in metamorphic rocks from the Bergell Alps. Minerals 2019, 9, 277. [Google Scholar] [CrossRef]
- Barber, D.; Wenk, H.-R. Dauphiné twinning in deformed quartzites: implications of an in situ TEM study of the α-β phase transformation. Physics and Chemistry of Minerals 1991, 17, 492–502. [Google Scholar] [CrossRef]
- Houser, L.; Ault, A.; Newell, D.; Evans, J.; Shen, F.A.; Van Devener, B. Nanoscale textural and chemical evolution of silica fault mirrors in the Wasatch fault damage zone, Utah, USA. Geochemistry, Geophysics, Geosystems 2021, 22, e2020GC009368. [Google Scholar] [CrossRef]
- Sharp, N.; McDonough, W.F.; Ticknor, B.W.; Ash, R.D.; Piccoli, P.M.; Borg, D.T. Rapid analysis of trinitite with nuclear forensic applications for post-detonation material analyses. Journal of Radioanalytical and Nuclear Chemistry 2014, 302, 57–67. [Google Scholar] [CrossRef]
- Donohue, P.H.; Simonetti, A. Vesicle Size Distribution as a Novel Nuclear Forensics Tool. PloS One 2016, 11, e0163516. [Google Scholar] [CrossRef]
- Day, J.M.; Moynier, F.; Meshik, A.P.; Pradivtseva, O.V.; Petit, D.R. Evaporative fractionation of zinc during the first nuclear detonation. Sci Adv 2017, 3, e1602668. [Google Scholar] [CrossRef]
- Bindi, L.; Kolb, W.; Eby, G.N.; Asimow, P.D.; Wallace, T.C.; Steinhardt, P.J. Accidental synthesis of a previously unknown quasicrystal in the first atomic bomb test. Proc Nat Acad Sci 2021, 118, e2101350118. [Google Scholar] [CrossRef]
- Kowitz, A.; Güldemeister, N.; Reimold, W.; Schmitt, R.; Wünnemann, K. Diaplectic quartz glass and SiO2 melt experimentally generated at only 5 GPa shock pressure in porous sandstone: Laboratory observations and meso-scale numerical modeling. Earth and Planetary Science Letters 2013, 384, 17–26. [Google Scholar] [CrossRef]
- Bunch, T.E. A study of shock-induced microstructures and solid state transformations of several minerals from explosion craters. University of Pittsburgh, Pittsburgh, 1966.
- Selby, H.D.; Hanson, S.K.; Meininger, D.; Oldham, W.J.; Kinman, W.S.; Miller, J.L.; Reilly, S.D.; Wende, A.M.; Berger, J.L.; Inglis, J. A New Yield Assessment for the Trinity Nuclear Test, 75 Years Later. Nuclear Technology 2021, 207, 321–325. [Google Scholar] [CrossRef]
- Hermes, R.E.; Strickfaden, W.B. A New Look at Trinitite. Nucl Weap J 2005, 2, 2–7. [Google Scholar]
- Bunch, T.E.; Hermes, R.E.; Moore, A.M.; Kennett, D.J.; Weaver, J.C.; Wittke, J.H.; DeCarli, P.S.; Bischoff, J.L.; Hillman, G.C.; Howard, G.A. Very high-temperature impact melt products as evidence for cosmic airbursts and impacts 12,900 years ago. Proc Nat Acad Sci 2012, 109, E1903–E1912. [Google Scholar] [CrossRef]
- Blenkinsop, T. Shock-induced microstructures and shock metamorphism. Deformation Microstructures and Mechanisms in Minerals and Rocks 2000, 80–89. [Google Scholar]
- Bohor, B.; Betterton, W.; Krogh, T. Impact-shocked zircons: discovery of shock-induced textures reflecting increasing degrees of shock metamorphism. Earth and Planetary Science Letters 1993, 119, 419–424. [Google Scholar] [CrossRef]
- Madden, M.E.E.; Kring, D.A.; Bodnar, R.J. Shock reequilibration of fluid inclusions in Coconino sandstone from Meteor Crater, Arizona. Earth and Planetary Science Letters 2006, 241, 32–46. [Google Scholar] [CrossRef]
- Langenhorst, F. Shock experiments on pre-heated α-and β-quartz: II. X-ray and TEM investigations. Earth and Planetary Science Letters 1994, 128, 683–698. [Google Scholar] [CrossRef]
- Hamers, M.F.; Pennock, G.M.; Herwegh, M.; Drury, M.R. Distinction between amorphous and healed planar deformation features in shocked quartz using composite color scanning electron microscope cathodoluminescence (SEM-CL) imaging. Meteoritics & Planetary Science 2016, 51, 1914–1931. [Google Scholar]
- MST. [ED] Electron Diffraction-Quartz Glass. Available online: https://www.mst.or.jp/Portals/0/en/en_ed.html (accessed on December 3, 2022).
- Gleason, A.; Bolme, C.; Lee, H.; Nagler, B.; Galtier, E.; Kraus, R.; Sandberg, R.; Yang, W.; Langenhorst, F.; Mao, W. Time-resolved diffraction of shock-released SiO2 and diaplectic glass formation. Nature Communications 2017, 8, 1–6. [Google Scholar] [CrossRef]
- Eckert, J.; Gourdon, O.; Jacob, D.E.; Meral, C.; Monteiro, P.J.; Vogel, S.C.; Wirth, R.; Wenk, H.-R. Ordering of water in opals with different microstructures. European Journal of Mineralogy 2015, 27, 203–213. [Google Scholar] [CrossRef]
- Hamers, M.; Pennock, G.; Drury, M. Scanning electron microscope cathodoluminescence imaging of subgrain boundaries, twins and planar deformation features in quartz. Physics and Chemistry of Minerals 2017, 44, 263–275. [Google Scholar] [CrossRef]
- Kalceff, M.A.S.; Phillips, M.R.; Moon, A.R.; Kalceff, W. Cathodoluminescence microcharacterisation of silicon dioxide polymorphs. In Cathodoluminescence in Geosciences; Springer: 2000; pp. 193-224.
- Hamers, M.F. Identifying shock microstructures in quartz from terrestrial impacts: new scanning electron microscopy methods; UU Department of Earth Sciences: 2013.
- French, B.M. Traces of Catastrophe: A Handbook of Shock-Metamorphic Effects in Terrestrial Meteorite Impact Structures.; Lunar and Planetary Institute: Washington DC, 1998. [Google Scholar]
- Schubnikow, A.; Zinserling, K. Über die Schlag-und Druckfiguren und über die mechanischen Quarzzwillinge. Zeitschrift für Kristallographie-Crystalline Materials 1932, 83, 243–264. [Google Scholar] [CrossRef]
- Tullis, J. Quartz: preferred orientation in rocks produced by Dauphiné twinning. Science 1970, 168, 1342–1344. [Google Scholar] [CrossRef]
- Hacker, B.R.; Abers, G.A. Subduction Factory 3: An Excel worksheet and macro for calculating the densities, seismic wave speeds, and H2O contents of minerals and rocks at pressure and temperature. Geochemistry, Geophysics, Geosystems 2004, 5. [Google Scholar] [CrossRef]
- Chao, E.; Fahey, J.; Littler, J.; Milton, D. Stishovite, SiO2, a very high pressure new mineral from Meteor Crater, Arizona. Journal of Geophysical Research 1962, 67, 419–421. [Google Scholar] [CrossRef]
- El Goresy, A.; Dubrovinsky, L.; Sharp, T.G.; Chen, M. Stishovite and post-stishovite polymorphs of silica in the shergotty meteorite: their nature, petrographic settings versus theoretical predictions and relevance to Earth’s mantle. Journal of Physics and Chemistry of Solids 2004, 65, 1597–1608. [Google Scholar] [CrossRef]
- Martini, J. Coesite and stishovite in the Vredefort dome, South Africa. Nature 1978, 272, 715–717. [Google Scholar] [CrossRef]
- Fahey, J. Recovery of coesite and stishovite from Coconino sandstone of Meteor Crater, Arizona. American Mineralogist: Journal of Earth and Planetary Materials 1964, 49, 1643–1647. [Google Scholar]
- Melosh, H.J. Impact cratering: A geologic process. New York: Oxford University Press; Oxford: Clarendon Press, 1989. [Google Scholar]
- Ernstson, K.; Poßekel, J. Enigmatic Meteorite Impact Signature: Field Evidence and Ground Penetrating Radar (GPR) Measurements Suggest Megascopic Impact Spallation Features. In Proceedings of the AGU Fall Meeting Abstracts; 2019; pp. EP53F–2239. [Google Scholar]
- Ernstson, K.; Schulz-Hertlein, G.; Ernstson, T.; Poßekel, J. A Probable Holocene Meteorite Impact Crater Strewn Field in Lower Franconia (Germany): Evidence from Digital Terrain Models and Geophysical Surveys (GPR, Electrical Imaging, Geomagnetics). In Proceedings of the Fall Meeting 2022, 2022. [Google Scholar]
- Glasstone, S.; Dolan, P.J. The Effects of Nuclear Weapons, Third ed.; US Dept of Defense, U.S. Government Printing Office: Washington, DC, 1977. [Google Scholar]
- Ernstson, K.; Poßekel, J.; Rappenglück, M.A. Near-Ground Airburst Cratering: Petrographic and Ground Penetrating Radar (GPR) Evidence for a Possibly Enlarged Chiemgau Impact Event (Bavaria, SE-Germany). In Proceedings of the Lunar and Planetary Science Conference; 2020; p. 1231. [Google Scholar]
Figure 1.
Low-shock fractures in quartz. SEM backscatter electron (BSE) images of polished, thin-sectioned grains from shock experiments by Kowitz et al. [11] showing (A) original unshocked quartz grains; (B) grains with non-planar, intra-granular microfractures initially produced at 5 GPa; (C) grains shocked at 7.5 GPa. Red arrows mark the direction of the applied shock from the top of the images down; yellow arrows mark selected representative fractures. Adapted and cropped from Kowitz et al. [11] Used with permission.
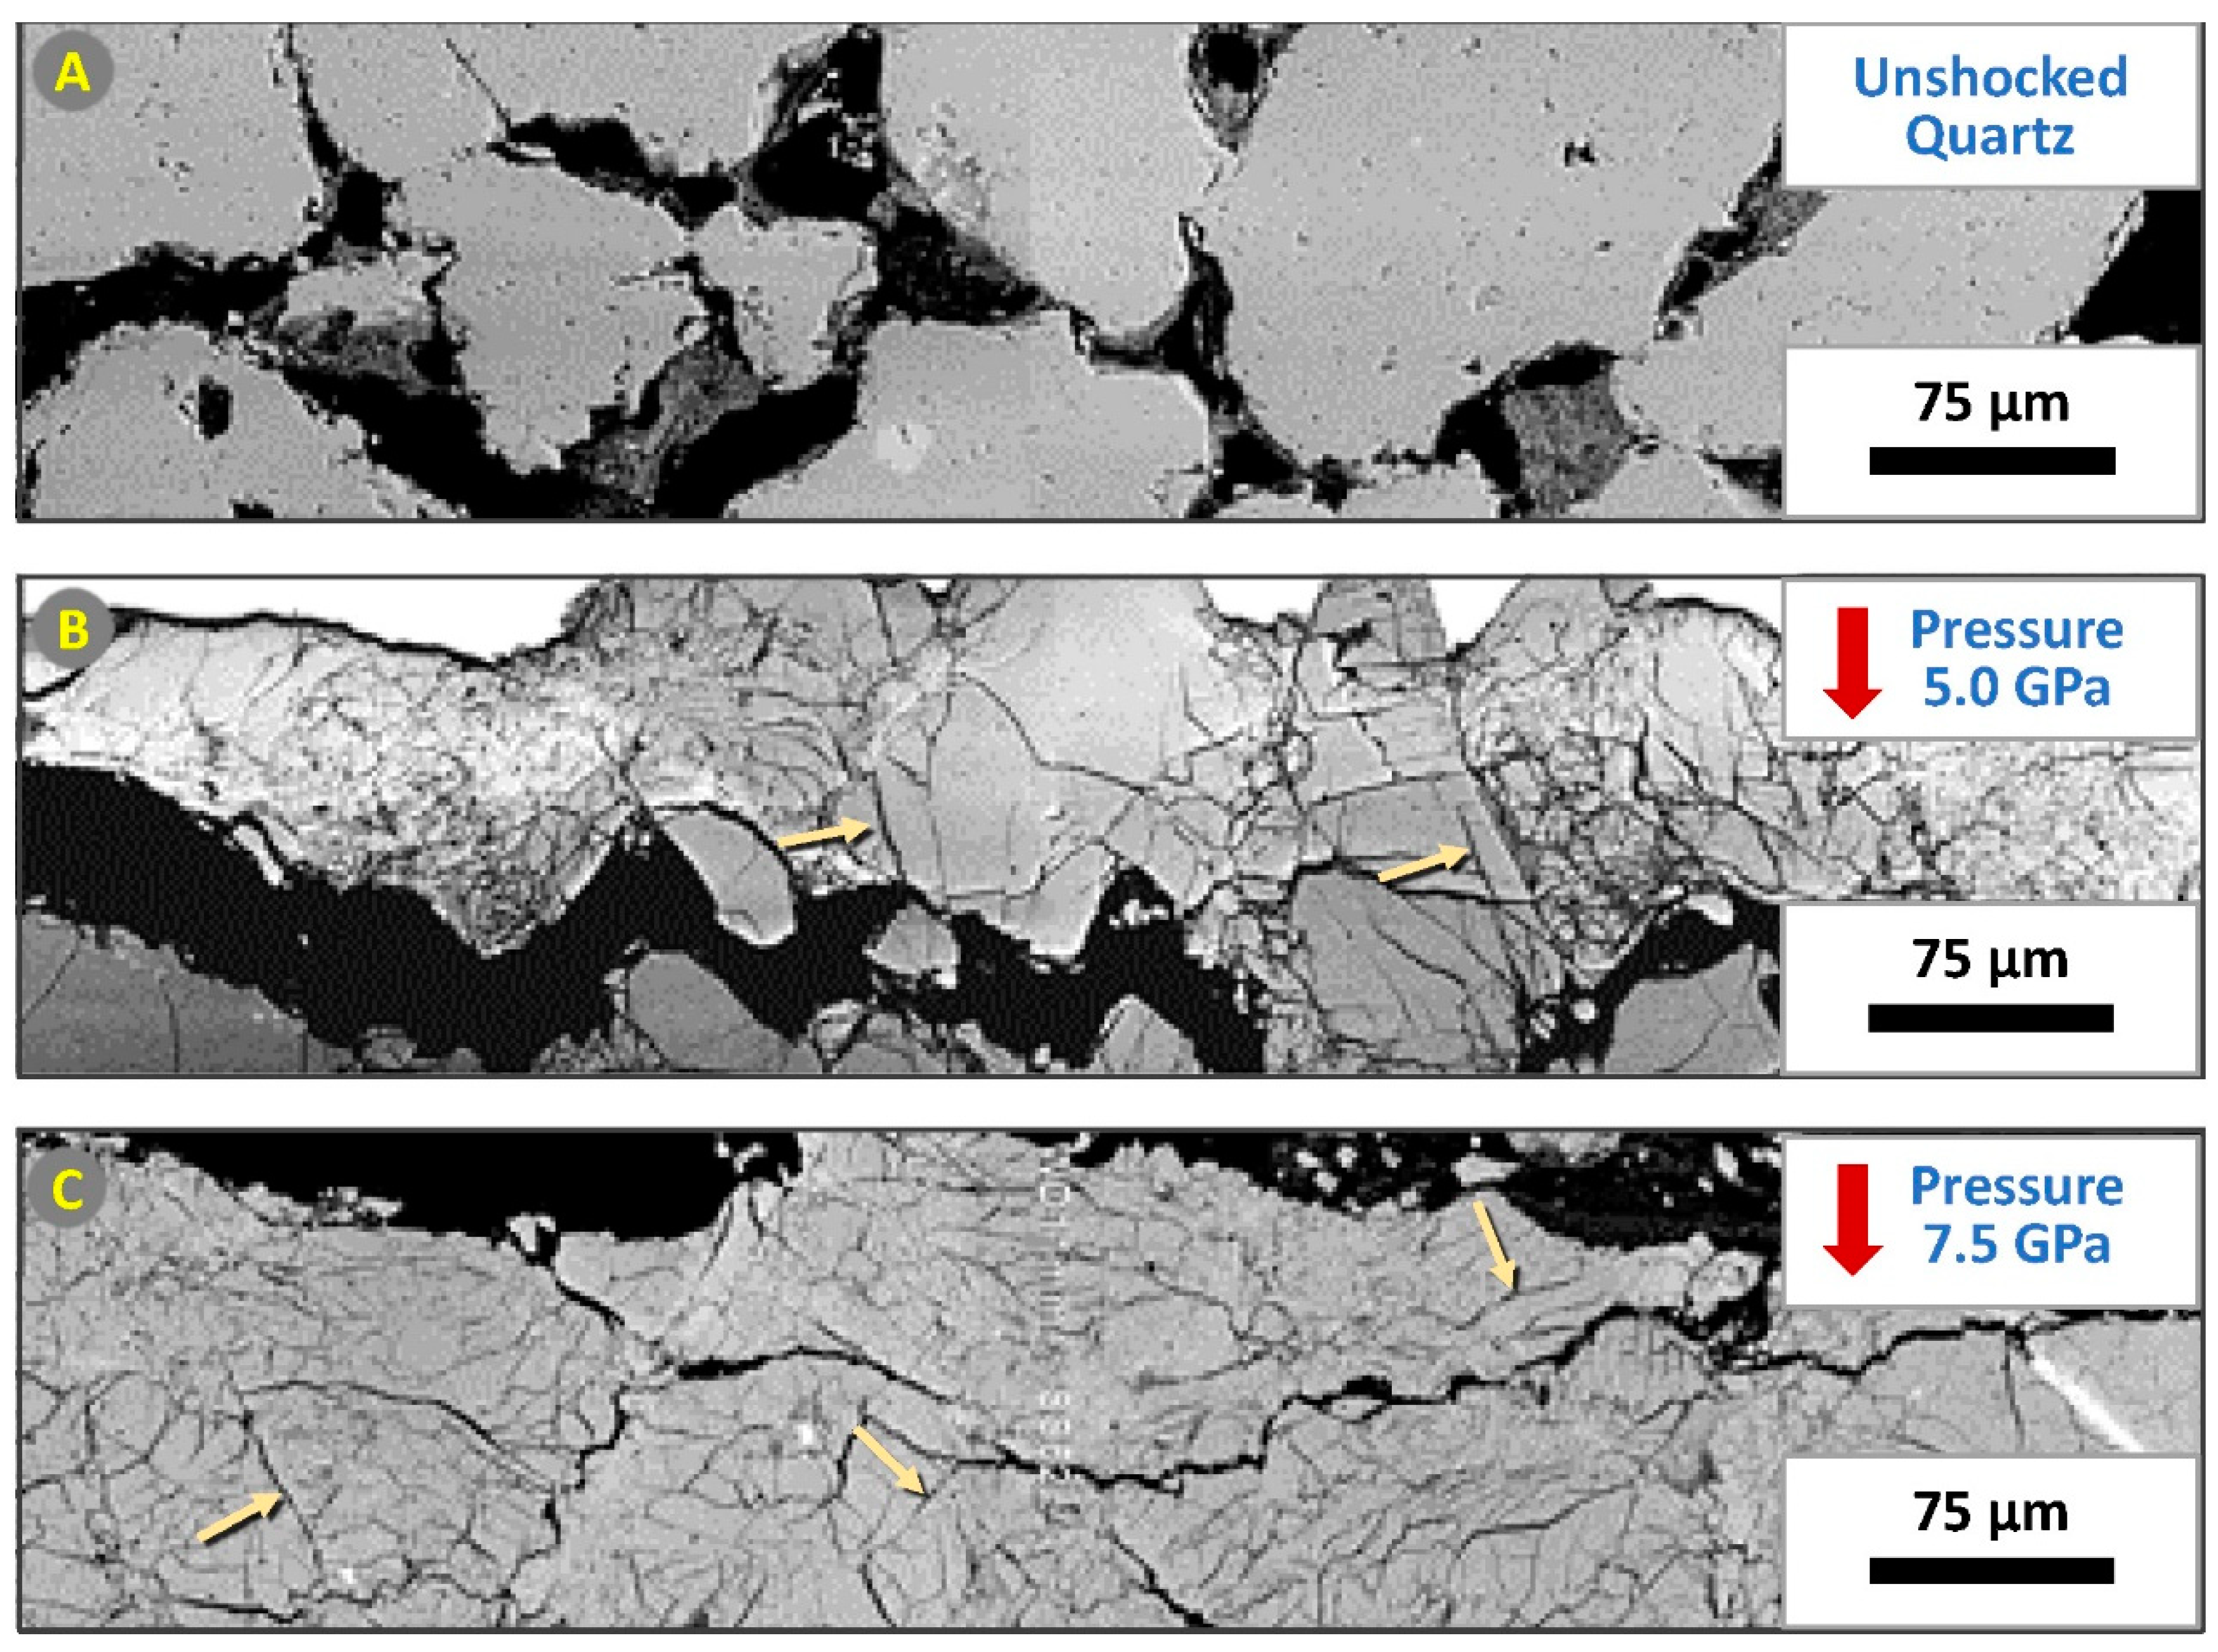
Figure 2.
Meteor Crater, Arizona. 1.2-km-wide impact crater near Flagstaff in northern Arizona [51]. The 180-m-deep crater is surrounded by an ejecta blanket elevated ~30 to 60 m above the surrounding plateau. Source: “Meteor Crater” 35.032206° N, 111.023988° W. Google Earth. Imagery date: 2022. Yellow pin marks the location of sample analyzed. Accessed: 10/08/2022. Permissions: https://about.google/brand-resource-center/products-and-services/geo-guidelines/.
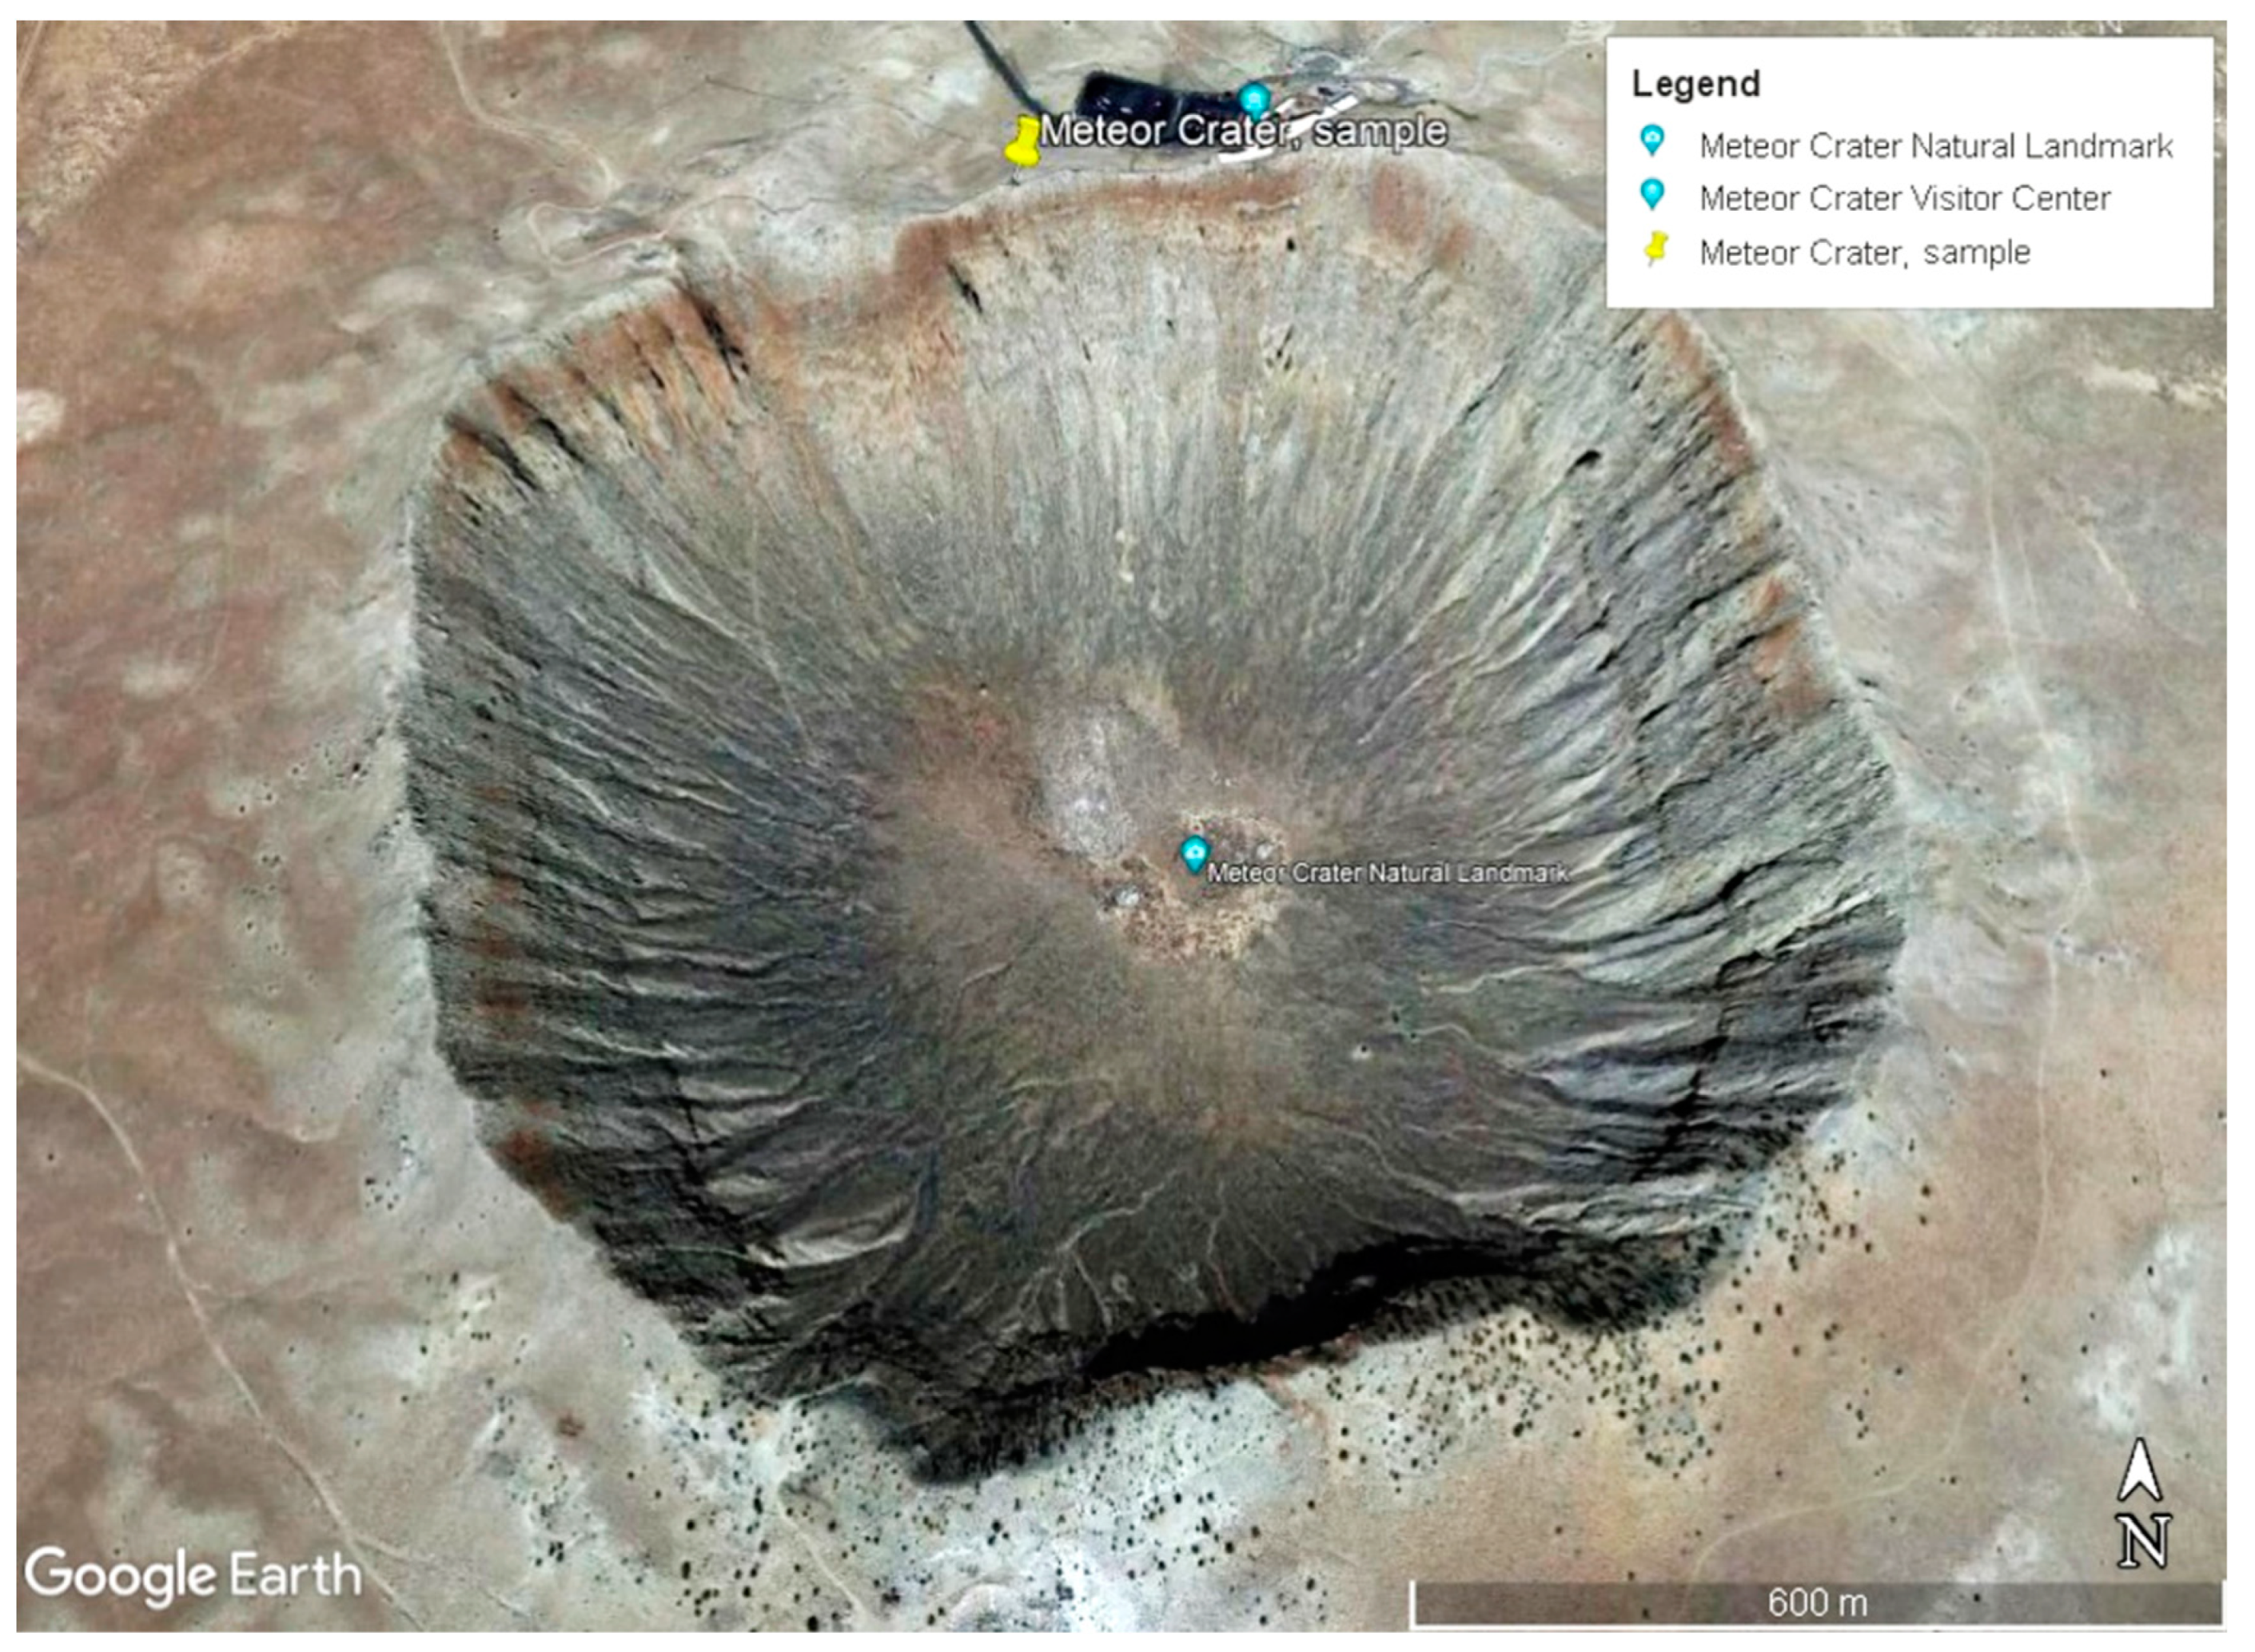
Figure 3.
Semipalatinsk Test Site, Kazakhstan. Photo of the general area for the detonations of Joe-1 and Joe-4 and other nuclear bomb craters. Source of base image: “Joe-1 test” 50.590664° N, 77.847319° E. Google Earth; Maxar Technologies. Imagery date: 2022. Accessed: 10/08/2022. Permissions: https://about.google/brand-resource-center/products-and-services/geo-guidelines/.
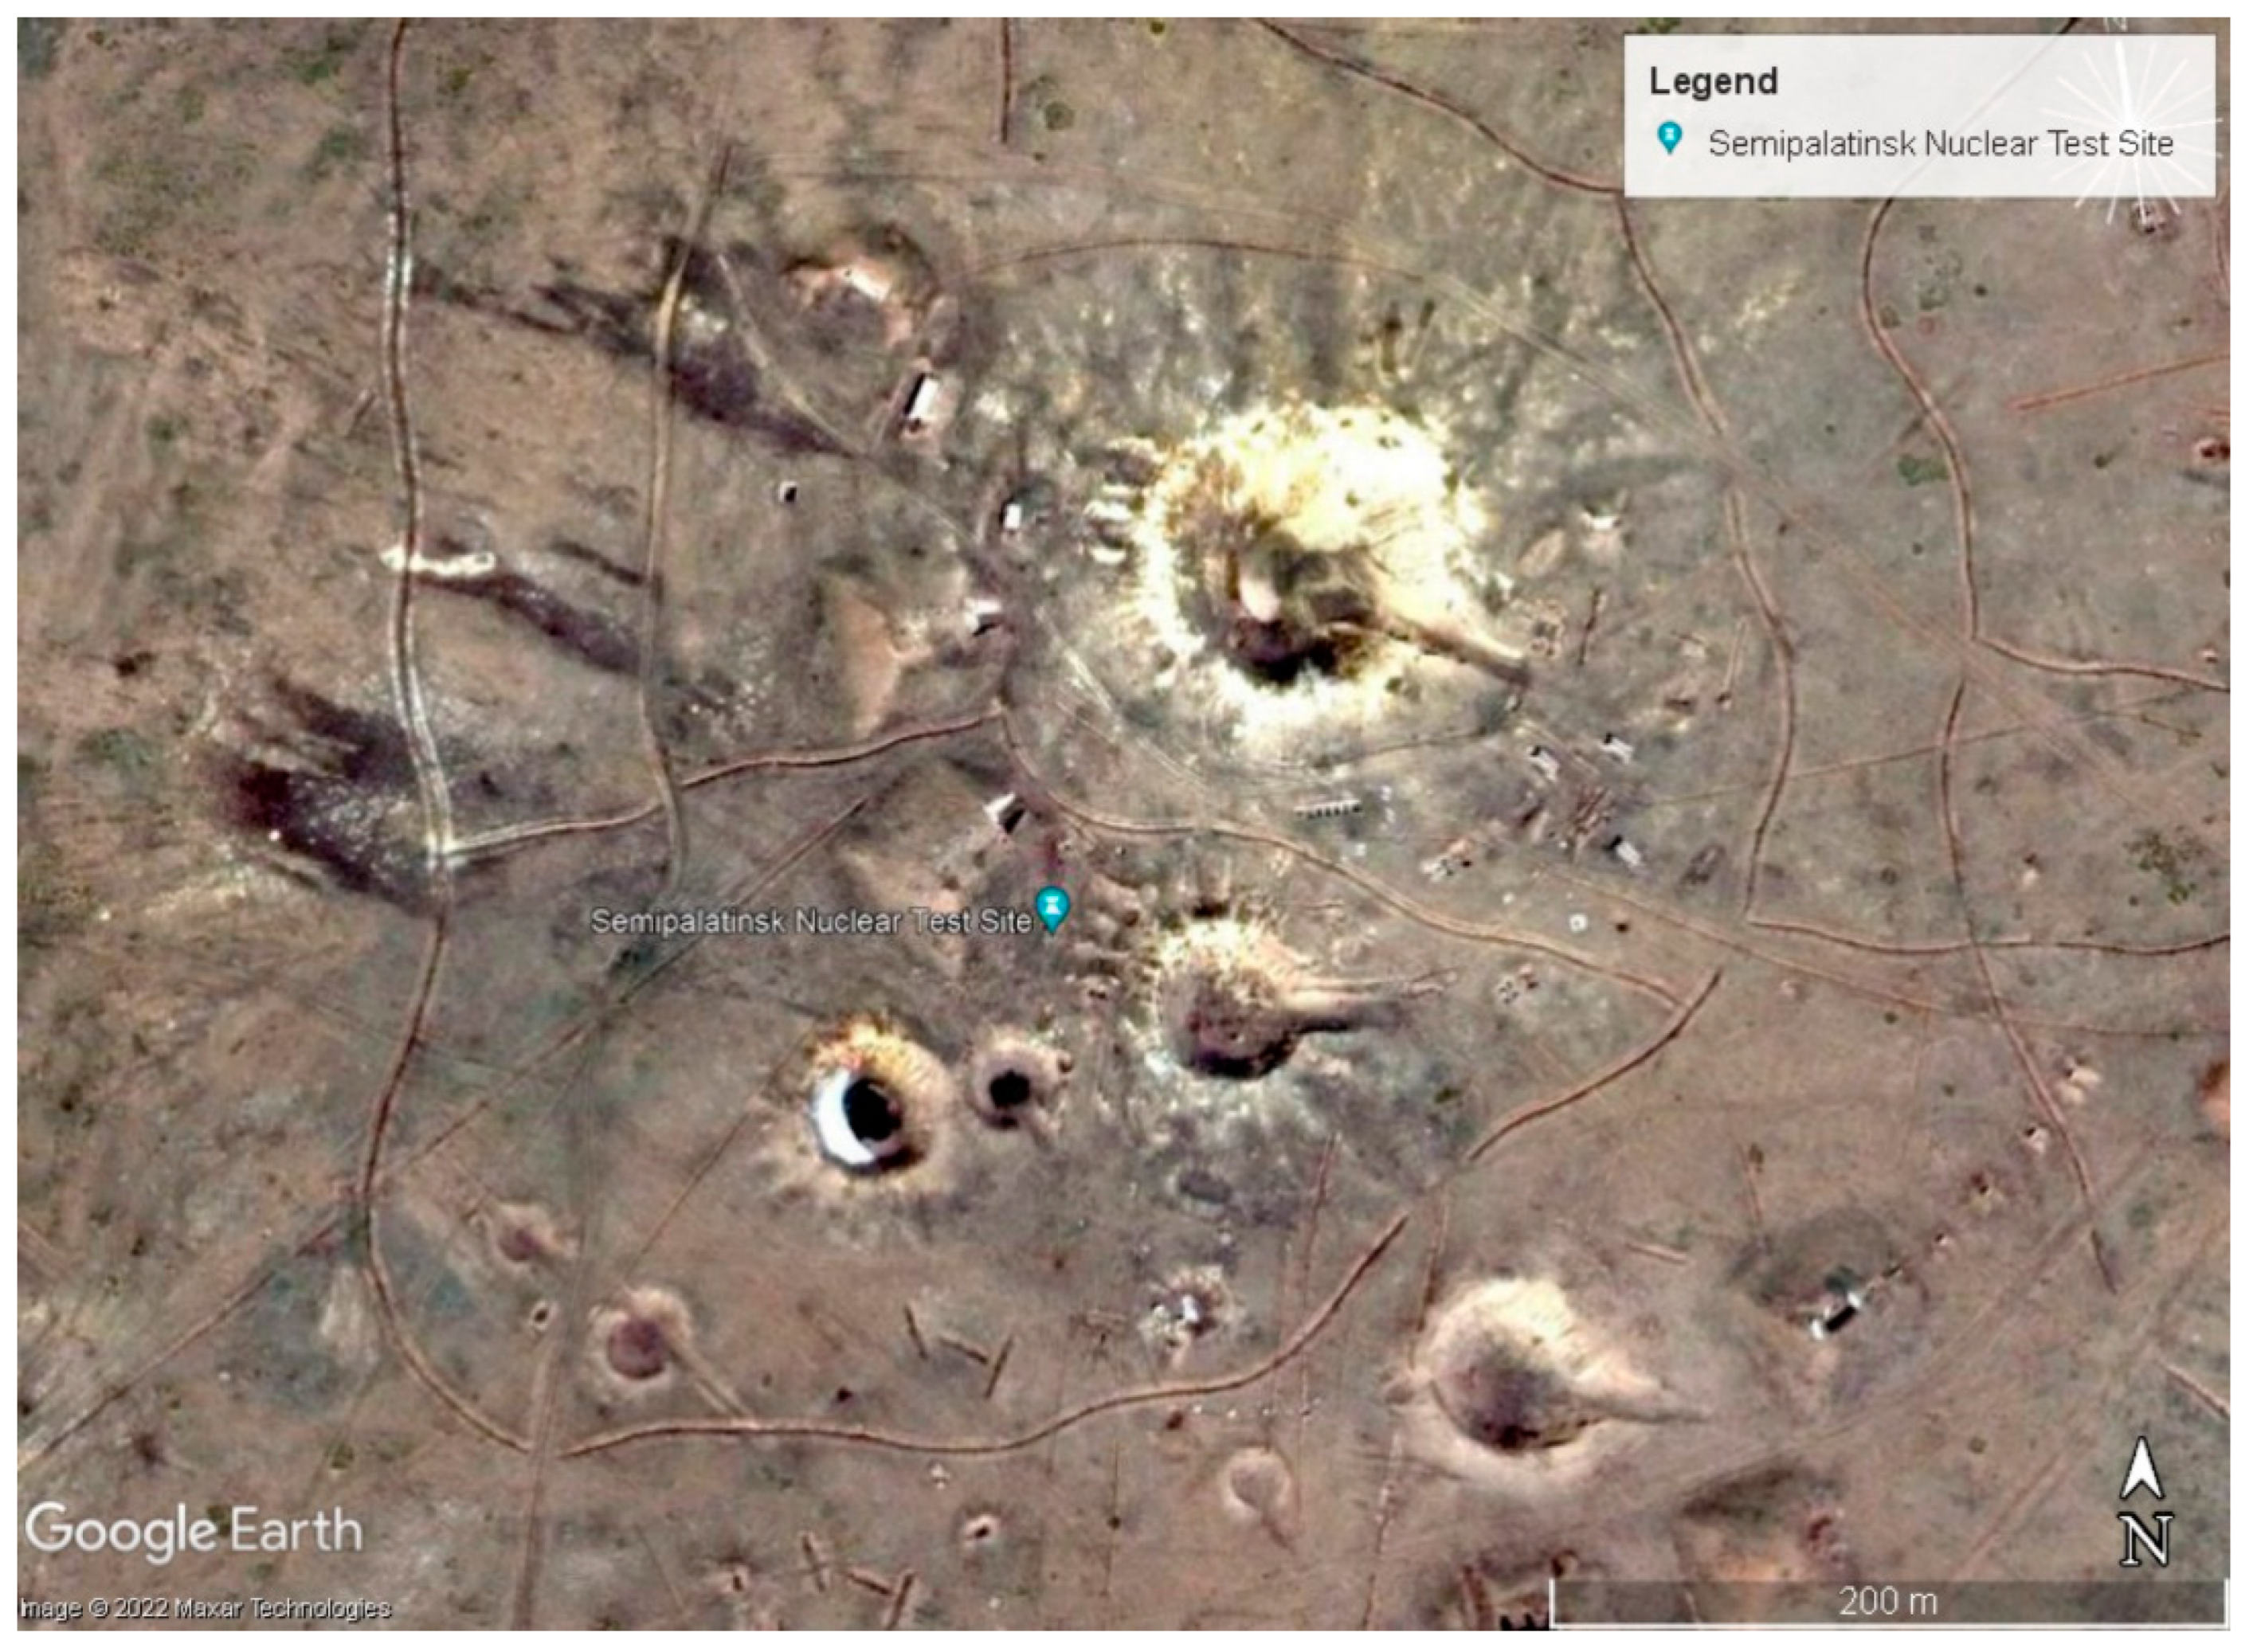
Figure 4.
Trinity Test Site in New Mexico. (A) Trinity ~300-meter-wide nuclear fireball, taken 25 ms after 24.8-kt detonation. Photo date: 16 July 1945. Courtesy of US Govt. Defense Threat Reduction Agency. Source: http://www.nucleararchive.com/Photos/Trinity/image8.shtml This work is in the public domain. (B) Post-detonation photograph. The photo was taken in July 1945 approximately 28 hours after the blast. The dark color represents trinitite glass within a ~400-meter-radius blast zone, which was discontinuously covered with ejected dark trinitite glass. Note that dark streaks of material radiate from ground zero. Source: “Trinity”, 33.68100° N, 106.4756° W. Google Earth. Imagery accessed: 10/08/2022. Permissions: https://about.google/brand-resource-center/products-and-services/geo-guidelines/.
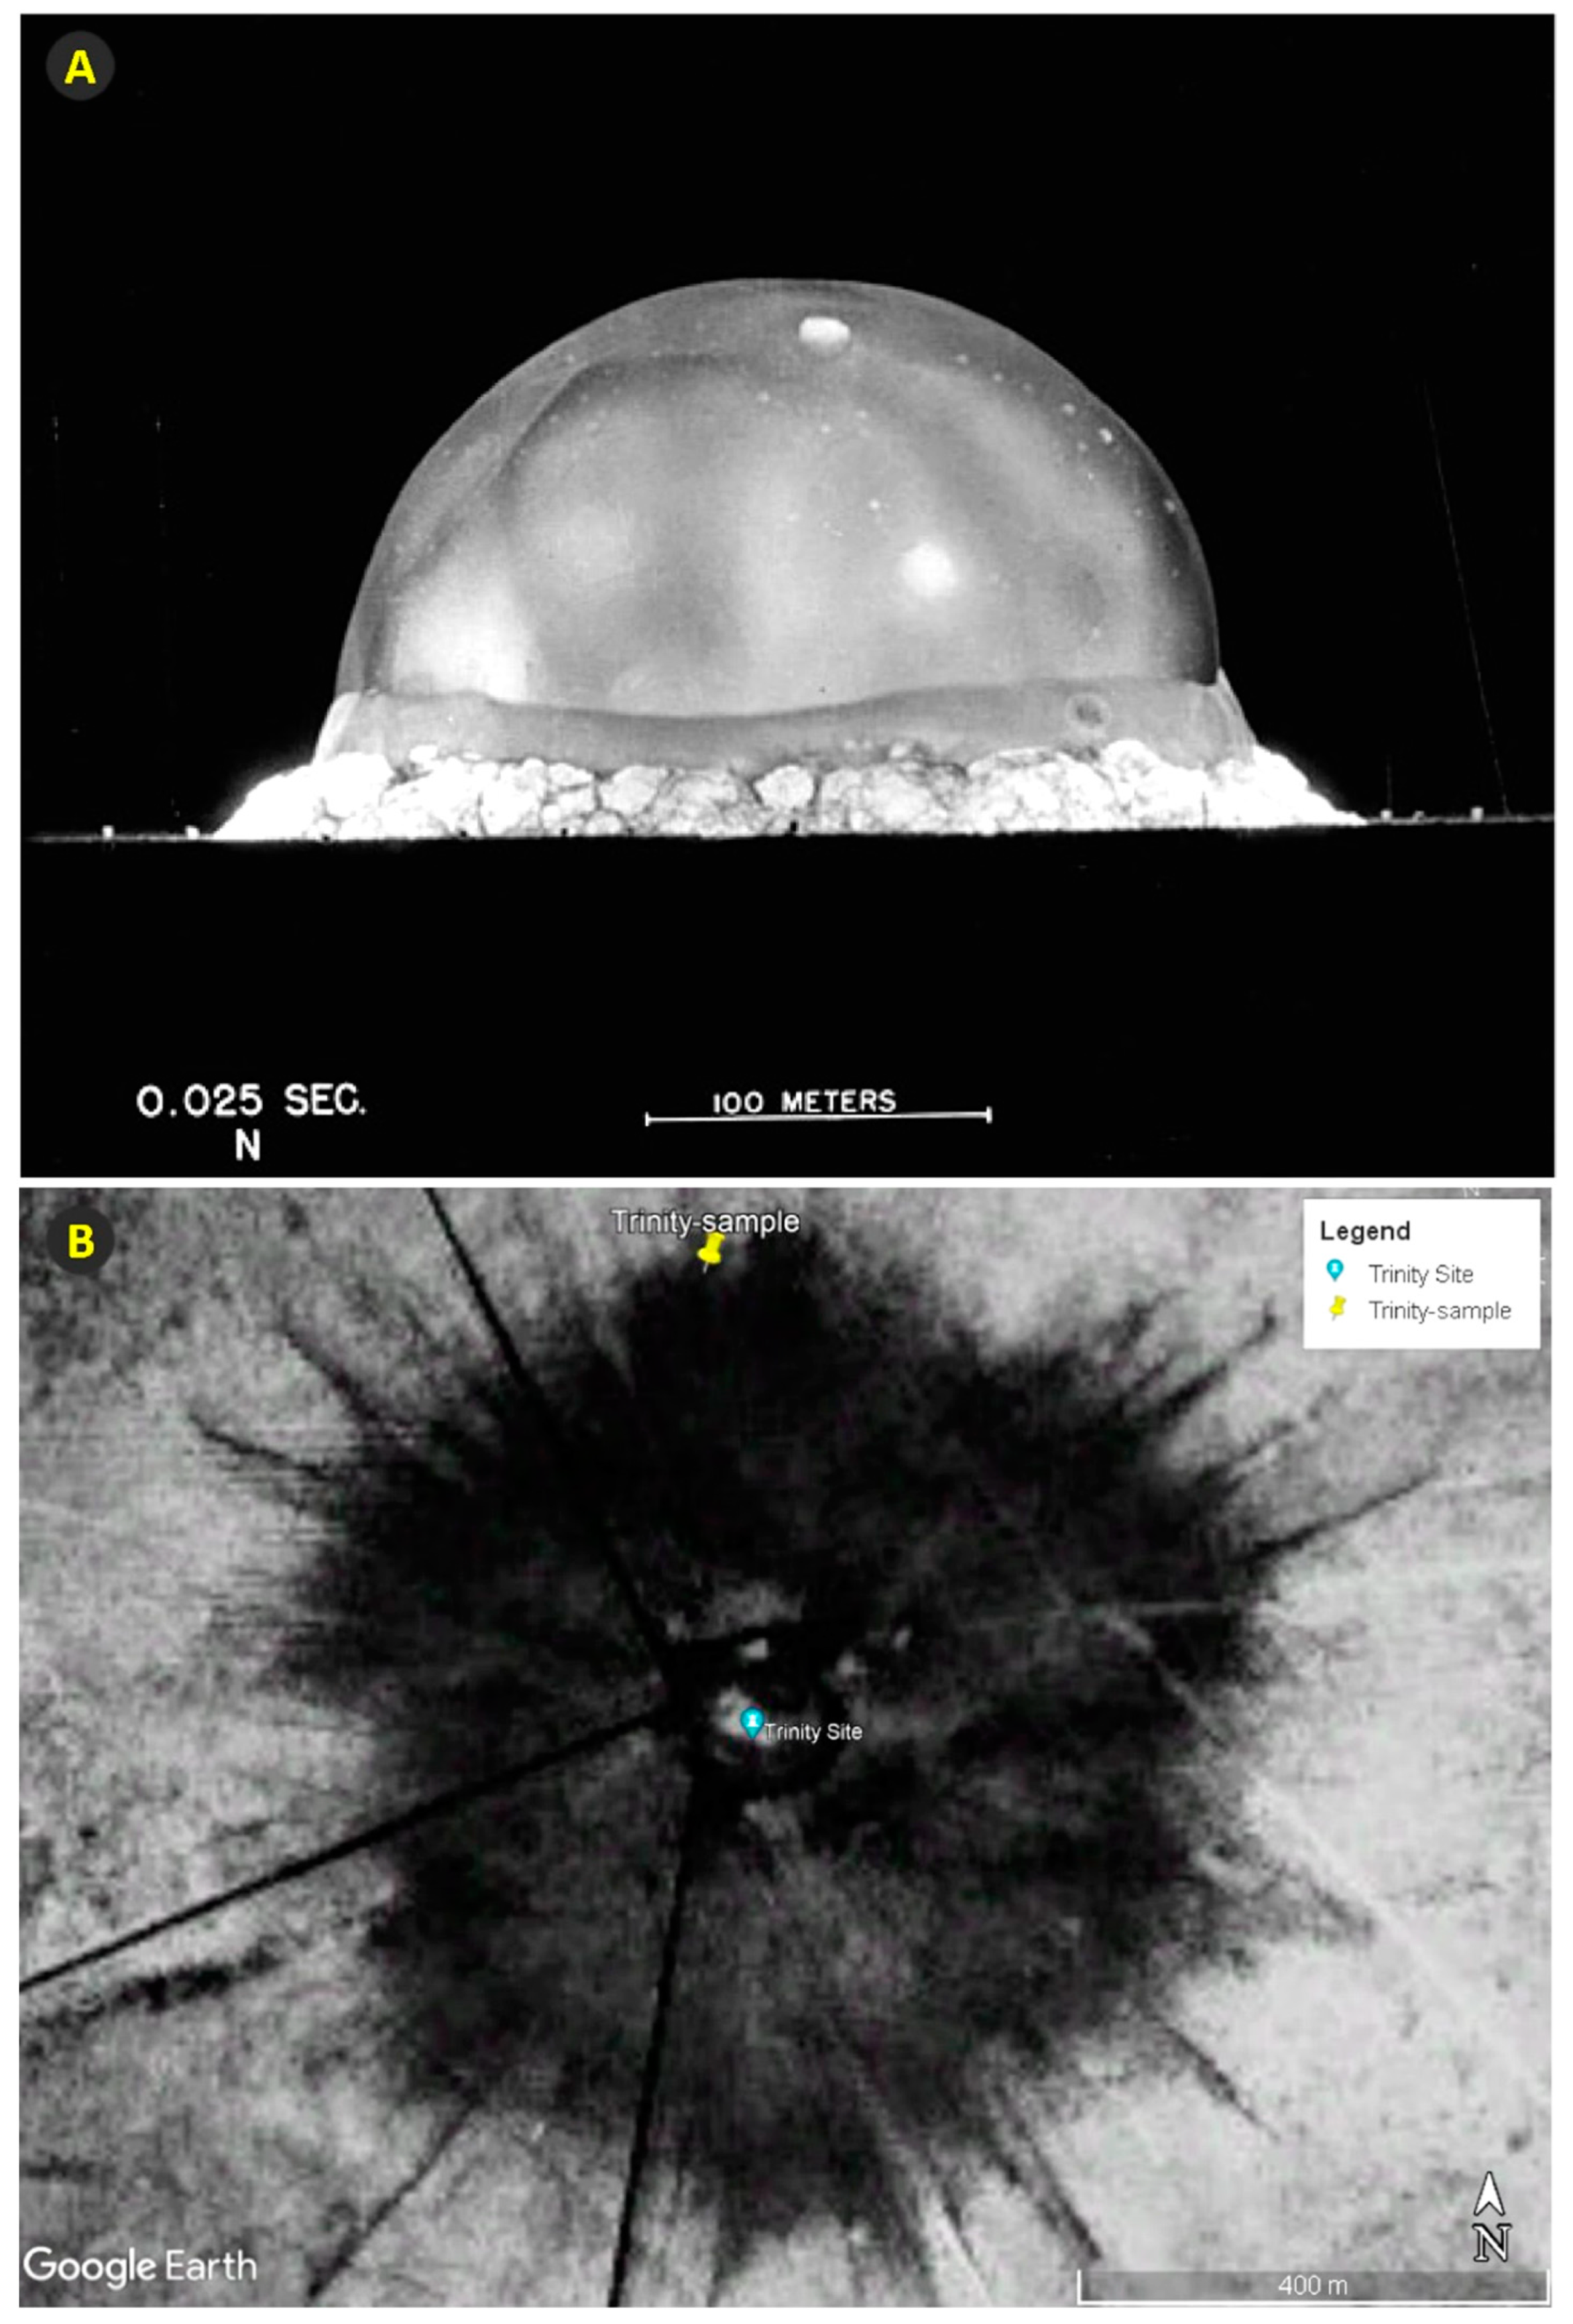
Figure 5.
Images of quartz grains. Optical microscopy (OPT), left panels A, D, G. Epi-illumination (EPI), middle panels B, E, H. Scanning electron microscopy (SEM), right panels C, F, I. (A-C) Grains from Meteor Crater, Arizona. (D-F) Grains from the Russian Joe-1/4 nuclear test. (G-I) Grains from the Trinity nuclear test site. Optical images (left column) were acquired under crossed polarizers. Yellow arrows indicate random representative shock fractures. Panels A and D show dark bands of undulose extinction between orange lines labeled “u”. The Trinity grain in panels G and H displays oriented pairs of shock fractures between blue arrows. Red arrows in panels C, F, and I (right column) mark sites from which micron-sized slices of the quartz grain were removed using the focused ion beam (FIB) and then analyzed using TEM and TEM-EDS. The red asterisks in the right column mark locations of CL and SEM-EDS analyses.
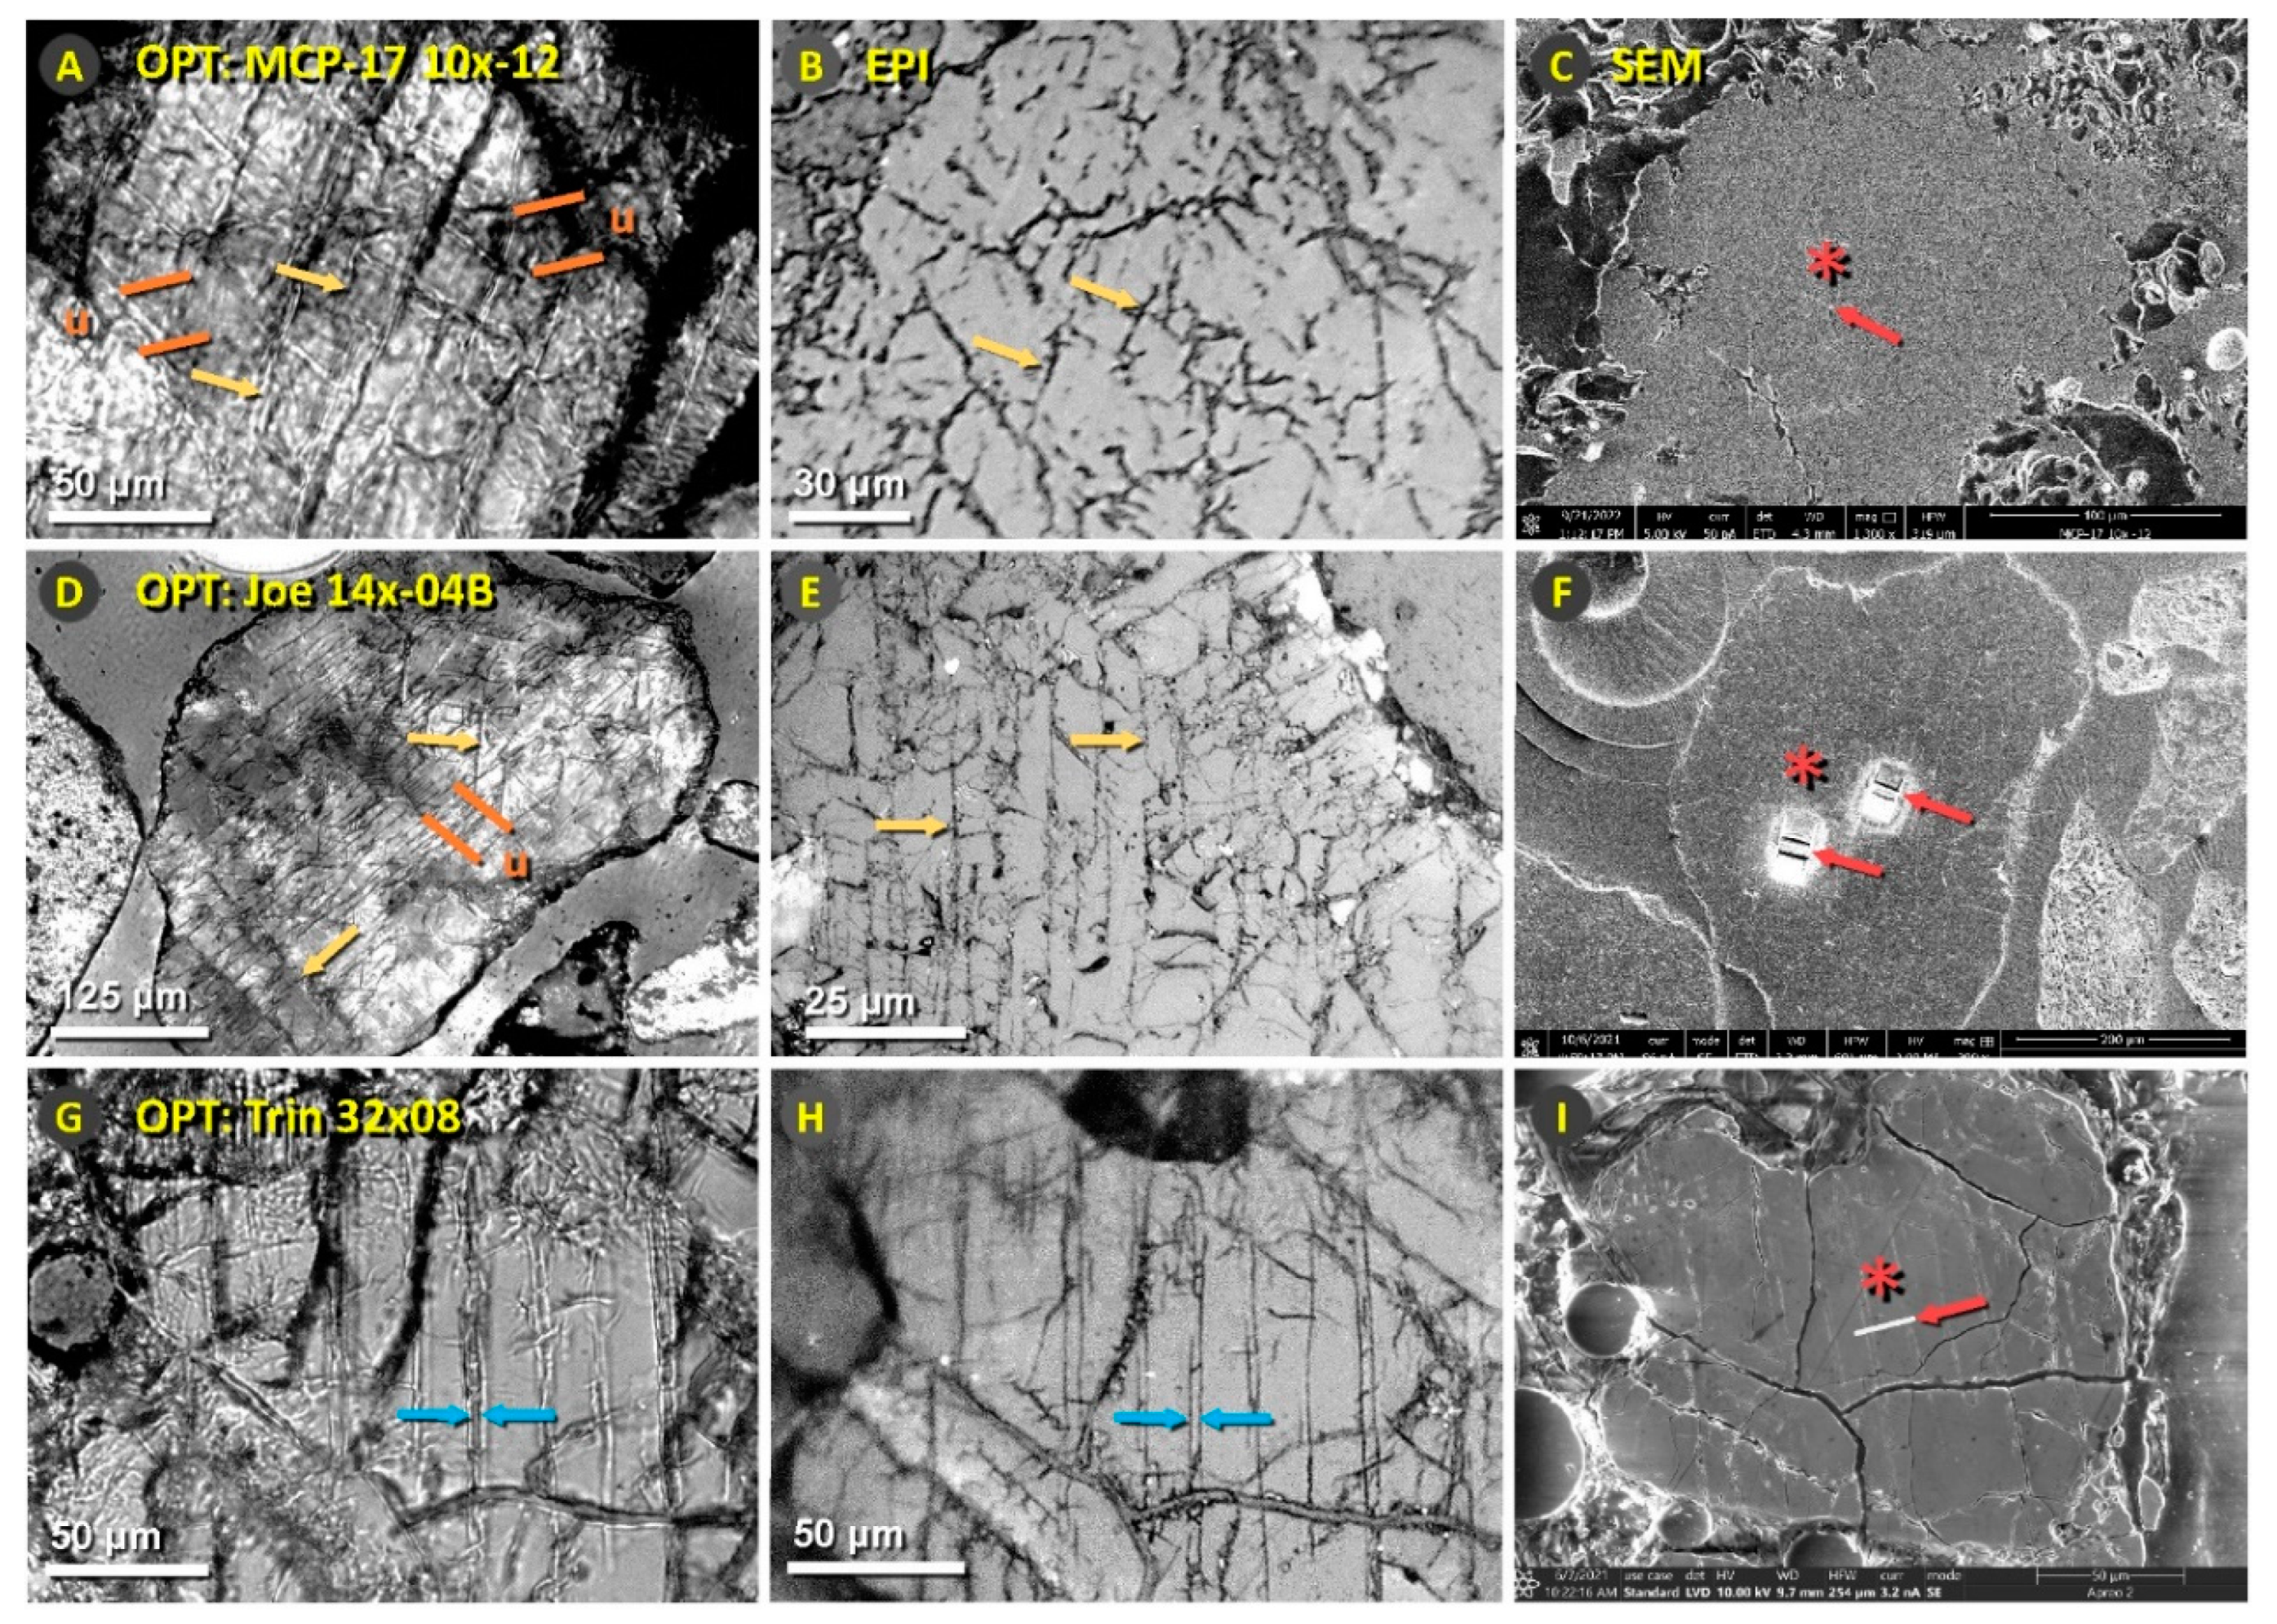
Figure 6.
Images using STEM, TEM, and fast-Fourier transform (FFT). (A-D) Grain #10x-12 from Meteor Crater, Arizona. (E-H) Grain #14x-04 from the Russian Joe-1/4 nuclear test. (I-L) Grain #09x11 from Trinity meltglass. The blue arrows mark shock fractures (left column) in these STEM images, in which the dark lines represent fractures and the black areas represent voids. For TEM brightfield analyses (middle and right columns), arrows labeled “f” mark material that discontinuously fills the shock fractures. Green arrows labeled “v” indicate voids that appear white in TEM mode, rather than black as in STEM. Panels D, H, and L are FFTs. The diffuse halo in each indicates that the material filling of some shock fractures is amorphous; halo d-spacings were measured along dashed yellow lines and averaged 3.72 Å in panel D, 3.90 Å in panel H, and 3.95 Å in panel L. These d-spacings indicate that the filling of the fractures is amorphous silica. The diameter of the TEM beam spot was ~0.5 µm. Insets of diffraction spectra were acquired at “f” in each corresponding TEM image.
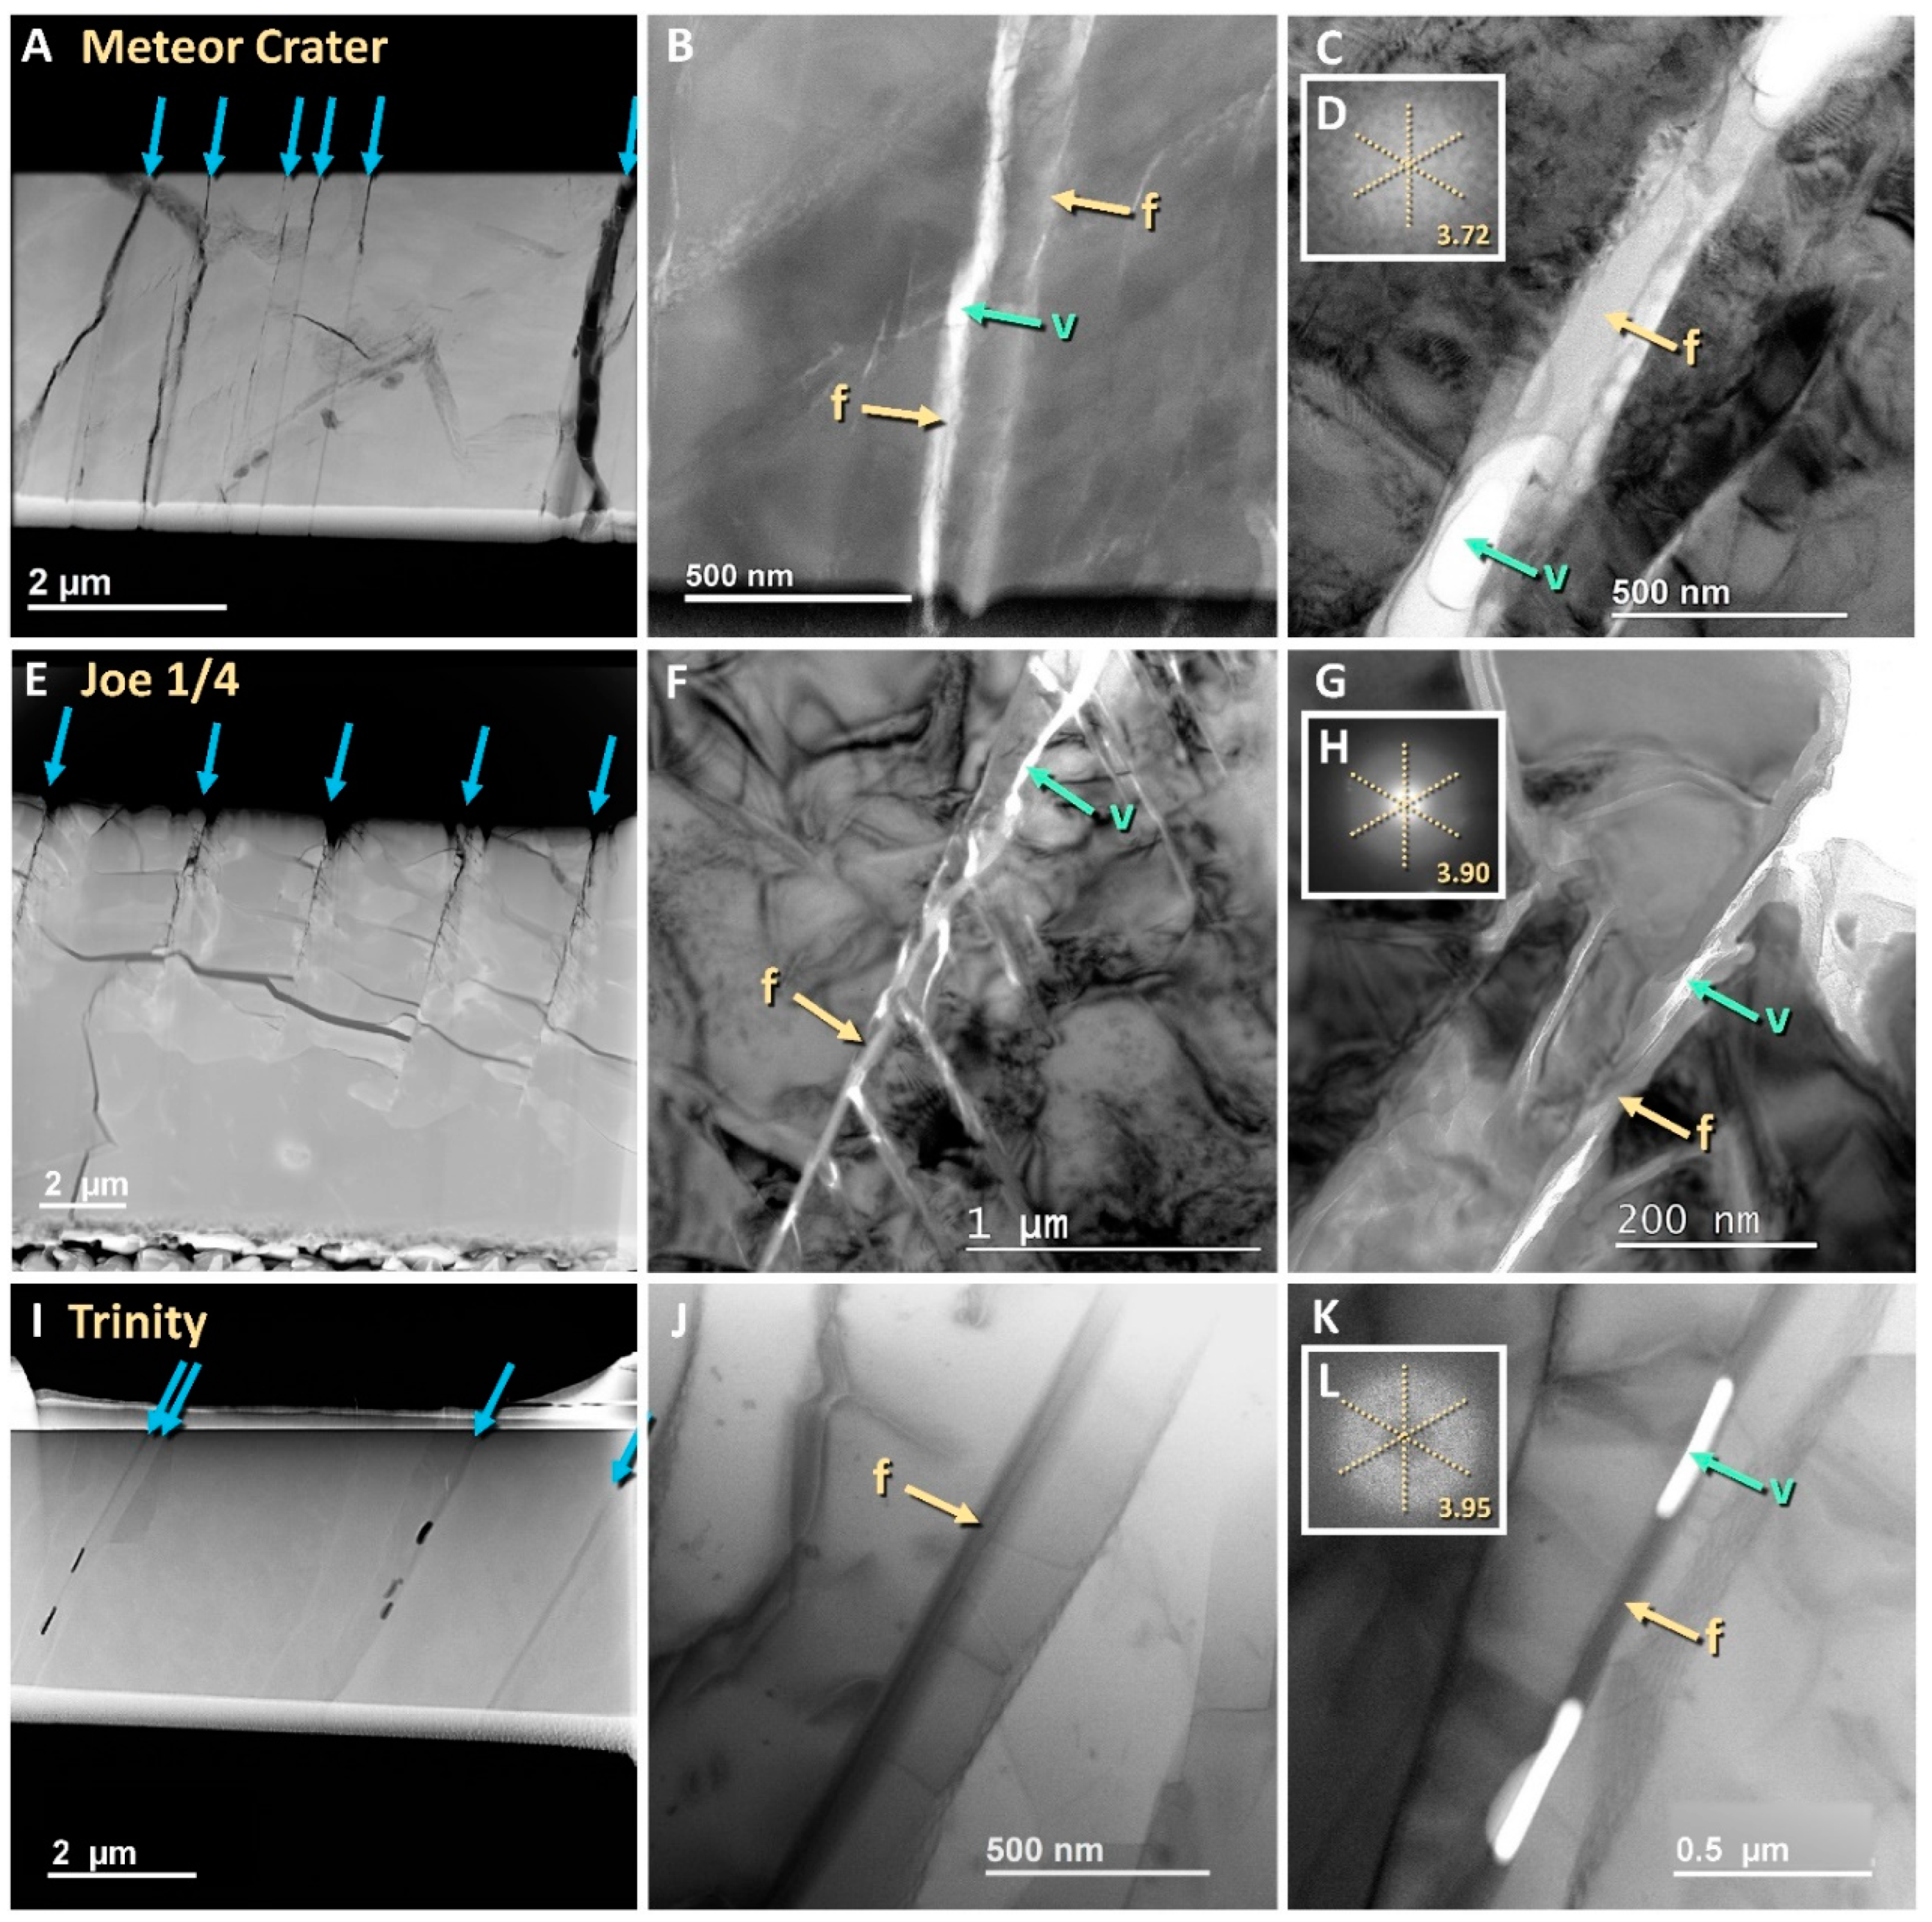
Figure 7.
TEM images of quartz shock fractures filled with amorphous silica. A)-F) is from Meteor Crater (grain #09x-11); G)-L) is from Trinity (grain #09x11). A) TEM brightfield image of the region of interest. (B) A close-up brightfield image exhibits the crystalline lattice below the dotted line and the amorphous silica above; acquired at the asterisk in panel A. (C) Fast-Fourier transform (FFT) of the top part of panel B exhibits a diffuse halo indicative of amorphous silica with a d-spacing of 3.42 Å. (D) FFT of the bottom part of panel B exhibits diffraction spots with a halo indicative of a mix of crystalline lattice with amorphous silica. The halo measures 3.34 Å. (E-F) EDS panels show a composition of 98 wt% silica. (G) TEM brightfield image of the region of interest. (H) A close-up brightfield image exhibits the crystalline lattice above the dotted line and the amorphous silica below the line; the image was acquired at the asterisk in panel G. (I) FFT of the top part of panel H shows diffraction spots with a halo that measures 3.45 Å. (J) FFT of the bottom part of panel H displays a diffuse halo indicative of amorphous silica. The d-spacing of the amorphous halo is 3.79 Å. (K-L) EDS panels showing a composition of 100 wt% silica.
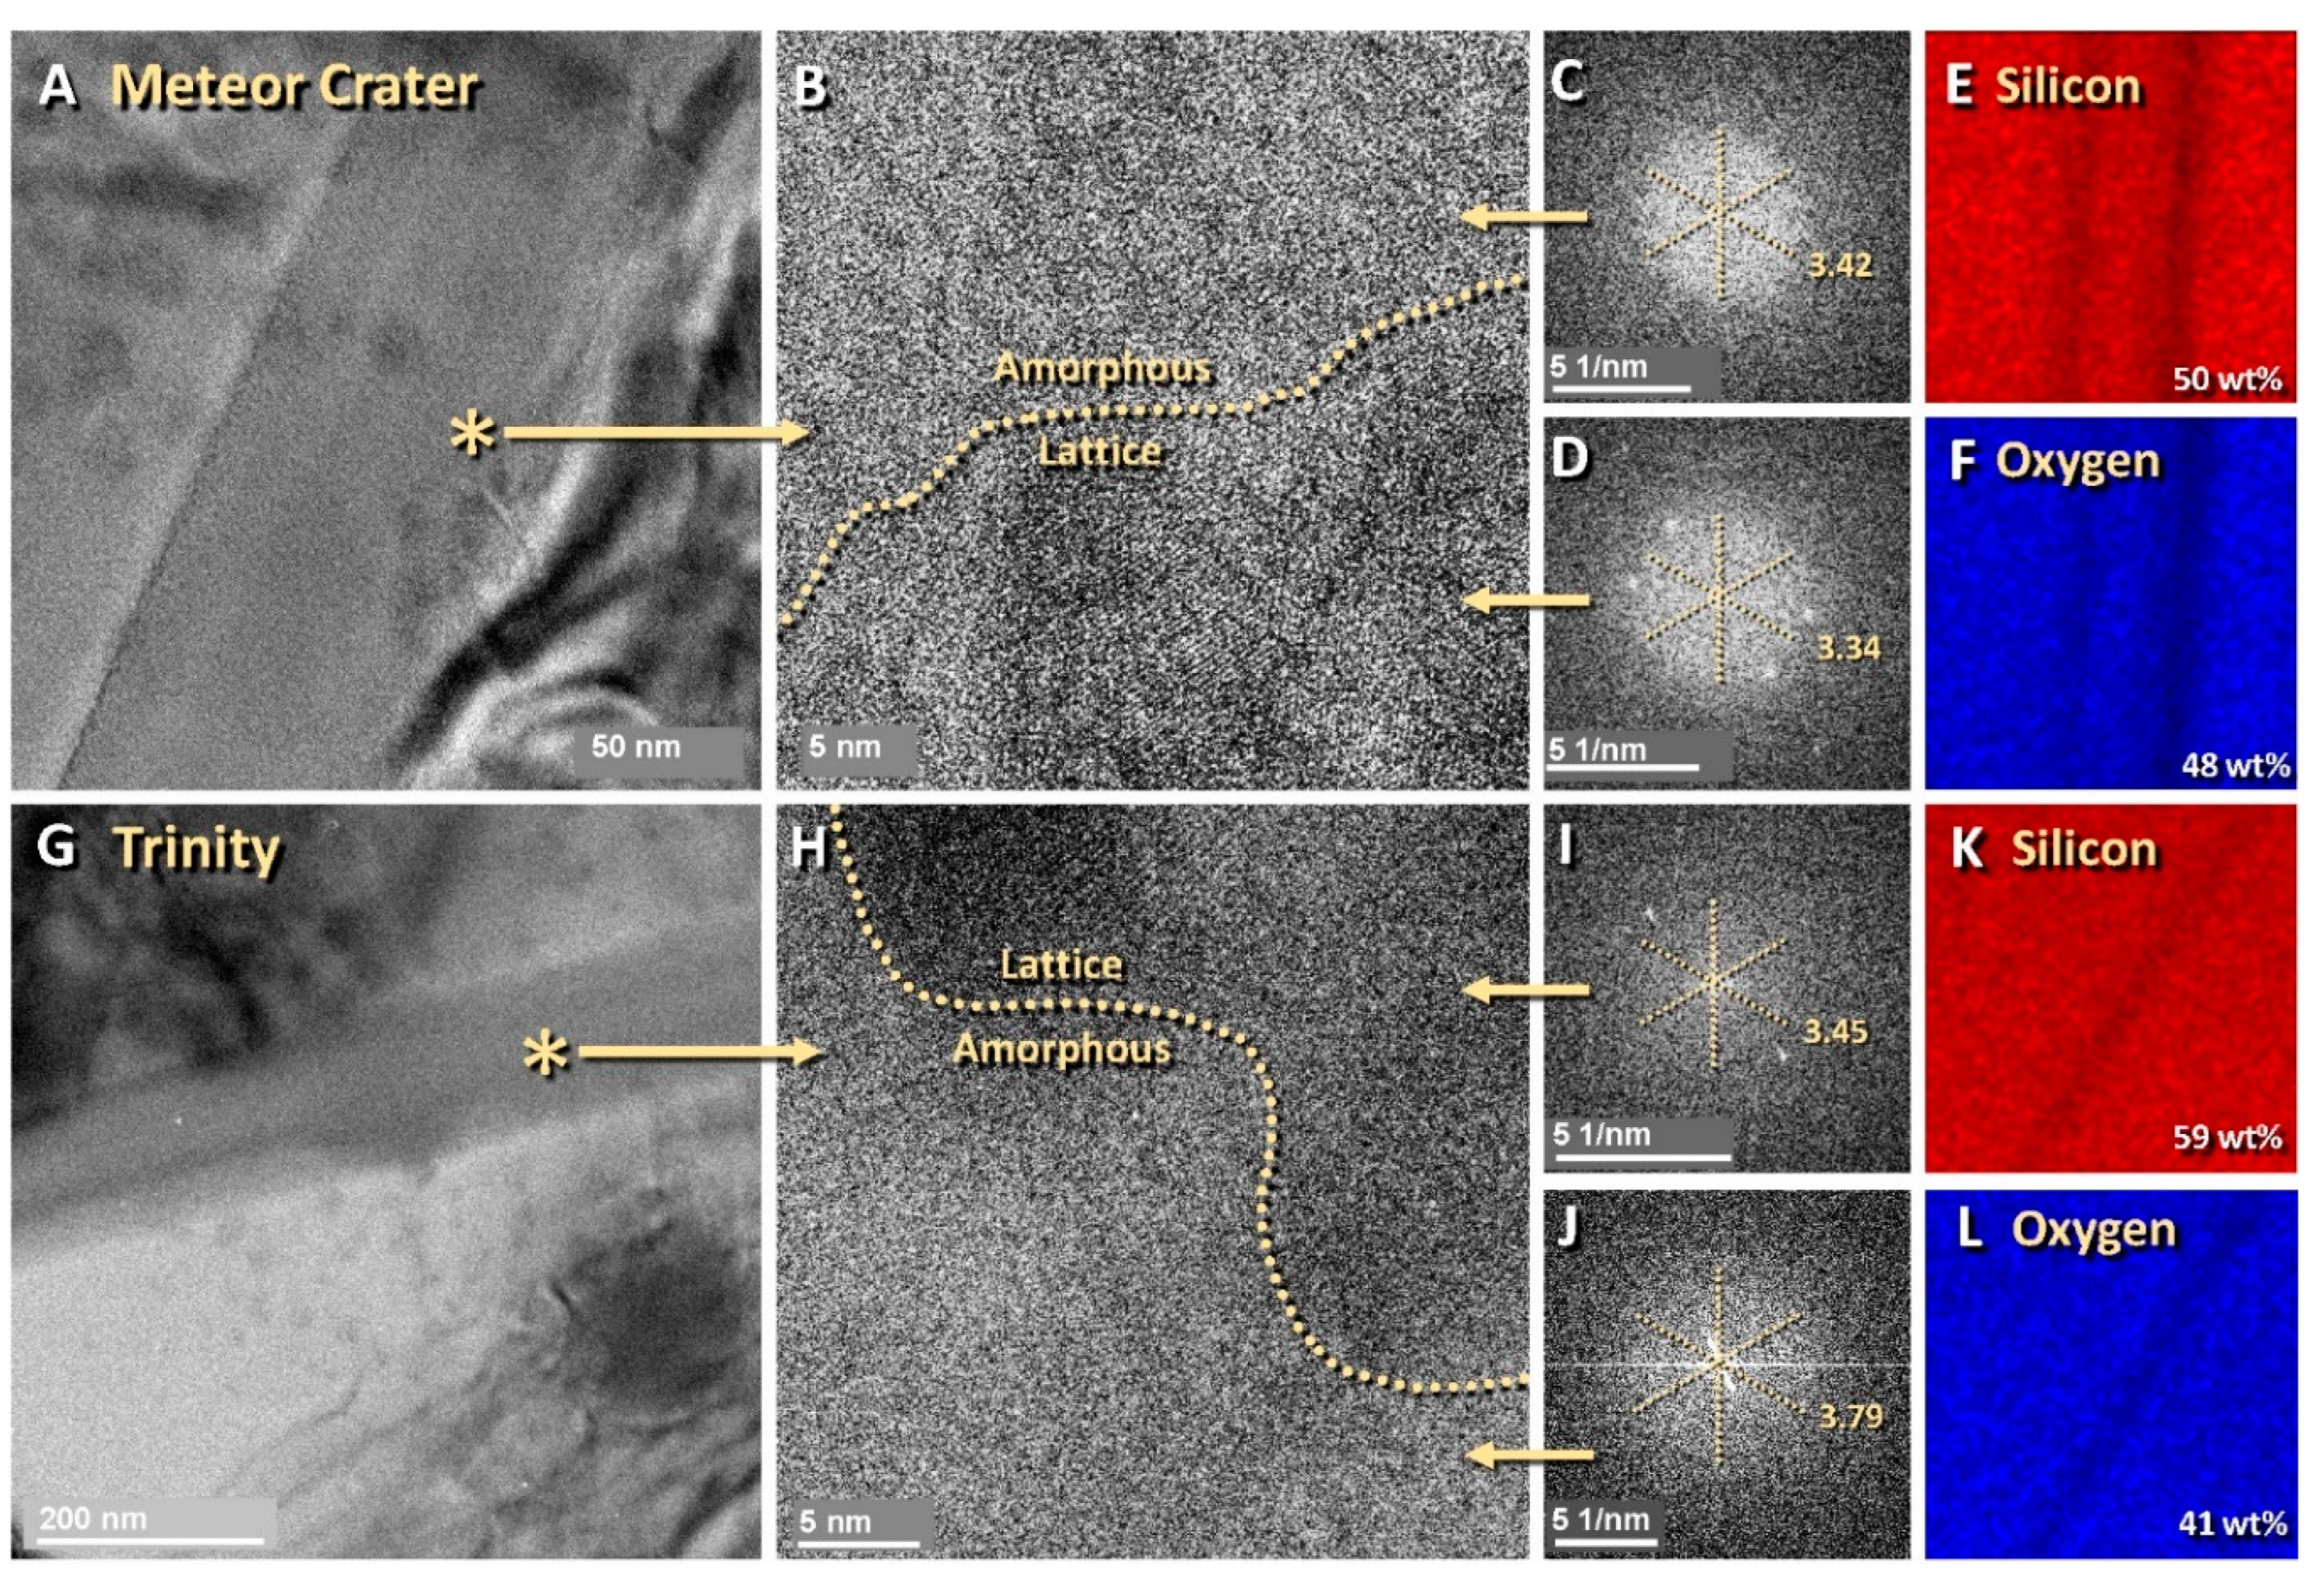
Figure 8.
TEM images [left column]; FFT patterns and plots [middle column]; EDS elemental maps [right column]. All images were acquired from FIB foils. (A-D) Grain #10x-12 from Meteor Crater, Arizona. (E-H) Grain #14x-04 from the Russian Joe-1/4 nuclear test. (I-L) Grain #30x08 from the Trinity JIE sediment sample. TEM images in the left column show the micron-sized areas analyzed; asterisks mark the locations used to generate the FFTs (middle column insets) and the EDS analyses (right column). Panel I (Trinity) shows a glass-filled shock fracture that intersects a glass-filled vesicle. In the middle column, the graphs show intensities plotted against d-spacings, generated from FFTs using the Profile function of Digital Micrograph, version 3.32.2403.0. Each grain shows a decrease in slope at d-spacings ranging from 3.50 to 3.70 Å (black line), marking the edges of the diffuse halos shown in the FFT insets. The yellow dashed lines plot a reference profile of non-shocked amorphous silica (melted quartz) [60] with a slope change at 4.20 Å. The slopes of the yellow and black lines are similar, consistent with the presence of amorphous silica in the grains in this study. EDS analyses in right-hand panels confirm that the areas centered on the asterisks at left are predominantly silica and oxygen (range: 98-99 wt%).
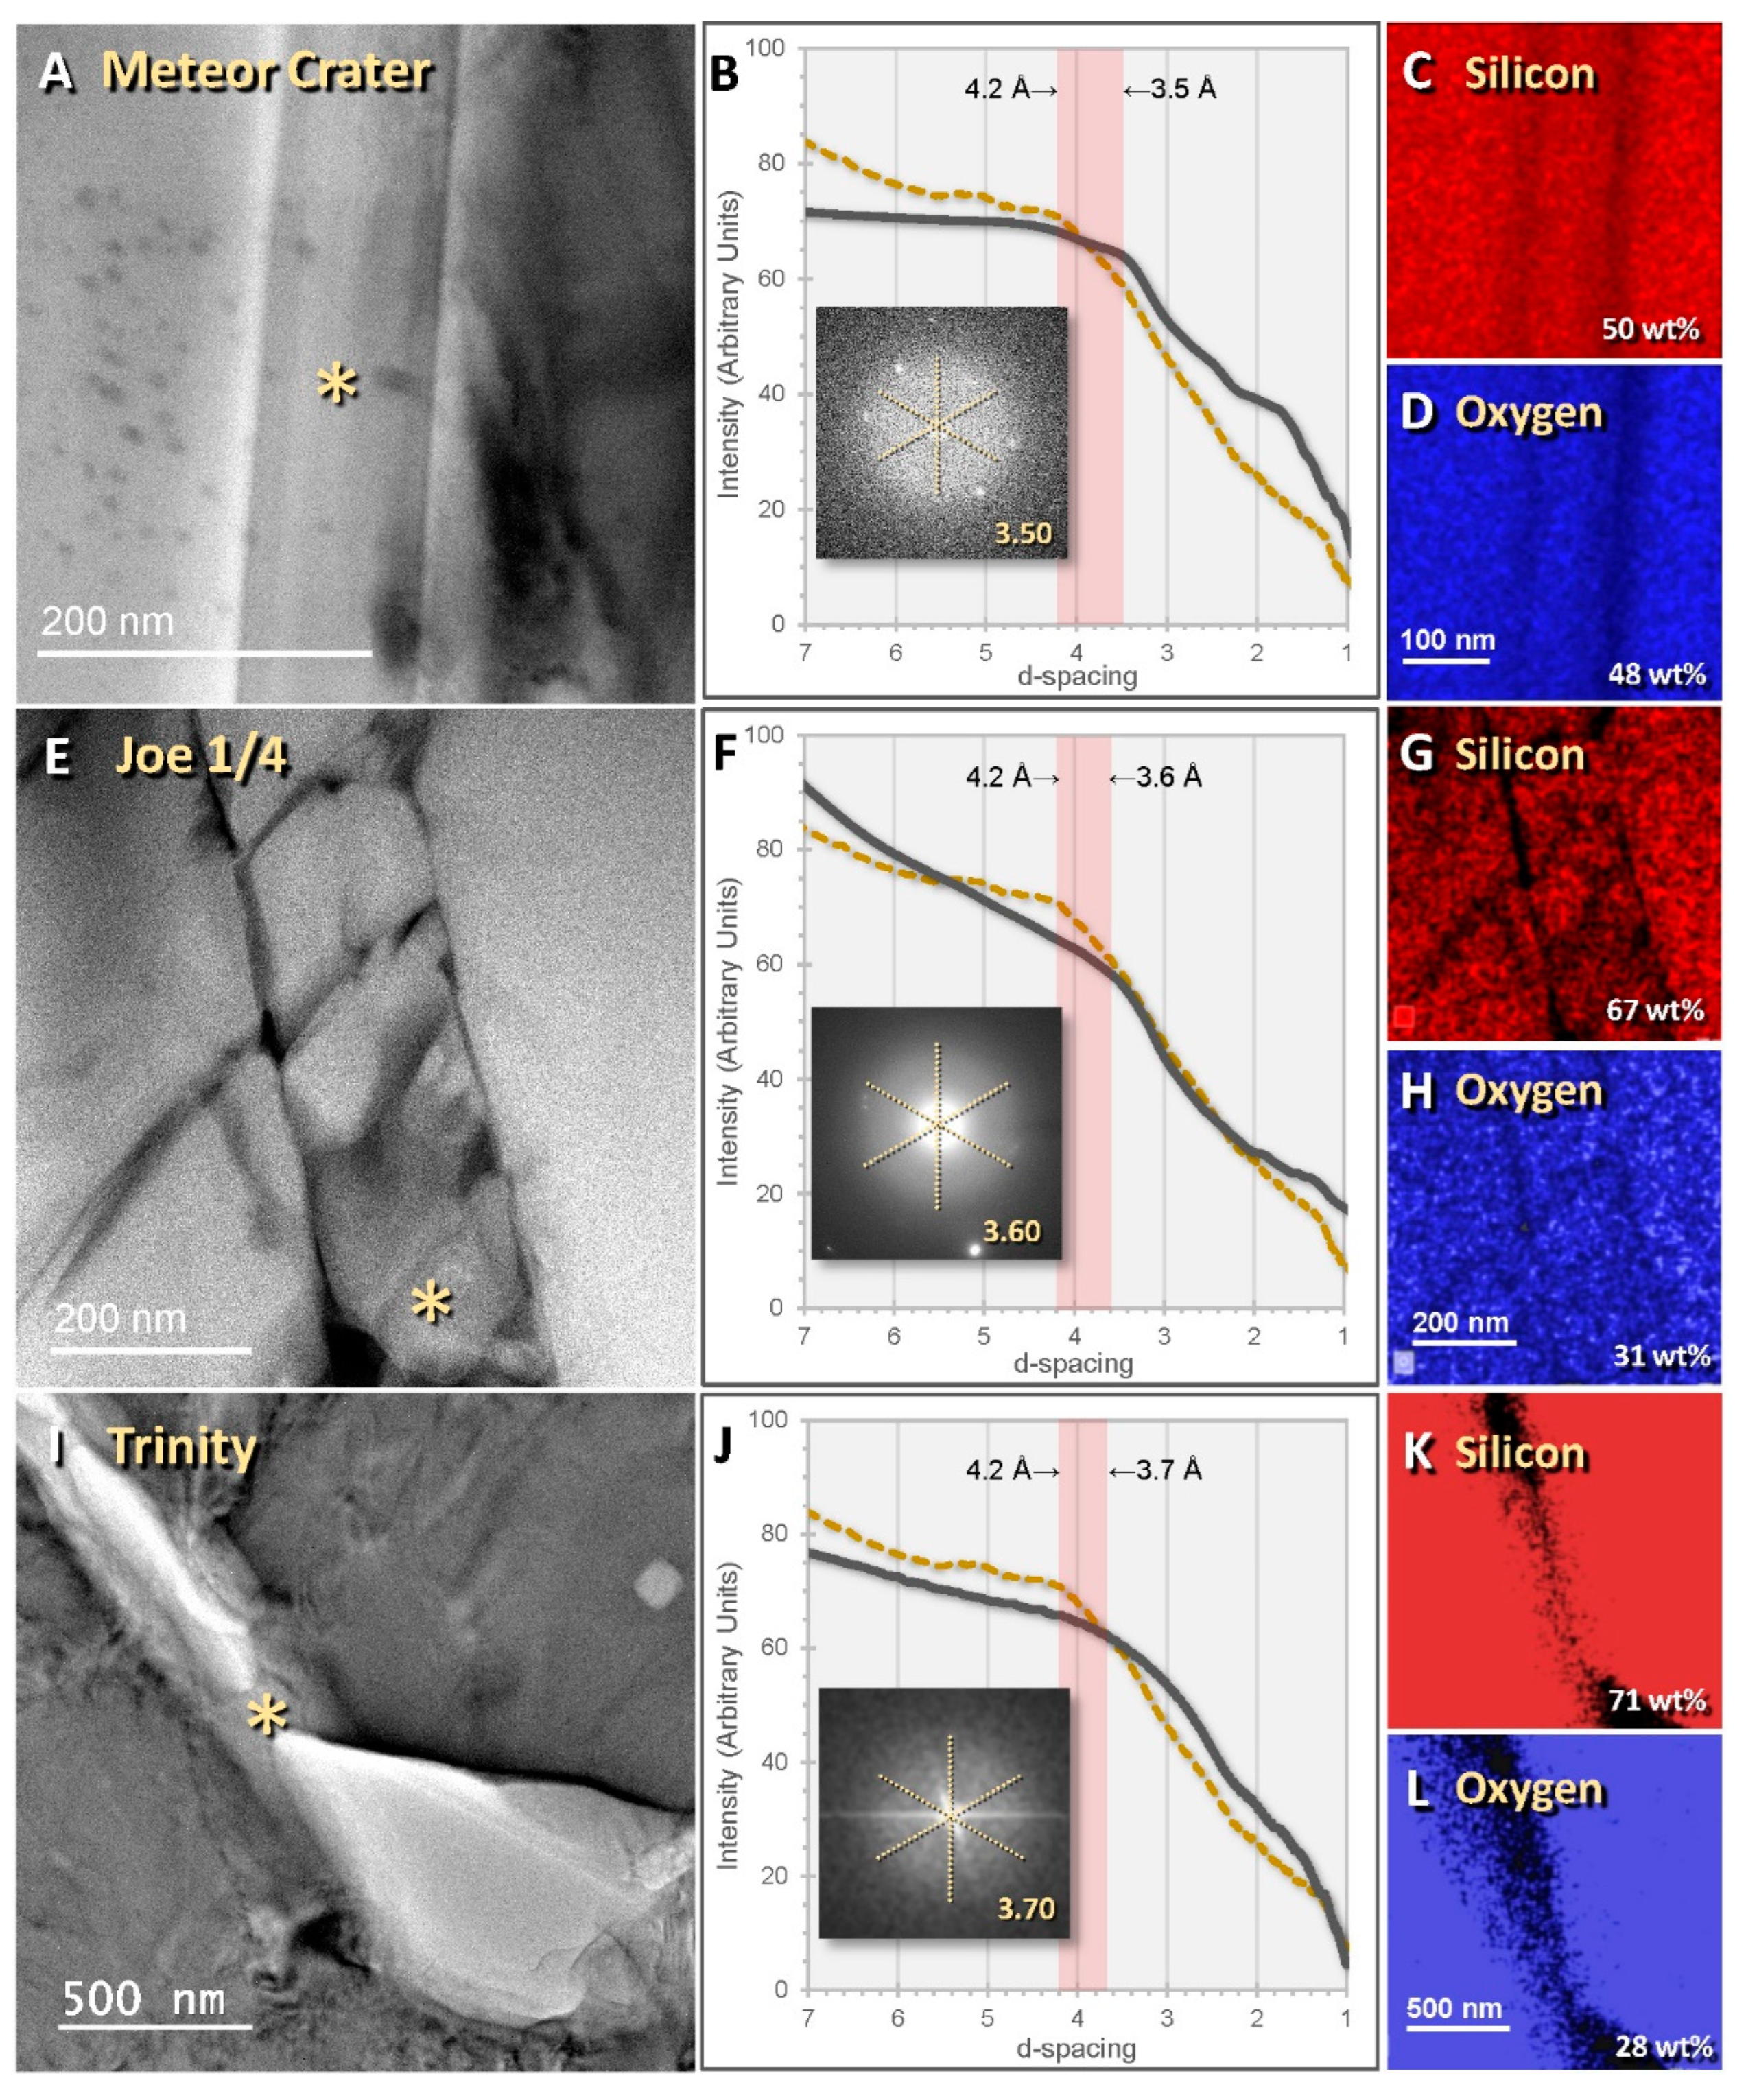
Figure 9.
SEM (A-C) images and cathodoluminescence (CL) images (D-F) of shock fractures in quartz grains. A) SEM image of quartz from Meteor Crater, grain 11x08. Shock fractures at arrows. (B) SEM image from the Joe-1/4 site, grain 03x16. Most shock fractures contain darker-contrast glass (g) along the shock fractures. The web-like structure is consistent with the high-pressure injection of molten silica or in situ melting. (C) SEM image of quartz from the Trinity site, grain 09x11. The arrow at “g” marks non-luminescent glass. (D) CL image of a different Meteor Crater grain 13x11 showing small, feather-like fractures angling away from the large irregular shock fracture. (E) CL image of a different grain from the Joe-1/4 site, grain 14x-04b. (F) CL image of a different grain, 06x14, from Trinity meltglass. Note that shock fractures are filled with bluish-gray-to-black, non-luminescent glass.
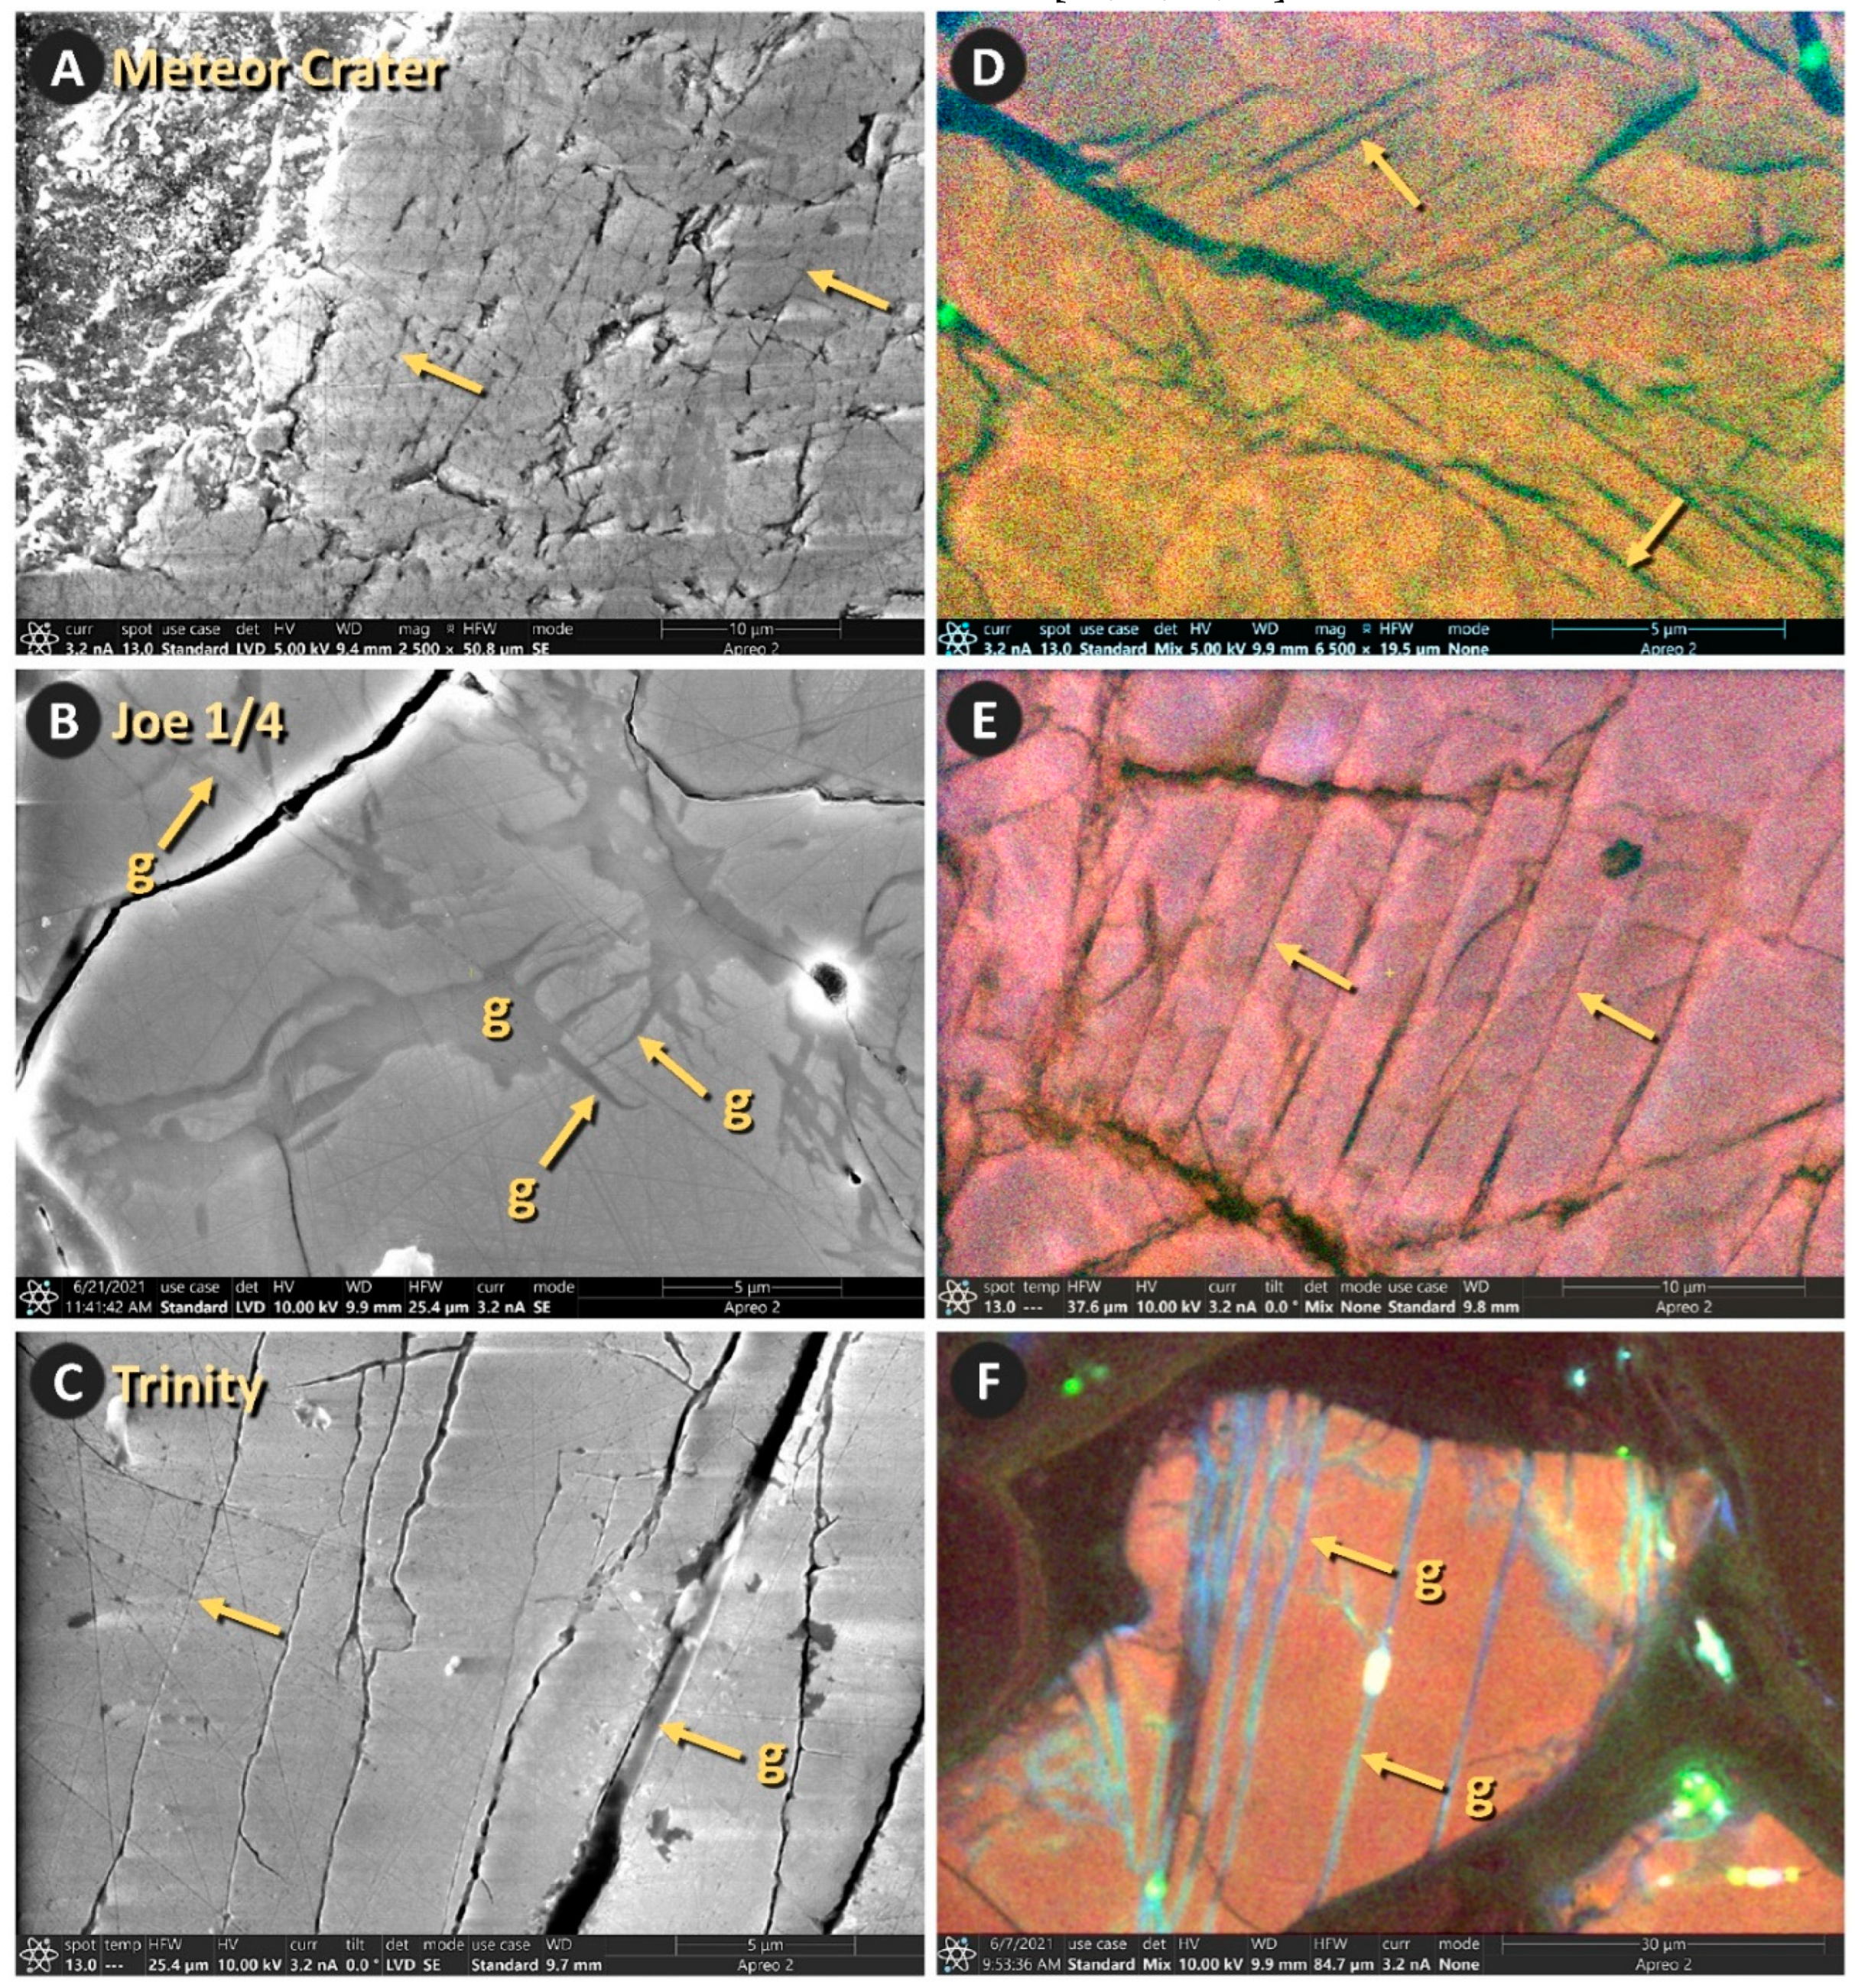
Figure 10.
SEM and cathodoluminescence (CL) images of shock fractures in quartz. (A, B) Grain 14x-04a from Meteor Crater, Arizona. (C, D) Grain 09x14 from the Russian Joe-1/4 nuclear test. (E, F) Grain 32x08 from Trinity meltglass. In the SEM images (left column) and CL images (right column), the red arrows point to sub-parallel pairs of shock fractures. In SEM images (left column), yellow arrows point to thin, dark-gray bands of amorphous silica, labeled “g”. In the CL images (right column), the bluish-gray-to-black bands at arrows labeled “g” indicate non-luminescent, glass-filled shock fractures. As confirmed by EDS, the material is amorphous silica (glass).
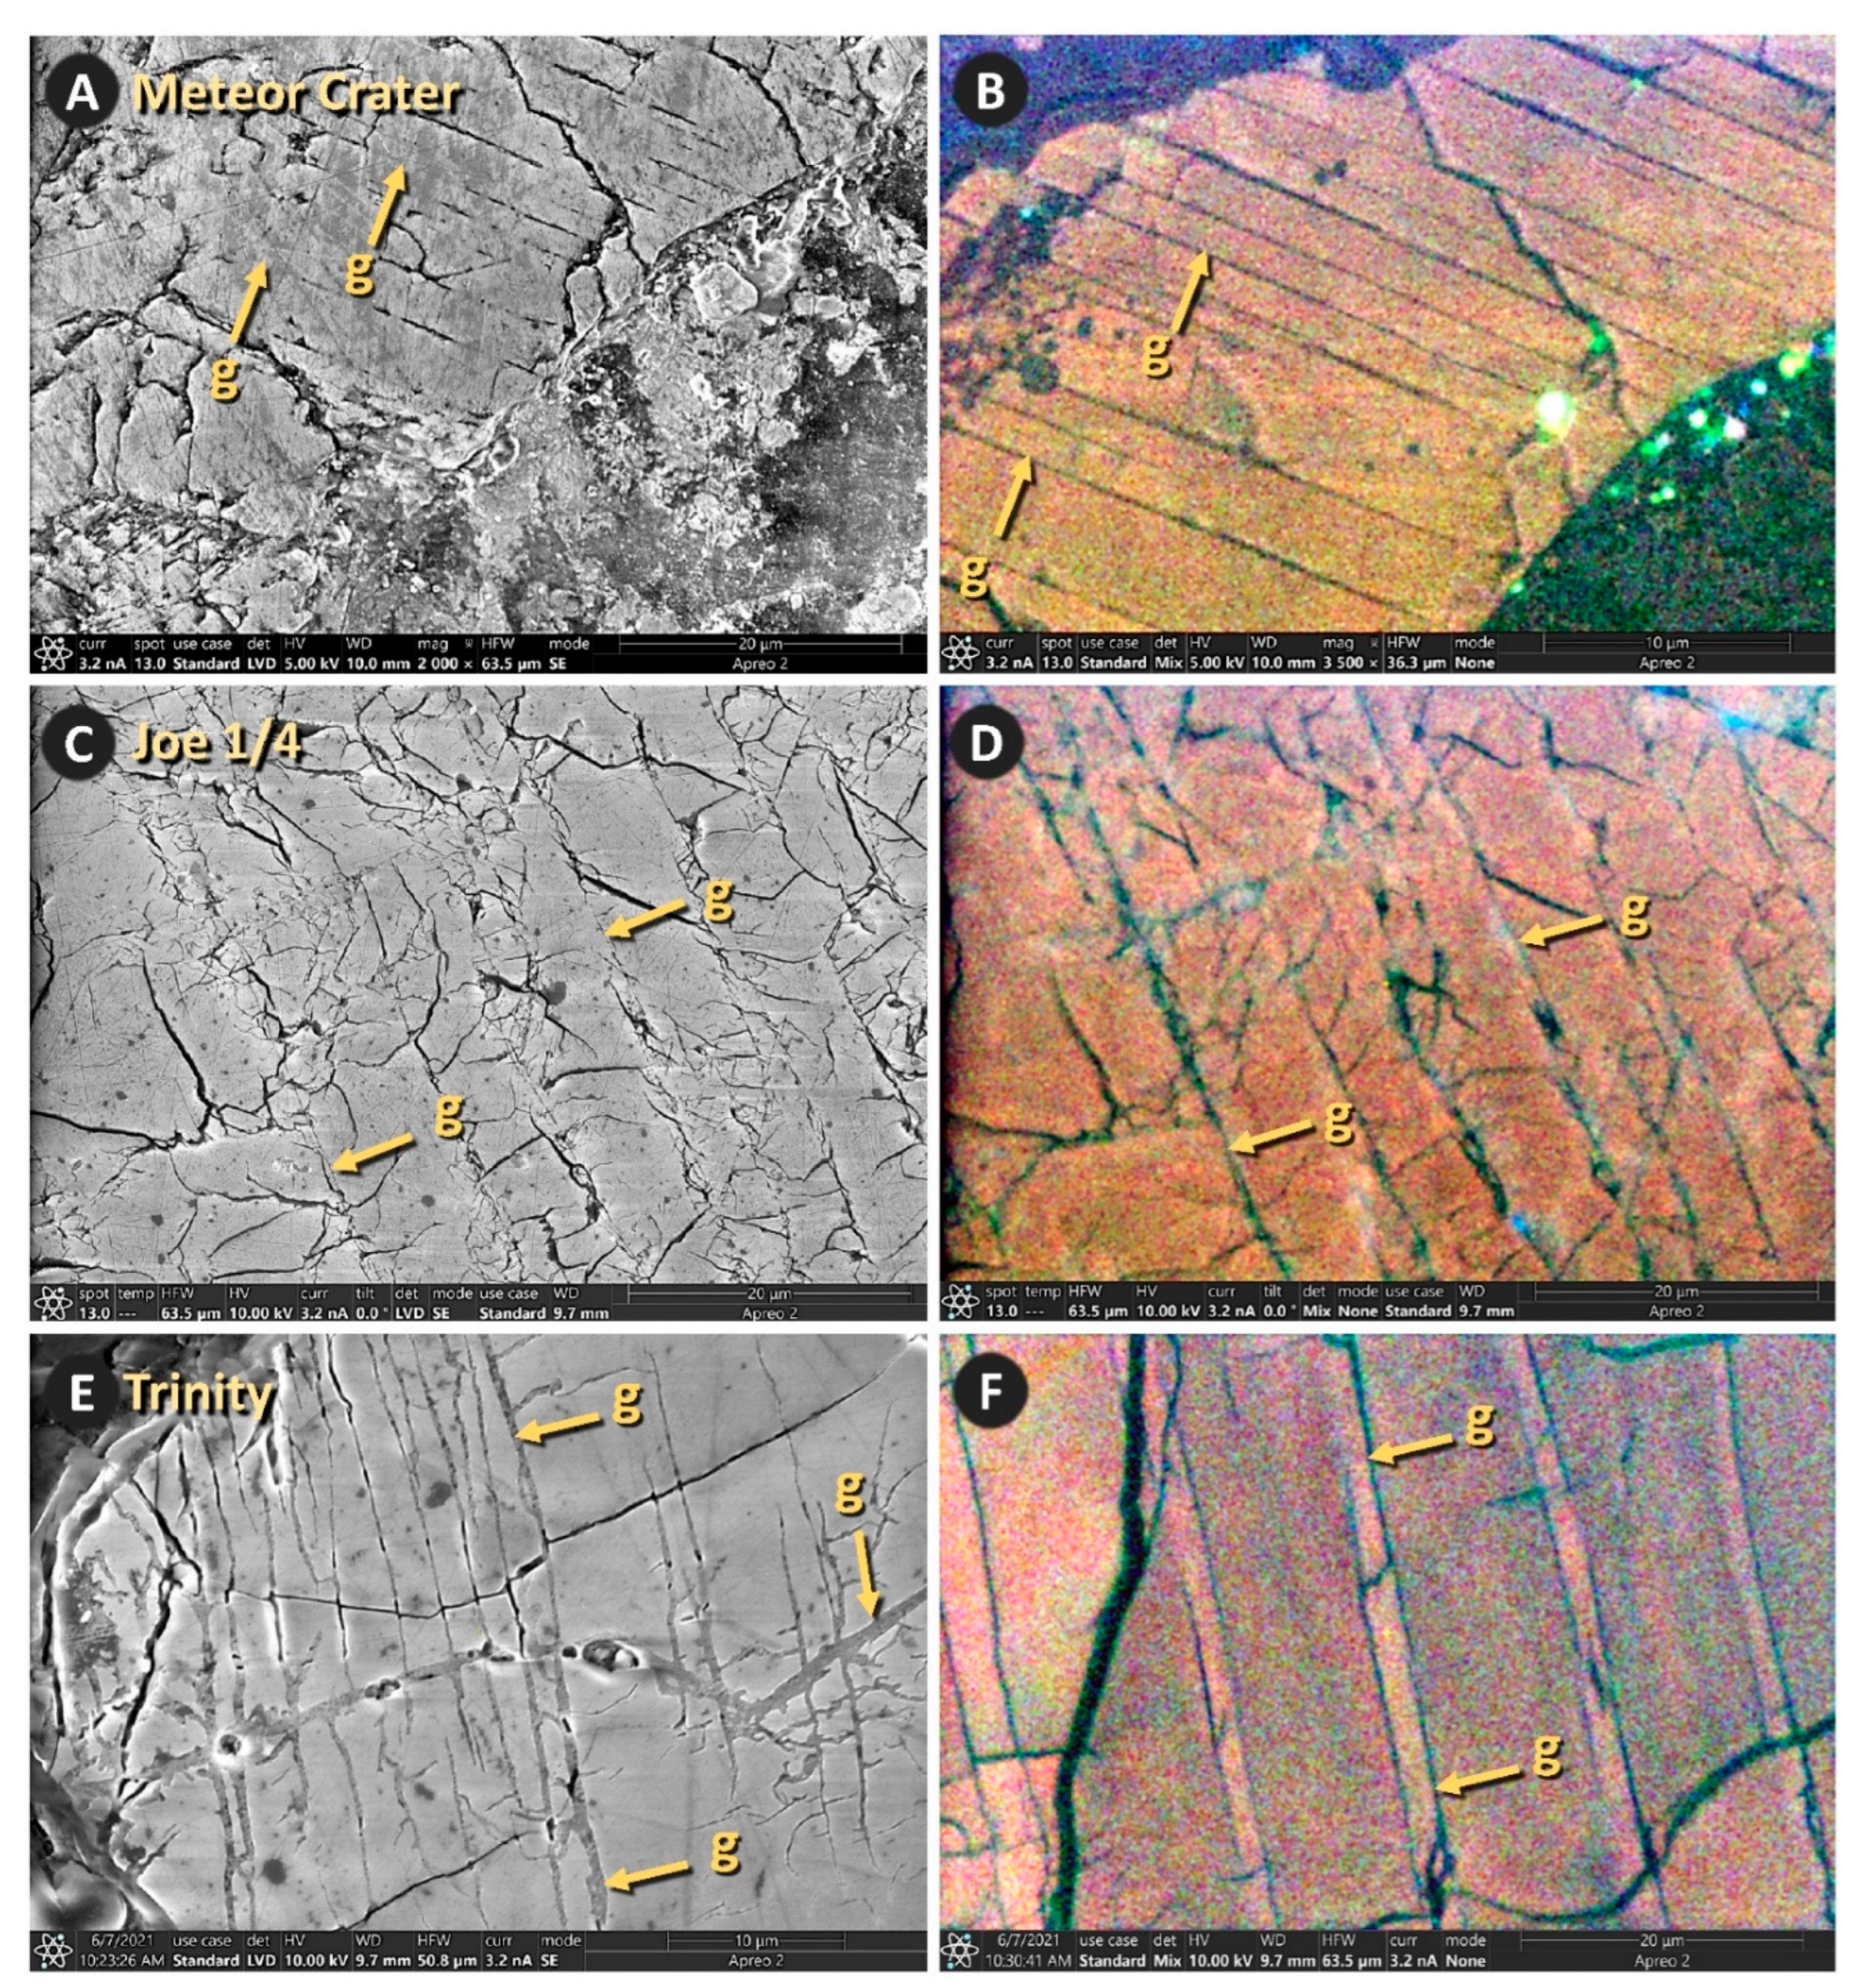
Figure 11.
Images acquired using SEM [left column]; grayscale panchromatic cathodoluminescence (CL) [middle column]; and energy dispersive spectroscopy (EDS) [right column]. (A-D) Grain #10x-12 from Meteor Crater, Arizona. (E-H) Grain #14x-04B from the Russian Joe-1/4 nuclear test. (I-L) Grain #32x08 from Trinity meltglass. In the SEM images (left column), the yellow arrows point to shock fractures filled with gray material. In the grayscale panchromatic CL images (spectrum: 185–850 nm; middle column), the yellow arrows point to the corresponding region, marked as glass. The gray-to-black color indicates that the filling material is non-luminescent, consistent with being amorphous silica [21,59,63,65]. The SEM-EDS panels (right column) are of approximately the same field of view as in the left column and confirm that the material is predominantly composed of silicon and oxygen (see EDS spectra for panels in Appendix, Figures S10–S14). Thus, the evidence indicates the filling in the fractures is amorphous silica.
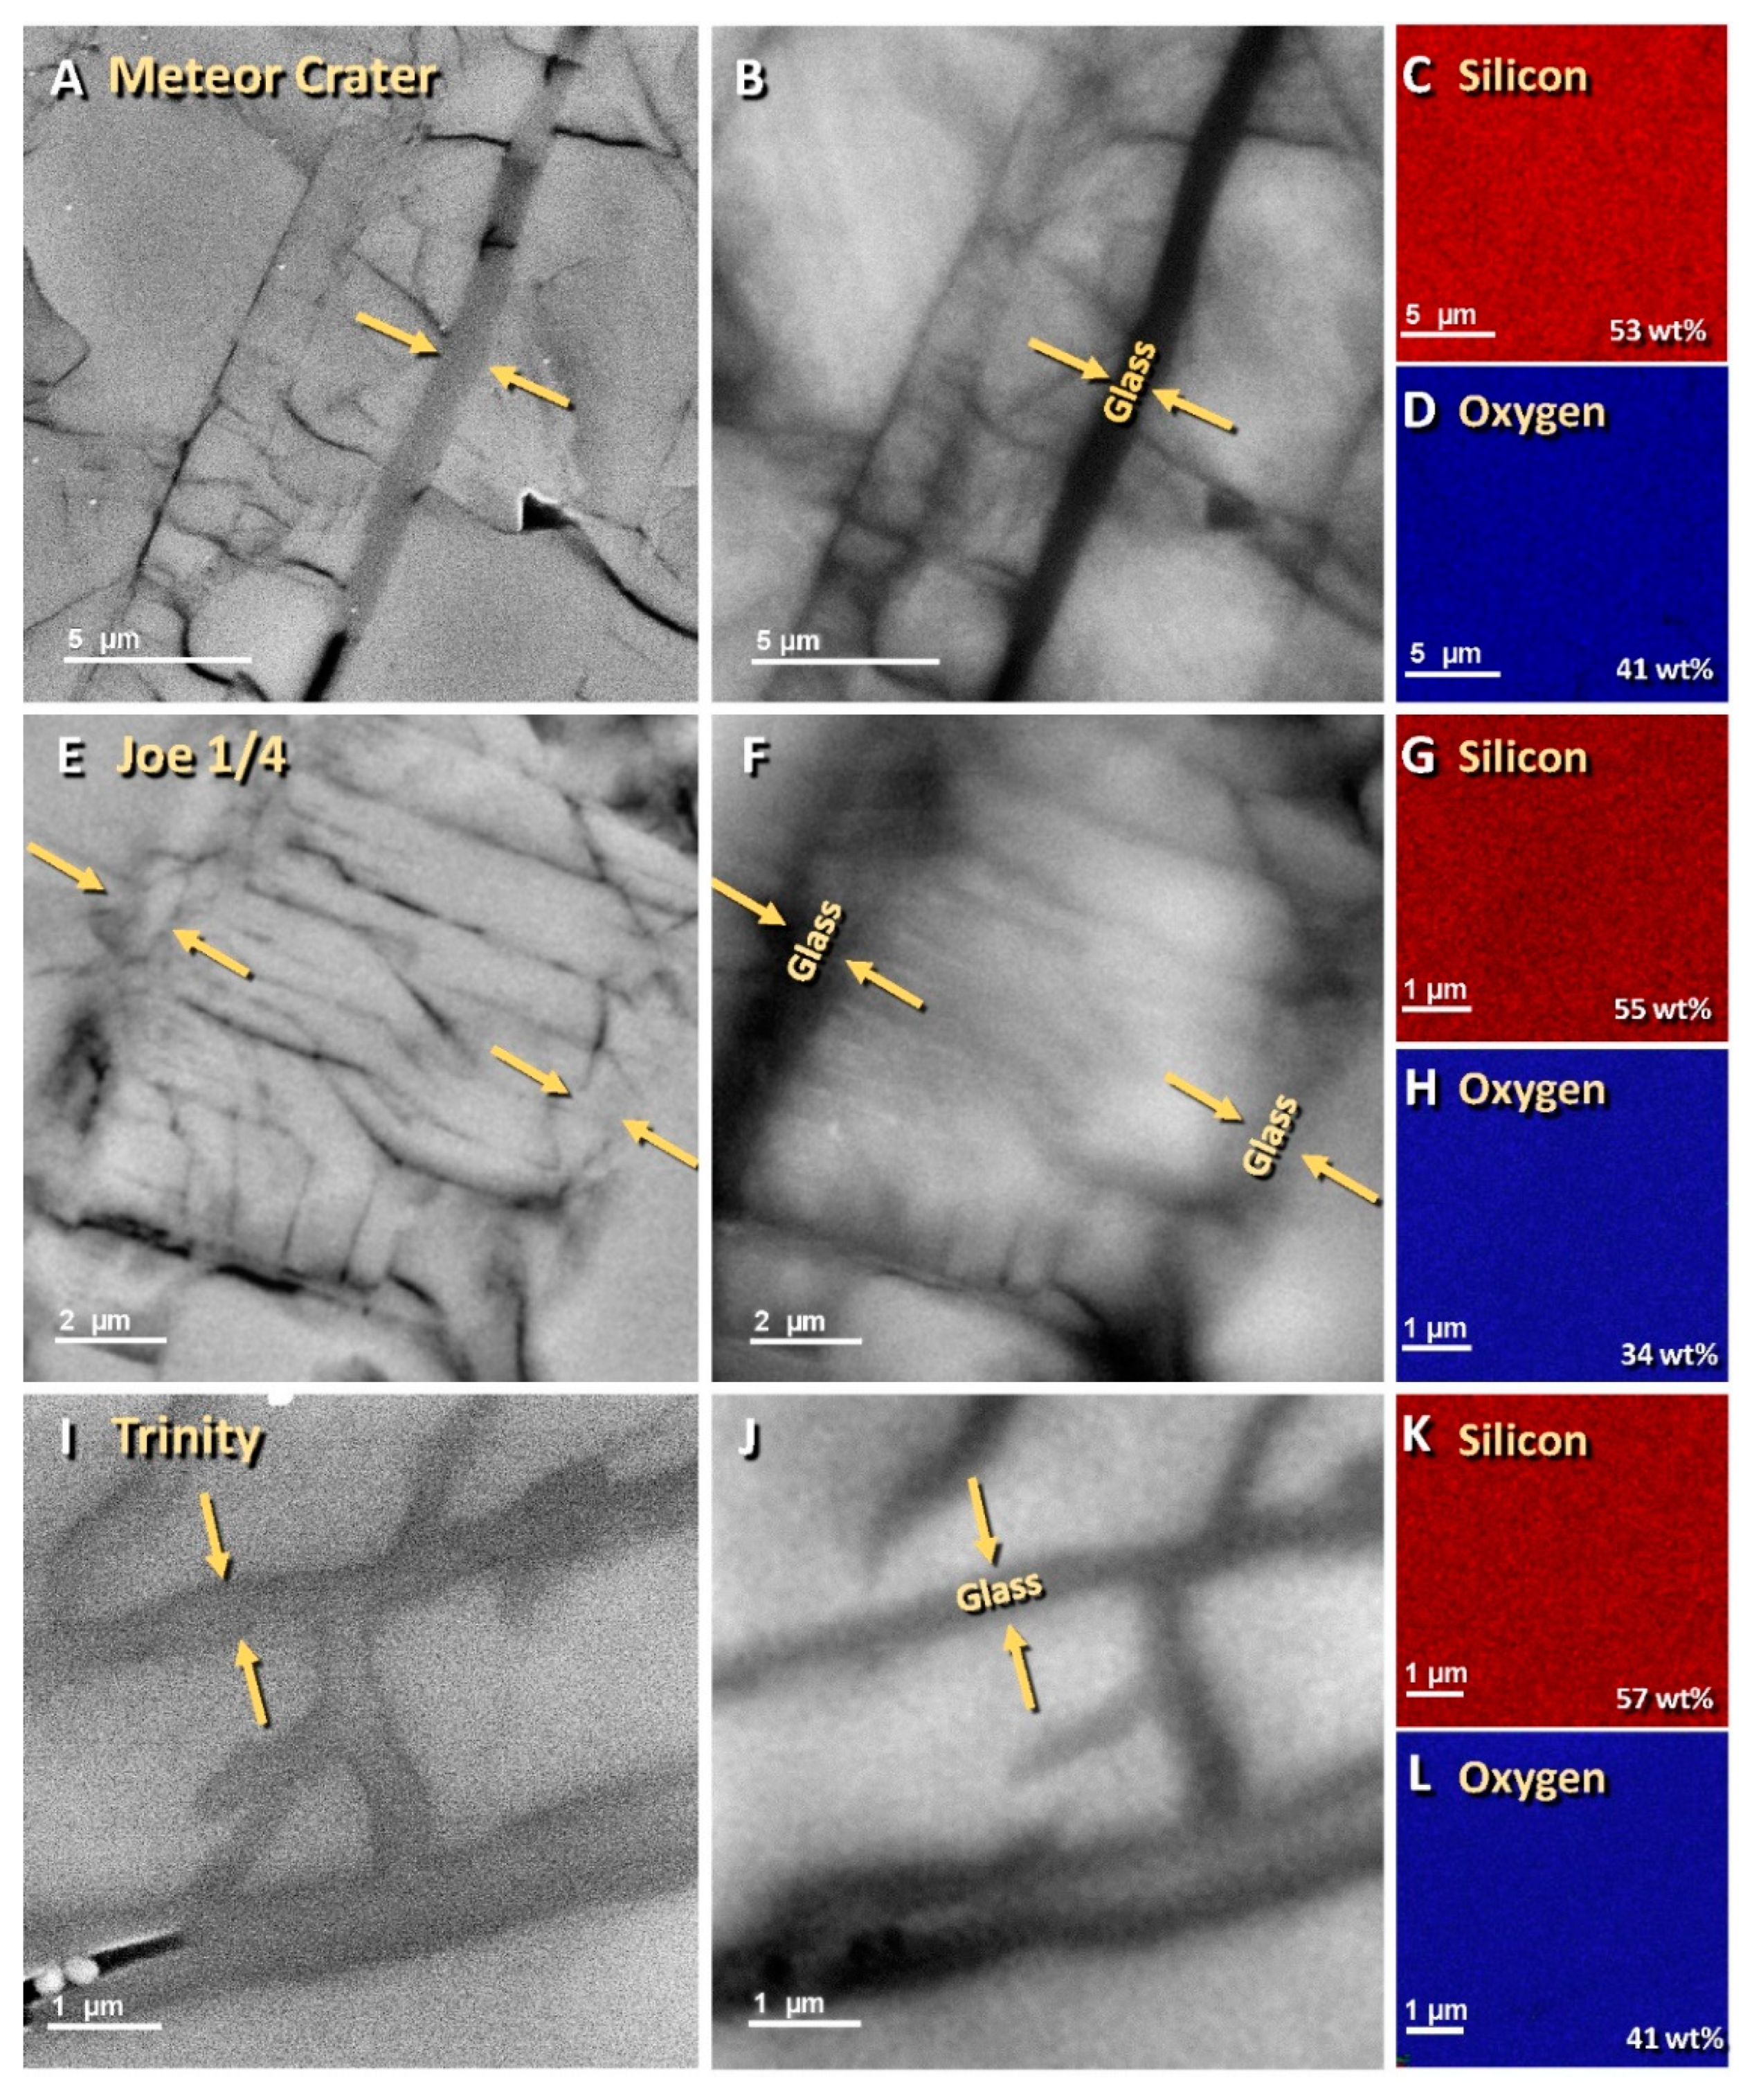
Figure 12.
Images using EBSD “virtual backscatter.” (A, D) Grain #10x-12 from Meteor Crater, Arizona. (B, E) Grain #14x-04B from the Russian Joe-1/4 nuclear test. (C, F) Grain #09x11 from Trinity meltglass. Virtual backscatter images in the left column show numerous oriented shock fractures, with arrows marking a few representative examples among the many fractures present. The lattice diagram at the lower right of each image (left column) represents the crystalline structure of that grain. In EBSD, the routines for image quality and local orientation spread (right column) were used to analyze the crystalline lattice to determine the degree of damage to each quartz grain. A multi-colored misorientation scale is inset into the lower right of panel D and applies to all images in the right column. The colors represent the degrees of misorientation, ranging from 0 degrees (blue) to ~5 degrees (red). Note that the greatest degree of misorientation (i.e., damage) is concentrated along shock fractures.
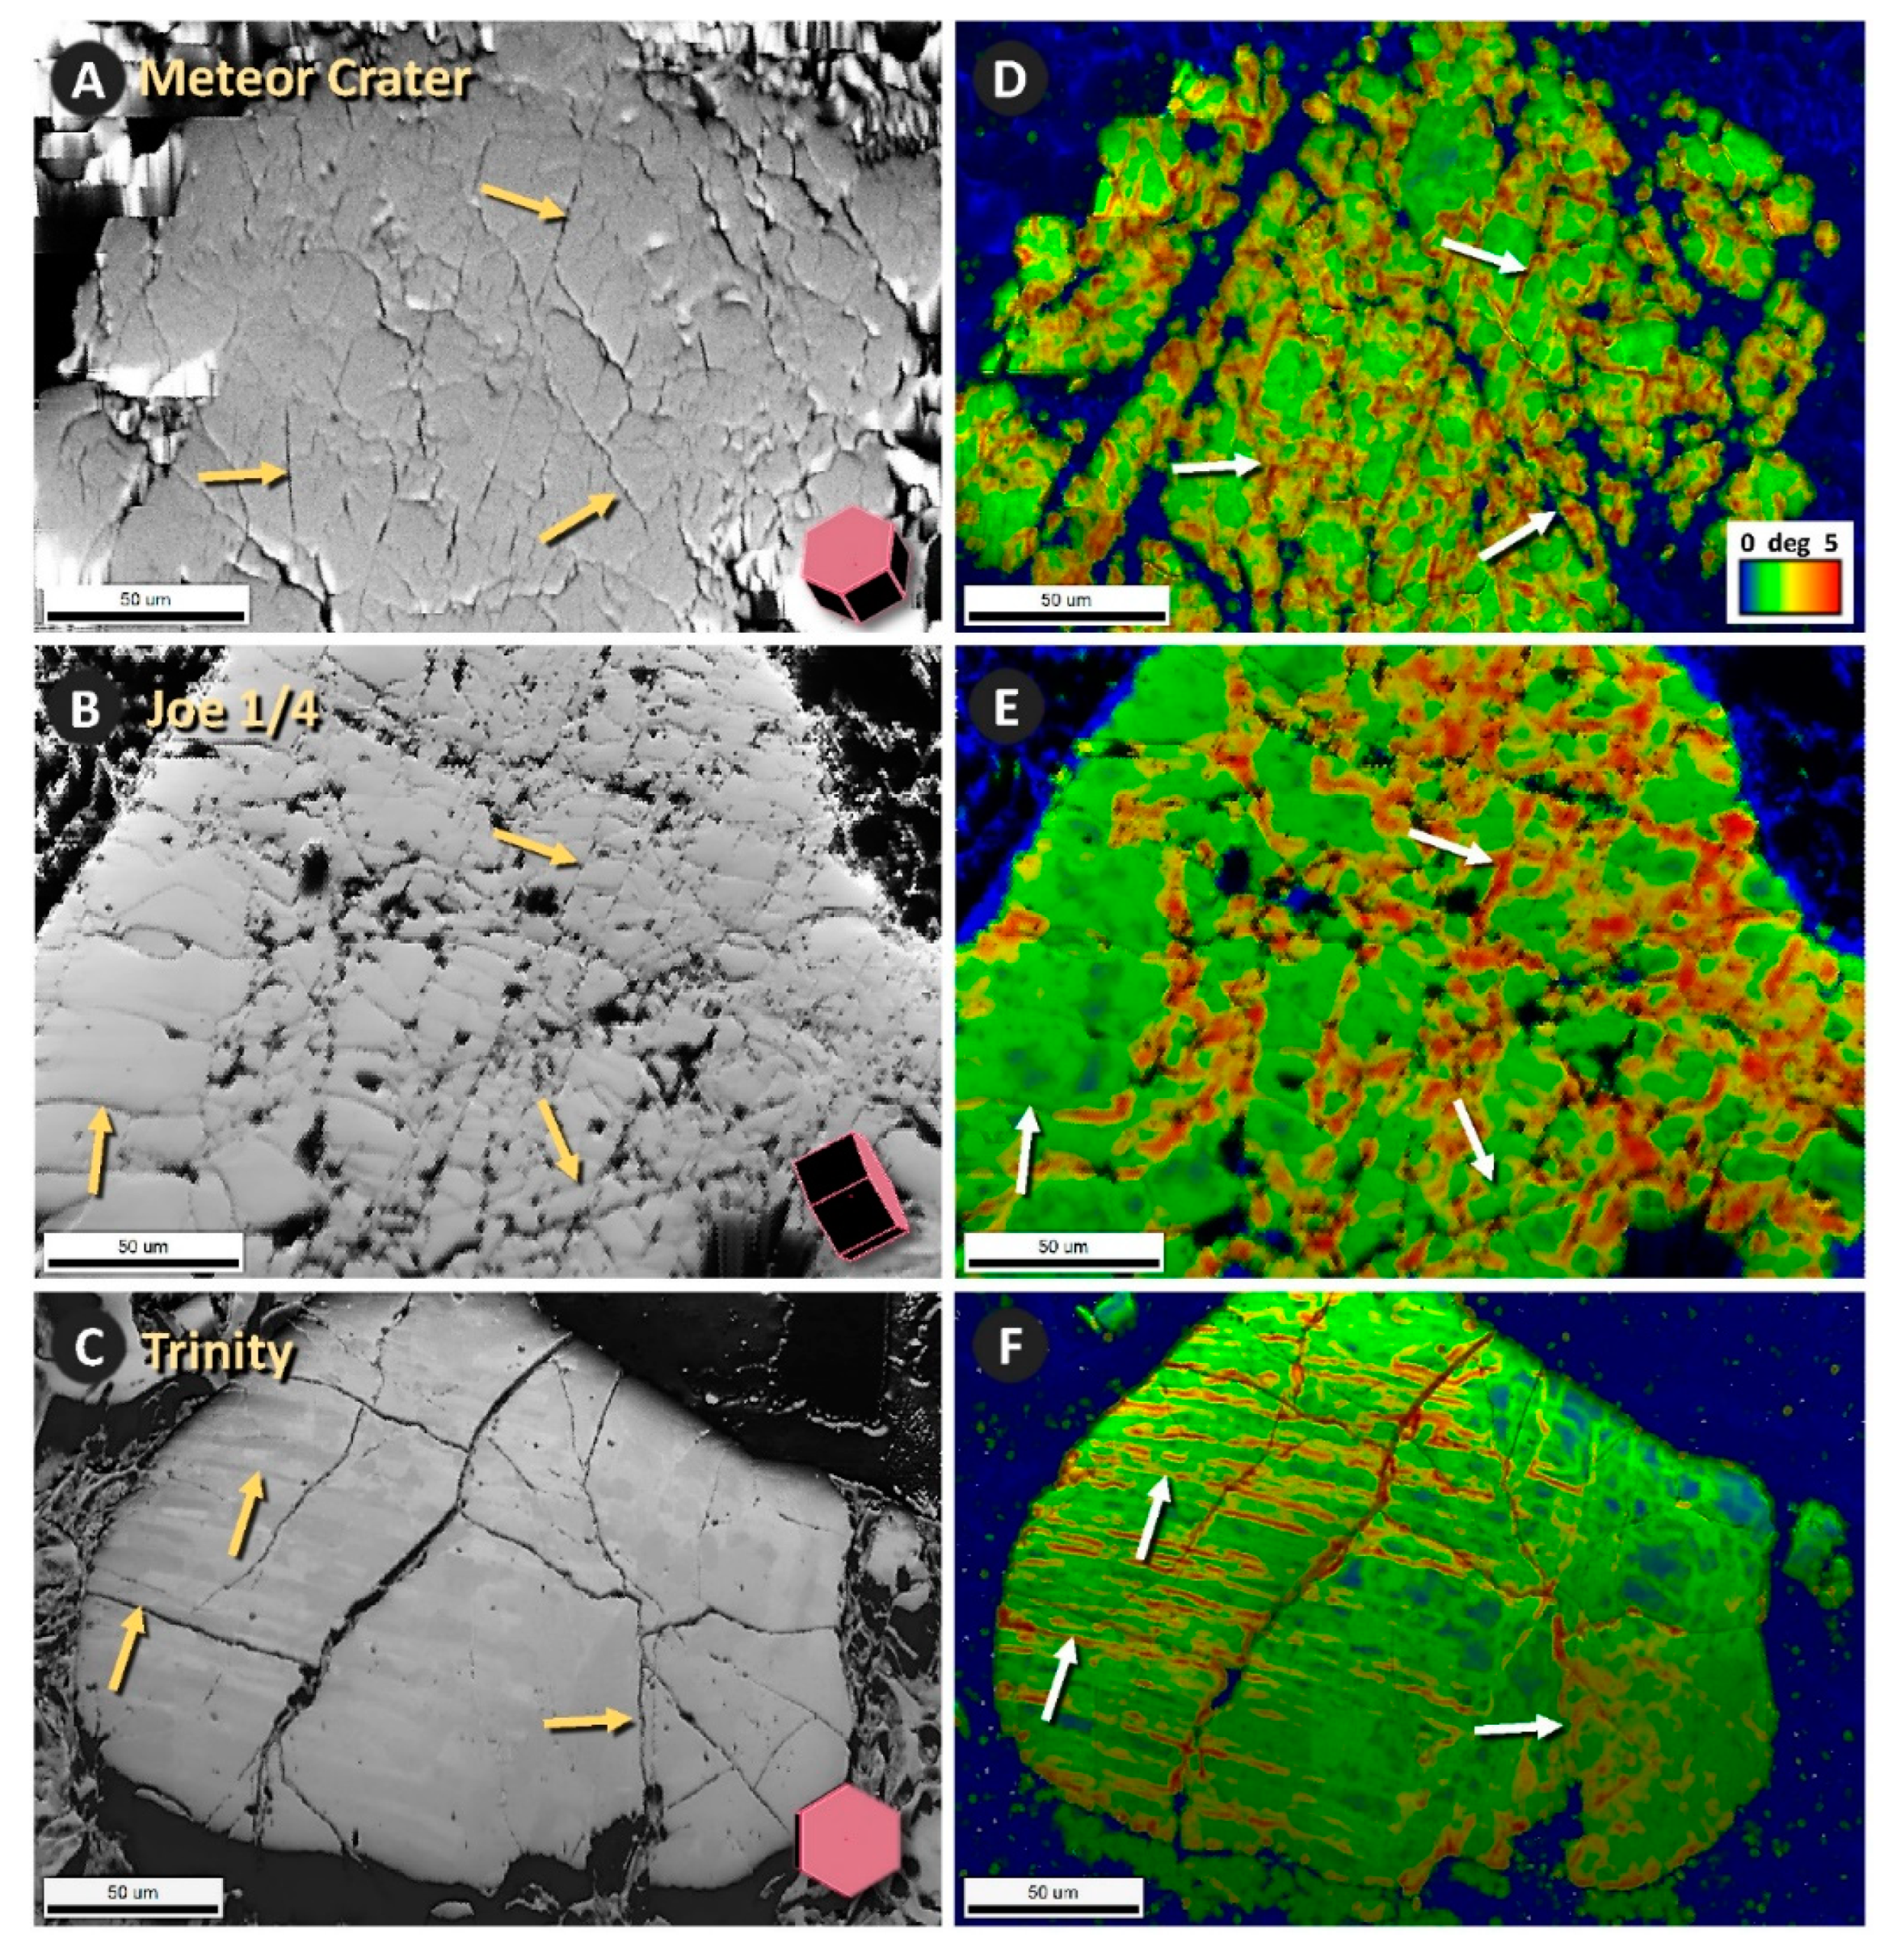
Figure 13.
Images of selected portions of shock-fractured quartz grain 32x08 from Trinity meltglass. A) EBSD “image quality” scan in red is superimposed on an SEM image; arrows mark a pair of oriented, sub-parallel shock fractures with damaged lattice, as indicated by the lack of an EBSD signal (red). (B) Pole figures across the grain with the c-axis (0001) nearly perpendicular to the surface but with Dauphine twins that share two orientations rotated 60 degrees (101 and 011). (C) EBSD map of Euler angle gamma which displays mainly two orientations (green and red). They are related by Dauphine twinning (180 - 30 deg rotation around the c-axis, black lines). Equal area projection. (D) Kikuchi patterns corresponding to EBSD scan in panel C. (E) Image quality and local orientation spread (LOS) image of lattice misorientations (yellow to red) that correspond to the sub-parallel shock fractures at arrows. (F) Close-up SEM-BSE image of oriented shock fractures. Medium gray areas represent amorphous silica, as separately confirmed by SAD, FFT, and TEM-EDS.
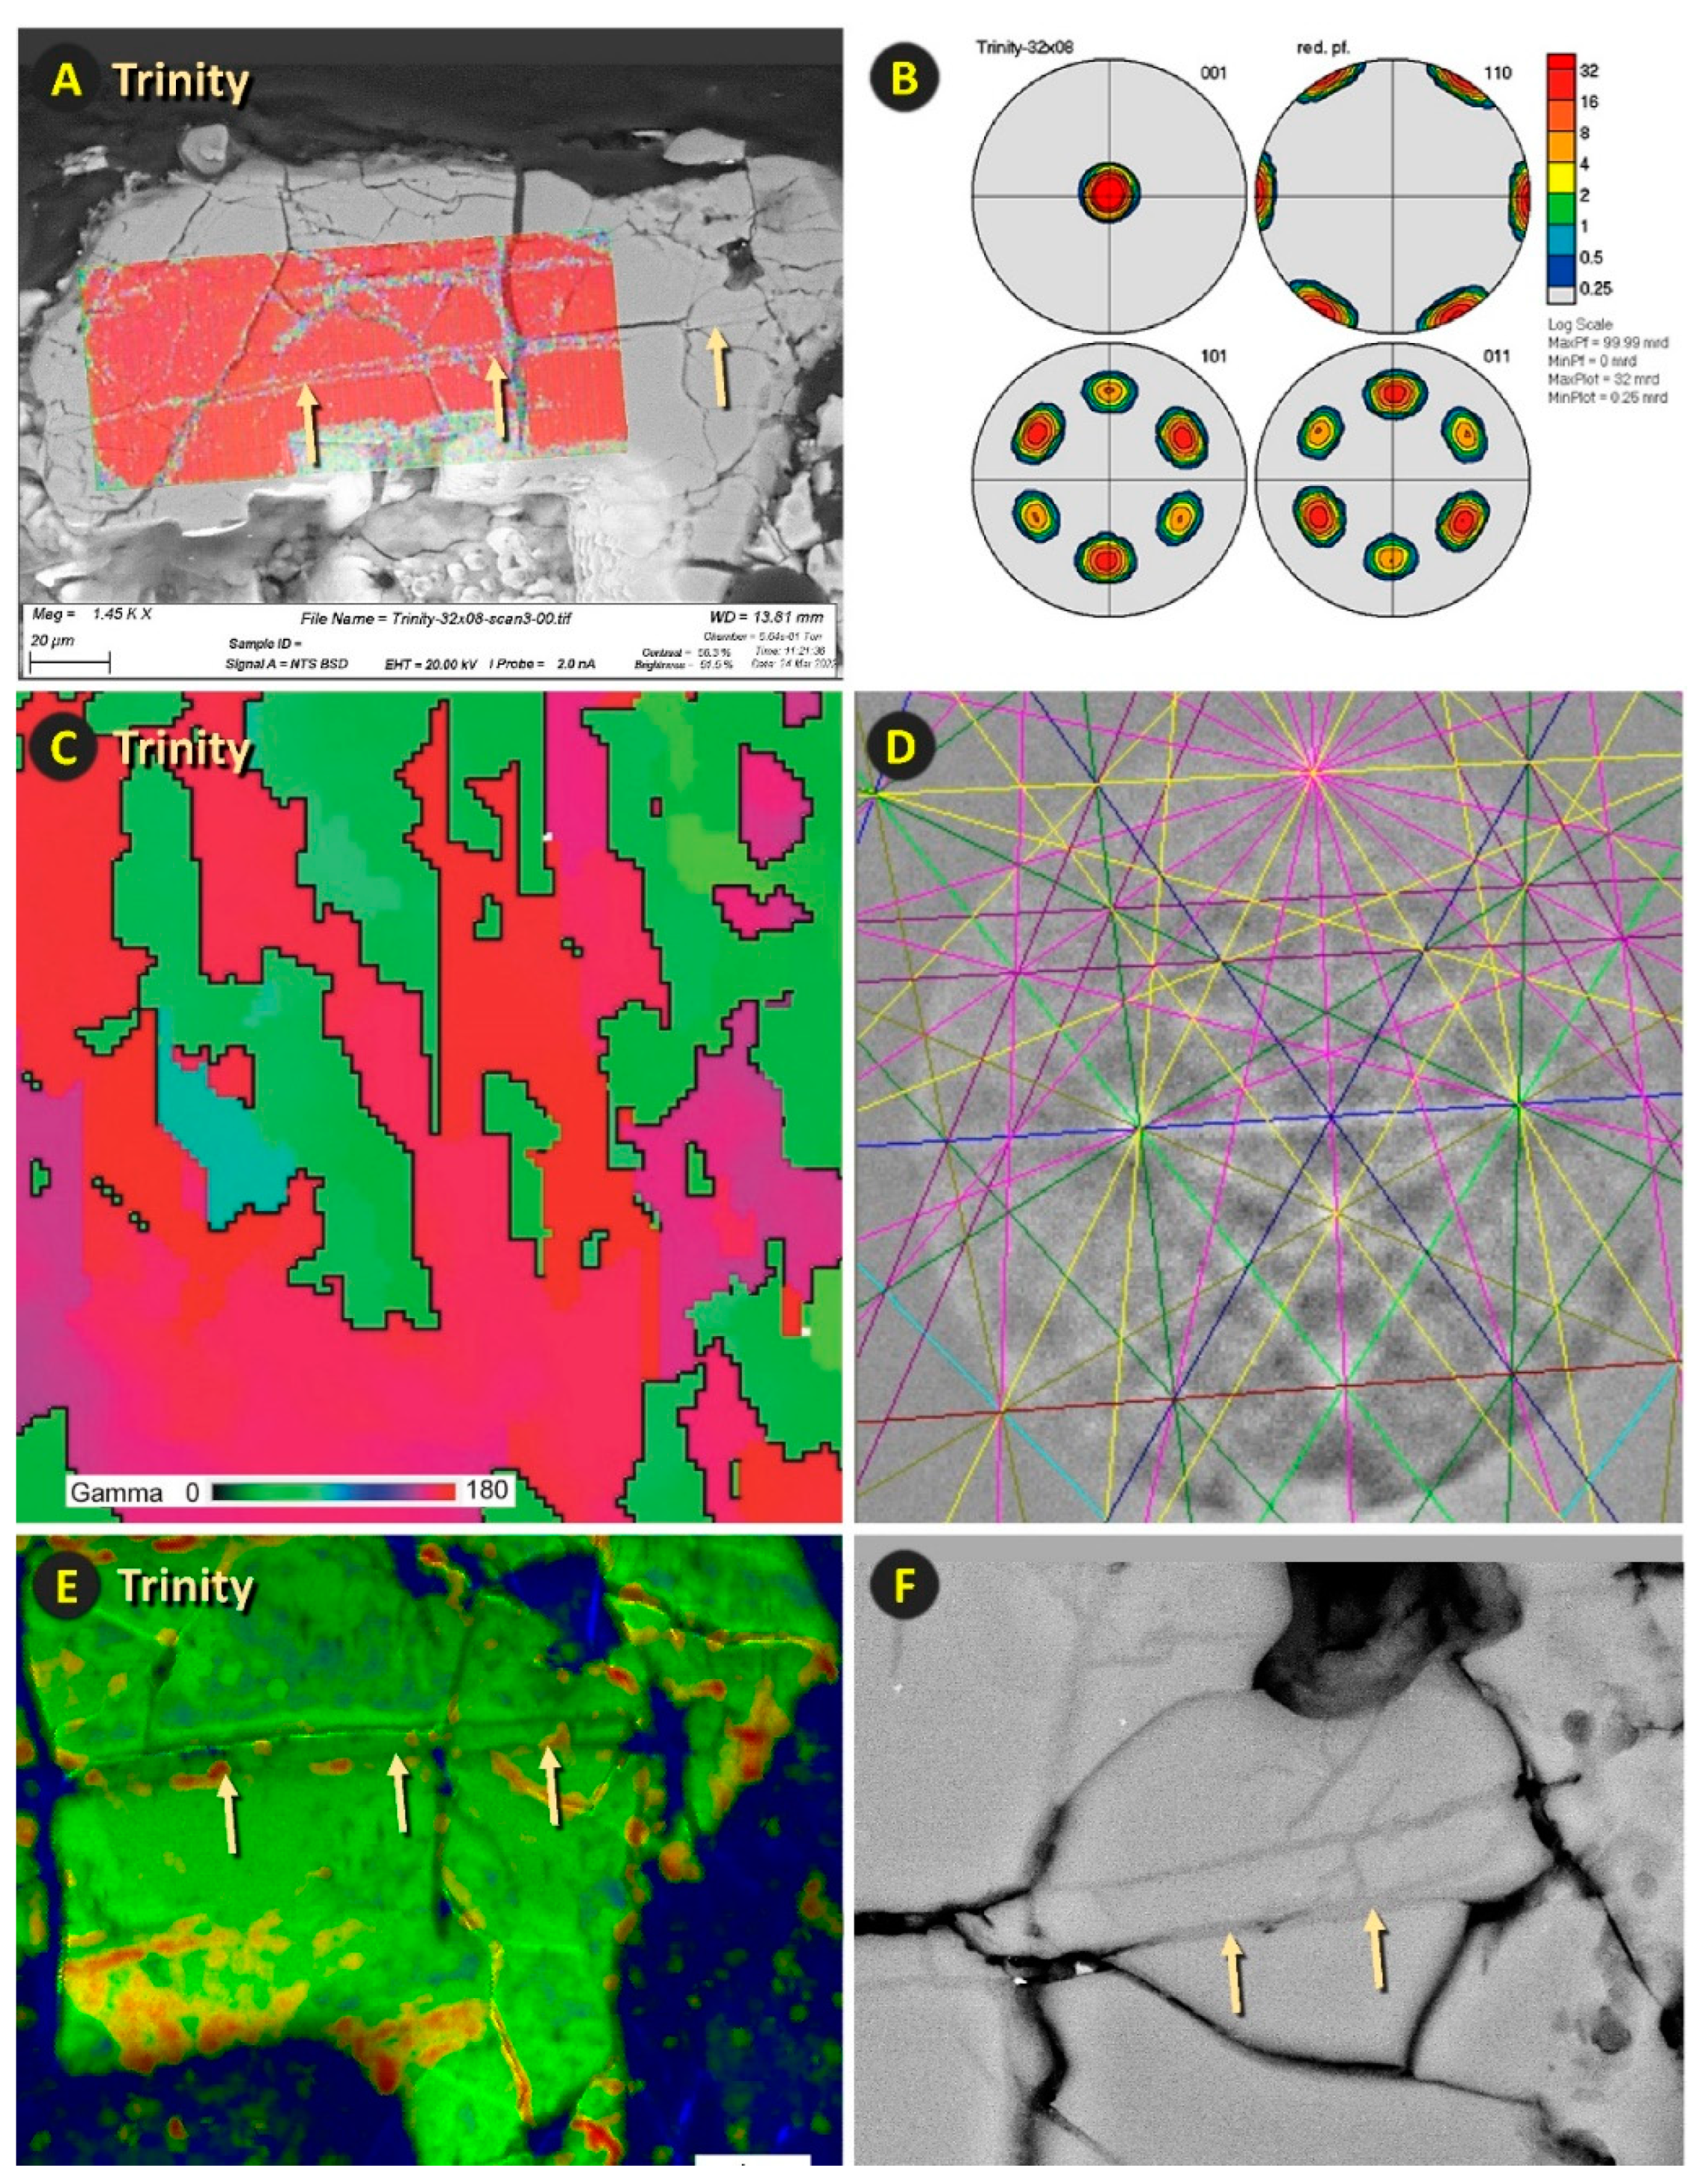
Figure 14.
[Left column] EBSD images using “orientation deviation” values superimposed on “image quality” values and [right column] EBSD “inverse pole Figure” values superimposed on “image quality” values. (A, D) Grain #10x-12 from Meteor Crater, Arizona. (B, E) Grain #19x-12C from the Russian Joe-1/4 nuclear test. (C, F) Grain #09x11 from Trinity meltglass. The inset legend in panel E shows the color-coded crystalline axes for all six panels. These color patterns (not contoured intensity plots) usually correlate with the sample normal relative to crystal orientation. Orientation deviation analyses (left column) show the crystalline misorientation of the grain relative to an average value. Note that the misorientations tend to align with shock fractures (gray-to-black colored) at the white arrows. Inverse pole Figure analyses (right column) illustrate the rotations of areas around the c-axis. In each Figure, the white arrows mark the black outlines of Dauphiné twins that are rotated 60° around the c-axis of these mono-crystalline quartz grains. Panels D through F display good evidence for Dauphine twinning, i.e., a 60 deg rotation around the c-axis. This twinning is represented by the magenta color in panel D, yellow color in E, and red in F. Note that most Dauphiné twins are oriented along shock fractures (gray-to-black colored), suggesting that the twinning formed synchronously with the shock fractures and is common in all quartz grains from the three sites investigated here.
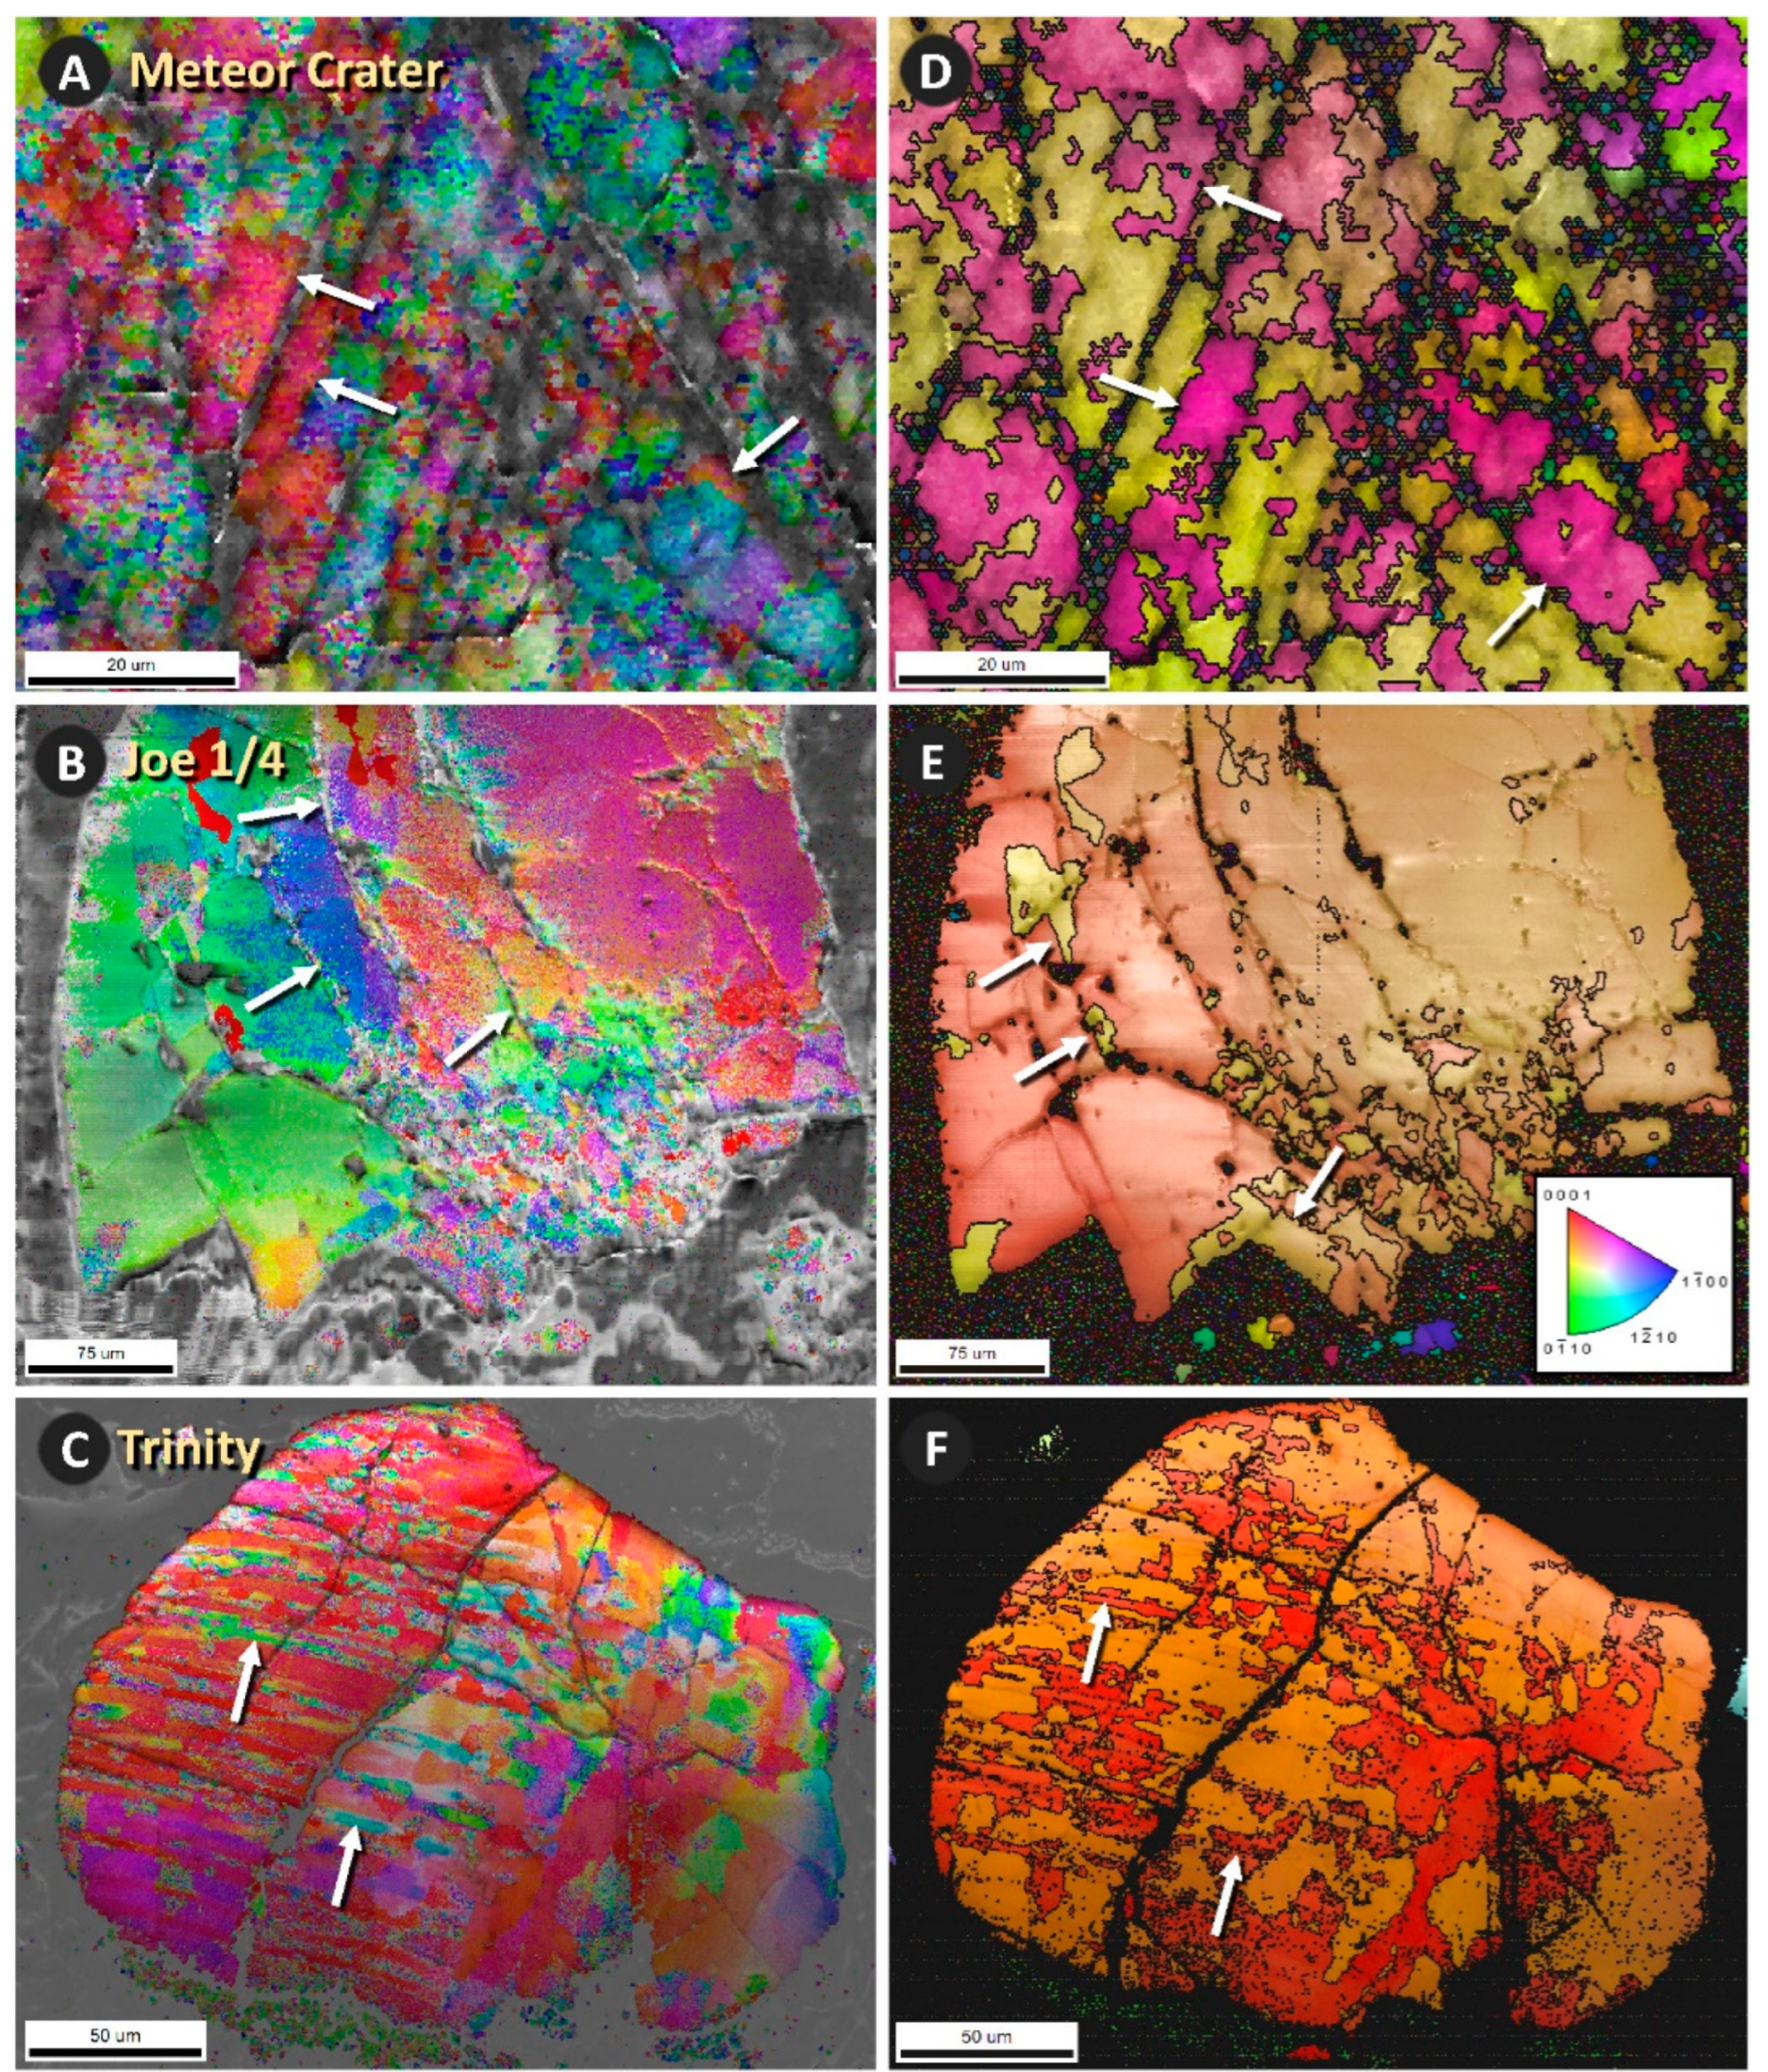

Table 1.
Characteristics of metamorphism of quartz. Shock micro-fractures investigated in this study share 2 of 10 characteristics with planar deformation features (PDFs), 4 of 10 characteristics with planar fractures (PFs), and 2 of 10 with tectonic deformation lamellae (DLs). The green shading represents features in common with shock fractures in our study. Data are mostly derived from French et al. [8].
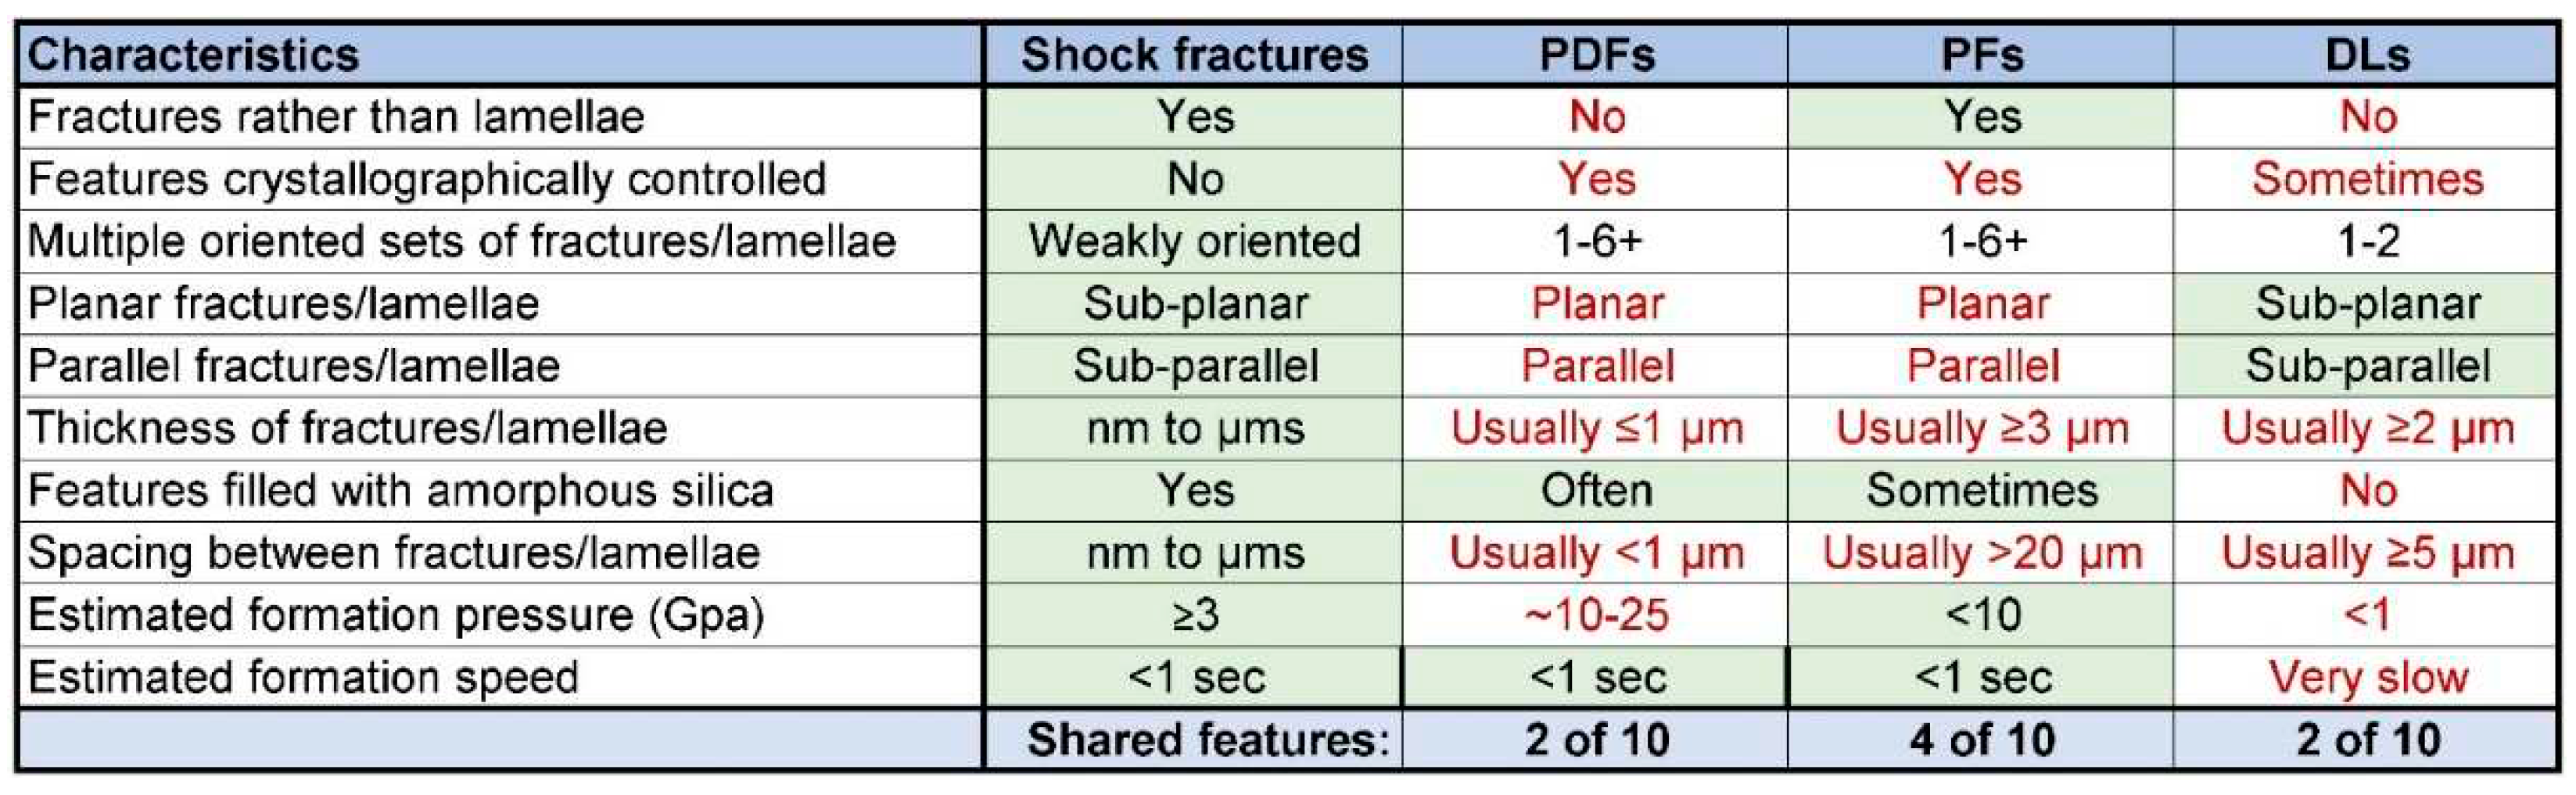
Table 2.
Classification of shock stages for quartz. Based on a study of quartz-rich sandstone from Meteor Crater [32,33]. The scale ranges from unshocked quartz at shock stage 0 to highly shocked quartz at shock stage 4 and melted quartz glass at shock stage 5. Shock-generated fractures with amorphous silica (glass) first appeared at ~5.0 to 5.5 GPa, as indicated by green highlighting. This classification is from Kowitz et al. [11], based on Table 2 of Kieffer [32,33] and modified by others [38,39].
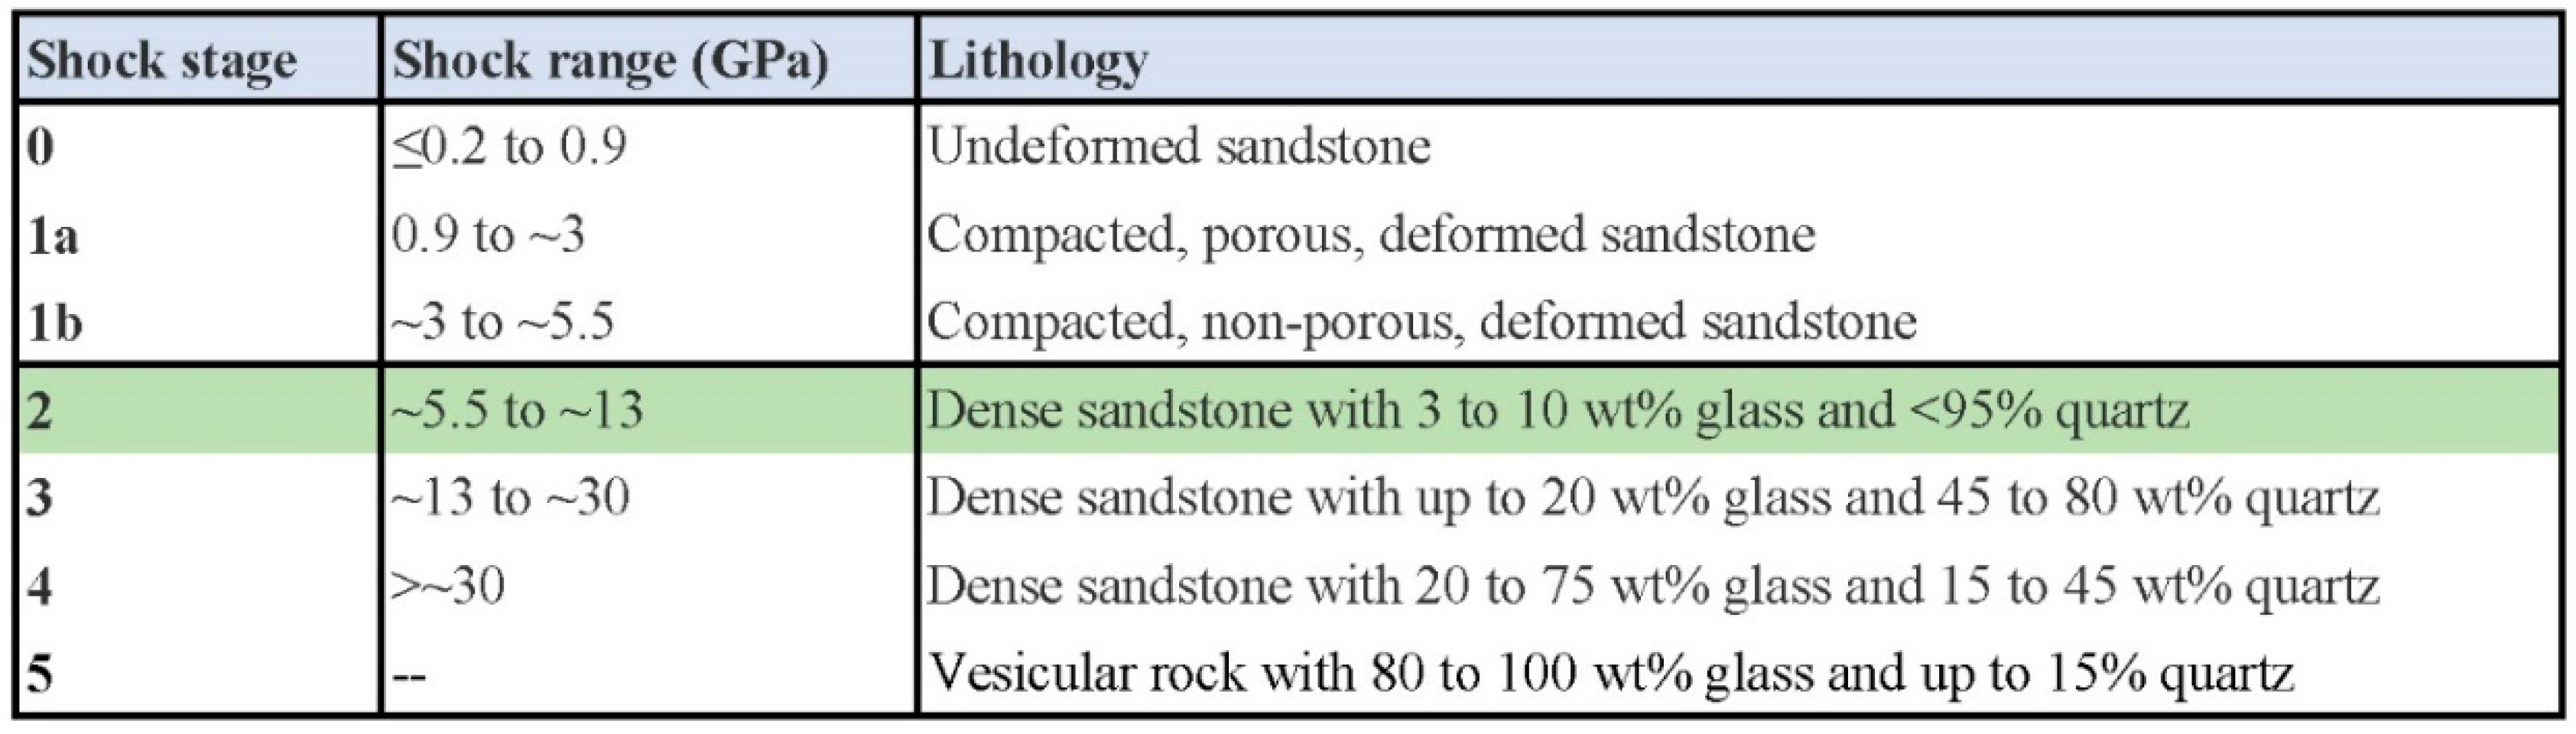
Disclaimer/Publisher’s Note: The statements, opinions and data contained in all publications are solely those of the individual author(s) and contributor(s) and not of MDPI and/or the editor(s). MDPI and/or the editor(s) disclaim responsibility for any injury to people or property resulting from any ideas, methods, instructions or products referred to in the content. |
© 2023 by the authors. Licensee MDPI, Basel, Switzerland. This article is an open access article distributed under the terms and conditions of the Creative Commons Attribution (CC BY) license (http://creativecommons.org/licenses/by/4.0/).
Copyright: This open access article is published under a Creative Commons CC BY 4.0 license, which permit the free download, distribution, and reuse, provided that the author and preprint are cited in any reuse.


