
Submitted:
23 May 2023
Posted:
24 May 2023
You are already at the latest version
Abstract
Recent reports suggest that dysregulation of lipid metabolism is a key feature of the most invasive cancers. To identify potential biomarkers of tumor aggressiveness, we compared the proteomes of two experimental models of malignant mesothelioma in rats exhibiting different invasive properties. Quantitative changes between the most invasive, M5-T1, versus the least invasive, F4-T2, first led to a list of 424 proteins. A second step, cross-comparing this list with 433 proteins distinguishing invasive vs non-invasive tumors, led to identifying 88 proteins that specifically increased and 157 that decreased, respectively, characterizing the most aggressive M5-T1 tumor. Among the 15 mitochondrial proteins found in these lists, the very long-chain specific acyl-CoA dehydrogenase, encoded by the Acadvl gene and involved in fatty acid beta oxidation, appeared to play an important role in the metabolic reprogramming of the tumor microenvironment. Immunohistochemical staining of tumor sections confirmed increased expression of Acadvl in the M5-T1 tumor. Finally, the dramatic increase and decrease, observed in 25 and 17 proteins, respectively, suggested the existence of a strong link between mitochondrial events and modifications of the extracellular matrix, immune cell components or other subcellular compartments. These findings highlight some important aspects of the tumor microenvironment changes linked to aggressiveness.
Keywords:
Cancer
; Aggressiveness
; Mitochondria
; Acadvl
; Fatty acid beta oxidation
; Biomarker
; Proteomics
; Malignant mesothelioma
1. Introduction
According to the National Cancer Institute dictionary of cancer terms, the term “aggressive” describes “a tumor that forms, grows, or spreads quickly”. For malignant mesothelioma, this term is frequently preferred to “invasive”, which defines cancers that “spread beyond the layer of tissue in which it developed”, especially for cases associated with the poorest clinical outcomes [1]. For aggressive tumors, investigations of their molecular alterations are useful tools that may improve clinical decisions and patient outcomes [2]. Previous studies have shown the usefulness of proteome studies as considerable discordance can be found between genomic mutations and protein expression levels, due to post-transcriptional regulation [3]. This approach recently led to identifying biomarkers that characterized highly aggressive tumor behavior [4]. Applied to the study of a highly invasive experimental tumor model, it also provided lists of candidate biomarkers exhibiting abundance changes associated with liver metastatic colonization, thus representing potential therapeutic targets [5].
In this field, numerous insights suggest that dysregulation of lipid metabolism is a major characteristic of highly invasive cancers, given its involvement in energy, changes in the composition of membranes, and signaling pathways [6]. This process is also associated with the epithelial-to-mesenchymal transition (EMT), Warburg effect, and extracellular matrix remodeling that frequently characterize these cancers [7].
Among the different metabolic pathways, alterations in fatty acid metabolism have been reported to contribute to aggressiveness in melanoma [8]. The role of cancer-associated adipocytes (CAAs), a new player in EMT in tumor microenvironment changes, was also emphasized [9]. Even naïve adipocytes were reported to be a key contributor to melanoma progression at a distance by providing extracellular vesicles that transfer both protein machinery and fatty acid substrates to cancer cells [10]. Given these recent insights into the role of mitochondria in tumor aggressiveness, in this study we first aimed to identify mitochondrial proteins whose abundance changes differentiate a deeply invasive from a mildly invasive experimental peritoneal mesothelioma designed in an immunocompetent rat strain. Among the fifteen mitochondrial proteins found, only one enzyme was involved in fatty acid beta oxidation (FAO). The marked increase and decrease, observed in 25 and 17 other candidate biomarkers of aggressiveness, respectively, led us to identify potential links between this mitochondrial enzyme and parallel changes in other subcellular compartments and the tumor microenvironment.
2. Materials and Methods
2.1. Rat Tumor Tissues for Proteomic Analyses
The formalin-fixed paraffin embedded (FFPE) tissue samples used in this study were taken from the same groups of Fisher F344 rats with four different experimental mesotheliomas of increasing stages of invasiveness, as previously described [11]. To generate the tumors, the experimental procedures used for in vivo manipulations in the UTE-IRS UN (Unité Thérapeutique Expérimentale de l’Institut de Recherche en Santé de l’Université de Nantes) between 2011 and 2015 followed the European Union guidelines for the care and use of laboratory animals in research protocols (approval #01257.03 of the French Ministry of Higher Education and Research (MESR)). The rats were purchased from Charles River Laboratories (L’Arbresle, 69210, France) and the experiments approved by the ethics committee for animal experiments (CEEA) of the Pays de la Loire Region under the recorded number 2011.38. The non-invasive M5-T2, mildly invasive F4-T2, moderately invasive F5-T1 and deeply invasive M5-T1 tumors were collected after intraperitoneal injection of 3 x 10⁶ cells of the corresponding cell lines (https://technology-offers.inserm-transfert.com/offer/, recorded as RT00418, RT00419, RT00421 and RT00417, respectively) to syngeneic rats.
2.2. Proteomic Analyses
For each sample analyzed, four or five 20 µm-thick sections of tumor tissue were scratched with a scalpel and collected in a 1.5-mL Eppendorf® microtube, and all the material collected deparaffinized in three successive xylene washes, then rehydrated in 100%, 95%, 70% and 50% ethanol solutions. The pellets were vacuum-dried, and the dried tissues resuspended in 200 µL of Rapigest SF (Waters, Milford, MA, USA). Dithiothreitol (AppliChem, Darmstadt, Germany) was then added (5 mM final concentration), and the samples incubated in a thermo shaker at 95°C for one hour, and then sonicated twice (ultrasonic processor 75,185, Bioblock Scientific, Illkirch, 67400, France). Cystein residues were alkylated by adding 200 mM of S-Methyl methanethiosulfonate at 37°C (10 mM final concentration). Sequencing-grade trypsin was added in a ratio ≥ 2 µg mm-3 tissue (at 37°C overnight), the reaction was stopped with formic acid (9% final concentration, incubation at 37°C for one hour), and the acid-treated samples were centrifuged at 16,000 g for ten minutes. After removing the salts from the supernatant, the peptides were collected in a new Eppendorf® microtube using C18 STAGE tips, and their concentration finally determined using the Micro BCA™ Protein Assay Kit (Thermo Fisher Scientific, St Herblain, 44800, France). The rat spectral library, SWATH-MS analysis, peptide identification, and relative quantification were performed as previously described [11]. The statistical analysis of the SWATH data set, peak extraction output data matrix from PeakView was imported into MarkerView (v.2, AB Sciex Pte, Ltd., Framingham, MA, USA) for data normalization, and relative protein quantification. Proteins with a statistical p-value < 0.05 estimated by MarkerView were considered to be differentially expressed under different conditions.
2.3. Histology and Immunohistochemical Analyses
The FFPE blocs were cut with a Leica RM2255 microtome (Leica Biosystems, Nussloch, Germany). Areas of interest for both proteomic and histological analyses were selected based on examination of sections of all samples stained with hematoxylin phloxine saffron (HPS), scanned on a Nanozoomer 2.0 HT Hamamatsu. For immunohistochemistry, tumor tissue sections were stained with anti-ACADVL antibody (NBP1-89287, BIO-TECHNE, Chatillon sur Seiche, 35092, France).
3. Results
3.1. Biomarkers of Deep Invasiveness and Immunosuppression
The procedure we used to identify mitochondrial biomarkers specifically related to the most aggressive tumor phenotype included four successive steps. First, we established a list of 433 proteins associated with the acquisition of invasive properties by comparing the proteome of the three invasive tumor models (F4-T2, F5-T1 and M5-T1) with that of the non-invasive tumor M5-T2 (Figure 1, step 1). In a second step, the comparison of the proteomes of the most invasive tumor, M5-T1 vs the least invasive, F4-T2, led to 424 proteins showing significant abundance changes (Figure 1, step 2). Next, we cross-referenced the two listings, defining two main subgroups within these 424 proteins. The first subgroup of 163 proteins that was common to the two listings was excluded from our study (supplementary Table S1). The second subgroup of 245 proteins showing abundance changes related only to deeply invasive properties and immunosuppression (Figure 1, steps 2 and 3), was analyzed in more detail in this study. The last 16 remaining proteins, which corresponded to tendencies towards an increase or decrease (with 0.05 < p < 0.085, supplementary Table S2), were also excluded from the study. Interestingly, however, this list contained 4 proteins for which p-values were < 0.001 in the comparison between M5-T1 and F4-T2 tumors, including a cytoskeletal protein (encoded by Fscn1), two proteins involved in transcription (encoded by Hmga1 and Wt1), which all increased, and a protein secreted to blood (encoded by Cp), which decreased.
3.2. Mitochondrial Proteins Specifically Changed in the Deeply Invasive M5-T1 Tumor
Next, we recorded the subcellular/extracellular locations of these proteins on https://www.proteinatlas.org (accessed on February 9, 2023), and 15 proteins exclusively located in mitochondria were identified, 7 showing an increase and 8 a decrease (Figure 1, step 4).
The role of the seven increased mitochondrial proteins (encoded by Aldh4a1, Hibadh, Pcca, Letm1, Acadvl, Pdha1, and Sfxn1) is summarized in Figure 2A and their abundance changes illustrated in Figure 2B. The main functions of the eight decreased mitochondrial proteins (encoded by Slc25a5, Aldh2, Cox4i1, Dld, Fh, Grpel1, Sdha, and Sod2) are summarized in Figure 2C and their abundance changes illustrated in Figure 2D.
3.3. Main Abundance Changes in Proteins Representing Potential co-Biomarkers of Aggressiveness
In parallel to mitochondrial events, dramatic abundance changes were also observed for other protein localizations that represented potential co-biomarkers of aggressiveness. A first important category corresponded to proteins in the extracellular matrix (ECM), nine being increased and one decreased (Figure 3A). A second group was represented by enzymes involved in different metabolic pathways, four being increased and three decreased (Figure 3B). A third group was involved in intracellular trafficking, four being increased and one decreased (Figure 3C). Of the proteins that only increased, three cytoskeletal, one proteasomal, one scaffold protein and three involved in the regulation of gene expression were found (Figure 3D-F). Regarding proteins that only decreased, five corresponded mostly to immune cell components (Figure 4A), one in the coagulation system (Figure 4B), two involved in cell differentiation (Figure 4C), two in signal transduction (Figure 4D), and two in iron storage and transport (Figure 4E).
Figure 3.
Abundance changes involved in tumor agressiveness (part I). A, Extracellular matrix proteins. B, Metabolism. C, Intracellular trafficking. D, Cytoskeleton. E, Proteasome. F, Scaffolding proteins. G, Regulation of gene expression. .
Figure 3.
Abundance changes involved in tumor agressiveness (part I). A, Extracellular matrix proteins. B, Metabolism. C, Intracellular trafficking. D, Cytoskeleton. E, Proteasome. F, Scaffolding proteins. G, Regulation of gene expression. .
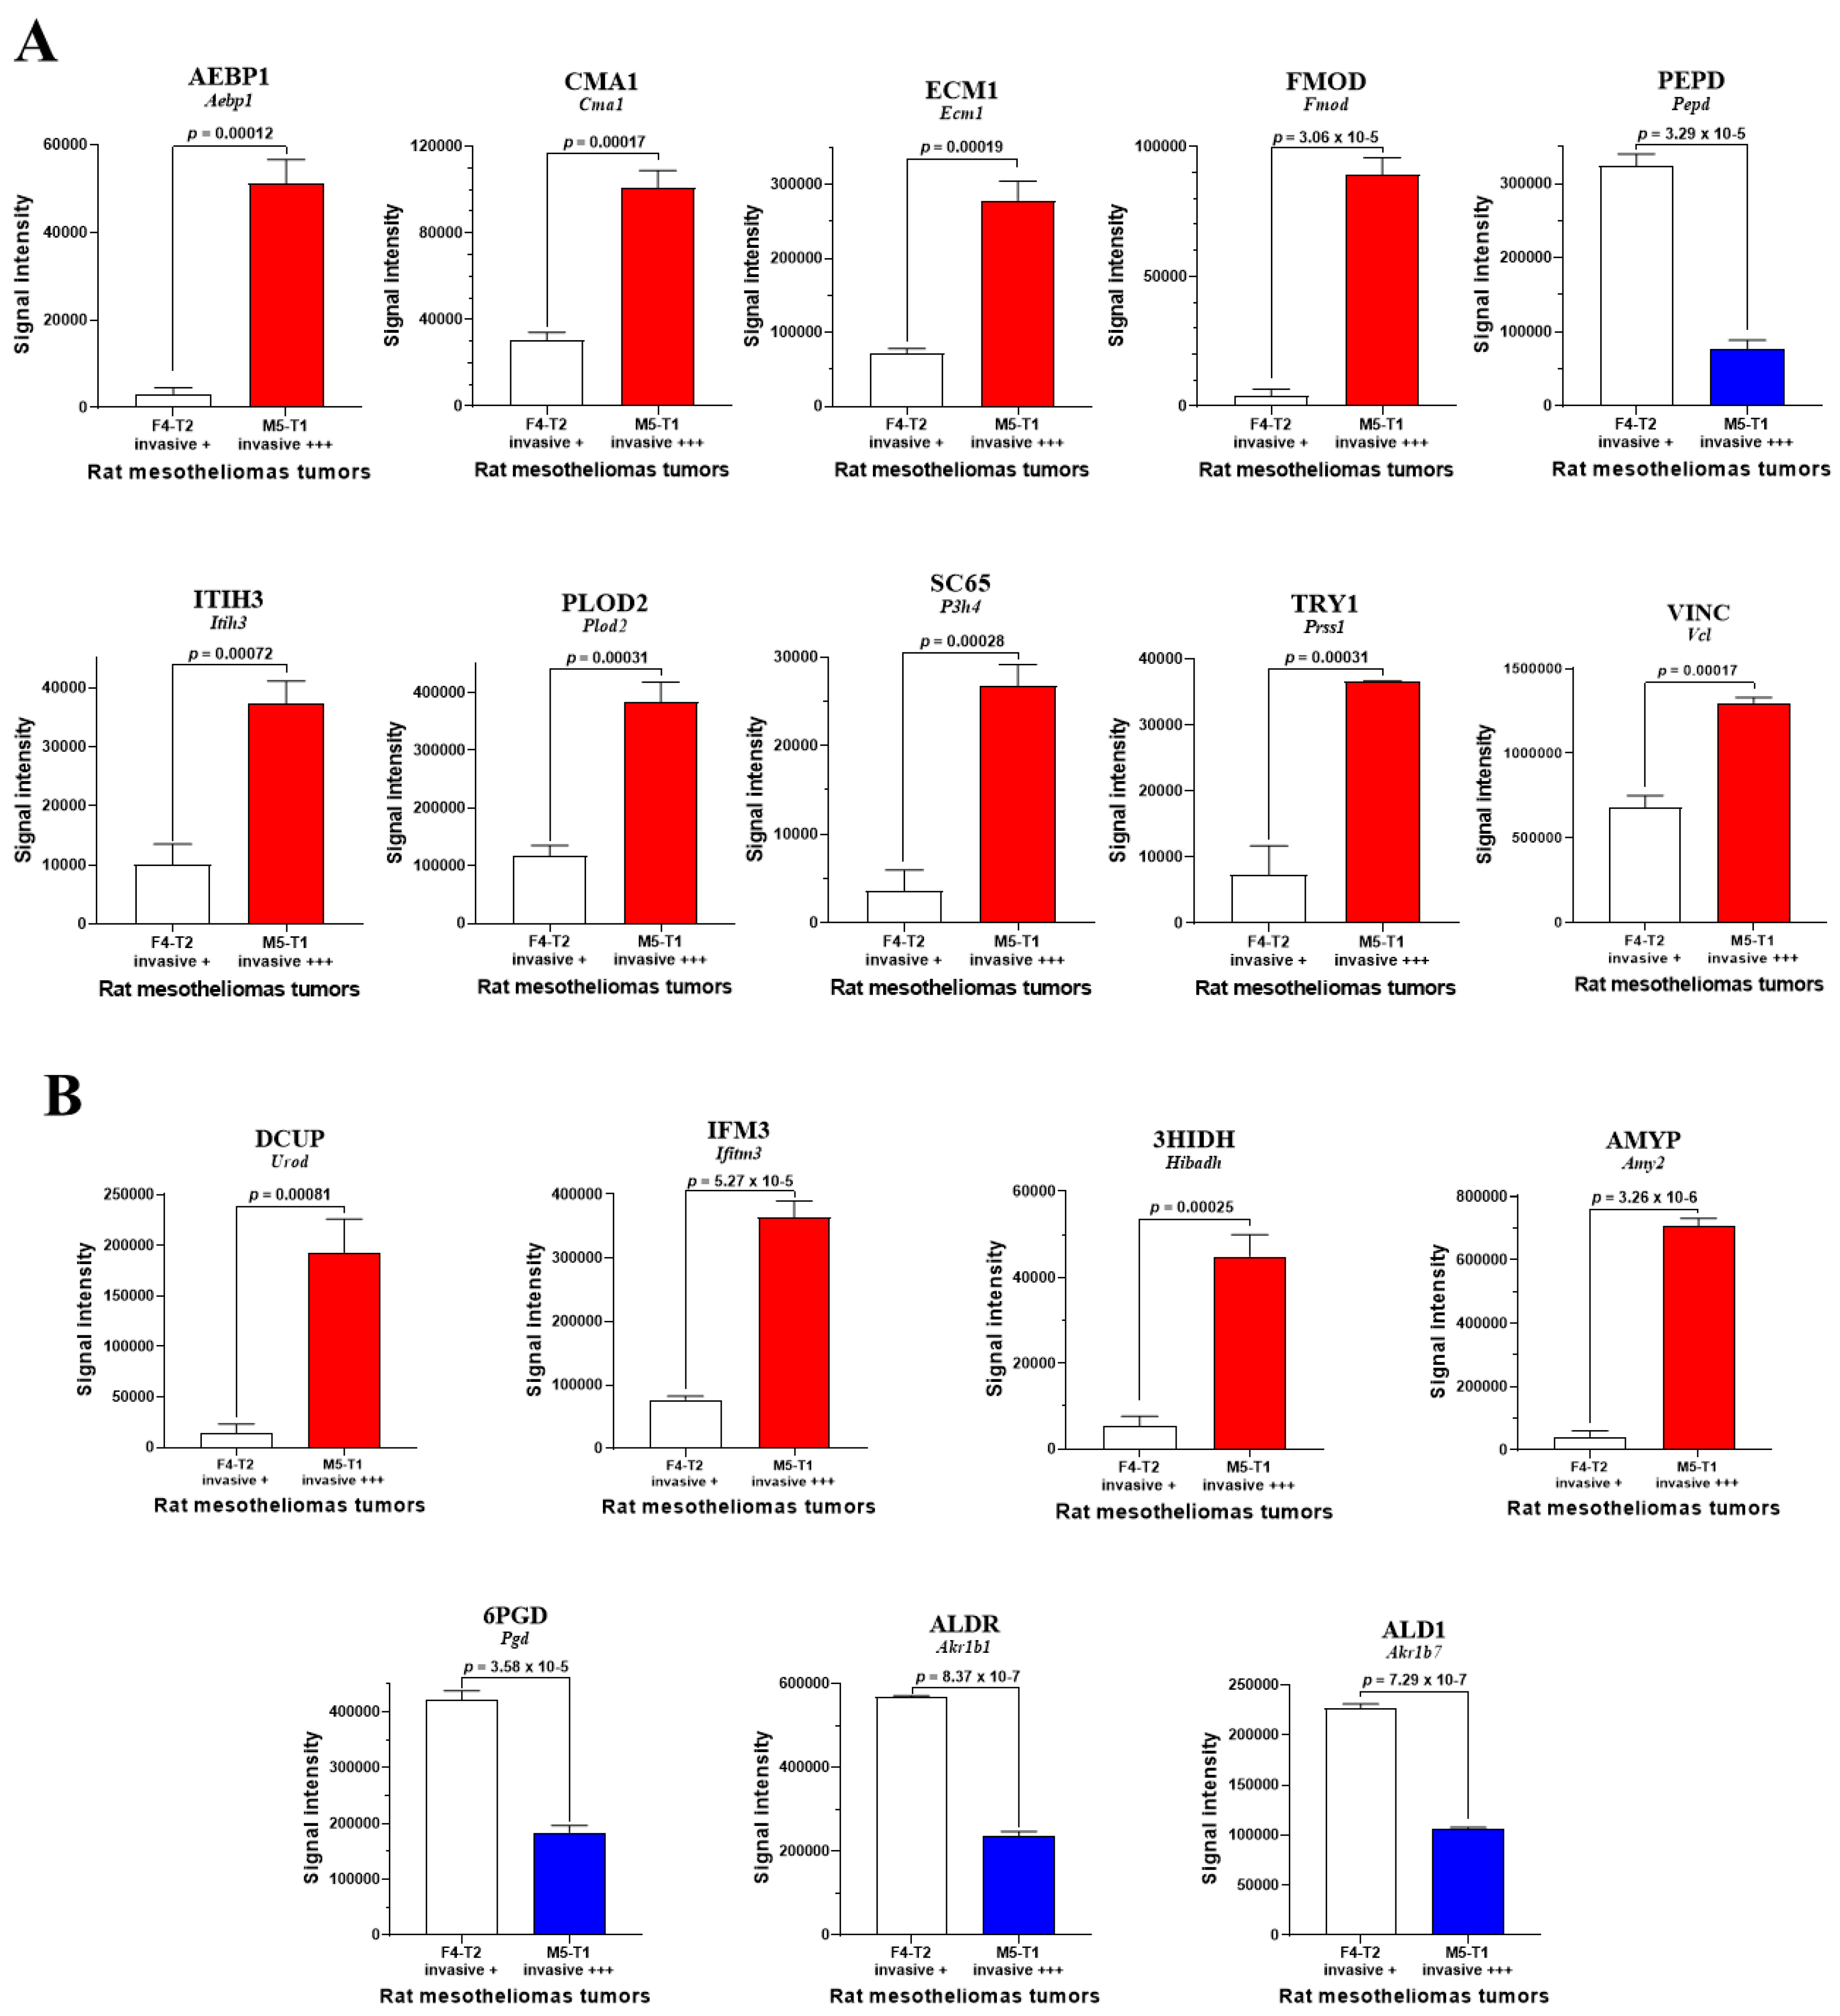
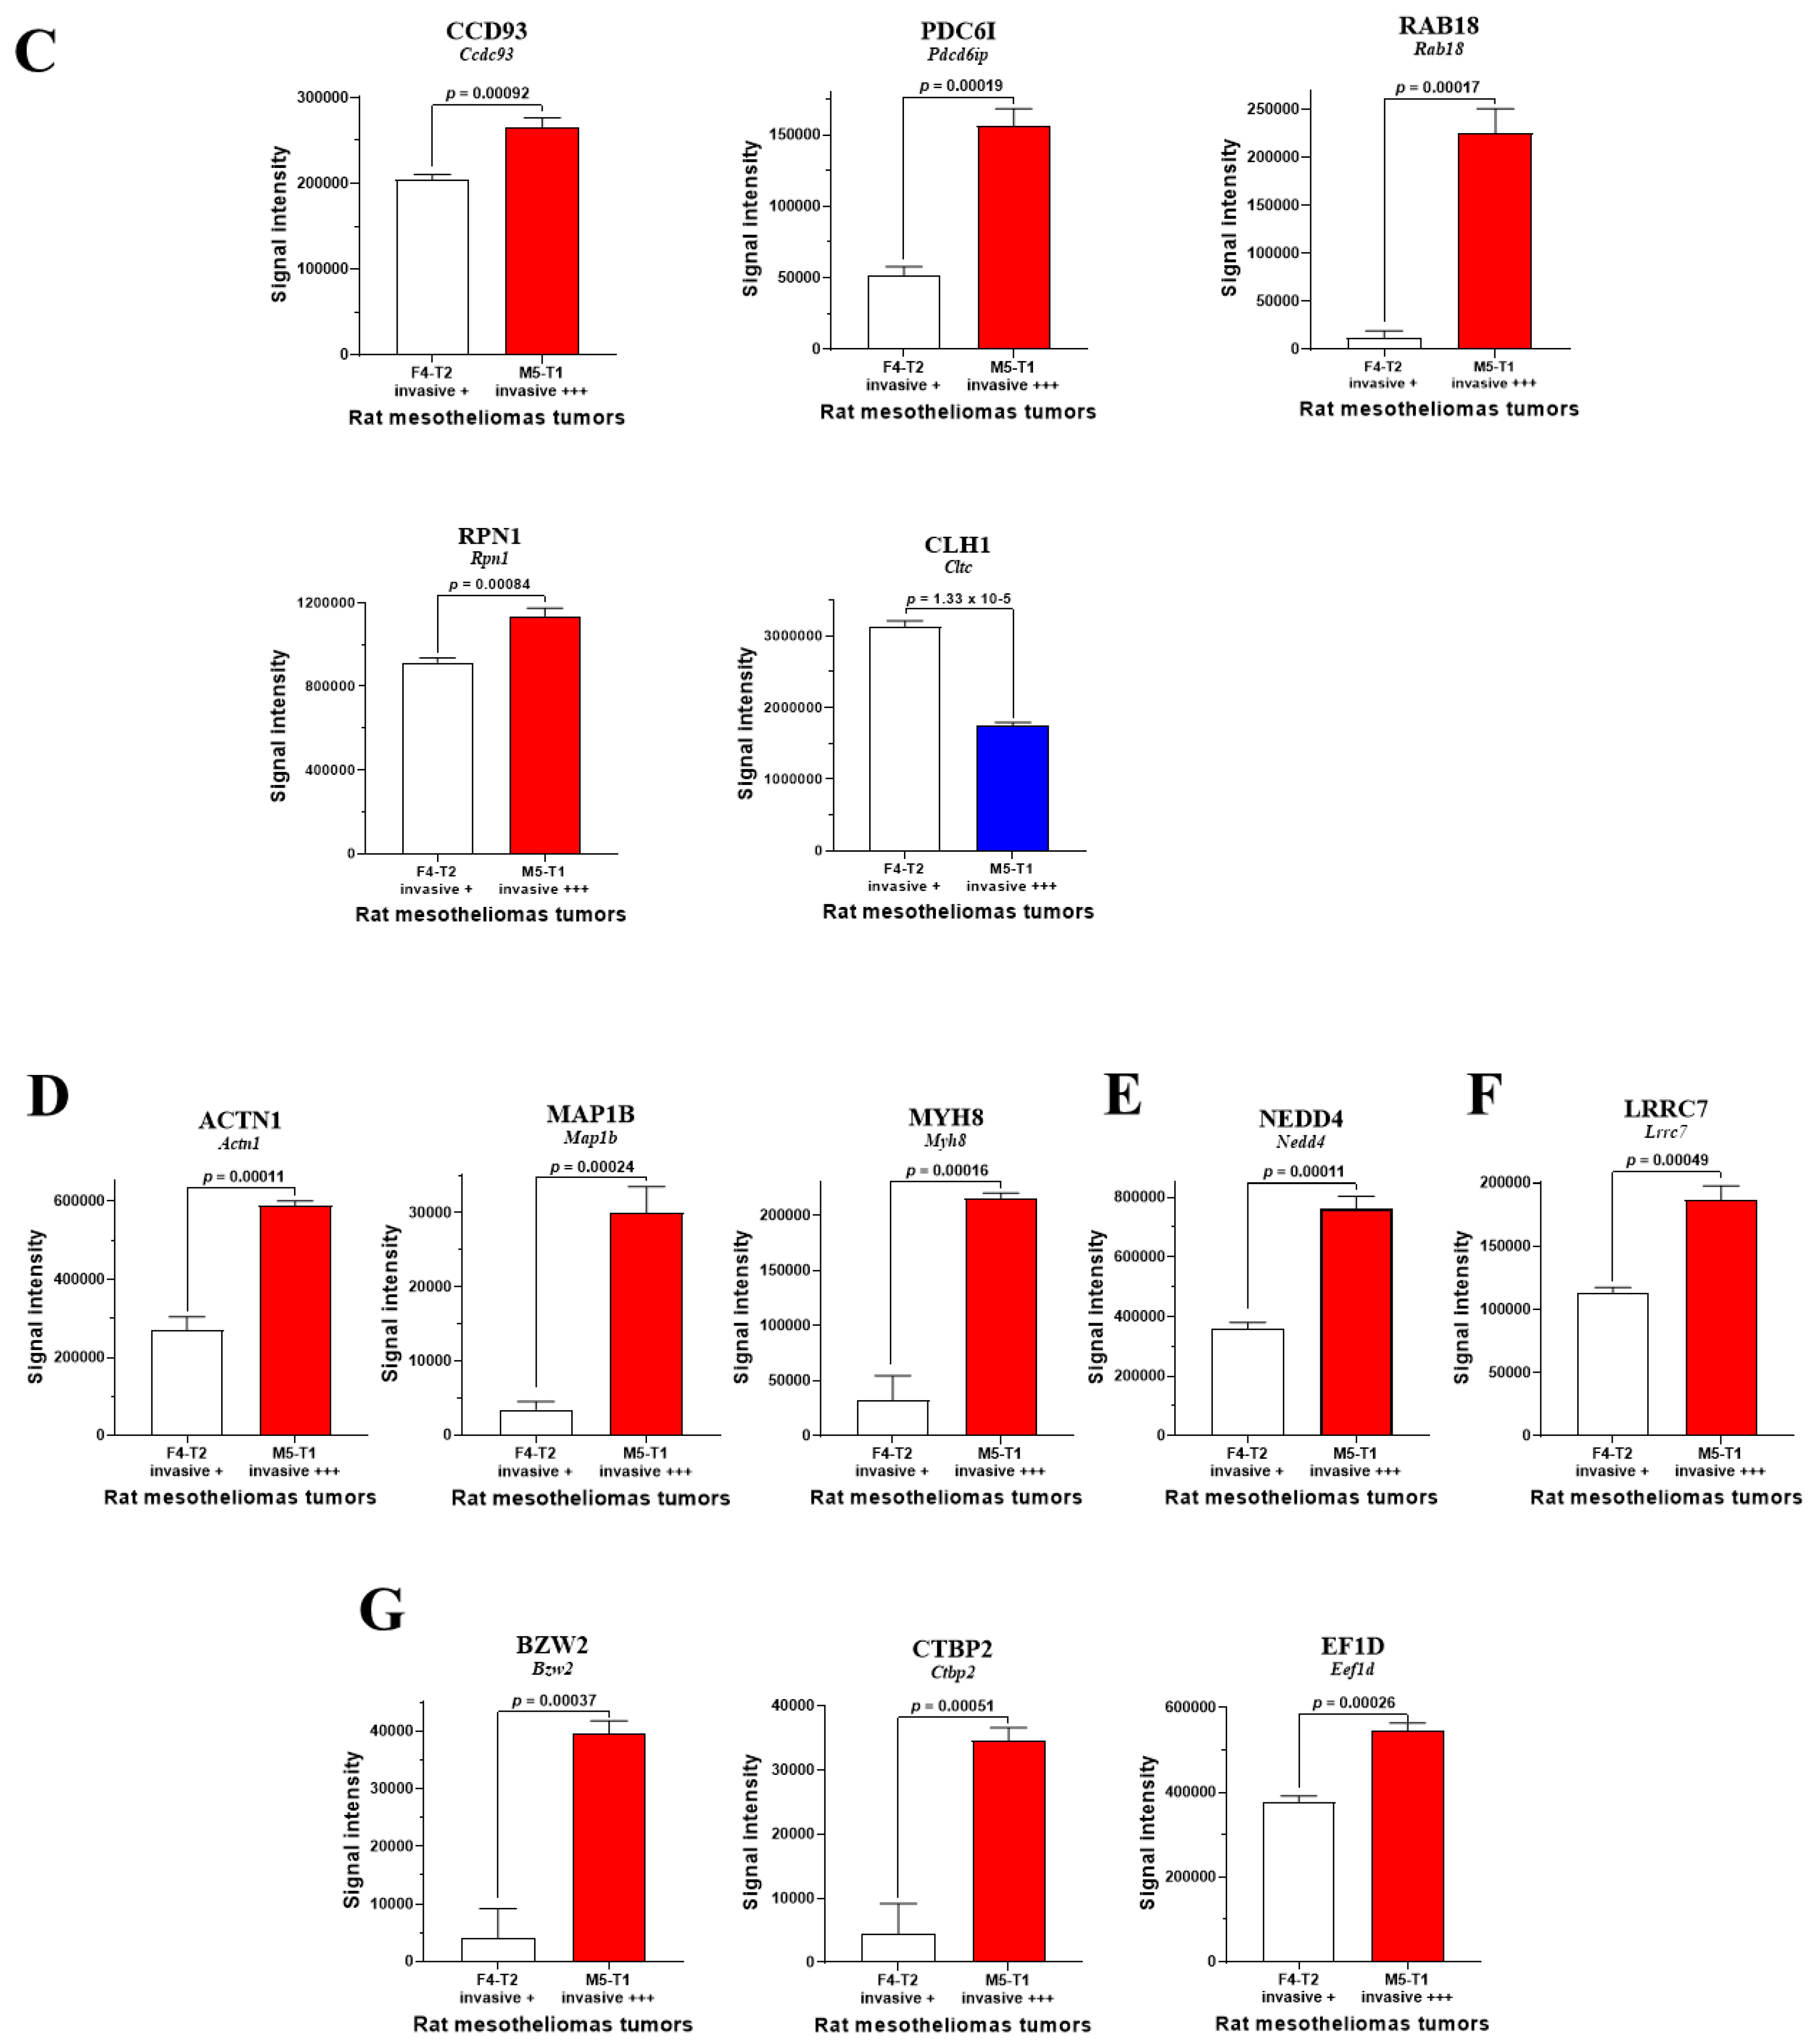
Figure 4.
Additional abundance decreases involved in tumor agressiveness (part II). A, Immune response. B, Coagulation. C, Cell differentiation. D, Signal transduction. E, Iron storage and transport.
Figure 4.
Additional abundance decreases involved in tumor agressiveness (part II). A, Immune response. B, Coagulation. C, Cell differentiation. D, Signal transduction. E, Iron storage and transport.
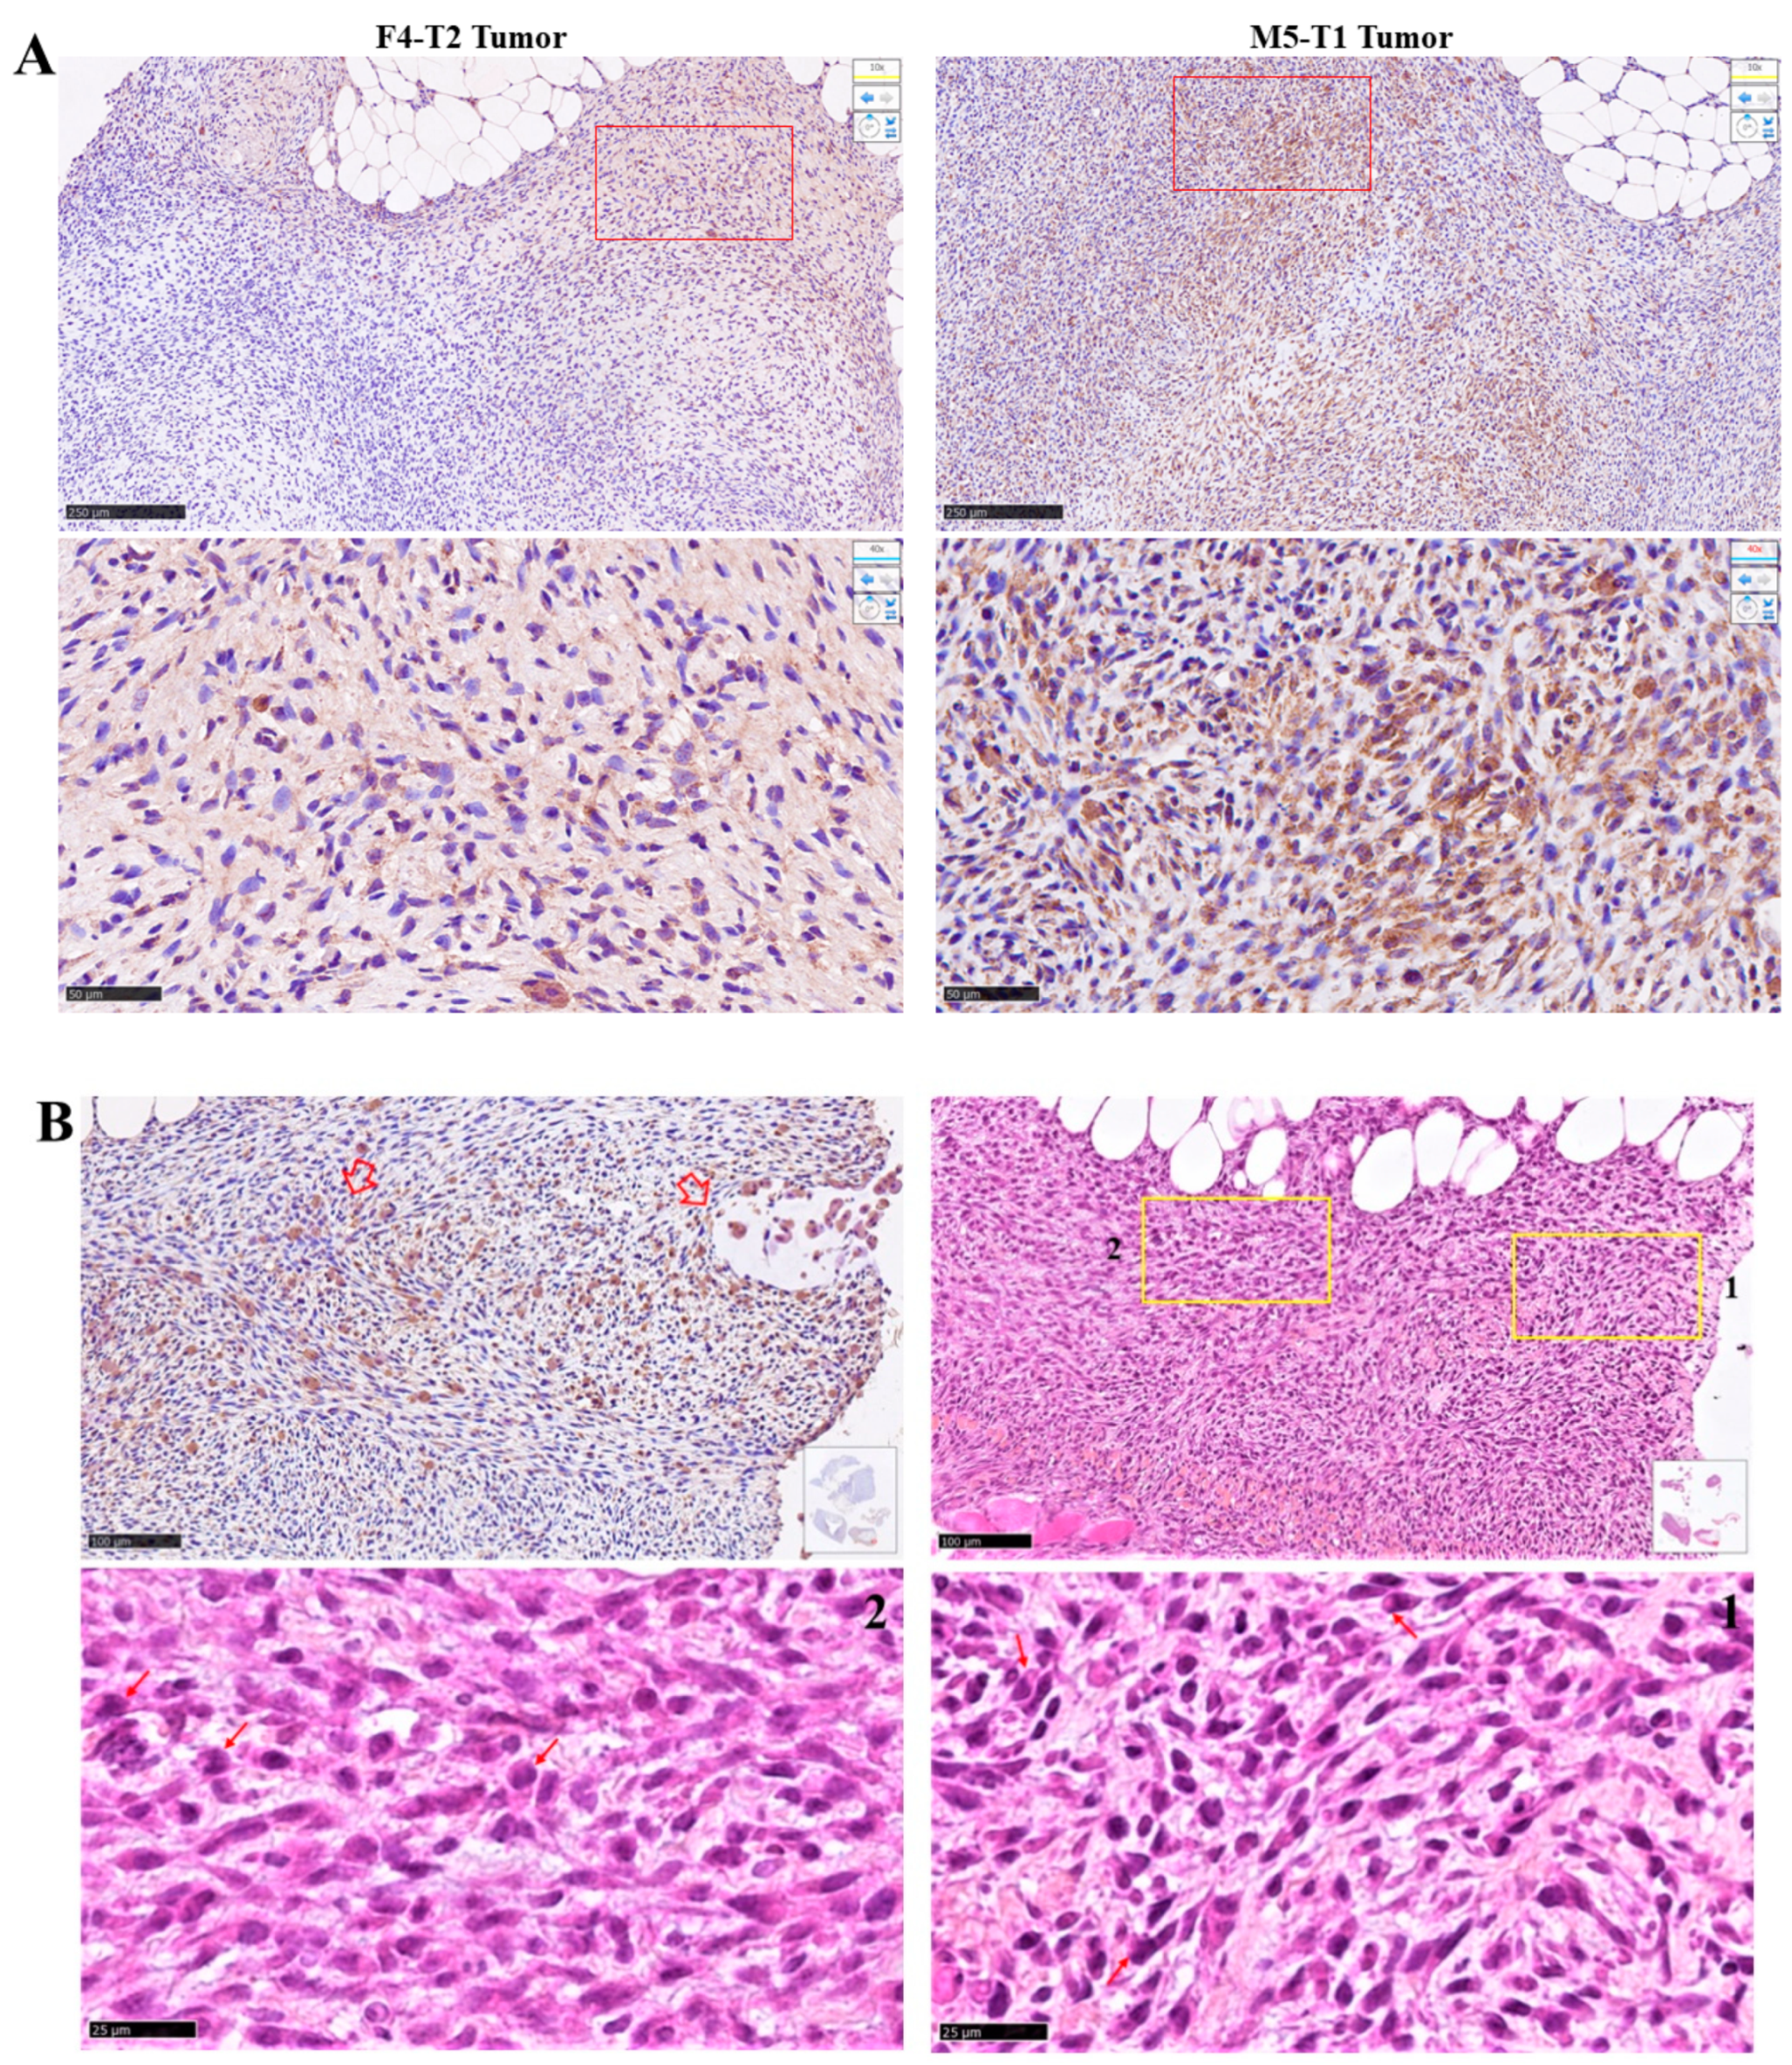
Figure 5.
Distribution of ACADVL in tumor tissues. A, Comparison deeply invasive (M5-T1, top right) vs mildly invasive (F4-T2, top left) tumors, immunohistochemical staining with anti-Acadvl antibody, scale bars represent 250 µm. Magnifications of the areas delimited by the red rectangles (bottom), scale bars represent 50 µm. B, Areas of the M5-T1 tumor exhibiting clusters of positively stained cells (top left, open red arrows), the top right image showing the corresponding HPS stained slide, scale bars represent 100 µm.. Areas delimited by the yellow rectangles are magnified above (bottom), with red arrows showing typical macrophage morphology, scale bars represent 25 µm.
4. Discussion
In previous reports, we identified biomarkers of increasing invasive properties in experimental models of malignant mesothelioma tumors growing in an immunocompetent rat strain [11]. However, in this study, proteins of interest exhibiting significant abundance changes were defined on the only basis of comparison between invasive vs non-invasive tumors. Herein we pursued these investigations with the aim of focusing this time on biomarkers of aggressiveness by comparing deeply vs mildly invasive tumors. The involvement of mitochondrial events in tumor aggressiveness and immunodeficiency has recently received considerable attention through their role in FAO. Evidence has confirmed the primary importance of this energetic pathway in tumor-infiltrating immune cells [12]. In particular, the immune-metabolic reprogramming of mitochondria in tumor-associated macrophages (TAMs) was reported as playing a crucial role in aggressive tumor progression [13]. In our study, the comparison of two models led us to identify an increased level of the mitochondrial FAO enzyme encoded by Acadvl in the most aggressive tumor. Furthermore, this observation was associated with the presence of higher amounts of TAMs positively stained with an antibody recognizing this enzyme in areas of active tumor stroma reorganization within the tumor tissue. Our data were consistent with the regulation of the immune response by mitochondria, and the peculiar role that FAO plays in the production of anti-inflammatory responses by M2 macrophages [14]. Linked to all these findings, Zhang et al. reported that FAO played a key role in the upregulated secretion of IL-1b by M2 macrophages to promote macrophage-mediated tumor cell migration [15]. In addition to mitochondrial proteins, another interesting finding observed among the numerous candidate biomarkers showing decreased abundances in the M5-T1 vs F4-T2 tumors, concerned FABP5. Hou et al. recently indicated that FABP5 deficiency led to reprogramming of metabolic pathways in macrophages by enhancing FAO in favor of M2 polarization [16].
Early investigations on ACADV in experimental tumors revealed it was a rate-limiting enzyme in long-chain FAO, as FAO activity in the mitochondria toward palmitic acid and stearic acid was enhanced more than 3 times in the rat hepatoma cell line H4 [17]. Interestingly, a first insight into the role of this enzyme in tumor aggressiveness came with the observation that a profound transcriptional repression of four genes involved in mitochondrial energy metabolism, including ACADVL, was associated with a complete long-term remission of a patient with metastatic malignant melanoma [18]. Subsequently, Pan et al. reported that both ACADVL and IFITM1 were overexpressed in women with squamous cell carcinoma of the cervix, these genes representing 2 out of 5 genes making it possible to distinguish it from normal tissue [19]. Interestingly, our study revealed the parallel increase in ACADVL and another protein in this family, IFITM3, two findings that agreed with the observations that both IFITM1 and IFITM3 were overexpressed in tumor tissues, and correlated with several poorly differentiated cancers [20]. Since then, three main studies have published additional insights consistent with our data showing the involvement of this FAO enzyme in both tumor aggressiveness and immune-suppressive properties. First, Wheeler et al. showed ACADVL is a driver of anoikis escape [21]. A second finding was the involvement of ACADVL overexpression in leukemia cell mitochondrial metabolism described by Tcheng et al. [22]. Finally, Micheva et al. demonstrated that the upregulation of ACADVL, with some other genes involved in the mitochondrial removal of long-chain fatty acyls, led to dampened oxylipin levels with harmful consequences on leukocyte activation [23].
Besides ACADVL, many other potential candidate biomarkers of aggressiveness exhibited pronounced abundance changes. Some of them have already been discussed in two previous studies, including those encoded by Ifitm3, Ecm1, Fmod, Itih3, Prss1, Map1b, Myh8, [5], and Cnn3, Coro1a, Smad3, Rpn1, and Hspa1b [24]. Among the mitochondrial proteins exhibiting an increase, the case of ODPA (encoded by Pdha1) is of great interest as it is an enzyme involved in the Warburg effect [25]. Linked with our findings, three reports recently highlighted the crucial role of this mitochondrial enzyme. First, Deng et al. revealed that it could represent a prognostic and immune-associated biomarker in multiple cancers, its expression being linked to DNA damage, cell invasion, and angiogenesis [26]. A second study by Olou et al. pointed to its involvement in adipocyte maintenance and secretion of the cancer-promoting cytokine IL-6 [27]. Finally, Tian et al. showed that silencing this gene suppressed proliferation, migration, and invasion in neuroblastoma [28]. Within mitochondrial proteins exhibiting a decrease, the two enzymes of the TCA cycle, succinate dehydrogenase (encoded by Sdha) and fumarate hydratase (encoded by Fh), which represent potential tumor suppressors, were frequently reported to be downregulated in cancers [29,30]. In good agreement with our data, a recent bioinformatic investigation also showed that the mitochondrial solute carrier family 25 (encoded by Slc25a5) had a prognostic value in patients with colon cancer, its upregulation being related to better overall survival [31]. Although controversial results have been reported on the role of SOD2 in cancers, its parallel decreased abundance found here agrees with early findings reporting that its suppression may create mitochondrial injury leading to increased ROS and glycolysis [32]. This observation is also consistent with the parallel decrease in the nucleotide exchange factor encoded by Grpel1, through its known role as a modulator of organelle function under stress conditions [33].
ECM proteins represented the category most concerned with marked abundance increase in the M5-T1 tumor. In addition to proteins encoded by the Ecm1, Fmod, Itih3, and Prss1 genes, previously discussed [5], four other members, encoded by Aebp1, Cma1, Plod2, and P3h4 played an important role in the acquisition of aggressive tumor properties. Linked with ACADVL, adipocyte metabolism and the proinflammation process in macrophages, AEBP1 was initially shown to promote EMT through activation of the NF-κB pathway in gastric cancer cells [34]. Subsequently, these observations were confirmed in the context of promotion of colon adenocarcinoma [35] and glioblastoma [36] cell growth. Finally, while AEBP1 progressively became a prognostic biomarker, its knockdown suppresses tumor proliferation and invasion in glioma [37] and oral cancer [38]. Regarding CMA1, Fenger et al. demonstrated that enforced miR-9 expression in canine mast cell tumors upregulated its expression in addition to IFITM3 mentioned above, leading to the development of an invasive phenotype [39]. The last two ECM proteins are involved in the stability of collagen intermolecular crosslinks. The expression of P3h4, which encodes a protein catalyzing the hydroxylation of lysine residues in collagen alpha chains, was reported to be a predictor of poor overall survival in both bladder [40] and lung cancer [41]. PLOD2, which provides attachment sites for carbohydrates in collagen, was also initially reviewed as a potential prognostic factor [42]. Recent clinicopathological studies have highlighted an inversed relationship between its high expression and overall survival in patients with esophageal squamous cell carcinoma [43], glioblastoma [44], laryngeal cancer [45], or osteosarcoma [46]. Moreover, an inverse relationship was also observed with immune cell infiltration [46].
Another major category concerned by abundance increase was proteins in the cytoskeleton. Of them, actinin-1 and vinculin appear to play an important role. High actinin-1 levels were recently associated with poor prognosis in oral squamous cell carcinoma [47]. The same association with poor prognosis was observed in gastric cancer through its involvement in the promotion of EMT via the AKT/GSK3b/β-catenin pathway [48]. Moreover, Cao et al. showed that the promotion of the metastatic properties it provided in breast cancer appeared to involve CAF activation [49]. Concerning vinculin, one decade ago Goldmann et al. highlighted the role it played in the transmission of mechanical forces and in the orchestration of mechanical signaling events in the context of cancer cell migration [50]. Among new insights, interestingly, Li et al. revealed the impact of high levels of vinculin on the promotion of EMT and poor prognosis in gastric cancer [51].
Among the biomarkers that specifically characterized M5-T1 tumor aggressiveness, many proteins in the tumor microenvironment involved in the immune response conversely exhibited a dramatic decrease. One of them, encoded by Coro1a, presented common features with the decrease already observed in the process of liver metastatic colonization by M5-T1 tumor cells [5]. As previously discussed, induction of T-cell anergy could explain this fact [52]. The decrease in COR1A in the M5-T1 tumor is also consistent with its low leukocytic infiltrate [24], and with the inverse situation found in immune-rich breast tumors in patients [53]. In good agreement with our findings, Ada is another gene which, like Coro1a, when affected, is associated with severe combined immunofeficiency [54]. Moreover, Zucchetti et al. recently showed the crucial role of another protein, ARP2 encoded by Actr2 which belongs to the Arp2/3 complex, in the protrusions developed by T-cells in immune surveillance [55]. Finally, Lee et al discovered that the protein MICA1, encoded by the gene Mical1, was involved in the regulation of actin via methionine-R-sulfoxidation, an important process in macrophage function [56]. In our study, this protein presented the most impressive drop within the decreased biomarkers, linked with tumor aggressiveness. Intriguingly, another comparable evolution was observed with CSRP2, while conflicting data were reported for both proteins regarding their link with cancer progression. For example, its overexpression was correlated with resistance to chemotherapy in leukemia [57], and this protein was presented as an invadopodial actin bundling protein in breast cancer promotion by hypoxia [58]. However, its decreased expression in colorectal cancer relative to normal tissues was indicative of poor prognosis in patients [59], and Kaplan-Meier analysis indicated that cohorts with low expression levels displayed worse relapse-free survival [60]. For MICAL1 too, Haikazian et al. have reported the existence of a potential relationship between MICAL1 overexpression and increased tumor invasiveness [61], while conversely Gu et al. showed it played an inhibitory role in the migration and growth of colorectal cancer cells [62]. One possible explanation for these discrepancies could be the multiple roles reported for these proteins, including cell differentiation, as CSRP2 has been documented as stimulating the smooth muscle differentiation program in normal tissues [63].
5. Conclusions
This study showed that the comparison of two experimental models of malignant mesothelioma emphasized the role of the mitochondrial FAO enzyme ADAVL in the emergence of both aggressive and immunosuppressive properties. Moreover, the observations made on quantitative changes in a set of key proteins in the extracellular matrix, immune cell components and other subcellular compartments, suggest the existence of connected events. This cancer is still a major public health problem, reinforcing the need to find innovative solutions to deal with the treatment of its most aggressive forms. Besides the specific case of malignant mesothelioma, these insights also have the potential to pave the way for interesting future basic research studies and therapeutic prospects for other types of aggressive cancers.
Supplementary Materials
The following supporting information can be downloaded at the website of this paper posted on Preprints.org, Supplementary Table S1; Supplementary Table S2.
Author Contributions
Conceptualization, D.L.P., J.K., C.R.; Investigation and formal analysis, D.L.P.; Methodology, D.LP, C.G.; Preparation of samples for proteomics, D.L.P., A.B., C.H.; Preparation of samples and immunohistochemistry, S.B.; Software, validation, supervision, C.G; Writing—original draft preparation, D.L.P.; Writing—review and editing, J.K., C.R.; Project administration, funding acquisition, D.L.P., C.G. All authors have read and agreed to the published version of the manuscript.
Funding
This research was conducted with the support of the “Mobilité internationale pour la recherche” (Mir program of the University of Angers) between the Universities of Angers (France) and Turin (Italy) in 2020-2021 and 2021-2022.
Institutional Review Board Statement
Experiments on F344 rats were conducted at the UTE-IRS UN facility (Nantes Université) following the European Union guidelines for the care and use of laboratory rodents in research protocols. The research was approved by the Ethics Committee for Animal Experiments (CEEA) of the Pays de la Loire Region (2011.38) and #0125703 of the French Ministry of Higher Education and Research (MESR).
Informed Consent Statement
Not applicable.
Acknowledgments
We are grateful to all the staff at the Animal Facility (UTE-IRS UN) at the Nantes University for the excellent care of the rats during the experiments. We also acknowledge the IBISA MicroPICell facility (Biogenouest), member of the national infrastructure France-Bioimaging supported by the French national research agency (ANR-10-INBS-04).
Conflicts of Interest
The authors declare no conflict of interest.
References
- Inaguma, S.; Ueki, A.; Lasota, J.; Komura, M.; Sheema, A.N.; Czapiewski, P.; Langfort, R.; Rys, J.; Szpor, J.; Waloszczyk, P.; et al. CD70 and PD-L1 (CD274) co-expression predicts poor clinical outcomes in patients with pleural mesothelioma. J. Pathol. Clin. Res. 2023, 9, 195–207. [Google Scholar] [CrossRef] [PubMed]
- Eickelschulte, S.; Riediger, A.L.; Angeles, A. K.; Janke, F.; Duensing, F.; Sültmann, H.; Görtz, M. Biomarkers for the detection and risk stratification of aggressive prostate cancer. Cancers 2022, 14, 6094. [Google Scholar] [CrossRef] [PubMed]
- Zhang, B.; Wang, J.; Wang, X.; Zhu, J.; Liu, Q.; Shi, Z.; Chambers, M.C.; Zimmerman, L.J.; Shaddox, K.F.; Kim, S.; et al. Proteogenomic characterization of human colon and rectal cancer. Nature 2014, 513, 382–387. [Google Scholar] [CrossRef]
- Kim, B.; Jung, M.; Moon, K.C.; Han, D.; Kim, K.; Kim, H.; Yang, S.; Lee, D.; Jun, H.; Lee, K.-M.; et al. Quantitative proteomics identifies TUBB6 as a biomarker of muscle-invasion and poor prognosis in bladder cancer. Int. J. Cancer 2023, 152, 320–330. [Google Scholar] [CrossRef] [PubMed]
- Pouliquen, D.L.; Boissard, A.; Henry, C.; Blandin, S.; Richomme, P.; Coqueret, O.; Guette, C. Curcumin treatment identifies therapeutic targets within biomarkers of liver colonization by highly invasive mesothelioma cells – potential links with sarcomas. Cancers 2020, 12, 3384. [Google Scholar] [CrossRef] [PubMed]
- Bian, X.; Liu, R.; Meng, Y.; Xing, D.; Xu, D.; Lu, Z. Lipid metabolism and cancer. J. Exp. Med. 2020, 218, e20201606. [Google Scholar] [CrossRef] [PubMed]
- Lee, S.Y.; Ju, M.K.; Jeon, H.M.; Lee, Y.J.; Kim, C.H.; Park, H.G.; Han, S.I.; Kang, H.S. Oncogenic metabolism acts as a prerequisite step for induction of cancer metastasis and cancer stem cell phenotype. Oxid. Med. Cell. Longev. 2018, 1027453. [Google Scholar] [CrossRef]
- Pellerin, L.; Carrié, L.; Dufau, C.; Nieto, L.; Ségui, B.; Levade, T.; Riond, J.; Andrieu-Abadie, N. Lipid metabolic reprogramming: role in melanoma progression and therapeutic perspectives. Cancers 2020, 12, 3147. [Google Scholar] [CrossRef]
- Pouliquen, D.L.; Boissard, A.; Henry, C.; Coqueret, O.; Guette, C. Curcuminoids as modulators of EMT in invasive cancers: a review of molecular targets with the contribution of malignant mesothelioma studies. Front. Pharmacol. 2022, 13, 934534. [Google Scholar] [CrossRef]
- Clement, E.; Lazar, I.; Attané, C.; Carrié, L.; Dauvillier, S.; Ducoux-Petit, M.; Esteve, D.; Menneteau, T.; Moutahir, M.; Le Gonidec, S.; et al. Adipocyte extracellular vesicles carry enzymes and fatty acids that stimulate mitochondrial metabolism and remodeling in tumor cells. EMBO J. 2020, 39, e102525. [Google Scholar] [CrossRef]
- Nader, J.S.; Abadie, J.; Deshayes, S.; Boissard, A.; Blandin, S.; Blanquart, C.; Boisgerault, N.; Coqueret, O.; Guette, C.; Grégoire, M.; et al. Characterization of increasing stages of invasiveness identifies stromal/cancer cell crosstalk in rat models of mesothelioma. Oncotarget 2018, 9, 16311–16329. [Google Scholar] [CrossRef] [PubMed]
- Kopecka, J.; Gazzano, E.; Castella, B.; Salaroglio, I.C.; Mungo, E.; Massaia, M.; Riganti, C. Mitochondrial metabolism: inducer or therapeutic target in tumor immune-resistance? Semin. Cell Develop. Biol. 2020, 98, 80–89. [Google Scholar] [CrossRef] [PubMed]
- Dubey, S.; Ghosh, S.; Goswami, D.; Ghatak, D.; De, R. Immunometabolic attributes and mitochondria-associated signaling of tumor-associated macrophages in tumor microenvironment modulate cancer progression. Biochem. Pharmacol. 2023, 208, 115369. [Google Scholar] [CrossRef]
- Angajala, A.; Lim, S.; Phillips, J.B.; Kim, J.-H.; Yates, C.; You, Z.; Tan, M. Diverse roles of mitochondria in immune responses: novel insights into immuno-metabolism. Front. Immunol. 2018, 9, 1605. [Google Scholar] [CrossRef] [PubMed]
- Zhang, Q.; Wang, H.; Mao, C.; Sun, M.; Dominah, G.; Chen, L.; Zhuang, Z. Fatty acid oxidation contributes to IL-1b secretion in M2 macrophages and promotes macrophage-mediated tumor cell migration. Mol. Immunol. 2018, 94, 27–35. [Google Scholar] [CrossRef]
- Hou, Y.; Wei, D.; Zhang, Z.; Guo, H.; Li, S.; Zhang, J.; Zhang, P.; Zhang, L.; Zhao, Y. FABP5 controls macrophage alternative activation and allergic asthma by selectively programming long-chain unsaturated fatty acid metabolism. Cell Rep. 2022, 41, 111668. [Google Scholar] [CrossRef]
- Aoyama, T.; Ueno, I.; Kamijo, T.; Hashimoto, T. Rat very-long chain Acyl-CoA dehydrogenase, a novel mitochondrial acyl-CoA dehydrogenase gene product, is a rate-limiting enzyme in long-chain fatty acid b-oxidation system. J. Biol. Chem. 1994, 269, 19088–19094. [Google Scholar] [CrossRef]
- Baur, M.; Gneist, M.; Owa, T.; Dittrich, C. Clinical complete long-term remission of a patient with metastatic malignant melanoma under therapy with indisulam (E7070). Melanoma Res. 2007, 17, 329–331. [Google Scholar] [CrossRef]
- Pan, Z.; Chen, S.; Pan, X.; Wang, Z.; Han, H.; Zheng, W.; Wang, X.; Li, F.; Qu, S.; Shao, R. Differential gene expression identified in Uigur women cervical squamous cell carcinoma by suppression substractive hybridization. Neoplasma 2010, 57, 123–128. [Google Scholar] [CrossRef]
- Friedlová, N.; Kokáš, F.Z.; Hupp, T.R.; Vojtěšek, B.; Nekulová, M. IFITM protein regulation and functions: far beyond the fight against viruses. Front. Immunol. 2022, 13, 1042368. [Google Scholar] [CrossRef]
- Wheeler, L.J.; Watson, Z.L.; Qamar, L.; Yamamoto, T.M.; Sawyer, B.T.; Sullivan, K.D.; Khanal, S.; Joshi, M.; Ferchaud-Roucher, V.; Smith, H.; et al. Multi-omic approaches identify metabolic and autophagy regulators important in ovarian cancer dissemination. iScience 2019, 19, 474–491. [Google Scholar] [CrossRef] [PubMed]
- Tcheng, M.; Roma, A.; Ahmed, N.; Smith, R. W.; Jayanth, P.; Minden, M. D.; Schimmer, A. D.; Hess, D. A.; Hope, K.; Rea, K. A.; et al. Very long chain fatty acid metabolism is required in acute myeloid leukemia. Blood 2021, 137, 3518–3532. [Google Scholar] [CrossRef] [PubMed]
- Misheva, M.; Kotzamanis, K.; Davies, L.C.; Tyrrell, V.J.; Rodrigues, P.R.S.; Benavides, G.A.; Hinz, C.; Murphy, R.C.; Kennedy, P.; Taylor, P.R.; et al. Oxylipin metabolism is controlled by mitochondrial b-oxidation during bacterial inflammation. Nat. Commun. 2022, 13, 139. [Google Scholar] [CrossRef]
- Nader, J.S.; Abadie, J.; Deshayes, S.; Boissard, A.; Blandin, S.; Blanquart, C.; Boisgerault, N.; Coqueret, O.; Guette, C.; Grégoire, M. Characterization of increasing stages of invasiveness identifies stromal/cancer cell crosstalk in rat models of mesothelioma. Oncotarget 2018, 9, 16311–16329. [Google Scholar] [CrossRef] [PubMed]
- Xu, L.; Li, Y.; Zhou, L.; Dorfman, R.G.; Liu, L.; Cai, R.; Jiang, C.; Tang, D.; Wang, Y.; Zou, X.; et al. SIRT3 elicited an anti-Warburg effect through HIF1a/PDK1/PDHA1 to inhibit cholangiocarcinoma tumorigenesis. Cancer Med. 2019, 8, 2380–2391. [Google Scholar] [CrossRef] [PubMed]
- Deng, L.; Jiang, A.; Zeng, H.; Peng, X.; Song, L. Comprehensive analyses of PDHA1 that serves as a predictive biomarker for immunotherapy response in cancer. Front. Pharmacol. 2022, 13, 947372. [Google Scholar] [CrossRef] [PubMed]
- Olou, A.A.; Ambrose, J.; Jack, J.L.; Walsh, M.; Ruckert, M.T.; Eades, A.E.; Bye, B.A.; Dandawate, P.; VanSaun, M.N. SHP2 regulates adipose maintenance and adipocyte-pancreatic cancer cell crosstalk via PDHA1. J. Cell Comm. Signal. 2022. [Google Scholar] [CrossRef]
- Tian, X.-M.; Xiang, B.; Yu, Y.-H.; Li, Q.; Zhang, Z.-X.; Zhanghuang, C.; Jin, L.-M.; Wang, J.-K.; Mi, T.; Chen, M.-L.; et al. A novel cuproptosis-related subtypes and gene signature associates with immunophenotype and predicts prognosis accurately in neuroblastoma. Front. Immunol. 2022, 13, 999849. [Google Scholar] [CrossRef]
- Gaude, E.; Frezza, C. Defects in mitochondrial metabolism and cancer. Cancer Metab. 2014, 2, 10. [Google Scholar] [CrossRef]
- Schaefer, I.-M.; Hornick, J.L.; Bovée, J.V.M.G. The roles of metabolic enzymes in mesenchymal tumors and tumor syndromes: genetics, pathology, and molecular mechanisms. Lab. Invest. 2018, 98, 414–426. [Google Scholar] [CrossRef]
- Chen, Y.-J.; Hong, W.-F.; Liu, M.-L.; Guo, X.; Yu, Y.-Y.; Cui, Y.-H.; Liu, T.-S.; Liang, L. An integrated bioinformatic investigation of mitochondrial solute carrier family 25 (SLC25) in colon cancer followed by preliminary validation of member 5 (SLC25A5) in tumorigenesis. Cell Death Dis. 2022, 13, 237. [Google Scholar] [CrossRef] [PubMed]
- Dhar, S.K.; Tangpong, J.; Chaiswing, L.; Oberley, T.D.; St Clair, D.K. Manganese superoxide dismutase is a p53-regulated gene that switches cancers between early and advanced changes. Cancer Res. 2011, 71, 6684–6695. [Google Scholar] [CrossRef] [PubMed]
- Srivastava, S.; Savanur, M.A.; Sinha, D.; Birje, A.; R. V.; Saha, P.P.; D’Silva, P. Regulation of mitochondrial protein import by the nucleotide exchange factors GrpEL1 and GrpEL2 in human cells. J. Biol. Chem. 2017, 292, 18075–18090. [Google Scholar] [CrossRef] [PubMed]
- Liu, J.-y.; Jiang, L.; Liu, J.-j.; He, T.; Cui, Y.-h.; Qian, F.; Yu, P.-w. AEBP1 promotes epithelial-mesenchymal transition of gastric cancer cells by activating the NF-kB pathway and predicts poor outcome of the patients. Sci. Rep. 2018, 8, 11955. [Google Scholar] [CrossRef] [PubMed]
- Xing, Y.; Zhang, Z.; Chi, F.; Zhou, Y.; Ren, S.; Zhao, Z.; Zhu, Y.; Piao, D. AEBP1, a prognostic indicator, promotes colon adenocarcinoma cell growth and metastasis through the NF-kB pathway. Mol. Carcinogenesis 2019, 58, 1795–1808. [Google Scholar] [CrossRef]
- Guo, K.; Song, L.; Chang, J.; Cao, P.; Liu, Q. AEBP1 promotes glioblstoma progression and activates the classical NF-kB pathway. Behav. Neurol. 2020, 8890452. [Google Scholar]
- Cheng, L.; Shao, X.; Wang, Q.; Jiang, X.; Dai, Y.; Chen, S. Adipocyte enhancer binding protein 1 (AEBP1) knockdown suppresses human glioma cell proliferation, invasion and induces early apoptosis. Pathol. Res. Pract. 2020, 216, 152790. [Google Scholar] [CrossRef]
- Zhou, Q.; Wang, X.; Zhang, Y.; Wang, L.; Chen, Z. Inhibition of AEBP1 predisposes cisplatin-resistant oral cancer cells to ferroptosis. BMC Oral Health 2022, 22, 478. [Google Scholar] [CrossRef]
- Fenger, J.M.; Bear, M.D.; Volinia, S.; Lin, T.-Y.; Harrington, B.K.; London, C.A.; Kisseberth, W.C. Overexpression of miR-9 in mast cells is associated with invasive behavior and spontaneous metastasis. BMC Cancer 2014, 14, 84. [Google Scholar] [CrossRef]
- Li, W.; Ye, L.; Chen, Y.; Chen, P. P3H4 is correlated with clinicopathological features and prognosis in bladder cancer. World J. Surg. Oncol. 2018, 16, 206. [Google Scholar] [CrossRef]
- Jin, X.; Zhou, H.; Song, J.; Cui, H.; Luo, Y.; Jiang, H. P3H4 overexpression seres as a prognostic factor in lung adenocarcinoma. Comput. Math. Meth. Med. 2021, 9971353. [Google Scholar]
- Du, H.; Pang, M.; Hou, X.; Yuan, S.; Sun, L. PLOD2 in cancer research. Biomed. Pharmacother. 2017, 90, 670–676. [Google Scholar] [CrossRef] [PubMed]
- Gong, X.; Wang, A.; Song, W. Clinicopathological significances of PLOD2, epithelial-mesenchymal transition markers, and cancer stem cells in patients with esophageal squamous cell carcinoma. Medicine 2022, 101, 34. [Google Scholar] [CrossRef] [PubMed]
- Kreße, N.; Schröder, H.; Stein, K.-P.; Wilkens, L.; Mawrin, C.; Sandalcioglu, I.E.; Dumitru, C.A. Int. J. Mol. Sci. 2022, 23, 6037. [CrossRef] [PubMed]
- Song, M.; Liu, X.; Li, T.; Zhang, Y.; Zhao, X.; Sun, W.; Li, Z. Silencing PLOD2 attenuates cancer stem cell-like characteristics and cisplatin-resistant through Integrin b1 in laryngeal cancer. Transl. Oncol. 2022, 22, 101460. [Google Scholar] [CrossRef] [PubMed]
- Wang, Z.; Fan, G.; Zhu, H.; Yu, L.; She, D.; Wei, Y.; Huang, J.; Li, T.; Zhan, S.; Zhou, S.; et al. PLOD2 high expression associates with immune infiltration and facilitates cancer progression in osteosarcoma. Front. Oncol. 2022, 12, 980390. [Google Scholar] [CrossRef] [PubMed]
- Xie, G.-f.; Zhao, L.-d.; Chen, Q.; Tang, D.-x.; Chen, Q.-y.; Lu, H.-f.; Cai, J.-r.; Chen, Z. High ACTN1 is associated with poor prognosis, and ACTN1 silencing suppresses cell proliferation and metastasis in oral squamous cell carcinoma. Drug Des. Devel. Ther. 2020, 14, 1717–1727. [Google Scholar] [CrossRef] [PubMed]
- Zhang, S.; Wang, J.; Chen, T.; Wang, J.; Wang, Y.; Yu, Z.; Zhao, K.; Zheng, K.; Chen, Y.; Wang, Z.; et al. a-actinin1 promotes tumorigenesis and epithelial-mesenchymal transition of gastric cancer via the AKT/GSK3b/b-catenin pathway. Bioengineered 2021, 12, 5688–5704. [Google Scholar] [CrossRef]
- Cao, Y.; Cao, W.; Qiu, Y.; Zhou, Y.; Guo, Q.; Gao, Y.; Lu, N. Oroxylin A suppresses ACTN1 expression to inactivate cancer-associated fibroblasts and restrain breast cancer metastasis. Pharmacol. Res. 2020, 159, 104981. [Google Scholar] [CrossRef]
- Goldmann, W.H.; Auernheimer, V.; Thievessen, I.; Fabry, B. Vinculin, cell mechanics and tumour cell invasion. Cell Biol. Int. 2013, 37, 397–405. [Google Scholar] [CrossRef]
- Li, H.; Wang, C.; Lan, L.; Behrens, A.; Tomaschko, M.; Ruiz, J.; Su, Q.; Zhao, G.; Yuan, C.; Xiao, X.; et al. High expression of vinculin predicts poor prognosis and distant metastasis and associates with influencing tumor-associated NK cell infiltration and epithelial-mesenchymal transition in gastric cancer. Aging 2021, 13, 5197–5225. [Google Scholar] [CrossRef]
- Punwani, D.; Pelz, B.; Yu, J.; Arva, N.C.; Schafernack, K.; Kondratowicz, K.; Makhija, M.; Puck, J.M. Coronin-1A: immune deficiency in humans and mice. J. Clin. Immunol. 2015, 35, 100–107. [Google Scholar] [CrossRef] [PubMed]
- Behring, M.; Ye, Y.; Elkholy, A.; Bajpai, P.; Agarwal, S.; Kim, H.-G.; Ojesina, A.I.; Wiener, H.W.; Manne, U.; Shrestha, S.; et al. Immunophenotype-associated gene signature in ductal breast tumors varies by receptor subtype, but the expression of individual signature genes remains consistent. Cancer Med. 2021, 10, 5712–5720. [Google Scholar] [CrossRef] [PubMed]
- Aykut, A.; Durmaz, A.; Karaca, N.; Gulez, N.; Genel, F.; Celmeli, F.; Ozturk, G.; Atay, D.; Aydogmus, C.; Kiykim, A.; et al. Severe combined immunodeficiencies: expanding the mutation spectrum in Turkey and identification of 12 novel variants. Scand. J. Immunol. 2022, 95, e13163. [Google Scholar] [CrossRef]
- Zucchetti, A.E.; Paillon, N.; Markova, O.; Dogniaux, S.; Hivroz, C.; Husson, J. Influence of external forces on actin-dependent T cell protrusions during immune synapse formation. Biol. Cell 2021, 113, 250–263. [Google Scholar] [CrossRef]
- Lee, B.C.; Peterfi, Z.; Hoffmann, F.W.; Moore, R.E.; Kaya, A.; Avanesov, A.; Tarrago, L.; Zhou, Y.; Weerapana, E.; Fomenko, D.E.; et al. MsrB1 and MICALs regulate actin assembly and macrophage function via reversible stereoselective methionine oxidation. Mol. Cell 2013, 51, 397–404. [Google Scholar] [CrossRef] [PubMed]
- Wang, S.-J.; Wang, P.-Z.; Gale, R.P.; Qin, Y.-Z.; Liu, Y.-R.; Lai, Y.-Y.; Jiang, H.; Jiang, Q.; Zhang, X.-H.; Jiang, B.; et al. Cysteine and glycine-rich protein 2 (CSRP2) transcript levels correlate with leukemia relapse and leukemia-free survival in adults with B-cell acute lymphoblastic leukemia and normal cytogenetics. Oncotarget 2017, 8, 35984–36000. [Google Scholar] [CrossRef] [PubMed]
- Hoffmann, C.; Mao, X.; Brown-Clay, J.; Moreau, F.; Al Absi, A.; Wurzer, H.; Sousa, B.; Schmitt, F.; Berchem, G.; Janji, B.; et al. Hypoxia promotes breast cancer cell invasion through HIF-1-mediated up-regulation of the invadopodial actin bundling protein CSRP2. Sci. Rep. 2018, 8, 10191. [Google Scholar] [CrossRef]
- Chen, L.; Long, X.; Duan, S.; Liu, X.; Chen, J.; Lan, J.; Liu, X.; Huang, W.; Geng, J.; Zhou, J. CSRP2 suppresses colorectal cancer progression via p130Cas/Rac1 axis-mediated ERK, PAK, and HIPPO signaling pathways. Theranostics 2020, 10, 11063–11079. [Google Scholar] [CrossRef]
- Wang, S.; Zhang, Y.; Liu, Y.; Zheng, R.; Wu, Z.; Fan, Y.; Li, M.; Li, M.; Li, T.; Li, Y.; et al. Inhibition of CSRP2 promotes leukemia cell proliferation and correlates with relapse in adults with acute myeloid leukemia. Onco Targets Ther. 2020, 13, 12549–12560. [Google Scholar] [CrossRef]
- Haikazian, S.; Olson, M.F. MICAL1 monooxygenase in autosomal dominant lateral temporal epilepsy: role in cytoskeletal regulation and relation to cancer. Genes 2022, 13, 715. [Google Scholar] [CrossRef] [PubMed]
- Gu, H.; Li, Y.; Cui, X.; Cao, H.; Hou, Z.; Ti, Y.; Liu, D.; Gao, J.; Wang, Y.; Wen, P. MICAL1 inhibits colorectal cancer cell migration and proliferation by regulating the EGR1/-catenin signaling pathway. Biochem. Pharmacol. 2022, 195, 114870. [Google Scholar] [CrossRef] [PubMed]
- Chang, D.F.; Belaguli, N.S.; Chang, J.; Schwartz, R.J. LIM-only protein, CRP2, switched on smooth muscle gene activity in adult cardiac myocytes. Proc. Natl. Acad. Sci. USA 2007, 104, 157–162. [Google Scholar] [CrossRef] [PubMed]
Figure 1.
Methodological approach used to identify mitochondrial biomarkers of agressiveness.
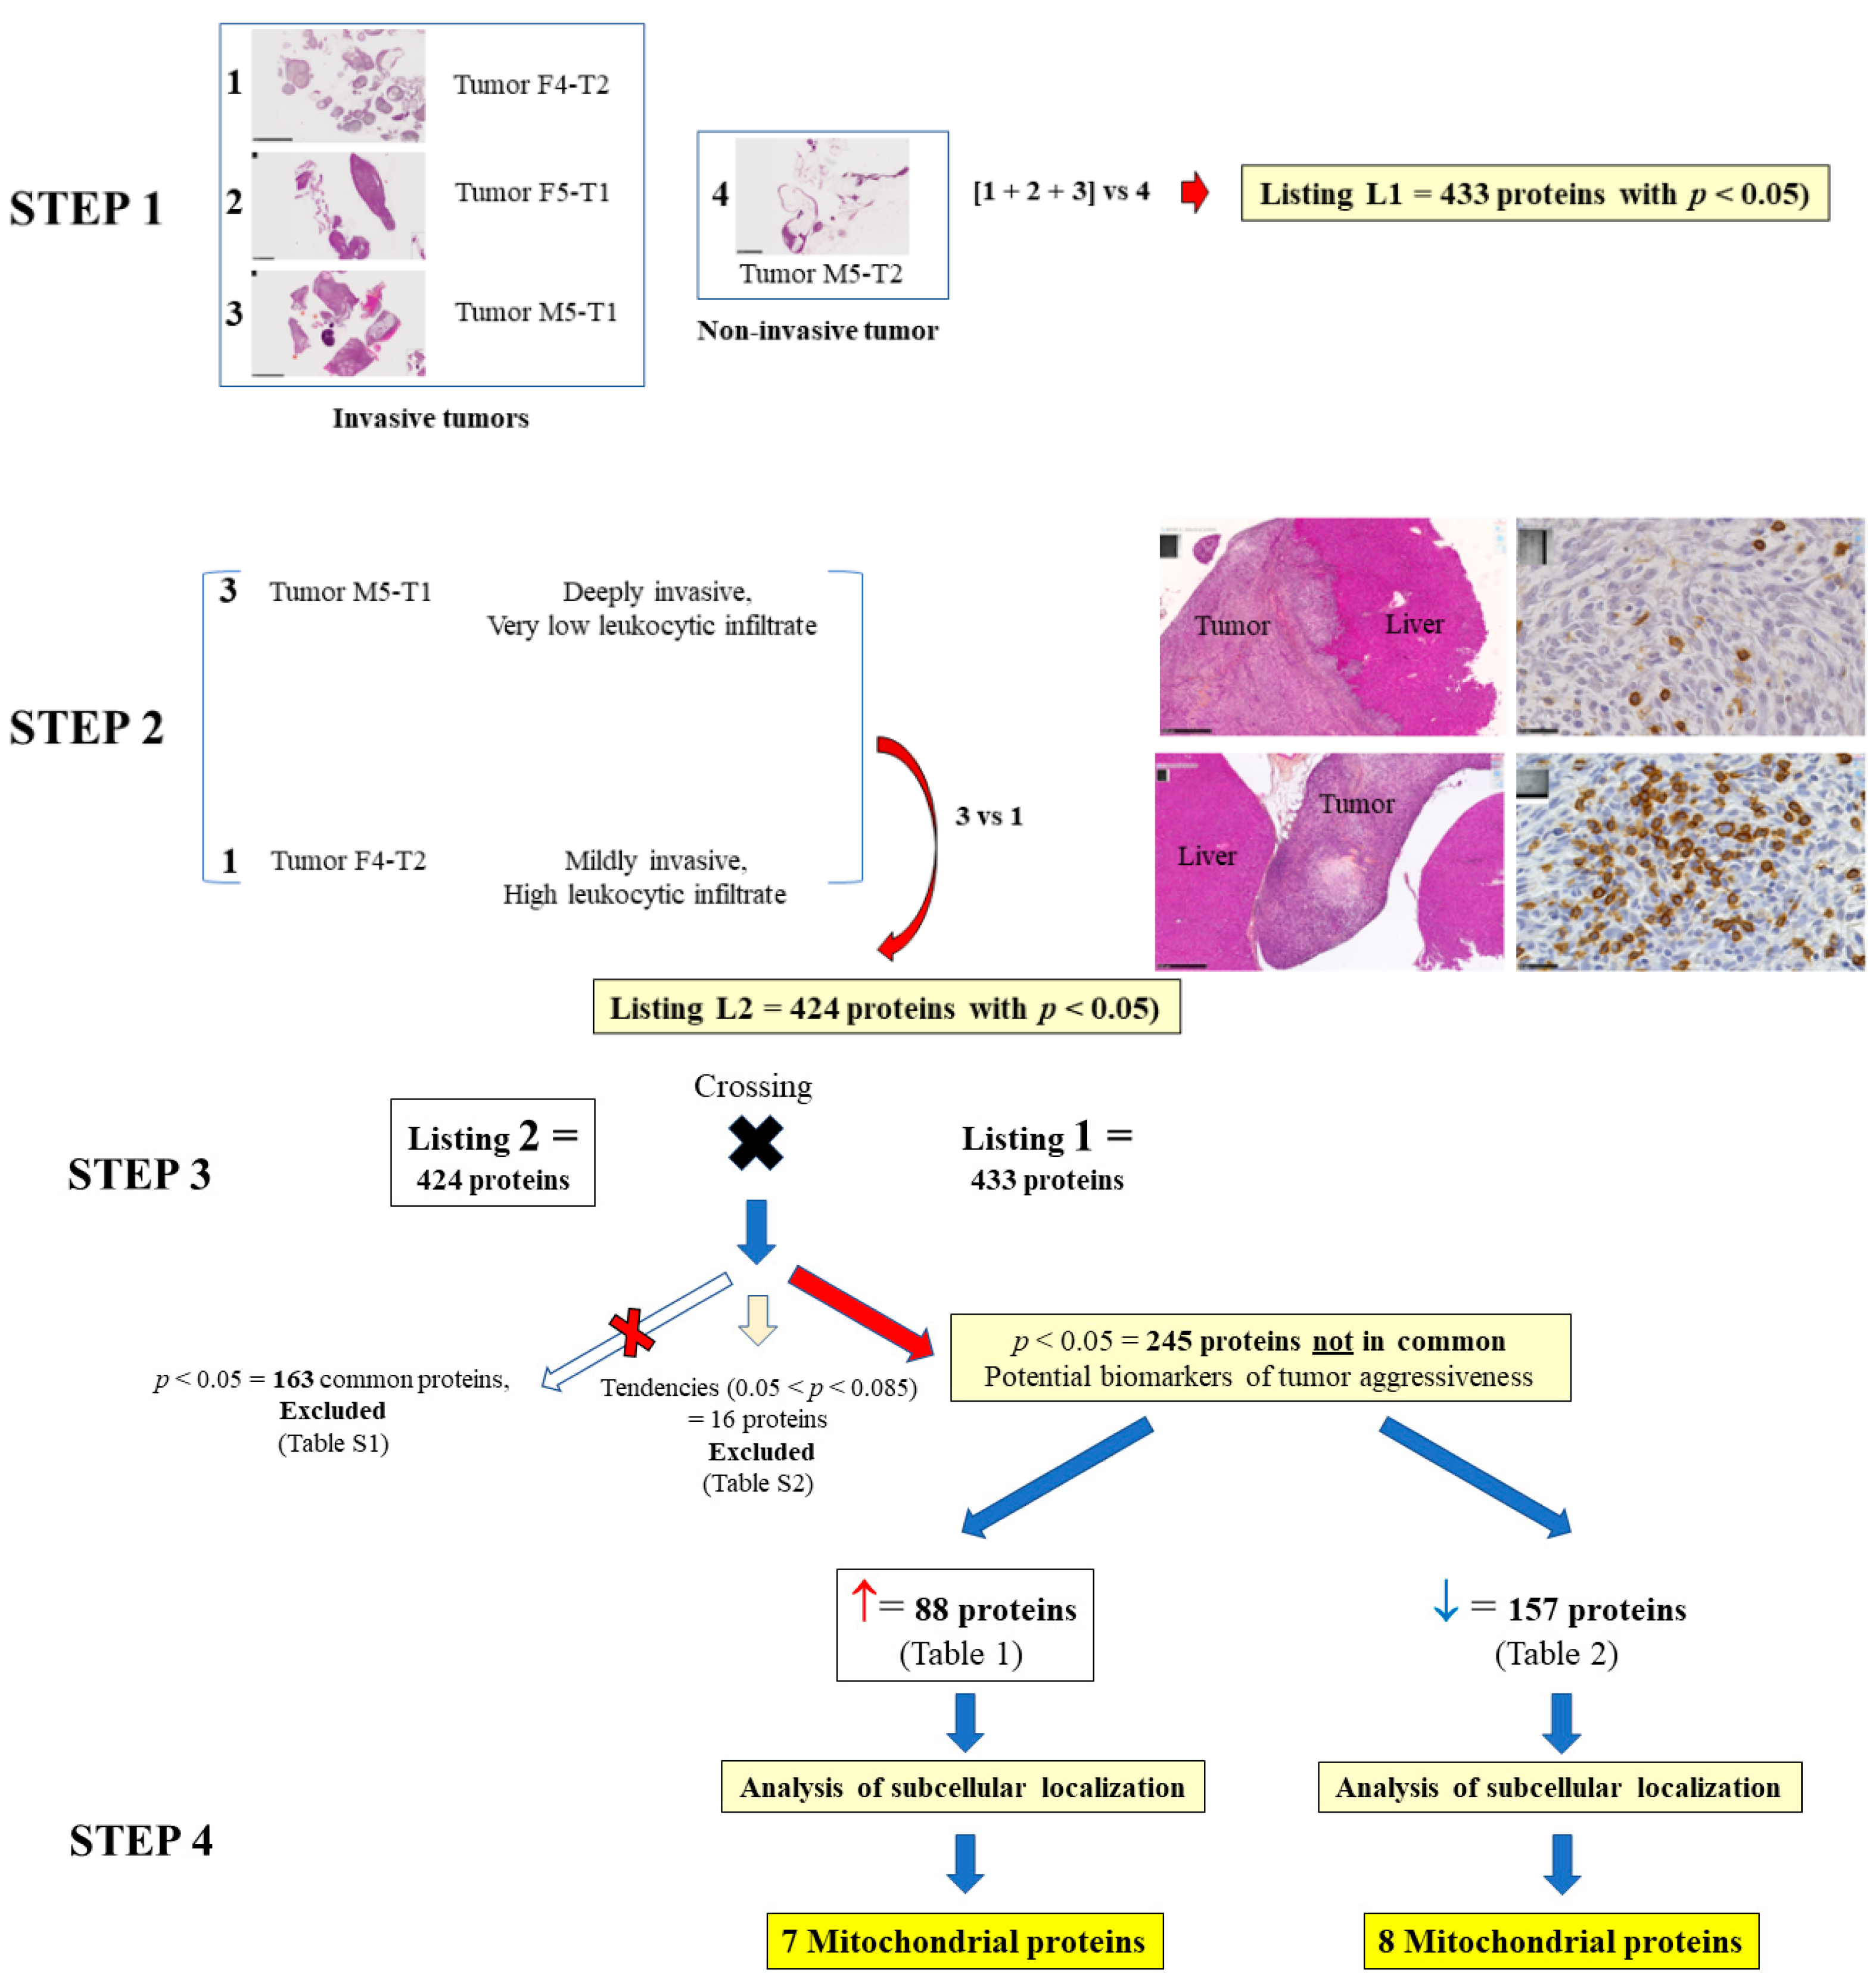
Figure 2.
Subcellular localization of proteins showing abundance changes associated with tumor aggressiveness. A., Mitochondrial proteins that increased (encoding genes indicated in red). For other localizations, gene names indicated in bold correspond to proteins for which p < 0.001 (changes illustrated in Figure 3). Underlined gene names correspond to proteins for which 0.001 < p < 0.01 (changes not shown for clarity). B., Abundance changes of mitochondrial proteins between M5-T1 and F4-T2 tumors. C., Mitochondrial proteins that decreased (encoding genes indicated in blue). For other localizations, gene names indicated in bold correspond to proteins for which p < 1.00 x 10⁻⁵ (changes illustrated in Figure 3 and Figure 4). D., Abundance changes of mitochondrial proteins between M5-T1 and F4-T2 tumors.
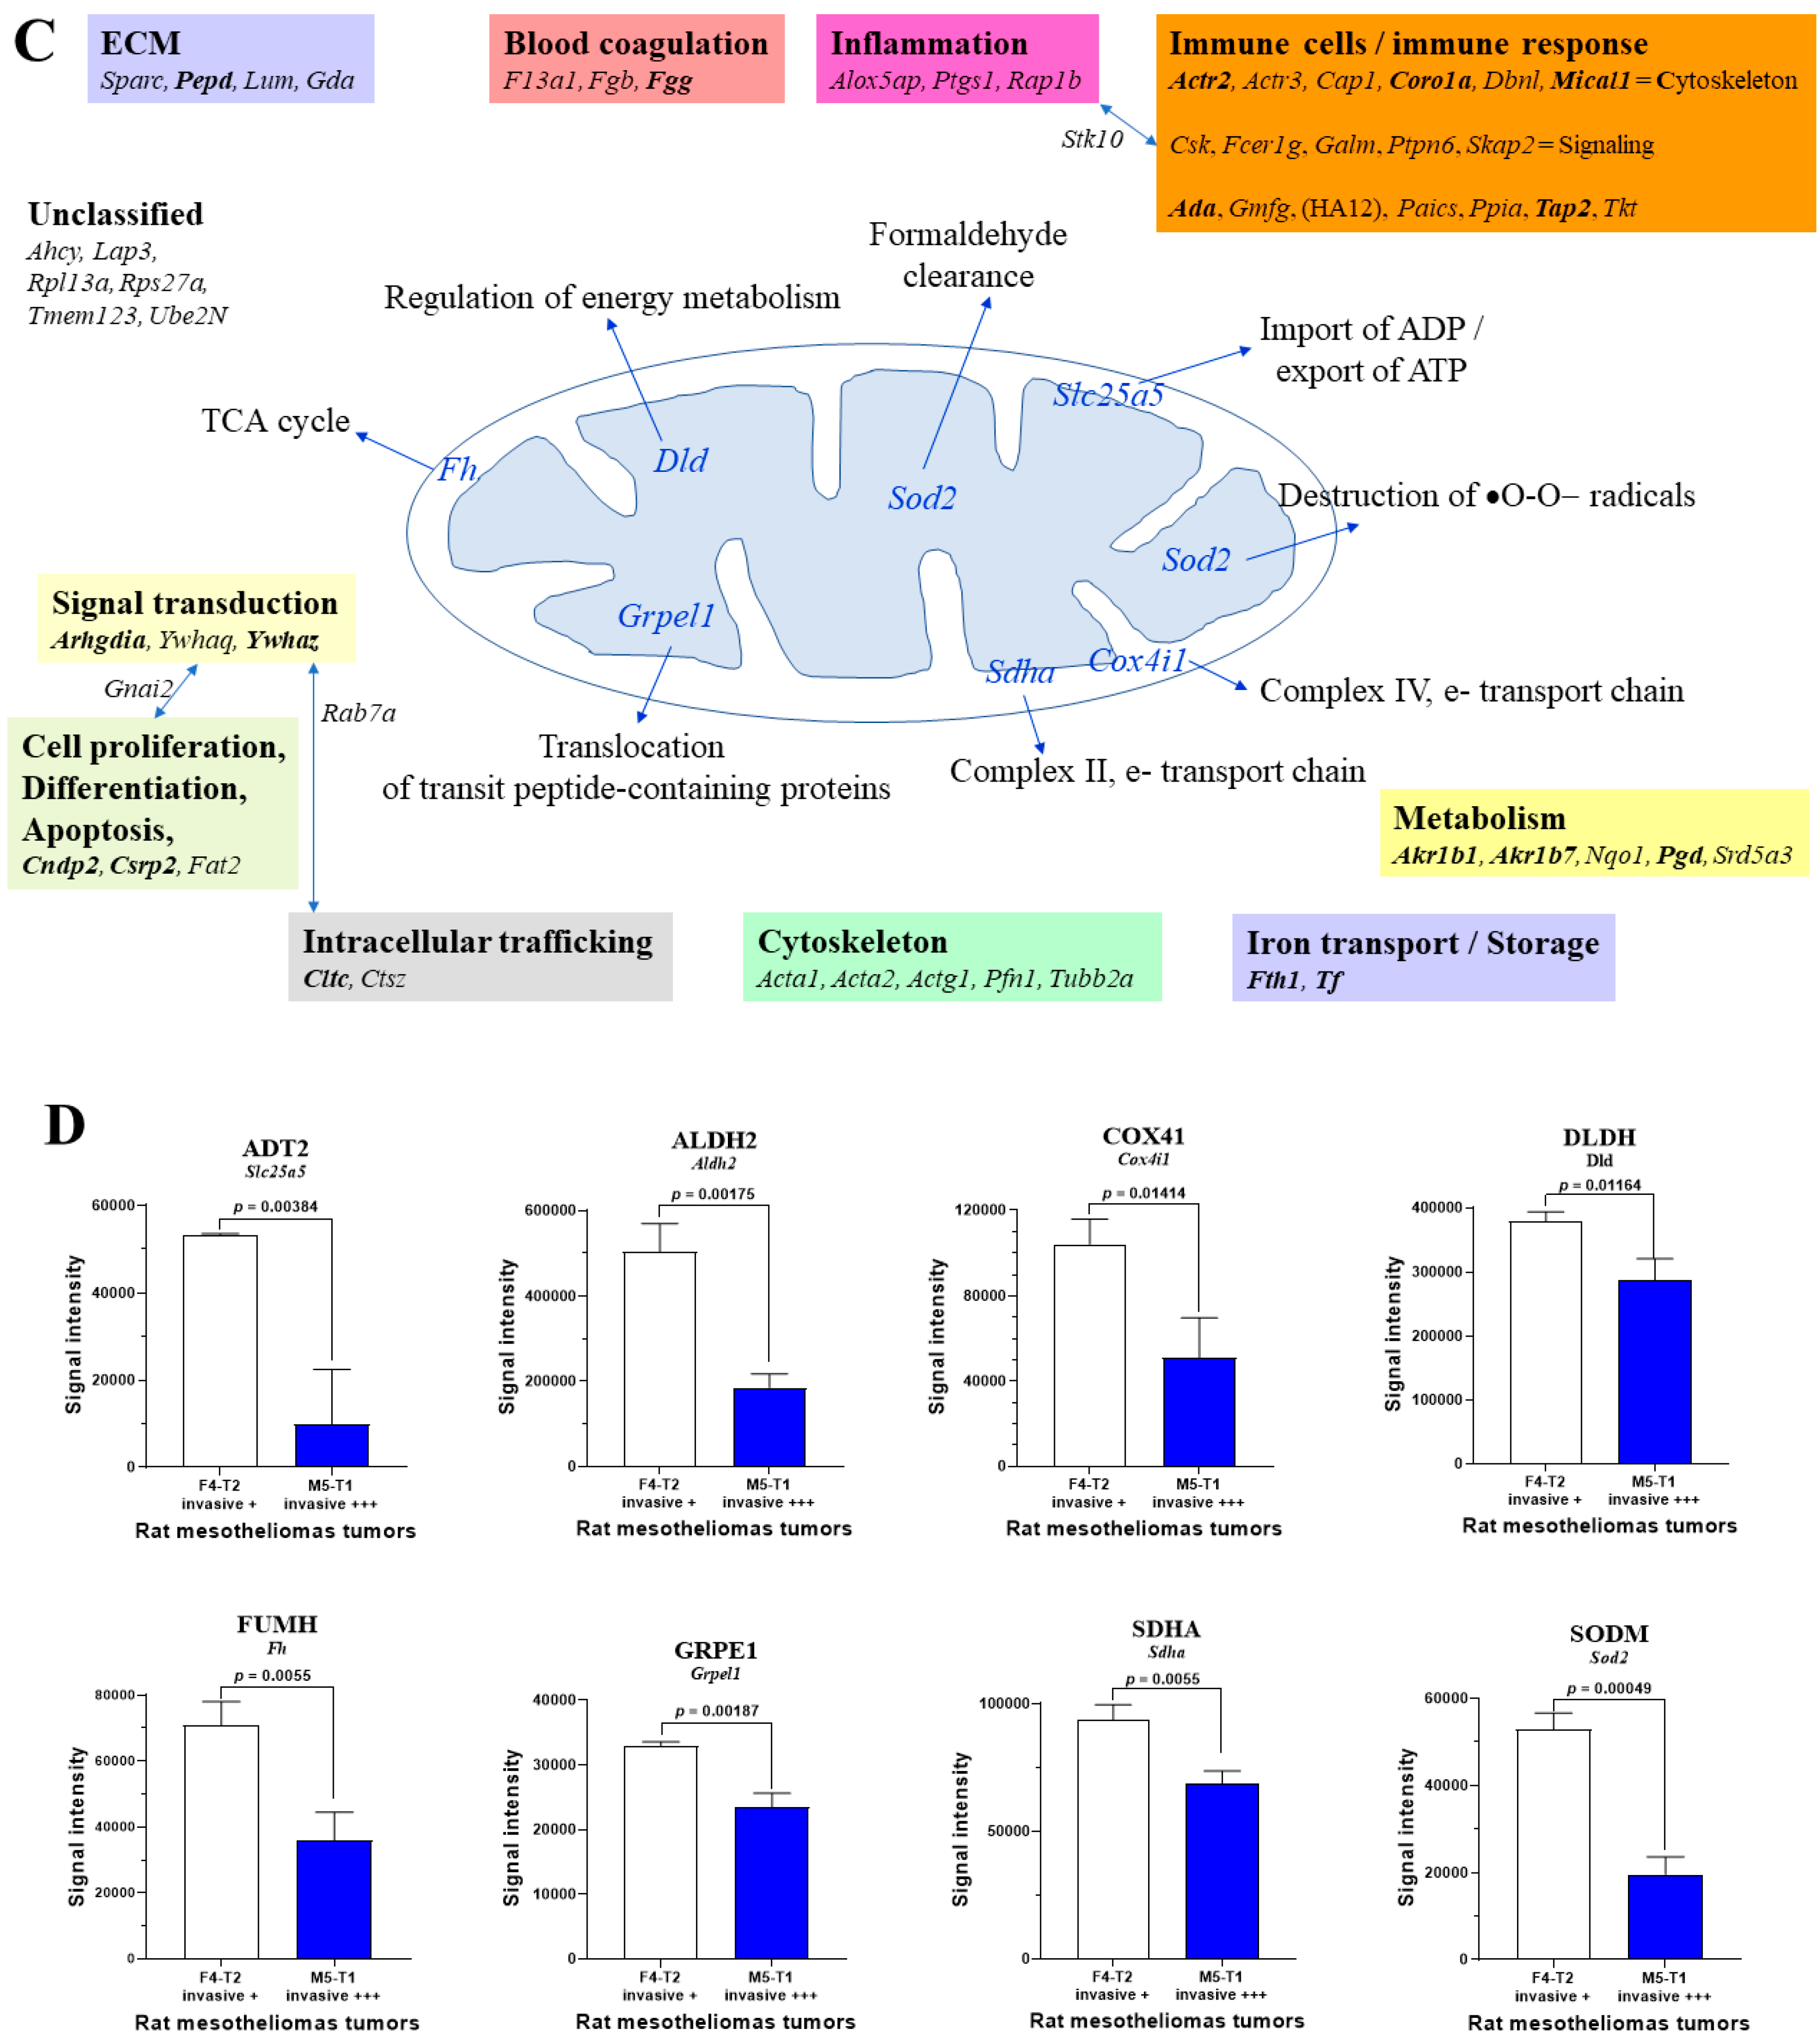

Table 1.
List of tumor tissue proteins exhibiting significant abundance increases with maximum aggressiveness. Comparison M5-T1 vs F4-T2 (p-values < 0.05). Gene and full protein names are given for Rattus norvegicus according to www.uniprot.org.
Table 1.
List of tumor tissue proteins exhibiting significant abundance increases with maximum aggressiveness. Comparison M5-T1 vs F4-T2 (p-values < 0.05). Gene and full protein names are given for Rattus norvegicus according to www.uniprot.org.
| Gene | Full name |
|---|---|
| Ywhag | 14-3-3 protein gamma |
| Hibadh | 3-hydroxyisobutyrate dehydrogenase, mitochondrial |
| Got1 | Aspartate aminotransferase, cytoplasmic |
| Acadvl | Very long-chain specific acyl-CoA dehydrogenase, mitochondrial |
| Acsl6 | Long-chain-fatty-acid--CoA ligase 6 |
| Actn1 | Alpha-actinin-1 |
| Aebp1 | Adipocyte enhancer-binding protein 1 |
| Aldh4a1 | Delta-1-pyrroline-5-carboxylate dehydrogenase, mitochondrial |
| Ampd2 | AMP deaminase 2 |
| Amy2 | Pancreatic alpha-amylase |
| Anxa3 | Annexin A3 |
| Bzw2 | Basic leucine zipper and W2 domain-containing protein 2 |
| Cc2d1b | Coiled-coil and C2 domain-containing protein 1B |
| Cpa1 | Carboxypeptidase A1 |
| Ccdc93 | REVERSED Coiled-coil domain-containing protein 93 |
| Ccs | Copper chaperone for superoxide dismutase |
| Cdc5l | Cell division cycle 5-like protein |
| Cel | Bile salt-activated lipase |
| Cma1 | Chymase |
| Cnn3 | Calponin-3 |
| / | UPF0449 protein C19orf25 homolog |
| Ctbp2 | C-terminal-binding protein |
| Ctnnb1 | Catenin beta-1 |
| Ctrb1 | Chymotrypsinogen B |
| Dync1li1 | Cytoplasmic dynein 1 light intermediate chain |
| Urod | Uroporphyrinogen decarboxylase |
| Dync1h1 | Cytoplasmic dynein 1 heavy chain 1 |
| Ecm1 | Extracellular matrix protein |
| Eef1d | Elongation factor 1-delta |
| Eno2 | Gamma-enolas |
| Fam65a | Protein FAM65A |
| Fmod | Fibromodulin |
| Fxr1 | Fragile X mental retardation syndrome-related protein 1 |
| Gdi1 | Rab GDP dissociation inhibitor alpha |
| Gnaq | Guanine nucleotide-binding protein G(q) subunit alph |
| Hnrnpk | Heterogeneous nuclear ribonucleoprotein K |
| Hspa1b | Heat shock 70 kDa protein 1B |
| Hspb8 | Heat shock protein beta-8 |
| Irf2bpl | Interferon regulatory factor 2-binding protein-like |
| Ifitm3 | Interferon-induced transmembrane protein 3 |
| Itih3 | Inter-alpha-trypsin inhibitor heavy chain H3 |
| Krt8 | Keratin, type II cytoskeletal 8 |
| Lnpep | Leucyl-cystinyl aminopeptidase |
| Letm1 | LETM1 and EF-hand domain-containing protein 1, mitochondrial |
| Pnlip | Pancreatic triacylglycerol lipase |
| Lman1 | Protein ERGIC-53 |
| Lrrc7 | Leucine-rich repeat-containing protein 7 |
| Lox | Protein-lysine 6-oxidase |
| Map1b | Microtubule-associated protein 1B |
| Mlec | Malectin |
| Mxra8 | Matrix-remodeling-associated protein 8 |
| Myh4 | Myosin-4 |
| Myh8 | Myosin-8 |
| Ppp1r12a | Protein phosphatase 1 regulatory subunit 12A |
| Nedd4 | E3 ubiquitin-protein ligase NEDD4 |
| Nid2 | Nidogen-2 |
| Nmes1 | Normal mucosa of esophagus-specific gene 1 protein |
| Smpd3 | Sphingomyelin phosphodiesterase 3 |
| Pdha1 | Pyruvate dehydrogenase E1 component subunit alpha, somatic form, mitochondrial |
| Ddost | Dolichyl-diphosphooligosaccharide--protein glycosyltransferase 48 kDa subunit |
| Pycrl | Pyrroline-5-carboxylate reductase 3 |
| Pcca | Propionyl-CoA carboxylase alpha chain, mitochondrial |
| Pdcd6ip | Programmed cell death 6-interacting protein |
| Pdlim4 | PDZ and LIM domain protein 4 |
| Pfkl | ATP-dependent 6-phosphofructokinase, liver type |
| Phldb1 | Pleckstrin homology-like domain family B member 1 |
| Plcb3 | 1-phosphatidylinositol 4,5-bisphosphate phosphodiesterase beta-3 |
| Plcd1 | 1-phosphatidylinositol 4,5-bisphosphate phosphodiesterase delta-1 |
| Plg | Plasminogen |
| Plod2 | Procollagen-lysine,2-oxoglutarate 5-dioxygenase 2 |
| Psma6 | Proteasome subunit alpha type-6 |
| Rab18 | Ras-related protein Rab-18 |
| Ric8a | Synembryn |
| Rpn1 | Dolichyl-diphosphooligosaccharide--protein glycosyltransferase subunit 1 |
| Rps28 | 40S ribosomal protein S28 |
| P3h4 | Synaptonemal complex protein SC65 |
| Sfxn1 | Sideroflexin-1 |
| Shc1 | SHC-transforming protein 1 |
| Sh3glb1 | Endophilin-B1 |
| Smad3 | Mothers against decapentaplegic homolog 3 |
| Stmn1 | Stathmin |
| Dars | Aspartate--tRNA ligase, cytoplasmic |
| Synpo | Synaptopodin |
| Tubb3 | Tubulin beta-3 chain |
| Prss1 | Anionic trypsin-1 |
| Try3 | Cationic trypsin-3 |
| Tsg101 | Tumor susceptibility gene 101 protein |
| Vcl | Vinculin |
| Vkorc1l1 | Vitamin K epoxide reductase complex subunit 1-like protein 1 |
Table 2.
List of tumor tissue proteins exhibiting significant abundance decrease with maximum aggressiveness. Comparison M5-T1 vs F4-T2 (p-values < 0.05). Gene and full protein names are given for Rattus norvegicus according to www.uniprot.org.
Table 2.
List of tumor tissue proteins exhibiting significant abundance decrease with maximum aggressiveness. Comparison M5-T1 vs F4-T2 (p-values < 0.05). Gene and full protein names are given for Rattus norvegicus according to www.uniprot.org.
| Gene name | Full protein name |
|---|---|
| Ywhaq | 14-3-3 protein theta |
| Ywhaz | 14-3-3 protein zeta/delta |
| Slc3a2 | 4F2 cell-surface antigen heavy chain |
| Pgd | 6-phosphogluconate dehydrogenase, decarboxylating |
| Xdh | Xanthine dehydrogenase/oxidase |
| Yap1 | Transcriptional coactivator YAP1 |
| Acta2 | Actin, aortic smooth muscle |
| Actg1 | Actin, cytoplasmic 2 |
| Acta1 | Actin, alpha skeletal muscle |
| Ada | Adenosine deaminase |
| Slc25a5 | ADP/ATP translocase 2 |
| Aif1 | Allograft inflammatory factor 1 |
| Akr1a1 | Alcohol dehydrogenase [NADP(+)] |
| Alox5ap | Arachidonate 5-lipoxygenase-activating protein |
| Aldh9a1 | 4-trimethylaminobutyraldehyde dehydrogenase |
| Akr1b7 | Aldose reductase-related protein 1 |
| Aldh2 | Aldehyde dehydrogenase, mitochondrial |
| Akr1b1 | Aldose reductase |
| Rnpep | Aminopeptidase B |
| Lap3 | Cytosol aminopeptidase |
| Anxa6 | Annexin A6 |
| Ap1b1 | AP-1 complex subunit beta-1 |
| Ap2a2 | AP-2 complex subunit alpha-2 |
| Aprt | Adenine phosphoribosyltransferase |
| Arpc1b | Actin-related protein 2/3 complex subunit 1B |
| Actr2 | Actin-related protein 2 |
| Actr3 | Actin-related protein 3 |
| Arpc2 | Actin-related protein 2/3 complex subunit 2 |
| B2m | Beta-2-microglobulin |
| C1qb | Complement C1q subcomponent subunit B |
| Canx | Calnexin |
| Cand1 | Cullin-associated NEDD8-dissociated protein 1 |
| Cap1 | Adenylyl cyclase-associated protein 1 |
| Capzb | F-actin-capping protein subunit beta |
| Casp1 | Caspase-1 |
| Ctsz | Cathepsin Z |
| Capza2 | F-actin-capping protein subunit alpha-2 |
| Ccdc50 | Coiled-coil domain-containing protein 50 |
| Cltc | Clathrin heavy chain 1 |
| Cndp2 | Cytosolic non-specific dipeptidase |
| Cfl1 | Cofilin-1 |
| Copb2 | Coatomer subunit beta' |
| Coro1a | Coronin-1A |
| Coro1b | Coronin-1B |
| Coro7 | Coronin-7 |
| Cotl1 | Coactosin-like protein |
| Cox4i1 | Cytochrome c oxidase subunit 4 isoform 1, mitochondrial |
| Csk | Tyrosine-protein kinase CSK |
| Csrp2 | Cysteine and glycine-rich protein 2 |
| Cux1 | Homeobox protein cut-like 1 |
| Dab2 | Disabled homolog 2 |
| Dbnl | Drebrin-like protein |
| Dld | Dihydrolipoyl dehydrogenase, mitochondrial |
| Emc2 | ER membrane protein complex subunit 2 |
| Exoc4 | Exocyst complex component 4 |
| F13a1 | Coagulation factor XIII A chain |
| Fabp5 | Fatty acid-binding protein, epidermal |
| Fat2 | Protocadherin Fat 2 |
| Fcerg1 | High affinity immunoglobulin epsilon receptor subunit gamma |
| Fga | Fibrinogen alpha chain |
| Fgb | Fibrinogen beta chain |
| Fgg | Fibrinogen gamma chain |
| Fkbp9 | Peptidyl-prolyl cis-trans isomerase FKBP9 |
| Fnta | Protein farnesyltransferase/geranylgeranyltransferase type-1 subunit alpha |
| Fth1 | Ferritin heavy chain |
| Fh | Fumarate hydratase, mitochondrial |
| Galm | Aldose 1-epimerase |
| Gdi2 | Rab GDP dissociation inhibitor beta |
| Arhgdia | Rho GDP-dissociation inhibitor 1 |
| Gphn | Gephyrin |
| Gimap4 | GTPase IMAP family member 4 |
| Gmfg | Glia maturation factor gamma |
| Gnai2 | Guanine nucleotide-binding protein G(i) subunit alpha-2 |
| Gpsm3 | G-protein-signaling modulator 3 |
| Hspa5 | 78 kDa glucose-regulated protein |
| Grpel1 | GrpE protein homolog 1, mitochondrial |
| Gda | Guanine deaminase |
| Hist1h4b | Histone H4 |
| / | RT1 class I histocompatibility antigen, AA alpha chain |
| Hexb | Beta-hexosaminidase subunit beta |
| Hmgn5 | High mobility group nucleosome-binding domain-containing protein 5 |
| Eif2s3 | Eukaryotic translation initiation factor 2 subunit 3, X-linked |
| Ilkap | Integrin-linked kinase-associated serine/threonine phosphatase 2C |
| Irgm | Immunity-related GTPase family M protein |
| Ckb | Creatine kinase B-type |
| Lasp1 | LIM and SH3 domain protein 1 |
| Lta4h | Leukotriene A-4 hydrolase |
| Lrrc15 | Leucine-rich repeat-containing protein 15 |
| Lum | Lumican |
| Gaa | Lysosomal alpha-glucosidase |
| Lyn | Tyrosine-protein kinase Lyn |
| Mical1 | [F-actin]-methionine sulfoxide oxidase MICAL1 |
| Mpdz | Multiple PDZ domain protein |
| Mx1 | Interferon-induced GTP-binding protein Mx1 |
| Nqo1 | NAD(P)H dehydrogenase [quinone] 1 |
| Ncl | Nucleolin |
| Pdcd4 | Programmed cell death protein 4 |
| Pdia3 | Protein disulfide-isomerase A3 |
| Pepd | Xaa-Pro dipeptidase |
| Ptgs1 | Prostaglandin G/H synthase 1 |
| Pip4k2a | Phosphatidylinositol 5-phosphate 4-kinase type-2 alpha |
| Srd5a3 | Polyprenol reductase |
| Tmem123 | Porimin |
| Ppp2ca | Serine/threonine-protein phosphatase 2A catalytic subunit alpha isoform |
| Ppia | Peptidyl-prolyl cis-trans isomerase |
| Pfn1 | Profilin-1 |
| Psmc5 | 26S protease regulatory subunit 8 |
| Psmb1 | Proteasome subunit beta type-1 |
| Ptbp3 | Polypyrimidine tract-binding protein 3 |
| Ptpn6 | Tyrosine-protein phosphatase non-receptor type 6 |
| Ptprc | Receptor-type tyrosine-protein phosphatase C |
| Ppat | Amidophosphoribosyltransferase |
| Paics | Multifunctional protein ADE2 |
| Rab1A | Ras-related protein Rab-1A |
| Rab7a | Ras-related protein Rab-7a |
| Rap1b | Ras-related protein Rap-1b |
| Renbp | N-acylglucosamine 2-epimerase |
| Rhoa | Transforming protein RhoA |
| Rpl11 | 60S ribosomal protein L11 |
| Rpl13a | 60S ribosomal protein L13a |
| Rpl23a | 60S ribosomal protein L23a |
| Rpl3 | 60S ribosomal protein L3 |
| Rpl7 | 60S ribosomal protein L7 |
| Rpl7a | 60S ribosomal protein L7a |
| Rpl8 | 60S ribosomal protein L8 |
| Hnrnpa1 | Heterogeneous nuclear ribonucleoprotein A1 |
| Rps2 | 40S ribosomal protein S2 |
| Rps27a | Ubiquitin-40S ribosomal protein S27a |
| Rps29 | 40S ribosomal protein S29 |
| Ahcy | Adenosylhomocysteinase |
| Ahcyl1 | Adenosylhomocysteinase 2 |
| Sec11a | Signal peptidase complex catalytic subunit SEC11A |
| Sdha | Succinate dehydrogenase [ubiquinone] flavoprotein subunit, mitochondrial |
| Sept9 | Septin-9 |
| Skap2 | Src kinase-associated phosphoprotein 2 |
| Smc1a | Structural maintenance of chromosomes protein 1A |
| Snap23 | Synaptosomal-associated protein 23 |
| Snx1 | Sorting nexin-1 |
| Snx3 | Sorting nexin-3 |
| Sod2 | Superoxide dismutase [Mn], mitochondrial |
| Sparc | SPARC |
| Srgap2 | SLIT-ROBO Rho GTPase-activating protein 2 |
| Stk10 | Serine/threonine-protein kinase 10 |
| Wars | Tryptophan--tRNA ligase, cytoplasmic |
| Tap2 | Antigen peptide transporter 2 |
| Tuba1c | Tubulin alpha-1C chain |
| Tubb2a | Tubulin beta-2A chain |
| Tubb5 | Tubulin beta-5 chain |
| Cct2 | T-complex protein 1 subunit beta |
| Cct4 | T-complex protein 1 subunit delta |
| Txn | Thioredoxin |
| Thy1 | Thy-1 membrane glycoprotein |
| Tkt | Transketolase |
| Tmed7 | Transmembrane emp24 domain-containing protein 7 |
| Tf | Serotransferrin |
| Txnl1 | Thioredoxin-like protein 1 |
| Ube2n | Ubiquitin-conjugating enzyme E2 N |
| Ubxn1 | UBX domain-containing protein 1 |
| Ugt1a6 | UDP-glucuronosyltransferase 1-6 |
| Ufl1 | E3 UFM1-protein ligase 1 |
Disclaimer/Publisher’s Note: The statements, opinions and data contained in all publications are solely those of the individual author(s) and contributor(s) and not of MDPI and/or the editor(s). MDPI and/or the editor(s) disclaim responsibility for any injury to people or property resulting from any ideas, methods, instructions or products referred to in the content. |
© 2024 by the authors. Licensee MDPI, Basel, Switzerland. This article is an open access article distributed under the terms and conditions of the Creative Commons Attribution (CC BY) license (https://creativecommons.org/licenses/by/4.0/).
Copyright: This open access article is published under a Creative Commons CC BY 4.0 license, which permit the free download, distribution, and reuse, provided that the author and preprint are cited in any reuse.


