
Submitted:
19 May 2023
Posted:
22 May 2023
You are already at the latest version
Abstract
This study seeks to determine how economic policy uncertainty (EPU) influences investment decisions and the market value of the Pakistan Stock Exchange. The study examines investment and operational data from 249 energy and petroleum companies between 2015 and 2020, in addition to macroeconomic variables such as EPU. This study investigates the moderating effects of EPU on investments in fixed and intangible assets, as well as its effect on Tobin's Q and the market price per share. The outcomes demonstrate that EPU reduces the costs of both tangible and intangible assets for businesses. In addition, companies with a greater Tobin's Q and market price per share are more impacted by uncertain corporate investment policies. However, financial leverage is found to be negatively correlated with share price and positively correlated with earnings per share and earnings per unit. Tobin's Q is positively correlated with financial leverage, indicating that firms that raise capital through debt are more likely to create value for investors. The research indicates that market-dependent enterprises are more susceptible to the unpredictability of monetary policy. Eventually, the findings suggest that consistent and transparent economic policies may increase the efficiency of corporate investment.
Keywords:
Economic Policy Uncertainty
; Tobin's Q
; Market Price Per Share
; Investment in Intangible Assets
; Fixed Assets
; Financial Leverage
; Cash Flow From Operations
1. Introduction
This study seeks to investigate the relationship between economic policy uncertainty (EPU) and corporate investment decisions. Regarding the impact of uncertainty on investments, prior research has yielded inconsistent results. As opposed to idiosyncratic uncertainty, we are primarily concerned with economic policy uncertainty. Wars and terrorist attacks can have a significant impact on business operations, affecting expenses, sales, and profitability. Additionally, external factors such as taxes and subsidies can impact investment decisions. Corporate investment is a substantial and irreversible expense, making policy modifications essential for how businesses operate and make investments.
EPU is a key factor in corporate decisions and market outcomes, influencing investment, production, and consumption patterns. Although the impact of EPU on business decisions and outcomes has been extensively studied, additional research is required to examine how EPU interacts with various investment sentiments at the firm level and influences the value of the firm [1] reported that EPU has increased over the past few years, which has had significant effects on businesses and markets. High levels of policy uncertainty can result in decreased business investment and employment, diminished consumer confidence, and heightened market volatility. Therefore, it is essential to examine the effect of EPU on the firm's value in order to comprehend how policy uncertainty influences the decision-making of businesses and, ultimately, their value.
New economic policy adoption and debate often take an extended period, and results might be unpredictable. According to the fundamental option theory, uncertainty makes it more valuable to postpone investments, especially when such investments are irreversible, to learn more about how profitable the projects will be [2]. On the other hand, uncertainty might heighten financial sector frictions that obstruct enterprises' access to outside capital and actual investments. The unpredictable nature of government economic policy, according to empirical research, has a detrimental influence on corporate investments and corporate bank loans [3], and it prompts companies to keep more cash on hand as a safety measure [4]. According to [5], uncertainty is a significant risk factor for stocks since it positively correlates with excess market returns. No earlier study has examined the relationship between macroeconomic uncertainty and financing contraction, even thoughthe debt is a significant source of corporate borrowing susceptible to market frictions. The study investigates the connection between company debt structure and the economic policy uncertainty of public limited firms.
Our research concentrates on the substantial effect that Pakistan's internal policy uncertainty has on economic activity. This factor is the primary impetus for our investigation. Policy uncertainty, in conjunction with political factors, is frequently directly related to unanticipated events that can affect the economic climate, thereby modifying the required returns for businesses to discount future cash flows. Consequently, it is essential to investigate how policy uncertainty influences corporate investment decisions. We utilize data from the Pakistan Stock Exchange because it is believed that Pakistan's economy is transitioning from a planned to a market-based system. It would be fascinating to determine if the effect of economic policy uncertainty on corporate investment is analogous to or distinct from that of market-based developed nations. The findings may have implications for other economies in transition.
The corpus of currently available research offers empirical evidence for the hypothesis that policy-related uncertainty may slow economic development by driving businesses to cut down on spending. The relationship between real per capita GDP and the unpredictability of policies for 46 developing countries between 1970 and 1985 was initially studied by [6]. They provide evidence that investment growth may be affected by policy uncertainty. According to more recent research, policy uncertainty is to blame for the decline in business investment spending during the current global financial crisis [7,8].
They show that fiscal instability disruptions hurt economic activity, whereas tax credit and budget certainty boosts company investment [9]. This economic policy uncertainty affects global and individual businesses very verst. We can see Figure 1 and the assessment in Figure 2. It is not much different. Figure 2 depicts the Pakistani economy's economic policy uncertainty from 2015 to the present.
Concerning [10], we create firm-level instruments to evaluate the causal effect of uncertainty shocks while addressing endogeneity issues. Their method of identifying exogenous variance in firm-level volatility uses industry differences in exposure to nine distinct types of aggregate uncertainty. The research considers firm-level uncertainty instruments that consider second-moment exposures to seven major currencies i.e., (the Canadian Dollar, Japanese Yen, Euro, British Pound, Swiss Franc, and Swedish Krona) in conjunction with the United States Dollar, crude oil prices, and Economic Policy Uncertainty. The Canadian Dollar, Japanese Yen, Euro, British Pound, Swiss Franc, and Swedish Krona are among these currencies. Through testing, their EPU score has shown to be an accurate predictor of basic economic policy uncertainty. The researchers constructed EPU indexes for Europe, Canada, Pakistan, and India similarly. Due to its ambiguity, we quantify economic policy uncertainty in Pakistan differently.
Corporate investment, stock prices, and Tobin's Q are examined in a sample of publicly listed Pakistani enterprises from 2015 through 2020. This contact has a substantial influence on business investment in Pakistan. Our findings confirm earlier studies for industrialized nations that policy-related economic uncertainty hurts company investment. Second, policy uncertainty affects enterprises differentially. Higher Tobin's Q, external finance and non-state ownership reduce policy uncertainty's negative effect on tangible and intangible asset investments. Our findings remain solid when we assess endogeneity, use alternative variables, evaluate stock prices and Tobin's Q's longer-lag effects, and examine economic policy uncertainty's interaction effects. Our results contribute to the literature and provide valuable counsel for policymakers in comparable nations.
The remainder of the essay is organized as follows. The development of our primary ideas and pertinent theoretical background from the literature are presented in the second part. We discuss our sample and variables in the third part. The empirical findings are presented in the fourth part. Testing is done in the fifth part. The last segment brings us to a close.
2. Literature Review
Research on the connection between business investment and the influence of uncertain economic policy on business value has produced conflicting results. According to Knight's famous idea (1921), entrepreneurs can detect and seize investment opportunities when they arise and may increase profitability by integrating resources. Therefore, the uncertainty of the economy is what drives corporate profits. An increased degree of uncertainty will also increase the anticipated profit of capital, which will lead to an increase in investment, according to the economic models developed by [11] as well as [12] that are founded on the suppositions of perfect rivalry among firms, a stable exchange scale factor, and balanced adjustment cost. However, if the assumption of [13] and [14] are loosened, [15] contend that capital investments fall as tax uncertainty rises. The genuine options arguments draw the same results. Because investment initiatives are irreversible or have buried costs, businesses must consider the difference in profit between present and future investments. Companies cut their current investment expenditure due to economic uncertainty since waiting to make future investments yields a greater return and a higher perceived worth [16]. [17] provide more industry-level evidence in support of this claim, as do [18] and [19] for firms.
Economic Policy Uncertainty (EPU) has become an essential concern for policymakers and businesses, with its impact on investment decisions and firm value being a hotly debated topic. Although the link between EPU and company value has been the subject of several research, little is known about how EPU interacts with other investment attitudes at the business level.
The effect of the Economic Policy Unit on the market value of Pakistani public enterprises between 2015 and 2020 was examined in research by [20]. They discovered that economic policy inconsistency had a negative link with market share price but a beneficial association with financial leverage. The research results demonstrated a positive association between working capital operations, the sample's market value per share, and the information in the financial statements analyzed.
[21] examined how EPU affected European firms' return on investment using data from 23 European states between 2000 and 2019. EPU drastically lowered European companies' stock market performance. EPU also affected stock returns more during times of high market volatility and low market liquidity. In contrast, research by [22] looked at how EPU affected Taiwanese companies' investing practices. According to the research, EPU favored Taiwanese companies' investment decisions, especially those with significant financial slack. The study recommended that firms with ample financial cushion were more equipped to cope with the uncertainty caused by EPU and were far more inclined to invest in profitable projects.
Additionally, research conducted in 2017 by Dibooglu and Kutan looked at the effect of EPU on the inflow of foreign direct investment (FDI). To Turkey. The research discovered that EPU had a detrimental effect on the inflow of FDI to Turkey, showing that investors from other nations were wary of investing there while economic policy uncertainty was high.
Policy uncertainty is a form of uncertainty that has a substantial impact on the investment behavior of businesses. It can result in higher-than-anticipated expenditures, decreased long-term investment, and diminished productivity [23]. Entrepreneurs are reluctant to increase investment when policy changes occur, particularly in developing nations, until the uncertainty associated with policy reform is resolved [24]. Theoretical and empirical studies conducted by [25] indicate that policy uncertainty diminishes the value of government market protections, causing more frequent stock price fluctuations. [26] demonstrate that corporate investment declines during presidential election years relative to other years. [27] research indicates that stock prices fluctuate less radically during election years due to an increase in positive noise, but election uncertainty undermines company performance and results in inefficient capital allocation. According to the findings of [28], higher levels of economic policy uncertainty harm corporate investment. The relationship between uncertainty and corporate investment can be influenced by corporate characteristics such as management flexibility, organization size, and financial constraints [29].
Unlike established market economies, countries undergoing economic transitions, such as Pakistan, may experience distinct effects of economic uncertainty on corporate investment. [30] discovered that Pakistan's return on capital is substantially greater than that of other developing market economies. Similarly, [31] compared India's return on capital and argued that the country's high investment rate is a result of its superior return on capital, which is significantly higher than that of other established nations. In the face of heightened policy unpredictability, greater returns on invested capital can encourage businesses to continue investing rather than postpone their plans. Uncertainty will likely have less of a negative impact on business investment if the projected return on invested capital is greater.
Literature indicates that EPU can impact firm value both positively and negatively, depending on the investment sentiment prevalent at the firm's level. In periods of high EPU, while some businesses may be better suited to deal with uncertainty and identify investment opportunities, others may encounter financial constraints and reduce investment expenditure. Therefore, when making investment decisions, policymakers and business managers must closely consider the impact of EPU on investment sentiment and firm value. The following initial hypothesis is derived from this study:
Hypothesis 1: The level of economic policy uncertainty is negatively related to firm investments in fixed and intangible assets.
Several studies have found that policy uncertainty has negative effects on businesses, including a reduction in external funding and an escalation of financial restrictions, which can delay investment [32]. The condition of the stock and credit markets has a substantial impact on the financing and investment decisions of corporations [33]. If companies have greater access to external debt markets, such as credit ratings, they may acquire more debt [34].
In addition, policy uncertainty may cause creditors to shorten loan maturities for a variety of reasons, including the deterioration of the capacity of borrowing companies to repay their loans by increasing operational risk and cash flow volatility. Creditors face less risk with short-term financing because they can keep a closer watch on business management [35]. When government economic policies are highly uncertain and lenders are exposed to greater interest rate risk, they may be less inclined to lend long-term debt. This reluctance may prevent companies that prefer long-term debt from securing longer-term loans, forcing them to compromise for shorter-term loans [36].
In addition, policy uncertainty increases equity risk premiums, which increases payment failure risk and enterprises' cash flow volatility [37,38]. During periods of significant policy unpredictability, creditors may become concerned about borrowers' capacity to repay, resulting in higher risk premiums to counterbalance the increased lending risk. To protect themselves against the possibility of borrowers defaulting on payments due to policy uncertainty, creditors may impose stricter covenants on loans provided to small, highly leveraged borrowers, loans made during economic downturns, and loans made when credit spreads are high [39,40,41]. Debt covenants may replace debt maturity in reducing the default risk of consumers. The discussion that has come before leads to the following hypothesis:
Hypothesis 2: Once economic policy uncertainty is high, businesses get more external funds than internal funds and vice versa.
According to [42], there is a favorable correlation between the payment cycle, the turnover of stock time, the accounts payable turnover period, and the receivables turnover period. It demonstrates that when there is uncertainty about economic policy, managing working capital for a business becomes more challenging, which reduces working capital management's effectiveness. It was discovered that uncertainty detrimentally affected working capital management effectiveness. Since little research had been done on this connection, the study at hand will add to the body of knowledge on the interactive effect of uncertainty regarding economic policies on handling working capital. We formulate the following hypothesis as follows:
Hypothesis 3: Working capital management reduces business value when economic policy unpredictability is high and increases when uncertainty is low.
The study that is given in this chapter investigates the relationship between business investments and the unpredictability of economic policy, with a particular focus on Pakistan. Even while the current body of research offers some empirical evidence of the detrimental effect that policy-related uncertainty has on business investment, there are still some holes in the argument that need to be filled. The absence of studies that investigate the connection between macroeconomic unpredictability and a contraction in finance, especially with respect to debt, is one possible gap in the research that needs to be filled. Even though it is mentioned in the text that debt is a substantial source of corporate borrowing that is sensitive to market frictions, no additional examination into how policy uncertainty can influence enterprises' access to debt financing is conducted.
Another potential research gap is the limited focus on the specific characteristics of Pakistani firms and how they might differ from firms in developed economies. According to the paragraph, the research uses figures from the Pakistan Stock Exchange to determine if the impacts of uncertain economic policies on corporate investment are equal to or greater than those in industrialized nations. However, further study is needed to determine how particular contextual elements unique to Pakistan may influence the link between unpredictability in economic policy and business investment. Finally, although the text emphasizes the need to research how policy uncertainty impacts company investment decisions, it does not investigate alternative policy remedies to reduce the detrimental effect of uncertainty on business investments. Future studies should concentrate on finding policy solutions that could assist in minimizing uncertainty about economic policies and encourage business investment.
3. Theory Applicable to Current Research
Real options theory is one theory that supports the notion of Economic Policy Uncertainty (EPU) and its interactive effects on company value. Real options theory states that enterprises must deal with uncertainty in the investment environment and that their ability to adapt their investment strategy in response to shifting economic conditions has an impact on their decision-making. Uncertainty in the setting for investment is generated by unpredictability in economic policies, which may impact changes in tax, financial, or regulatory laws and the intrinsic worth of real business options. The value of a firm's real choices is impacted by the heightened economic environment uncertainty that EPU-related enterprises confront. In reaction to higher EPU, businesses may decide to postpone investments, cut down on capital expenditures, or even abandon certain initiatives. These choices demonstrate the worth of the genuine alternatives that businesses possess as well as their adaptability to changes in the economic environment.
Moreover, EPU influences the value of real options and, therefore, company value by interacting with other firm-specific variables such as financial limitations, development prospects, and firm size. For instance, businesses that are struggling financially may be more susceptible to EPU because they have fewer resources available to them to adjust to changes in the economic environSimilarlyimilar to this, companies with significant development potential may be more impacted by EPU due to their greater actual option values. The real options one, on its whole, offers a theoretical framework to comprehend how EPU influences company value through the value of real choices that businesses own. It also emphasizes how crucial it is to take company-specific aspects into account when evaluating how EPU affects firm value.
4. Research Objective
To explore the influence of uncertain economic policies on company investment behavior, particularly fixed and intangible investments, and how this impact changes according to firm financial characteristics such as managerial flexibility, company size, and financial constraints. Additionally, it explore how policy uncertainty affects external funding, including access to debt markets and loan maturity, and the role of equity risk premium in this context.
5. Scope of the Study
This study aims to investigate the connection between economic policy unpredictability and corporate investment. It will conduct a thorough analysis of existing research on the topic and incorporate multiple perspectives and findings. The study will examine how policy uncertainty affects corporate investment behavior, productivity, external financing, and financial constraints. In addition, the study will investigate the role of management flexibility, firm size, and financial constraints as potential mediators of the effect of economic instability on business investment. In addition, the study will assess the effects of policy uncertainty on emerging markets, such as Pakistan and India, where the outcomes may differ from those of mature market economies. Ultimately, the purpose of this study is to further our comprehension of the impact of policy uncertainty on corporate investment and to construct a framework that can serve as a foundation for future research.
6. Research Methods
Using the Generalized Method of Moments (GMM) model, this study examines the relationship between policy uncertainty and firm value in the energy and petroleum industry in Pakistan. GMM is favored over other prevalent panel data approaches such as fixed effects (FE), random effects (RE), and ordinary least squares (OLS) because it resolves the endogeneity issue that arises when the dependent variable is correlated with the error term. Due to data limitations, the sample size of 249 firms in Pakistan's energy and hydrocarbon sectors is restricted. State Bank of Pakistan provided the secondary data used for this investigation, which spans the years 2015 through 2020. In its analysis, the research considers the unpredictability of economic policy, company investment in physical and intangible assets, working capital management, financial leverage, and firm value. The independent variable in this equation is the degree of economic policy uncertainty. The Arellano-Bond estimator provides an estimate for the GMM model, which addresses the issue of endogeneity by including lag-dependent variables. Robust standard errors consider the possibility of heteroskedasticity and autocorrelation. The primary findings of this research are the GMM model's calculated coefficient on economic policy uncertainty, corporate investment, and well-worth in Pakistan's energy and petroleum industry. The research is looked at to draw findings and formulate policy recommendations.
7. Dynamic panel data analysis
A statistical technique called dynamic panel data analysis is used to examine panel data, which is a collection of observations made over time on a number of people, businesses, nations, or other entities. The approach considers the data's cross-sectional and time-series aspects. The emphasis of a dynamic panel data analysis is on how the dependent variable varies over time and how explanatory factors affect those changes. Analyzing dynamic panel data is comparable to attempting to solve a puzzle in which the components are constantly altering and changing form. The Generalized Method of Moments (GMM) is one of the most prevalent techniques for this form of analysis. In contrast to other methods, such as fixed effects and random effects models, GMM takes into account the possibility of endogeneity. This happens when there is a correlation between the examined factors and the error term in the regression equation. GMM aids in the resolution of this issue by minimizing the disparity between sample and population moments. In other words, it helps us locate the missing puzzle components and properly assemble them.
In economics and the social sciences, dynamic panel data analysis is a common method for obtaining a deeper comprehension of various phenomena. Critical to sustainable development is the study of the impact of government policies on economic growth, which is one of these fields of study. In addition, dynamic panel data analysis is used to examine the relationship between corporate governance and firm performance in order to identify the best business practices. The identification of factors influencing international trade flows, which can be immensely complex, is another area of focus for researchers. Through the use of dynamic panel data analysis, researchers can gain a deeper understanding of the relationships between variables over time, allowing them to make informed decisions based on their findings. This technique is instrumental in finance, where variables such as stock prices, interest rates, and exchange rates are observed over time for many companies. The dynamic panel data model accounts for the potential endogeneity problem. A link between the explanatory factors and the error term may be established thanks to the inclusion of lag-dependent variables as instruments in the regression equation. The findings of the regression may then be understood using this correlation. It aids in limiting the influence of elements that are not visible on explained variables. The variables that are being described and those that are being discussed could be impacted by these elements. Additionally, it is possible to calculate the short- and long-term impacts of the factors that influence the dependent variable by employing dynamic panel data analysis. This is so that the influence that is felt over a longer period of time may be represented by the lagging dependent variable. Investigating the intricate relationships that may develop over time between various aspects in financial data requires the use of a sophisticated approach like dynamic panel data analysis. There are several methods for doing this.
8. Generalized Method of Moments (GMM) Estimators
When conventional techniques that are OLS, F.E, and RE cannot account for the potential endogeneity problem, Economists estimate model parameters using the Generalized Methods of Moments (GMM). GMM estimators use moment conditions derived from the population to estimate the model's parameters. These moment conditions are data functions where the population mean is zero.
Because it can deal with various problems, those are unobserved heterogeneity, endogeneity, and measurement error; GMM estimators are frequently used in panel data analysis. They are considered more effective than conventional techniques because they estimate the model's parameters by using all of the information in the data, including moment conditions.
GMM estimators are frequently used in the financial industry to estimate asset pricing models and investigate the correlation between macroeconomic factors and stock returns. When working with financial data that may display non-stationarity, time-varying volatility, and heteroskedasticity, GMM estimators are especially helpful. They enable researchers to consider these variables and estimate the model's parameters with greater accuracy.
yit = δyi, t−1 + x’itβ + uit i = 1, . . . , N; t = 1, . . . , T
Statistics descriptive: Table 1 offers descriptive statistics for the key variables and an overview of the data utilized in the research. The variables in the data include: IFA (Investing in Non-Moving Assets), INTA (Investing in Intangible Assets), FLR (Financial Leverage Ratio), WCR (Working Capital Ratio), EPU (Economic Policy Uncertainty Index), FS (Firm Size), AGE (Firm Age), CFO (Cashflow from Operations), Tobin's Q, and MPPS (Market Price Per Share) are some other financial metrics. While WCR is derived by dividing current assets by current liabilities, FLR is computed by dividing total assets by equity. A gauge of economic policy uncertainty was created by Scott Baker, Nicholas Bloom, and Steven Davis and is known as the EPU index. AGE, CFO, and FS are all measurements of the age and performance of a corporation, and FS is calculated by taking the logarithm of the total assets. Essential determinants of a company's financial performance are Tobin's Q and MPPS. As opposed to MPPS, which is the market price per share of a company's stock, Tobin's Q is calculated by dividing the market value of a firm by the cost of replacing its assets. The research seeks to acquire a thorough knowledge of the link between economic policy uncertainty and company investment behavior by taking these factors into account. Additionally, MPPS is calculated by dividing the share price as of the current day by the total number of outstanding shares. We used the natural logarithm approach to standardize the initial annual data. The cash flow is calculated each year by subtracting the net operational cash flow.
Investment in fixed assets (IFA) Investment in intangible assets (INTA) Financial leverage (F.L.) Working Capital Ratio (W.C.) Economic Policy Uncertainty (EPU) Firm Age (AGE) Firm Size (Log of Total Assets) Cashflow from Operations (CFO) Tobin Q Ratio (TobinQ) Market Price Per Share (MPPS)
The average Tobin's Q and Market Price Per Share values in Pakistani manufacturing companies is 1.411 and 93.513, respectively, representing the income based on shareholder investment. The average financial leverage is 6.766, the average EPU is 95.326 percent, and the average CFO is 0.226 for businesses that want to balance current assets and liabilities. The average INTA value is approximately 6.632. It suggests that very few intangible assets are owned by Pakistani businesses, and they have less of a predisposition to hold assets that would swiftly and gradually amortize. While investing in fixed assets indicates a 15.763 mean value. Age is shown to have a mean value of 30.600 across all manufacturing industries. Examining the mean size value, which in this case is 15.783, which indicates a very high correlation between total assets, is the next factor that is particularly appropriate. We can see that some variables have a more comprehensive range of values than others based on the descriptive statistics given in the table. For instance, the maximum value of the variable F.L. is 195.511, significantly higher than its mean value of 6.766. It implies that the distribution of this variable may contain some extreme values. The variable MPPS is similarly widely dispersed from the mean, as shown by its high standard deviation of 253.211 for the variable. The range of values for the variable INTA is smaller, with a minimum and maximum value of 6.632 and 18.371, respectively, and a relatively low standard deviation (5.740).
Pearson correlation matrix, Table 2. Tobin's Q and MPPS, the dependent variables, correlate highly with INTA and IFA. Additionally, the macroeconomic variable EPU has a significant relationship with Tobin's Q and MPPS, and the firm performance accounting model will support relevant, apparent relationships between macroeconomic variables. Tobin's Q and MPPS are highly correlated with the macroeconomic vector, the EPU, and depend on outputs. Variance inflation analysis (VIF), illustrated in Table 3 and Table 4 (2.76 and 2.08, respectively), solved the multicollinearity problem between the variables. The findings revealed that all values are less than 10, and in all models, the highest VIF value is connected to the variance influence factor values of 2.76 and 2.08, respectively. As a result, there won't be a multicollinearity issue with the results of the specified variables. The findings in Table 2 provide some early indications of how strongly INTA, IFA, FL, and W.C. affect the performance of businesses. Strong results for the association and descriptions of the results on the hypotheses seen in Table 3 have been obtained through further investigations.
Information on different investment kinds, such as those in fixed assets, intangible assets, and other long-term assets, may be found in the annual financial statement. Companies use capital expenditure to assess their investment in fixed assets as a proportion of total assets at the start of the fiscal year. The Pakistan Monthly Index of Policy Uncertainty, which measures the country's economic policy uncertainty, was calculated by the authors. The EPU index, commonly referred to as "Measuring Economic Policy Uncertainty," was calculated by Scott Baker, Nicholas Bloom, and Steven Davis. Total assets at the start of the fiscal year are divided by cash flow to get net operating cash flow. The market value of both traded and non-traded shares is computed, together with total debt, and is then divided by total assets one period later. The ratio of total debt to total assets with a one-period lag is known as the leverage ratio. The natural logarithm of the current total assets is used to represent size.
To ascertain if there was any noticeable negative link between corporate investment and times of significant economic policy uncertainty, the correlation matrix's findings were reviewed. The results indicate that when economic policy is very uncertain, company investment performs differently. A negative correlation suggests that when economic policy is highly uncertain, corporate investment is often lower. Correlation coefficients between pertinent variables are shown in Table 2. As can be seen, the other correlation coefficients are pretty insignificant, except the reasonably strong correlation between Tobin's q and invested in physical assets and intangible assets (0.410; 0.433) and companies' Size and intangible assets and intangible assets (0.517; 0.866). Corporate Investment has positive connections with the other variables but negative correlations with the CFO indicator of economic policy uncertainty.
Along with Tobin's Q, investments in intangible assets, and fixed assets, EPU exhibits a negative correlation. To determine whether multicollinearity is not an issue in the regression analysis, we employ the Variance Inflation Factor (VIF). VIF is 2.76 and 2.08 in both leaner models (lower than 10), showing that multicollinearity is not a problem.
Standard errors in parentheses *** p<0.01, ** p<0.05, * p<0.1, IFA: This variable measures the amount of Investment made by a firm in intangible assets such as patents, trademarks, and copyrights. INTA: This variable represents a firm's Investment in fixed assets such as land, buildings, and equipment. FL: Financial leverage indicates the degree to which a company uses debt to finance its operations. A higher value of F.L. indicates that the firm has taken on more debt than equity. W.C.: Working Capital ratio measures a firm's short-term liquidity. It is calculated as current assets minus current liabilities divided by current assets. EPU: Economic Policy Uncertainty measures the level of uncertainty firms face due to economic policies and regulations. Higher values of EPU indicate more significant uncertainty. AGE: This variable represents the firm's Age, calculated as the years since its inception. SIZE: Firm Size is measured as the logarithm of total assets. CFO: Cash flow from Operations indicates the amount of cash the firm generates. It is calculated by subtracting operating expenses from operating revenues. Tobin's Q: This variable measures the market value of a company's assets relative to their replacement cost. MPPS: Market Price Per Share is the price at which a firm's shares are trading.
Real options theory is used practically in this situation by examining how different factors affect a firm's Tobin's Q, which calculates the market worth of a company's assets in relation to their replacement cost. The following factors were taken into account in this analysis: MPPS, IntA, IFA, FL, WC, EPU, Age, Size, and CFO. According to the analysis's findings, MPPS significantly improves Tobin's Q. This implies that businesses that make new investments or increase their operational capacity often enjoy greater market values. Tobin's Q is positively influenced by IntA, Age, Size, and CFO, suggesting that bigger, older companies with better financial performance are often valued more by investors.
IFA, FL, and EPU, on the other hand, have a negative impact on Tobin's Q. According to this, a company's market value may be impacted by elements including significant financial debt, an unclear economic outlook, and a lack of investment in fixed assets. Overall, the analysis's findings emphasize the significance of taking genuine choices into account when making investment decisions and the possible effects that outside influences may have on a company's value. Firms may more accurately determine the prospective value of their assets and make better investment choices by adding real option theory into their decision-making processes.
Table 3 also reports several diagnostic tests commonly used to evaluate the model's validity. We used several tests to evaluate any errors in the model's specification, including the B&P LM test, the Hausman test, the heteroskedasticity test, the autocorrelation test, and the VIF test. In contrast, the Sargan and Hansen tests test the validity of the instruments used in the GMM estimation. The AR1 and AR2 tests test for autocorrelation in the model's residuals. The threshold is that if its value is significant, the problem is not present in the model. In this model, the dependent variable is Tobin's Q, a financial metric used to measure a firm's market value relative to its assets. The model includes 9 independent variables: IntA, IFA, FL, W.C., EPU, Age, Size, CFO, and a constant term. Model GMM is a regression model estimated using the Generalized Method of Moments (GMM) estimation technique. GMM is a popular econometric method used to estimate a model's parameters when the assumptions of Ordinary Least Squares (OLS) or Fixed Effects (F.E.) regression models are violated.
We applied both static and dynamic statistical models in this research. Ultimately Our baseline regression equation is based on research investments in intangible assets, investments in fixed assets, and working capital [43,44]. How much focus financial managers have on financial leverage and decisions regarding the use of internal funds or external sources are observed, and found that it has negative relation with Tobin's Q, which means the usage of internal funds have supportive as compared to debts. We lag Tobin's Q and MPPS variable by one period, following [45,46]. The following is the central equation in Model 4, the primary model for our upcoming empirical discussion. In Table 3, Table 4, Table 5 and Table 6, our major focused will be model four.
Where MPPSit market price per share and Tobin's Qit, a firm's market performance indicator, are used. INTAit represents intangible value at the end of each year, FLit represents leverage ratio in the previous period, WCit represents current assets to current liabilities in the previous period, EPUit represents uncertainty in economic policies in each period, CFOit represents cash flow, Firm Sizeit represents firm Size, which is sales revenue scaled by assets, and Firm Ageit represents firm Age. Our hypothesis is that businesses tend to spend less in tangible and intangible assets when economic policy uncertainty is high. This anticipation is predicated on the idea that uncertainty breeds risk aversion and postpones investment choices. We estimate a regression model using our dataset to test our hypothesis, and the results are shown in Table 3.
We determine that Model 4, which contains a lag dependent variable, is the best suitable specification for our research based on the empirical findings. We interpret the findings in light of the significant coefficients produced by the GMM system model. Economic policy uncertainty, our main factor of interest, is proven to have a significant detrimental impact on company investment in both tangible and intangible assets. This result implies that enterprises are less inclined to invest in assets with long-term advantages when uncertainty is high, maybe as a result of the option value of delaying investments in uncertain situations. This outcome is consistent with the idea that investments are irreversible (Pindyck, 1988).
Additionally, we expand Model 4 to include Age, Size, and CFO as three control variables. These variables are designed to measure how business characteristics affect investment choices. Overall, our results indicate that, even after adjusting for other firm-specific characteristics, economic policy uncertainty has a significant influence on corporate investment choices in both tangible and intangible assets.
The finding is consistent with the principle of irreversibility in investments and the expected benefit of postponing investments e.g., [47]. We extend Model (4) to include the three control variables Age, Size, and CFO. The results demonstrate that, despite the sizeable and favorable impacts of economic policy uncertainty, cash flow from operations, age, and business size all have a large negative impact on Tobin's Q. Therefore, our first hypothesis is not supported. It suggests that enterprises involved in Pakistani manufacturing are not focusing on external macroeconomic uncertain elements when developing their plans to invest in fixed or intangible assets because of the uncertain economic policy climate. We employed interaction term in model 4 of Table 4 when Tobin's Q is our dependent variable. In the forthcoming discussion, we will focus on Table 4's finding Model 4 in the last column.
Real options theory is a financial theory that enables businesses to choose their strategic investments based on their possible future worth. It makes an effort to estimate the investment's worthwhile taking into consideration its ambiguity and flexibility. In this situation, the GMM model is examining how real options theory is used to business investment choices. Tobin's Q, a measurement of the market worth of a firm's assets in relation to their replacement cost, is a component of the model. Additional factors that affect a company's financial and operational success include IntA, IFA, FL, WC, EPU, Age, Size, and CFO.
Each variable's influence on the firm's investment choice is represented by a set of coefficients in the model, some of which are statistically significant while others are not. The EPUIFA, EPUINTA, EPUFL, and EPUWC coefficients show how the economic policy uncertainty (EPU) of the company interacts with each of the other variables. To guarantee the validity and correctness of the model, diagnostic tests including the Sargan test, Hansen test, and AR1 and AR2 tests are utilized. These tests look for problems including heteroscedasticity, autocorrelation, and endogeneity. This model, among others, is used in the actual application of real options theory in this situation to examine investment choices and estimate their prospective worth in light of hazy future developments.
Tobin's Q, which gauges a company's market worth, and a number of independent variables are estimated using GMM in this model. Here is a basic explanation of how Tobin's Q relates to each independent variable. When speaking about investment in intangible assets, the coefficient is positive and statistically significant. It reveals that companies with larger intangible asset investments have higher Tobin's Qs. This could be the case because intangible assets, like patents and trademarks, can provide businesses a competitive edge and raise their market worth. purchase of fixed assets) The statistically significant positive coefficient indicates that enterprises with more fixed asset investments have higher Tobin's Qs. This can be the case since making investments in fixed assets can increase a company's capacity for output and competitiveness, which raises its market worth. Financial leverage has a positive, statistically significant coefficient, meaning that businesses with more financial leverage more debt compared to equity have a positive association with Tobin's Q and are more valuable.
If the firm can provide a return on investment greater than the cost of its debt, then increased leverage may result in better returns for equity investors. The positive and statistically significant working capital ratio coefficient shows that businesses having a greater working capital ratio more current assets in relation to current liabilities tend to have higher Tobin's Qs. This could be the case because investors may perceive a firm favorably if it has a greater working capital ratio as a sign that it has more liquidity and is better equipped to satisfy its short-term commitments. Financial Policy A greater Tobin's Q is often seen with businesses functioning in an environment with more uncertain economic policy, according to the positive and statistically significant uncertainty coefficient. It can seem illogical to do this. However, it may be that investors reward firms that can navigate and adapt to ambiguous economic situations. Because the age coefficient is statistically significant and negative, it shows that older businesses often have lower Tobin's Q. Younger businesses may have more development potential and are seen as more inventive and energetic, which might account for this. The positive and statistically significant size coefficient shows that bigger businesses often have a greater Tobin's Q. The size, operating cash flow, and unpredictability of economic policy are a few of the variables that affect a company's share price in the market. Market valuations are often greater for bigger, more powerful firms. Furthermore, companies with greater cash flow from operations often have higher market values because they may reinvest their gains into the business or pay them to shareholders.
Economic policy uncertainty affects the link between each independent variable and Tobin's Q, a metric of a company's market worth in proportion to its assets. The interaction terms EPUIFA, EPUINTA, EPUFL, and EPUWC describe this connection. The weakening of the positive association between each independent variable and Tobin's Q when economic policy uncertainty is high is shown by the negative coefficients of these components. This shows that the link between these variables and Tobin's Q may be moderated by the unpredictability of economic policy.
Depending on their financial status and limits, various enterprises may be impacted by economic policy uncertainty in different ways. According to our data, companies with higher Tobin's Q scores, greater internal financing capacity, and non-state ownership are less likely to be adversely affected by uncertain economic conditions when making investment choices. These businesses could be better equipped to manage unpredictable times and keep making investments in their assets. In accordance with [48,49], we make the following adjustments to our original regression equation to account for interaction terms:
When estimating the parameters in Eq. (1), the Generalized Method of Moments (GMM) method is used to take into account any possible unmeasured error factors or endogeneity of the model's explanatory variables. In the middle of the 1990s, [49,50], created the GMM estimate technique. The GMM technique combines equations in the level for which lagging variances of endogenous constructs are utilized as instruments with equations in the first difference that employ lagging levels of endogenous constructs as instruments. The endogenous variables in this research are INTAit, IFAit, FLit, and WCit, as well as the terms that govern their interactions with EPUit. Cash flows from operations and economic policy uncertainties are further factors. A series of instruments are used with delays starting from the second on back for the first-difference equations and with lag 2 in the levels equation to handle the potential of delayed impacts of economic policy shocks on the real economy. The Sargan-Hansen test of over-identifying constraints is used to assess the validity of instruments. The squared correlation between the dependent variable's actual and anticipated values serves as the goodness-of-fit metric.
The error term is examined for potential autocorrelation problems using the Lagrange multiplier test. We use [51] STATA system GMM estimation tool, xtabond2, for econometric estimation. Model 4 generates the GMM estimate when the general interaction effect of economic policy uncertainty is taken into account, as shown in Table 5. The delayed Tobin's Q shows that Sargan-Hansen tests do not challenge the validity of over-identifying limitations; all anticipated variables have extremely significant signals that make intuitive sense. Lagrange multiplier tests for second-order correlation in the error component, however, cannot disprove the null hypothesis that there is no autocorrelation in empirical models. The model seems to have a great potential for explanatory power, based on the goodness-of-fit statistics produced from the inverse correlation between the actual and anticipated values of Tobin's Q. The linearity terms included into the model make sure that missing variables are not to blame for the substantial model and relative significance of an interaction effect. The result shows that the relationship between Tobin's Q and Investment in tangible and intangible assets is increased when firm-level uncertainty rises [52].
An rise in investment in intangible assets is linked to an increase in MPPS, according to the positive and statistically significant coefficient for IntA. It implies that investors may believe businesses with stronger intangible asset investments (such patents or intellectual property) have more growth potential and long-term profitability. A rise in investment in fixed assets is linked to a drop in MPPS, according to the negative and statistically significant IFA coefficient. Investors could assume that businesses with larger fixed asset investments are less effective or less quick to adjust to shifting market circumstances. As shown by the negative and statistically significant coefficient for F.L., higher levels of financial leverage are linked to lower MPPS. Investors can interpret this to mean that more leverage raises the possibility of financial difficulty or insolvency. The working capital coefficient is negative and only weakly significant, showing that a lower MPPS is correlated with a greater working capital ratio (current assets minus current liabilities). Investors could assume that businesses with greater amounts of working capital are less adept at managing their cash flow or inventories. greater degrees of economic policy uncertainty are linked to greater MPPS, according to the positive and statistically significant coefficient for EPU. Investors may believe that uncertainty increases the likelihood of future gains or expansion prospects. The statistically significant negative age coefficient shows that older enterprises have lower MPPS than younger ones. It may imply that investors think more innovatively or with more growth potential of younger companies. Larger enterprises have greater MPPS than smaller firms, according to the positive and statistically significant Size coefficient, which is positive. It can imply that investors believe bigger companies to be more diversified or to have more dependable cash flows.
CFO: The statistically significant negative coefficient for CFO shows that lower MPPS are connected with greater amounts of cash flow from operations. It can imply that investors think the company is not investing enough in successful ideas if its cash reserves are large. The coefficients for these four interaction terms EPUIFA, EPUINTA, EPUFL, and EPUWC are all negative and statistically significant, demonstrating that levels of economic policy uncertainty mitigate the impacts of IFA, IntA, FL, and WPS on MPPS. The negative coefficient for each interaction term specifically indicates that the negative impact of IFA, IntA, FL, and WPS on MPPS is less pronounced at times of significant economic policy uncertainty. It could imply that during difficult times, investors consider businesses with substantial investments in fixed or intangible assets or high levels of financial leverage to be less hazardous, potentially as a result of these businesses' higher levels of physical assets or more diversification. Similar to this, the positive coefficient for EPU indicates that high levels of uncertainty may boost the possibility of growth possibilities, which may partially counteract the negative consequences of excessive financial leverage or the investment in fixed or intangible assets.
The models that are shown illustrate the effects of different independent factors on Tobin's Q or Market Price Per Share, the dependent variables. The research discovered substantial positive connections between Tobin's Q and IFA, FL, W.C., EPU, and Size. Tobin's Q, on the other hand, was negatively impacted by age, showing that older businesses had lower market values. IntA, EPU, and Size were shown to have a positive link with Market Price Per Share, whereas IFA, W.C., and CFO had a negative relationship. F.L. had hardly any impact on MPPS. It is important to highlight that the findings may not generalize to other situations since they depend on the precise dataset and model parameters utilized in the research.
Overall, the findings suggest that various factors, including a firm's Investment in fixed and intangible assets, financial leverage, working capital, economic policy uncertainty, and firm Size, can influence a firm's market valuation.
According to the results of the Generalized Method of Moments (GMM) analysis, the variables MPPS (Market Price Per Share), IntA (Investment in Fixed assets), IFA (Investment in Fixed Assets), FL (Firm Leverage), WC (Working Capital), EPU (Economic Policy Uncertainty), Age, Size, and CFO (Cash Flow from Operations) are significant determinants of firm value. These variables serve as influences on the real options value that businesses possess in the real options theory setting. For instance, since they have a larger value of actual options, companies with high MPPS may have more latitude to postpone investment choices. Similarly to this, businesses with high levels of cash flow from operations (CFO) could be better able to adapt their investment plan to changes in the macroeconomic environment. The findings imply that a considerable impact on company value is caused by the interplay between EPU and certain firm-specific characteristics, including IFA, IntA, FL, and WC. This suggests that the effect of EPU on company value relies on the unique traits of the business and the worth of its actual choices. Practically speaking, these results may aid businesses in making investment choices in hazy economic climates. Firms may choose the best time to invest, the amount to invest, and investment strategy by knowing the variables that impact the value of their real choices. Moreover, companies may more accurately analyse the influence of EPU on their investment choices and modify their strategies as necessary by taking the interplay between EPU and firm-specific variables into account.
The stock market price of a company is the dependent variable in this research. The shift in economic policy uncertainty from positive to negative is estimated using the lag of the market price price shock (MPPS). Economic policy irrationality has an impact on this connection, which has a positive and statistically significant coefficient for the lag-dependent variable. The importance of other coefficient estimates is mostly unaffected by the interaction term and the lack of a change in economic policy uncertainty.
The effect of uncertain economic policy on a firm's investment in physical and intangible assets, financial leverage, and working capital is examined in Column 4 of Table 6. This column contains the variables "company stock market price volatility" and "economic policy uncertainty". The EPUINTA and EPUWC interaction variables are negative in column 4 of the system GMM regression equation, suggesting a negative impact on businesses' short- and long-term investment choices. Column 4's significance threshold is set at 1%.
The lag-dependent variable MPPS's positive and significant coefficient estimates are in line with what we anticipated. Given that all coefficients are significant at the 1% level, we utilized the system GMM model in column 4 to draw the conclusion that economic policy uncertainty has a moderating influence on the variables. Our research suggests that, in addition to the influence of policy shocks, individual business uncertainty, such as stock price volatility, influences company-level investment choices. This is consistent with the real alternatives hypothesis, which holds that when faced with uncertainty, firms are more prone to postpone investment and production [53]. Businesses are more susceptible to negative extrinsic economic policy shocks when their intrinsic uncertainty is higher.
The share market price of a company is a key metric for assessing its success in the world of finance. The results of a GMM regression analysis are shown in Table 6, which reveals the correlation between MPPS, the dependent variable, and a number of independent variables. The table contains a wealth of data that may aid analysts and investors in making wise choices.
The degree of confidence in the findings is indicated by the numbers in parenthesis next to the coefficient estimations. As we go down the rows, we can see that certain factors have an influence on MPPS that is positive while others have an impact that is negative. When an independent factor changes, the coefficients indicate how much the share market price is expected to vary.
We may find patterns and insights that are not immediately obvious by closely reviewing the findings. For instance, we may see that a firm's investment in physical and intangible assets, financial leverage, and working capital are all negatively impacted by the unpredictability of economic policy. This shows that when the policy climate is unclear, firms are more cautious in their investment decisions. Table 6 offers a comprehensive look at the intricate world of money and economics. Anyone trying to make wise selections in the realm of investing and corporate finance may benefit from the insights included in it.
The findings demonstrate a high positive correlation between Tobin's Q Lag value and MPPS, with a coefficient estimate of 0.998 and a standard error of 0.0896. It implies that businesses with high Tobin's Q also often have high MPPS. With a coefficient estimate of 29.23 and a standard error of 12.02, IntA likewise exhibits a favorable connection with MPPS. It implies that businesses with significant intangible assets also have significant MPPS. With a coefficient estimate of -54.52 and a standard error of 67.31, IFA has a bad connection with MPPS. It implies that businesses with significant financial asset investments often have low MPPS. With a coefficient estimate of -1.348 and a standard error of 4.959, F.L. has a bad connection with MPPS. It implies that businesses with significant financial leverage often have poor MPPS. With a coefficient estimate of 0.731 and a standard error of 2.924, W.C. shows a favorable connection with MPPS. It implies that businesses with large working capital have higher MPPS levels. With a coefficient estimate of -4.745 and a standard error of 4.261, EPU has a bad connection with MPPS. It implies that businesses that operate in highly unpredictable environments often have low MPPS. With a coefficient estimate of 15.58 and a standard error of 11.91, age positively correlates with MPPS. It implies that older businesses often have greater MPPS. With a coefficient estimate of 4.975 and a standard error of 8.840, size positively correlates with MPPS. It implies that bigger businesses often have greater MPPS. With a coefficient estimate of -7.098 and a standard error of 14.95, CFO has a poor connection with MPPS. According to this, companies with poor cash flows often have low MPPS.
The outcomes also demonstrate a positive relationship between MPPS and the interaction between EPU and IFA, with an estimated coefficient of 0.275 and a standard error of 0.286. It suggests that firms operating in a high uncertainty environment with high investments in financial assets tend to have high MPPS. Similarly, the interaction between EPU and INTA has a negative relationship with MPPS, with a coefficient estimate of -0.0572 and a standard error of 0.122. It suggests that firms operating in highly uncertain environments with high intangible assets tend to have low MPPS. The interaction between EPU and F.L. has a positive relationship with MPPS, with a coefficient estimate of 0.00907 and a standard error of 0.0422. It suggests that firms operating in a high uncertainty environment with high financial leverage tend to have high MPPS.
Finally, the interaction between EPU and W.C. has a negative relationship with MPPS, with a coefficient estimate of -0.0111 and a standard error of 0.0306. It suggests that firms operating in a high uncertainty environment with high working capital tend to have low MPPS.
Overall, the results of the GMM analysis provide insights into the relationship between various independent variables and MPPS. The findings suggest that Tobin's Q, intangible assets, working capital, Age, and Size have positive relationships with MPPS, while financial assets, financial leverage,
The findings of a GMM regression study that looked at the correlation between the dependent variable MPPS and a number of independent factors are shown in Table 6. In parenthesis, the table gives the coefficient estimates as well as the accompanying standard errors. The magnitude and axis of the link between the independent and dependent variables are shown by these coefficients. The analysis's findings indicate that a number of independent factors and MPPS are significantly correlated. While F.L. and EPU have negative relationships with MPPS, IntA, Size, and W.C. have favorable relationships with it. Additionally, only the IFA coefficient is significant, whereas the Age, CFO, and IFA coefficients are all negative.
Additionally, the significant interactions between EPU, IFA, INTA, FL, and W.C. indicate that the values of IFA, INTA, FL, and W.C. affect the link between EPU and MPPS. Overall, these findings suggest that MPPS is favourably impacted by IntA, Size, and W.C., whereas F.L. and EPU are adversely impacted. However, given these results are based on a particular dataset and model, it is crucial to use care when extrapolating them to other scenarios.
These findings emphasize the need of taking into account a variety of variables when examining how uncertainty in economic policy affects MPPS. According to the results, businesses may be more likely to keep larger levels of working capital and invest in both physical and intangible assets when there is less economic policy uncertainty. High levels of economic policy uncertainty, on the other hand, may cause businesses to lower financial leverage and put off making investment choices. The impact of interactions between EPU and other independent variables show how complicated this connection is and how important it is to have a thorough grasp of the variables at work. We may find patterns and insights that are not immediately obvious by closely reviewing the findings. For instance, we may see that a firm's investment in physical and intangible assets, financial leverage, and working capital are all negatively impacted by the unpredictability of economic policy. This shows that when the policy climate is unclear, firms are more cautious in their investment decisions. Table 6 offers a comprehensive look at the intricate world of money and economics. Anyone trying to make wise selections in the realm of investing and corporate finance may benefit from the insights included in it.
9. Explanation of the Hypothesis
According to Hypothesis 1, there is a connection between corporate investment in physical and intangible assets and the unpredictability of economic policy. In particular, the theory contends that when economic policy uncertainty is high, firms are less likely to invest in physical and intangible assets. Businesses are more inclined to invest in fixed and intangible assets when economic policy uncertainty is minimal. Physical assets such as buildings, machinery, and equipment that companies own and employ to produce products and services are referred to as fixed assets. On the other hand, intangible assets are non-physical assets that companies own and employ, such patents, trademarks, and copyrights.
According to the theory, when economic policy uncertainty is high, firms are less inclined to invest in fixed and intangible assets because they are unclear about future economic circumstances and the possible effects of policy changes on their investment choices. Businesses could choose to hang onto their cash in such a scenario as opposed to investing it in potential loss-making assets. In contrast, firms are more inclined to invest in fixed and intangible assets when economic policy uncertainty is low because they are more confident in the state of the economy and the prospective returns on their investments. It may be the result of consistent governmental actions, an expanding economy, and favourable market circumstances.
Overall, hypothesis 1 shows that firm investment choices in physical and intangible assets are greatly impacted by economic policy uncertainty.
According to hypothesis 2, firms depend more on external funding sources, such as bank loans, bonds, or equity financing, than they do on internal ones, such retained profits or cash reserves, when economic policy uncertainty is high. Because of increased economic policy uncertainty, firms may be less willing to spend internal capital in long-term initiatives. To lessen their risks and uncertainties, they can instead go to the outside world for finance.
In contrast, firms may be more eager to utilize internal resources to finance investments in real and intangible assets when economic policy uncertainty is low because they see less risks and economic environment uncertainties. They could be less dependent on outside money as a consequence. Overall, the theory contends that firm financing choices are influenced by the degree of economic policy uncertainty, with higher levels of uncertainty resulting in a larger dependence on outside finance sources.
According to hypothesis 3, there is a link between economic policy uncertainty and a firm's ability to maximize value via working capital management. Taking care of a company's current assets and obligations is referred to as working capital management. Businesses may find it challenging to forecast future economic circumstances and may exercise more caution when making investment choices, including how they manage their working capital, when economic policy uncertainty is high. It may reduce a company's working capital, which would be detrimental to its overall financial health and, eventually, its worth. On the other hand, firms may have more faith in the future when economic policy uncertainty is minimal. To enhance their business operations and financial stability, they can be more eager to invest in working capital. It could boost a company's working capital, enhancing its worth.
As a result, according to Hypothesis 3, the effect of economic policy uncertainty on working capital management on a firm's value is detrimental.
10. Conclusions
The study came to the conclusion that a variety of variables, including Tobin Q MPPS, IntA, IFA, FL, WC, EPU, Age, Size, and CFO, had a significant effect on firm value and investment choices. In the framework of real options theory, a number of things have an impact on the real choices value that firms have. The study also found that the importance of a firm's actual choices as well as its distinguishing qualities have a significant role in how economic policy uncertainty (EPU) influences a firm's value. Our findings provide helpful advice on how businesses could pick their investments in uncertain economic climates by taking into account the variables that influence the value of their real decisions. The study finds that the interplay between EPU and firm-specific characteristics like IFA, IntA, FL, and WC has a considerable impact on company value. Finally, the study's regression analysis revealed that whereas Tobin's Q Lag, IntA, WC, Age, and Size have positive relationships with MPPS, IFA, FL, and CFO had negative ones. The study highlights how important it is for investors to consider both internal company uncertainty and external economic policy shocks when making investment decisions.
The findings of our research highlight the vital importance of real option theory in understanding how policy uncertainty affects enterprises' financial constraints and investment activity. Our data supports the idea that policy uncertainty has detrimental effects on investments owing to market frictions by confirming that it exacerbates financial constraints and hinders access to external finance. Our analysis also demonstrates that contradictory economic policies have a negative effect on market share prices but are favorably related with financial leverage. We also find a strong correlation between working capital operations, an important financial statement indicator, and market price per share for the sample companies. Our findings are supported by the discovery of a link between a firm's physical and intangible assets and the unpredictable nature of economic policy. It is important to recognize that our findings may not generalize to other contexts since they are dependent on the information and methods used in our research. However, our results provide important new understandings of how policy uncertainty affects businesses' financial judgments and investment practices.
The implications of our study are particularly significant for businesses with constrained budgets. We demonstrate that the real negative effects of economic policy uncertainty on fixed asset investments are actually more pronounced at times of heightened macroeconomic variables due to a lack of external loan financing and unfavorable lending circumstances. Our research indicates that restricting external debt financing with important macroeconomic drivers worsens the financial restrictions that businesses confront and has a negative impact on corporate investments. Overall, our analysis emphasizes how crucial it is for investors, business managers, and politicians to consider how policy uncertainty may impact businesses' financial constraints and investment activity. Firms may be able to negotiate unclear economic policies and make prudent investment decisions by applying real option theory.
11. Further Recommendations
Following are some suggestions for further research and decision-making based on the study's findings: More study is needed to determine how economic policy uncertainty affects businesses' attitudes toward investing and decision-making, especially in emerging nations like Pakistan. Future research might examine how government actions can lower economic policy uncertainty and lessen its negative effects on investments and value of enterprises. The implementation of policies that provide a stable economic climate, lessen uncertainty, and encourage businesses to invest more in fixed and intangible assets should be taken into consideration by policymakers. Future research might examine how corporate governance procedures help businesses' investments and value from being negatively impacted by unpredictable economic policies.
The effects of EPU on various sectors and industries, as well as the effects on small and medium-sized firms (SMEs), may be explored further via study. Comparing Pakistan's EPU effect on firm value to that of other nations in the area, such as India, Bangladesh, and Sri Lanka, might be useful. To expand the sample size and boost the reliability of the findings, more information may be gathered over a longer time period. Implementing these suggestions will help policymakers and scholars better understand how economic policy uncertainty affects investments and value in enterprises and pinpoint practical mitigation solutions for its negative consequences.
12. Benefits to the stakeholders
The study offers valuable insights into how economic policy uncertainty affects firm value for those involved in Pakistan's energy and petroleum industries. They can use the research findings to make well-informed decisions about risk management, market trends, and investment strategies, which can improve performance and profitability.
The findings can serve as a roadmap for policymakers as they develop measures to encourage investment sentiment, increase investor confidence, and motivate businesses to invest in the oil and gas industry. Additionally, the study can add to the larger body of academic literature on the impact of investment sentiments and economic policy uncertainty on firm value. The results can help researchers and policymakers better understand the dynamics of the energy and petroleum sectors in developing nations like Pakistan. They can also guide future studies and research on these topics. Overall, the research paper can potentially be helpful to Pakistani energy and petroleum industry stakeholders, national policymakers, and the larger academic community.
Acknowledgments
The study was funded by Researchers Supporting Project number (RSPD2023R749), King Saud University, Riyadh, Saudi Arabia.
References
- Abel, A. B. Optimal Investment under uncertainty. The American Economic Review 1983, 73, 228–233. [Google Scholar] [CrossRef]
- Aizenman, J., & Marion, N. P. Macroeconomic uncertainty and Private Investment. Economics Letters 1993, 41, 207–210. [CrossRef]
- Akron, S. , Demir, E., Díez-Esteban, J. M., & García-Gómez, C. D. Economic policy uncertainty and corporate Investment: Evidence from the U.S. hospitality industry. Tourism Management 2020, 77, 104019. [Google Scholar] [CrossRef]
- Alfaro, Ivan, Nicholas Bloom, and Xiaoji Lin, The Finance Uncertainty Multiplier (2021). [CrossRef]
- Amore, M. D., & Corina, M. Political elections and corporate Investment: International evidence. Journal of International Business Studies 2021, 52, 1775–1796. [CrossRef]
- Apergis, N., Poufinas, T., & Antonopoulos, A. ESG scores and cost of debt. Energy Economics 2022, 112, 106186. [CrossRef]
- Arellano, M., & Bover, O. Another look at the instrumental variable estimation of error-components models. Journal of econometrics 1995, 68, 29–51. [CrossRef]
- Audi, M., Sulehri, F. A., Ali, A., & Al-Masri, R. (2022). An Event Based Analysis of Stock Return and Political Uncertainty in Pakistan: Revisited. [CrossRef]
- Baker, S. R., Bloom, N., & Davis, S. J. Measuring economic policy uncertainty. The Quarterly Journal of Economics 2016, 131, 1593–1636. [CrossRef]
- Balcilar, M., Usman, O., Gungor, H., Roubaud, D., & Wohar, M. E. Role of global, regional, and advanced market economic policy uncertainty on bond spreads in emerging markets. Economic Modelling 2021, 102, 105576. [CrossRef]
- Batabyal, S., & Killins, R. Economic policy uncertainty and stock market returns: Evidence from Canada. The Journal of Economic Asymmetries 2021, 24, e00215. [CrossRef]
- Bloom, N., Bond, S., & Van Reenen, J. Uncertainty and investment dynamics. The review of economic studies 2007, 74, 391–415. [CrossRef]
- Blundell, R., & Bond, S. Initial conditions and moment restrictions in dynamic panel data models. Journal of econometrics 1998, 87, 115–143. [CrossRef]
- Boyer, B. H., & Filion, D. Common and fundamental factors in stock returns of Canadian oil and gas companies. Energy Economics 2007, 29, 428–453. [CrossRef]
- Caixe, D. F. Corporate governance and investment sensitivity to policy uncertainty in Brazil. Emerging Markets Review 2022, 51, 100883. [Google Scholar] [CrossRef]
- Chen, L., Yuan, Y., & Zhao, N. The effect of oil price uncertainty on corporate Investment in the presence of growth options: Evidence from listed companies in China (1998–2019). The North American Journal of Economics and Finance 2022, 62, 101779. [CrossRef]
- Cheng, X. The Impact of Economic Policy Uncertainty on the Efficiency of Corporate Working Capital Management—The Evidence from China. Modern Economy 2019, 10, 811–827. [Google Scholar] [CrossRef]
- Cui, X., Wang, C., Liao, J., Fang, Z., & Cheng, F. Economic policy uncertainty exposure and corporate innovation investment: Evidence from China. Pacific-Basin Finance Journal 2021, 67, 101533. [CrossRef]
- Custódio, C., Ferreira, M. A., & Laureano, L. Why are U.S. firms using more short-term debt? Journal of Financial Economics 2013, 108, 182–212. [CrossRef]
- de Fontenay, E. (2022). The Use of Debt in Corporate Finance. Encyclopedia of Law and Economics (Edward Elgar), Forthcoming. [CrossRef]
- Faff, R., & Brailsford, T. Oil price risk and the Australian stock market. Journal of Energy Finance & Development 1999, 4, 69–87. [CrossRef]
- Fernandes, B., Cunha, J., & Ferreira, P. The use of real options approach in energy sector investments. Renewable and Sustainable Energy Reviews 2011, 15, 4491–4497. [CrossRef]
- Hartman, R. The effects of price and cost uncertainty on Investment. Journal of economic theory 1972, 5, 258–266. [Google Scholar] [CrossRef]
- Huang, H. H., Kerstein, J., Wang, C., & Wu, F. Firm climate risk, risk management, and bank loan financing. Strategic Management Journal 2022. [CrossRef]
- Ilyas, M., Khan, A., Nadeem, M., & Suleman, M. T. Economic policy uncertainty, oil price shocks and corporate Investment: evidence from the oil industry. Energy Economics 2021, 97, 105193.
- Iqbal, N., Naeem, M. A., & Suleman, M. T. Quantifying the asymmetric spillovers in sustainable investments. Journal of International Financial Markets, Institutions and Money 2022, 77, 101480. [CrossRef]
- Irwin, K., Gilstrap, C., McDowell, W., Drnevich, P., & Gorbett, A. How knowledge and uncertainty affect strategic international business investment decisions: Implications for cross-border mergers and acquisitions. Journal of Business Research 2022, 139, 831–842. [CrossRef]
- Jacob, M., Wentland, K., & Wentland, S. A. Real effects of tax uncertainty: Evidence from firm capital investments. Management Science 2022, 68, 4065–4089. [CrossRef]
- Jory, S. R., Khieu, H. D., Ngo, T. N., & Phan, H. V. The influence of economic policy uncertainty on corporate trade credit and firm value. Journal of Corporate Finance 2020, 64, 101671. [CrossRef]
- Jumah, Z., Younas, Z. I., & Al-Faryan, M. A. S. Economic policy uncertainty, corporate diversification, and corporate Investment. Applied Economics Letters 2022, 1–11. [CrossRef]
- Knight Frank, H. (1921). Risk, uncertainty and profit. книга. [CrossRef]
- Kundu, S. The Anatomy of Corporate Securitizations and Contract Design. Journal of Corporate Finance 2022, 102195. [Google Scholar] [CrossRef]
- Le, A. T., & Tran, T. P. Does geopolitical risk matter for corporate Investment? Evidence from emerging countries in Asia. Journal of Multinational Financial Management 2021, 62, 100703. [CrossRef]
- Li, D., Tong, T. W., Xiao, Y., & Zhang, F. Terrorism-induced uncertainty and firm R&D investment: A real options view. Journal of International Business Studies 2022, 53, 255–267. [CrossRef]
- Loughran, T., & McDonald, B. Textual analysis in accounting and finance: A survey. Journal of Accounting Research 2016, 54, 1187–1230. [CrossRef]
- Muriithi, S. G., Walters, B. A., McCumber, W. R., & Robles, L. R. Managerial entrenchment and corporate social responsibility engagement: The role of economic policy uncertainty. Journal of Management and Governance 2022, 26, 621–640. [CrossRef]
- Nguyen, N. H., & Phan, H. V. Policy uncertainty and mergers and acquisitions. Journal of Financial and Quantitative Analysis 2017, 52, 613–644. [CrossRef]
- Obenpong Kwabi, F., Owusu-Manu, S., Boateng, A., Ezeani, E. B., & Du, M. Economic policy uncertainty and cost of capital: the mediating effects of foreign equity portfolio flow. Review of Quantitative Finance and Accounting 2022, 1–25. [CrossRef]
- Phan, H. V., Nguyen, N. H., Nguyen, H. T., & Hegde, S. Policy uncertainty and firm cash holdings. Journal of Business Research 2019, 95, 71–82. [CrossRef]
- Pindyck, R. S. (1990). Irreversibility, uncertainty, and Investment. [CrossRef]
- Qi, X. Z., Ning, Z., & Qin, M. Economic policy uncertainty, investor sentiment and financial stability—an empirical study based on the time varying parameter-vector autoregression model. Journal of Economic Interaction and Coordination 2022, 17, 779–799. [CrossRef]
- Ramezanifar, A., & Mousavi, S. A. The impact of economic policy uncertainty on the stock returns of the energy sector: Evidence from the U.S. Journal of Energy Finance & Development 2019, 4, 1–14. [CrossRef]
- Rashid, A., Nasimi, A. N., & Nasimi, R. N. The uncertainty–investment relationship: scrutinizing the role of firm Size. International Journal of Emerging Markets. 2021. [CrossRef]
- Roodman, D. How to do xtabond2: An introduction to difference and system GMM in Stata. The stata journal 2009, 9, 86–136. [Google Scholar] [CrossRef]
- Sen, P. Capital accumulation and convergence in a small open economy. International Economics Studies 2022, 38, 15–24. [Google Scholar] [CrossRef]
- Soana, M. G., & Caselli, S. Exploring the impact of economic policy uncertainty on international firms' capital structure. Journal of Financial Management, Markets and Institutions 2019, 7, 189–216. [CrossRef]
- Su, C. W., & Chang, C. L. Economic policy uncertainty and financial market volatility. Journal of Financial Stability 2019, 40, 110–125. [CrossRef]
- Tran, D. T., & Phan, H. V. Government economic policy uncertainty and corporate debt contracting. International Review of Finance 2022, 22, 169–199. [CrossRef]
- Wang, D., Liu, T., Li, X., Huang, Y., & Zhou, Y. Identifying the Dynamic Influence of Economic Policy Uncertainty on Enterprise Investment Using Functional Data Analysis. Mathematical Problems in Engineering 2022, 2022. [CrossRef]
- Wen, H., Lee, C. C., & Zhou, F. How does fiscal policy uncertainty affect corporate innovation investment? Evidence from China's new energy industry. Energy Economics 2022, 105, 105767. [CrossRef]
- Zakari, A., Adedoyin, F. F., & Bekun, F. V. The effect of energy consumption on the environment in the OECD countries: economic policy uncertainty perspectives. Environmental Science and Pollution Research 2021, 28, 52295–52305. [CrossRef]
- Zeitun, R., & Goaied, M. The nexus between debt structure, firm performance, and the financial crisis: nonlinear panel data evidence from Japan. Applied Economics 2022, 1–19. [CrossRef]
- Zhang, D., & Li, S. The effect of economic policy uncertainty on corporate cash holdings: Evidence from China. Journal of Asian Economics 2019, 65, 101168. [CrossRef]
Figure 1.
Global Economic Policy Uncertainty (GEPU).
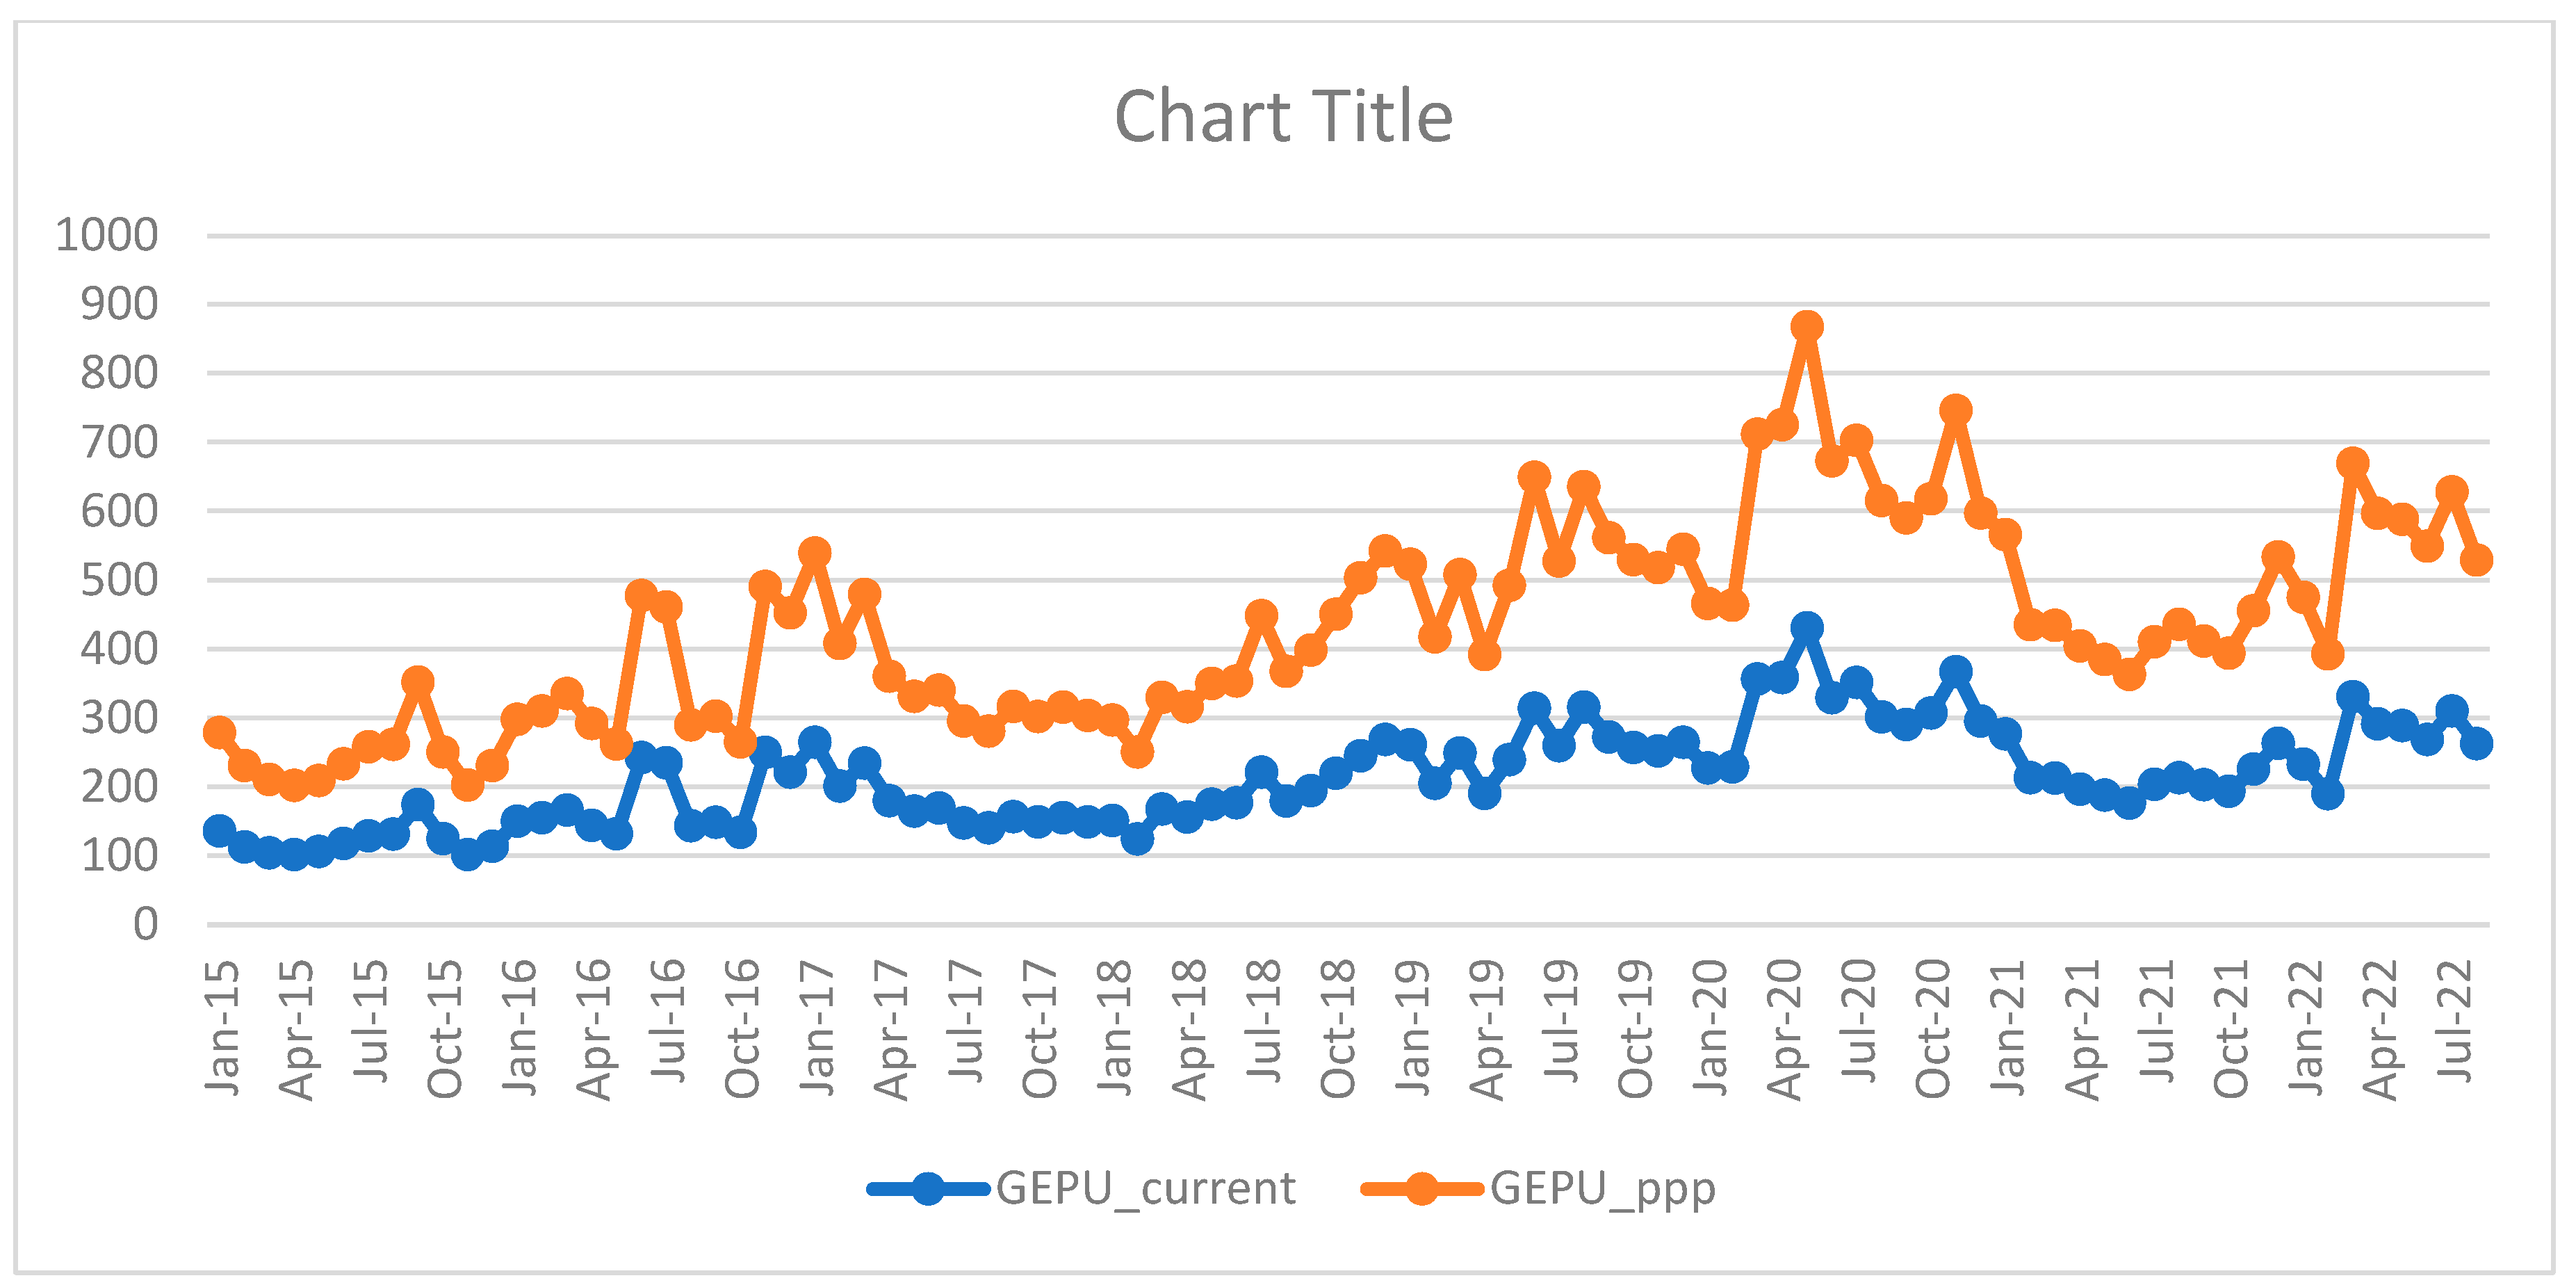
Figure 2.
Pakistan EPU index -2 and EPU index-4 Chart.
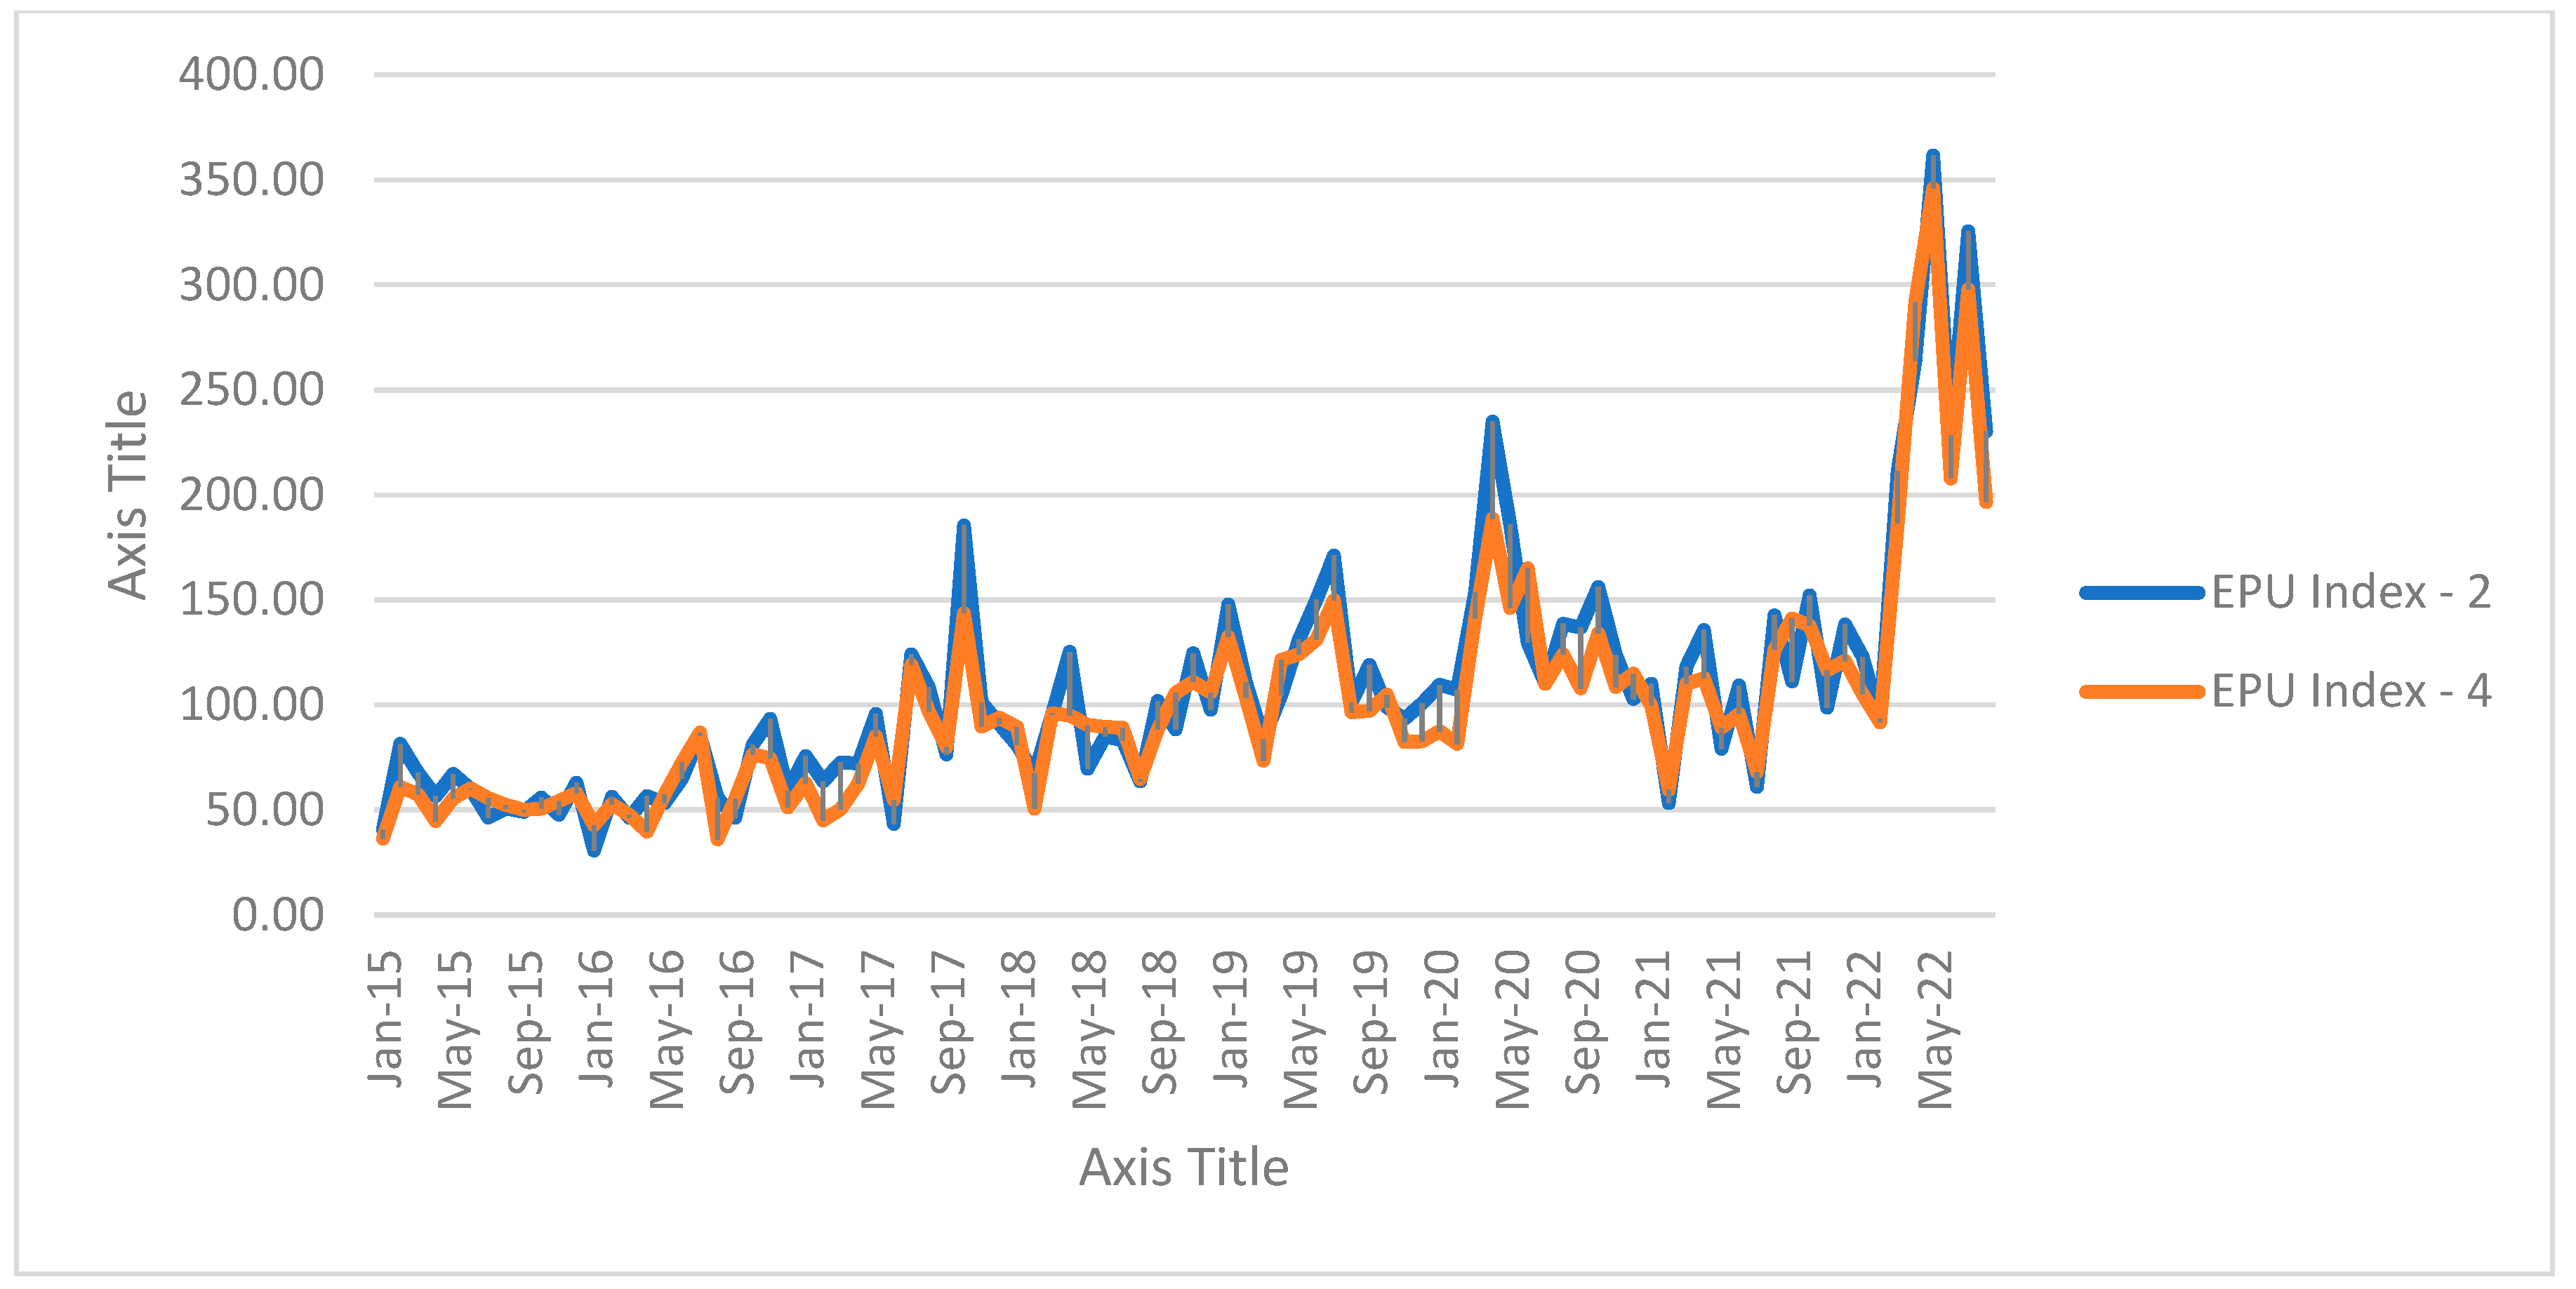
Figure 3.
Conceptual Model of the Research: Source Author.
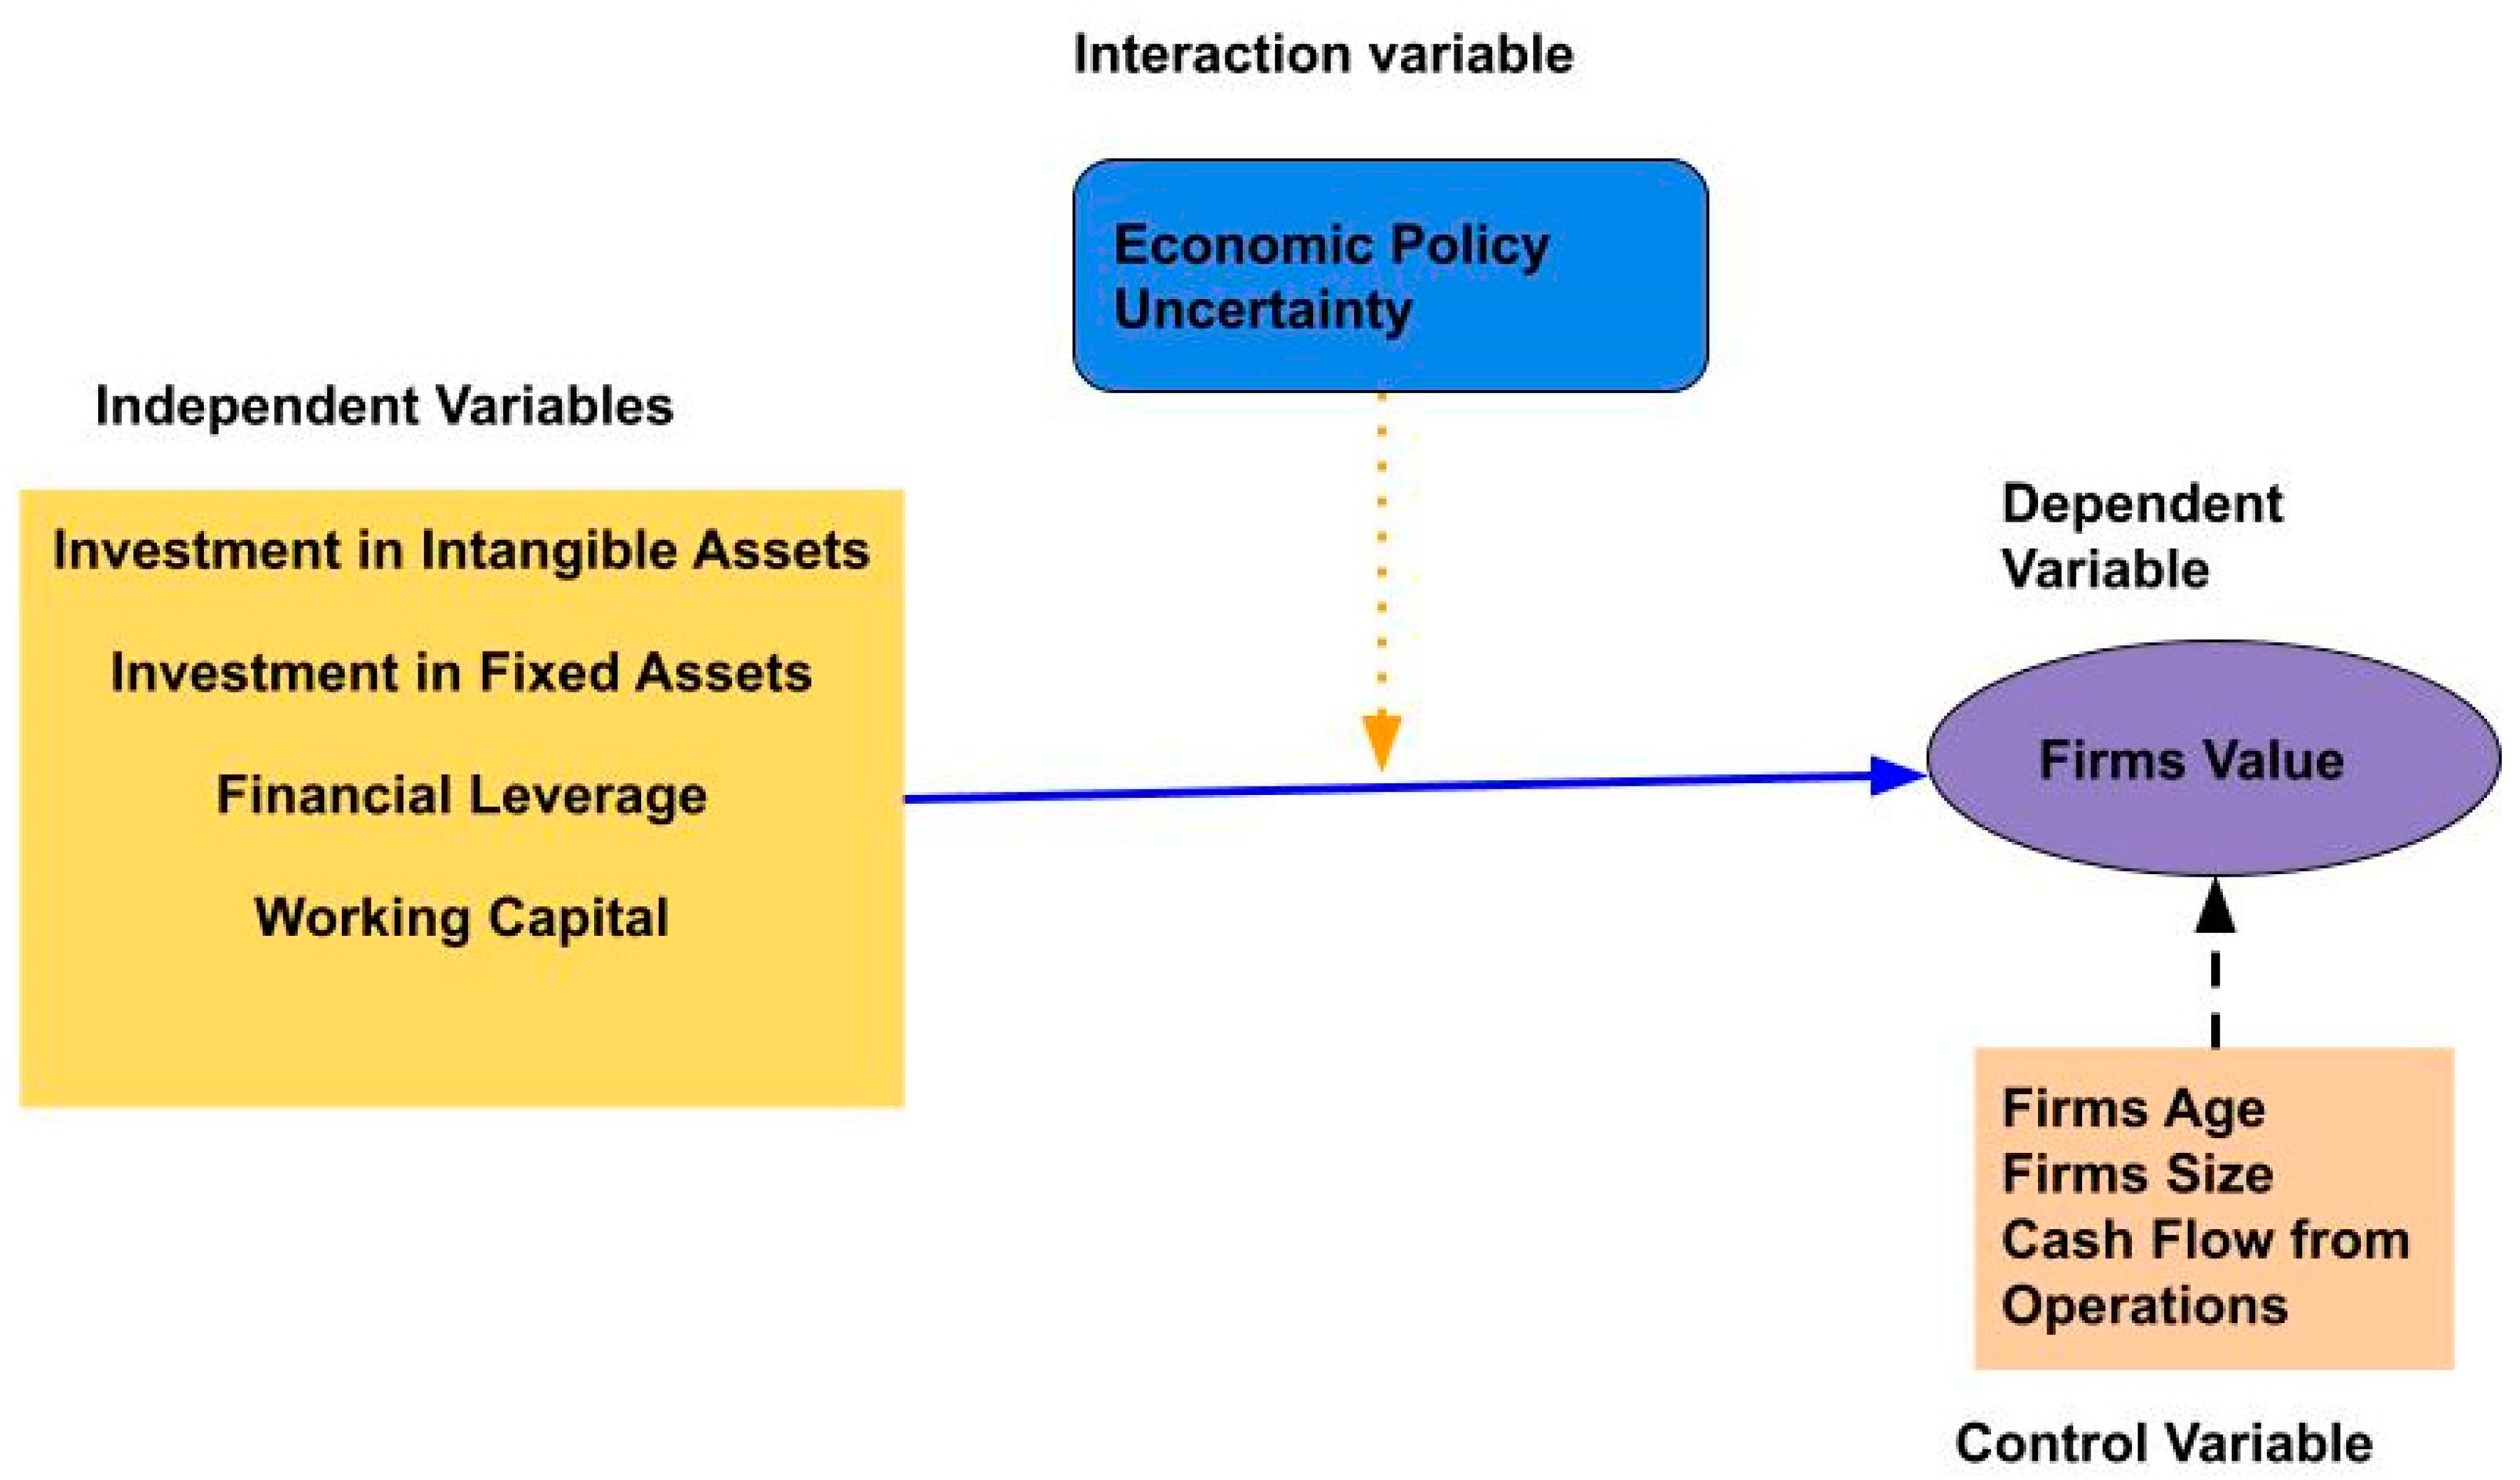

Table 1.
Descriptive Statistics.
| Mean | Maximum | Minimum | Std. Dev. | Skewness | Kurtosis | Observations | |
| INTA | 6.632 | 18.371 | 6.632 | 5.760 | -0.003 | 1.578 | 5129 |
| IFA | 15.763 | 19.468 | 8.928 | 2.507 | -0.852 | 3.283 | 5129 |
| FL | 6.766 | 195.511 | 1.022 | 20.508 | 7.118 | 62.227 | 5129 |
| WC | 11.816 | 113.543 | 11.816 | 34.765 | 3.063 | 14.084 | 5129 |
| EPU | 95.326 | 139.820 | 58.720 | 28.739 | 0.149 | 1.724 | 5129 |
| AGE | 30.600 | 68.000 | 7.000 | 17.419 | 0.775 | 2.336 | 5129 |
| SIZE | 15.783 | 20.477 | 15.783 | 4.125 | -2.196 | 8.270 | 5129 |
| CFO | 0.226 | 6.762 | 0.226 | 0.750 | 7.539 | 60.994 | 5129 |
| TOBINQ | 1.411 | 9.955 | 1.411 | 1.660 | 2.747 | 12.009 | 5129 |
| MPPS | 93.513 | 1575.640 | 93.513 | 253.211 | 4.624 | 24.082 | 5129 |
Table 2.
Correlation matrix.
| Correlation | INTA | IFA | FL | WC | EPU | AGE | SIZE | CFO | TOBINQ | MPPS |
| INTA | 1.000 | |||||||||
| IFA | 0.526 | 1.000 | ||||||||
| 0.000 | ||||||||||
| FL | 0.185 | 0.276 | 1.000 | |||||||
| 0.044 | 0.002 | |||||||||
| WC | 0.255 | 0.015 | 0.029 | 1.000 | ||||||
| 0.005 | 0.005 | 0.006 | ||||||||
| EPU | -0.066 | -0.013 | 0.073 | -0.169 | 1.000 | |||||
| 0.074 | 0.088 | 0.029 | 0.006 | |||||||
| AGE | 0.325 | 0.377 | 0.384 | 0.144 | 0.097 | 1.000 | ||||
| 0.000 | 0.000 | 0.000 | 0.117 | 0.091 | ||||||
| SIZE | 0.517 | 0.866 | 0.224 | 0.115 | 0.023 | 0.305 | 1.000 | |||
| 0.000 | 0.000 | 0.014 | 0.011 | 0.001 | 0.001 | |||||
| CFO | -0.149 | -0.267 | -0.059 | -0.113 | 0.035 | -0.078 | -0.254 | 1.000 | ||
| 0.105 | 0.003 | 0.019 | 0.020 | 0.002 | 0.096 | 0.005 | ||||
| TOBINQ | 0.433 | 0.410 | 0.356 | 0.254 | -0.265 | 0.281 | 0.408 | -0.119 | 1.000 | |
| 0.000 | 0.000 | 0.000 | 0.005 | 0.003 | 0.002 | 0.000 | 0.195 | |||
| MPPS | 0.065 | 0.158 | -0.030 | 0.025 | 0.010 | 0.072 | 0.207 | -0.036 | 0.426 | 1.000 |
| 0.082 | 0.004 | 0.049 | 0.087 | 0.014 | 0.038 | 0.023 | 0.099 | 0.000 |
Investment in fixed assets (IFA) Investment in intangible assets (INTA) Financial leverage (F.L.) Working Capital Ratio (W.C.) Economic Policy Uncertainty (EPU) Firm Age (AGE) Firm Size (Log of Total Assets) Cashflow from Operations (CFO) Tobin Q Ratio (TobinQ) Market Price Per Share (MPPS).
Table 3.
Linear Regression when the dependent variable is Tobin's Q.
| VARIABLES | OLS | RE | FE | GMM |
| Tobin’s Q = L, | 0.494*** | |||
| (0.0123) | ||||
| IntA | 0.0493* | 0.0493* | 0.00584** | 0.0252*** |
| (0.0284) | (0.0284) | (0.0392) | (0.0193) | |
| IFA | 0.0931*** | 0.0931*** | -0.508*** | -1.146*** |
| (0.120) | (0.120) | (0.427) | (0.209) | |
| FL | 0.00940*** | 0.00940 | 0.00474*** | -0.0502*** |
| (0.00652) | (0.00652) | (0.00697) | (0.000675) | |
| WC | 0.00705 | 0.00705 | 0.00502*** | -0.00189*** |
| (0.00704) | (0.00704) | (0.00753) | (0.00130) | |
| EPU | -0.0151*** | -0.0151*** | -0.0168*** | 0.00911*** |
| (0.00378) | (0.00378) | (0.0242) | (0.00282) | |
| Age | 0.0107*** | 0.0107*** | 0.0234*** | -0.329*** |
| (0.0136) | (0.0136) | (0.403) | (0.0536) | |
| Size | 0.0382*** | 0.0382*** | -0.0230*** | -0.148*** |
| (0.0587) | (0.0587) | (0.0704) | (0.0467) | |
| CFO | 0.0189*** | 0.0189*** | -0.0136*** | -0.0722*** |
| (0.147) | (0.147) | (0.148) | (0.0178) | |
| Constant | -0.0305*** | -0.0305*** | 10.55*** | |
| (1.485) | (1.485) | (11.97) | ||
| Diagnostic Tests | ||||
| B&P LM test | 20.19*** | |||
| Hausman test | 9.86*** | |||
| Heteroscedasticity | 76570.34*** | |||
| Autocorrelation | 46.056*** | |||
| VIF | 2.78 | |||
| Sargan Test PValue | 4.56(0.601) | |||
| Hansen test (PValue) | 7.51 (0.353) | |||
| AR1 | -0.67(0.504) | |||
| AR2 | -0.37(0.715) |
Table 4.
Nonlinear Regression dependent variable is Tobin's Q.
| Models | 1 | 2 | 3 | 4 |
| Variables | OLS | RE | FE | GMM |
| Tobin’s Q = L, | 0.248*** | |||
| (0.140) | ||||
| IntA | 0.0915*** | 0.0915*** | 0.0388*** | 0.0866*** |
| (0.0855) | (0.0855) | (0.0911) | (0.155) | |
| IFA | 0.117*** | 0.117*** | 0.459*** | 1.818*** |
| (0.242) | (0.242) | (0.626) | (0.603) | |
| FL | 0.145*** | 0.145*** | 0.110*** | 0.192*** |
| (0.0358) | (0.0358) | (0.0403) | (0.0551) | |
| WC | 0.0183*** | 0.0183*** | 0.0247*** | 0.0329*** |
| (0.0234) | (0.0234) | (0.0242) | (0.0339) | |
| EPU | -0.00184*** | -0.00184*** | 0.0270*** | 0.0762*** |
| (0.0280) | (0.0280) | (0.0389) | (0.0493) | |
| Age | 0.00287*** | 0.00287*** | -0.122*** | -0.0303*** |
| (0.0107) | (0.0107) | (0.393) | (0.0401) | |
| Size | 0.0306*** | 0.0306*** | 0.00923*** | 0.00827*** |
| (0.0582) | (0.0582) | (0.0693) | (0.105) | |
| CFO | 0.0156*** | 0.0156*** | 0.0274*** | 0.115*** |
| (0.144) | (0.144) | (0.145) | (0.178) | |
| EPU*IFA | -0.000161*** | -0.000161*** | -0.00174*** | -0.00470*** |
| (0.00193) | (0.00193) | (0.00210) | (0.00344) | |
| EPU*INTA | -0.000444*** | -0.000444*** | 5.81e-05*** | 0.000724*** |
| (0.000878) | (0.000878) | (0.000915) | (0.00155) | |
| EPU*FL | -0.00112*** | -0.00112*** | -0.000884*** | -0.00176*** |
| (0.000301) | (0.000301) | (0.000333) | (0.000449) | |
| EPU*WC | -8.84e-05*** | -8.84e-05*** | -0.000182*** | -0.000227*** |
| (0.000260) | (0.000260) | (0.000266) | (0.000351) | |
| Constant | -1.262*** | -1.262*** | -2.729*** | |
| (3.203) | (3.203) | (13.60) | ||
| Diagnostic Tests | ||||
| B&P LM test | 12.15*** | |||
| Hausman test | 11.20*** | |||
| Heteroscedasticity | 1.3e+05*** | |||
| Autocorrelation | 30.148*** | |||
| Sargan Test (P value) | 0.03()0.983 | |||
| Hansen test (P value) | 0.79(.672) | |||
| AR1 | -0.37(0.714) | |||
| AR2 | 1.01(0.314) |
Standard errors in parentheses *** p<0.01, ** p<0.05, * p<0.1, Investment in fixed assets (IFA) Investment in intangible assets (INTA) Financial leverage (F.L.) Working Capital Ratio (W.C.) Economic Policy Uncertainty (EPU) Firm Age (AGE) Firm Size (Log of Total Assets) Cashflow from Operations (CFO) Tobin Q Ratio (Tobin's Q) Market Price Per Share (MPPS).
Table 5.
Linear Regression Dependent variable is Market Price per Share.
| Model | 1 | 2 | 3 | 4 |
| VARIABLES | OLS | RE | FE | GMM |
| MPPS = L, | 0.246*** | |||
| (0.00145) | ||||
| IntA | -3.119** | -3.119*** | -1.579*** | 3.843*** |
| (2.822) | (2.822) | (3.362) | (0.405) | |
| IFA | 28.26** | 28.26** | 57.83*** | -2.876*** |
| (20.19) | (20.19) | (36.58) | (4.251) | |
| FL | -0.265*** | -0.265*** | -0.286*** | -0.00974*** |
| (0.584) | (0.584) | (0.597) | (0.0298) | |
| WC | -0.778** | -0.778** | -0.835** | -0.150* |
| (0.632) | (0.632) | (0.646) | (0.0905) | |
| EPU | 0.000130 | 0.000130*** | -0.497*** | 2.368*** |
| (0.386) | (0.386) | (2.072) | (0.276) | |
| Age | -0.0517** | -0.0517** | 9.087** | -47.48*** |
| (3.640) | (3.640) | (34.57) | (5.458) | |
| Size | 3.368*** | 3.368*** | 5.242** | 0.502*** |
| (5.354) | (5.354) | (6.031) | (0.581) | |
| CFO | 0.0338* | 0.0338** | 1.440** | -2.914** |
| (12.46) | (12.46) | (12.71) | (1.316) | |
| Constant | -371.9** | -371.9*** | -1,109*** | |
| (319.7) | (319.7) | (1,026) | ||
| Diagnostic Tests | ||||
| B&P LM test | 210.05*** | |||
| Hausman test | 1.51*** | |||
| Heteroscedasticity | 3.4e+06*** | |||
| Autocorrelation | 10147.20*** | |||
| VIF | 2.08 | |||
| Sargan Test (P-value) | 0.96(0.61) | |||
| Hansen test (PValue) | 9.22(0.161) | |||
| AR1 | -0.14(0.886) | |||
| AR2 | -1.11(0.0265) |
Standard errors in parentheses *** p<0.01, ** p<0.05, * p<0.1, Investment in fixed assets (IFA) Investment in intangible assets (INTA) Financial leverage (F.L.) Working Capital Ratio (W.C.) Economic Policy Uncertainty (EPU) Firm Age (AGE) Firm Size (Log of Total Assets) Cashflow from Operations (CFO) Tobin Q Ratio (Tobin's Q) Market Price Per Share (MPPS).
Table 6.
Nonlinear Regression Dependent variable is Market Price per Share.
| VARIABLES | OLS | RE | DE | GMM |
| MPPS = L, | 0.998*** | |||
| (0.0896) | ||||
| IntA | -1.840*** | -1.840*** | -6.158*** | 29.23** |
| (9.233) | (9.233) | (8.147) | (12.02) | |
| IFA | 20.81*** | 20.81*** | 88.11*** | -54.52* |
| (29.24) | (29.24) | (56.05) | (67.31) | |
| FL | -1.837*** | -1.837*** | -1.080*** | -1.348*** |
| (4.031) | (4.031) | (3.603) | (4.959) | |
| WC | -2.609*** | -2.609*** | -2.127*** | 0.731** |
| (2.461) | (2.461) | (2.163) | (2.924) | |
| EPU | 0.143*** | 0.143*** | 2.132*** | -4.745* |
| (2.964) | (2.964) | (3.479) | (4.261) | |
| Age | 0.387*** | 0.387*** | 11.59*** | 15.58*** |
| (2.298) | (2.298) | (35.15) | (11.91) | |
| Size | 3.774*** | 3.774*** | 3.978*** | 4.975** |
| (6.428) | (6.428) | (6.197) | (8.840) | |
| CFO | 0.0278*** | 0.0278*** | 3.049*** | -7.098** |
| (15.00) | (15.00) | (12.94) | (14.95) | |
| EPU*IFA | -0.0205*** | -0.0205*** | -0.206*** | 0.275** |
| (0.205) | (0.205) | (0.188) | (0.286) | |
| EPU*INTA | -0.0190*** | -0.0190*** | 0.0474*** | -0.0572** |
| (0.0948) | (0.0948) | (0.0819) | (0.122) | |
| EPU*FL | 0.0131*** | 0.0131*** | 0.00733*** | 0.00907** |
| (0.0334) | (0.0334) | (0.0298) | (0.0422) | |
| EPU*WC | 0.0219*** | 0.0219*** | 0.0158*** | -0.0111*** |
| (0.0272) | (0.0272) | (0.0238) | (0.0306) | |
| Constant | -253.3*** | -253.3*** | -1,585*** | |
| (403.8) | (403.8) | (1,217) | ||
| Diagnostic Tests | ||||
| B&P LM test | 157.61*** | |||
| Hausman test | -1.37 *** | |||
| Heteroscedasticity | 1.6e+06*** | |||
| Autocorrelation | 962.44*** | |||
| Sargan Test (PValue) | 0.10(0.952) | |||
| Hansen test (PValue) | 1.07(0.585) | |||
| AR1 | -0.35(0.723) | |||
| AR2 | -0.05(0.959) |
Standard errors in parentheses *** p<0.01, ** p<0.05, * p<0.1, Investment in fixed assets (IFA) Investment in intangible assets (INTA) Financial leverage (F.L.) Working Capital Ratio (W.C.) Economic Policy Uncertainty (EPU) Firm Age (AGE) Firm Size (Log of Total Assets) Cashflow from Operations (CFO) Tobin Q Ratio (Tobin's Q) Market Price Per Share (MPPS)
Disclaimer/Publisher’s Note: The statements, opinions and data contained in all publications are solely those of the individual author(s) and contributor(s) and not of MDPI and/or the editor(s). MDPI and/or the editor(s) disclaim responsibility for any injury to people or property resulting from any ideas, methods, instructions or products referred to in the content. |
© 2023 by the authors. Licensee MDPI, Basel, Switzerland. This article is an open access article distributed under the terms and conditions of the Creative Commons Attribution (CC BY) license (http://creativecommons.org/licenses/by/4.0/).
Copyright: This open access article is published under a Creative Commons CC BY 4.0 license, which permit the free download, distribution, and reuse, provided that the author and preprint are cited in any reuse.


