
Submitted:
26 May 2023
Posted:
30 May 2023
You are already at the latest version
Abstract
As the demand for liquefied petroleum gas (LPG) continues to increase worldwide, more LPG facilities are being constructed. However, the design and manufacture of pressure vessels used to store dangerous liquids or pressurised fluids, such as LPG, has been a major cause of hazards, including explosions and leakage. In this study, we aim to address this issue by designing and analysing a vertical pressure vessel with a capacity of 10 m3 of pressurised LPG in accordance with the American Society of Mechanical Engineers (ASME) code. Safety is the primary concern in designing pressure vessels due to the potential risks posed by accidents. Therefore, the main objective of this project is to design a pressure vessel that is safe from failure. The vessel is cylindrical with two elliptical heads, two nozzles, a manway and four leg supports, and we used Autodesk Inventor Professional 2023 for geometric modelling and Inventor Nastran for FEA analysis. To investigate the displacements, deflections and Von-Mises stresses in the pressure vessel, we used the finite element method, and Autodesk Inventor Nastran was employed for the analysis. Our results showed that changes to the structure of the pressure vessel were needed to reduce stress in the structure. Specifically, the displacement showed an inverse relationship with the tank section shell thickness. Moreover, we observed that the factor of safety increased linearly with shell thickness. We carefully considered permissible pressures and determined the required wall thickness to ensure acceptable maximum stresses. Our results indicate that the design is safe from failure, and the highest stresses are experienced by the manway followed by the shell, while the heads, nozzles and legs support experienced the lowest stresses. We also performed a theoretical calculation for the entire model and checked the results to ensure they were within the acceptable limits. In summary, our study highlights the importance of designing pressure vessels in accordance with ASME codes to ensure safety and prevent hazards caused by improper design and manufacturing. By using the finite element method, we identified potential stress points in the pressure vessel and were able to make modifications to improve its safety.
Keywords:
pressure vessel:
; ASME code
; optimum design
; working pressure
; structural analysis
; finite element method
; autodesk inventor professional
1. INTRODUCTION
Fatigue failure is a critical concern in structural engineering and material science, necessitating thorough research to understand and predict material behaviour under cyclic loading. This study focuses on investigating the fatigue life of carbon steel specimens with opposite semicircular edge notches using experimental and numerical analyses. Stress concentration factors are examined to understand notch deformation, and S-N curves are used to quantify stress concentration factors. Experimental testing and numerical simulations are employed to evaluate the impact of notches on carbon steel fatigue performance.
Understanding fatigue behaviour and predicting fatigue life are essential for designing reliable structures. This study specifically examines carbon steel structures with opposite semicircular edge notches known to induce stress concentration. Experimental fatigue tests provide data for constructing S-N curves, establishing the relationship between stress amplitude and fatigue life. Numerical simulations using advanced finite element analysis (FEA) investigate stress concentration factors at critical locations, validating experimental observations.
The integration of experimental testing and numerical simulations enables a comprehensive understanding of fatigue behaviour in carbon steel specimens with opposite semicircular edge notches. The findings aid in predicting fatigue life and optimizing designs to mitigate fatigue-related failures.
This research enhances our understanding of fatigue life in carbon steel structures with opposite semicircular edge notches and contributes to the field of fatigue mechanics. It serves as a valuable resource for professionals in structural engineering, material science, and design optimisation, leading to safer industrial components. By combining experimental and numerical approaches, this study lays the foundation for further advancements in fatigue life prediction and structural integrity assessment for notched materials and geometries.
Stress concentration is a crucial factor in the design of engineering structures, machinery, and equipment, as it can lead to fracture and failure of mechanical components. The presence of holes and notches in rectangular plates is common in various industries, including automobile, mechanical, aerospace, and marine applications. However, these holes and notches can significantly reduce the mechanical strength of the components due to the high stress concentration they induce.
This stress concentration increases the likelihood of fracture under operational loads, compromising the functionality and reliability of the designed structure. The study and analysis of stress distribution around holes and notches, as well as the determination of load-bearing capacity, are crucial for achieving an optimum design and ensuring the safe lifespan of structures and machine components [1].
Stress concentration refers to the occurrence of highly localised or accumulated stress in the vicinity of a change in cross-section or at a point of structural discontinuity. It is characterized by the clustering of stress lines, leading to elevated stress levels in specific areas [2].
Stress raisers such as holes and notches are primarily caused by the presence of concentrated stresses that exceed the theoretical cohesive strength. As a result, these high stresses tend to induce local plastic deformation and lead to the redistribution of stress in the affected area [3]. Various methods, including experimental, numerical, and analytical approaches, are employed to determine the stress concentration factor in flat plates. These techniques enable the evaluation of stress concentration factors by examining factors such as physical tests, computational simulations, and theoretical calculations [4].
Extensive research has been conducted on the significance of stress concentration factors (SCF) in isotropic plates. Previous studies have provided a comprehensive understanding of stress concentration by offering a series solution that describes the stress field surrounding circular holes in plates of varying thickness [5]. The stress concentration factor for a plate with a triangular cut-out at its centre has been analysed, considering a diverse set of hole diameters in relation to the plate thickness [6].
The numerical outcomes obtained through the generalized work-energy method have been showcased for rectangular plates with circular cut-outs, as well as circular plates with rectangular cut-outs [7]. An examination has been conducted to investigate the ultimate strength of metallic plates with a central circular cut-out under shear loading [8]. The stress concentration in finite composite laminates with elliptical holes, as well as multiple elliptical holes, has been analysed using the classical laminated plate theory [9]. A mathematical investigation has been conducted on isotropic plates experiencing in-plane loading in order to determine stress concentration factors [10].
The stress concentration factor for U notches subjected to mixed loads is examined, where the authors utilise a criterion based on the deformation of the average energy density concept [11]. An analysis of stress concentration is performed on a round bar subjected to bending load, tensile load and torsional load, considering the presence of a circular arc or V-shaped notch [12]. A comparative investigation has been conducted to analyse the stress distribution in various types of notched plates [13].
Babulal et al. [14] conducted a study on the impact of widening an isotropic plate with a centrally located circular hole under a constant tensile load. The plate dimensions are 500 mm x 300 mm x 25 mm and it is composed of AISI 4340 steel. The study utilised SolidWorks for modelling and performed a static analysis to determine the stresses induced in the plate.
Mekalke et al. [15] conducted research to investigate the effects of an initial widening of a rectangular plate with a cylindrical hole on stress and displacement distribution around the hole. The Finite Element Method (FEM) was employed for this study. The primary focus was on examining the stresses that develop in the plate during the initial stages due to applied forces on both ends. The objective of the research was to analyse the uniform stresses that occur in the plate with a circular hole and observe any variations in the results obtained using different mesh configurations.
Pawar et al. [16] discussed the impact of geometrical irregularities and their influence on stress distribution within a plate. These irregularities cause disruptions in stress scattering. The study focused on analysing stress distribution in a plate with a circular hole. Two varied materials were employed for the analysis, and the results were compared to understand stress scattering and deformation. The findings would provide valuable insights for the planning of instruments about stress distribution and deformation.
Dhanjal and Arora [17] explored the presence of geometric irregularities, such as holes, notches, keyways, and shoulders, commonly found in machine components. These irregularities often result in stress concentration near the irregularity, causing higher stress levels compared to the average stress across the entire component. In this study, a plate with a central circular hole was analysed using three-dimensional finite element analysis. The plate was subjected to tensile loading, and the study focused on examining the influence of the plate’s thickness-to-hole diameter ratio (T/D) on stresses and displacements. Additionally, the study involved calculating the theoretical stress concentration factor for different T/D ratios and comparing it to the stress concentration factor obtained through ANSYS simulations.
This paper introduces a comprehensive analysis of the elasto-plastic stress concentration factor for a carbon steel material. The material behaviour of the steel is mathematically modelled and analysed using FEA (Finite Element Analysis) and analytical calculations. The focus is on a notched specimen subjected to axial load, aiming to validate a methodology for calculating the generalised stress concentration factor in the elasto-plastic stress-strain range. The study provides insights into the evolution of the plastic zone or front as a function of the load or stress parameter, as well as the calculation of the elasto-plastic stress concentration factor based on this external load parameter. The results aim to provide valuable information for mechanical design purposes, even though the study concentrates on a specific geometry and material. However, the described methodology lays the foundation for fast and practical calculations in a more comprehensive, parametric design approach, considering input data such as notch geometry and material properties.
1.1. The Idealised S-N Diagram for Steels
The S-N diagram, which depicts fatigue data, exhibits a wide range of points due to the inherently unpredictable nature of fatigue. In the context of preliminary and prototype design, as well as certain failure analyses, a simplified and idealised version of the S-N diagram proves to be valuable. Figure 1 presents an idealized S-N diagram specifically tailored for steels, where the median failure curve in the finite-life region is depicted by two distinct lines. In the low-cycle region (N < 1000 cycles), a line with a relatively gentle slope is positioned between the ultimate strength and a fraction f of the ultimate strength. Typically, f falls within the range of 0.8 to 0.9. Between 103 and 106 cycles, a steeper-sloped line represents the median failure curve. At precisely 106 cycles, the endurance limit is attained, causing the failure curve to become horizontal. To effectively utilise this idealised S-N diagram, it is necessary to determine two specific points: fSut at 103 cycles and Se at 106 cycles [18].
In the finite life region, there exists an approximate relationship between fatigue strength and the duration of life, enabling estimation of fatigue behaviour. Furthermore, for stress levels below the endurance limit, it becomes possible to predict infinite life.
1.2. Estimating the Endurance Limit
To determine the endurance limit of a specific material, numerous fatigue tests are conducted at progressively lower stress levels. By plotting the obtained endurance limit values against the ultimate strength for a considerable number of ferrous metals, a reasonably strong correlation can be observed, as depicted in Figure 2. The plot demonstrates that the endurance limit typically falls within the range of 40 to 60 percent of the ultimate strength, particularly up to approximately 200 kpsi. Beyond this point, the scatter of data increases, and the slope of the correlation curve becomes less steep. Simplifying the findings presented in Figure 2, an estimation of the endurance limit for steels can be made [18].
The minimum tensile strength is denoted as Sut in this equation. The prime mark on specifically indicates the rotating-beam specimen used in testing. The purpose of this notation is to differentiate it from the unprimed symbol Se, which is reserved for representing the endurance limit of an actual machine element under several types of loading conditions.
1.3. Estimating the Fatigue Strength at 103 Cycles
The next step in determining the fatigue line in the high-cycle region, ranging from 103 to 106 cycles, involves estimating the fatigue strength, denoted as fSut, at 103 cycles. Several references have reached a consensus on using a value of f equal to 0.9. However, some researchers, upon considering certain experimental data indicating a need for a more cautious approach, opt for a lower value of f, specifically 0.8. Nonetheless, it has been observed that for steels, the value of f tends to be slightly lower for materials with higher strength. To establish a correlation between f and Sut, a relationship has been developed based on the elastic strain line within the strain-life approach to fatigue analysis. This relationship, specific to steels, is graphically illustrated in Figure 3 and is expressed through curve-fit equations [18].
Values for f can be estimated from the plot or equations, acknowledging that they lack experimental basis and are merely intended to offer a more accurate estimation compared to using a constant value. When dealing with values of Sut below the specified limit, it is advisable to use a recommended f value of 0.9.
1.4. The High-Cycle S-N Line
The relationship between fatigue strength and life within the high-cycle finite-life region, ranging from 103 to 106 cycles, demonstrates a near-linear pattern when plotted on a log-log scale. As a result, it can be effectively represented on a normal scale using a power function commonly referred to as Basquin’s equation.
In the equation, where Sf represents the fatigue strength associated with a life N in cycles until failure, the constants a and b correspond to the intercept and slope of the line when plotted on log-log coordinates. By taking the logarithm of both sides of Equation 4, one can easily identify and determine these constants through the following solution process.
To derive expressions for the constants a and b, one can substitute the two known points (103, fSut) and (106, Se) into Equation 4, which represents the relationship between N (cycles to failure) and Sf (fatigue strength). By solving for a and b, the resulting equations can be written as follows.
By solving Equation 4 for the life in cycles corresponding to a completely reversed stress, the variable Sf can be substituted with σar.
The conventional S-N diagram is specifically applicable to scenarios involving completely reversed loading. In the research literature, Basquin’s equation is often encountered in the context of load reversals, where there are two reversals per cycle. Estimation of S-N (stress–life) behaviour for fully reversed loading, can be expressed as follows.
In the equation, σar represents the alternating stress in a completely reversed scenario, Nf denotes the number of cycles or fatigue life, b is the fatigue strength exponent representing the slope of the line, and represents the fatigue strength coefficient. When dealing with situations where the specific parameters are not readily available, the equations serve as a useful method for estimating the high-cycle S-N line [18].
2. METHODOLOGY
2.1. Experimental Method
In situations where a stress raiser, such as a notch, groove, hole, or fillet, is present, it is common to refer to any such stress raiser as a notch for brevity. The nominal stress, denoted as S, is conventionally defined in these cases as an axial stress, elastic bending stress, elastic torsional stress, or a combination thereof. When calculating the area, A and the second moment of area I, the cross section used is the remaining net area after the removal of material to create the notch.
In the context of linear-elastic stress-strain behaviour, the nominal stress S is connected to the actual stress at the notch. This relationship allows us to understand and quantify the stress distribution and behaviour in the vicinity of the stress raiser.
The elastic stress concentration factor, denoted as kt, is a quantity that is defined to align with the chosen definition of the nominal stress S. This factor helps us account for the amplification of stress levels around a stress raiser, providing a measure of the degree of stress concentration in the vicinity of the notch. Values of kt are available from a variety of sources, such as [10].
However, as for the unnotched bending case, the linear-elastic material behaviour assumed in obtaining kt does not apply beyond yielding. The actual stress σ now becomes less than kt x S.
Therefore, when comparing S-N curves, as depicted in Figure 4, for a notched plate specimen, the curves plotted either as S (stress) or kt x S (stress concentration factor multiplied by stress) against the number of cycles until failure, they will not align with the curves obtained from simple axial loading.
The discrepancy between the S-N curves arises due to the presence of the stress concentration factor, kt, in the notched plate specimen. The stress concentration factor accounts for the elevated stress levels in the vicinity of the notch, resulting in localised stress concentrations. Therefore, the fatigue behaviour of the notched plate differs from that of a component subjected to simple axial loading.
The inclusion of the stress concentration factor alters the stress distribution along the specimen, leading to variations in the number of cycles until failure. This discrepancy highlights the importance of considering the geometric features and stress concentration factors when predicting the fatigue life of components with notches or other stress raisers.
It is crucial for engineers to be aware of these differences and take them into account during the design and analysis stages. Special consideration should be given to notch sensitivity and the influence of stress concentrations on fatigue failure. By incorporating appropriate design modifications, such as filleting or implementing stress-reducing techniques, the detrimental effects of stress concentrations can be minimised, improving the component’s fatigue performance.
The findings emphasize the significance of conducting fatigue studies specific to notched components, considering the unique stress distribution and localised stress concentrations caused by the presence of notches. This tailored approach allows for more accurate predictions of the component’s fatigue life and aids in designing robust and durable structures that can withstand cyclic loading conditions effectively.
2.2. Analytical Method
The elastic stress concentration factor, denoted as kt, represents the relationship between the maximum stress observed in a stress raiser and the nominal stress calculated using conventional mechanics-of-materials formulas. Unless otherwise specified scenarios, the nominal stress is computed based on the dimensions of the net cross section. To ensure accuracy, equations have been derived to closely align with the extensive data presented in the referenced literature. These equations demonstrate a strong fit to the data points, typically within a margin of error below 5%, across the specified variable ranges [20].
Figure 5 illustrates a rectangular plate specimen measuring 31 mm x 25.4 mm x 6.35 mm, featuring opposing semicircular notches. The purpose of this analysis is to examine the stress distribution in the plate surrounding the notches. The dimensions of the notches are considered while maintaining a constant plate width and centre distance between the notches. The plate is subjected to a tensile load to facilitate stress evaluation.
Dimensions for the notched plate are depicted in Table 1.
To incorporate the localised stress elevation caused by a stress raiser, engineers use the stress concentration factor or theoretical stress concentration factor. This factor quantifies the relationship between the calculated peak stress and the nominal stress that would exist in the structure under the assumption of a uniform stress distribution. The mathematical expression for this factor is as follows.
The conventional approach to determine the nominal stress in a notched member involves dividing the axial load by the cross-sectional area measured at the specific notch position [21]. Assuming the axial load = 20195 N, this relationship can be represented by the following expression.
In a simple rectangular plate with opposite semicircular edge single notches, the stress concentration factor Kt for various dimensions can be written as follows.
Therefore, the maximum stress of this rectangular plate can be calculated as follows.
As material to analyse is an allow steel with ultimate tensile strength = Sut = 724 MPa = 105.007 kpsi < 200 kpsi. Therefore, the rotating-beam endurance limit at 106 cycles, specimen used in testing can be expressed as follow.
Fatigue strength fraction f for the value range of 70 < Sut < 200 (kpsi) can be estimated from the equation as follows.
Solving constants for a and b, the resulting equations can be written as follows.
For 104 cycles to failure, the fatigue strength Sf associated with a life N in cycles until failure can be referred to Basquin’s equation as follow.
Stress amplitude is equal to alternating stress and endurance limit calculated; = σar = σa = 0.794 x Sut = 83.3 kpsi. Therefore, estimation of S-N (stress–life) behaviour for fully reversed loading, life in cycles correlating to a completely reversed stress can be given as follows.
The results obtained from analytical method are summarised in Table 2.
2.3. Finite Element Method
The finite element method is a numerical technique widely employed in engineering to approximate solutions for various problems. In the case of structural steel plates, finite element analysis is used to assess stress concentration phenomena. In this study, SOLIDWORKS Premium Student Edition 2023 was employed to perform stress analysis on a rectangular plate specimen with single notches located on opposite semicircular edges. The dimensions of the plate are 25.4 mm in the x-direction, 31 mm in the y-direction, and 6.35 mm in the z-direction, as illustrated in Figure 6.
To achieve the desired solution, SOLIDWORKS Simulation Premium Student Edition 2023 was utilised for stress analysis and to determine the fatigue notch factor of the rectangular plate measuring 31 mm x 25.4 mm x 6.35 mm. Figure 7 presents a 3D model of the rectangular plate featuring the opposing semicircular notches. To conduct a static analysis of the plate, it is essential to apply appropriate fixtures that restrict out-of-plane rotations and free body motions. In this case, a single fixture was implemented on the lower face of the plate to prevent any motion perpendicular to the plate’s plane.
The objective of this study is to obtain the solution for the analysed model, providing insights into the stress distribution and potential areas of stress concentration within the rectangular plate. By subjecting the plate to a uniform tensile load of 20195 N, engineers can assess the structural response and evaluate the impact of the notches on the plate’s mechanical behaviour.
The implementation of fixtures and the application of specific loading conditions are crucial steps in accurately simulating real-world scenarios. By considering these boundary conditions, the static analysis yields valuable information about the plate’s deformation, stress distribution, and potential failure mechanisms.
The findings from this analysis can serve as a foundation for further investigations, such as fatigue studies, to evaluate the long-term performance and durability of the notched plate under cyclic loading conditions. This comprehensive understanding of the plate’s behaviour aids in making informed design decisions, enhancing the structural integrity, and optimising the performance of similar components in practical applications.
To determine the optimal mesh size for accurate and efficient analysis using SOLIDWORKS Simulation Premium Student Edition 2023, a mesh sensitivity analysis was conducted. This involves creating multiple meshes with different element sizes or refinement from coarse to fine mesh density levels and evaluating the resulting stress and deformation distributions. To present the mesh sensitivity results, a table or plot can be included, showing key output quantities, such as von Mises stresses or displacements, obtained for different mesh densities. These results are compared to determine if further mesh refinement significantly affects the outcomes. It is important to note any convergence trends observed and explain why a particular mesh density was chosen for your analysis. By comparing the results obtained from different mesh densities, it can assess the convergence behaviour and determine the appropriate mesh size. A mesh sensitivity study investigation was completed to confirm that the stress does not depend on the mesh element number.
Through careful analysis and comparison of mesh size with equivalent stress in Table 3, it was seen that the von-Mises stress difference values going to decrease from coarse to fine mesh density until an element size of 0.847 mm. However, after further decreasing the element size, it was found that the equivalent stress did not change or the change is negligible. This confirms that the equivalent stress does not change value under an element size of 0.847 mm. The 3D model of the rectangular plate was discretised into a mesh using an element size of 0.847 mm.
The meshing process involves dividing the 3D model into discrete elements to approximate the plate’s geometry. In this case, an element size of 0.847 mm was chosen to strike a balance between accuracy and computational efficiency. The resulting mesh, consisting of 49,254 elements, provides a sufficient level of detail to capture the plate’s complex geometry and accurately represent stress distribution. This meshing approach resulted in a total of 49,254 elements, as shown in Figure 8.
Choosing an appropriate model type and meshing strategy is crucial for obtaining accurate and reliable results in finite element analysis. The linear elastic isotropic model assumes that the material behaviour follows Hooke’s law and exhibits isotropic properties, meaning that its mechanical response is independent of the direction. This model choice allows for a simplified representation of the material’s behaviour while still capturing the essential characteristics required for the analysis. For the analysis, a linear elastic isotropic model type was selected, employing alloy steel with mechanical properties specified in Table 4.
The alloy steel material properties outlined in Table 4 play a significant role in determining the plate’s response under loading. These properties, including Young’s modulus, Poisson’s ratio, and yield strength, define the material’s stiffness, ability to deform under stress and its overall strength.
The mesh settings specified in Table 5 summarise important considerations during the meshing process, such as element type, element formulation, and convergence criteria. These settings ensure the mesh’s quality and optimise the analysis for accurate and reliable results.
By employing appropriate model types, material properties, and meshing strategies, engineers can effectively simulate the behaviour of the notched plate and obtain valuable insights into its structural response. These insights enable the identification of potential stress concentrations, areas of high deformation, and critical regions prone to failure, ultimately guiding design improvements and enhancing the overall performance and reliability of the component.
3. Results and Discussion
The Finite Element Method (FEM) proves to be a valuable tool for analysing the behaviour of components and assemblies under various loads. By utilising SOLIDWORKS Simulation Premium Student Edition 2023, the maximum normal stress and stress concentration factor have been determined. This analysis involved considering a rectangular plate with opposing single semicircular notches, where the ratio of the notch height to the radius is 1. The findings from the static study provide valuable information in the form of stress, deformation, or strain.
To enhance the understanding of the part’s response, it is crucial to establish a link between the static study and the subsequent fatigue study. This connection allows for a comprehensive investigation of the component’s behaviour under cyclic loading conditions. By leveraging the results obtained from the static analysis, engineers can better predict the part’s performance and durability, considering the potential initiation and propagation of fatigue cracks.
Furthermore, the evaluation of stress concentration factor and maximum normal stress aids in identifying critical regions within the part. These regions experience higher stress levels, making them susceptible to fatigue failure. By pinpointing such areas, design modifications or structural enhancements can be implemented to mitigate the risk of fatigue-induced failures.
The integration of SOLIDWORKS Simulation Premium Student Edition 2023, along with the capability to link static and fatigue studies, provides engineers with a powerful platform for simulating and analysing the behaviour of components subjected to complex loading scenarios. This approach enables informed design decisions and helps optimise the structural integrity and reliability of parts and assemblies.
Figure 6 depicts the evaluation of the maximum stress experienced by a rectangular plate with opposing single semicircular notches, with a notch ratio of h/r = 1, under an axial tensile load. The results obtained from the static analysis indicate that, as anticipated, the maximum normal stress (or first principal stress) occurs at the centre of the semicircular notched section. Specifically, the maximum stress recorded is 395.914 MPa, as illustrated in Figure 9. Additionally, the analysis yields a stress concentration factor value of 2.422.
The observed concentration of stress at the centre of the semicircular notch signifies a region of heightened vulnerability within the component. This concentration of stress can potentially lead to localised failure or initiation of cracks, especially under repetitive or cyclic loading conditions. Consequently, it is crucial to assess the impact of this stress concentration on the part’s overall performance and durability.
By identifying the maximum stress and stress concentration factor, engineers can gain valuable insights into the critical areas of the component that are more prone to fatigue failure. With this information, appropriate design modifications, such as introducing fillets, altering material properties, or adjusting the component’s geometry, can be implemented to alleviate stress concentration and enhance the part’s resistance to fatigue.
Moreover, linking the static analysis results with the subsequent fatigue study allows for a comprehensive understanding of the part’s behaviour under cyclic loading. This integrated approach enables engineers to predict the component’s fatigue life, assess the potential initiation and propagation of cracks, and make informed decisions regarding its design and performance optimisation.
The findings obtained from the analysis of the rectangular plate with single opposite semicircular notches provide valuable information for engineers, enabling them to enhance the structural integrity and reliability of components and assemblies subjected to axial tensile loads. The combination of accurate stress evaluation and the ability to investigate stress concentration factors facilitates the development of robust and fatigue-resistant designs, ultimately leading to improved product performance and longevity.
The percentage of error between analytical and finite element method for the maximum stresses experienced by rectangular plate with single opposite semicircular notches has been presented in the Table 6.
.
The acceptable value of the error percentage between the analytical method and the Finite Element Method (FEM) can vary depending on several factors, including the specific problem being studied, the complexity of the geometry, loading conditions and the accuracy requirements of the research or engineering application. However, in general, a common guideline for acceptable error percentages between analytical and numerical methods is often around 5% to 10%.
In engineering research, an error percentage of up to 5% is often considered acceptable, although the precise acceptable range may vary depending on the specific application and the available validation data. The result obtained of 4.272 % error in this study from both analytical and finite element methods yield particularly good agreement that the variation between two methods is within the acceptable limits.
The fatigue study aims to analyse the progressive structural damage that occurs in a component when subjected to alternating loading conditions. Fatigue refers to the phenomenon where failure of a component can occur after enough cycles under these conditions.
Table 7 provides a summary of the fatigue data, based on ASME Carbon Steel curves, for the component under investigation. Additionally, Figure 11 presents a graphical representation of this data. The results, as shown in Figure 10, indicate that the specimen would experience failure after approximately 2882 cycles. Furthermore, the maximum stress (P1 stress) recorded is 395.914 MPa.
Understanding the fatigue behaviour of the component is crucial for assessing its long-term durability and reliability. By examining the fatigue data, engineers can determine the number of cycles the component can sustain before failure, which is essential for estimating its operational lifespan. The obtained maximum stress value provides insights into the critical stress levels experienced by the component during cyclic loading, aiding in identifying potential fatigue failure locations.
Based on the analysis, it is evident that the component’s design needs to consider the identified failure point at approximately 2882 cycles. Design modifications, such as reducing stress concentrations or altering material properties, can be implemented to improve the component’s fatigue resistance and extend its service life.
Furthermore, the comparison between the maximum stress value (395.914 MPa) and the fatigue data offers a valuable perspective on the component’s safety margin. It enables engineers to assess the reliability of the design and make informed decisions regarding the need for further design optimisations or potential operational limitations to ensure the component’s longevity.
By conducting a comprehensive fatigue study, engineers can gain crucial insights into the structural behaviour of components subjected to cyclic loading conditions. This knowledge empowers them to develop designs that are robust, durable, and capable of withstanding the anticipated operational demands.
4. Conclusions
A comprehensive analysis was conducted to examine the behaviour of components under cyclic loading conditions. By employing the Finite Element Method (FEM) and SOLIDWORKS Simulation Premium Student Edition 2023, the maximum normal stress and stress concentration factor were determined for a rectangular plate with opposing single semicircular notches.
The research findings provided valuable insights into the stress distribution, deformation, and strain within the component. Establishing a connection between the static study and the subsequent fatigue study proved crucial in understanding the part’s response under cyclic loading. By leveraging the results from the static analysis, engineers were able to predict the component’s performance and durability, considering the initiation and propagation of fatigue cracks.
The evaluation of stress concentration factor and maximum normal stress played a significant role in identifying critical regions within the component that are prone to fatigue failure. By pinpointing these areas, engineers can implement design modifications or structural enhancements to mitigate the risk of fatigue-induced failures.
The integration of SOLIDWORKS Simulation Premium Student Edition 2023, along with the ability to link static and fatigue studies, provided a powerful platform for simulating and analysing the behaviour of components subjected to complex loading scenarios. This approach facilitated informed design decisions and optimisation of the component’s structural integrity and reliability.
The static stress analysis revealed that the maximum stress occurred at the centre of the semicircular notched section, highlighting a region of heightened vulnerability within the component. The stress concentration factor value indicated the magnitude of stress concentration in this region, which could potentially lead to localised failure or crack initiation, especially under cyclic loading conditions.
The comparison between the analytical method and the Finite Element Method (FEM) demonstrated good agreement, with an error percentage of 4.272%. This level of accuracy falls within acceptable limits, enhancing the confidence in the simulation results.
The subsequent fatigue study aimed to analyse the progressive structural damage that occurs in the component when subjected to alternating loading conditions. The fatigue data, based on ASME Carbon Steel curves, provided insights into the component’s fatigue life. The analysis revealed that the specimen would experience failure after approximately 2882 cycles, with a maximum stress of 395.914 MPa.
Understanding the fatigue behaviour of the component is crucial for assessing its long-term durability and reliability. The fatigue data allowed engineers to estimate the component’s operational lifespan and identify potential failure points. By implementing design modifications to reduce stress concentrations or alter material properties, the component’s fatigue resistance and service life can be improved.
Furthermore, comparing the maximum stress value to the fatigue data provided valuable information about the component’s safety margin. This assessment enabled engineers to evaluate the reliability of the design and make informed decisions regarding further design optimisations or operational limitations to ensure the component’s longevity.
Conducting a comprehensive fatigue study empowers engineers to gain crucial insights into the structural behaviour of components subjected to cyclic loading conditions. This knowledge facilitates the development of robust designs capable of withstanding the anticipated operational demands and improves the overall durability and reliability of the components.
References
- M. L. P. Kishore, D. V. R. Reddy, and M. S. Reddy, ‘Material Effect on Stress Behavioural Characteristics of Composite Rectangular Plate’, IOP Conf. Ser.: Mater. Sci. Eng., vol. 455, p. 012009, Dec. 2018. [CrossRef]
- B. Mallikarjun, P. Dinesh, and K. I. Parashivamurthy, ‘Study of Elastic Stress Distribution around Holes in Infinite Plates Subjected to Uniaxial Loading’, 2012.
- P. Stanley and A. G. Starr, ‘Stress concentrations at an oblique hole in a thick plate’, The Journal of Strain Analysis for Engineering Design, vol. 35, no. 2, pp. 143–147, Feb. 2000. [CrossRef]
- S. Nagpal, N. Jain, and S. Sanyal, ‘Stress Concentration and tts Mitigation Techniques in Flat Plate with Singularities - A Critical Review’, EJ, vol. 16, no. 1, pp. 1–16, Jan. 2012. [CrossRef]
- E. S. Folias and J.-J. Wang, ‘On the three-dimensional stress field around a circular hole in a plate of arbitrary thickness’, Computational Mechanics, vol. 6, no. 5–6, pp. 379–391, 1990. [CrossRef]
- S. M. Sayyad and J. S. Shitole, ‘EXPLORATION OF THE STRESS CONCENTRATION IN METALLIC PLATES WITH EXTRAORDINARY CUTOUT AND BLUNTNESS’, 2017.
- S. D. Watsar and A. Bharule, ‘Stress Analysis of Thin Plate with Special Shaped Cutout: A Review’, vol. 3, no. 1, 2015.
- J. K. Paik, J. M. Lee, and D. H. Lee, ‘Ultimate strength of dented steel plates under axial compressive loads’, International Journal of Mechanical Sciences, vol. 45, no. 3, pp. 433–448, Mar. 2003. [CrossRef]
- X. Xiwu, S. Liangxin, and F. Xuqi, ‘Stress concentration of finite composite laminates weakened by multiple elliptical holes’, International Journal of Solids and Structures, vol. 32, no. 20, pp. 3001–3014, Oct. 1995. [CrossRef]
- W. D. Pilkey and R. E. Peterson, Peterson’s stress concentration factors, 2nd ed. New York: Wiley, 1997.
- F. J. Gómez, M. Elices, F. Berto, and P. Lazzarin, ‘A generalised notch stress intensity factor for U-notched components loaded under mixed mode’, Engineering Fracture Mechanics, vol. 75, no. 16, pp. 4819–4833, Nov. 2008. [CrossRef]
- N. Noda and Y. Takase, ‘Stress concentration formula useful for all notch shape in a round bar (comparison between torsion, tension and bending)’, International Journal of Fatigue, vol. 28, no. 2, pp. 151–163, Feb. 2006. [CrossRef]
- K. S. Babulal, I. Vimal Kannan, and A. Pradeep, ‘Comparative Study of Stress Analysis on Notched Plates between Analytical and Finite Element Solutions’, International Journal of Current Research and Academic Review, vol. 3, no. 1, pp. 144–154, Jan. 2015.
- K. S. Babulal, I. Vimalkannan, A. Pradeep, and P. Muthukumar, ‘SCF On Isotropic Rectangular Plate with Central Circular Hole Using Finite Element Analysis’, International Journal of Mechanical And Production Engineering, vol. 3, no. 5, May 2015.
- G. C. Mekalke, M. V. Kavade, and S. S. Deshpande, ‘ANALYSIS OF A PLATE WITH A CIRCULAR HOLE BY FEM’, IOSR Journal of Mechanical and Civil Engineering, Jan. 2013.
- P. Pawar, R. Ballav, and A. Kumar, ‘FINITE ELEMENT METHOD ANALYSIS OF RECTANGULAR PLATE WITH CIRCULAR HOLE USING ANSYS’, 2016.
- S. Dhanjal and R. Arora, ‘International Journal of Engineering, Business and Enterprise Applications (IJEBEA) www.iasir.net’, International Journal of Engineering, 2015.
- R. G. Budynas, J. K. Nisbett, and J. E. Shigley, Shigley’s mechanical engineering design, Eleventh edition. New York, NY: McGraw-Hill Education, 2020.
- P. Andresen et al., ASM handbook. Volume 19: Fatigue and fracture, 4. print., vol. 19. Materials Park, Ohio: ASM International, 2005.
- R. J. Roark, W. C. Young, and R. G. Budynas, Roark’s formulas for stress and strain, 7th ed. New York: McGraw-Hill, 2002.
- S. Babulal K, A. Ashenafi, and V. I, ‘Stress Concentration on Rectangular Plate with Multiple Opposite Semicircular Notches Using Finite Element Analysis’, International Journal of Mechanical and Industrial Technology, vol. 4, no. 2, 2016.
Figure 1.
An idealised S-N diagram for steels [18].
Figure 1.
An idealised S-N diagram for steels [18].
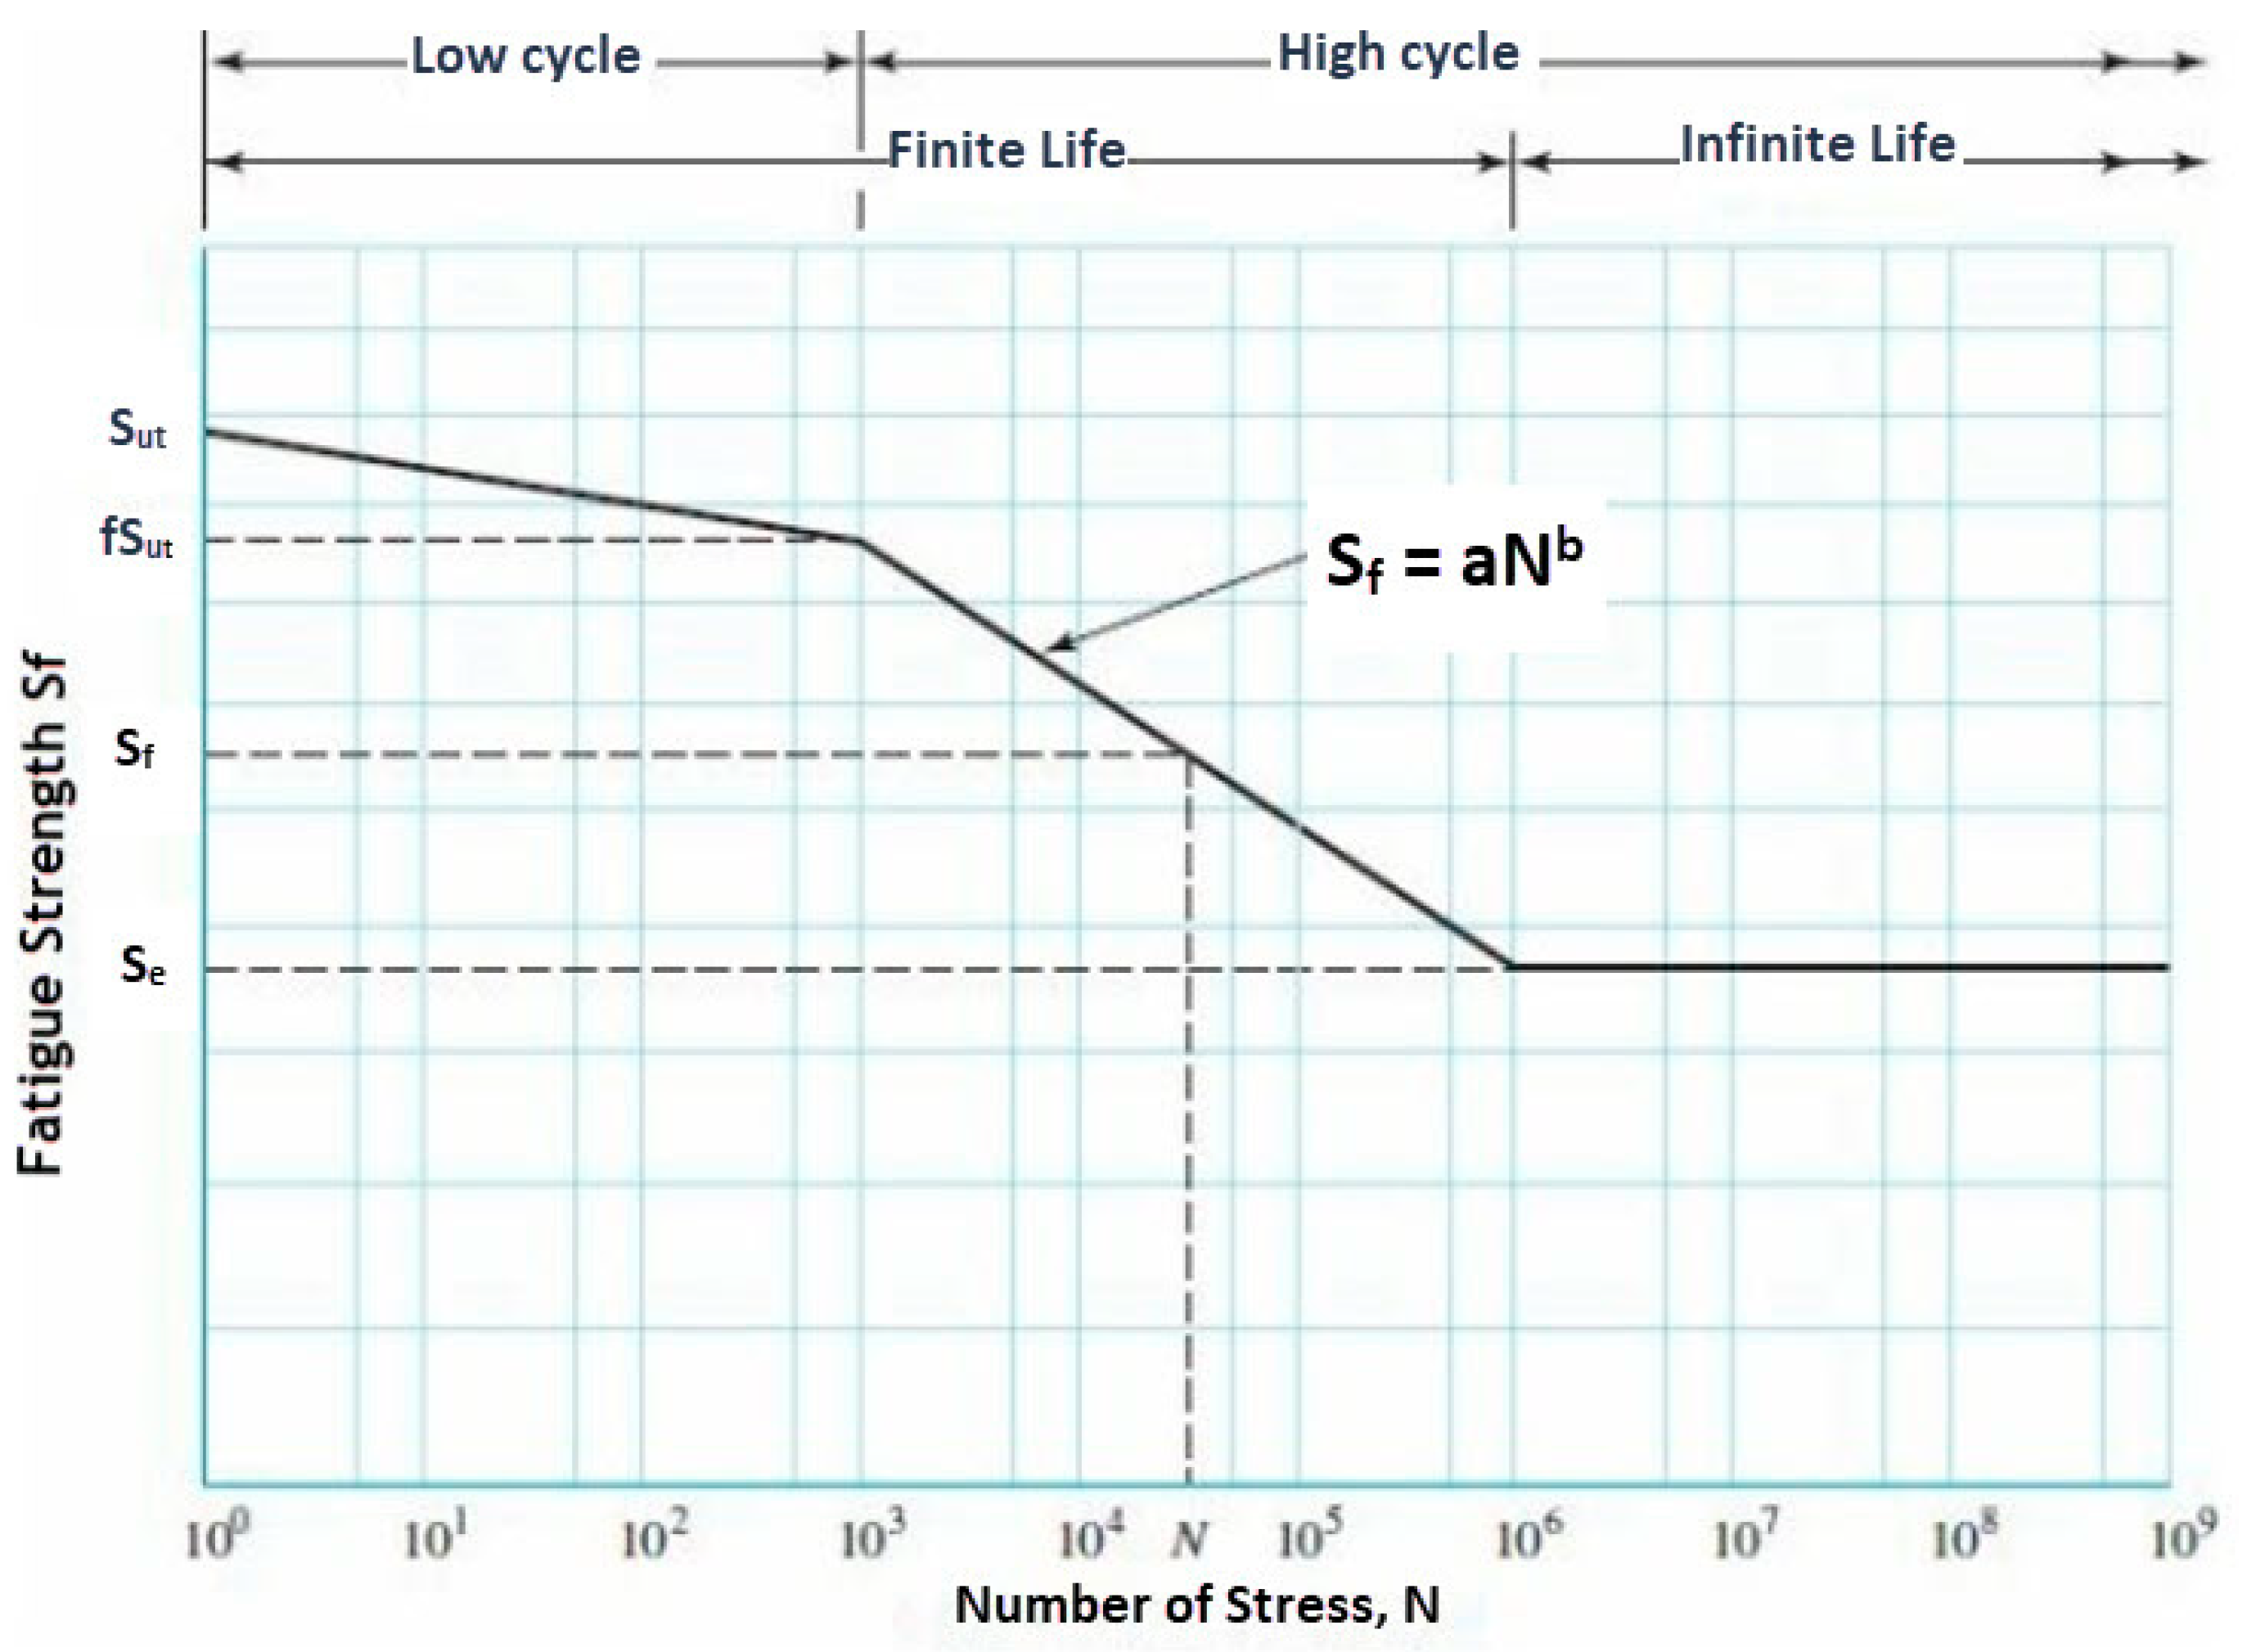
Figure 2.
Endurance Limits versus Tensile Strengths [18].
Figure 2.
Endurance Limits versus Tensile Strengths [18].
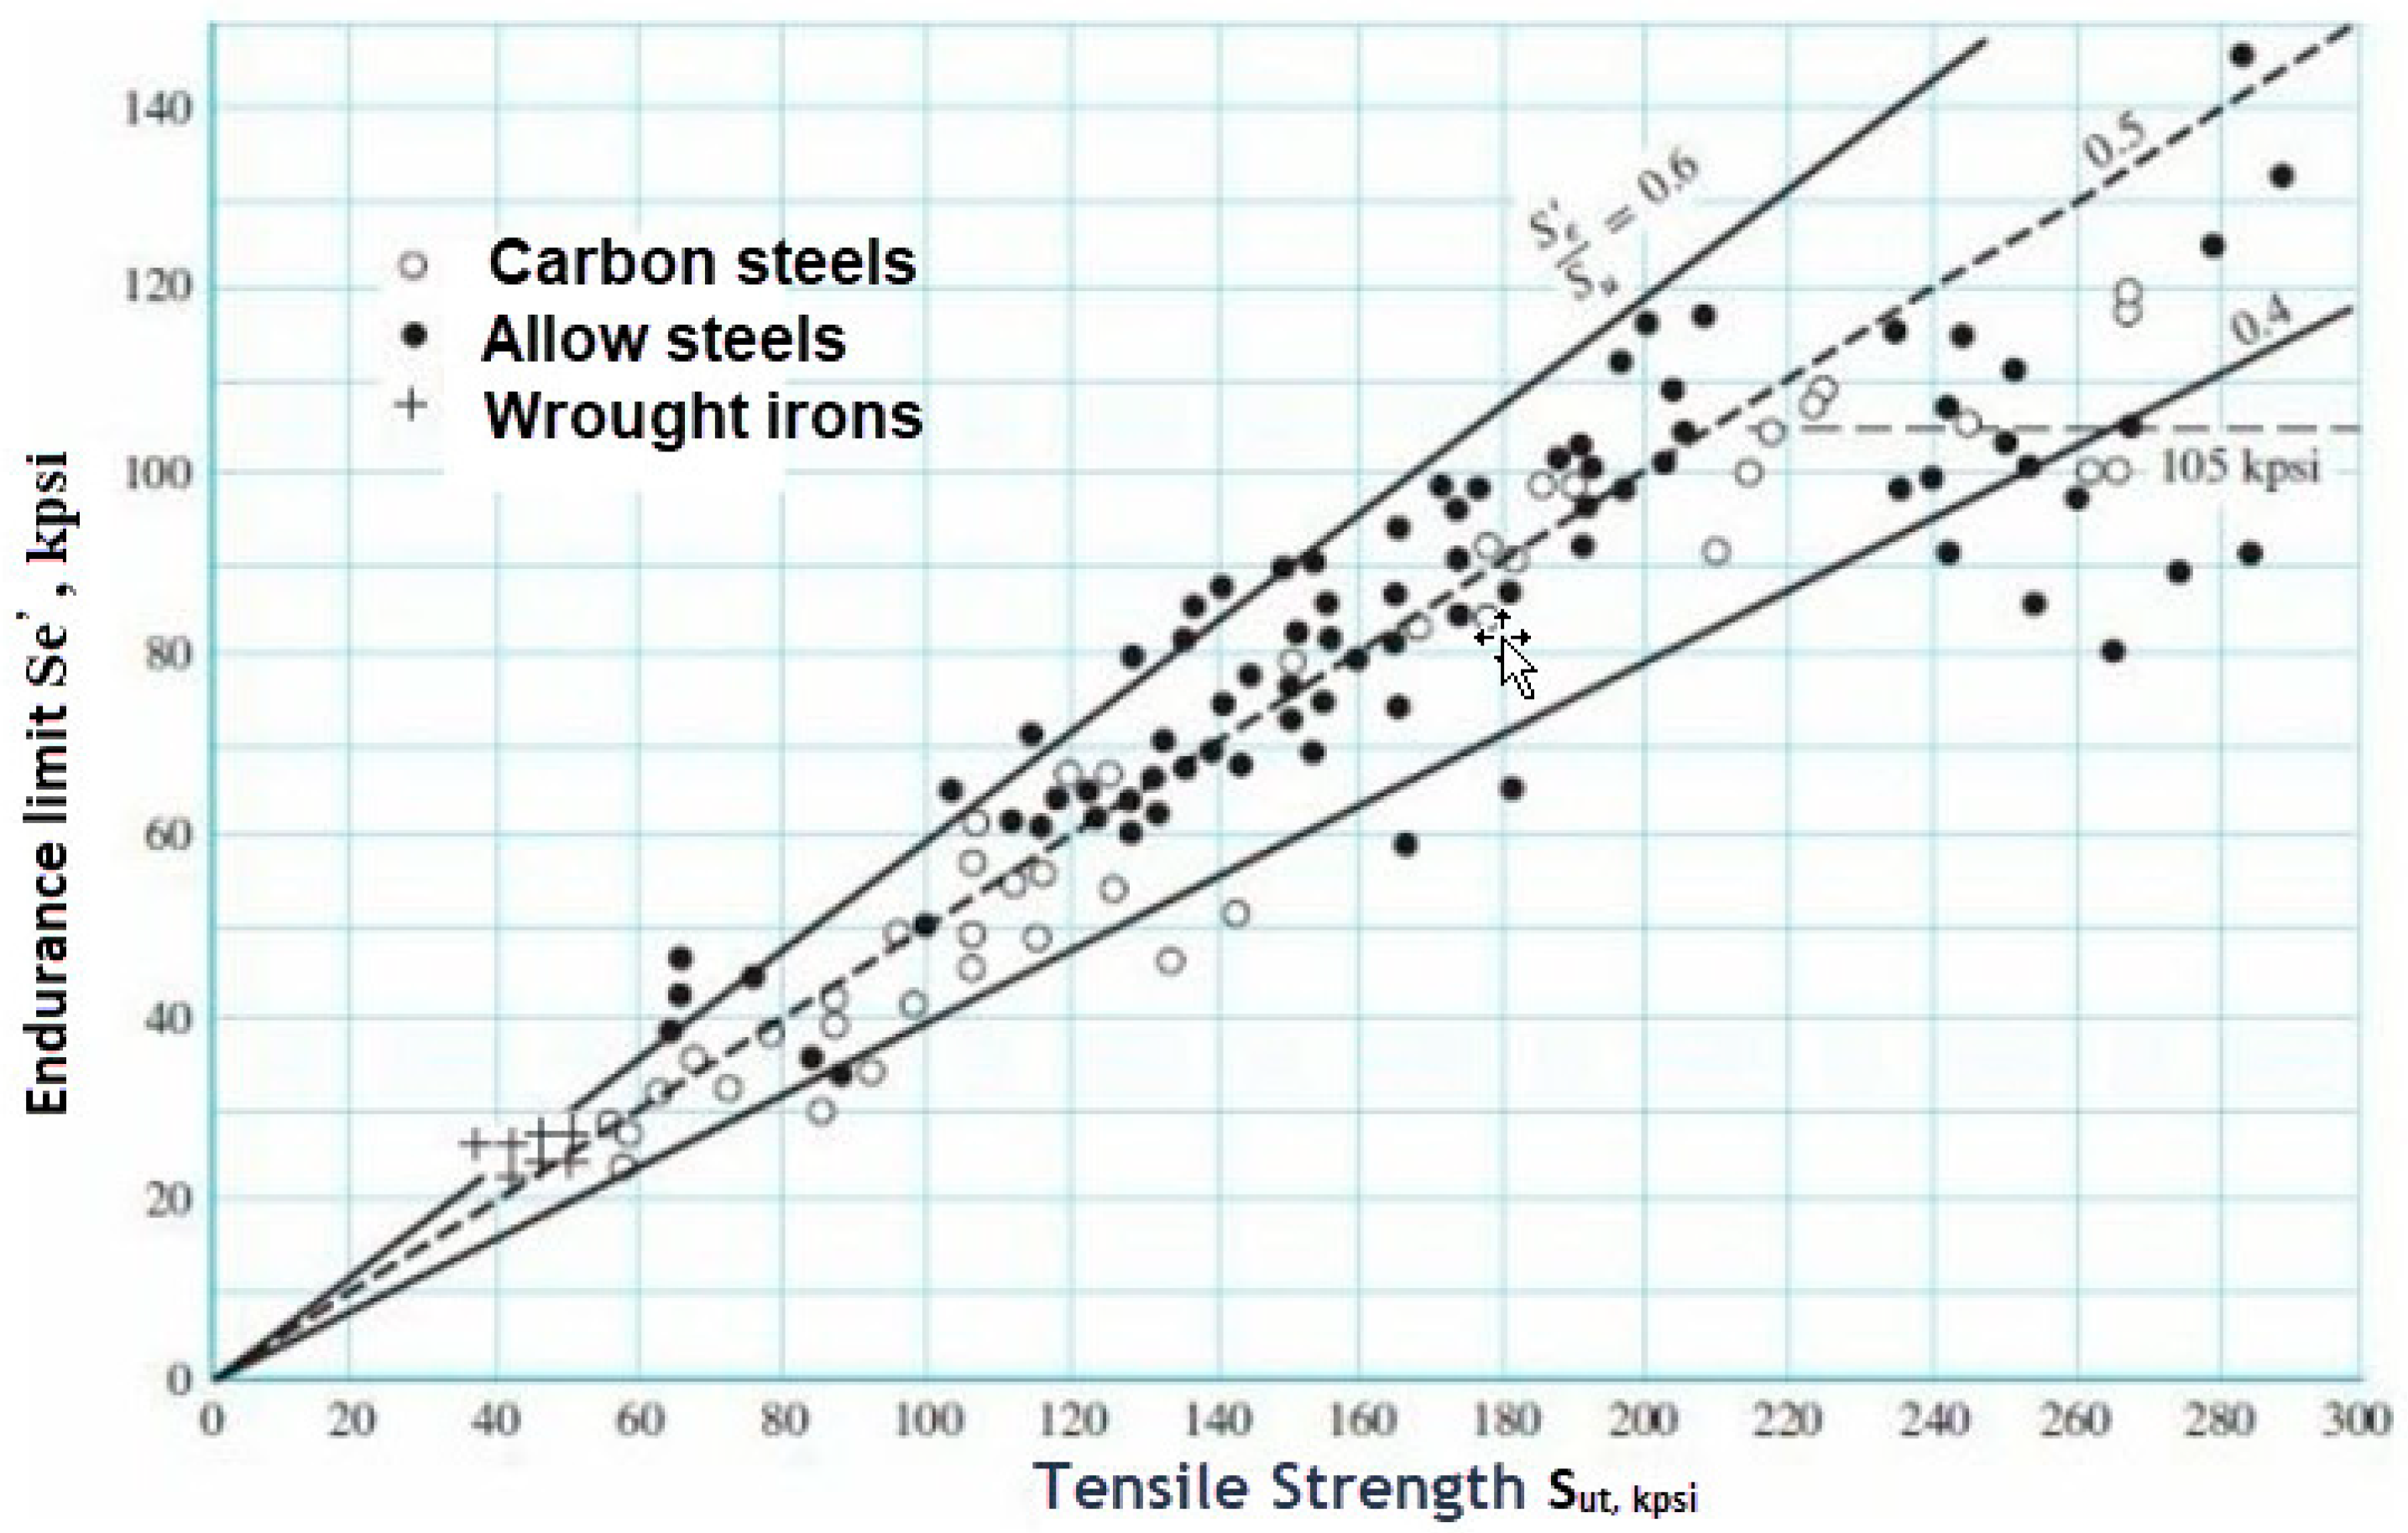
Figure 3.
Fatigue strength fraction, f, of Sut at 103 cycles for steels, with Se = = 0.5Sut at 106 cycles [18].
Figure 3.
Fatigue strength fraction, f, of Sut at 103 cycles for steels, with Se = = 0.5Sut at 106 cycles [18].
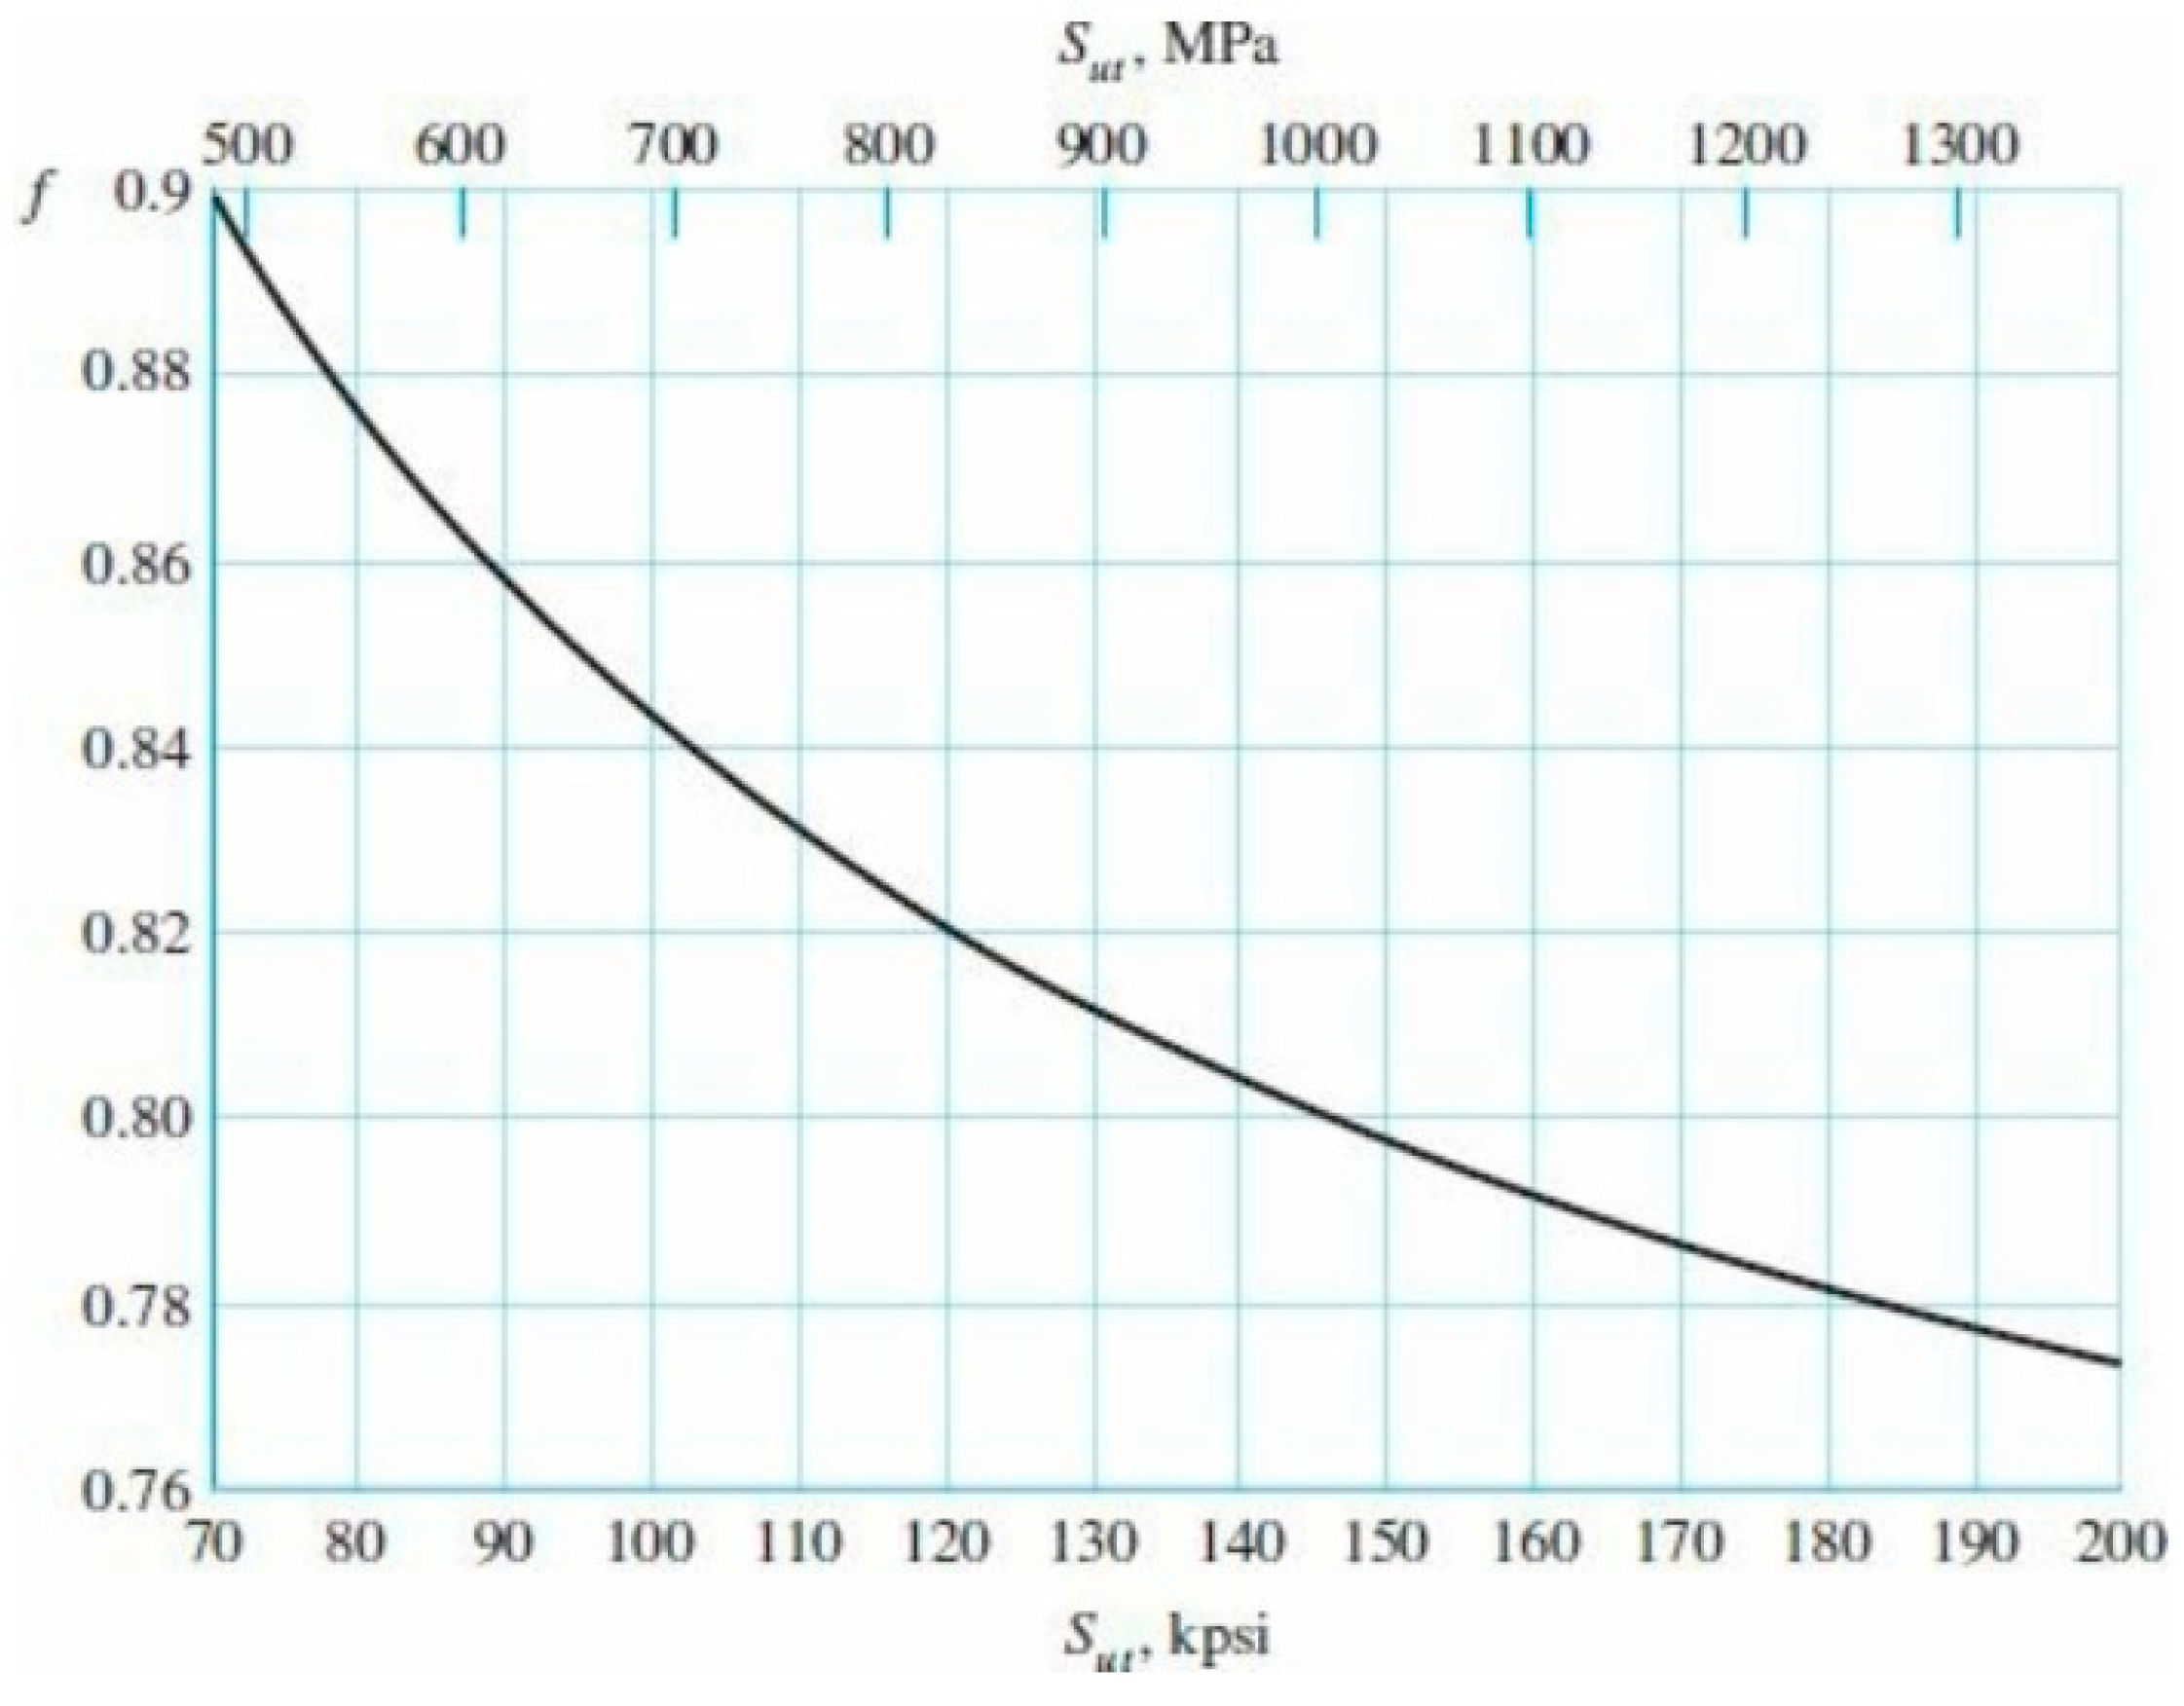
Figure 4.
Test Data for a Ductile Metal Illustrating Variation of the S-N curves Stress Amplitude with Life [19].
Figure 4.
Test Data for a Ductile Metal Illustrating Variation of the S-N curves Stress Amplitude with Life [19].
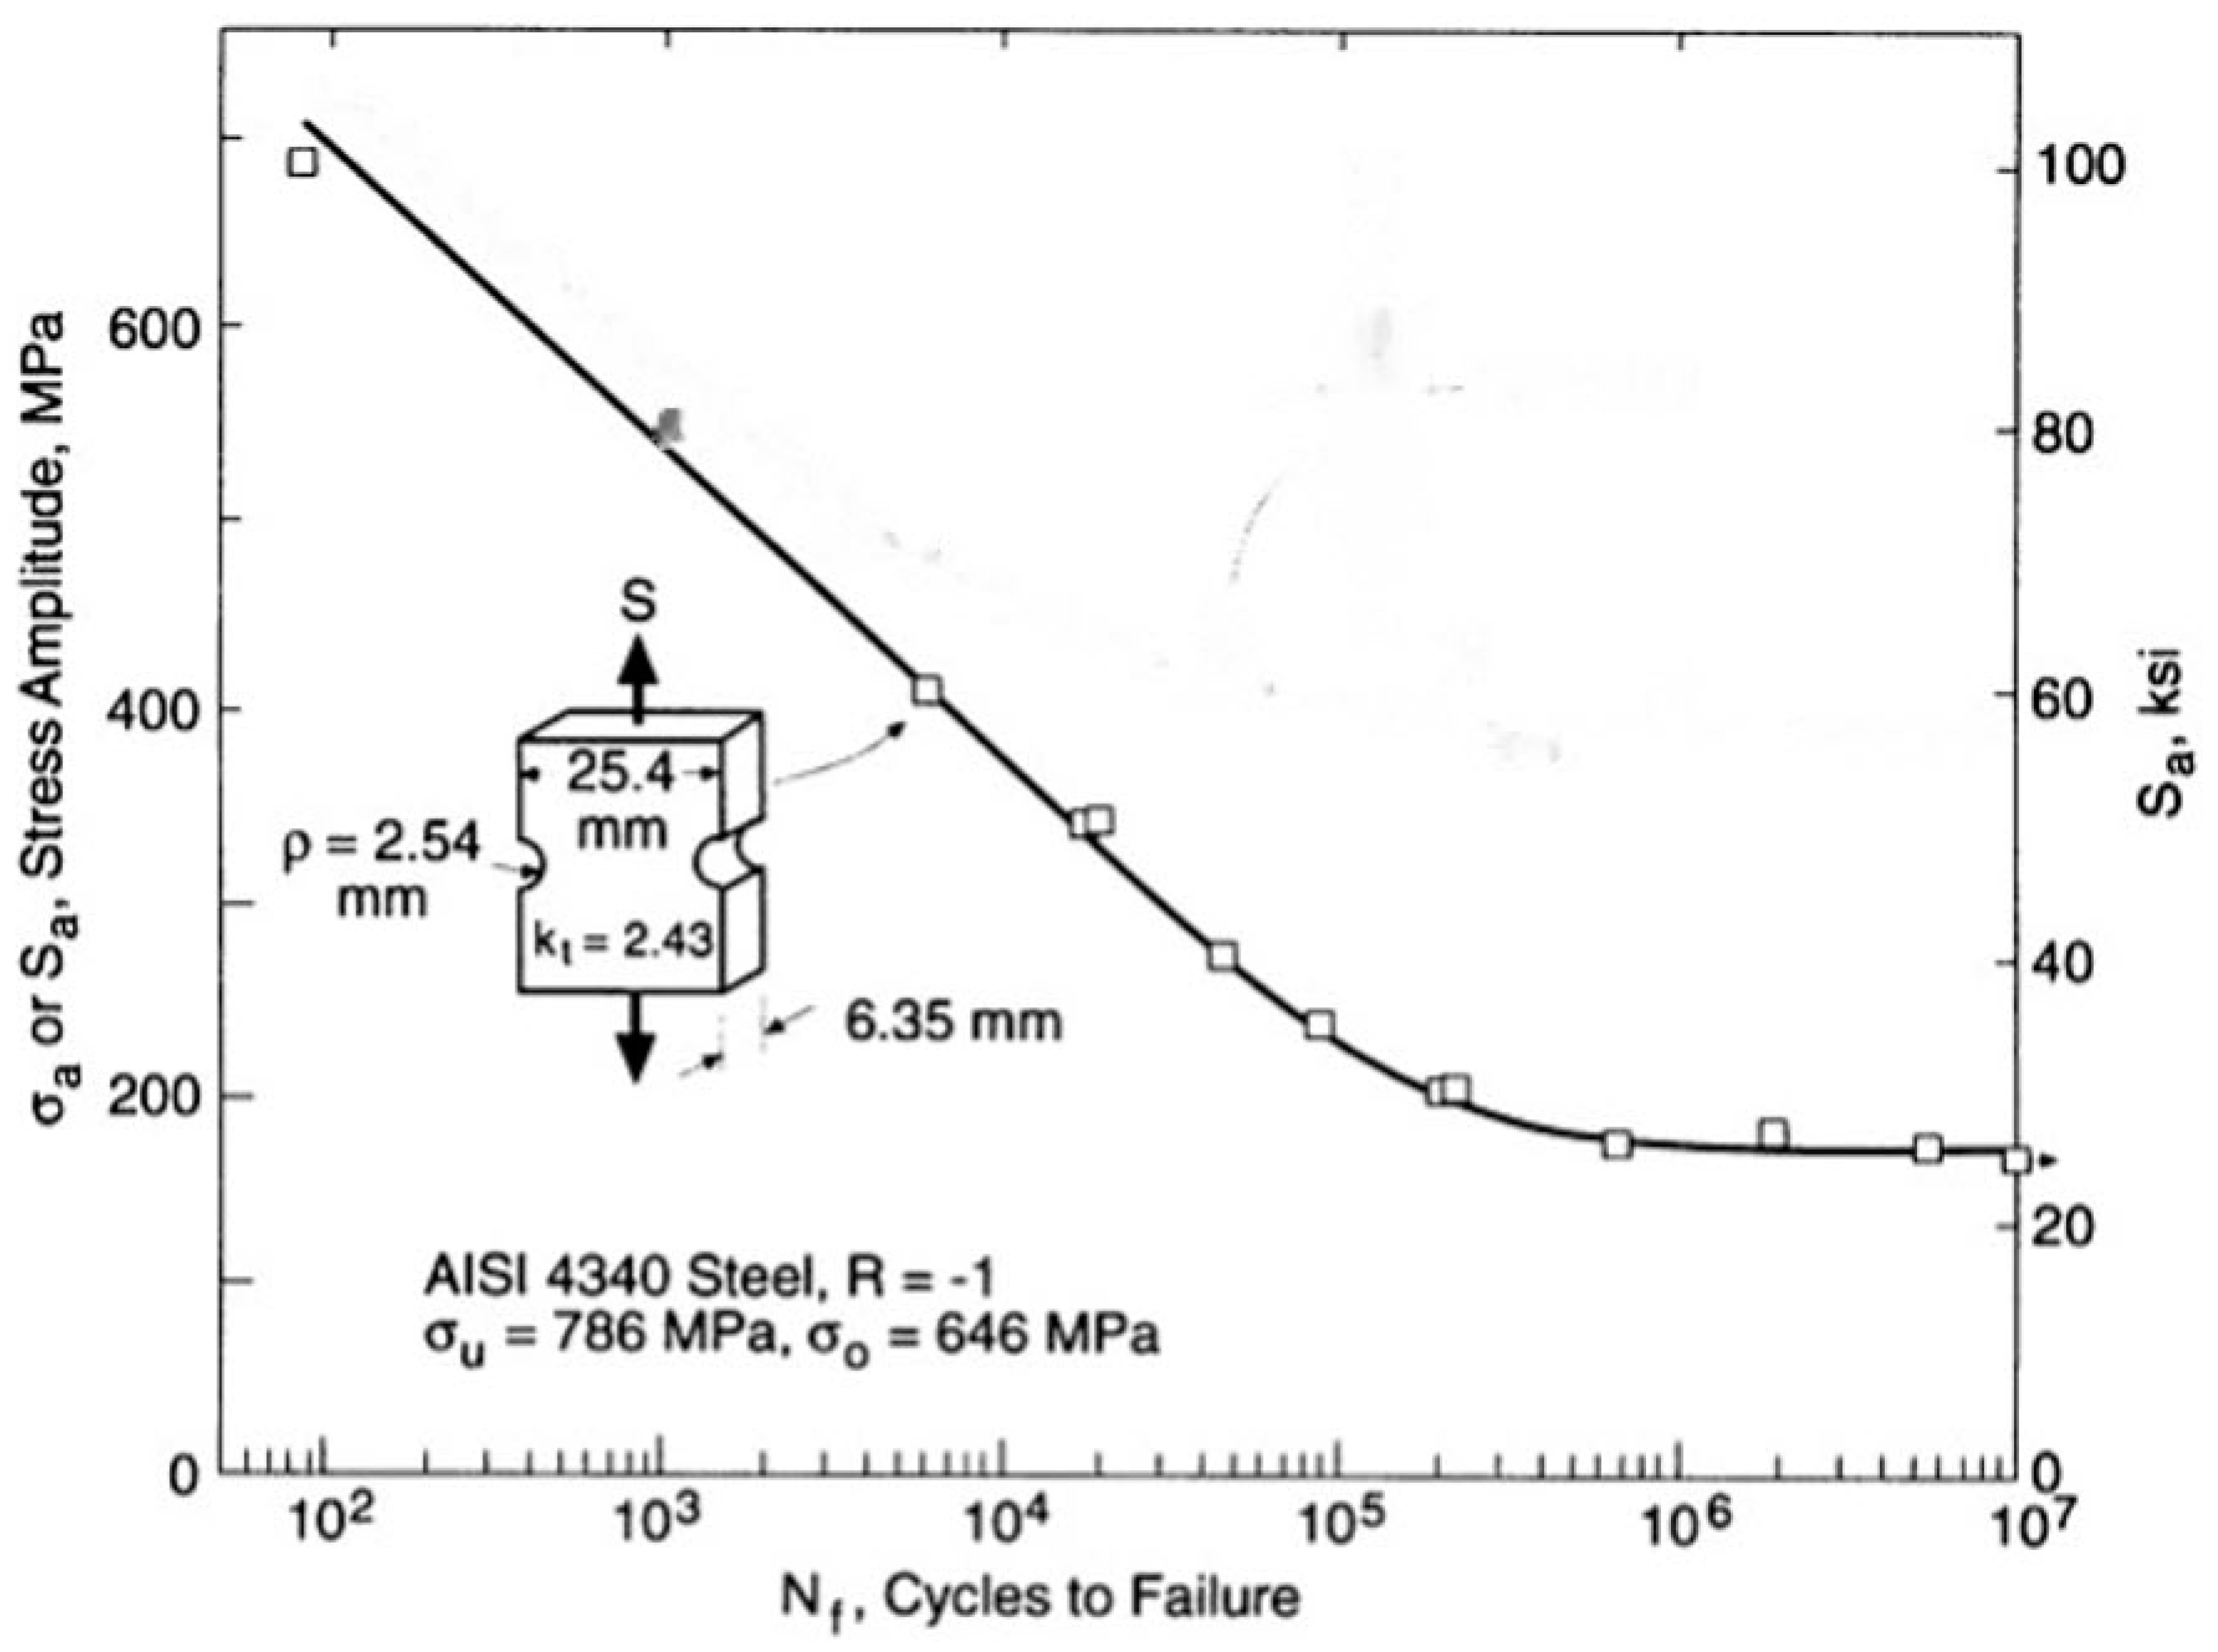
Figure 5.
Opposite Single Semicircular Shaped Notches.
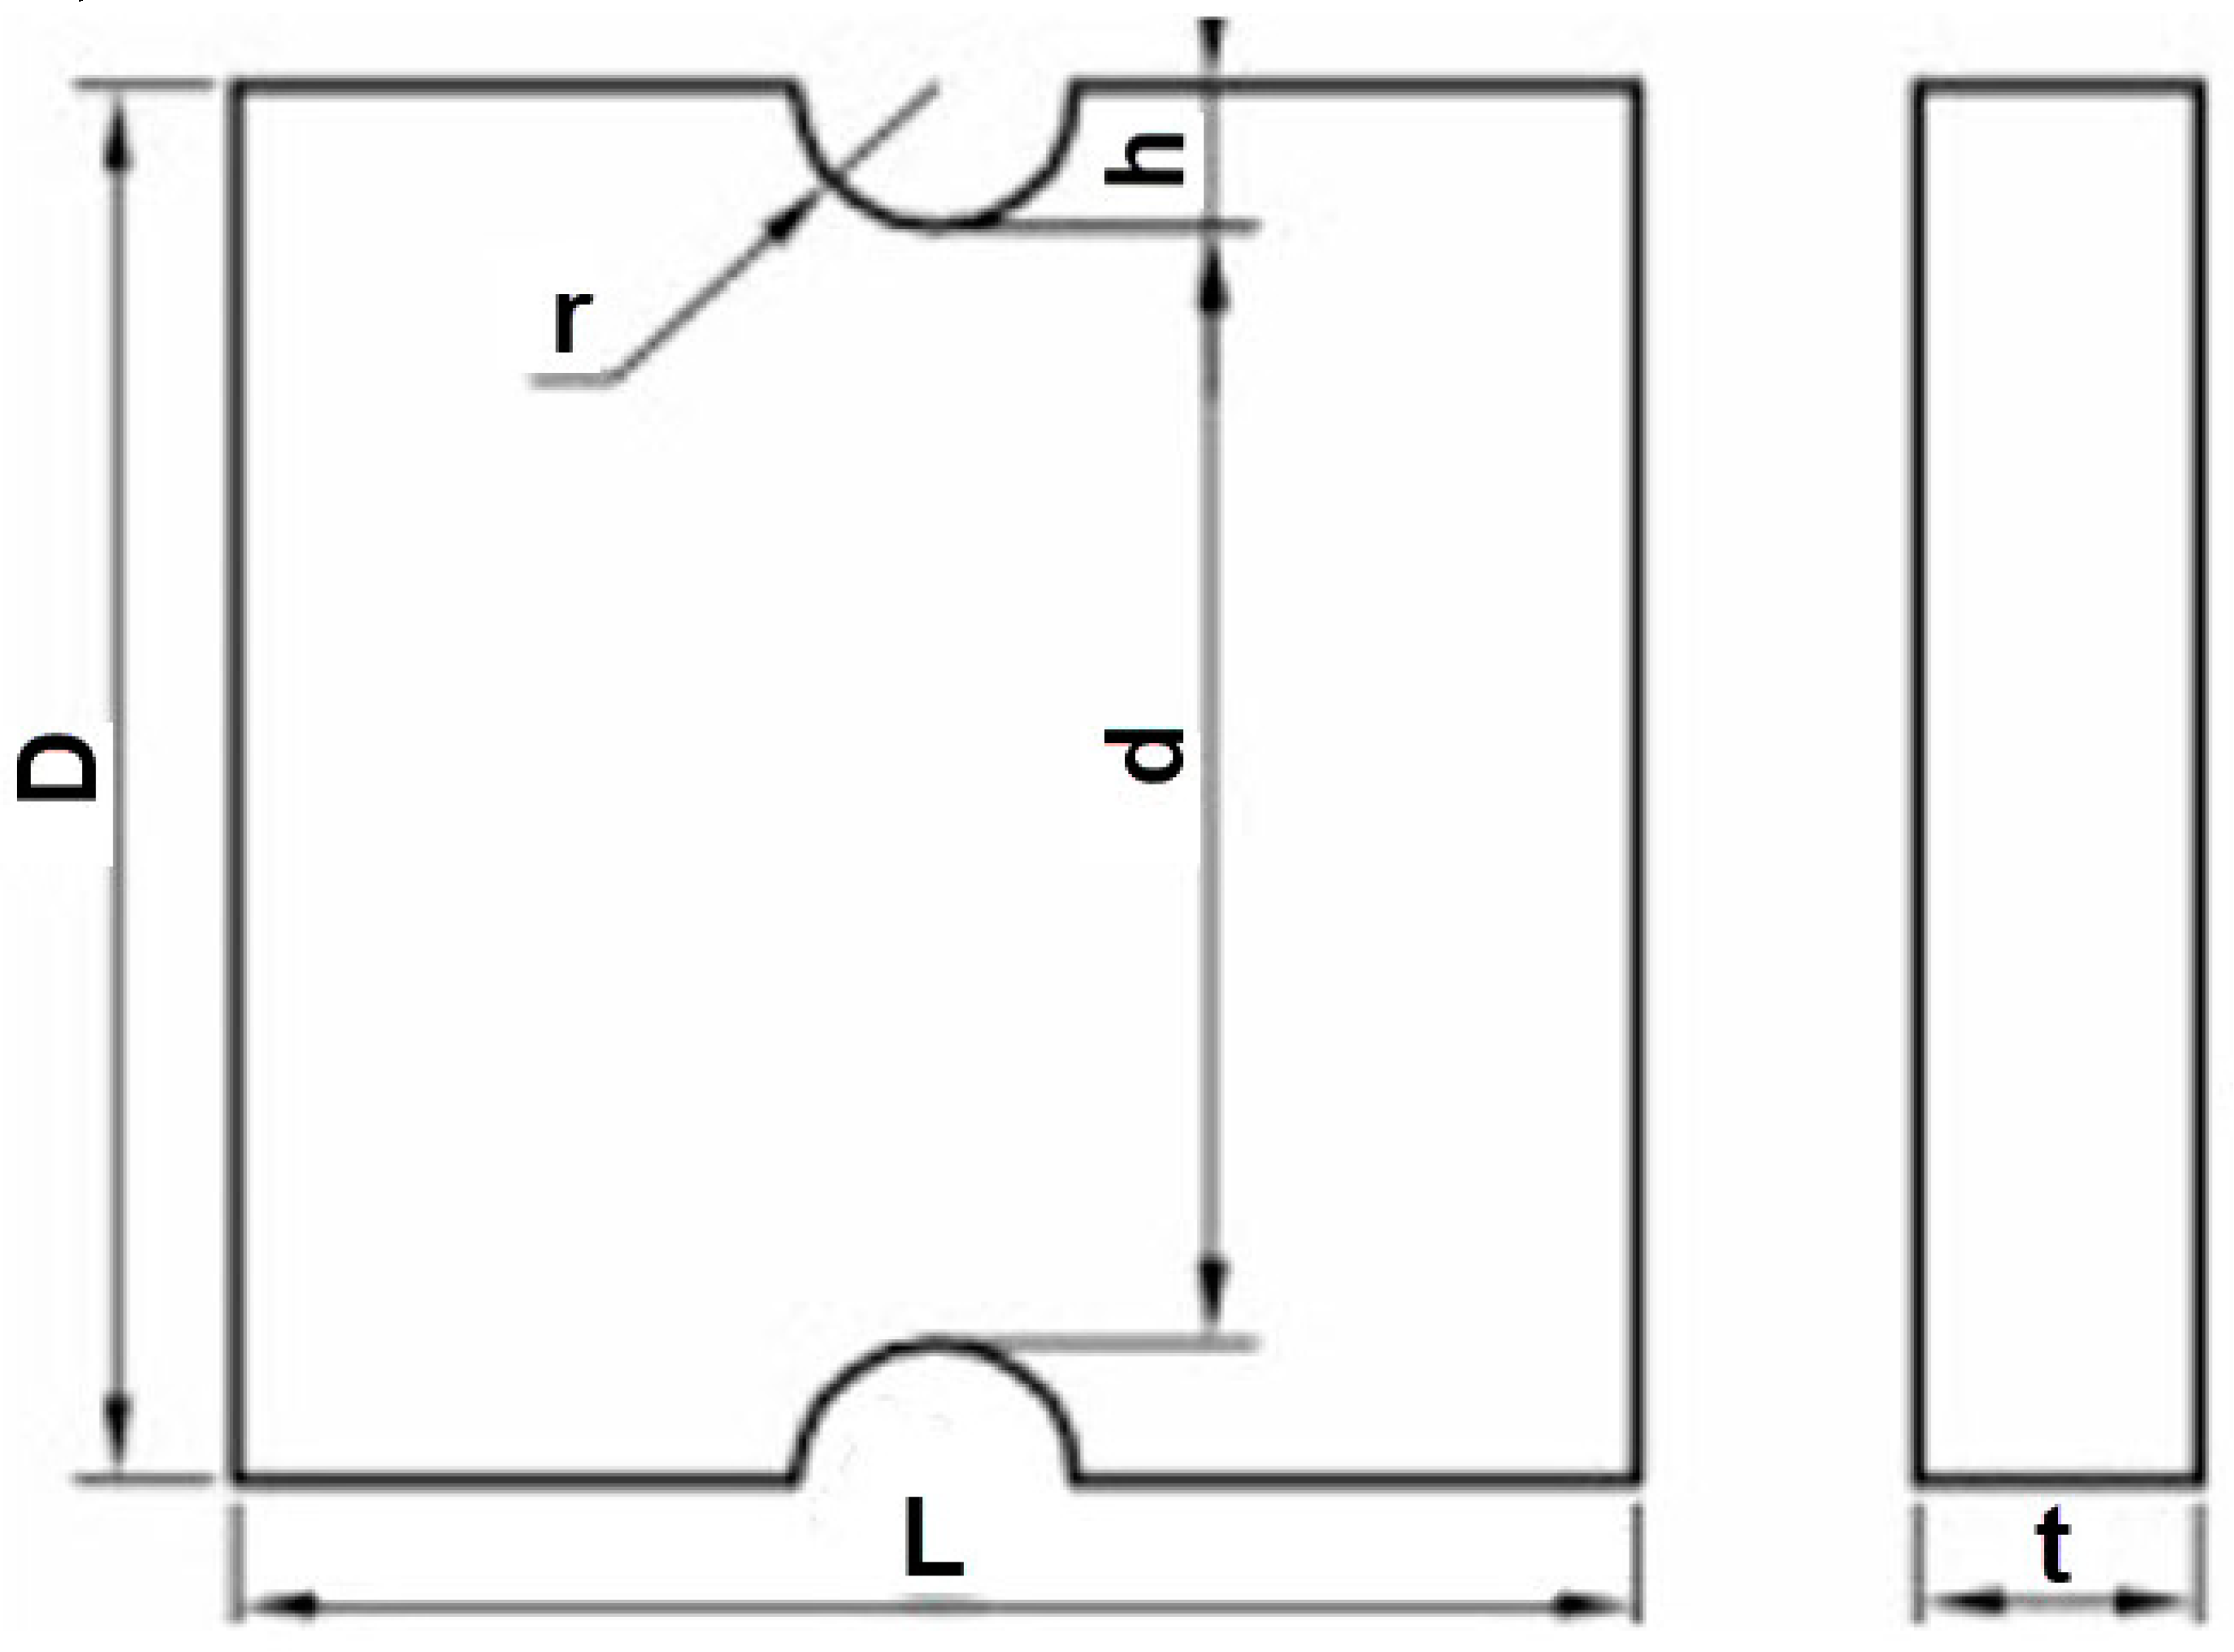
Figure 6.
D CAD View Modelling for a semicircular notched rectangular plate.
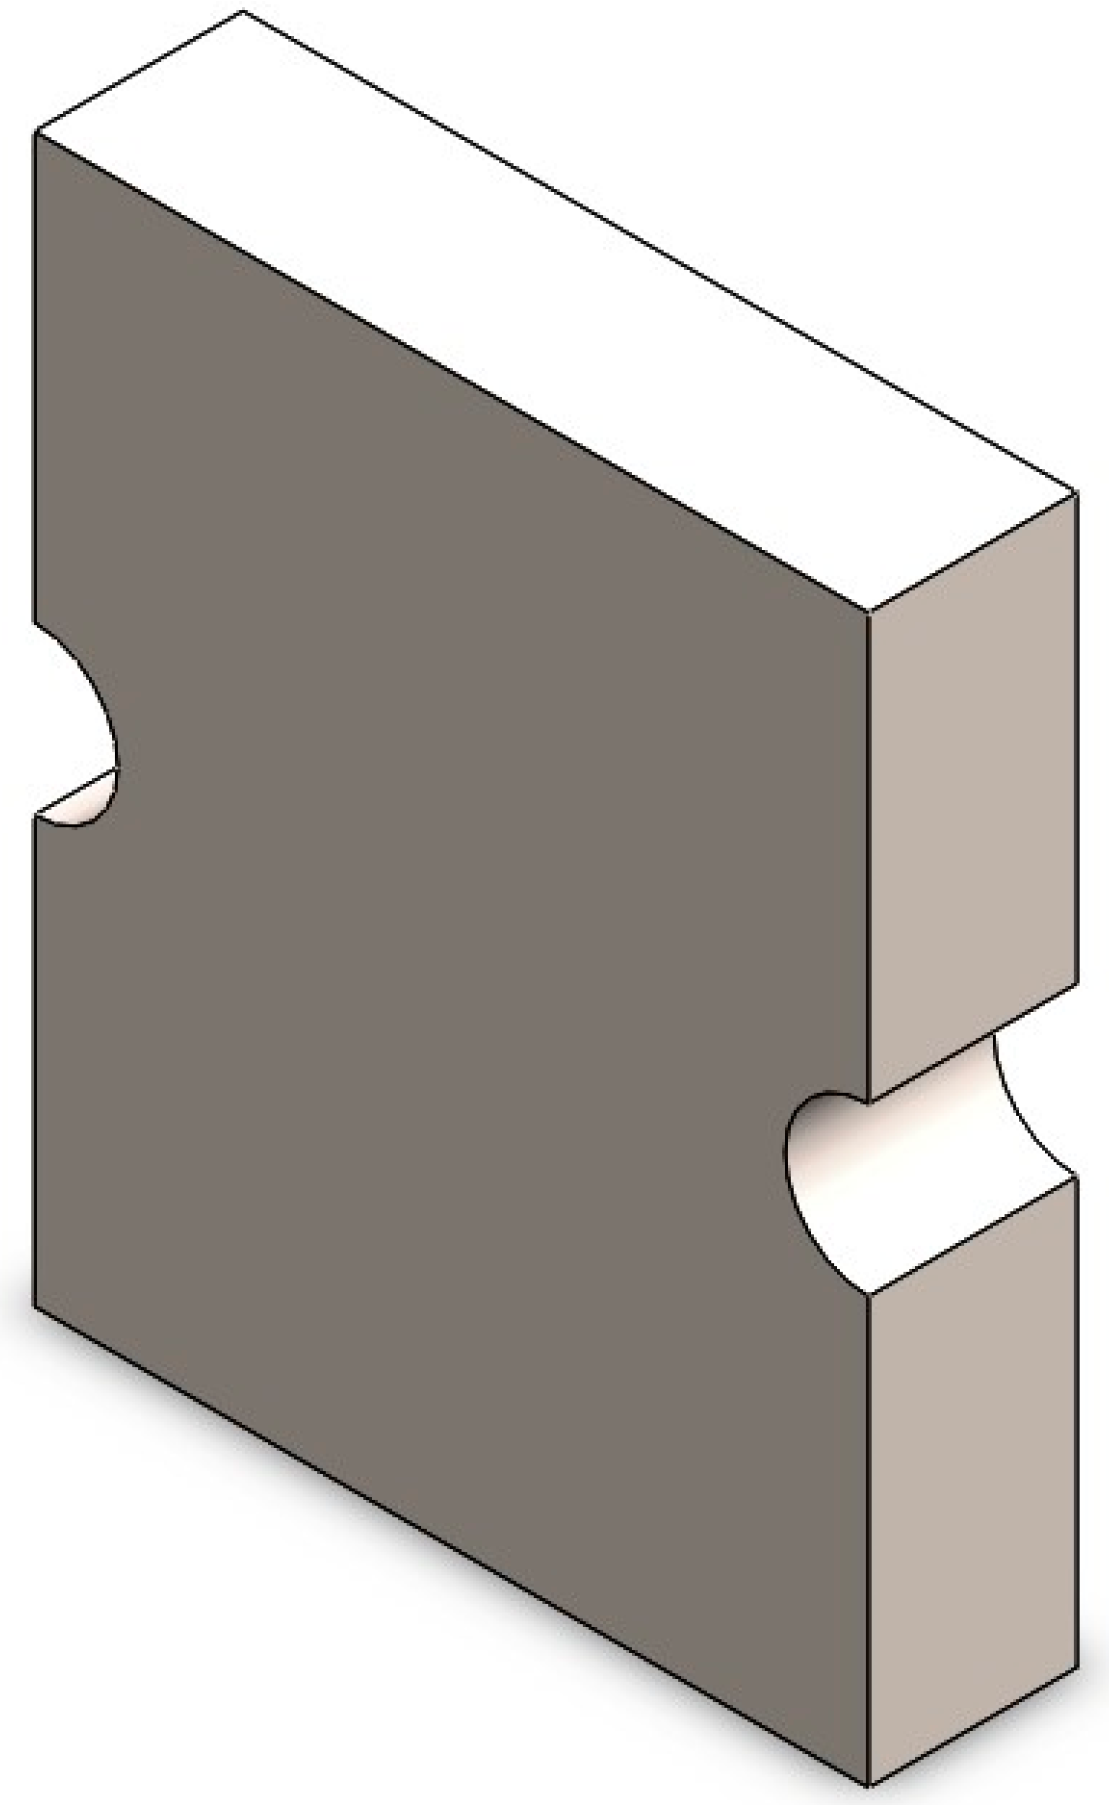
Figure 7.
D Model of Rectangular Plate with Single Opposite Semicircular Notches under Loading and Constrains.
Figure 7.
D Model of Rectangular Plate with Single Opposite Semicircular Notches under Loading and Constrains.
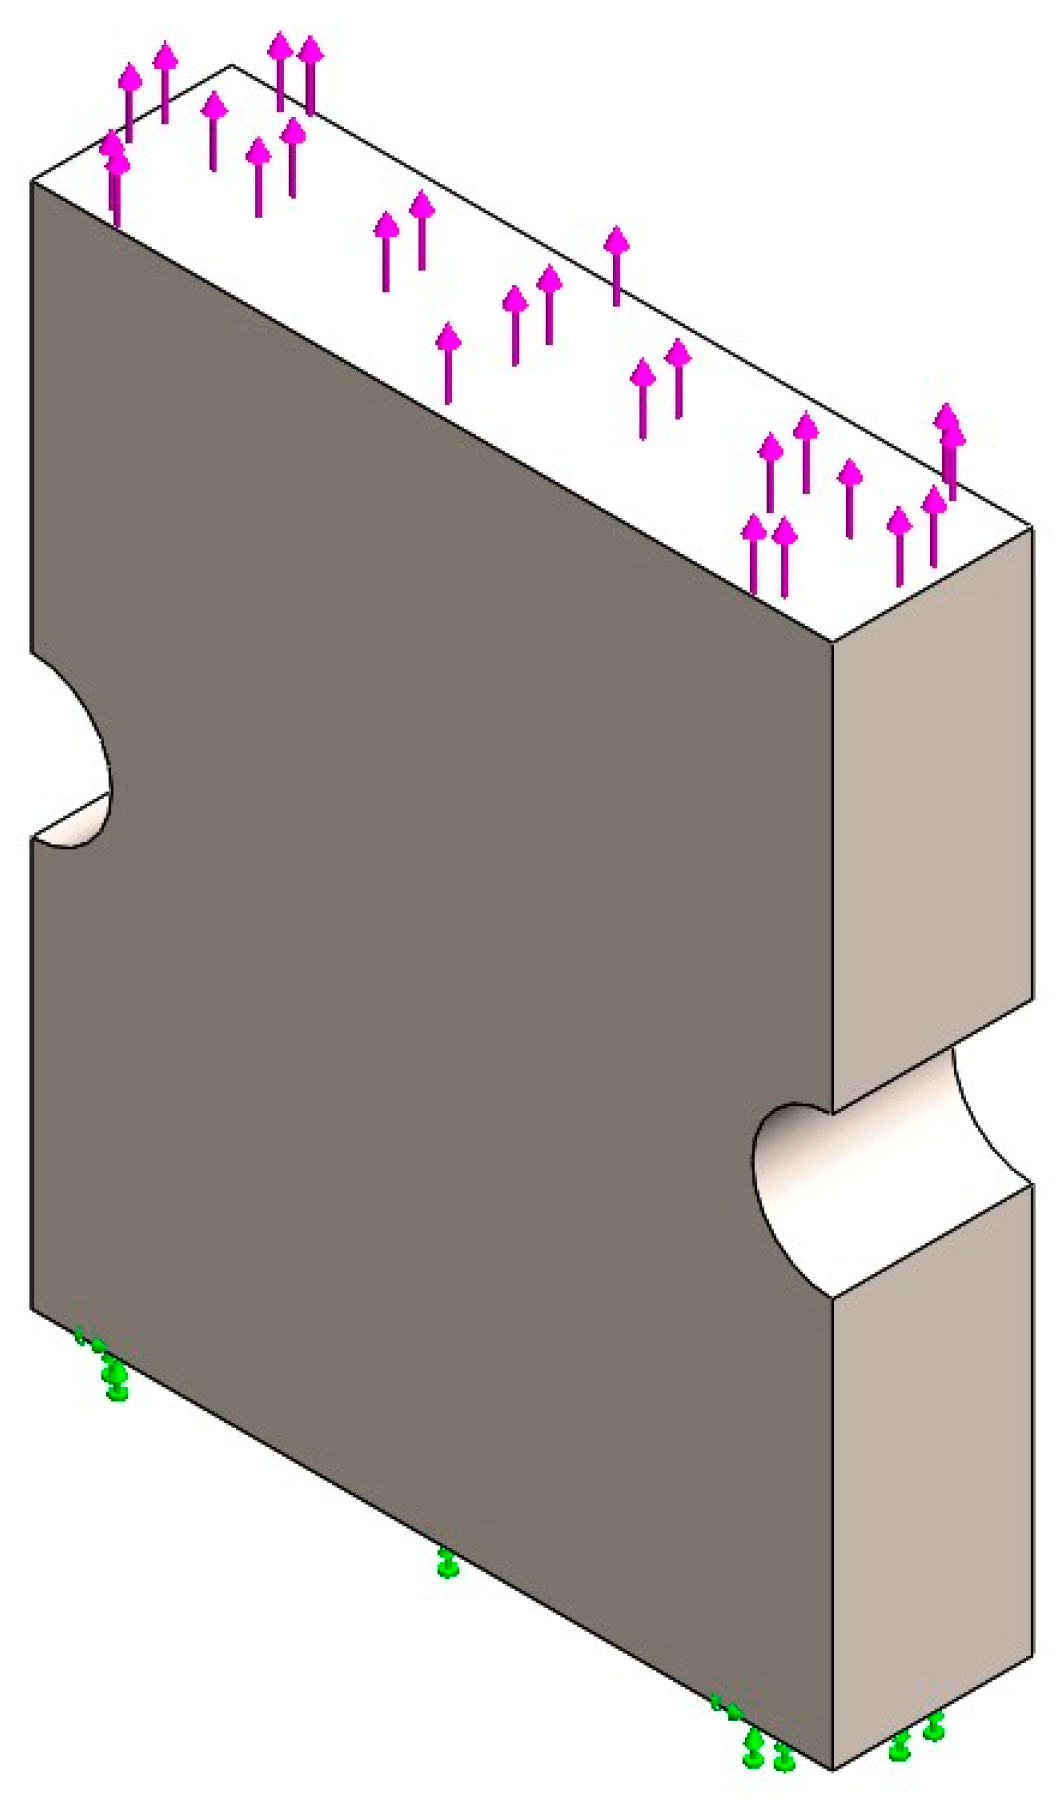
Figure 8.
Meshed Body of Rectangular Plate with Single Opposite Semicircular Notches.
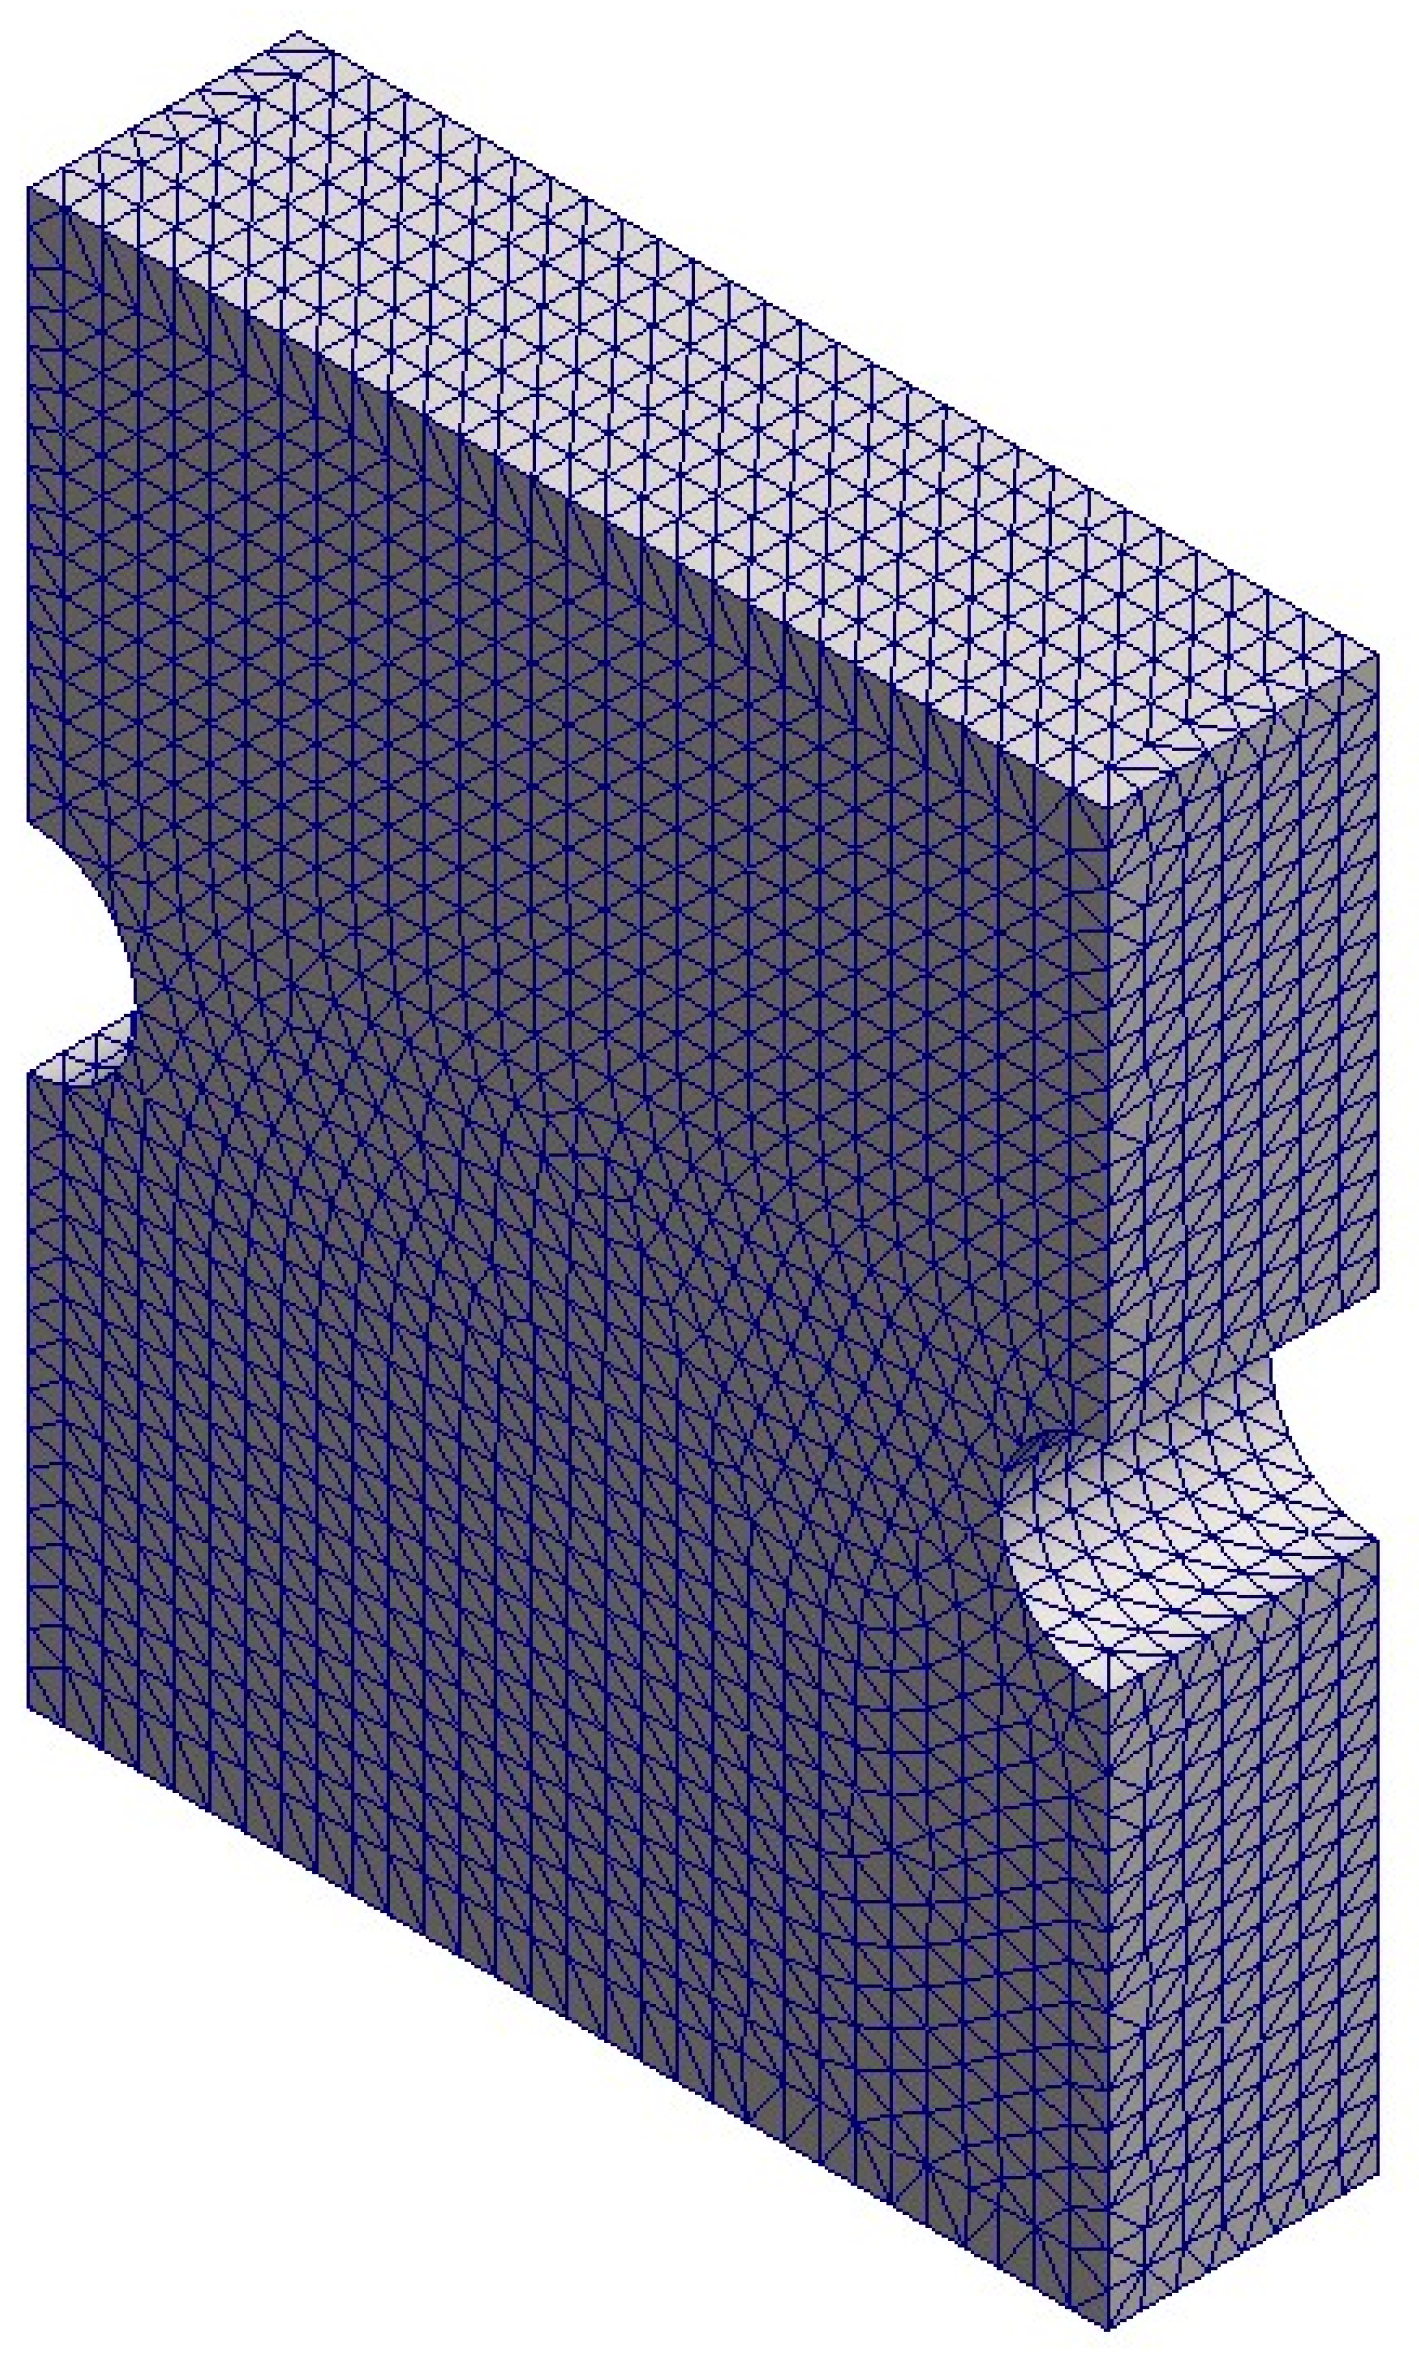
Figure 9.
Static Stress Analysis, P1 First Principal Stress.
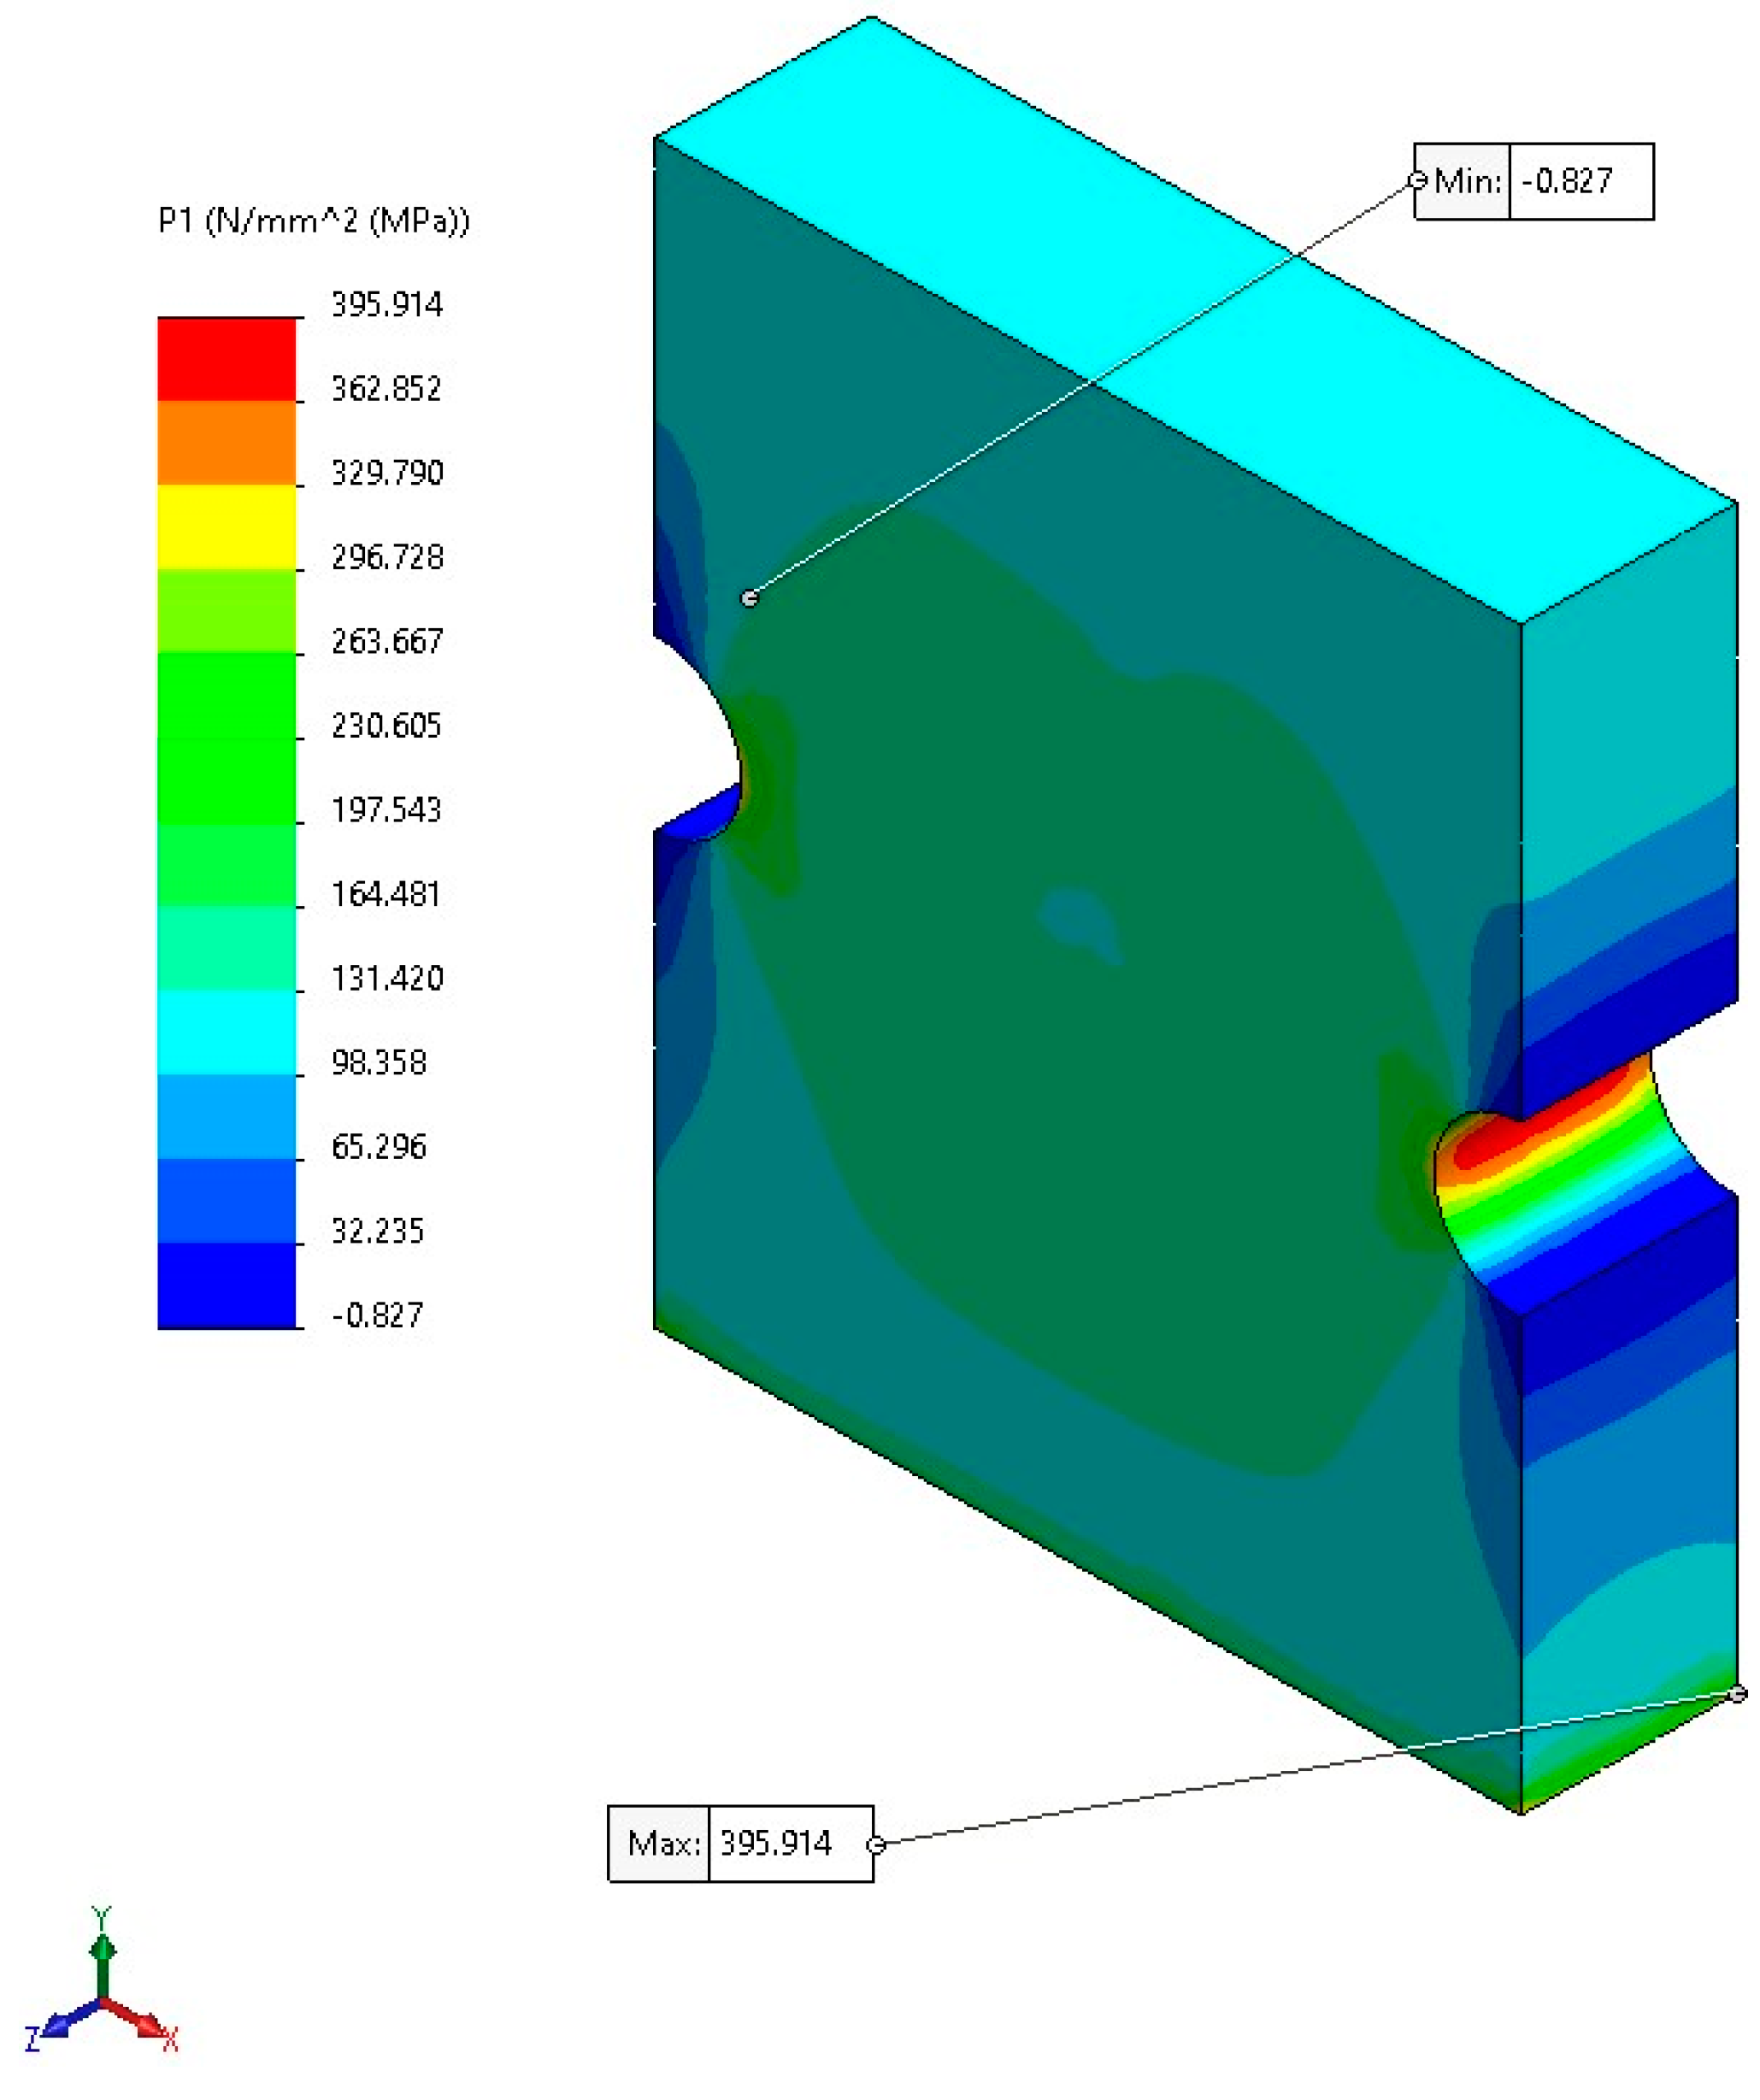
Figure 10.
Fatigue Notch Factor Total Life.
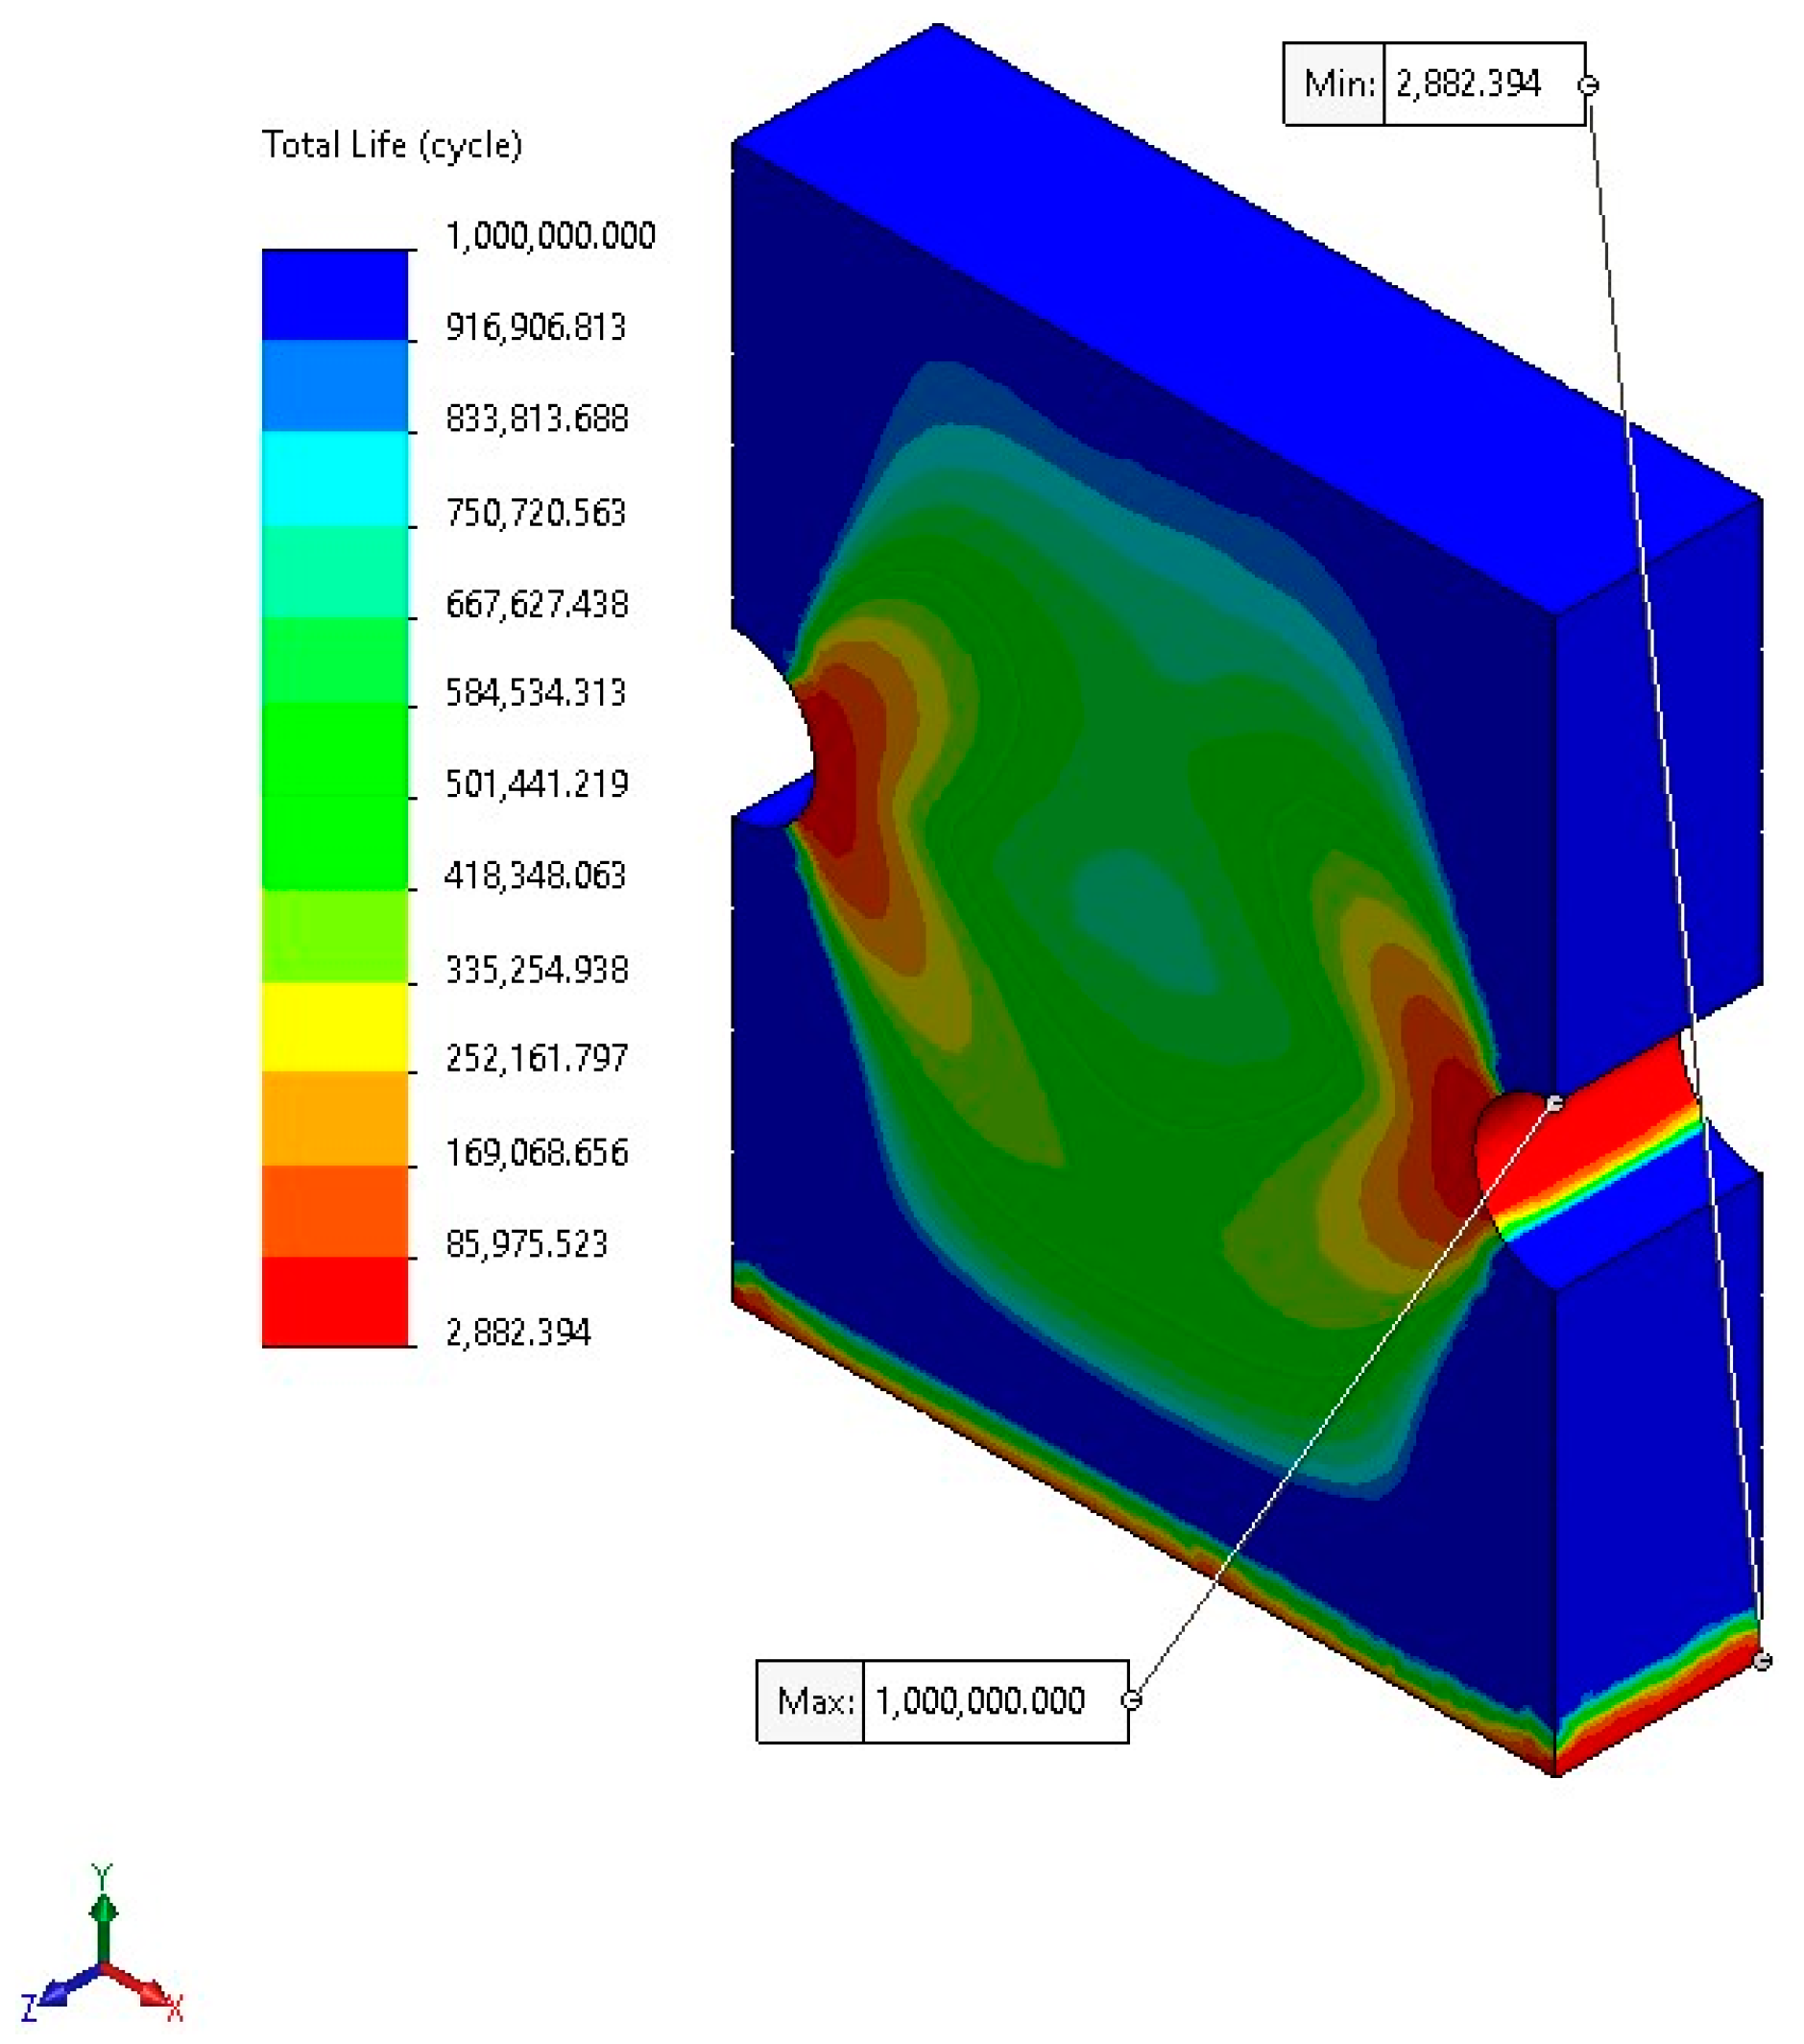
Figure 11.
Fatigue S-N Carbon Steel Curves.
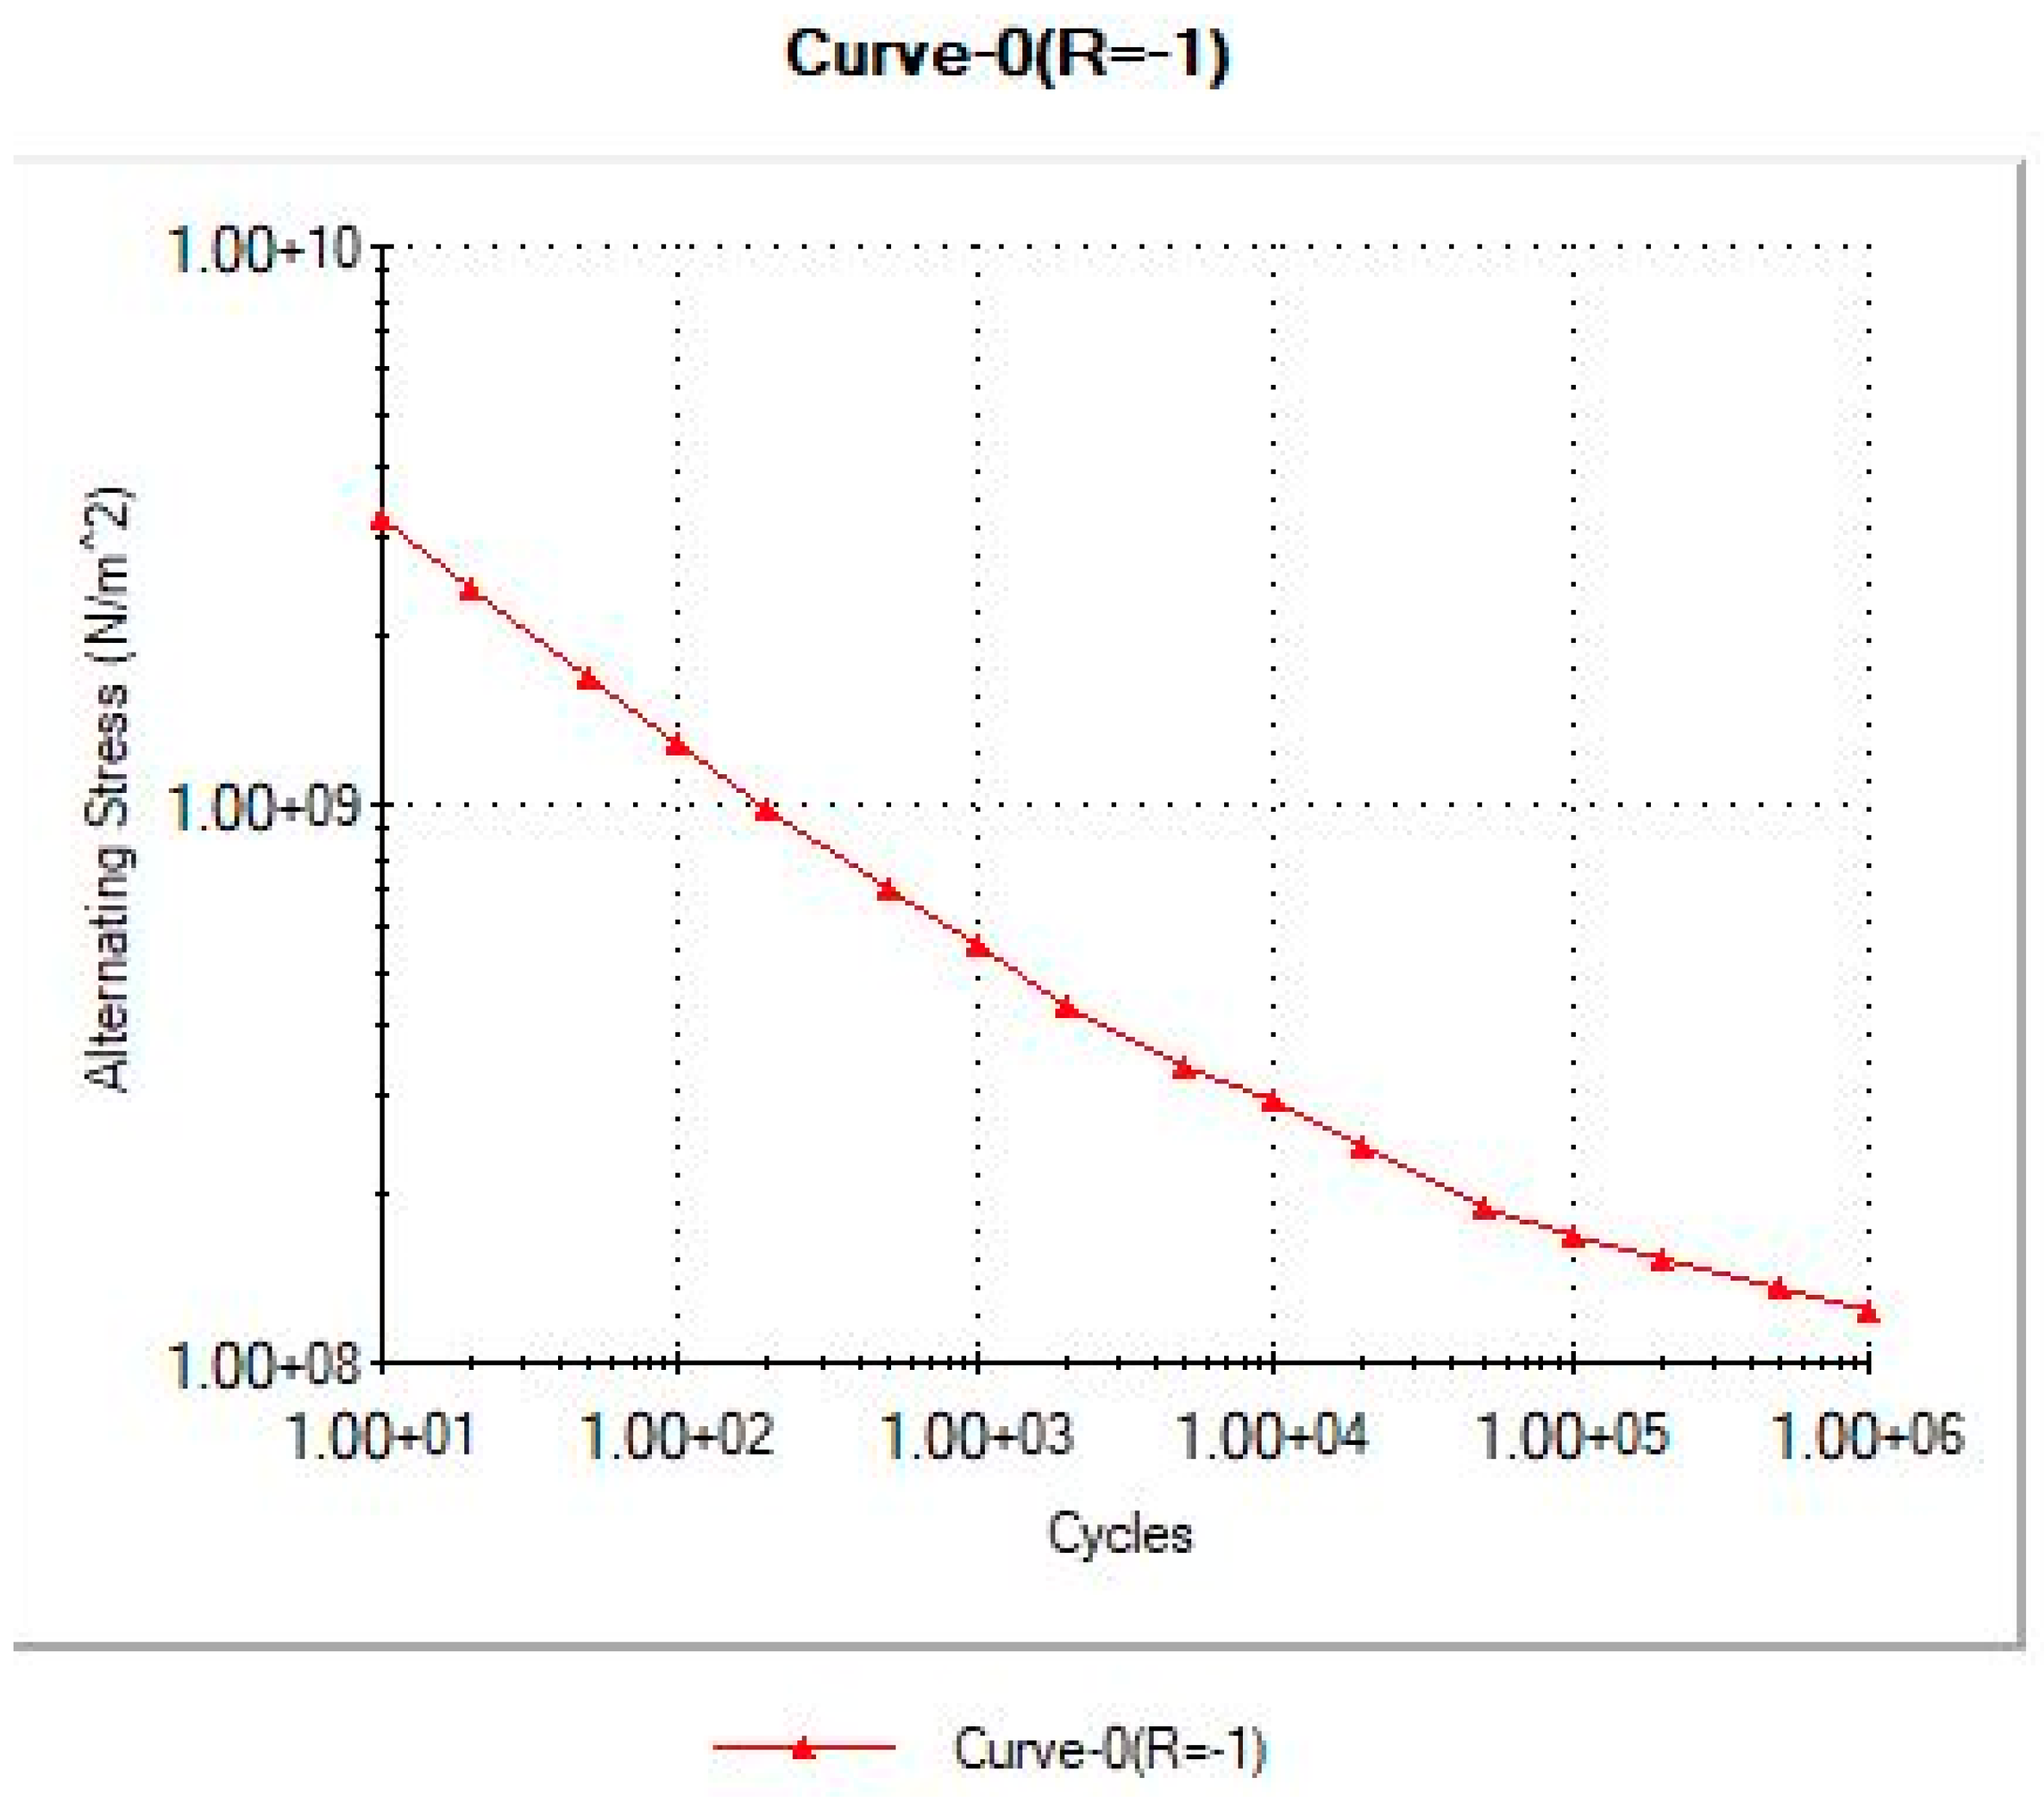

Table 1.
Dimensions for the Semicircular Notched Plate.
| Dimension | Value | Units |
|---|---|---|
| r | 2.54 | Mm |
| h | 2.54 | Mm |
| t | 6.35 | Mm |
| D | 25.4 | Mm |
| d | 20.32 | Mm |
| L | 31 | Mm |
Table 2.
Analytical Method Results.
| Property | Value | Units |
|---|---|---|
| Nominal Stress | 156.511 | MPa |
| Maximum Stress | 379 | MPa |
| Stress Concentration Factor | 2.422 | N/A |
| Ultimate Tensile Strength (Sut ) | 105.007 | kpsi |
| Endurance Limit) | 57.753 | kpsi |
| Fatigue strength fraction (f) | 0.842 | N/A |
| Constant (a) | 135.358 | kpsi |
| Fatigue strength exponent (b) | -0.061 | N/A |
| Fatigue Strength (Sf) | 77.174 | kpsi |
| Stress Amplitude (σa)/(σar) | 83.3 | kpsi |
| Fatigue Life (Nf) | 2891 | cycles |
Table 3.
Comparison of Mesh Element Number Versus Equivalent Stress (Mesh Study).
| Element size (mm) | Total Element | Von-Mises Stress (MPa) |
|---|---|---|
| 3.391 | 1039 | 316.815 |
| 2.967 | 1609 | 337.913 |
| 2.077 | 3470 | 367.147 |
| 1.505 | 9259 | 370.178 |
| 1.165 | 19735 | 373.087 |
| 0.847 | 49254 | 375.604 |
Table 4.
Mechanical properties of alloy steel.
| Property | Value | Units |
|---|---|---|
| Elastic Modulus | 210000 | N/mm2 |
| Poisson’s Ratio | 0.28 | N/A |
| Shear Modulus | 79000 | N/mm2 |
| Density | 7700 | kg/m3 |
| Tensile Strength | 724 | N/mm2 |
| Yield Strength | 620 | N/mm2 |
Table 5.
Solid Mesh Setting.
| Jacobian points | Element size | Tolerance | Mesh quality | Total nodes | Total elements | Maximum Aspect Ratio | Percentage of elements\with Aspect Ratio |
|---|---|---|---|---|---|---|---|
| 16 | 0.847 (mm) | 0.042 (mm) | High | 71995 | 49254 | 3.2525 | > 3 : 100 |
Table 6.
Error percentage of
| Type of Stress Raiser | , Analytical Method (MPa) | Error Percentage (%) | |
|---|---|---|---|
| Opposite Single Semicircular Notch | 379 | 395.914 | 4.272 |
| Fatigue Life (Nf) | 2891 | 2882 | 0.311 |
Table 7.
Fatigue data based on ASME Carbon Steel curves.
| Points | N | S (MPa) |
|---|---|---|
| 1 | 10 | 3259.154214 |
| 2 | 20 | 2418.800359 |
| 3 | 50 | 1699.254584 |
| 4 | 100 | 1284.478011 |
| 5 | 200 | 984.677052 |
| 6 | 500 | 709.900479 |
| 7 | 1000 | 555.697581 |
| 8 | 2000 | 437.265074 |
| 9 | 5000 | 340.860217 |
| 10 | 10000 | 295.452491 |
| 11 | 20000 | 241.693724 |
Disclaimer/Publisher’s Note: The statements, opinions and data contained in all publications are solely those of the individual author(s) and contributor(s) and not of MDPI and/or the editor(s). MDPI and/or the editor(s) disclaim responsibility for any injury to people or property resulting from any ideas, methods, instructions or products referred to in the content. |
© 2023 by the authors. Licensee MDPI, Basel, Switzerland. This article is an open access article distributed under the terms and conditions of the Creative Commons Attribution (CC BY) license (http://creativecommons.org/licenses/by/4.0/).
Copyright: This open access article is published under a Creative Commons CC BY 4.0 license, which permit the free download, distribution, and reuse, provided that the author and preprint are cited in any reuse.


