
Submitted:
17 May 2023
Posted:
18 May 2023
You are already at the latest version
Abstract
In order to conduct an accurate classification of the heterogeneous landscape in Jiului Valley, Romania mining basing, four machine learning algorithms (SVMs) and two common algorithms (MLC and MD) have been compared, using a temporal series of Landsat satellite images from the period 1988-2017. By using independent validation, an accuracy assessment was established together with the analysis of the differences between the classification algorithms used. Although all six algorithms used have shown a high overall accuracy (ranging from 80.29% to 93.14%) and Kappa values (from 0.77 to 0.92), SVM-RBF appears to have a higher overall applicability in describing the spatial distribution and the cover density of each land cover category. Results have indicated a large difference in classification accuracy between the SVM-RBF algorithm and commonly used algorithms, the SVM-RBF algorithms have slightly outperformed the MLC with an overall accuracy of 7.14–8.86% and by 0.0833–0.1033 kappa coefficient. On the other hand, the same algorithm have outperformed the MD by and overall accuracy of 9.71–10.86% and by 0.1133–0.1267 kappa coefficient. By using SVM-RBF, certain classified maps have been developed and used for assessing changes by post classification comparison. The results have shown an average growth of 6.5% in mined areas over the studied period.
Keywords:
Support Vector Machine
; Maximum Likelihood
; Minimum Distance
; machine learning
; classification algorithm
; Landsat
1. Introduction
In general, land cover mapping is a delicated process in which different factors intervene and which influence the quality of the final product [1]. For supervised object-based classification processes it is ought to be selected multiple options including the type of images, image pre-processing, segmentation method, training sample sets, accuracy assessment, classification algorithm, target classes and complexity of landscape [2,3].
In order to deal with such circumstances, supervised object-based classification methods were designed and adapted to certain study areas, the results being further compared to the ones already obtained through existing methods, thus validating their applicability [3]. However, due to the differences between the studied areas, it is difficult to generalize the results obtained. This means that a certain method which provides a good classification accuracy in a certain study area cannot be generalized for other areas of study. The issue becomes more difficult when large areas, with complex landscape, are mapped, due to strong changes in environmental gradients (e.g., temperature, moisture, and elevation) or due to past disturbaces [4]. In the case of such heterogeneous landscapes are found land cover categories which are difficult to spectral discriminate due to similarities between classes [5].
Among all the factors that influence the result of a supervised object-based classification, the classification algorithm plays a very important role. There are numerous algorithms for classifying satellite images and in the last three decades many studies that analyzed their accuracy have been carried out [6,7,8,9,10,11,12,13,14]. Among them, Maximum Likelihood Classifier (MLC), Minimum Distance to the Mean (MD), Mahalanobis Distance (MLD) and Spectral Angle Mapper (SAM) are considered to be common classifiers [15,16,17,18,19]. Relatively novel classification algorithms, considered as the advanced classification algorithms, include Random Forest (RF), Support Vector Machines (SVMs), Decision Trees (DT), Relevance Vector Machines (RVM), Artificial Neural Network (ANN) or Neural Net (NN), Object Based Image Analysis (OBIA), and Histogram Estimation Classifier (HEC) [20,21,22,23,24,25,26,27,28,29,30].
Common and advanced classification algorithms have both strengths and limitations. Common algoritms (parametric algorithms) like MLC, assume the existence of a normal multivariate distribution for each class [7,10] and a satisfactory number of training samples [2]. If a normal distribution of the data is not ensured, which happens quite often in the case of land cover classes, the parametric classifiers may fail due to the inability to elucidate the interclass confusion [31]. This represents the main limitation of parametric classifiers [10,27]. Instead, advanced classification algorithms (machine learning algorithms) can overcome the limitations of parametric classifiers if the imagery data is not normally distributed [2,21,27,32,33]. In recent years, machine learning algorithms are frecvently used because they are more accurate and robust to noise compared with common algorithms [5,34]. SVMs have the ability to produce higher classification accuracy even with a small number of training samples [35]. Choosing a suitable algorithm for large areas depends on its ability to handle noise observations, operating in a complex environment and using a small number of training samples comparativley to the size of the studied area [36,37].
In the specialized literature, there are many studies which aimed to compare and evaluate different classification algorithms of diverse landscapes. Thus, Otukei & Blaschke (2010) evaluated the performance of DT, SVM and MLC algorithms, Szuster et al. (2011) have compared the performances of MLC, NN and SVM, while Shao & Lunetta (2012) have compared algorithms like NN, SVM, and Classification and Regression Tree (CRT). Other studies have focused on evaluating the performance of different algorithms in classifying complex landscapes that also include surface mining. So, Demirel et al. (2011) found that SVM works very well in monitoring environmental impacts of mining from remote locations in mountainous region and cloud cover on satellite images. Karan & Samadder (2016) compared SVM and MLC algorithms regarding the detection of change in open cast mines using Landsat images and found that SVM performs better than MLC. Also, Karan & Samadder (2018b) found that by applying SVM to the classification of land use from Jharia coalfield (India) using WorldView-2 images, an overall accuracy of 95% is obtained. In the same study [9], it is shown that, among the common classifier algorithms, MLC obtained the highest overall accuracy of 84%, while MD only of 80.47%. In other studies, based on Landsat 8 Operational Land Imager (OLI), SVM classification algorithms led to a superior classification of land use for mining areas [39].
In this study, we compare the performance of the SVMs, MLC and MD algorithms and Landsat Thematic Mapper (TM) and Landsat 8 OLI for mapping mined areas and complex landscape around these as well as assessing the land cover changes in the Jiului Valley mining basin in Romania. In this sense, three main objectives were pursued: (1) the mapping of land cover classes from a complex landscape using SVMs (four kernels: linear, polynomial, RBF and sigmoidal), MLC and MD; (2) comparing the performance of the SVMs, MLC and MD in detecting and mapping land cover changes; and (3) assessing the land cover changes, mainly in mined areas, within the studied area over the period 1988-2017.
2. Materials and Methods
2.1. Study Area
The study was carried out on an area of 107715.3 hectares which includes the largest surface mining basin in Romania called Jiului Valley and the surrounding landscape (Figure 1). The area is located beetween 44o35'31'' and 45o01'43'' North latitude and between 22o53'46'' and 23o29'15'' East longitude. The mining basin consists of the Rovinari and Motru Jilț mining basins from which coal is extracted, each basin having open surface mining operations [40,41]. The altitude of the studied area is between 330 m and 400 m. The average annual air temperature is 10.3o C and the average annual amount of precipitation is 700 mm.
Landscape structure and land-cover dynamics are very complex.In the studied area there are forests of different age classes, agricultural lands, pastures and hayfields, surface mining operations, built up areas, dumps and water bodies. The forests consist of deciduous species (sessile oak, Turkey oak and beech), mixed stands (beech, spruce and fir), coppices of alder and riparian stands along the waters [42]. On meadows and hayfileds there are both native species, but also species that have exceeded their range from the steppe to silvo steppe [43].
Relatively close to the surface mining, urban areas without a high density of buildings are found, as well as rural areas in the form of fragmented settlements. Polluted land cover classes can also be found in the Jiului Valley due to the coal factories that existed nearby, especially before 1989.
2.2. Materials
The satellite images used are Landsat 5 TM and Landsat 8 OLI acquired in the period 1988–2017, downloaded for free from the United States Geological Survey (USGS) archive (https://earthexplorer.usgs.gov/). The level of image processing is 1T (georeferenced and orthorectified) and the projection system is Universal Transverse Mercator (UTM), datum WGS 84, zone 34N. The images are cloud free, acquired in the vegetation season and in the same moon, in clear atmospheric conditions and with low noise. By using near anniversary images, efectele produse de sun angle, phenology and atmospheric condition are reduced. Information on the Landsat imagery used in this study are shown in Table 1.
The cartographic material used for accuracy assessment of the classified images came from different sources. For the 1988 and 1998 images two sources have been used, such as, aerial images acquired in 1986 and 1997, and cadastral maps (scale 1:5000) drawn up in 1986 [44]. Accuracy assessment of classified images from 2008 and 2017 was based on colored ortophotos (scale 1:5000) drawn up in 2008 and 2017 by the National Agency for Cadastre and Land Registration (http://geoportal.ancpi.ro/) [44], Google maps images and field data collection for the image in 2017.
2.3. Image Pre-Processing
If two different features from a satellite image have the same color, their discrimination may be difficult, but if these features are different in terms of tone or brightness, their discrimination can be done easier [8]. In this study, some of the surface features had a similar spectral behavior on the mean signature (e.g., mined and built up). In order to much better discriminate these features, the images were atmospherically corrected by the dark object subtraction (DOS) method [45]. This technique has facility the reduction of additive effects caused by atmospheric haze, the result leading to an improvement in the distinction between surface features.
2.4. Images Classification
2.4.1. Support Vector Machine
SVMs represents a set of learning algorithms used for classification and regression. The theoretical framework was proposed by Vapnik & Chervonenkis (1971) and then by Vapnik (1999). SVMs are non-parametric classifiers. The results obtained by applying SVM application depends on the quality of the data training process. If the training data, consisting of a number of k samples, are represented as{Xi, yi}, i = 1, . . ., k where is an N-dimensional space and is a class label [48], then these classes are considered linearly separable [48] if there is a vector W perpendicular to the linear hyperplane and a scalar b showing the offset of the discriminating hyperplane from the origin [48,49]. For example, for two classes (class 1 represented by -1 and class 2 represented by +1), two hyperplanes can be used to discriminate the data point into representative classes [10]. These can be expressed by [10]:
WXi + b ≥ +1 for all y = +1, for example a member of class 1
WXi + b ≤ –1 for all y = –1, for example a member of class 2
The two hyperplanes are chosen so as to maximize the distance between two classes and not include vectors between them [10]. Mainly, the aim is to find the class into which the new data points can fall or partain [10].
SVM has been initially developed to identify the linear boundaries between classes. This limitation was addressed by projecting the feature space at a large dimension, under the assumption that a linear boundary can exists within a feature space with a large dimensional space [33]. This projection to a higher dimensionality represent the kernel trick. Kernel functions commonly used in SVMs can be broadly grouped into four groups, namely, linear, polynomial, radial basis function and sigmoid kernels [33] (Table 2).
Each kernel must have a different set of parameters which are user-controlled. These parameters are: C (cost), γ (width parameter), r and d, thus their optimization increases significantly the accuracy of the SVM solution. The C parameter define the amount of misclassification allowed for the data that is not separable from the training sample. Large values of the C parameter can lead to an over-fitting model, while increasing the values will affect the shape of the class-dividing hyperplane, which can affect the classification accuracy results [50]. The kernel width parameter (γ) influences the smoothing of the shape of the class-dividing hyperplane [50]. The r parameter represents the bias term while the d parameter is the polynomial degree in the case of using the polynomial kernel (Petropoulos et al., 2012). The most common degree is 2 (quadratic) because larger degrees tend to overfit the model.
In the case of a data set, in order to perform the best classification, it is necessary to find the optimal parameters [33]. One of the methods for optimizing these parameters is the grid search method [51]. The idea underlying the method is testing different pairs of parameters and the pair with the highest cross validation accuracy is the one searched for and selected [33]. The application of the method is carried out in two steps. In the first step, a coarser grid with an exponentially growing sequence is used (C, γ) (e.g., C = 2-5, 2-3 …, 215 and γ = 2-15, 2-13. . ., 23) and the cross-validation rate is calculated. In the second step, after identifying the optimal region on the grid (C, γ), a finer grid is searched for near the region, a better cross-validation rate is obtained and then the whole training set is trained again to generate the final classifier [33,51]. For the application of SVM in solving multiclass problems, one-against-all, one-against-one and all-together strategies were developed [52].
In this study SVM was applied using linear (SVM-LIN), polynomial (SVM-POL), radial base function (SVM-RBF) and sigmoid (SVM-SIG) kernels. The strategy for performing the classification was one-against-one. The kernels’ function parameters were determined by the grid search method using the cross-validation approach [51]. The optimal values of these parameters found following the application of the grid search method are presented in Table 2.
2.4.2. Maximum Likelihood
The MLC classification algorithm is based on the folowing equation [15]:
where D is the weighted distance (likelihood), c represents a particular class of interest, X is the vector of spectral signature for the candidate pixel from the testing data, Mc is the mean vector ofthe sample of class c from the training data, ac is the percent probability that any candidate pixel is a member of class c, Covc is the covariance matrix of the pixels in the sample of class c from the training data, ǀCovcǀ is the determinant of Covc (matrix algebra), Covc-1 is the inverse Covc (matrix algebra) [33], ln is the natural logarithm function, and T is the transposition function [15,17,53]. A pixel is assigned to class c, for which the likelihood is the highest or the least weighted distance [33].
2.4.3. Minimum Distance
MD decision rule determine the spectral distance between the measurement vector for the candidate pixel and the mean vector for each signature [15]. It is simple and fast to compute, requiring only the average of the vectors for each band resulted from the sample training data. Candidate pixels are assigned to the class that is spectrally closest to the sample mean. The computation relationship is [15]:
where n is the number of bands, i represent a particular band, c is a particular class, Xxyi represent data file value of pixel x, y in band i, µci is the mean of data file values in band i for the sample for class c, SDxyc is spectral distance from pixel x, y to the mean of class c [15].
After calculating the spectral distance for all possible classes of c, the class to which the candidate pixel is assigned is the class for which SD is the lowest [15].
2.4.4. Classification Scheme and Training Data
The land cover classification scheme consists of seven cover classes taking into account the land cover in the studied area (Table 3). In order to minimize the bias caused by using different combinations of bands, six bands were used for all applied algorithms (Table 1).
Trainig samples for spectral signature were collected by digitizing homogeneous areas from satellite images. The samples were collected using a RGB 752 combination found to discriminate the land cover classes in this case. In this combination, some areas which were found to be polluted on the 1988 image, were more easily highlighted as part of the class they represent. The samples were randomly selected in the known areas using the ‘region of interest’ (ROI) tools provided by ENVI software. Part of training samples for 2017 were collected by field trip using a Trimble R8S receptor [44]. The distribution of samples was aproximatively uniform and covered well the entire studied area. The pixel numbers included in training samples depended on the size of the land cover class therefore, in the case of less represented classes, training samples included fewer pixels (e.g., dump, water) (Table 4). For the built-up class, training samples were established more difficult because the area is fringed, the built-up surfaces alternating with pasture and agricultural land. The same training samples were used for all six algorithms.
2.4.5. Images Classification and Validation
Images classification was performed with ENVI software. The SVM classification was performed using the following kernels: linear, polynomial, RBF, and sigmoid. For each SVM algorithm the input data were satellite images, the file with previously collected spectral signatures (ROI files) and the specific optimized parameters (Table 2). For the MLC and MD, satellite images and ROI files were used. The same number of bands (6 bands) was used for all algorithms. Classified maps have been smoothed using a 3 x 3 majority filter to minimize the appearance of ‘salt and pepper’ from the images.
For the accuracy assessment, the confusion matrix was used. The parameters calculated for each classified map were: overall accuracy, producer accuracy, user accuracy and kappa coefficient (k). Overall accuracy and kappa coefficient were calculated with the help of the following relationships [55]:
where, nii represents the number of samples classified into classes i (i = 1, 2,…, k), ni+ signifies overall classifications in category i, and n+i denotes the overall reference data [55].
The accuracy assessment of classified images was carried out using 50 samples from each class, randomly distributed, other than those used to collect spectral signatures. They were generated in Erdas Image. In the case of images from 1988 and 1998, the overall accuracy was limited by the availability of data.
2.4.6. Change Detection
In order to compare the individually classified images and obtain “from-to” informations, the post-classification comparison (PCC) technique was applied. Land cover maps from different years, created independently, were compared with PCC using a mathematical pixel-by-pixel arrangement [56]. The areas of land cover changes for the entire period were established by crosstabulation, by substracting the 1988 classification map from the 2017 map. The result of applying this technique was displayed as a matrix showing the changes. In this study, the PCC technique has been used for four time periods: 1988–1998, 1998–2008, 2008–2017 and 1988–2017. The overall accuracy of crosstabulation maps was obtained by multiplying overall accuracy of independently classified images.
3. Results
3.1. Classification Results
For each year of the time series of satellite images, 6 images corresponding to the 6 classification algorithms were obtained, in total 24 classified maps were performed (Figure 2). In each classified image, all land cover classes defined by the classification were identified. There were no unclassified pixels. In Table 5 the exhaustive situation is presented, with the total surface covered by each land cover class, estimated by applying the six algorithms.
The studied landscape is complex and the estimated surfaces are different, depending on the classification algorithm. All algorithms estimated the largest surfaces in agricultural and forest classes. Agricultural class occupies an estimated area between 37.9% (MD, 2017) and 47.2% (SVM-POL, 1988) while forest class between 33.9% (MLC, 1988) and 49.2% (MD, 2017). Pasture class was estimated to occupy an area of 5.2% (SVM-LIN, 2008; SVM-POL, 2008; SMV-SIG, 2008, 2017) up to 13.3% (MLC, 1988). The mined and built-up classes, although they occupy smaller areas compared to agricultural, forest and pasture, were estimated in a large range. Thus, the mined class was estimated to occupy an area in range from 1.9% (MD, 2017) to 7.6% (SVM-SIG, 2008) while built up between 0.3% (SVM-SIG 1988, 2008) and 4.5% (MLC, 2017). The areas estimated by all algorithms as ocuppied by water and dump are rather small, below 2%, respectively below 0.9%. It was found that the areas estimated by SVM algorithms are close, with small differences between them, and between the areas estimated by SVM algorithms and common algorithms (MLC, MD) there are larger differences.
The results regarding accuracy assessment using the confusion matrix are preseted in Figure 3 and Figure 4. It can be observed that SVM-RBF has ensured the highest overall accuracy and kappa coefficient for all years studied, with range between 90.00% (1988) and 93.14% (2017), respectively between 0.8833 (1988) and 0.9200 (2017). The range in which the overall accuracies of SVMs are found is between 87.14% (SVM-SIG, 1988) and 93.14% (SVM-RBF, 2017). Common algorithms provided the lowest accuracy, with MD and MLC performing slightly over 80% (minimum 80.29% for MD in 1988). The results obtained are close to those highlighted by other studies. For example, Bouaziz et al. (2017) obtained, for SVM-RBF, an overall accuracy of 91.20%, followed by SVM-POL with 90.01%; as for MLC, the overall accuracy performed was about 86.00% while for the MD was 78.75% (kappa coefficient 0.68).
Part of land cover classes such as mined areas and built up raised the biggest issues in classification for all algorithms, especially MD and MLC. Therefore, one of the challenges was the discrimination of mined areas from built-up areas. In many areas, mined class was classified as built-up and vice-versa. Confusion was encountered especially in marginal, transitional, areas between land cover classes. Built up class had a low user's accuracy for MD and MLC algorithms (Figure 4) within this study site and sometimes was confused with other classes due to similarity of spectral features and small height variances [44]. The built-up class included urban areas that have spectral reflectance similar to that of bare soil and rocks [44]. In the case of rural areas, built-up was confused with agricultural class due to the fringed aspect of the area characterized by the alternation of built-up areas with the areas occupied by courtyards and gardens. To this matter, the moderate spatial resolution of the Landsat images (30 m) contributed too, making it impossible for the classes to be discriminated.
So, the biggest confusions were between built-up and mined classes in the case of MD and MLC algorithms. From the visual interpretation, it becomes obvious that the two algorithms produced classification errors in the form of overestimation of the built-up surface in all years, especially in 1988, at the expense of mined areas (Figure 5). These errors can be attributed to the spectral reflectance similar to built-up and mined areas and the limitation of MD and MLC classifiers. Also, on the 1988 image, there were quite extensive surfaces that were polluted at that time due to factories in the area and were classified as built-up (Figure 5a,b). These are the areas where the weakest results of the MD and MLC algorithms were obtained, greatly confusing the surfaces covered with vegetation, but quite polluted, with built-up and mined areas.
Confusions between forest, pasture and agricultural classes were made by all algorithms. In certain locations, mined areas were classified into pasture or agricultural classes. This is the case of marginal areas, of transition from one land class to another, especially in the case of a reclaimed mine. It was also found that the algorithms SVM-POL, SVM-LIN and SVM-SIG showed a slight underestimation of the built up areas and, at the same time, a slight overestimation of the mined areas. Although both MD and MLC algorithms overestimated built-up areas, MLC highlighted linear details better (especially on the 2008 image), such as paved roads, compared to MD. The SVMs algorithms identified these linear details but not continuously, and where they did it, they were identified as mined areas.
3.2. Land Cover Changes
The results show that in all analyzed periods there were land cover changes that affected all land cover classes (Table 5). All land cover changes were obtained based on classified images that showed the situation from the moment the images were taken. The changes have been in both directions, positive and negative.
The SVMs algorithms, with the exception of SVM-SIG, led to obtaining close values regarding the occurred changes. For example, for the period 1988-2017, the difference in terms of land cover changes related to the agricultural class was 0.6%, for forest 1.4% and for pasture 2.7%. Regarding mined and built-up areas, which raised the biggest problems, the differences between SVMs algorithms was 5.6%, and 9.8% respectively. In the case of SVM-SIG, land cover changes estimated were different for some classes. For example, over the entire period, this algorithm estimated a decrease of mined areas by 25.7%, other SVMs estimated an increase between 3.1% and 8.7%. The large difference, both in value and direction, comes from the estimation on the 1988 image of a large area of 5142.8 ha, in the mined class, compared to 3534.4 ha estimated by SVM-RBF. In the other years, the mined areas estimates were close to the other SVMs. The increase of the mined area was made by including the marginal areas of the mined areas with the other land cover classes and by classifying some small areas, dispersed throughout the studied area. Also, the algorithm estimated a decrease of the agricultural class by 4.8% compared to the decrease of 11.6-12.2% estimated by the other algorithms.
Common algorithms performed differently for some land cover classes, both among themselves and compared to SVMs. The MD showed that in the period 1988-2017, the mined surface decreased by 62.1% and MLC estimated a reduction by 37.7%. The built-up area estimated by MD shows a reduction of 13.0%, while MLC shows an increase of 59.8%. Bigger differences were also reported in the forest class, with MD estimating an increase of 33.0% and MLC of 15.5%, but also in the agricultural class where MD estimated a decrease of 4.2% and MLC an increase of 3.9%. So, not only are there great differences, but also the directions differ.
Compared to SVMs, both common algorithms classified very large areas in the built-up class. Taking SVM-RBF as reference, the estimated built-up area increases, e.g by MLC, were 514.6% (1988), 324.6% (1998), 317.3% (2008) and 390.3% (2017). The areas where large increases in the built-up area were reported on the 1988 image are those near the mined area and those polluted by the factories existing at that time. These locations were classified by both common algorithms as being part of the built-up class. The SVMs algorithms did not bring high confusions when classifying the land cover in these areas. In contrast, in the mined class, the MD and MLC algorithms classified smaller areas, except for the 1988 image when a larger area was classified. For example, MD classified in 1988 a surface being of 5296.9 ha, while MLC 5563.8 ha, even larger than those estimated by SVM-SIG. This determined that, for the period 1988-2017, MD and MLC show a decrease in mined areas.
Thus, the complexity of the landscape, given by the existence of mined areas located near built-up areas and especially polluted surfaces, sometimes when passing from one class to another, led to confusion between classes. Confusions were also made between other classes, forest with pasture and agricultural.
3.3. Mined Post-Classification Comparison
SVM-RBF classified images reported higher accuracy for all years, hence for PCC change detection, the results from this algorithm were used. Following the application of the PCC technique, maps were obtained which shows “from-to” information related to the conversions of land cover classes from analyzed periods. In Table 6 is presented the “from-to” matrix of mined class obtained based on SVM-RBF maps independently classified. The estimated changes based on the “from-to” matrix of mined class were in both directions, namely, from mined to land cover classes (forest, pasture, etc.) and from land cover classes (forest, pasture, etc.) to mined (Table 6) [44].
Results reveal that in the period 1988–1998 the largest increase in mined class area occured, of 3718.6 ha, meaning 205.2%. The increase over the 1988 mined class area is mainly due to the conversion of 2468.0 ha (66.4%) from agricultural, 499.6 ha (13.4%) from pasture and 412.3 ha (11.1%) from forest. It was the period with the biggest conversions that led to the increase of the mined class area.
In the period 1998-2008, the mined class area increased by only 290.7 ha (4.0%). This increase is given by the converting of a large area from forest to mined, but also of a reverse conversion, from mined to pasture. The other land cover classes (agricultural, built up, dump) did not contribute substantially to the conversion, areas at the end of the period remaining roughly the same as at the beginning of the period. It is the period in which there was the largest area in mined class (4088.3 ha). At the same time, surface mining was spread in the same locations.
The period 2008-2017 is characterized by a decrease in mined area with 3778.2 ha (50.1%). During this period, it took place only the conversion of 92.9 ha from forest to mined, the rest of the conversions being from mined in other land cover classes (forest, pasture, etc). The period is characterized by the fact that mined areas were no longer exploited and began to be reclaimed. The largest reclaimed surface came from the conversion of 2764.2 ha mined area in agricultural and 501.6 ha in pasture. Although these conversions happened, during the whole period there were still 2429.8 ha mined areas.
Between 1988 and 2017, mined areas increased by 6.5%, the increase being an average one rather than a linear. During this period, only 13.3% of mined class did not change. Conversions to and from mined areas took place, the location of these areas being shown in Figure 6. For example, from agricultural to mining there were converted 1917.9 ha, while from mined to agricultural 1867.5 ha. Reverse conversions occurred during the 29 years because certain locations with mined areas were reclaimed and others, with agricultural, were converted into surface mining operations.
4. Discussion
4.1. Accuracy Assessment
Confusion matrix was used to perform accuracy assessment on Landsat images from years 1988, 1998, 2008 and 2017. The comparison of the results revealed that the SVM-RBF algorithm provided the highest values for overall accuracy and for kappa coefficient and the MD algorithm the lowest. Comparing the SVMs algorithms between then, it was found that SVM-RBF improved the overall accuracy classification by almost 5.1% for Landsat 5 TM and by 2.8% for Landsat 8 OLI. The results obtained are similar to those of other studies [8] that found improvements of 6% and 3% for Landsat 5 and Landsat 8 images in detecting changes in open-cast coal mining areas. By comparing the SVMs algorithms with MD and MLC, it was found that the former had provided a better overall accuracy by 12% and 10%, respectively.
It was found that SVMs exceeded MD and MLC in the classification of features that have similar spectral behavior encountered in a complex landscape. Within the SMVs, an improvement up to 19.1% was observed in the mined area classification and 12% in the built-up area classification. Because SVMs algorithms are known for the high accuracy ensured in the case of a smaller number of training samples [8], this determined that SVMs algorithms exceed MLC and MD, ensuring higher classification accuracy for each class. Moreover, due to the fact that Landsat 8 OLI had a higher spectral and radiometric resolution compared to Landsat 5 TM, led to an improvement in the apparent reflectance of surface features. This specific characteristic has led to higher accuracies for all algorithms in the case of the Landsat 8 OLI image.
The accuracies achieved in the classification led to different estimates of the land cover classes surfacea and, implicitly, to obtaining different results when assessing the land cover changes. At the same time, it is also possible that not all land cover changes have been captured on satellite images. The 10-year interval between images of the time series, considered quite long, probably has contributed to the appearance of some conversions that could be considered anomalous. In this situation are found the surfaces where conversions between all land cover classes occurred, in the same time period. Moreover, the studies carried out in this direction recommend that the interval between the time series images be shortened [51] and some studies even specify the number of years (5 years) [59]. Considering the location of the studied area, in the analyzed case, no qualitative images (e.g., without cloud covering) taken at a shorter interval could be found in the USGS archive.
4.2. Comparing Performance of Algorithms
Maintaining the same training samples performed for each land cover class allowed to evaluate the relative performance for four advanced algorithms SVMs and two common algorithms, MLC and MD, when classifying a complex landscape with surface mining from Jiu Valley, Romania.
The classification accuracy produced by SVMs showed slight variations that may be due to the choice of the kernel function and its parameters. Considering the overall accuracies, SVM-RBF algorithm worked best followed by SVM-POL, SVMLIN and SVM-SIG (Figure 3). It is possible that SVM-RBF and SVM-POL, being non-linear kernels, to have ensured better results compared to SVM-LIN because the class boundaries are non-linear or overlapping. The studies that used machine learning algorithms investigated different SVMs parameters and showed that even contradictory results can be achieved [7,50,60,61]. For example, Melgani & Bruzzone (2004) and Maxwell et al. (2014) considered that SVMs are robust to parameter settings. On the one hand, Maxwell et al. (2014) noted that parameter optimization resulted in an improvement of classification accuracy with only 0.1% for mining and mine reclamation mapping. On the other hand, Foody & Mathur (2004) have shown that the γ parameter had a large impact on classification accuracy, with accuracies ranging from less than 70% to over 90%. Similarly, Huang et al. (2002) have suggested that the choice of RBF or polynomial kernel affects the shape of the decision boundary. In case of using RBF kernel, they showed that the classification errors vary with the parameter γ, especially when three predictor variables were used instead of seven. For the polynomial kernel, the authors have shown that the classification accuracy increases with the order of the polynomial. Thus, the slightly different accuracies provided by SVMs in this study, may come as a result of the parameter setting even though they were optimized. In the case of the 2017 image, the best accuracy was established. It is possible that this accuracy is also related to the superior characteristics of the Landsat OLI sensor compared to Landsat 5 TM, something also noted in other studies [57].
The major differences between SVM algorithms and between them and the MLC and MD algorithms appeared in the discrimination between mined classes and other classes, in particular, built-up (Figure 5). The SVMs algorithms, mainly SVM-RBF, have been able to better discriminate between mined areas and built-up areas, without major difficulties in learning the support vectors. However, the compex characteristics of built-up areas in contrast to areas such as highly homogeneous agricultural areas, forest or pasture areas, presented some intrinsic classification difficulties for SVMs as well. It was the case of some locations represented by fringe areas, characterized by the alternation of built-up with agricultural or pasture. In such situations, the classification accuracy for built-up areas remained inferior to that of agricultural areas, an aspect also found in other studies [3,62,63].
The accuracy sensitivity of the SVM classifications to training set size indicates the need to include outlying cases for the training set, which yield adequate support vectors. Althouth in the case of SVMs it is not necessary a large training sample to estimate the statistical distribution, it is still essential that the training sample includes useful support vectors that adequately define the boundaries of the class [60]. In this case, the probability of finding useful support vectors is higher in a large training sample than in a small sample [60]. Regarding mined and built-up classes, the training samples size was smaller considering the smaller area they occupy and their distribution in the studied area. If the training samples size had been larger, it would have increased the probability of including mixed pixels. The results have shown that in general, a balances sample is preferable.
The quality of training data has an impact on the accuracy of SVMs. For example, Foody et al. (2016) noted that SVM accuracy dropped by 8% when 20% of the training data were mislabelled, emphasizing that, even for rubst algorithms, training data quality is important. The accuracy of the MLC and MD algorithms also depended on the quality of the training data. It is possible that the training data given was not entirely qualitative. In this case, mined areas and built-up areas were founded where the probability of including them in the training sample and mixed pixels was higher. Mixed pixels are common in Landsat data due to the heterogeneity of landscape and the limitation of 30 m spatial resolution data. By using only, the spectral signature of the features, the existence of a large number of mixed pixels in a training sample could lead to its degradation. In these conditions, mixed spectral pixels had a negative impact on the classification results when MLC and MD were applied.
Also, in the present study, it is possible that the numbers of training samples were sufficient for SVMs but insufficient for the common algorithms that assured poor accuracy. Moreover, the specialized literature shows that fewer training samples can be used for SVMs and more for common algorithms [60]. In the present study, the training samples were larger for forest, pasture and agriculture and smaller for the other land cover classes. In this case, it is possible that on the image from 1988, where the biggest errors have been reported in the cases of MD and MLC, the training samples that represented 15.7% of the built-up area, respectively 13.7% of the mined area classified by SVM-RBF (considered as reference), may not have been sufficient. Instead, for the images from 1998 and 2008, where the SVMs algorithms estimated close mined and built-up surfaces, the weight of training samples was higher. For example, training samples for mined in 1998 represented 19.3% and for built-up 19.2 %, and for the image from 2008, training samples of mined areas represented 24.9% and built-up 12.8%. Thus, the percentage of training samples compared to the occupied surface has generally been shown to have a great impact on the classification accuracy. Some studies have noted that the training data can have a greater impact than the used algorithm [7].
Some studies suggest that SVMs algorithms are insensitive to data sizes, increasing or decreasing of band numbers taken into the classification, and thus, the number of bands would not affect accuracy [65]. In other studies, it is shown that the classification accuracy using SVMs can increase with the decrease of the number of bands included in the classification [66]. In the present study, the effect of the number of bands on classification accuracy was not investigated but, since it was small (6 bands), it can be considered that the number of bands was not a decisive factor influencing classification accuracy.
Parametric classifiers assume that the data is representative and normally distributed. In the real world, most data collected from the ground do not obey a typical model (e.g., Gaussian mixture, linearly separable, etc.), which is also the case with land cover classes. As such, parametric classifiers, MD and MLC, proved to provide poor accuracy because there was not a normal distribution of land cover data, the landscape being heterogeneous and complex. Also, since there is a lot of uncertainty in the land cover surfaces distribution, they could not be described based on data distribution. In these situations, non parametric SVM algorthms gave better results.
The accuracy provided by the MD algorithm was the weakest. It did not take into account the variability of the classes which made that wide differences between the variance of the classes to lead to misclassifications. When the landscape is complex, the parametric classifiers often produce ‘noisy’ results [2]. Moreover, the algorithm was very fast compared to SVMs algorithms, being one of the most used algorithms due to its mathematical simplicity, requiring only mean vectors for each band in the training data.
4.3. Assessing Land Cover Changes
In addition to the results regarding maps change, an increase in surface mining by 231.1 ha was highlighted in the entire period (1988-2017) in the studied area. The fluctuation in mined areas during the approximately three decades was high, registering two peaks in the first two periods (1988-1998, 1998-2008) followed by a decrease in the third (2008-2017). This was due to the transition from underground mining to surface mining after 1989. The changes led to a degradation of the landscape in the area [44]. The relief was modified by the appearance of new forms, both positive (sterile dumps) and, negative (remaining pits of the quarries) [44,67]. Because of the surface mining activity, the hydrological processes were affected by the removal of top soil vegetative cover. There have been also landslides, various geomechanical phenomena such as subsidence, changes in the quality and quantity of surface and underground waters [67].
Therefore, the assessment and monitoring of land cover changes in such complex landscapes, with surface mining, is a priority. Carrying out such studies can contribute to the planning of activities both in surface mining operations and in reclamining abandoned surfaces.
5. Conclusions
The main aim of the study was to compare the performance of four advanced algorithms and two common algorithms for mapping and assessing land cover changes in a complex landscape with surface mining. By using the same training data set, the study results show the achievement of different accuracies in the classification of Landsat satellite images. The ability of SVM algorithms to generate an optimal separating hyperplane led to a better performance of them compared to MD and MLC algorithms. Within the SVM algorithms, the accuracies were slightly different, the best performing being SVM-RBF, the final results depending on the chosen kernel, the optimization of the selected kernel parameters and the method used to generate the SVM. Accuracy assessment based on the confusion matrix has revealed that classes with overlapping spectral reflectance values on the signature plot were classified much more accurately by SVM algorithms. Among the common algorithms, the MLC algorithm performed better than MD. It was found that these algorithms do not give reliable results in complex landscapes compared to SVMs. The disadvantage of both algorithms’types, common and advanced, is the fact that they both operate at a pixel level and not at a sub-pixel level. This can cause a reduction in accuracy due to mixed pixels when using medium spatial resolution satellite images.
Another objective of the study was to assess changes, mainly, the changes in mined areas over a period of 29 years, based on the classification algorithm that proved, after the assessment, to ensure the best accuracy, respectively SVM-RBF. PCC technique was used in the study in order to obtain maps change and “from – to” information. Results have shown that the detection of changes from satellite images in a complex landscape is a complicated process which requires a unique approach applicable to all cases. It was observed that during the studied period, mined areas increased on average by 6.5%, with very large increases and decreases in the intermediate periods. The main drivers for these changes were the shift from underground mining to surface mining [44]. The expansion of surface mining affected the landscape both by changing the relief in the area and by degrading the ecological balance.
The assessment of changes in areas with surface mining using satellite images from different time periods can be a suitable indicator for quantifying and understanding human actions on the environment. Modern classification techniques through machine learning algorithms such as SVM, can ensure high accuracies in the classification of Landsat satellite images, used afterwards in assessing changes in complex landscapes with surface mining.
Funding
This research received no external funding.
Acknowledgments
We would like to thank the USGS website for the Landsat imagery, Transilvania University of Brașov for the aerial photos, the National Agency for Cadastre and Land Registration for the colour orthophotos, and Trimble Inc. for the Trimble R8S receptor and the Trimble Business Center educational software. Also, we thank to reviews for the observations made that determined the quality improvement of the article.
Conflicts of Interest
The author declare no conflict of interest.
References
- Khatami, R.; Mountrakis, G.; Stehman, S. V. A meta-analysis of remote sensing research on supervised pixel-based land-cover image classification processes: General guidelines for practitioners and future research. Remote Sens. Environ. 2016, 177, 89–100. [Google Scholar] [CrossRef]
- Lu, D.; Weng, Q. A survey of image classification methods and techniques for improving classification performance. Int. J. Remote Sens. 2007, 28, 823–870. [Google Scholar] [CrossRef]
- Ma, L.; Li, M.; Ma, X.; Cheng, L.; Du, P.; Liu, Y. A review of supervised object-based land-cover image classification. ISPRS J. Photogramm. Remote Sens. 2017, 130, 277–293. [Google Scholar] [CrossRef]
- Rogan, J.; Miller, J. Integrating GIS and remotely sensed data for mapping forest disturbance and change. In Understanding forest disturbance and spatial pattern: remote Sensing and GIS approaches; Wulder, M. A. & Franklin, S.E., Ed.; CRC Press, 2006; pp. 133–172.
- Rodriguez-Galiano, V.F.; Ghimire, B.; Rogan, J.; Chica-Olmo, M.; Rigol-Sanchez, J.P. An assessment of the effectiveness of a random forest classifier for land-cover classification. ISPRS J. Photogramm. Remote Sens. 2012, 67, 93–104. [Google Scholar] [CrossRef]
- Hall, F.G.; John, R.T.; Engman, E.T. Status of remote sensing algorithms for estimation of land surface state parameters. Remote Sens. Environ. 1995, 51, 138–156. [Google Scholar] [CrossRef]
- Huang, C.; Davis, L.S.; Townshend, J.R.G. An assessment of support vector machines for land cover classification. Int. J. Remote Sens. 2002, 23, 725–749. [Google Scholar] [CrossRef]
- Karan, S.K.; Samadder, S.R. Accuracy of land use change detection using support vector machine and maximum likelihood techniques for open-cast coal mining areas. Environ. Monit. Assess. 2016, 188. [Google Scholar] [CrossRef]
- Karan, S.K.; Samadder, S.R. A comparison of different land-use classification techniques for accurate monitoring of degraded coal-mining areas. Environ. Earth Sci. 2018, 77, 1–15. [Google Scholar] [CrossRef]
- Otukei, J.R.; Blaschke, T. Land cover change assessment using decision trees, support vector machines and maximum likelihood classification algorithms. Int. J. Appl. Earth Obs. Geoinf. 2010, 12. [Google Scholar] [CrossRef]
- Shao, Y.; Lunetta, R.S. Comparison of support vector machine, neural network, and CART algorithms for the land-cover classification using limited training data points. ISPRS J. Photogramm. Remote Sens. 2012, 70, 78–87. [Google Scholar] [CrossRef]
- Szuster, B.W.; Chen, Q.; Borger, M. A comparison of classification techniques to support land cover and land use analysis in tropical coastal zones. Appl. Geogr. 2011, 31, 525–532. [Google Scholar] [CrossRef]
- Townshend, J.R. Land cover. Int. J. Remote Sens. 1992, 13, 1319–1328. [Google Scholar] [CrossRef]
- Vorovencii, I.; Muntean, D. Evaluation of supervised classification algorithms for Landsat 5 TM images. RevCAD; J. Geod. Cadas. 2012, 11, 229–238. [Google Scholar]
- ERDAS ERDAS Field Guide; Fifth Edit.; ERDAS® , Inc.: Atlanta, 1999.
- Lillesand, T.M.; Kiefer, R.W. Remote Sensing and Image Interpretation; John Wiley and Sons Ltd.: New York, 1999. [Google Scholar]
- Mather, P.M. Computer processing of remotely sensed images: An introduction; 3rd Editio.; John Wiley and Sons Ltd., 2005. 2005.
- Richards, J.A. Remote sensing digital image analysis: An introduction; 2nd Editio.; Springer Berlin, Heidelberg, 2013; Vol. 9783642300; ISBN 9783642300622.
- Sabins, F.F. Remote sensing. Principles and interpretation; 3th Editio.; W.H. Freeman and Company: New York, 1997.
- Lawrence, R.; Bunn, A.; Powell, S.; Zambon, M. Classification of remotely sensed imagery using stochastic gradient boosting as a refinement of classification tree analysis. Remote Sens. Environ. 2004, 90, 331–336. [Google Scholar] [CrossRef]
- Pal, M.; Mather, P.M. An assessment of the effectiveness of decision tree methods for land cover classification. Remote Sens. Environ. 2003, 86, 554–565. [Google Scholar] [CrossRef]
- Adelabu, S.; Mutanga, O.; Adam, E. Evaluating the impact of red-edge band from Rapideye image for classifying insect defoliation levels. ISPRS J. Photogramm. Remote Sens. 2014, 95, 34–41. [Google Scholar] [CrossRef]
- Mitra, P.; Uma Shankar, B.; Pal, S.K. Segmentation of multispectral remote sensing images using active support vector machines. Pattern Recognit. Lett. 2004, 25, 1067–1074. [Google Scholar] [CrossRef]
- Foody, G.M. Approaches for the production and evaluation of fuzzy land cover classification from remotely sensed data. Int. J. Remote Sens. 1986, 17, 1317–1340. [Google Scholar] [CrossRef]
- Lucieer, V. Object-oriented classification of sidescan sonar for mapping benthic marine. Int. J. Remote Sens. 2008, 29, 905–921. [Google Scholar] [CrossRef]
- Hay, G.J.; Blaschke, T.; Marceau, D.J.; Bouchard, A. A comparison of three image-object methods for the multiscale analysis of landscape structure. ISPRS J. Photogramm. Remote Sens. 2003, 57, 327–345. [Google Scholar] [CrossRef]
- Pal, M. Advanced algorithms for land use and cover classification. In Advances in mapping from remote sensor imagery; Li, X.Y.& J., Ed.; CRC Press, 2012; pp. 69–90.
- Roscher, R.; Förstner, W.; Waske, B. I2VM: Incremental import vector machines. Image Vis. Comput. 2012, 30, 263–278. [Google Scholar] [CrossRef]
- Tigges, J.; Lakes, T.; Hostert, P. Urban vegetation classification: Benefits of multitemporal RapidEye satellite data. Remote Sens. Environ. 2013, 136, 66–75. [Google Scholar] [CrossRef]
- Löw, F.; Michel, U.; Dech, S.; Conrad, C. Impact of feature selection on the accuracy and spatial uncertainty of per-field crop classification using Support Vector Machines. ISPRS J. Photogramm. Remote Sens. 2013, 85, 102–119. [Google Scholar] [CrossRef]
- Ustuner, M.; Sanli, F.B.; Dixon, B. Application of support vector machines for landuse classification using high-resolution rapideye images: A sensitivity analysis. Eur. J. Remote Sens. 2015, 48, 403–422. [Google Scholar] [CrossRef]
- Lu, D.; Mausel, P.; Batistella, M.; Moran, E. Comparison of land-cover classification methods in the Brazilian Amazon basin. Photogramm. Eng. Remote Sensing 2004, 70, 723–731. [Google Scholar] [CrossRef]
- Kavzoglu, T.; Colkesen, I. A kernel functions analysis for support vector machines for land cover classification. Int. J. Appl. Earth Obs. Geoinf. 2009, 11, 352–359. [Google Scholar] [CrossRef]
- Dietterich, T.G. Approximate statistical tests for comparing supervised classification learning algorithms. Neural Comput. 1998, 10, 1895–1923. [Google Scholar] [CrossRef]
- Mantero, P.; Moser, G.; Serpico, S.B. Partially supervised classification of remote sensing images through SVM-based probability density estimation. IEEE Trans. Geosci. Remote Sens. 2005, 43, Article–559e570. [Google Scholar] [CrossRef]
- DeFries, R.S.; Chan, J.C.W. Multiple criteria for evaluating machine learning algorithms for land cover classification from satellite data. Remote Sens. Environ. 2000, 74, 503–515. [Google Scholar] [CrossRef]
- Rogan, J.; Franklin, J.; Stow, D.; Miller, J.; Woodcock, C.; Roberts, D. Mapping land-cover modifications over large areas: A comparison of machine learning algorithms. Remote Sens. Environ. 2008, 112, 2272–2283. [Google Scholar] [CrossRef]
- Demirel, N.; Emil, M.K.; Duzgun, H.S. Surface coal mine area monitoring using multi-temporal high-resolution satellite imagery. Int. J. Coal Geol. 2011, 86, 3–11. [Google Scholar] [CrossRef]
- Karan, S.K.; Samadder, S.R. Improving accuracy of long-termland-use change in coal mining areas using wavelets and Support Vector Machines. Int. J. Remote Sens. 2018, 39, 84–100. [Google Scholar] [CrossRef]
- Greșiță, C.I. Expert system used for monitoring the behaviour of hydrotechnical constructions. REVCAD J. Geod. Cadastre 2011, 11, 75–84. [Google Scholar]
- Greșiță, C.I. Surveying methods to studying the behaviour of dams (in Romanian); Tehnopress Publishing House: Iasi, 2013.
- Tudoran, G.M. Regulations regarding the management of forests included in natural protected areas. Bull. Transilv. Univ. Braşov, Ser. II For. Wood.Industry. Agric. Food Eng. 2013, 55, 35–38. [Google Scholar]
- Tudoran, G.M.; Zotta, M. Adapting the planning and management of Norway spruce forests in mountain areas of Romania to environmental conditions including climate change. Sci. Total Environ. 2020, 698, 133761. [Google Scholar] [CrossRef]
- Vorovencii, I. Changes detected in the extent of surface mining and reclamation using multitemporal Landsat imagery: a case study of Jiu Valley, Romania. Env. Monit Assess 2021, 193, 30. [Google Scholar] [CrossRef] [PubMed]
- Heumann, B.W. An object-based classification of mangroves using a hybrid decision tree-support vector machine approach. Remote Sens. 2011, 3, 2440–2460. [Google Scholar] [CrossRef]
- Vapnik, W.N.; Chervonenkis, A.Y. On the uniform convergence of the relative frequencies of events to their probabilities. Theory Probab. its Appl. 1971, 17, 264–280. [Google Scholar] [CrossRef]
- Vapnik, W.N. An overview of statistical learning theory. IEEE Trans. Neural Networks 1999, 10, 988–999. [Google Scholar] [CrossRef]
- Nyamekye, C.; Ghansah, B.; Agyapong, E.; Kwofie, S. Mapping changes in artisanal and small-scale mining (ASM) landscape using machine and deep learning algorithms. - a proxy evaluation of the 2017 ban on ASM in Ghana. Environ. Challenges 2021, 3, 100053. [Google Scholar] [CrossRef]
- Osuna, E.; Freund, R.; Girosi, F. An improved training algorithm for support vector machines. In Proceedings of the Neural Networks for Signal Processing VII. Proceedings of the 1997 IEEE Workshop; New York, 1997; pp. 276–285.
- Melgani, F.; Bruzzone, L. Classification of hyperspectral remote sensing images with support vector machines. IEEE Trans. Geosci. Remote Sens. 2004, 42, 1778–1790. [Google Scholar] [CrossRef]
- Petropoulos, G.; Partsinevelos, P.; Mitraka, Z. Change detection of surface mining activity and reclamation based on a machine learning approach of multitemporal Landsat TM imagery. Geocarto Int. 2012, 28, 323–342. [Google Scholar] [CrossRef]
- Hsu, C.W.; Chang, C.C.; Lin, C.J. A practical guide to support vector classification; Taipei, 2016.
- Weston, J.; Watkins, C. Multi-class support vector machines; London, 1998.
- Schrader, S.; Pouncey, R. Erdas field guide; 4th editio.; Erdas Inc.: Atlanta, 1997.
- Kavzoglu, T.; Reis, S. Performance analysis of maximum likelihood and artificial neural network classifiers for training sets with mixed pixels. GIScience Remote Sens. 2008, 45, 330–342. [Google Scholar] [CrossRef]
- Congalton, R.G.; Green, K. Assessing the accuracy of remotely sensed data. Principles and Practices (3th ed.); CRC Press, 2019.
- Toosi, N.B.; Soffianian, A.R.; Fakheran, S.; Pourmanafi, S.; Ginzler, C.; Waser, L.T. Comparing different classification algorithms for monitoring mangrove cover changes in southern Iran. Glob. Ecol. Conserv. 2019, 19. [Google Scholar] [CrossRef]
- Bouaziz, M.; Eisold, S.; Guermaz, E. Semiautomatic approach for land cover classification: a remote sensing study for arid climate in southeastern Tunisia. Euro-Mediterranean J. Environ. Integr. 2017, 2, Article–24. [Google Scholar] [CrossRef]
- Townsend, P.A.; Helmers, D.P.; Kingdon, C.C.; McNeil, B.E.; de Beurs, K.M.; Eshleman, K.N. Changes in the extent of surface mining and reclamation in the Central Appalachians detected using a 1976–2006 Landsat time series. Remote Sens. Environ. 2009, 113, 62–72. [Google Scholar] [CrossRef]
- Foody, G.M.; Mathur, H. A relative evaluation of multiclass image classification by Support Vector Machines. IEEE Trans. Geosci. Remote Sens. 2004, 42, 1335–1343. [Google Scholar] [CrossRef]
- Maxwell, A.E.; Warner, T.A.; Strager, M.P.; Pal, M. Combining RapidEye satellite imagery and lidar for mapping of mining and mine reclamation. Photogramm. Eng. Remote Sensing 2014, 80, 179–189. [Google Scholar] [CrossRef]
- Myint, S.W.; Gober, P.; Brazel, A.; Grossman-Clarke, S.; Weng, Q. Per-pixel vs. object-based classification of urban land cover extraction using high spatial resolution imagery. Remote Sens. Environ. 2011, 115, 1145–1161. [Google Scholar] [CrossRef]
- Xu, H.Q.; Li, P.J.; Zhang, Y.; Wang, J.F.; Coops, N.C. Urban land cover classification from very high resolution imagery using spectral and invariant moment shape information. Can. J. Remote Sens. 2010, 36, 248–260. [Google Scholar] [CrossRef]
- Foody, G.M.; Pal, M.; Rocchini, D.; Garzon-Lopez, C.X.; Bastin, L. The sensitivity of mapping methods to reference data quality: Training supervised image classifications with imperfect reference data. ISPRS Int. J. Geo-Information 2016, 5. [Google Scholar] [CrossRef]
- Pal, M.; Mather, P.M. Some issues in the classification of DAIS hyperspectral data. Int. J. Remote Sens. 2006, 105, 2895–2916. [Google Scholar] [CrossRef]
- Weston, J.; Mukherjee, S.; Chapelle, O.; Pontil, M.; Poggio, T.; Vapnik, V. MIT Open Access Articles Feature Selection for SVMs Feature Selection for SVMs. 2000.
- Fodor, D.; Lazăr, M. Ecological occupation and rehabilitation of land in the Oltenia area (in Romanian). AGIR Bull. 2006, 3, 27–31. [Google Scholar]
Figure 1.
Location of the study area.
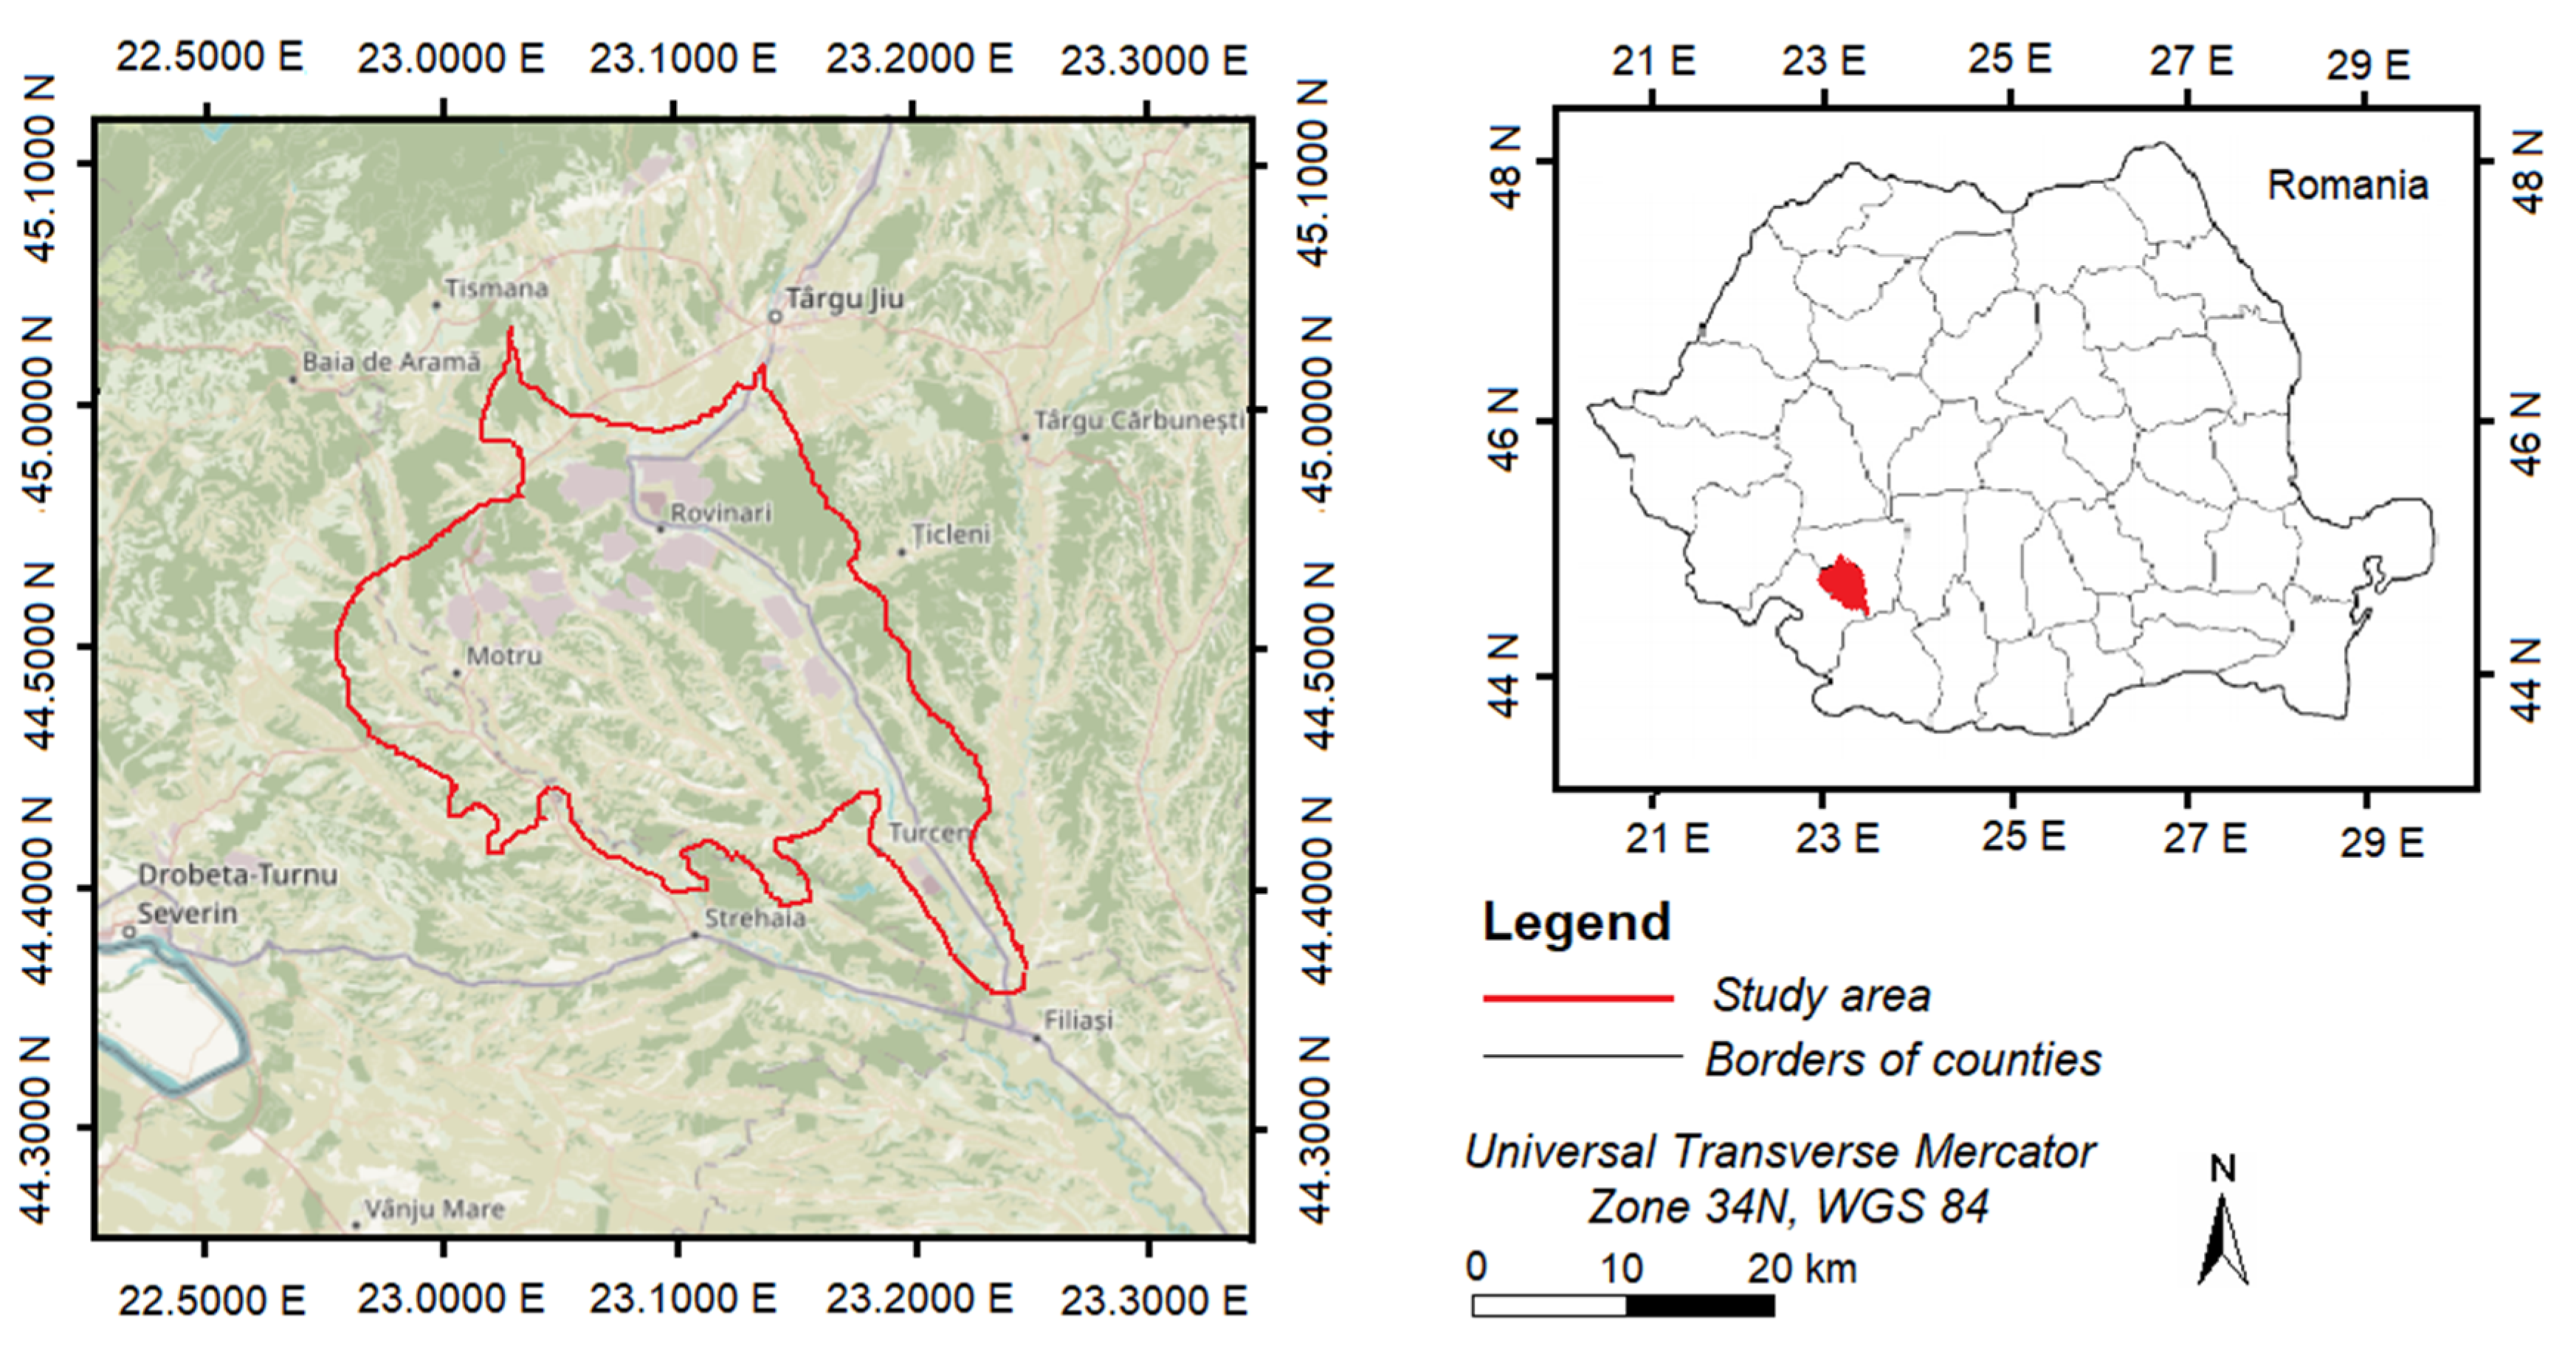
Figure 2.
Images obtained after applying the six classification algorithms:.a. MD; b. MLC; c. SVM-BRF; d. SVM-LIN; e. SVM-POL; f. SVM-SIG.
Figure 2.
Images obtained after applying the six classification algorithms:.a. MD; b. MLC; c. SVM-BRF; d. SVM-LIN; e. SVM-POL; f. SVM-SIG.
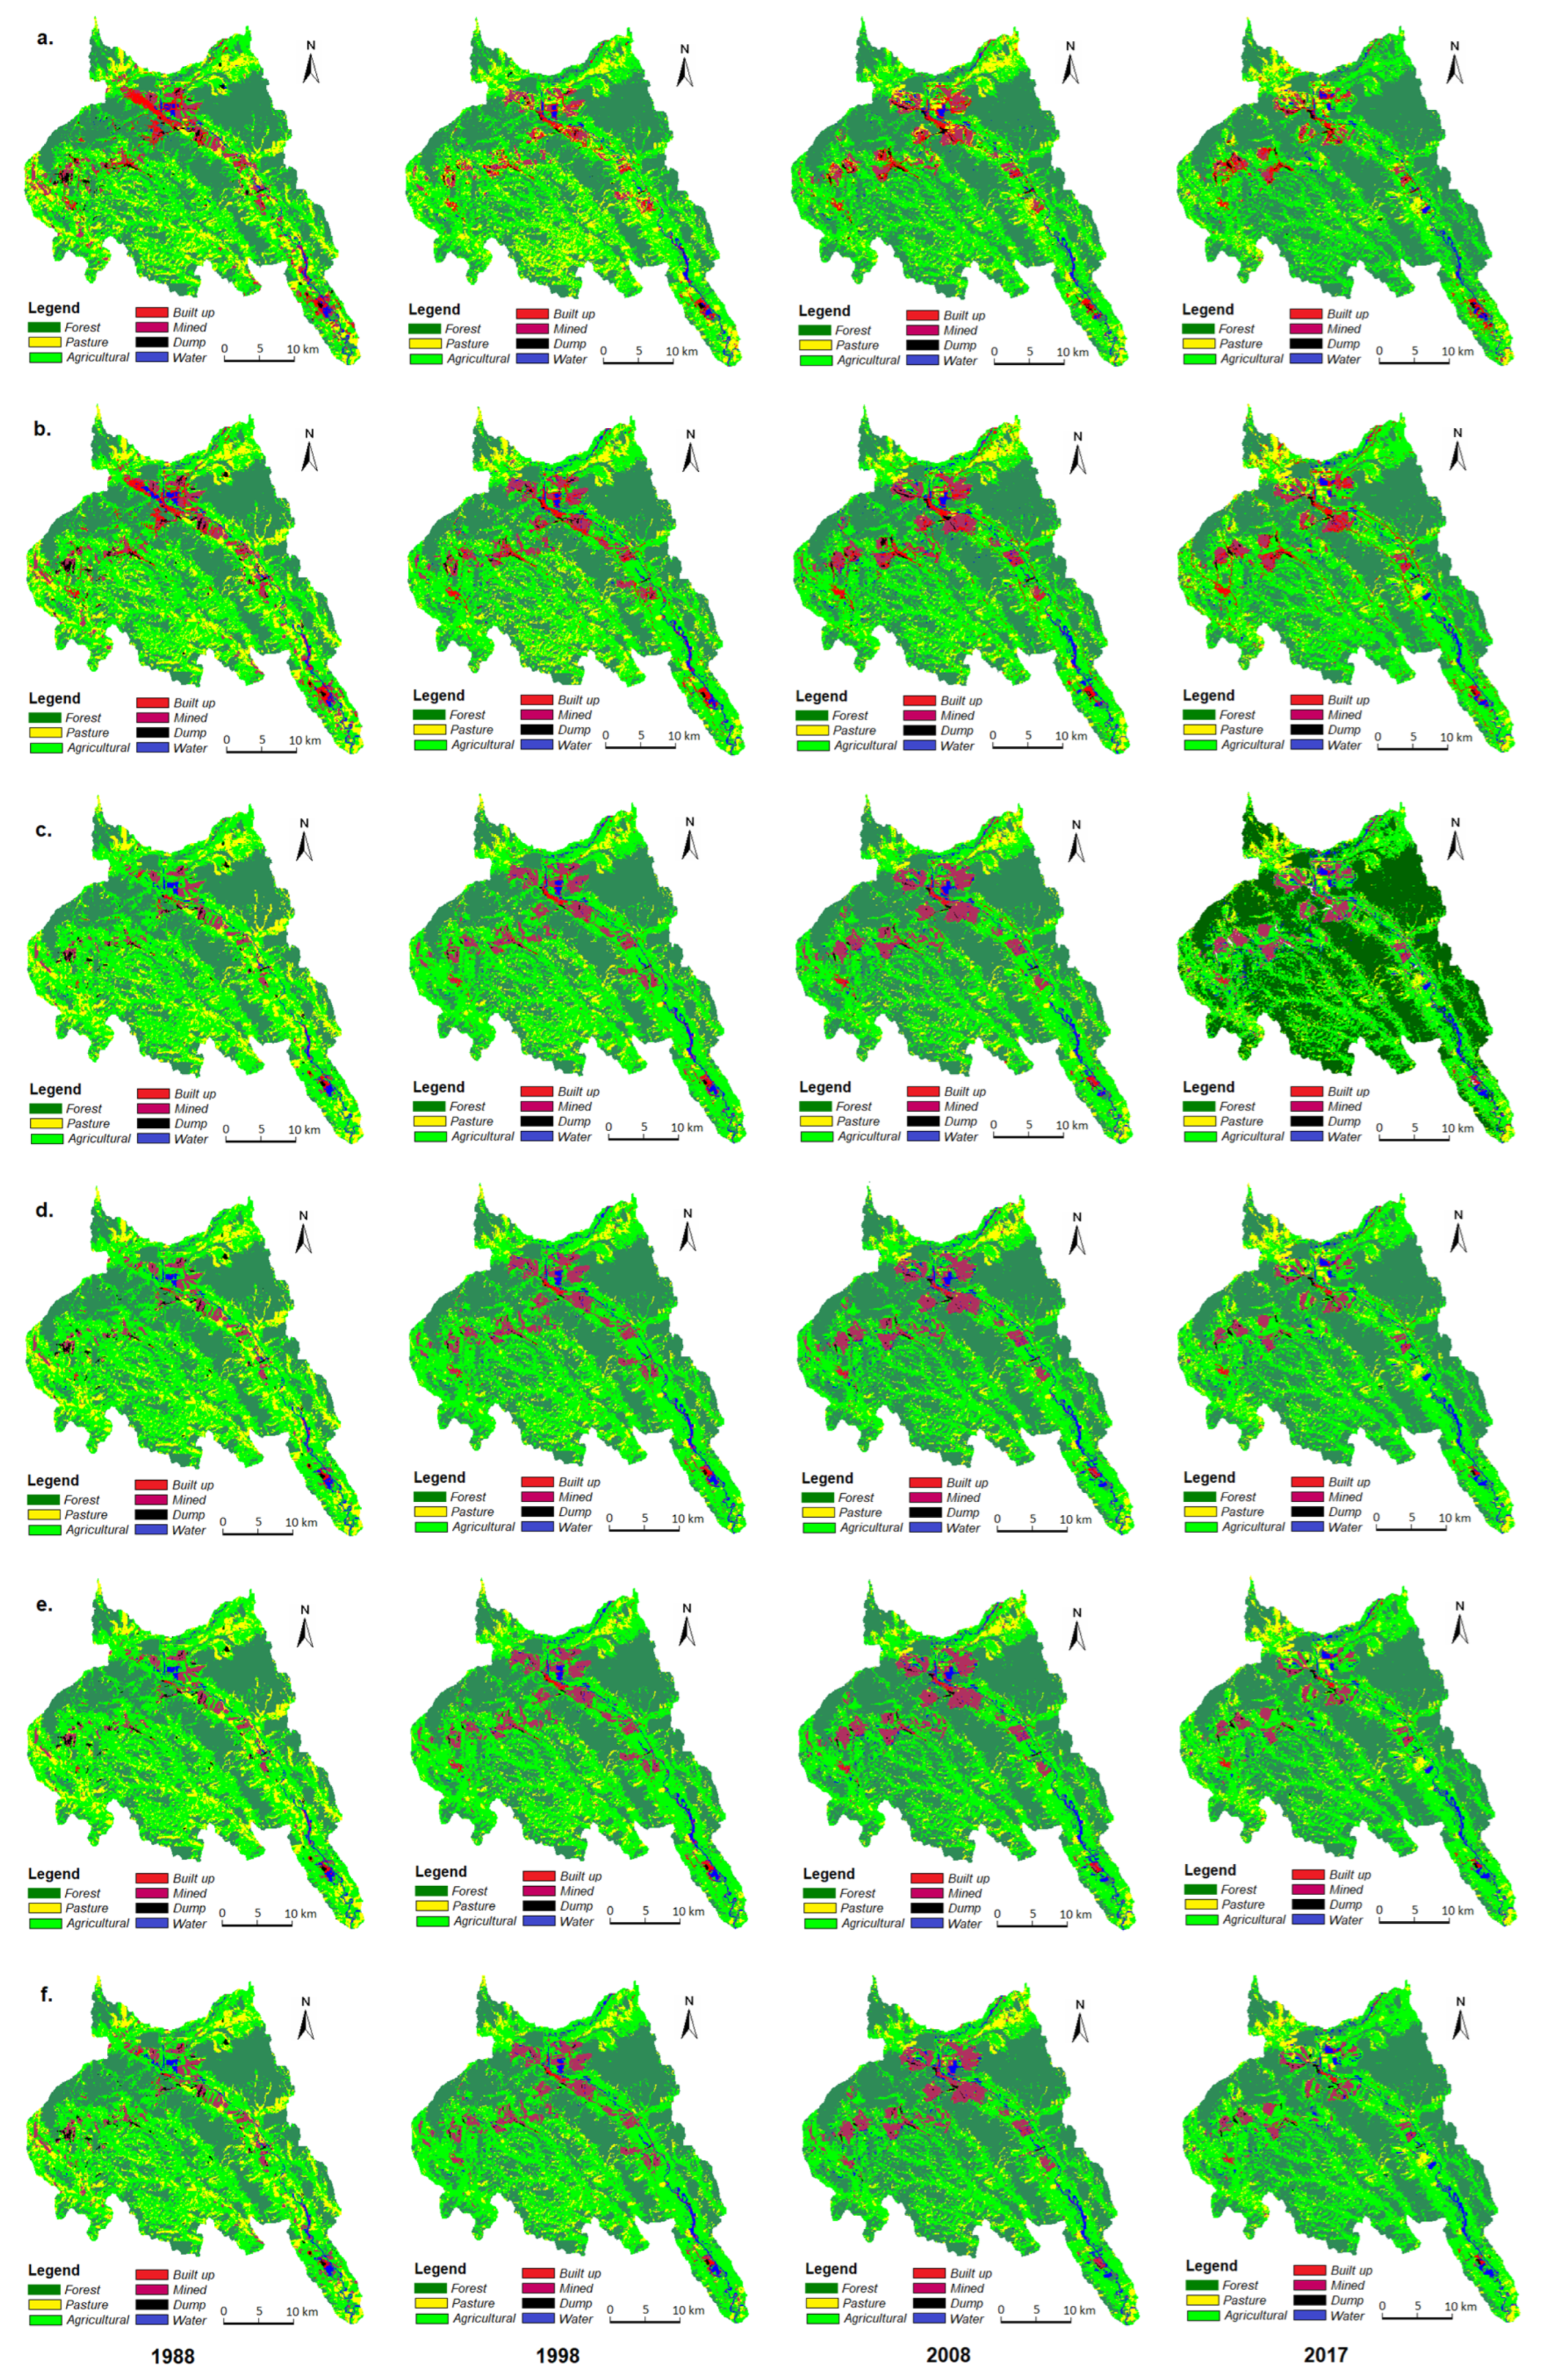
Figure 3.
Overall accuracies and kappa coefficients of classified images.
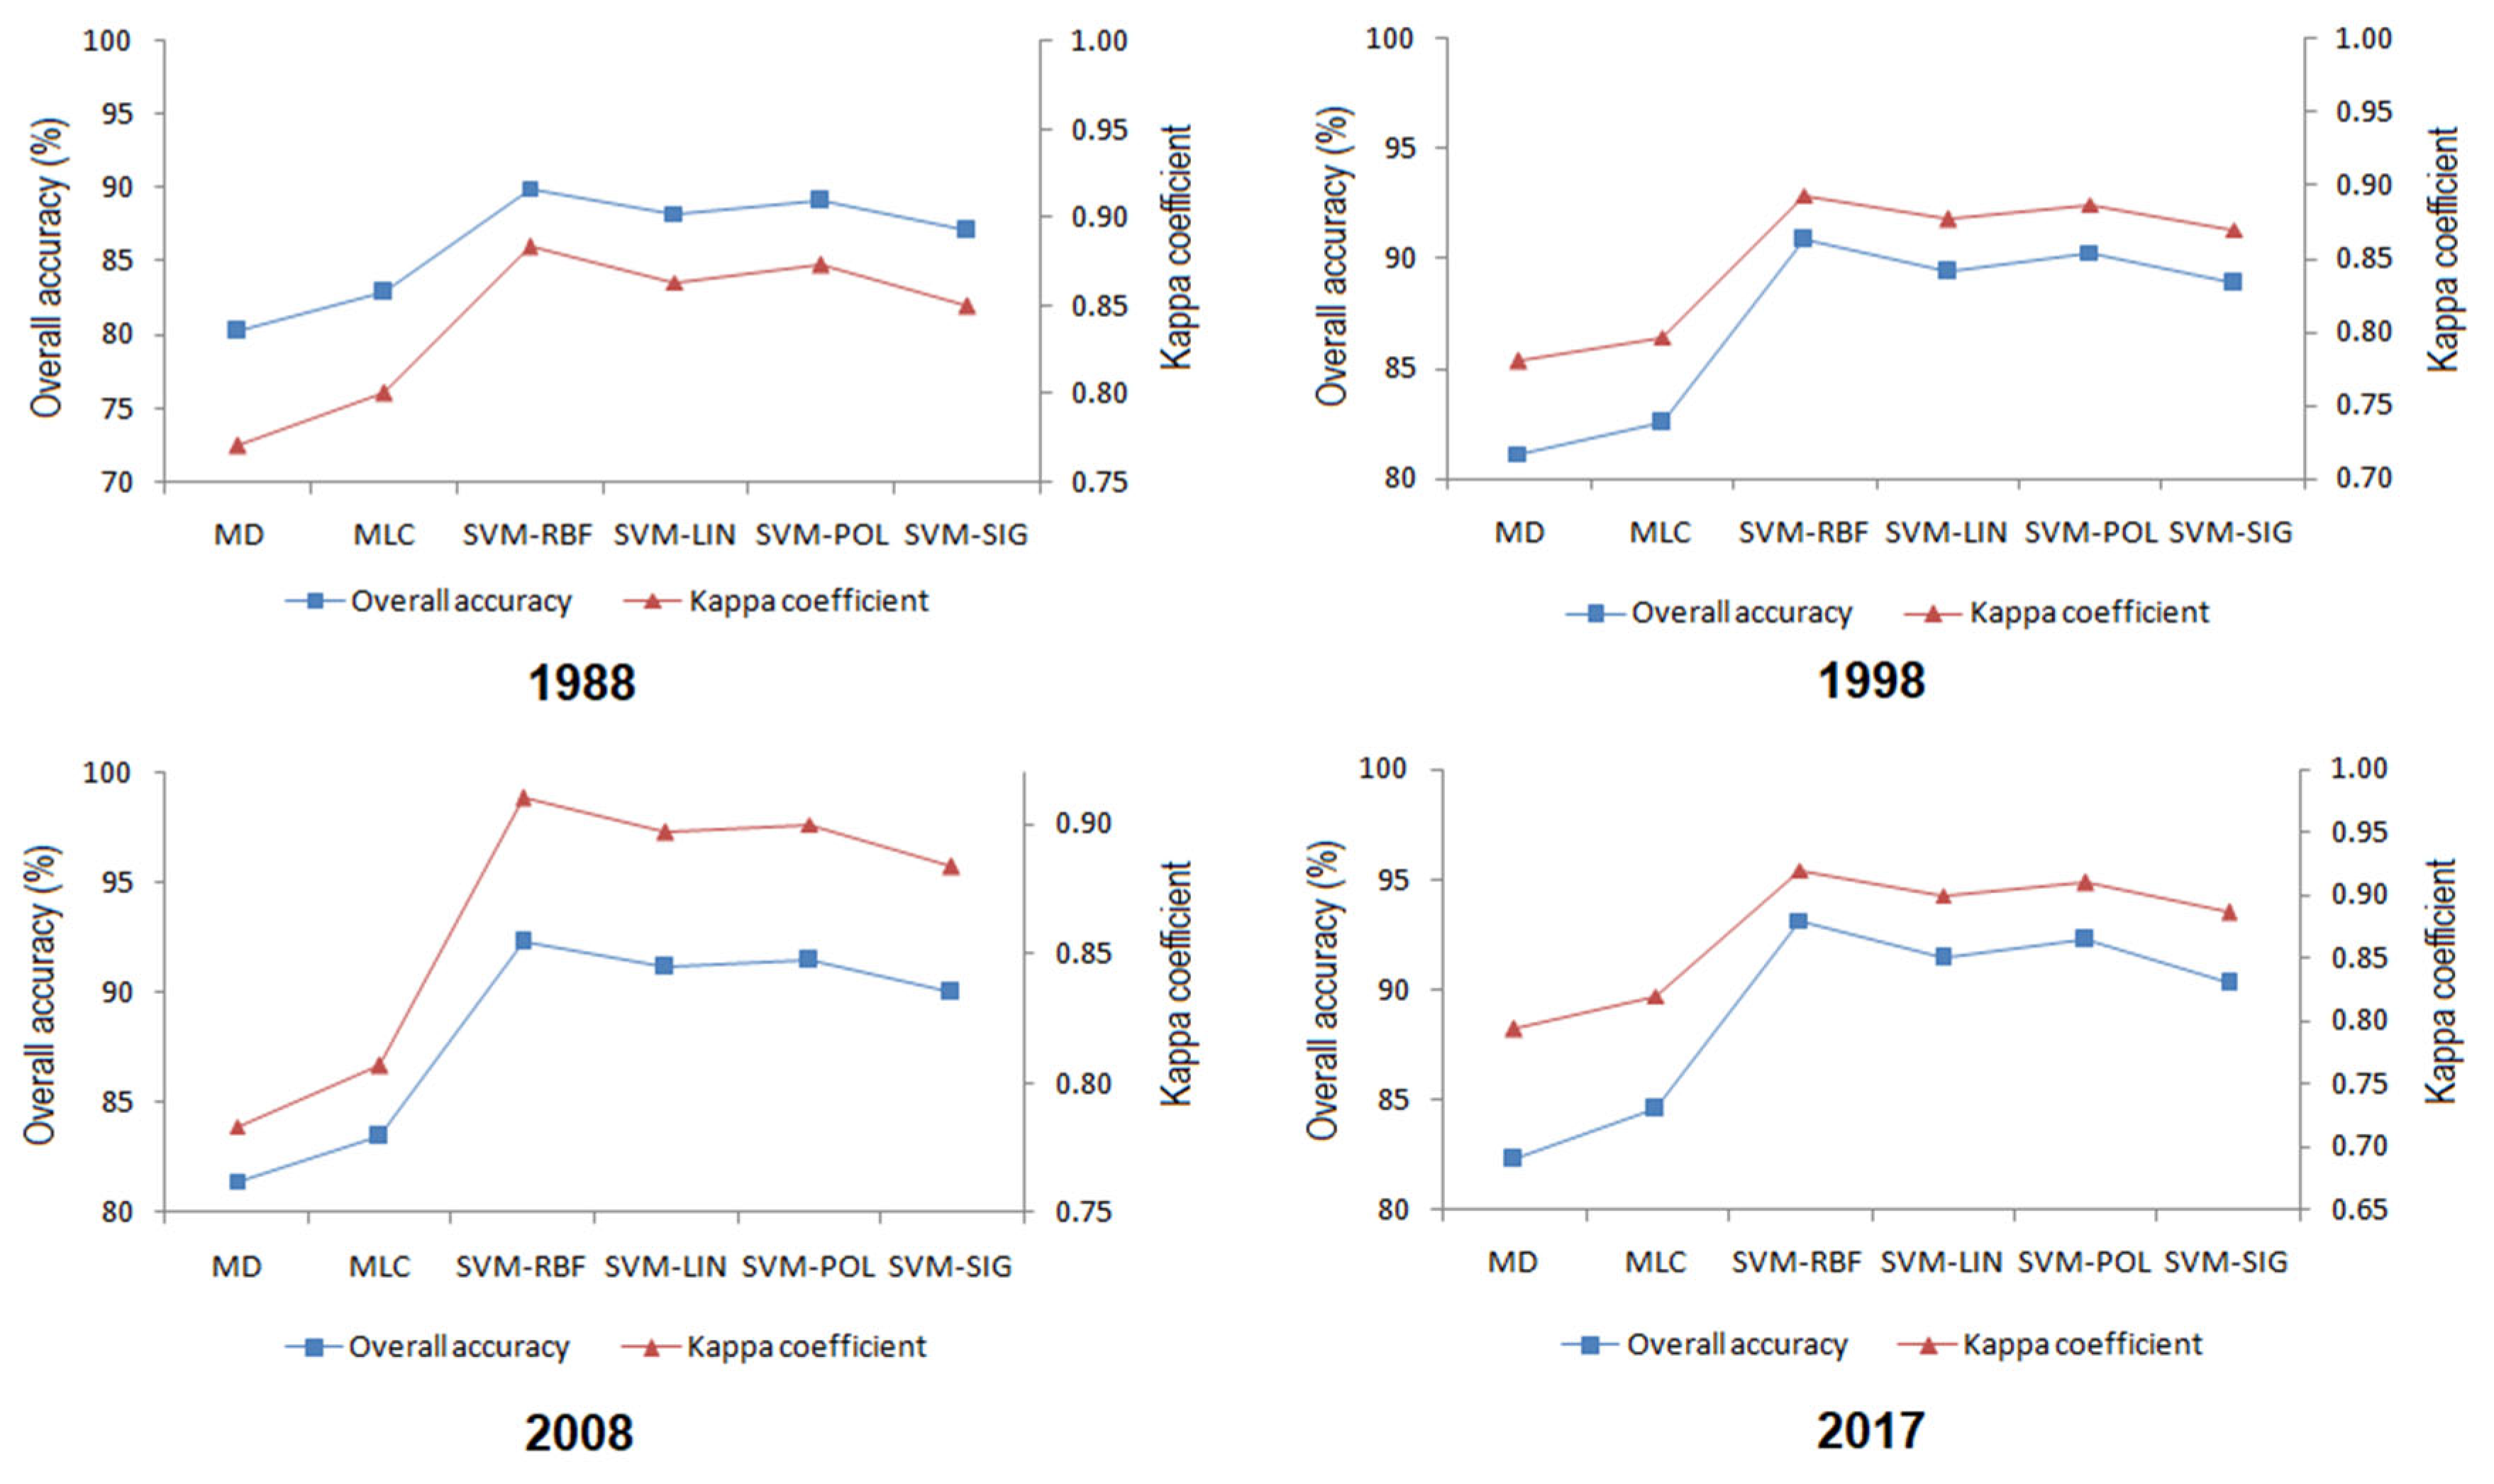
Figure 4.
Producer’s and user’s accuracies of classified images.
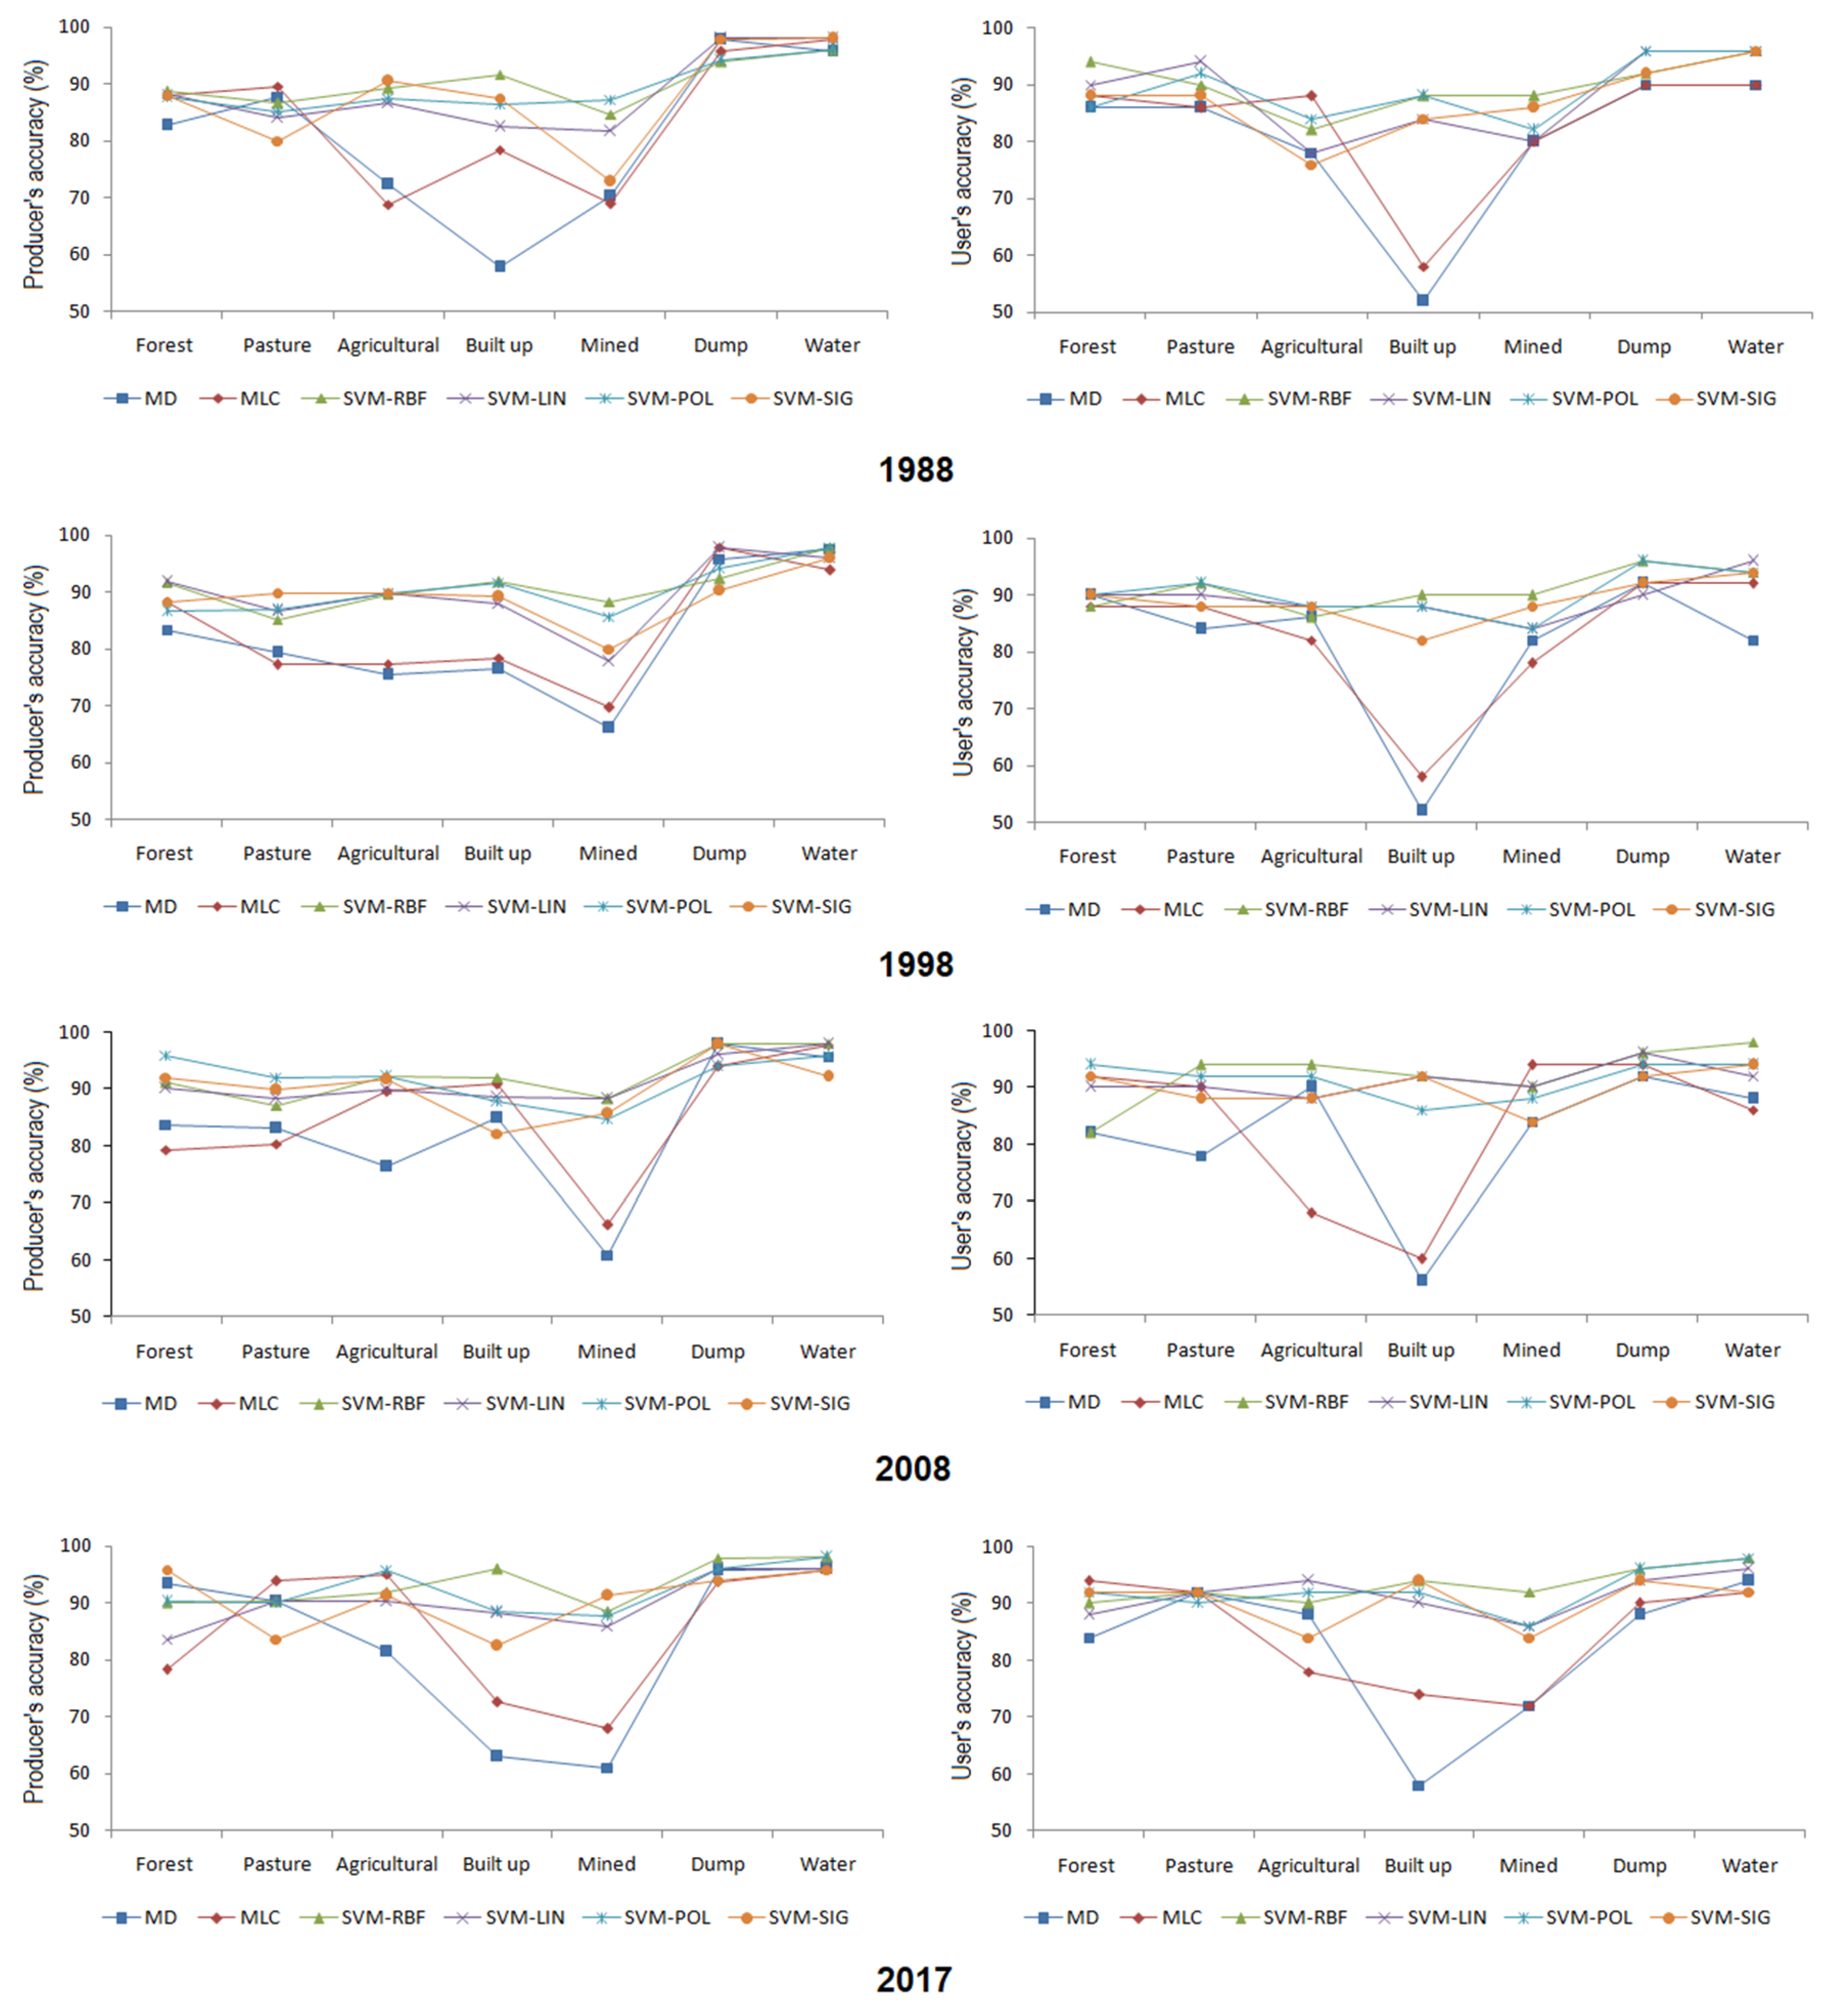
Figure 5.
Portion of images classified by the six algorithms: a. MD;b. MLC; c. SVM-BRF; d. SVM-LIN; e. SVM-POL; f. SVM-SIG.
Figure 5.
Portion of images classified by the six algorithms: a. MD;b. MLC; c. SVM-BRF; d. SVM-LIN; e. SVM-POL; f. SVM-SIG.
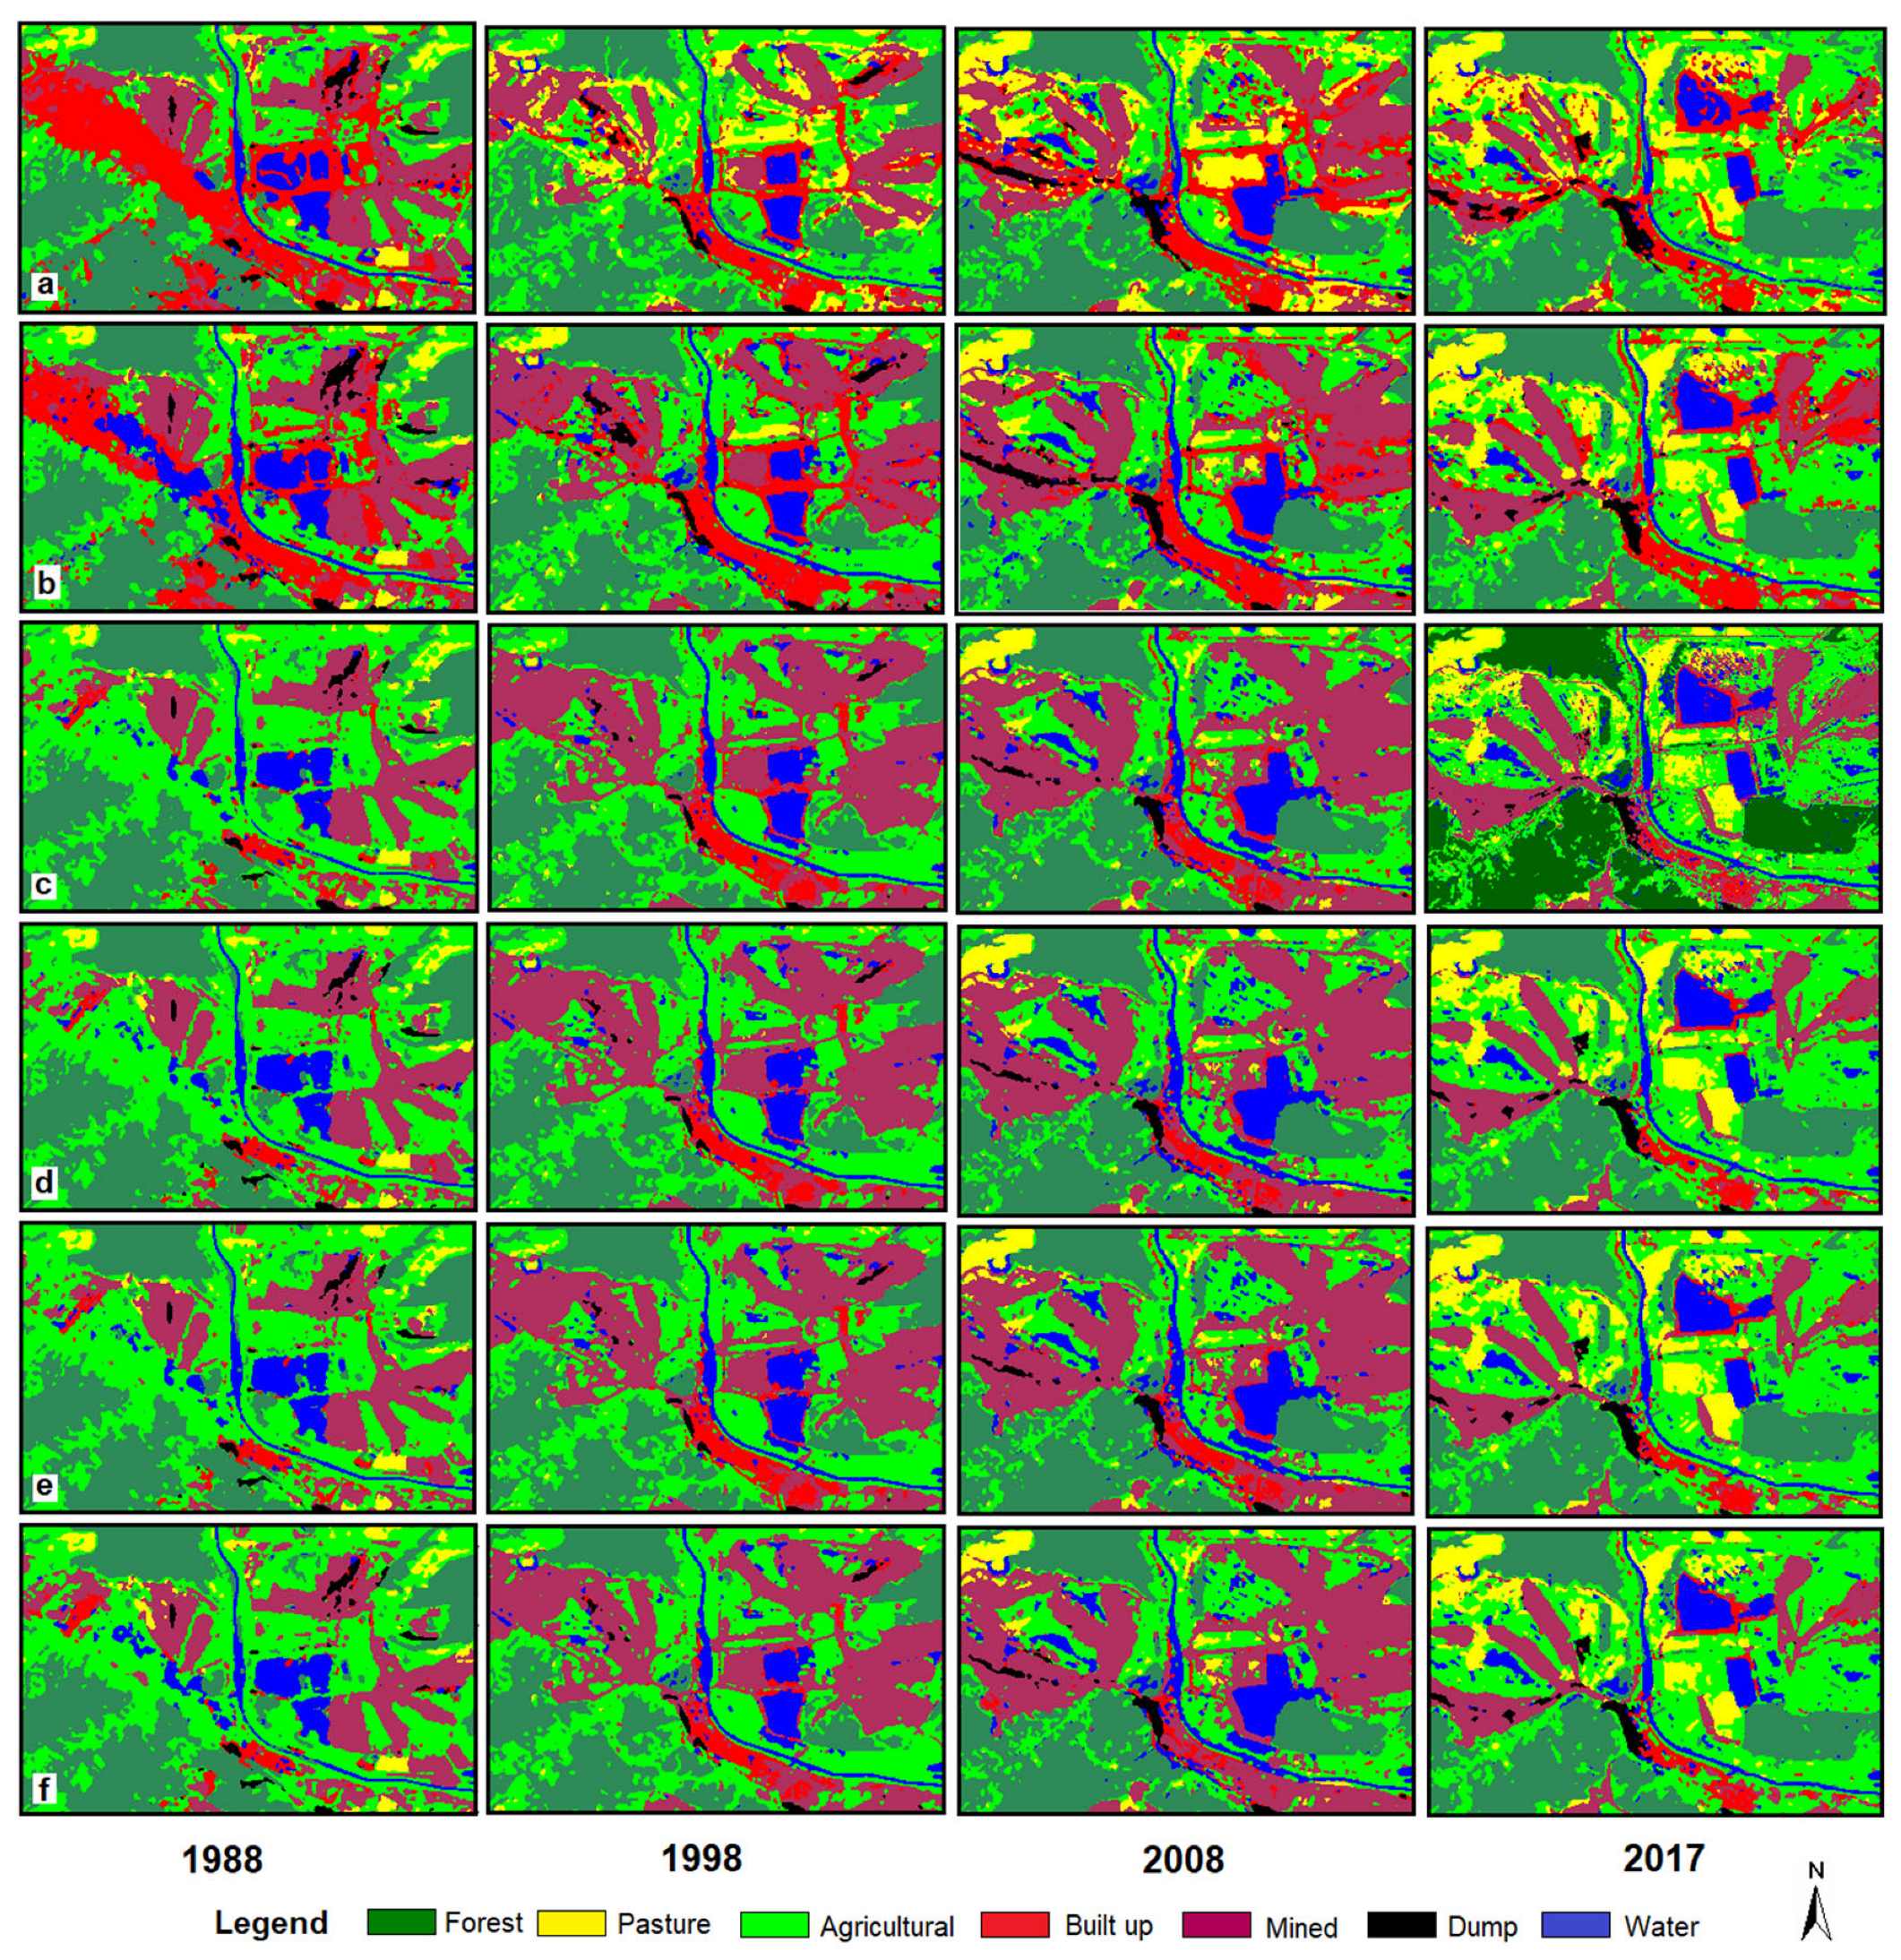
Figure 6.
Location of active mines in the studied periods.
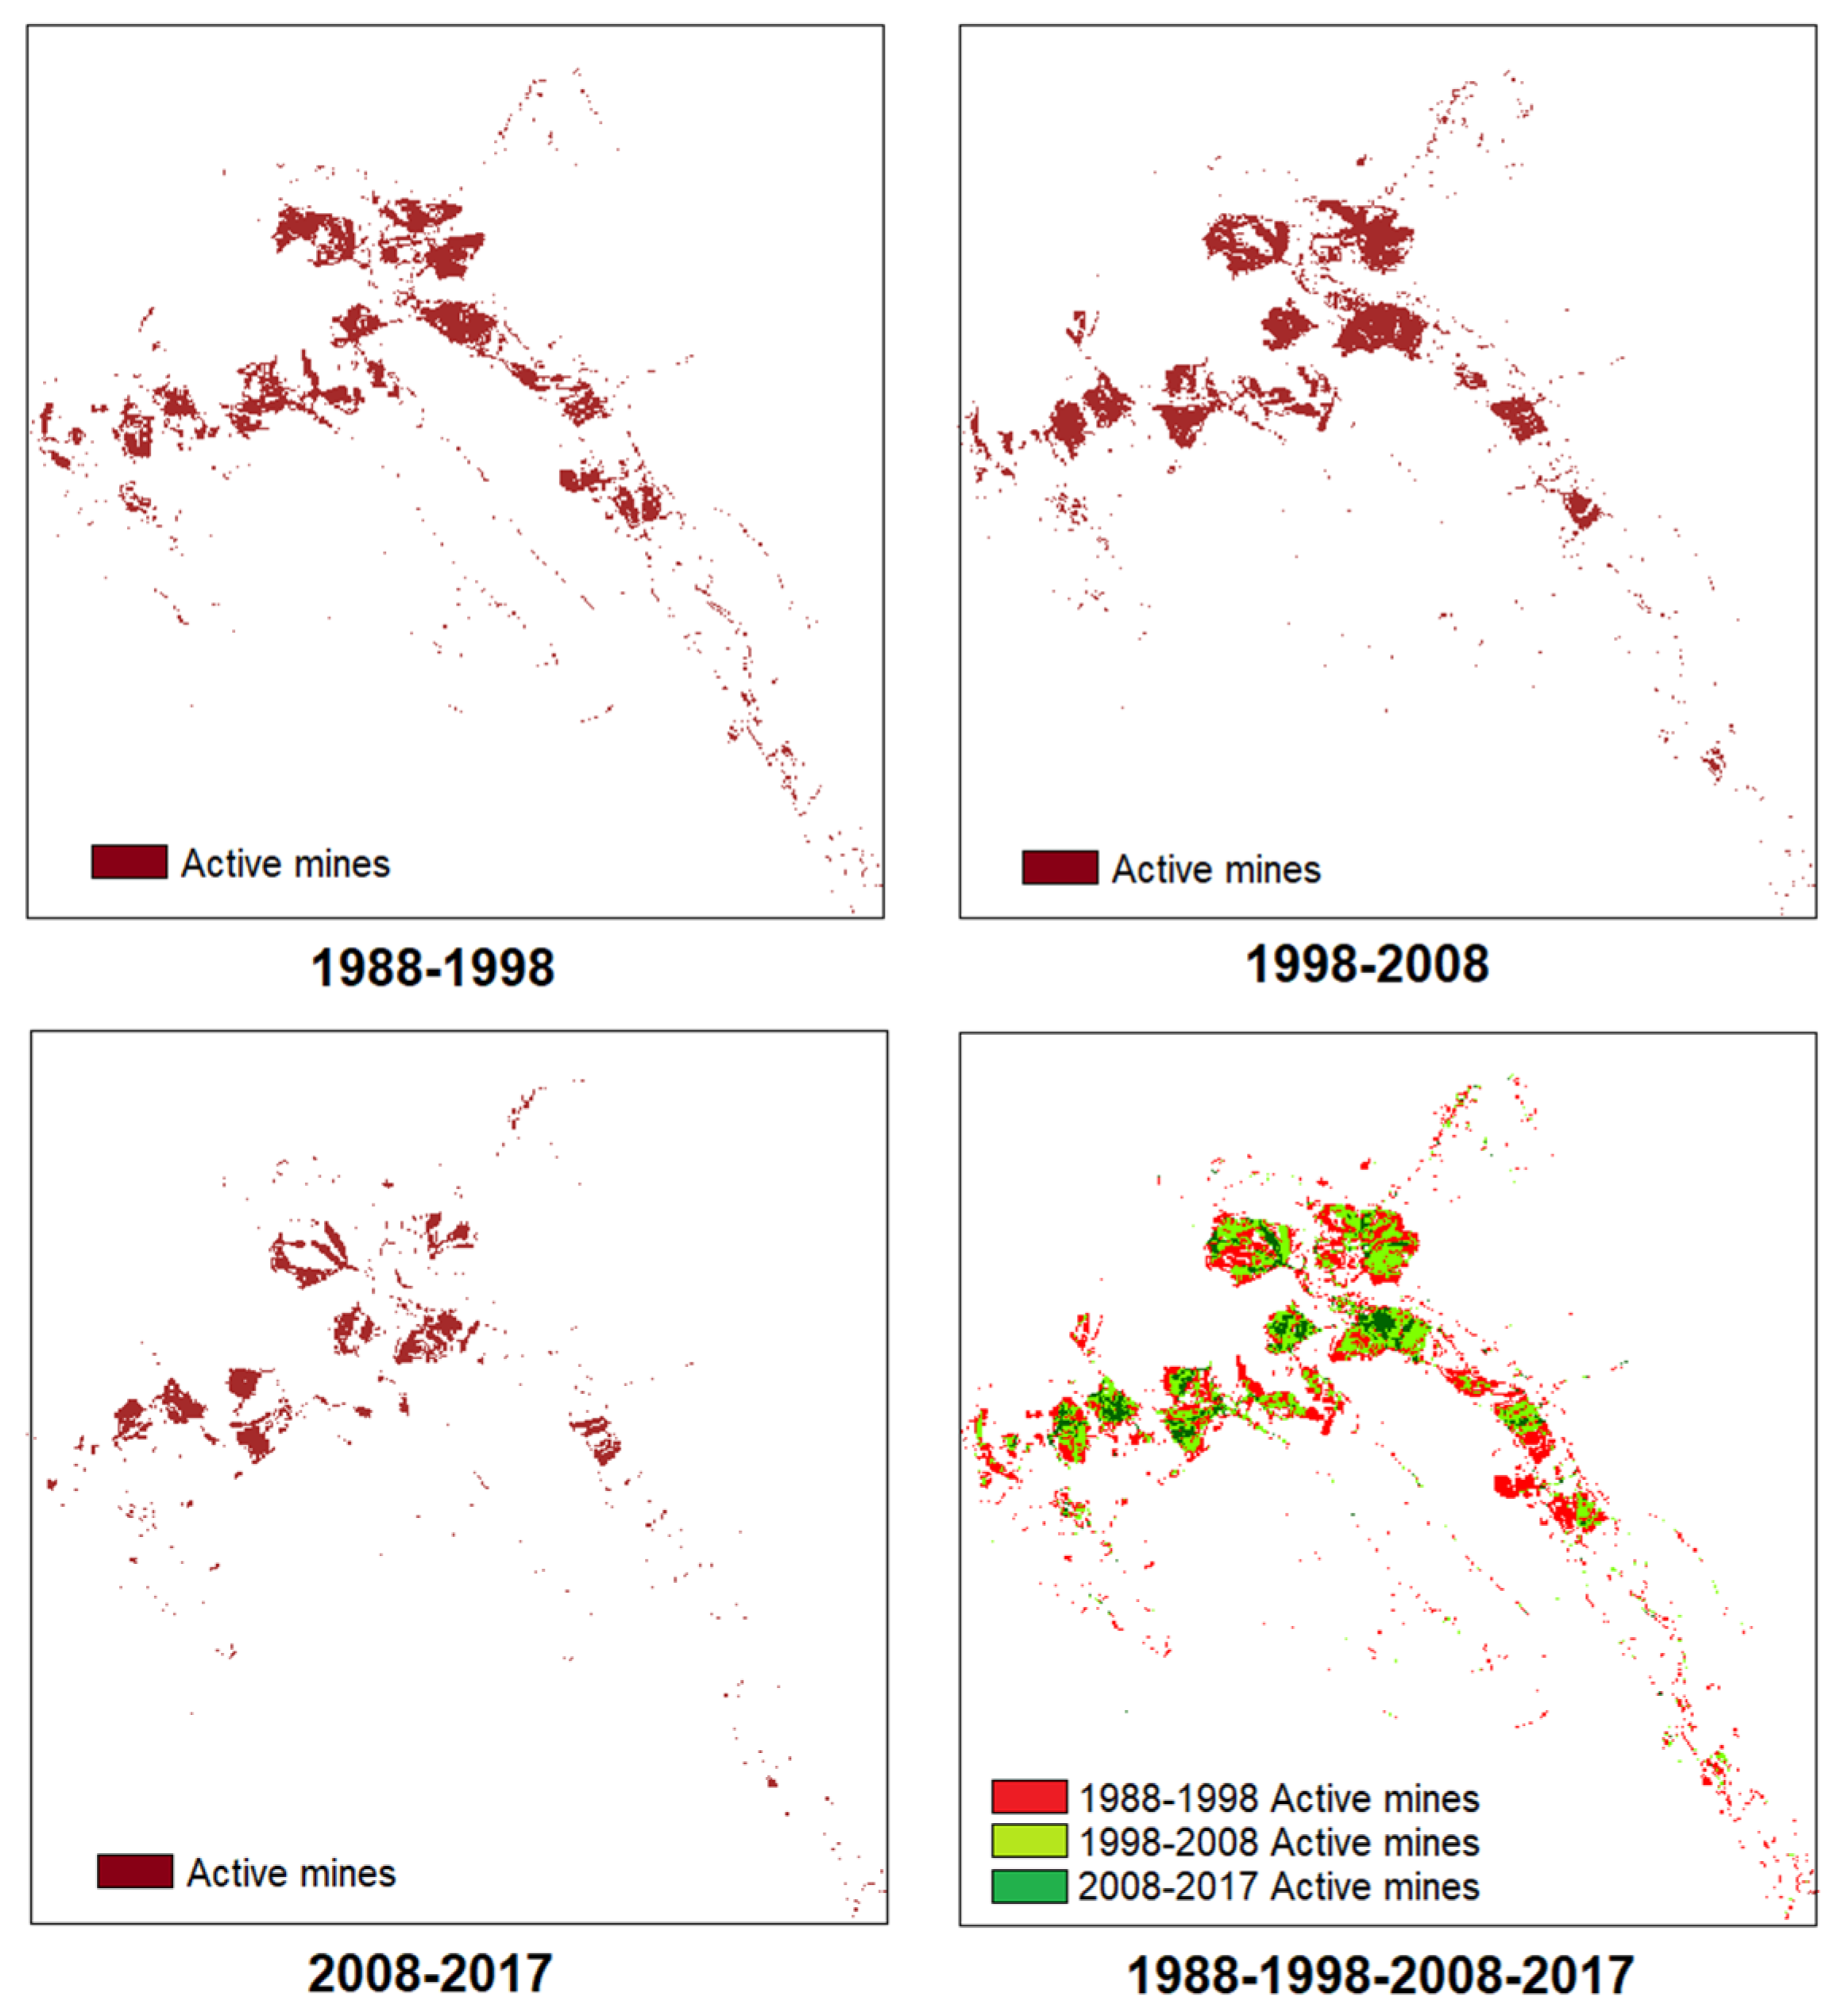

Table 1.
Characteristics of the satellite images used in the study.
| Characteristics | Landsat 5 TM | Landsat 8 OLI |
|---|---|---|
| Acquisition date | 22 August 1988, 2 August 1998, 13 August 2008 | 16 August 2017 |
| Metadata | Yes | Yes |
| Spatial resolution (in m) | MSS30 | MSS30 |
| Spectral resolution (in μm) | Blue: (0.45–0.51) Green: (0.52–0.60) Red: (0.63–0.69) NIR: (0.76–0.90) |
Blue: (0.45–0.51) Green: (0.53–0.59) Red: (0.64–0.67) NIR: (0.85–0.88) |
| Path/row | 184/029 | 184/029 |
| Available number of bands | 7 (6 used in study: band 1–5, and 7) | 11 (6 used in study: bands 2–7) |
Table 2.
SVM parameters used in the study.
| No. | Kernel function | Formula | Kernel parameters | Optimal parameters used in this study |
|---|---|---|---|---|
| 1 | Linear | C | C=200 | |
| 2 | Polynomial | C, γ, r and d | C=250; γ=0.167; r=1; d=2 | |
| 3 | RBF | C and γ | C = 100; γ=0.167 | |
| 4 | Sigmoid | C, γ and r | C=100; γ=0.167; r=1; |
K(xi, xj) – the kernel function; γ – the gamma function for all kernels used; d – the degree defined in the polynomial kernel; r – the bias term defined in the kernel function of both polynomial and sigmoid kernels; C –the cost parameter (trade-off between training error and margin); T – a transformation.
Table 3.
Land cover classes used in satellite images classification [44].
Table 3.
Land cover classes used in satellite images classification [44].
| Code | Land cover classes | Description |
|---|---|---|
| 1 | Forest | Evergreen forests, deciduous forests, mixed forests, shrubs (hazelnuts, willow trees, etc.) |
| 2 | Pasture | Areas consisting of arid land with short vegetation, areas with pasture and sparse grass |
| 3 | Agricultural | Areas with tall vegetation which is mown, different agricultural crops |
| 4 | Built up | Residential, commercial, industrial, parking, transportation and facilities |
| 5 | Mined (active or reclaimed) | Areas with surface mines, areas with no vegetation cover inside surface mining, areas with sparse vegetation inside surface mining (grass, shrubs, sparse forest) |
| 6 | Dump | Sterile dumps |
| 7 | Water | Rivers and lakes (natural or occurred after surface mining activity) |
Table 4.
Pixel counts of the training samples collected from the seven land cover classes.
| Year | Land cover class | ||||||
|---|---|---|---|---|---|---|---|
| Forest | Pasture | Agricultural | Built up | Mined | Dump | Water | |
| Pixels 1988 | 27006 | 9030 | 14029 | 1018 | 5397 | 1387 | 4093 |
| Pixels 1998 | 25299 | 4202 | 15564 | 2201 | 15536 | 1005 | 4627 |
| Pixels 2008 | 32606 | 6034 | 9959 | 1717 | 20851 | 1100 | 5415 |
| Pixels 2017 | 17046 | 5509 | 7658 | 680 | 7170 | 648 | 2596 |
Table 5.
Land cover change analysis obtained from the six algorithms (1988–2017).
| MD | ||||||||||||
| Land cover class | 1988 | 1998 | 2008 | 2017 | 1988-1998(% class) | 1998-2008 (% class) | 2008-2017 (% class) | 1988-2017 (% class) | ||||
| ha | % | ha | % | ha | % | ha | % | |||||
| Forest | 39850.2 | 37.0 | 41301.1 | 38.3 | 47285.3 | 43.9 | 53017.1 | 49.2 | 3.6 | 14.5 | 12.1 | 33.0 |
| Pasture | 14198.1 | 13.2 | 14097.2 | 13.1 | 8723.3 | 8.1 | 6741.3 | 6.3 | -0.7 | -38.1 | -22.7 | -52.5 |
| Agricultural | 42628.7 | 39.6 | 45187.0 | 42.0 | 42837.3 | 39.8 | 40832.2 | 37.9 | 6.0 | -5.2 | -4.7 | -4.2 |
| Built up | 3644.9 | 3.4 | 2430.8 | 2.3 | 3132.2 | 2.9 | 3170.4 | 2.9 | -33.3 | 28.9 | 1.2 | -13.0 |
| Mined | 5296.9 | 4.9 | 3136.9 | 2.9 | 3799.1 | 3.5 | 2006.7 | 1.9 | -40.8 | 21.1 | -47.2 | -62.1 |
| Dump | 916.2 | 0.8 | 346.9 | 0.3 | 604.0 | 0.6 | 519.1 | 0.5 | -62.1 | 74.1 | -14.1 | -43.3 |
| Water | 1180.3 | 1.1 | 1215.4 | 1.1 | 1334.1 | 1.2 | 1428.5 | 1.3 | 3.0 | 9.8 | 7.1 | 21.0 |
| Total | 107715.3 | 100 | 107715.3 | 100 | 107715.3 | 100 | 107715.3 | 100 | ||||
| MLC | ||||||||||||
| Land cover class | 1988 | 1998 | 2008 | 2017 | 1988-1998(% class) | 1998-2008 (% class) | 2008-2017 (% class) | 1988-2017 (% class) | ||||
| ha | % | ha | % | ha | % | ha | % | |||||
| Forest | 36484.6 | 33.9 | 39152.3 | 36.3 | 41502.0 | 38.5 | 42126.5 | 39.1 | 7.3 | 6.0 | 1.5 | 15.5 |
| Pasture | 14365.1 | 13.3 | 9759.3 | 9.1 | 7086.2 | 6.6 | 7077.2 | 6.6 | -32.1 | -27.4 | -0.1 | -50.7 |
| Agricultural | 45896.0 | 42.6 | 47475.7 | 44.1 | 46839.6 | 43.5 | 47694.5 | 44.2 | 3.4 | -1.3 | 1.8 | 3.9 |
| Built up | 3009.6 | 2.8 | 3347.7 | 3.1 | 3827.9 | 3.6 | 4808.3 | 4.5 | 11.2 | 14.3 | 25.6 | 59.8 |
| Mined | 5563.8 | 5.2 | 5383.3 | 5.0 | 5362.8 | 5.0 | 3464.8 | 3.2 | -3.2 | -0.4 | -35.4 | -37.7 |
| Dump | 944.9 | 0.9 | 506.2 | 0.5 | 557.4 | 0.5 | 420.8 | 0.4 | -46.4 | 10.1 | -24.5 | -55.5 |
| Water | 1451.3 | 1.3 | 2090.8 | 1.9 | 2539.4 | 2.3 | 2123.2 | 2.0 | 44.1 | 21.5 | -16.4 | 46.3 |
| Total | 107715.3 | 100 | 107715.3 | 100 | 107715.3 | 100 | 107715.3 | 100 | ||||
| SVM-RBF | ||||||||||||
| Land cover class | 1988 | 1998 | 2008 | 2017 | 1988-1998(% class) | 1998-2008 (% class) | 2008-2017 (% class) | 1988-2017 (% class) | ||||
| ha | % | ha | % | ha | % | ha | % | |||||
| Forest | 37539.6 | 34.9 | 41381.5 | 38.4 | 48369.6 | 44.9 | 48850.5 | 45.4 | 10.2 | 16.9 | 1.0 | 30.1 |
| Pasture | 13837.4 | 12.8 | 6885.7 | 6.4 | 6779.3 | 6.3 | 7233.7 | 6.7 | -50.2 | -1.5 | 6.7 | -47.7 |
| Agricultural | 50437.4 | 46.8 | 49477.5 | 45.9 | 41783.2 | 38.8 | 44535.8 | 41.3 | -1.9 | -15.6 | 6.6 | -11.7 |
| Built up | 584.8 | 0.5 | 1031.4 | 1.0 | 1206.4 | 1.1 | 1232.1 | 1.1 | 76.4 | 17.0 | 2.1 | 110.7 |
| Mined | 3534.4 | 3.3 | 7253.0 | 6.7 | 7543.7 | 7.0 | 3765.5 | 3.5 | 105.2 | 4.0 | -50.1 | 6.5 |
| Dump | 703.2 | 0.7 | 218.8 | 0.2 | 280.4 | 0.3 | 330.5 | 0.3 | -68.9 | 28.2 | 17.9 | -53.0 |
| Water | 1078.5 | 1.0 | 1467.4 | 1.4 | 1752.7 | 1.6 | 1767.2 | 1.7 | 36.1 | 19.4 | 0.8 | 63.9 |
| Total | 107715.3 | 100 | 107715.3 | 100 | 107715.3 | 100 | 107715.3 | 100 | ||||
| SVM-LIN | ||||||||||||
| Land cover class | 1988 | 1998 | 2008 | 2017 | 1988-1998(% class) | 1998-2008 (% class) | 2008-2017 (% class) | 1988-2017 (% class) | ||||
| ha | % | ha | % | ha | % | ha | % | |||||
| Forest | 38433.3 | 35.7 | 42040.4 | 39.1 | 48956.1 | 45.4 | 49663.5 | 46.1 | 9.4 | 16.5 | 1.4 | 29.2 |
| Pasture | 12878.1 | 11.9 | 5750.0 | 5.3 | 5589.0 | 5.2 | 6501.7 | 6.0 | -55.4 | -2.8 | 16.3 | -49.5 |
| Agricultural | 50171.9 | 46.6 | 49860.9 | 46.3 | 42364.8 | 39.4 | 44368.5 | 41.2 | -0.6 | -15.0 | 4.7 | -11.6 |
| Built up | 393.6 | 0.4 | 560.4 | 0.5 | 514.4 | 0.5 | 867.8 | 0.8 | 42.4 | -8.2 | 68.7 | 120.5 |
| Mined | 3830.4 | 3.6 | 7559.9 | 7.0 | 7803.0 | 7.2 | 3948.6 | 3.7 | 97.4 | 3.2 | -49.4 | 3.1 |
| Dump | 807.2 | 0.7 | 239.8 | 0.2 | 297.6 | 0.3 | 355.9 | 0.3 | -70.3 | 24.1 | 19.6 | -55.9 |
| Water | 1200.8 | 1.1 | 1703.9 | 1.6 | 2190.4 | 2.0 | 2009.3 | 1.9 | 41.9 | 28.6 | -8.3 | 67.3 |
| Total | 107715.3 | 100 | 107715.3 | 100 | 107715.3 | 100 | 107715.3 | 100 | ||||
| SVM-POL | ||||||||||||
| Land cover class | 1988 | 1998 | 2008 | 2017 | 1988-1998(% class) | 1998-2008 (% class) | 2008-2017 (% class) | 1988-2017 (% class) | ||||
| ha | % | ha | % | ha | % | ha | % | |||||
| Forest | 37914.7 | 35.2 | 42037.9 | 39.0 | 49026.1 | 45.5 | 49529.3 | 46.0 | 10.9 | 16.6 | 1.0 | 30.6 |
| Pasture | 12871.3 | 11.9 | 5748.2 | 5.3 | 5570.6 | 5.2 | 6378.8 | 5.9 | -55.3 | -3.1 | 14.5 | -50.4 |
| Agricultural | 50888.1 | 47.2 | 49972.9 | 46.4 | 42400.2 | 39.4 | 44674.8 | 41.5 | -1.8 | -15.2 | 5.4 | -12.2 |
| Built up | 397.7 | 0.4 | 686.9 | 0.6 | 695.2 | 0.6 | 849.1 | 0.8 | 72.7 | 1.2 | 22.1 | 113.5 |
| Mined | 3619.7 | 3.4 | 7344.4 | 6.8 | 7577.6 | 7.0 | 3936.2 | 3.7 | 102.9 | 3.2 | -48.1 | 8.7 |
| Dump | 814.4 | 0.8 | 244.0 | 0.3 | 296.1 | 0.3 | 346.4 | 0.3 | -70.0 | 21.4 | 17.0 | -57.5 |
| Water | 1209.4 | 1.1 | 1681.0 | 1.6 | 2149.5 | 2.0 | 2000.7 | 1.8 | 39.0 | 27.9 | -6.9 | 65.4 |
| Total | 107715.3 | 100 | 107715.3 | 100 | 107715.3 | 100 | 107715.3 | 100 | ||||
| SVM-SIG | ||||||||||||
| Land cover class | 1988 | 1998 | 2008 | 2017 | 1988-1998(% class) | 1998-2008 (% class) | 2008-2017 (% class) | 1988-2017 (% class) | ||||
| ha | % | ha | % | ha | % | ha | % | |||||
| Forest | 38896.7 | 36.1 | 41527.2 | 38.6 | 49027.8 | 45.5 | 48609.1 | 45.1 | 6.8 | 18.1 | -0.9 | 25.0 |
| Pasture | 12448.1 | 11.5 | 5882.9 | 5.5 | 5571.2 | 5.2 | 5609.9 | 5.2 | -52.7 | -5.3 | 0.7 | -54.9 |
| Agricultural | 48854.6 | 45.4 | 50359.9 | 46.7 | 42167.2 | 39.2 | 46509.7 | 43.2 | 3.1 | -16.3 | 10.3 | -4.8 |
| Built up | 372.8 | 0.3 | 443.3 | 0.4 | 348.4 | 0.3 | 644.9 | 0.6 | 18.9 | -21.4 | 85.1 | 73.0 |
| Mined | 5142.8 | 4.8 | 7605.5 | 7.1 | 8218.1 | 7.6 | 3820.1 | 3.6 | 47.9 | 8.1 | -53.5 | -25.7 |
| Dump | 809.4 | 0.8 | 242.7 | 0.2 | 316.2 | 0.3 | 364.3 | 0.3 | -70.0 | 30.3 | 15.2 | -55.0 |
| Water | 1190.9 | 1.1 | 1653.8 | 1.5 | 2066.4 | 1.9 | 2157.3 | 2.0 | 38.9 | 24.9 | 4.4 | 81.1 |
| Total | 107715.3 | 100 | 107715.3 | 100 | 107715.3 | 100 | 107715.3 | 100 | ||||
Table 6.
“From-to” matrix (in ha) obtained through cross-tabulation of the SVM-RBF classified maps for mined class in periods 1988–1998, 1998–2008, 2008–2017, and 1988–2017.
Table 6.
“From-to” matrix (in ha) obtained through cross-tabulation of the SVM-RBF classified maps for mined class in periods 1988–1998, 1998–2008, 2008–2017, and 1988–2017.
| Period 1988–1998 | ||||||||
| Forest | Pasture | Agricultural | Built up | Mined | Dump | Water | Total | |
| From mined to land cover classes: | 86.4 | 25.1 | 1366.8 | 80.2 | 1838.4 | 47.3 | 90.2 | 3534.4 |
| From land cover classes to mined: | 498.7 | 524.7 | 3834.8 | 164.4 | 1838.4 | 244.1 | 147.9 | 7253.0 |
| Overall Accuracy: 81.77% | ||||||||
| Period 1998–2008 | ||||||||
| Forest | Pasture | Agricultural | Built up | Mined | Dump | Water | Total | |
| From mined to land cover classes: | 99.2 | 207.7 | 2245.1 | 308.1 | 4088.3 | 79.6 | 79.6 | 7253.0 |
| From land cover classes to mined: | 645.0 | 49.4 | 2214.4 | 315.7 | 4088.3 | 83.6 | 147.3 | 7543.7 |
| Overall Accuracy: 83.85% | ||||||||
| Period 2008–2017 | ||||||||
| Forest | Pasture | Agricultural | Built up | Mined | Dump | Water | Total | |
| From mined to land cover classes: | 221.3 | 543.3 | 3521.6 | 471.2 | 2429.8 | 103.8 | 252.7 | 7543.7 |
| From land cover classes to mined: | 314.2 | 41.7 | 757.4 | 93.9 | 2429.8 | 34.8 | 93.7 | 3765.5 |
| Overall Accuracy: 85.95% | ||||||||
| Period 1988–2017 | ||||||||
| Forest | Pasture | Agricultural | Built up | Mined | Dump | Water | Total | |
| From mined to land cover classes: | 389.0 | 383.9 | 1867.5 | 135.4 | 502.0 | 63.5 | 193.1 | 3534.4 |
| From land cover classes to mined: | 818.0 | 296.3 | 1917.9 | 64.0 | 502.0 | 106.6 | 60.7 | 3765.5 |
| Overall Accuracy: 83.83% | ||||||||
Disclaimer/Publisher’s Note: The statements, opinions and data contained in all publications are solely those of the individual author(s) and contributor(s) and not of MDPI and/or the editor(s). MDPI and/or the editor(s) disclaim responsibility for any injury to people or property resulting from any ideas, methods, instructions or products referred to in the content. |
© 2023 by the authors. Licensee MDPI, Basel, Switzerland. This article is an open access article distributed under the terms and conditions of the Creative Commons Attribution (CC BY) license (http://creativecommons.org/licenses/by/4.0/).
Copyright: This open access article is published under a Creative Commons CC BY 4.0 license, which permit the free download, distribution, and reuse, provided that the author and preprint are cited in any reuse.


