Submitted:
11 May 2023
Posted:
15 May 2023
You are already at the latest version
Abstract
Ozonated sunflower oil (OSO) is well known functional oil with its antioxidant, antimi-crobial, anti-allergic, and skin-moisturizing properties. However, studies on the effects of OSO on high-cholesterol diet (HCD)-induced metabolic disorders have been scarce. In the current study, we aimed to determine the anti-inflammatory effects of OSO on lipid me-tabolism in adult hypercholesterolemic zebrafish and its embryo. Microinjection of OSO (final 2%, 10 nL) into zebrafish embryos under presence of carboxymethyllysine (CML, 500 ng) protected acute embryo death upto 61% survival, while sunflower oil (final 2%) showed much less protection around 42% survival. The microinjection of OSO was more effective than SO to inhibit reactive oxygen species (ROS) production and apoptosis in the CML induced embryo toxicity. Intraperitoneal injection of OSO under presence of CML protected acute death from CML-induced neurotoxicity with improved hepatic inflamma-tion, less detection of ROS and interleukin (IL)-6, and lowering blood total cholesterol (TC) and triglyceride (TG), while SO-injected group did not protect the CML-toxicity. Long-term supplementation of OSO (final 20%, wt/wt) with HCD for 6 months resulted higher sur-vivability than HCD alone group or HCD+SO group (final 20%, wt/wt) with significant lowering of plasma TC and TG levels. The HCD+OSO group showed the least hepatic in-flammation, fatty liver change, ROS, and IL-6 production. In conclusion, short-term treat-ment of OSO by injection exhibited potent anti-inflammatory activity against acute neuro-toxicity of CML in zebrafish and its embryo. Long-term supplementation of OSO in diet also revealed the highest survivability and blood lipid-lowering effect through potent an-ti-oxidant and anti-inflammatory activity.
Keywords:
ozonated sunflower oil
; OSO
; antioxidant
; dyslipidemia
; high-cholesterol diet
; HCD
; zebrafish
; zebrafish embryo
; carboxymethyllysine
; CML
1. Introduction
Hyperinflammation is associated with many pathological processes of critical diseases, such as dyslipidemia [1] and autoimmune disease [2], and also initiated by proinflammatory signalling during infection or cell damage with non-specific attack [3, 4], Dyslipidemia is characterized by elevated plasma levels of total cholesterol (TC), low-density lipoprotein cholesterol (LDL-C), or triglycerides (TG) or decreased plasma levels of high-density lipoprotein cholesterol (HDL-C) [5]. Consumption of high-cholesterol diet (HCD) contribute to the progression of dyslipidemia, hepatic inflammation, and hepatic steatosis via elevation of serum TG and VLDL/LDL [6]. Dyslipidemia plays an important role as “add fuel to the fire” in the exacerbation of inflammatory cascade series, insulin resistance, type 2 diabetes, fatty liver change, and hepatic steatosis [7]. For decades, several studies have been conducted to evaluate the efficacy to treat simultaneously inflammation and dyslipidemia, because oxidative stress and proinflammatory signaling were more aggravated in hyperlipidemia especially in high TG [8, 9].
Ozone (O3), a bluish gas with three oxygen atoms that are easily broken into oxygen and oxygen atoms with high oxidizing power. Ozone have exhibited various medical effects, including antimicrobial, immunomodulatory, anti-tumor effect, and antioxidant effects, as well as epigenetic modification [10, 11]. In particular, ozone have a strong germicidal effects with destructively against bacteria, fungi, and viruses: via ozonolysis of dual bonds of the cytoplasmic membrane and modify intracellular contents through protein oxidation, leading to the sterility [12]. However, ozonated water cannot be kept in storage for a long time because ozone in water is very unstable with short half-life [13].
To overcome the instability of ozone in water, ozonated oil was produced by the direct reaction of ozone with various vegetable oils, such as sunflower oil, almond oil, and olive oil, which is enriched in unsaturated fatty acids. Many ozonated oils in various vegetable oil claimed adequate activities of the wound healing or tissue regeneration in skin via anti-microbial activity [14]. In topical application, the ozonated oil acts as a moisturizer and protectant in patients with impaired skin barrier function [9]. Conversely, several studies reported that ozone therapies ameliorated lipid profiles [10]; however, studies on ozonated oil are limited in hyperlipidemic animal model.
Our previous study demonstrated that ozonated sunflower oil (OSO) supplementation has strong antioxidant properties [15]. Therefore, we performed an animal study to evaluate the lipid-lowering effects of OSO in high-cholesterol diet (HCD)-induced hyperlipidemic zebrafish. The current study is consisted with the following three category of experiments: microinjection of OSO in zebrafish embryos under presence of carboxymethyllysine (CML); intraperitoneal (IP) injection of OSO with carboxymethyllysine (CML) in HCD-fed zebrafish; and long-term consumption of OSO with HCD supplementation in adult zebrafish.
2. Materials and Methods
2.1. Materials
Ozonated sunflower oil (Raydel® Bodyone Flambo oil) was provided by Rainbow and Nature Pty, Ltd. (Thornleigh, NSW, Australia). The characteristics of the OSO revealed the typical range of Oleozon®, as previously described [16]. Sunflower oil (SO) was purchased from the local supermarket in Daegu, South Korea. N-ε-carboxylmethyllysine (CAS-No 941689-36-7, Cat#14580-5g), dihydroethidium (DHE, 104821-25-2, Cat #37291), and acridine orange (AO, 65-61-2, Cat#A9231), 2-phenoxyethanol (Sigma P1126; St. Louis, MO, USA) were procured from Sigma–Aldrich (St. Louis, MO, USA). All other chemicals and reagents else otherwise stated were of analytical grade and used as supplied.
2.2. Zebrafish Embryos Production
Zebrafish were maintained using the standard protocols as per the guidelines for the care and use of laboratory animals [17, 18]. Zebrafish embryos were produced and collected as the previously described method [19] with slight modifications. Embryos were collected, washed with egg water, and inspected for further experiments.
2.3. Microinjection of Zebrafish Embryos
Embryos at the 16-cell stage [1.5 h post-fertilization (hpf)] were randomly divided into six groups that received different treatments. Embryos in group I were injected with PBS (vehicle), while group II embryos were injected with 500 ng CML in PBS. Embryos in group III and group IV were injected with 500 ng CML along with the co-injection of SO 1% and SO2%, respectively; similarly, embryos in group V and VI were injected with 500 ng CML with co-injection of OSO1% and OSO2%, respectively. The embryos in different groups received a constant treatment volume (20 nL) which was injected by microcapillary pipette using a pneumatic picopump (PV830; World Precision Instruments, Sarasota, FL, USA) equipped with a magnetic manipulator (MM33; Kantec, Bensenville, IL, USA). Bias was minimized by microinjections at the same position of the yolk. Embryos in all the groups were visualized under the stereomicroscope (Motic SMZ 168; Hong Kong) at 5 and 24 h post-treatment and images were captured by Motic cam2300 CCD camera.
2.4. Imaging of Reactive Oxygen Species (ROS) and Apoptosis in Embryo
ROS levels in the embryos injected with CML and different concentrations of SO and OSO were determined by dihydroethidium (DHE) fluorescent staining, as the previously described method [20]. The stained images were visualized under a Nikon Eclipse TE2000 microscope (Tokyo, Japan) at the excitation and emission wavelength of 588 nm and 605 nm, respectively. The extent of apoptosis was measured via acridine orange (AO) staining as a method adopted by [21]. The stained embryos were visualized under a Nikon Eclipse TE2000 microscope at 502 nm and 525 nm excitation and emission wavelengths, respectively. The fluorescent intensity from DHE and AO staining corresponding to ROS and apoptosis was quantified using Image J software version 1.53r (http://rsb.info.nih.gov/ij/, accessed on 16 January 2023).
2.5. Acute inflammation in Adult Hyperlipidemic Zebrafish
Hyperlipidemic zebrafish were prepared by supplementing a 4% cholesterol diet for one month, and acute inflammation was induced by injecting 500 μg CML/10 μL of PBS (equivalent to 6 mM CML considering ~ zebrafish body weight was approximately 300 mg) as our previous report [22]. Adult zebrafish were divided into five groups. Zebrafish in Group I were injected with 10 μL PBS containing 500 μg CML. While zebrafish in Group II and III were co-injected with 500 μg CML with 10 μL of SO (final 1%) and SO (final 2%), respectively. Likewise, zebrafish in Group IV and V were co-injected with 500 μg CML with 10 μL of OSO (final 1%) and OSO (final 2%), respectively. Each treatment was given intraperitoneal (IP) injection using a 28-gauge needle into the abdominal region after anesthetizing zebrafish by drenching in 0.1% solution of 2-phenoxyethanol. At 30- and 60-min post-injection, zebrafish swimming activity and survivability were evaluated. Finally, zebrafish in different groups were sacrificed after 60 min post-injection, blood was collected by heart puncture and hepatic tissue was preserved in -70oC for the histological analysis.
2.6. Effect of OSO Supplementation with High-Cholesterol Diet in Adult Zebrafish
The zebrafish were randomly divided into the following four groups (n = 60): normal diet control (ND, Tetrabit Gmbh D49304, 47.5% crude protein, 6.5% crude fat, 2.0% crude fiber, 10.5% crude ash, containing vitamin A [29,770 IU/kg], vitamin D3 [1,860 IU/kg], vitamin E [200 mg/kg], and vitamin C [137 mg/kg]; Melle, Germany), HCD control, HCD with SO (final 20%, wt/wt), and HCD supplemented with OSO (final 20%, wt/wt). Zebrafish were maintained in the abovementioned diet for 6 months at 28°C with a 12:12 h light–dark cycle. Bodyweight and survivability were examined periodically at 3- and 6 months. At the end of 6-month blood from the zebrafish's heart was collected using a 22-G needle after anesthetizing with 0.1% phenoxyethanol solution. The hepatic tissue was removed surgically and processed for histological analysis.
2.7. Analysis of Plasma
Blood (2 μL) was drawn from the hearts of the adult fish, combined with 3 μL of phosphate-buffered saline (PBS)-ethylenediaminetetraacetic acid (EDTA, final concentration, 1 mM) and then collected in EDTA-treated tubes. The plasma total cholesterol (TC) and triglyceride (TG) were determined using commercial assay kits (cholesterol, T-CHO, and TGs, Cleantech TS-S; Wako Pure Chemical, Osaka, Japan) as per the method suggested by the suppliers.
2.8. Histopathological and Immunohistochemical Analysis
The hepatic tissue was surgically removed from the zebrafish, fixed in 10% formalin buffer solution, and subsequently frozen. The fixed hepatic tissue was embedded in the parafilm, and 7-μm-thick slices were prepared and stained with hematoxylin and eosin (H&E) [23]. Immunohistochemical (IHC) staining was performed to detect proinflammatory cytokine IL-6 as the previously described method [24]. In brief, IHC primary antibody (ab9324, Abcam, London, UK) was diluted (1:200) according to the manufacturer’s instructions and incubated overnight at 4°C with tissue section. The IHC reaction was visualized using the EnVision+ System-HRP polymer kit as a secondary antibody (1:1,000, Code K4001, Dako, Denmark). The tissue was visualized under an optical microscope (Nikon, Tokyo, Japan). Hepatic DHE staining for the ROS analysis was performed using the same protocol described in section 2.4.
2.9. Statistical Analysis
Data are presented as mean ± standard error of three independent experiments. The statistical difference between the groups was determined by One-way analysis of variance (ANOVA) followed by Tukey’s multiple-range test at p<0.05 using Statistical Package for the Social Sciences software program (version 23.0; SPSS, Inc., Chicago, IL, USA).
3. Results
3.1. OSO Attenuated the CML-Induced Embryo Toxicity
The survival rate of zebrafish embryos treated with CML and different concentrations of SO and OSO is depicted in Figure 1A. The PBS-alone-injected group showed the highest survivability (82.6%). While in the CML (500 ng) injected embryo survivability decreased periodically and reached 28.6% at 24 h, in contrast, improved embryo survivability was observed in the embryos co-treated with the CML and OSO1% or OSO2%. Likewise, a co-treated of CML with SO1% and SO2% also displayed improved survivability compared to only CML-treated embryos. A significantly higher embryo survivability (p<0.05) around 2.1-fold (60.6%) and 1.8-fold (49.9%) were observed in OSO2% and OSO1% injected embryos, respectively, as compared to only CML-injected embryos (28.6%) at 24 h.
Morphological changes in the embryo’s development were observed at 5 h and 24 h post treatment (Figure 1B). A delayed embryo development with structural deformities was observed in CML-injected embryos compared to the only PBS-injected embryos. Embryos co-injected with OSO1% and OSO2% revert the CML-induced developmental impairment, and results are in accordance with findings of embryo survivability (Figure 1A). Contrary to this, not a significant difference in the embryo’s development was detected in SO1%-treated groups. The deformities regarding eyes and tail development in the embryos treated with SO1% and CML, as indicated by red arrowhead, were comparable with only CML-injected embryos. These findings demonstrated that OSO mainly OSO2% has strong protective activity against CML-induced developmental deformities and mortality of embryos zebrafish.
Fluorescence intensity (FI) from AO and DHE staining indicated that severe ROS production and apoptosis were occurred in embryos, respectively, by presence of CML (Figure 1C). AO staining revealed the highest FI in CML-treated embryos, which was approximately 3-fold higher than PBS-treated embryos, thus manifesting the apoptotic potential of CML. In contrast, the OSO1% and OSO2% treatments significantly (p<0.05) rescued the embryos from CML-induced apoptosis. A 47.2% and 59.1% less AO fluorescent intensity was noticed in OSO1% and OSO2% -injected embryos compared to only CML-injected embryos. Also, SO1% and SO2%-injected embryos displayed significant (p<0.05) apoptotic inhibition evident by 33.8% and 44.1%, respectively, reduced fluorescent intensity compared to CML-injected embryos. The results of DHE staining showed a massive production of ROS in response to CML, which was significantly 4.2-fold higher than only PBS-treated embryos.
The CML-induced ROS production was significantly reverted by injecting OSO and SO. The embryos injected with OSO1% and OSO2% displayed 58.3% and 70.2% reduced DHE fluorescent intensity compared to CML-treated embryos. Also, a 41.6% and 54.1% reduced DHE fluorescent intensity was noticed in embryos treated with SO1% and SO2%, respectively, compared to only CML-treated embryos. The results of apoptosis and ROS staining imply the efficacy of OSO and SO to preclude CML-induced ROS production and apoptosis.
3.2. OSO rescued HCD-Fed Zebrafish from CML-Induced Mortality and Acute Paralysis
As shown in Figure 2A, severe mortality with only 17.5% survival of zebrafish was noticed in the CML alone group. Though, treatment of OSO2% induced significantly (p<0.05) counter the CML triggered mortality in zebrafishes. OSO2% group showed around 3.7-fold and 2.0-fold higher survivality than CML-alone and SO2% group, respectively, at 60 min post injection. As shown in Figure 2B, CML alone group and SO group showed severe CML-induced paralysis after 30 min of post-injection, where almost all the zebrafish were lying on the bottom of the tank without any swimming activity (Figure 2C, Supplementary Video S1). However, zebrafish co-injected with OSO2% significantly (p<0.05) recovered from the paralytic effect of CML. A 32.5% restoration of zebrafish swimming activity was noticed at 30 min post-treatment of OSO2%, which was linearly increased up to 52.5% at 60 min of post-treatment, representing 13 and 3-fold higher recovery as compared to only CML-treated zebrafish at the respective time. Also, a 2-fold higher zebrafish swimming activity was noticed in the OSO2% group compared to SO2% injected group 60 min of post-treatment. Results demonstrated the preventive role of OSO2% by restoration of swimming activity against CML-induced acute paralysis in zebrafish that consequently improved survivability (Supplementary Video S2).
3.3. OSO Ameliorated the CML-Induced Hepatic Inflammation in HCD-Fed Zebrafish
As shown in Figure 3A, of the H&E staining, a visible hepatic degeneration around the portal vein (as indicated by black arrows) was observed in CML and CML co-injected with SO1%. In contrast, OSO efficiently subdued the CML-induced hepatic degeneration visible by the low stained area of the nucleus. The hepatic tissue of OSO1% and OSO2% group displayed 29.9% and 49.9% lower H&E-stained areas than the hepatic tissue of only the CML injected group. A significantly reduced around 34.3% (p=0.001) reduction of H&E-stained area in the OSO2% injected group compared to the SO2% injected group clearly indicates the efficient hepatoprotective nature of OSO2%.
As shown in Figure 3B, the higher oil red O-stained area corresponding to fatty liver changes was observed in the hepatic tissue of CML-injected zebrafish, which was significantly reduced with the co-treatment of OSO. A 43.8% (p=0.001) and 78.9% (p<0.001) lower oil red O-stained area was observed in the OSO1% and OSO2% groups, respectively, compared to the CML-treated group. However, zebrafish co-treated with SO1% and SO2% revealed 13.3% and 28.5% lower stained areas than CML alone control group. While compared with SO2%, a significantly 71.6% (p<0.001) lower oil red O-stained area was observed in the OSO2% injected group. Results suggested a lower lipids accumulation in the hepatic tissue of zebrafish treated with OSO compared to SO and CML alone control groups.
DHE staining demonstrated the higher production of ROS in the CML-injected zebrafish, apparent by 74.3% red stained area (Figure 3C). Compared to this, a slight reduction of DHE stained area was noticed in the hepatic tissue fetched from SO2% injected zebrafish. A 61.7% DHE stained area was quantified in SO2% injected zebrafish, which was 1.2- fold lower than that of the only CML-treated group. However, injection of OSO precisely OSO2% effectively reduces the ROS production as demonstrated by only 38.3% red stained area, which is almost 1.9-fold lower than that of the stained area manifested in only CML treated group. Compared to SO2%, a 1.6-fold lower DHE stained area appeared in the OSO2% injected group, signifying higher efficacy of OSO2% to counter ROS.
Furthermore, IL-6 production in different groups was examined by the IHC staining. As depicted in Figure 3D, 37.2% IHC stained area corresponding to the IL-6 production was noticed in the hepatic tissue of the CML injected group. Injection of SO1% and SO2% did not affect the IHC-stained area, evidenced by 33.5% and 36.6% stained areas, nearly similar to the stained area (37.2%) corresponding to the CML alone injected group. In contrast, the OSO2% injected group efficiently reduced IL-6 production. A 25.5% IHC stained area was noticed in the OSO2% injected group, which was approximately 1.5-fold lower than that of the stained area that appeared in the CML-treated group. Compared to SO2%, a significantly reduced IHC stained area around 1.4-fold (p=0.020) in the OSO2% injected group testifies to the superiority of OSO2% to block IL-6 production in zebrafish. The staining results collectively suggest that OSO2% efficiently reverted the CML-induced adverse effect exerted by ROS and proinflammatory IL-6 production.
3.4. OSO attenuated CML induced Dyslipidemia in HCD-Fed Zebrafish
Plasma lipid profiles of the zebrafish injected with CML and subsequently treated with SO and OSO are demonstrated in Figure 4. The least HDL-C level was detected in the CML-treated group. The treatment of SO and OSO at the tested concentration of 1% and 2% significantly (p<0.05) enhanced the HDL-C compared to the only CML injected group. A 29.7% and 20.7% higher HDL-C was detected in the zebrafish injected with SO2% and OSO2%, respectively, compared to only CML-treated zebrafish. Contrary to HDL-C, a higher amount of TC was quantified in CML injected group, which was significantly (p<0.05) reduced in response to SO and OSO. Furthermore, a reduced HDL-C/TC ratio was noticed in the CML-injected zebrafish that was significantly (p<0.05) improved by the injection of both OS and OSO. Treatment of SO1% and SO2% enhanced the HDL-C/TC ratio by 21.2% and 23.9%, respectively, compared to the CML-injected group. However, a more profound effect with 31.4% and 38.5% enhancement in HDL-C/TC ratio was observed in the OSO1% and OSO2% injected group, respectively, compared to the only CML injected group. Furthermore, the OS and OSO injection significantly (p<0.05) reduced CML-induced TG levels. An 18.6%, 24.9%, 49.9%, and 53.1% lower TG level was quantified in the SO1%, OS2%, OSO1%, and OSO2% injected groups, respectively, as compared to the only CML injected groups. Likewise, a massive level of non-HDL-C was confirmed in zebrafish injected with CML that was convincingly deterred by injecting SO and OSO. A 1.6 and 1.7-fold lower non-HDL-C was quantified in SO1% and SO2%-infused groups compared to the only CML-injected group. Contrast to the SO treatment, a more intense effect with 2.6- and 3.6-fold reduction in non-HDL-C level was demonstrated by OSO1% and OSO2%, respectively, compared to the only CML injected group. The results strongly advised the effect of SO and OSO on balancing the plasma lipid profile in the hypolipidemic zebrafish.
3.5. OSO Supplementation Increased Survivability and Decreased Body Weight of HCD-Fed Zebrafish
The survivability of zebrafish fed with HCD and the supplementation of HCD with SO and OSO were monitored up to 6 months, and the outcomes are presented in Figure 5. After 3 months of feeding, the ND group showed 100% survivability, whereas the survivability reduced to 84.0% in the HCD-fed group. In contrast, 96.7% survivability was observed in the HCD+OSO-supplemented group. Surprisingly, HCD+SO fed group exhibited the most negligible effect, with a 75.0% survivability after 3 months of feeding. Further, with an enhancement of feeding time up to 6 months, survivability was reduced in all the groups. However, better survivability was observed in HCD+OSO fed groups compared to only HCD and HCD+SO fed groups.
Additionally, a change in zebrafish body weight was observed after 3 and 6 months of feeding. All the groups that received the different food showed an enhancement in their body weight after 3 months of feeding compared to their body weight at the beginning of the experiment. However, the most noticeable effect with 61.8% and 31.3% body weight enhancement was observed in HCD+SO and only HCD fed group, respectively, after 3 months compared to their initial body weight. Contrary to this, the least body weight enhancement, with 8.5% and 18.9%, was observed in the ND and HCD+OSO supplemented groups, respectively. Further enhancement of the feeding duration up to 6 months had a non-significant impact on the body weight gain in the zebrafish that received ND and HCD+OSO diet. However, a slight enhancement (5%) in body weight was observed in the HCD+OS-fed group compared to the body weight observed at 3 months. Unlike this, a colossal change with 49.5% advancement in body weight was observed in the HCD-fed zebrafish after 6 months compared to their body weight of 3 months.
After three months consumption, the body weight of zebrafish in the ND and OSO+HCD-fed groups were 20.3% and 12.2% lower than that of zebrafish in the HCD-control group. Contrary to this, a 16.2% body weight enhancement was observed in SO+HCD fed group compared to the HCD alone group. At six months after consumption, 46.4%, 41.2% and 18.4% lower body weight were observed in ND, OSO+HCD and SO+HCD fed groups, respectively, compared with only the HCD group. Interestingly non-significant body weight changes between ND and OSO+HCD fed groups were observed during the six months of feeding, signifying the preventive role of OSO in maintaining body weight altered by HCD.
Plasma lipid profile analysis revealed that HCD increased plasma TG and TC levels by 1.7 and 3.1 folds, respectively, compared to the ND group (Figure 5C). However, OSO supplementation effectively prevents HCD enhanced plasma TG and TC levels. Surprisingly, a significantly (p<0.05) higher TC level was observed in SO supplementation with HCD compared to only HCD groups. Though, SO supplementation significantly (p<0.05) reduced HCD-induced TC. The results supported the anti-obesity effect of OSO.
3.6. OSO Supplementation Suppressed the HCD provoked Hepatic Steatosis and ROS Production
Hepatic histology is shown in Figure 6. Histological analysis with H&E staining indicated that the stained area of the nucleus in the HCD group significantly increased by 10% compared with that in the ND group. OSO supplementation significantly (p<0.05) decreased the stained area of the nucleus by 5% compared with the HCD control group (Figure 6A).
Consistent with H&E results, the hepatic oil red O-stained area in the HCD-fed group was significantly (p<0.05) 3-fold higher than that of the ND group, whereas OSO supplementation with HCD significantly (p<0.05) decreased the hepatic oil red O-stained area and was like that of the oil red O-stained area of ND group (Figure 6B). Furthermore, the DHE-stained area corresponding to ROS production was significantly 2.4-fold higher in the HCD control group compared with that in the ND group. The OSO supplementation with HCD significantly repressed the DHE-stained area compared with the HCD control and SO-supplemented HCD group (Figure 6C). These findings strongly imply the impact of OSO against HCD-induced hepatic steatosis.
4. Discussion
Abnormal lipid profile, oxidative stress, and inflammation are severe pathological components, which are responsible for the onset of several diseases, such as heart failure, diabetes, dementia [25, 26]. Being overweight and obese is also a global challenge due to sedentary life style and consuming junk food that enhances the risk of various disorders such as heart disease [27]. Many research and development are underway to develop efficient, safe, natural compounds, oils and extracts that can maintain the lipid profile, oxidative stress, and inflammation.
Sunflower oil (SO) is the second most widely used edible oil and has an abundance of linoleic acid, oleic acid, and saturated fatty acids [28]. Besides contains a substantial amount of vitamins and minerals [29]. Due to diverse phytoconstituents, SO has a substantial derma protective effect and antimicrobial activity against various microorganisms [28]. Several methods can improve the medicinal and functional properties of SO. One such approach is ozonation, in which ozone gas is influx in SO for a set of times that may vary from a few hours to several days. During ozonation, ozone acts on the unsaturation site of the SO. As well as increase of the oxygen content in SO, the ozonation produces a variety of carboxylic acids, aldehydes, ozonides and peroxide species responsible for the diverse biofunctionality to treat variety of ailments [14,30].
Strikingly, several preclinical and clinical studies recommended a safe nature of OSO [31], fortifying the utilization of OSO as a natural product. Accumulating reports revealed the OSO displayed potent antioxidant and antimicrobial potential [15,31,32]; nonetheless, a limited study revealed the other beneficial effects of OSO precisely against dyslipidemia and hepatic inflammation in zebrafish [15]. However, our research group has been working on different bio functionality of OSO; in one such effort, we have confined the protective effect of OSO against oxidative stress-induced damage in zebrafish embryos [15]. To extend our study herein, we attempted to decode the comparative effect of OSO and SO against CML-induced toxicity and hepatic inflammation in HCD-fed zebrafish. Zebrafish share higher homology with the human genome [33] and are considered as an excellent model for preclinical [34] and toxicological studies [35]. Many reports have suggested that the preclinical efficacy of small molecules tested in zebrafish was useful to be further entered the clinical trials [34], thus testifying zebrafish suitability as an excellent model for preclinical studies. More interestingly, the lipid metabolism process of zebrafish is similar to that of humans, though the plasma lipid profiles differ from humans [36,37].
CML is well known for its toxicity owing to the induction of reactive oxygen species/ oxidative stress [22,38] that provokes the cellular mechanism of apoptosis. A provocative role of CML on the proapoptotic regulators such as Bcl-2/Bax, caspase 3, and caspase 9 has also been documented [39]. In the present study, CML was used as an inducer for oxidative stress and inflammation in the hyperlipidemic zebrafish as our recent report [19] and the amelioration effect of SO and OSO was evaluated. We observed that OSO2% effectively protected the embryo survival and restoration of structural and development deformities against the adversity imposed by CML.
Moreover, an enhanced effect was exhibited by OSO2% compared to the SO2%, suggesting the positive impact of ozonation on the functionality of SO. These observations are in accordance with the previous study that documented the merits of ozonation over native oils [15]. The superior activity of OSO2% was probably due to the presence of a variety of ozone-catalyzed compounds [14, 30] that are well-known for their diverse biological activities [40]. Furthermore, OSO2%, as compared to SO2%, strongly diminishes the CML-induced oxidative stress evident by the low fluorescent intensity in DHE-stained embryos. Also, the low intensity of AO-stained green fluorescence in embryos injected with CML+OSO2% compared to only CML and CML co-injected with SO2% demonstrates inhibition of apoptosis by OSO2%. The outcomes of AO staining endorse the results observed for embryo survivability and strengthen the notion that OSO2% promotes anti-apoptotic events, consequently leading to higher embryo survival. Numerous reports suggest that ROS-induced oxidative stress provokes the apoptotic cascade, leading to cellular death [41, 42].
We presume that OSO, owing to its significant antioxidant activity [15], scavenges ROS or induces the cellular antioxidant machinery, renders the CML-induced oxidative stress, and finally prevents embryo death. The notion is strongly supported by the earlier study documenting OSO to stimulate cellular antioxidants (superoxide dismutase (SOD) and glutathione peroxidase (GSH-px), which diminishes the alcohol induced oxidative stress in rats [31]. Additionally, an affirmative role of OSO in the structural alteration of HDL3 has been described [15]. The altered HDL3 enhances the functionality of paraoxonase-1, a vital biomarker associated with counter inflammation and oxidative stress [43].
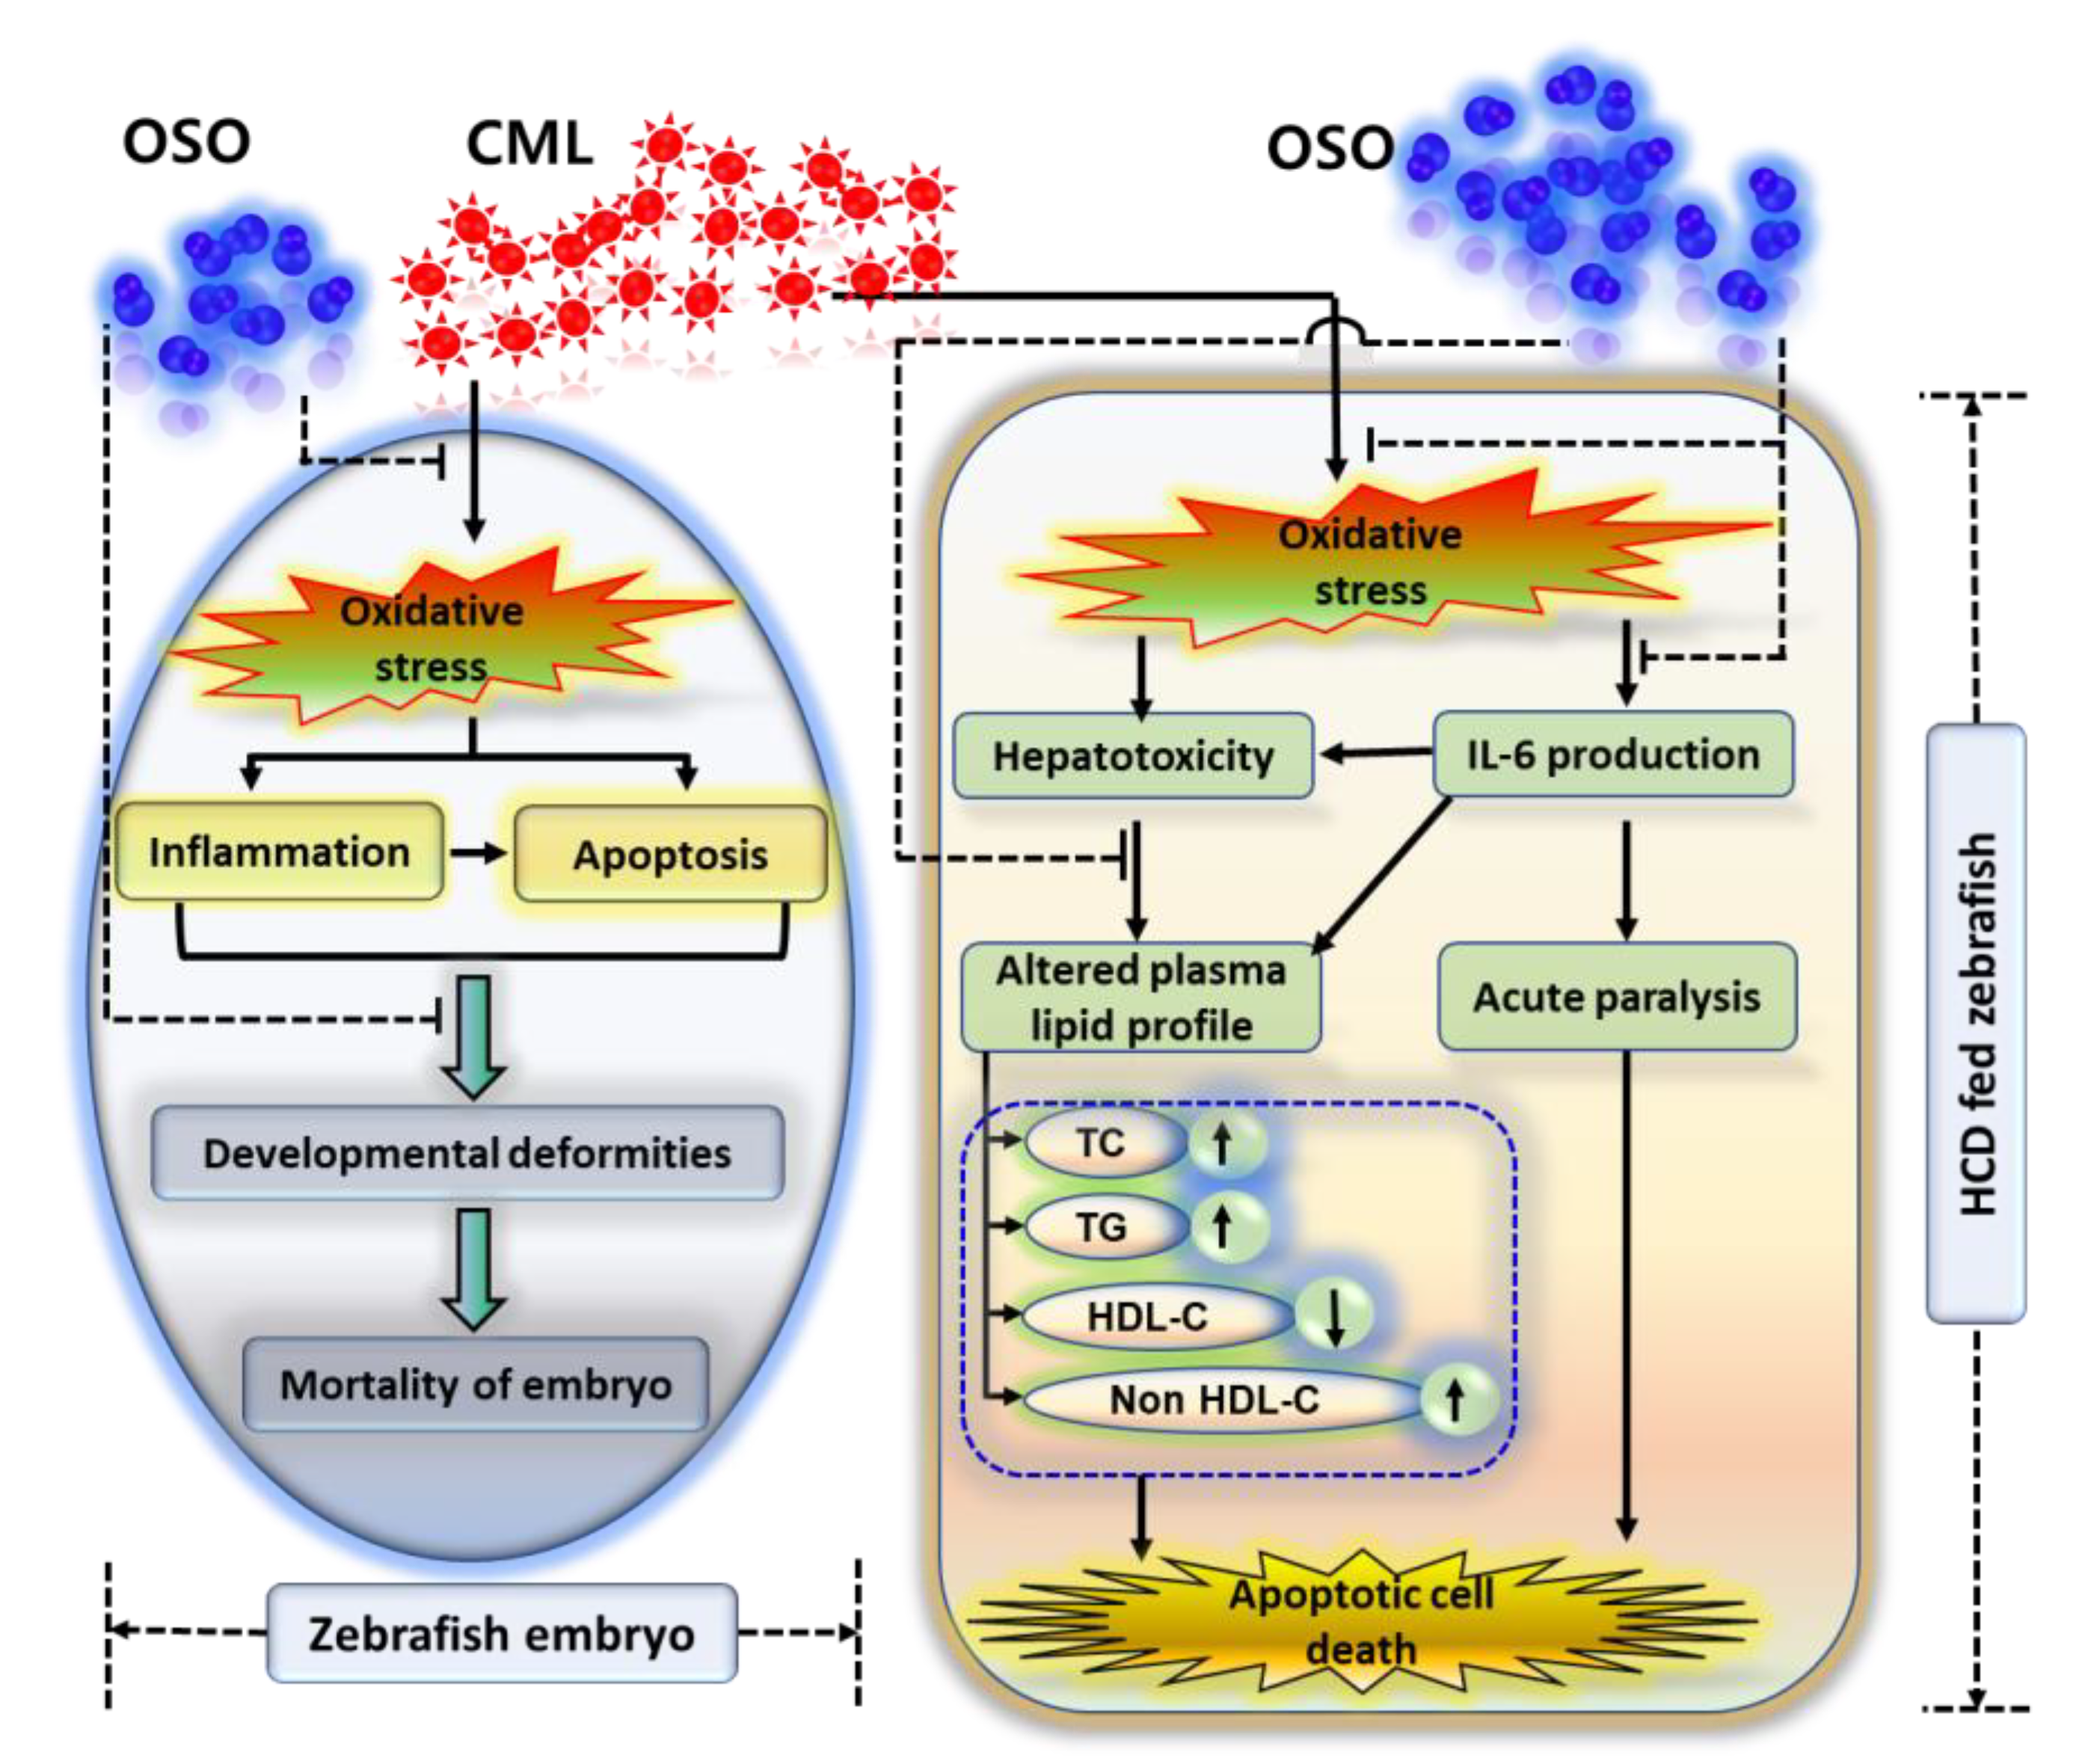
The finding collectively indicates that OSO2% due to its antioxidant nature balance the CML induced oxidative stress and subsequently prevent the inflammation and apoptosis and suppress the mortality and developmental deformities of zebrafish embryos (Figure 7). Furthermore, the effect of OSO against CML induced acute paralysis was determined in adult zebrafish fed with HCD (4%). In our previous study we have documented the resistance of HCD fed zebrafish towards the low dose of CML [22], hence, we have treated the zebrafish with the high amount of CML (final 500 μM, equivalent to 6 mM in around 300 mg body weight of zebrafish) and checked the acute paralysis by observing the swimming behavior at 30- and 60-min post injection [19]. The OSO2% group showed a great resilience against the acute paralytic toxicity of the CML evident by the higher swimming percentage (32.5%) which progressively increased up to 52.5% with time. Contrast to this SO1% and SO2% found less effective towards the revival of swimming activity against CML induced acute paralysis. Though, the exact mechanism of survival against the CML induced paralysis is not known. Probably the antioxidant and anti-inflammatory role of OSO may be a leading cause for such kind of effect. This notion is supported by reports showing the association of inflammation with paralytic disorder. Even more our recent study described the effective role of CIGB-258 and tocilizumab (IL-6 inhibitor) towards the revival of zebrafish swimming pattern against CML induced acute paralysis [19, 22]. Furthermore, we have reported that CIGB-258 inhibited the IL-6 production thus suppresses the inflammation implying that inflammation may be one of culprit for acute paralysis [21, 53].
Also, OSO displayed hepatic prevention against CML-induced hepatic damage in HCD-fed zebrafish. A higher infiltration of neutrophils, as depicted in the H&E-stained area, was dose-dependently reduced by the treatment of OSO. The Oil red O staining suggested the curative role of OSO2% against CML-induced fatty liver changes in hyperlipidemic adult zebrafish. Consistent with this, the OSO2% diminished a CML-induced higher production of IL-6 and ROS in HCD fed zebrafish. IL-6 is an important proinflammatory cytokine associated with various disorders such as rheumatoid arthritis (RA), Crohn's disease, and multiple sclerosis [44]. An antioxidant role of OSO2% might be a reason for the inhibition of IL-6, consistent with the reports suggesting an inflammatory pathway induction by oxidative stress [45]. Combined results of ROS staining in embryos and of the hyperlipidemic zebrafish suggest the effect of OSO2% to balance oxidative stress, which is consistent with our earlier report suggesting an antioxidant nature of OSO [15].
Although several studies have reported that OSO has antioxidant, antimicrobial, and antifungal activities, only a few studies have evaluated its lipid-lowering effects. Herein, OSO2% displayed the healing effect on dyslipidemia by reducing TG, TC, and non-HDL-C levels in HCD-supplemented CML injected zebrafish. Elevated IL-6 might be the main culprit of the lipid profile imbalance in CML treated group. The notion was strongly supported by the previous findings demonstrating a correlation between serum IL-6 and TG [46]. Also, the previous report suggested that IL-6 stimulated the TG secretion in the blood of rats just after 2 h post-injection [47]. Our findings demonstrated the low accumulation of IL-6 in the hepatic tissue treated with OSO2% and consequently have a balancing effect on the serum lipid profile. Varieties of the inflammatory disorder emerge with the imbalance of the serum lipid profile, such as in the patients of RA, a decreased HDL-C and apolipoprotein A-I level with elevation of IL-6 were observed [48, 49].
Similarly, in systemic lupus erythematous (SLE) and psoriasis, a decreased HDL and higher TG levels were observed [50]. Moreover, many drugs for treating RA, SLE, and psoriasis significantly affect the serum lipid profile, thus strongly advocating the central role of inflammation in balancing the lipid profile [50]. The pathophysiology of infection and inflammation suggested the deep involvement of cytokines, including IL-6, in the abnormal serum lipid profile [51]. For example, several cytokines, such as IL-6, were found actively to increase serum triglyceride and very low-density lipoproteins (VLDL) [51]. We believe the anti-inflammatory activity (suggested by IL-6 staining) is the major reason responsible for the balancing of serum lipid profile by OSO2%. A potential role of linolenic acid and oleic acid to reduce cholesterol has been cited in the literature, and this may be the other reason for the diminished cholesterol in OSO2% group as these two are the essential components of SO, in turn, OSO [29].
A noteworthy role of OSO was also observed in maintaining the body weight, liver fibrosis and lipidosis in zebrafish against prolonged consumption exposure to HCD. We speculated these effects originated from the antioxidant and anti-inflammatory activity of OSO, which following the published article suggesting an association between obesity and oxidative stress, lipid metabolism, and IL-6 [26, 52].
5. Conclusions
OSO neutralizes CML-induced toxicity by suppressing oxidative stress and apoptosis, consequently preventing zebrafish embryos' developmental deformities and mortality. The OSO treatment triggered a prompt revival of zebrafish from CML-induced paralysis with survivability from acute hepatic inflammation and displayed a significant credential to maintain dyslipidemia and steatosis. OSO prevents the fatal effect exerted by prolonged intake of HCD by maintaining hepatic morphology, serum lipid profile, body weight maintenance and higher survivability. The results endorse using OSO as a natural curative agent for hyperlipidemia, oxidative stress, and inflammatory-related disorders.
Author Contributions
Conceptualization, K.-H.C.; methodology, H.-J.N, J.-E.K, D.-J.K, A.B; data curation, writing—original draft preparation, K.-H.C. and A.B; writing—review and editing, K.-H.C., supervision, K-H.C.; All authors have read and agreed to the published version of the manuscript.
Funding
This research received no external funding.
Institutional Review Board Statement
The animal study protocol was approved by Committee of Animal Care and Use of Raydel Research Institute (approval code RRI-20-004).
Informed Consent Statement
Not applicable.
Data Availability Statement
The data used to support the findings of this study are available from the corresponding author upon reasonable request.
Conflicts of Interest
The authors declare no conflict of interest.
References
- Hong, N.; Lin, Y.; Ye, Z.; Yang, C.; Huang, Y.; Duan, Q.; Xie, S. The relationship between dyslipidemia and inflammation among adults in east coast China: A cross-sectional study. Front. Immunol. 2022, 13, 937201. [Google Scholar] [CrossRef] [PubMed]
- Duan, L.; Rao, X.; Sigdel, K.R. Regulation of Inflammation in Autoimmune Disease. J. Immunol. Res. 2019, 2019, 1–2. [Google Scholar] [CrossRef]
- Robinson, G.; Pineda-Torra, I.; Ciurtin, C.; Jury, E.C. Lipid metabolism in autoimmune rheumatic disease: implications for modern and conventional therapies. J. Clin. Investig. 2022, 132. [Google Scholar] [CrossRef] [PubMed]
- Bäck, M.; Yurdagul, A., Jr.; Tabas, I.; Öörni, K.; Kovanen, P.T. Inflammation and its resolution in atherosclerosis: mediators and therapeutic opportunities. Nat. Rev. Cardiol. 2019, 16, 389–406. [Google Scholar] [CrossRef] [PubMed]
- Hedayatnia, M.; Asadi, Z.; Zare-Feyzabadi, R.; Yaghooti-Khorasani, M.; Ghazizadeh, H.; Ghaffarian-Zirak, R.; Nosrati-Tirkani, A.; Mohammadi-Bajgiran, M.; Rohban, M.; Sadabadi, F.; et al. Dyslipidemia and cardiovascular disease risk among the MASHAD study population. Lipids Heal. Dis. 2020, 19, 1–11. [Google Scholar] [CrossRef] [PubMed]
- Perry, R.J.; Samuel, V.T.; Petersen, K.F.; Shulman, G.I. The role of hepatic lipids in hepatic insulin resistance and type 2 diabetes. Nature 2014, 510, 84–91. [Google Scholar] [CrossRef] [PubMed]
- Subramanian, S.; Goodspeed, L.; Wang, S.; Kim, J.; Zeng, L.; Ioannou, G.N.; Haigh, W.G.; Yeh, M.M.; Kowdley, K.V.; O'Brien, K.D.; et al. Dietary cholesterol exacerbates hepatic steatosis and inflammation in obese LDL receptor-deficient mice. J. Lipid Res. 2011, 52, 1626–1635. [Google Scholar] [CrossRef]
- Cao, X.-L.; Du, J.; Zhang, Y.; Yan, J.-T.; Hu, X.-M. Hyperlipidemia exacerbates cerebral injury through oxidative stress, inflammation and neuronal apoptosis in MCAO/reperfusion rats. Exp. Brain Res. 2015, 233, 2753–2765. [Google Scholar] [CrossRef]
- Soehnlein, O.; Libby, P. Targeting inflammation in atherosclerosis — from experimental insights to the clinic. Nat. Rev. Drug Discov. 2021, 20, 589–610. [Google Scholar] [CrossRef]
- Di Mauro, R.; Cantarella, G.; Bernardini, R.; Di Rosa, M.; Barbagallo, I.; Distefano, A.; Longhitano, L.; Vicario, N.; Nicolosi, D.; Lazzarino, G.; et al. The Biochemical and Pharmacological Properties of Ozone: The Smell of Protection in Acute and Chronic Diseases. Int. J. Mol. Sci. 2019, 20, 634. [Google Scholar] [CrossRef]
- Liu, L.; Zeng, L.; Gao, L.; Zeng, J.; Lu, J. Ozone therapy for skin diseases: Cellular and molecular mechanisms. Int. Wound J. 2022, 20, 2376–2385. [Google Scholar] [CrossRef] [PubMed]
- Greene, A.K.; Guzel-Seydim, Z.; Seydim, A.C. Chemical and physical properties of ozone in Ozone in food processing. John Wiley and Sons, Oxford, UK: 2012; 19–31.
- Egorova, G.V.; Voblikova, V.A.; Sabitova, L.V.; Tkachenko, I.S.; Tkachenko, S.N.; Lunin, V.V. Ozone Solubility in Water. Mosc. Univ. Chem. Bull. 2015, 70, 207–210. [Google Scholar] [CrossRef]
- Ugazio, E.; Tullio, V.; Binello, A.; Tagliapietra, S.; Dosio, F. Ozonated Oils as Antimicrobial Systems in Topical Applications. Their Characterization, Current Applications, and Advances in Improved Delivery Techniques. Molecules 2020, 25, 334. [Google Scholar] [CrossRef] [PubMed]
- Cho, K.-H.; Kang, D.-J.; Nam, H.-S.; Kim, J.-H.; Kim, S.-Y.; Lee, J.-O.; Kim, B.-J. Ozonated Sunflower Oil Exerted Protective Effect for Embryo and Cell Survival via Potent Reduction Power and Antioxidant Activity in HDL with Strong Antimicrobial Activity. Antioxidants 2021, 10, 1651. [Google Scholar] [CrossRef] [PubMed]
- Menéndez, S.; Falcón, L.; Maqueira, Y. Therapeutic efficacy of topical OLEOZON® in patients suffering from onychomycosis. Mycoses 2010, 54, e272–e277. [Google Scholar] [CrossRef] [PubMed]
- Nusslein-Volhard, C.; Dahm, R. Zebrafish: A practical approach, 1st ed.; Oxford University Press: Oxford, UK, 2002. [Google Scholar]
- NRC) National Research Council of the National Academy of Sciences. Guide for the care and use of laboratory animals; national academy press: Washington, DC, USA, 2010. [Google Scholar]
- Cho, K.-H.; Kim, J.-E.; Nam, H.-S.; Kang, D.-J.; Na, H.-J. Anti-Inflammatory Activity of CIGB-258 against Acute Toxicity of Carboxymethyllysine in Paralyzed Zebrafish via Enhancement of High-Density Lipoproteins Stability and Functionality. Int. J. Mol. Sci. 2022, 23, 10130. [Google Scholar] [CrossRef]
- Owusu-Ansah, E.; Yavari, A.; Mandal, S.; Banerjee, U. Distinct mitochondrial retrograde signals control the G1-S cell cycle checkpoint. Nat. Genet. 2008, 40, 356–361. [Google Scholar] [CrossRef]
- Umali, J.; Hawkey-Noble, A.; French, C.R. Loss of foxc1 in zebrafish reduces optic nerve size and cell number in the retinal ganglion cell layer. Vis. Res. 2019, 156, 66–72. [Google Scholar] [CrossRef]
- Cho, K.-H.; Nam, H.-S.; Kim, J.-E.; Na, H.-J.; Dominguez-Horta, M.d.C.; Martinez-Donato, G. CIGB-258 Exerts Potent Anti-Inflammatory Activity against Carboxymethyllysine-Induced Acute Inflammation in Hyperlipidemic Zebrafish via the Protection of Apolipoprotein A-I. Int. J. Mol. Sci. 2023, 24, 7044. [Google Scholar] [CrossRef]
- Fischer, A.H.; Jacobson, K.A.; Rose, J.; Zeller, R. Hematoxylin and eosin staining of tissue and cell sections. In Basic Methods in Microscopy; Cold Spring Harbor Laboratory Press: New York, NY, USA, 2006. [Google Scholar]
- Shull, L.C.; Sen, R.; Menzel, J.; Goyama, S.; Kurokawa, M.; Artinger, K.B. The conserved and divergent roles of Prdm3 and Prdm16 in zebrafish and mouse craniofacial development. Dev. Biol. 2020, 461, 132–144. [Google Scholar] [CrossRef]
- Tangvarasittichai, S. Oxidative stress, insulin resistance, dyslipidemia and type 2 diabetes mellitus. World J. Diabetes 2015, 6, 456–480. [Google Scholar] [CrossRef] [PubMed]
- Manna, P.; Jain, S.K.; D, P.; Richardson, M.R.; Boyer, W.R.; Johnson, T.M.; Churilla, J.R.; Devaraj, S.; Adams-Huet, B.; Jialal, I.; et al. Obesity, Oxidative Stress, Adipose Tissue Dysfunction, and the Associated Health Risks: Causes and Therapeutic Strategies. Metab. Syndr. Relat. Disord. 2015, 13, 423–444. [Google Scholar] [CrossRef] [PubMed]
- Lakka, T.A.; Bouchard, C. Physical activity, obesity and cardiovascular diseases. Handb. Exp. Pharmacol. 2005, 170, 137–163. [Google Scholar]
- Nandha, R.; Singh, H.; Garg, K.; Rani, S. A review on “Therapeutic potential of sunflower seeds”. Int. J. Res. Dev. Pharm. L. Sci. 2014, 3, 967–972. [Google Scholar]
- Khan, S.; Choudhary, S.; Pandey, A.; Khan, M.K.; Thomas, G. Sunflower oil: Efficient oil source for human consumption. Emer. Life Sci. Res. 2015, 1, 1–3. [Google Scholar]
- Moureu, S.; Violleau, F.; Haimoud-Lekhal, D.A.; Calmon, A. Ozonation of sunflower oils: Impact of experimental conditions on the composition and the antibacterial activity of ozonized oils. Chem. Phys. Lipids 2015, 186, 79–85. [Google Scholar] [CrossRef]
- Rodríguez, Z.B.Z.; Álvarez, R.G.; Guanche, D.; Merino, N.; Rosales, F.H.; Cepero, S.M.; González, Y.A.; Schulz, S. Antioxidant Mechanism is Involved in the Gastroprotective Effects of Ozonized Sunflower Oil in Ethanol-Induced Ulcers in Rats. Mediat. Inflamm. 2007, 2007, 1–6. [Google Scholar] [CrossRef]
- Rodriguez, Z.Z.; Lemus, M.; Fleitas, E. Efficacy of ozonized sunflower oil as treatment of canine generalized demodicosis. Insights Vet. Sci. 2021, 5, 15–21. [Google Scholar]
- Gupta, H.R.; Patil, Y.; Singh, D.; Thakur, M. Embryonic Zebrafish Model - A Well-Established Method for Rapidly Assessing the Toxicity of Homeopathic Drugs - Toxicity Evaluation of Homeopathic Drugs Using Zebrafish Embryo Model -. J. Pharmacopunct. 2016, 19, 319–328. [Google Scholar] [CrossRef]
- Patton, E.E.; Zon, L.I.; Langenau, D.M. Zebrafish disease models in drug discovery: from preclinical modelling to clinical trials. Nat. Rev. Drug Discov. 2021, 20, 611–628. [Google Scholar] [CrossRef]
- Juan-García, A.; Bind, M.-A.; Engert, F. Larval zebrafish as an in vitro model for evaluating toxicological effects of mycotoxins. Ecotoxicol. Environ. Saf. 2020, 202, 110909–110909. [Google Scholar] [CrossRef] [PubMed]
- Fang, L.; Liu, C.; Miller, Y.I. Zebrafish models of dyslipidemia: relevance to atherosclerosis and angiogenesis. Transl. Res. 2014, 163, 99–108. [Google Scholar] [CrossRef] [PubMed]
- Fraher, D.; Sanigorski, A.; Mellett, N.A.; Meikle, P.J.; Sinclair, A.J.; Gibert, Y. Zebrafish Embryonic Lipidomic Analysis Reveals that the Yolk Cell Is Metabolically Active in Processing Lipid. Cell Rep. 2016, 14, 1317–1329. [Google Scholar] [CrossRef] [PubMed]
- Lee, B.-H.; Hsu, W.-H.; Hsu, Y.-W.; Pan, T.-M. Suppression of dimerumic acid on hepatic fibrosis caused from carboxymethyl-lysine (CML) by attenuating oxidative stress depends on Nrf2 activation in hepatic stellate cells (HSCs). Food Chem. Toxicol. 2013, 62, 413–419. [Google Scholar] [CrossRef]
- Wang, Z.; Bao, Z.; Ding, Y.; Xu, S.; Du, R.; Yan, J.; Li, L.; Sun, Z.; Shao, C.; Gu, W. Nε-carboxymethyl-lysine-induced PI3K/Akt signaling inhibition promotes foam cell apoptosis and atherosclerosis progression. BioMedicine 2019, 115, 108880. [Google Scholar] [CrossRef] [PubMed]
- Carata, E.; Tenuzzo, B.A.; Dini, L. Powerful properties of ozonated extra virgin olive oil. In Herbal Medicine; IntechOpen Limited: London, UK, 2019. [Google Scholar]
- Alam, M.; Kariya, R.; Boonnate, P.; Kawaguchi, A.; Okada, S. Induction of apoptosis by Shikonin through ROS-mediated intrinsic and extrinsic apoptotic pathways in primary effusion lymphoma. Transl. Oncol. 2021, 14, 101006. [Google Scholar] [CrossRef] [PubMed]
- Simon, H.-U.; Haj-Yehia, A.; Levi-Schaffer, F. Role of reactive oxygen species (ROS) in apoptosis induction. Apoptosis 2000, 5, 415–418. [Google Scholar] [CrossRef]
- Litvinov, D.; Mahini, H.; Garelnabi, M. Antioxidant and anti-inflammatory role of paraoxonase 1: Implication in arteriosclerosis diseases. North Am. J. Med Sci. 2012, 4, 523–32. [Google Scholar] [CrossRef]
- Neurath, M.F.; Finotto, S. IL-6 signaling in autoimmunity, chronic inflammation and inflammation-associated cancer. Cytokine Growth Factor Rev. 2011, 22, 83–89. [Google Scholar] [CrossRef]
- Hussain, T.; Tan, B.; Yin, Y.; Blachier, F.; Tossou, M.C.; Rahu, N. Oxidative Stress and Inflammation: What Polyphenols Can Do for Us? Oxid. Med. Cell. Longev. 2016, 2016, 7432797. [Google Scholar] [CrossRef]
- Qiao, Q.; Bouwman, F.G.; A van Baak, M.; Roumans, N.J.T.; Vink, R.G.; Mariman, E.C.M. Plasma Levels of Triglycerides and IL-6 Are Associated With Weight Regain and Fat Mass Expansion. J. Clin. Endocrinol. Metab. 2022, 107, 1920–1929. [Google Scholar] [CrossRef] [PubMed]
- Nonogaki, K.; Fuller, G.M.; Fuentes, N.L.; Moser, A.H.; Staprans, I.; Grunfeld, C.; Feingold, K.R. Interleukin-6 stimulates hepatic triglyceride secretion in rats. Endocrinology 1995, 136, 2143–2149. [Google Scholar] [CrossRef] [PubMed]
- Agca. R.; Heslinga, S.C.; Rollefstad, S.; Heslinga, M.; McInnes, I.B.; Peters, M.J.; Kvien, T.K.; Dougados, M.; Radner, H.; Atzeni, F.; Primdahl, J.; Sodergren, A.; Wallberg Jonsson S.; van Rompay J.; Zabalan, C.; Pedersen, T.R.; Jacobsson, L.; de Vlam K.; Gonzalez-Gay M.A.; Semb, A.G.; Kitas, G.D.; Smulders, Y.M.; Szekanecz, Z.; Sattar, N.; Symmons, D.P.; Nurmohamed, M.T. EULAR recommendations for cardiovascular disease risk management in patients with rheumatoid arthritis and other forms of inflammatory joint disorders: 2015/2016 update. Ann. Rheum. Dis. 2017, 76, 17–28.
- Steiner, G.; Urowitz, M.B. Lipid Profiles in Patients with Rheumatoid Arthritis: Mechanisms and the Impact of Treatment. Semin. Arthritis Rheum. 2009, 38, 372–381. [Google Scholar] [CrossRef]
- Feingold, K.R.; Grunfeld, C. The effect of inflammation and infection on lipids and lipoproteins. In Endotext; Feingold, K.R., Anawalt, B., Boyce, A., Chrousos, G., Dungan, K., Grossman, A., Hershman, J.M., Kaltsas, G., Koch, C., Kopp, P., et al., Eds.; MDText.com, Inc.: South Dartmouth, MA, USA, 2000. [Google Scholar]
- Khovidhunkit, W.; Kim, M.S.; Memon, R.A.; Shigenaga, J.K.; Moser, A.H.; Feingold, K.R.; Grunfeld, C. Effects of infection and inflammation on lipid and lipoprotein metabolism: mechanisms and consequences to the host. J. Lipid Res. 2004, 45, 1169–1196. [Google Scholar] [CrossRef]
- Eder, K.; Baffy, N.; Falus, A.; Fulop, A.K. The major inflammatory mediator interleukin-6 and obesity. Inflamm. Res. 2009, 58, 727–736. [Google Scholar] [CrossRef]
Figure 1.
Effects of sunflower oil (SO) and ozonated sunflower oil (OSO) on carboxymethyllysine (CML) induced toxicity in zebrafish embryos. (A) Survivability of zebrafish embryos during 24 h post-injection; (B) Stereo images of developing zebrafish embryos at 5 h and 24 h post-fertilization. The black arrow represents the death of embryos during 5 h post-injection, while the red arrow represents developmental deformities (of eyes and tail curvature) and stunt growth at 24 h post-injection. (C) Fluorescent images of acridine orange (AO) and dihydroethidium (DHE) represent the apoptosis and ROS production in zebrafish embryos at 5 h post-injection. PBS alone group received microinjection of PBS, while the PBS+CML group received the microinjection of 500 ng CML in PBS; the CML+SO1% and SO2% groups were microinjected with 500 ng CML with SO1% and SO2%, respectively; similarly, CML+OSO1% and OSO2% groups were microinjected with 500 ng CML with OSO1% and OSO2%, respectively. The fluorescent intensity of AO and DHE stained area was quantified by Image J software version 1.53r (http://rsb.info.nih.gov/ij/ accessed on 23 January 2023). *** represents a significant difference between the mean value of PBS alone and PBS+CML group at p<0.001. Alphabets (a-c) represent the statistical significance (p<0.05) between CML alone and CML+OS or OSO-injected groups.
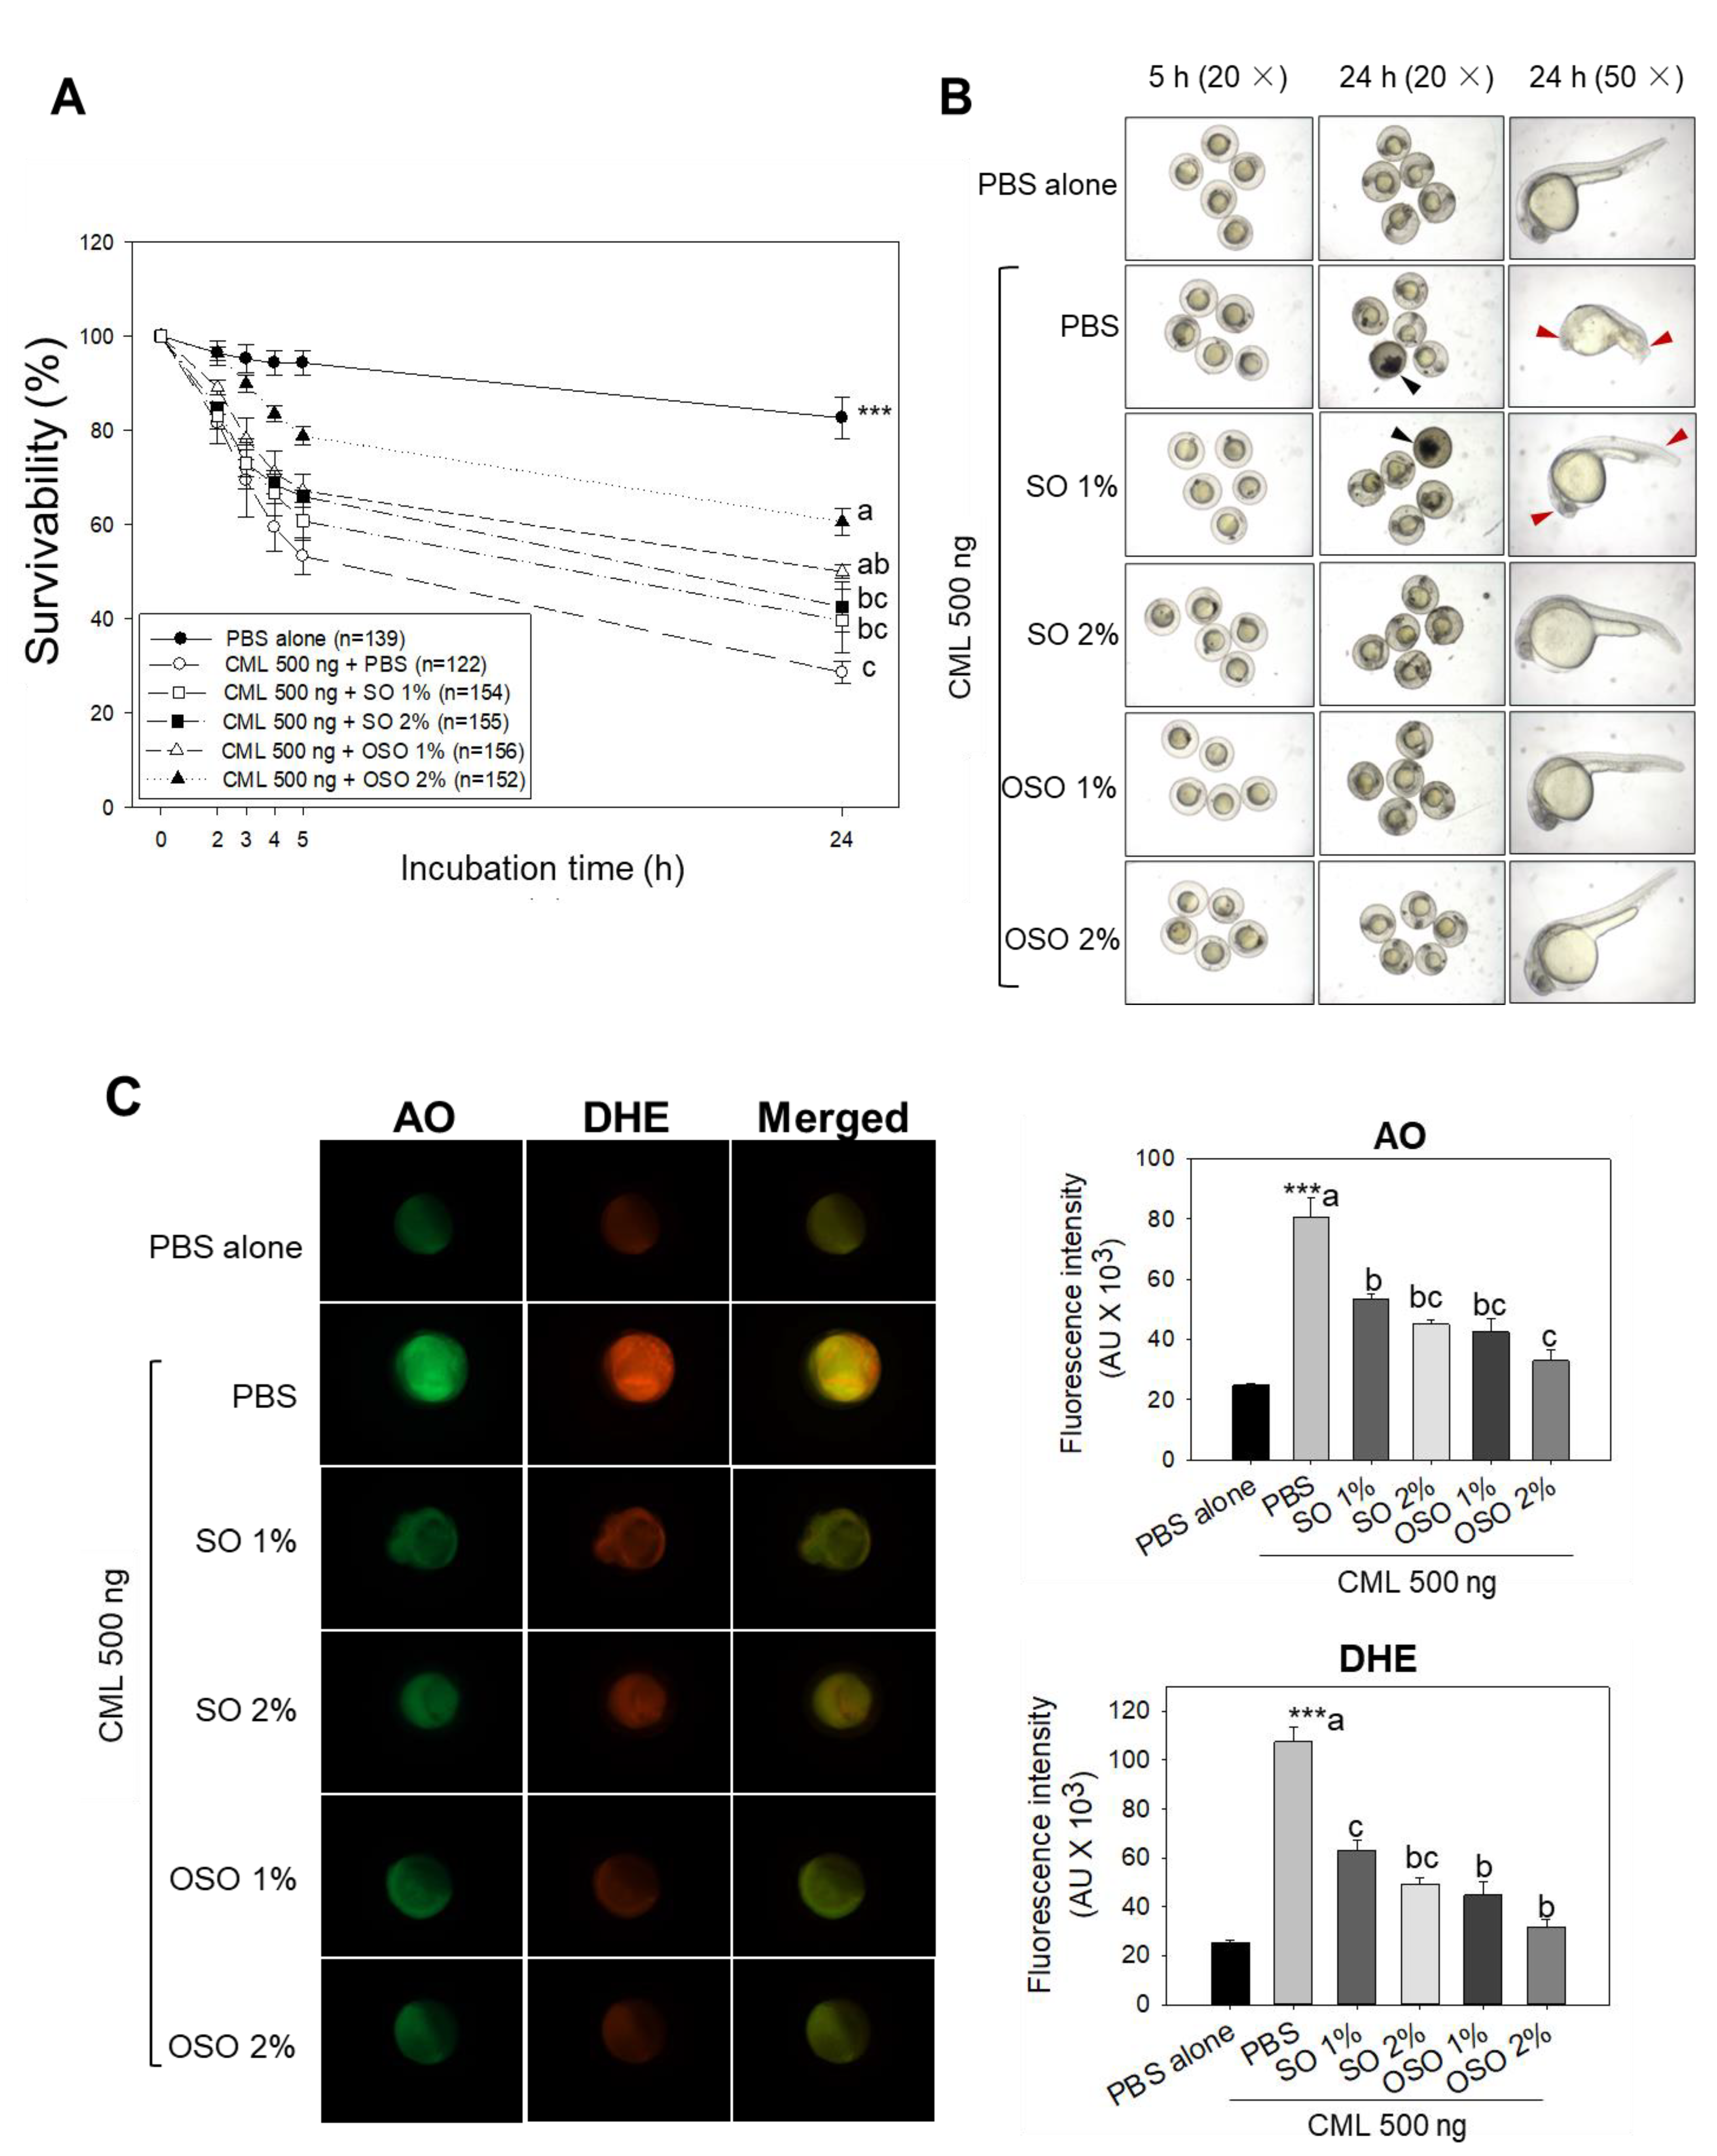
Figure 2.
Effects of sunflower oil (SO) and ozonated sunflower oil (OSO) on survivability and swimming ability of carboxymethyllysine (CML) injected adult zebrafishes maintained on the high-cholesterol diet (HCD). (A) Survivability of adult zebrafish after 60 min post-injection of CML (500 μg equivalent to 6 mM) or CML co-injected with SO1% or SO2% and OSO1% or OSO2% (B) and (C) Swimming behavior of adult zebrafish measured at 30 min and 60 min post-injection of CML (500 μg equivalent to 6 mM) alone or CML in the presence of SO1% or SO2% and OSO1% or OSO2%. Alphabets (a-b) represent the statistical significance (p<0.05) between the groups.
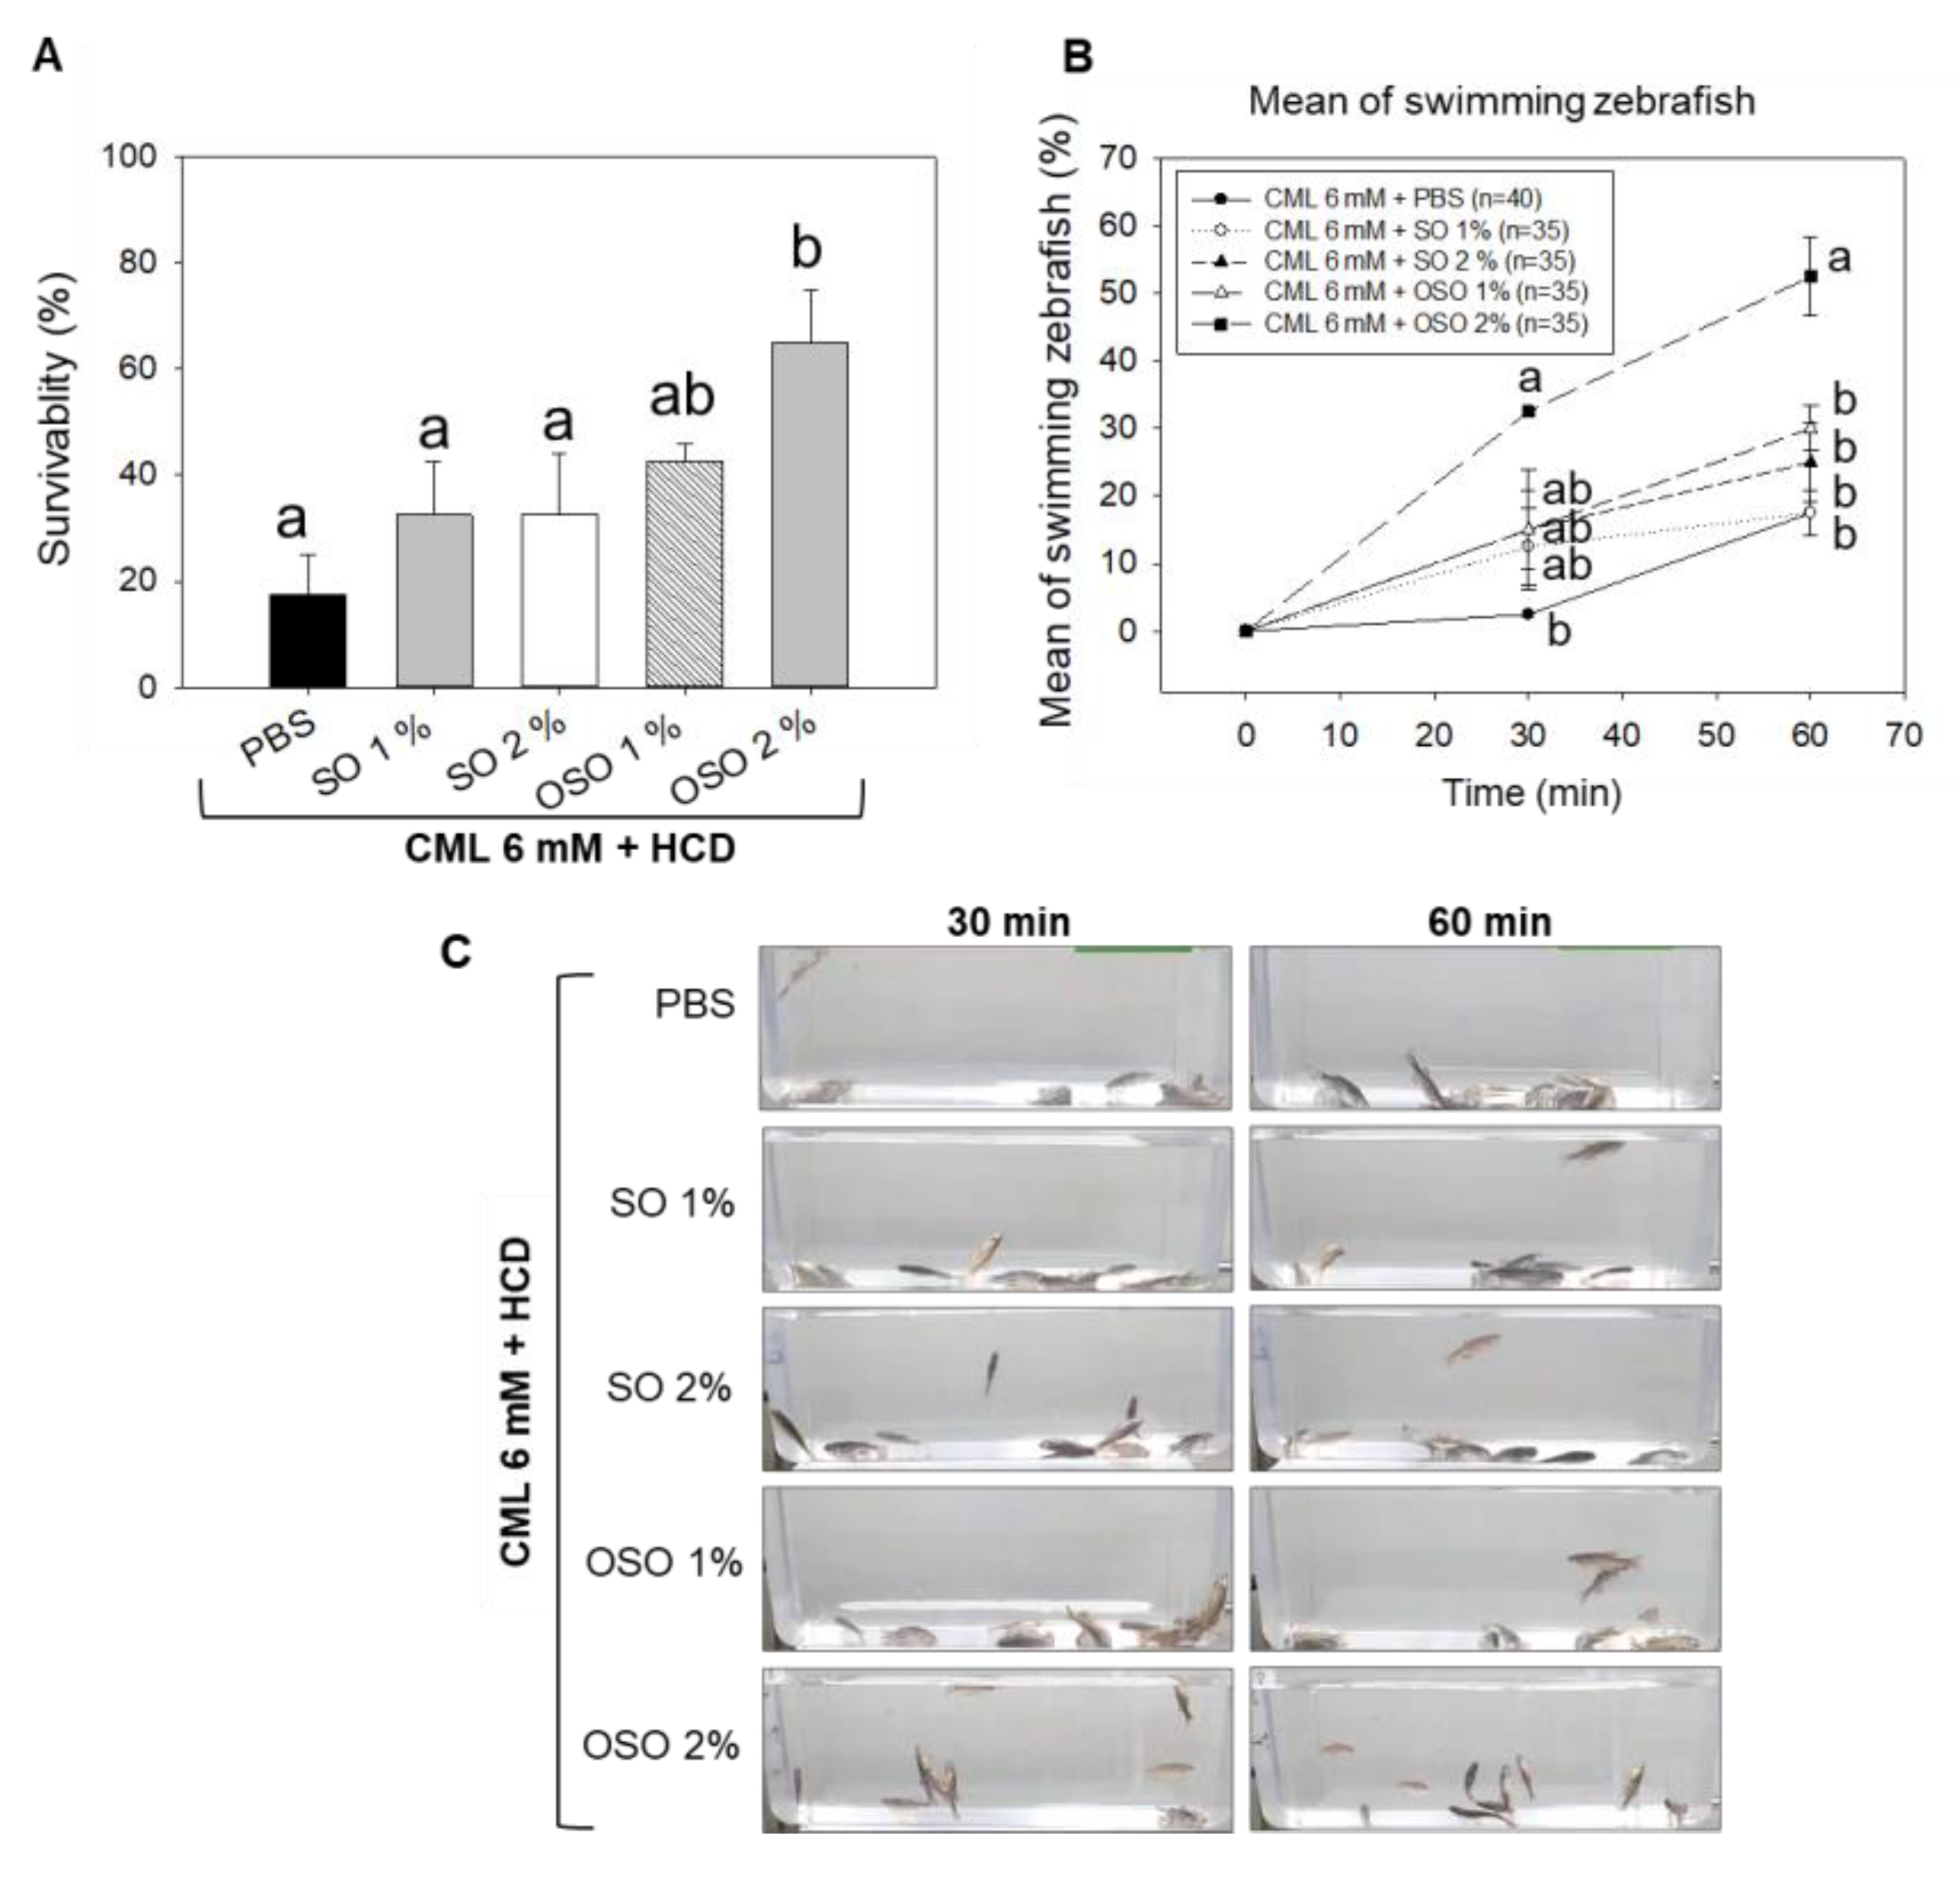
Figure 3.
Hepatic morphology, fatty liver changes, reactive oxygen species (ROS), and IL-6 production in high-cholesterol diet (HCD) consumed adult zebrafish injected with carboxymethyllysine (CML) or CML with sunflower oil (SO) and ozonated sunflower oil (OSO). (A) Hematoxylin and eosin (H&E) staining; (B) Oil red O staining. (C) Dihydroethidium (DHE) fluorescent staining for the detection of ROS. (D) Immunohistochemistry (IHC) for the analysis of IL-6 production. Scale bar equivalent to 100 μm. PBS+CML group received the microinjection of CML (500 μg equivalent to 6 mM) in PBS, while the CML+SO1% and SO2% groups were microinjected with 500 μg of CML with SO1% and SO2%, respectively; similarly, the OSO1% and OSO2% groups were micro-injected with 500 μg of CML with OSO1% and OSO2%, respectively. Zebrafish received a high-cholesterol diet (HCD) during the experiment. All the staining’s were performed on the hepatic tissue surgically acquired at 60 min post-injection. All the images were captured under a microscope at 400× magnification. The stained area in all the histological analyses was appraised by Image J software version 1.53r (http://rsb.info.nih.gov/ij/ accessed on 30 January 2023).
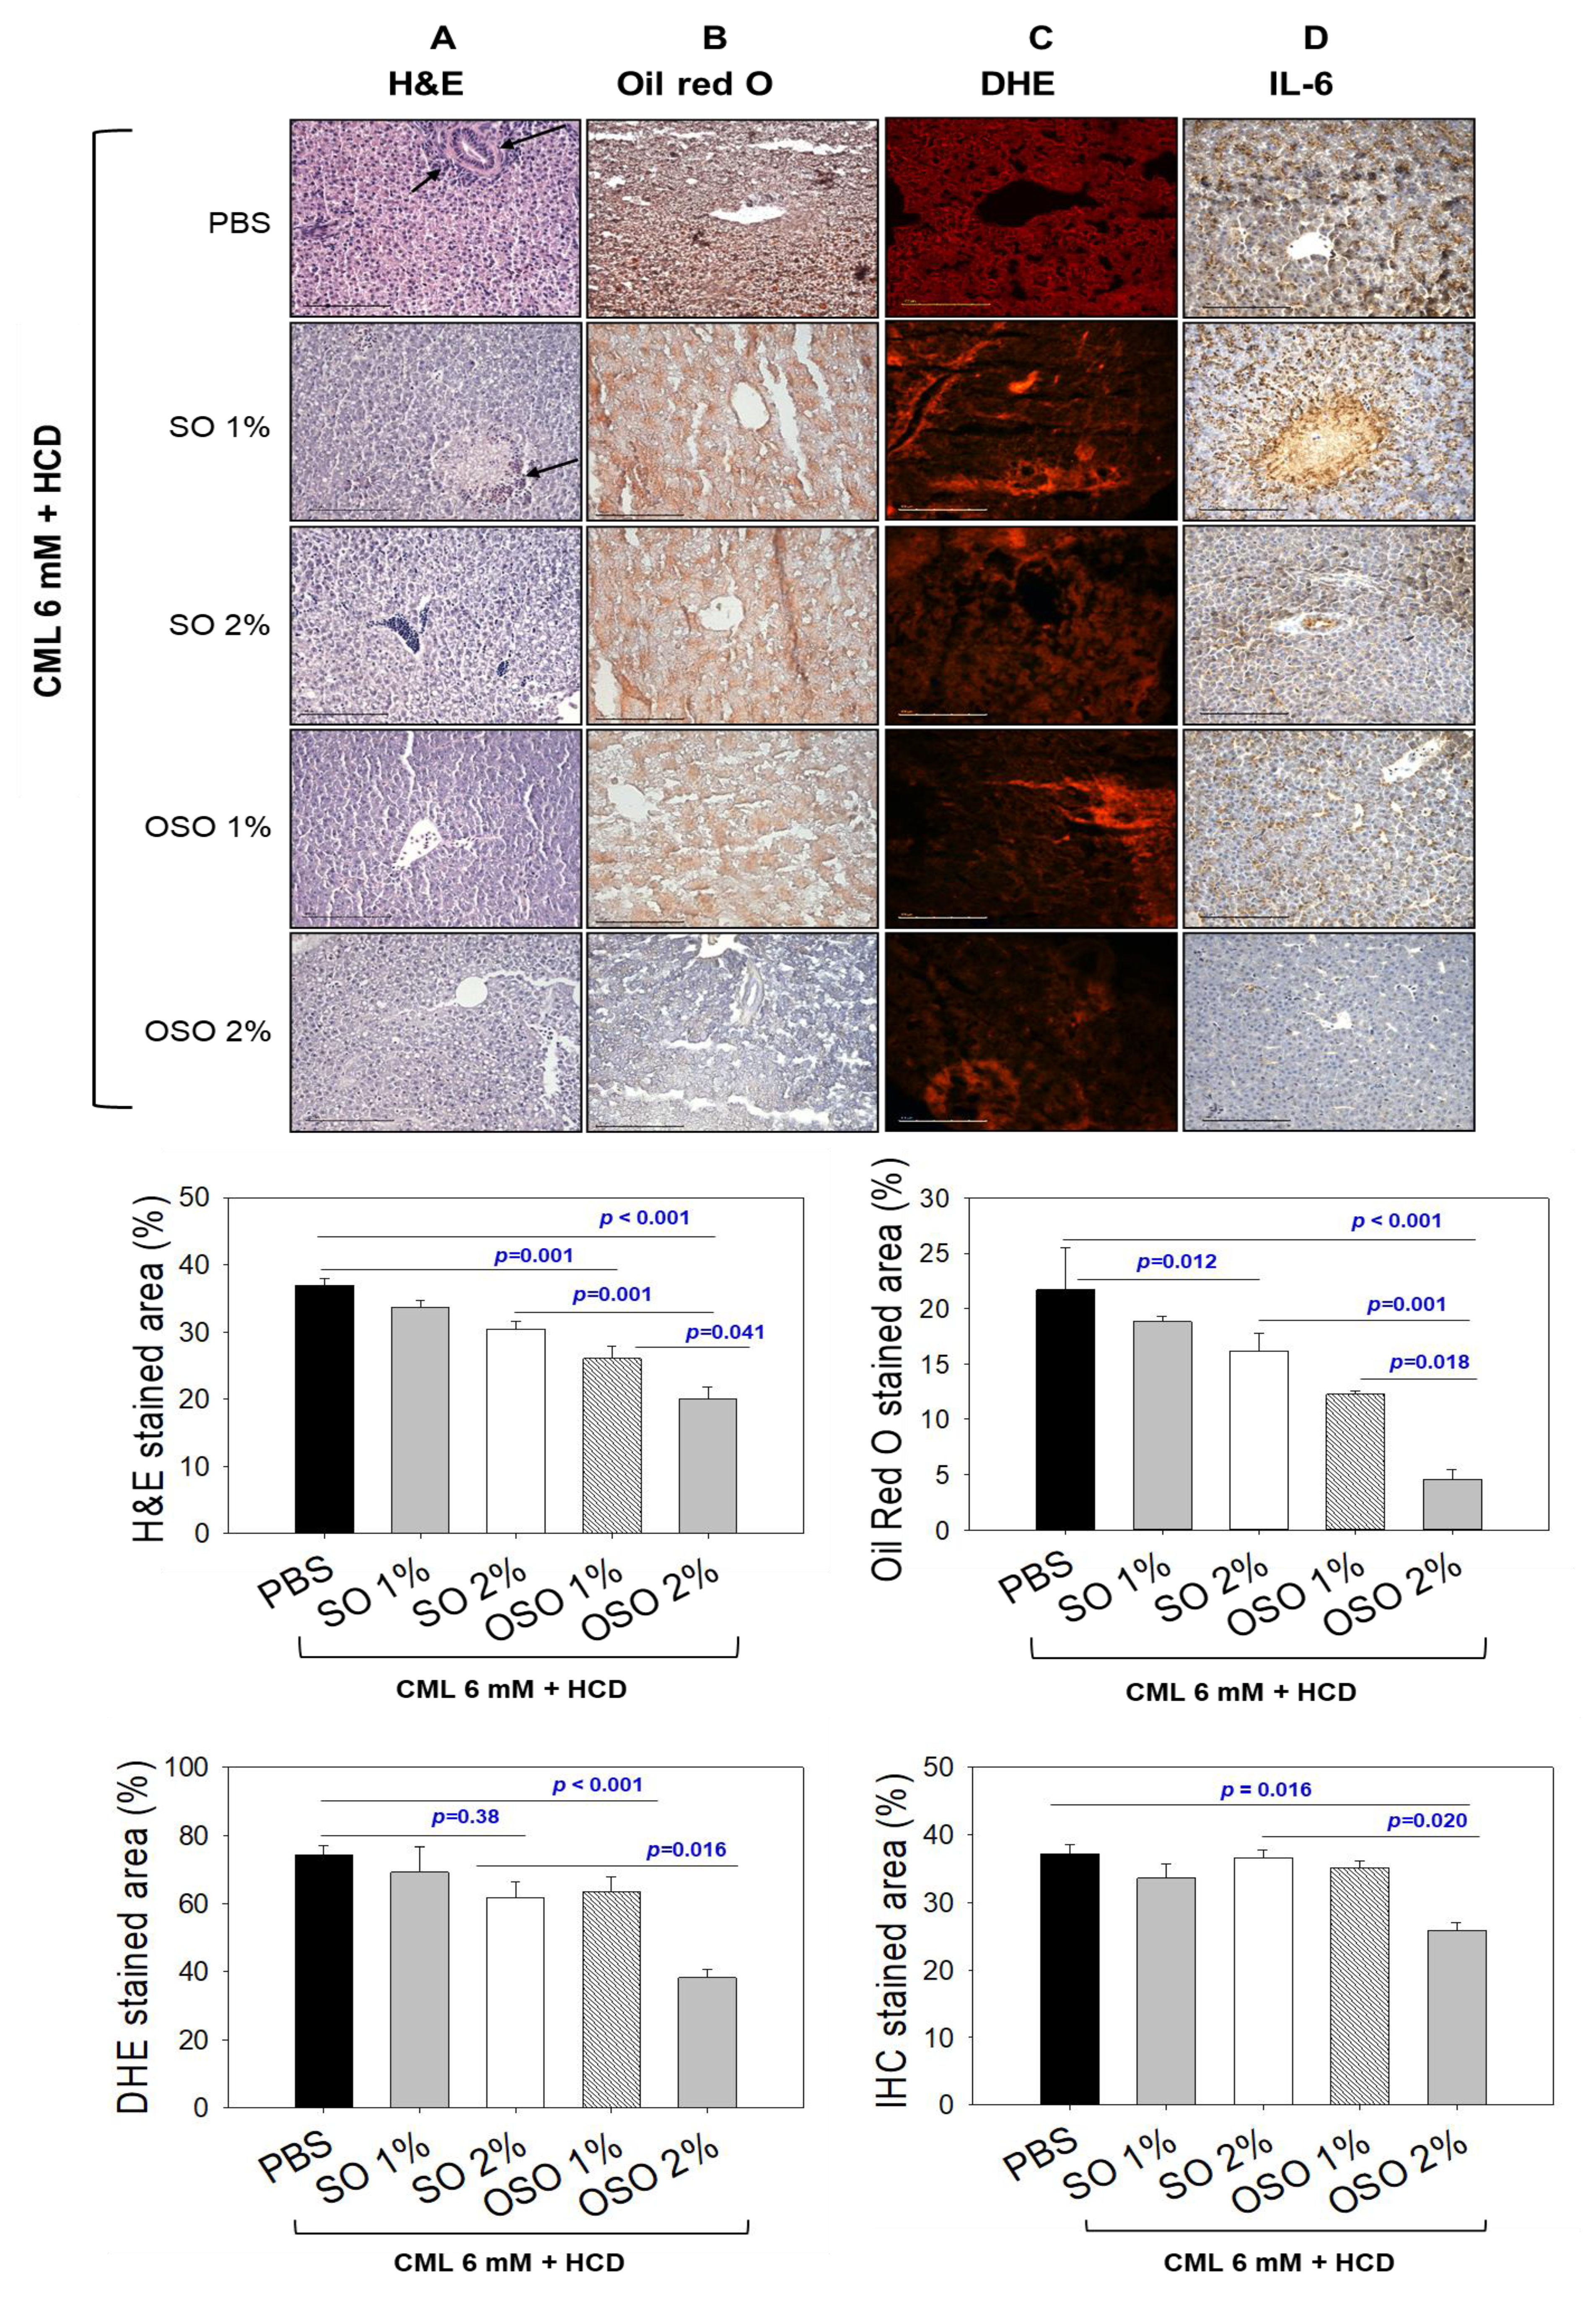
Figure 4.
Effects of sunflower oil (SO) and ozonated sunflower oil (OSO) on plasma lipid profiles in carboxymethyllysine (CML) injected adult zebrafish maintained on the high-cholesterol diet (HCD). Blood for the lipid profile from adult zebrafish was collected at 60 min post-injection. PBS+CML group received the microinjection of CML (500 μg equivalent to 6 mM) in PBS, while the CML+SO1% and SO2% groups were microinjected with 500 μg of CML with SO1% and SO2%, respectively; similarly, the CML+OSO1% and OSO2% groups were microinjected with 500 μg of CML with OSO1% and OSO2%, respectively. Alphabets (a-d) above the bar graphs represent the statistical significance (p<0.05) between different groups. TG, TC, and HDL-C are abbreviated for triglyceride, total cholesterol, and high-density lipoprotein cholesterol, respectively.
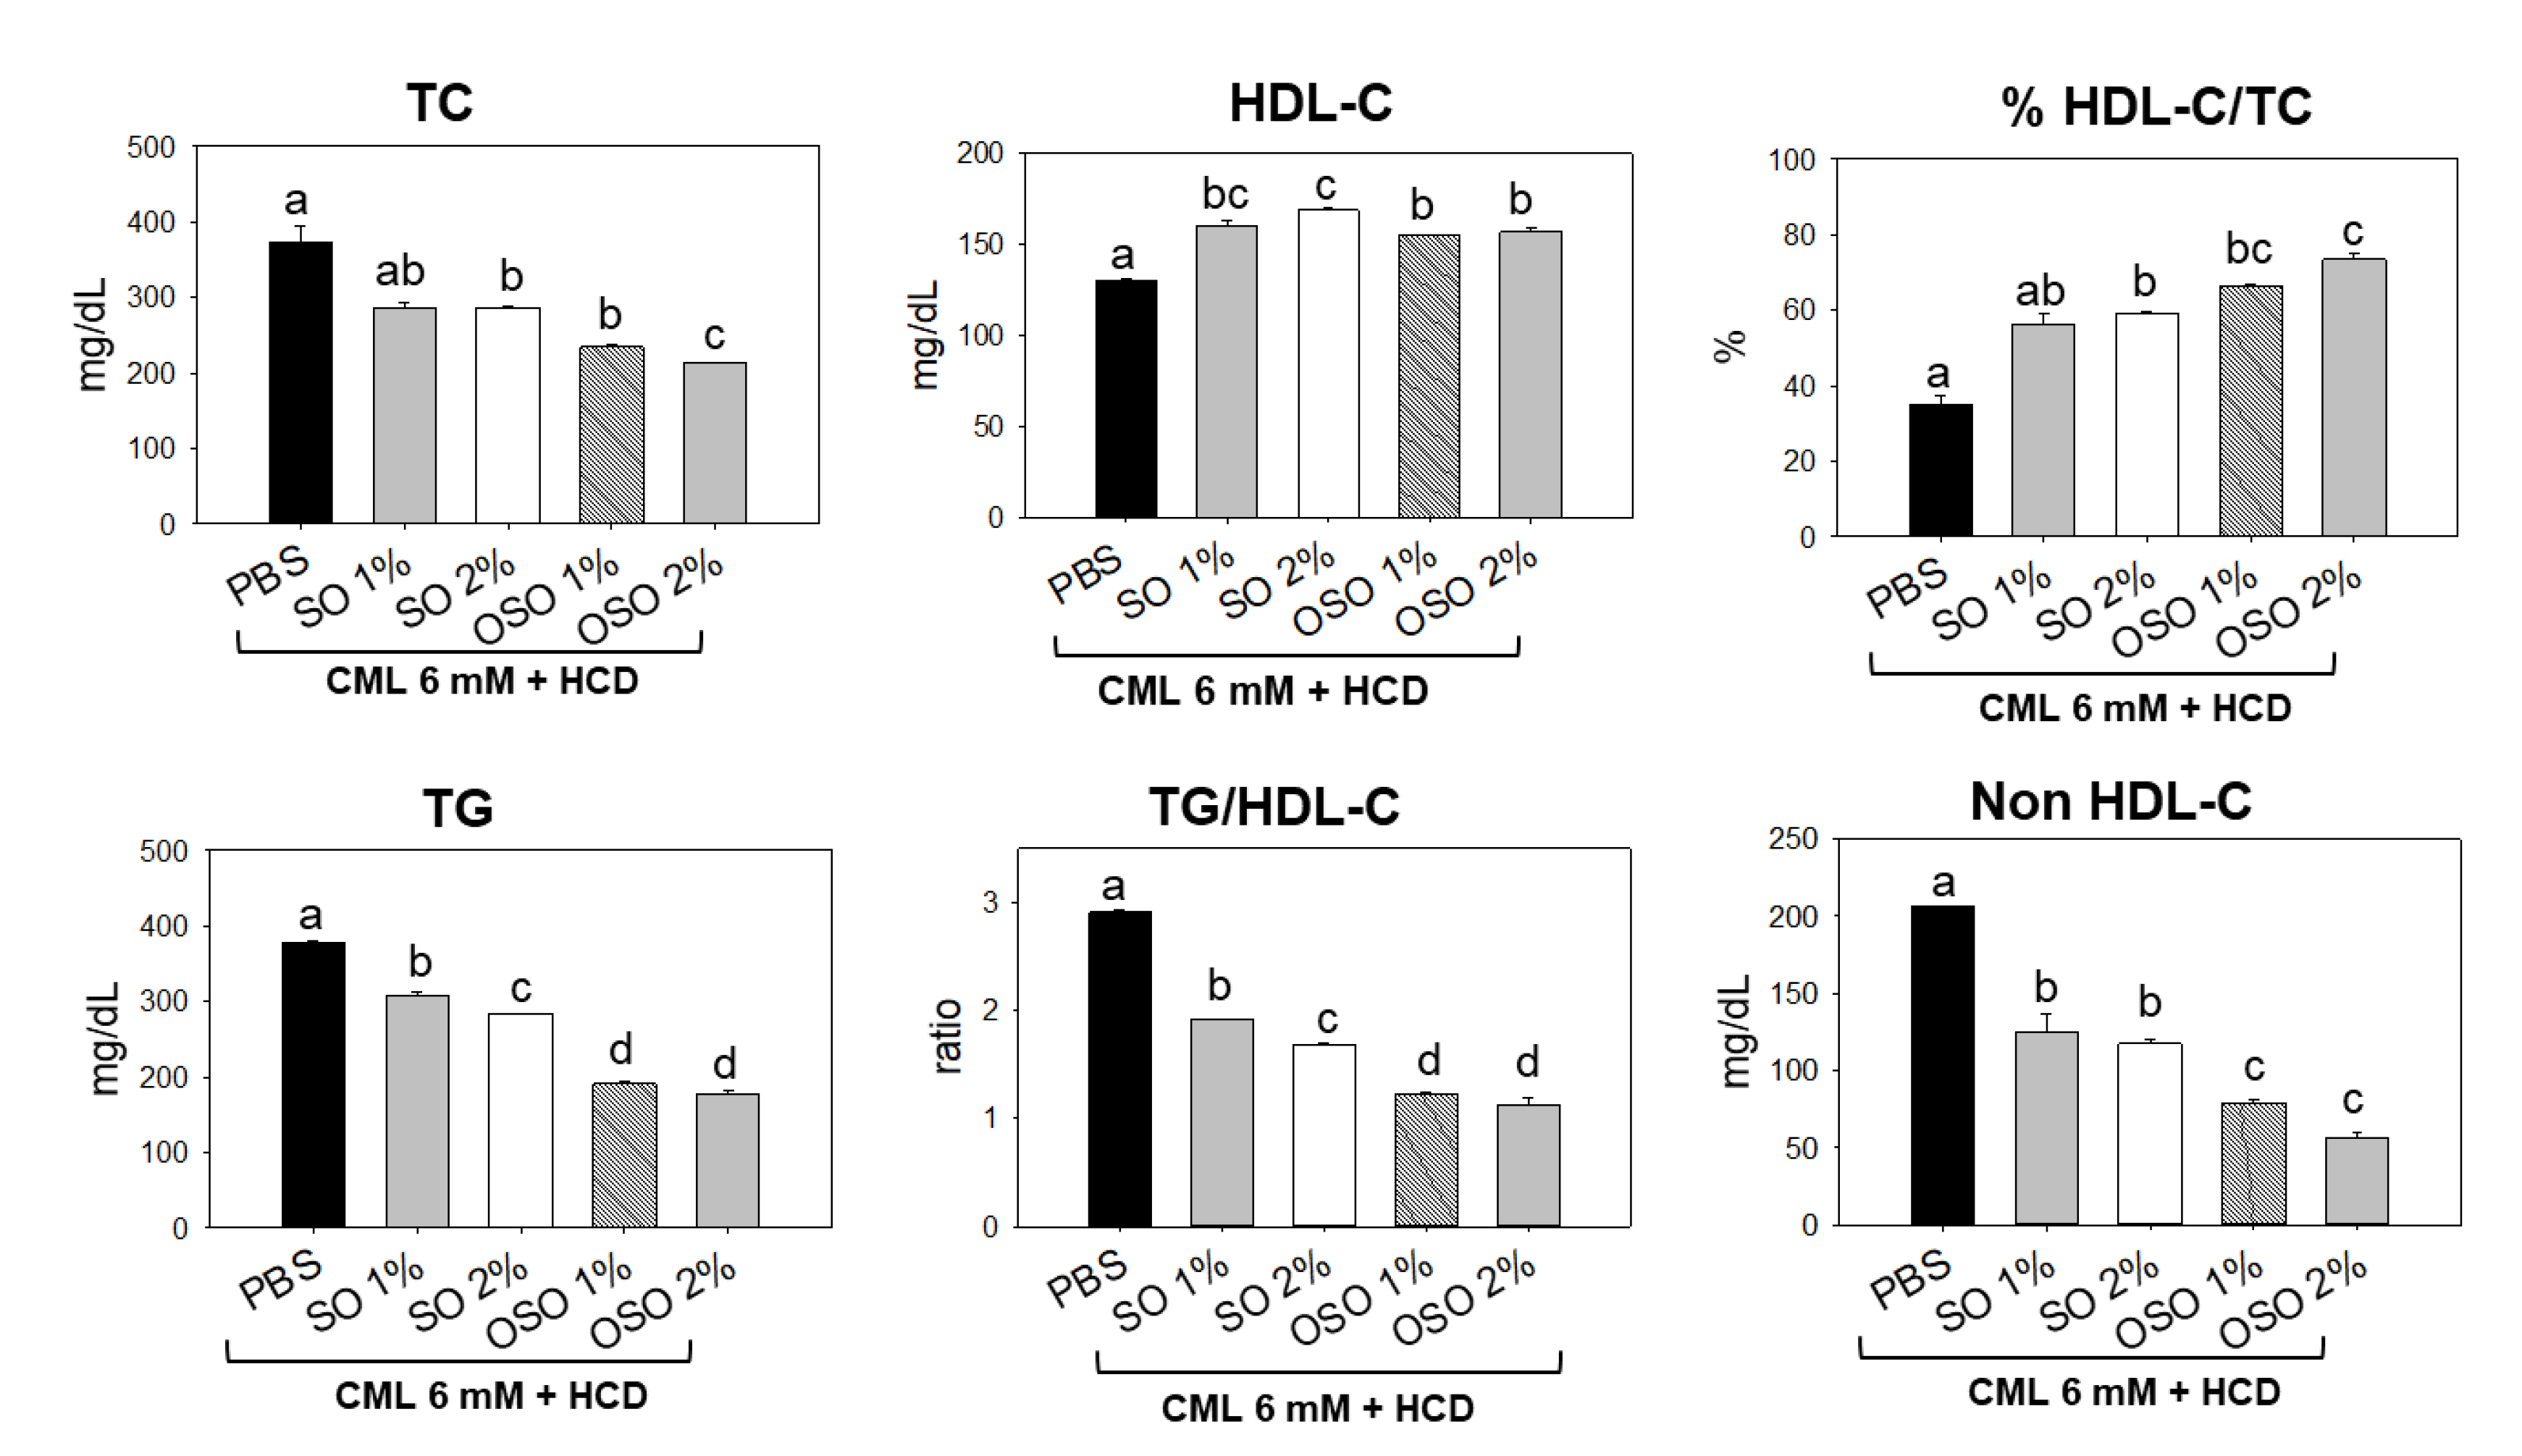
Figure 5.
Effects of sunflower oil (SO) and ozonated sunflower oil (OSO) on the survivability, body weight, and lipid profile of zebrafish supplemented with high cholesterol diet (HCD). (A) survivability of zebrafish during 6 months of HCD feeding. (B) Changes in the body weight of zebrafish during 6 months of HCD feeding. (C) plasma lipid profile at 6 months in HCD-fed zebrafish. ND, normal diet; HCD, high-cholesterol diet (4% cholesterol blended with ND); HCD+SO [HCD with SO (final 20%, wt/wt)]; HCD+OSO [HCD with OSO (final 20%, wt/wt)]. Different alphabets (a-b) above the bar graphs represent the statistical significance (p<0.05) among different groups. TG and TC are abbreviated for triglyceride and total cholesterol, respectively.
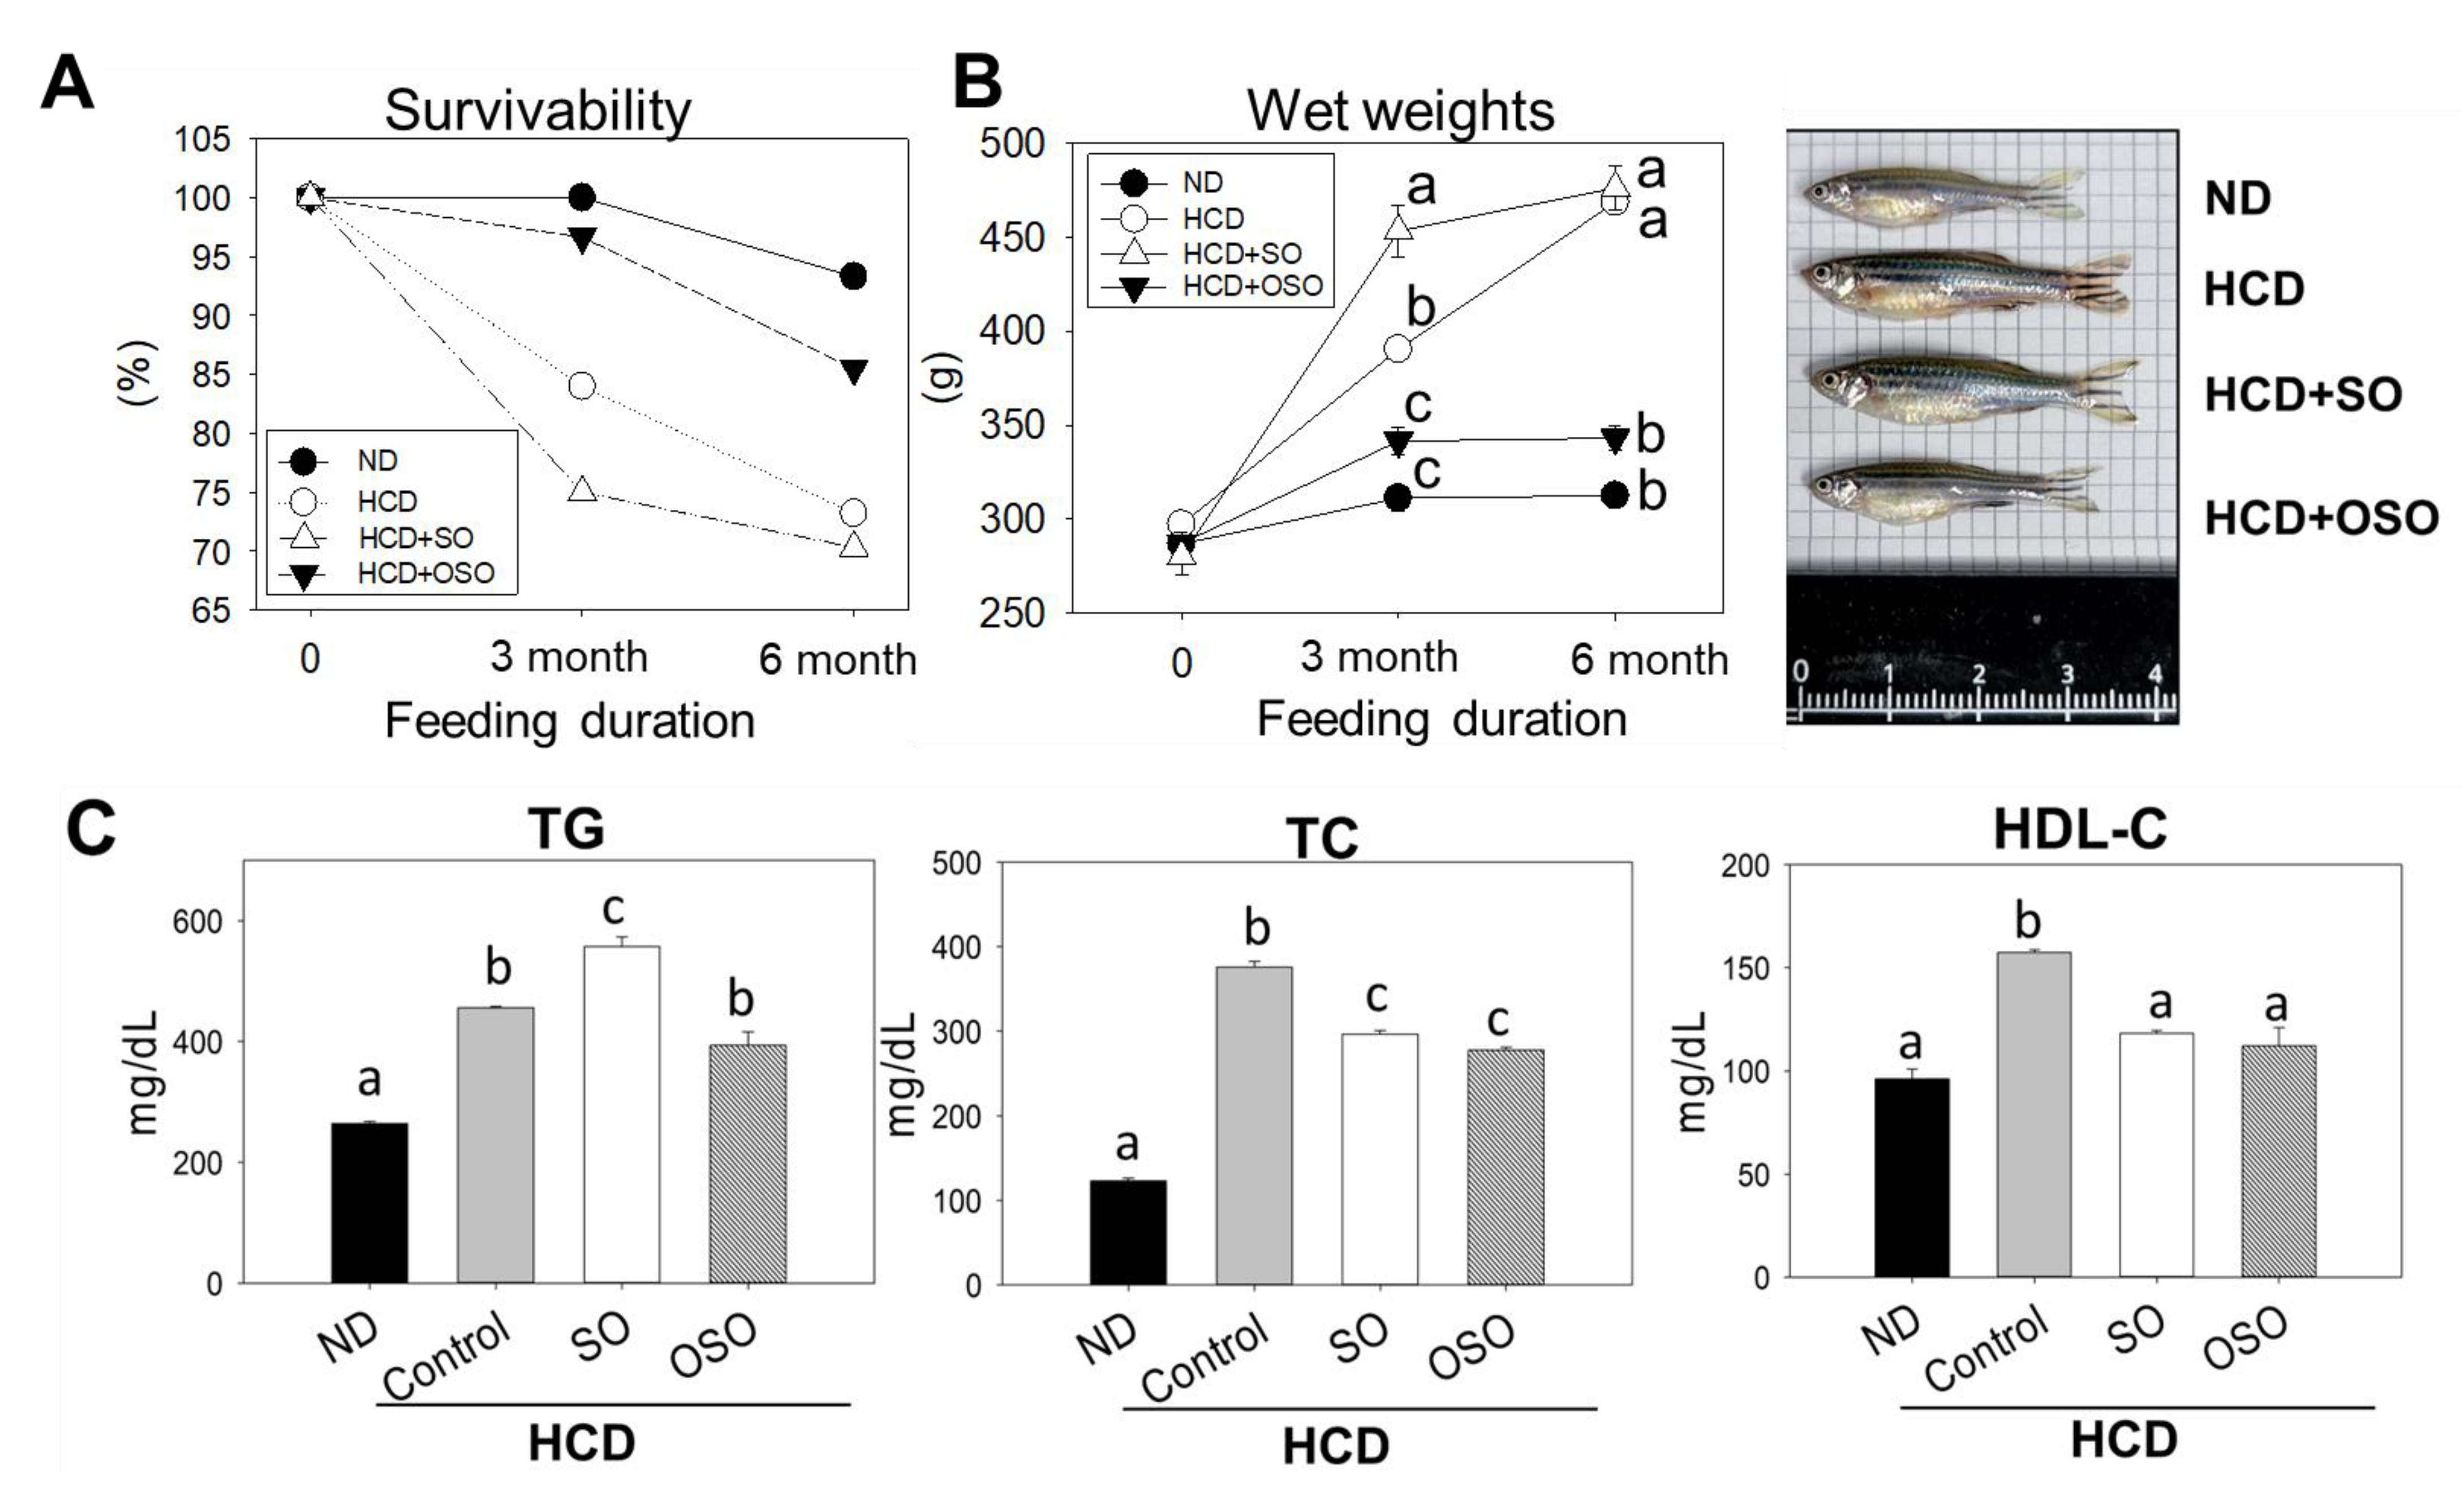
Figure 6.
Assessment of hepatic morphology, fatty liver changes, and reactive oxygen species (ROS) in adult zebrafish fed with high-cholesterol diet (HCD) up to 6 months. (A) hematoxylin and eosin (H&E) staining. (B) Oil red O staining. (C) dihydroethidium (DHE) ROS examination. Scale bar equivalent to 100 μm. All the images were captured under a microscope at 400× magnification. The stained area of the histology was assessed by Image J software version 1.53r (http://rsb.info.nih.gov/ij/ accessed on 8 January 2023). Alphabets (a-c) above the bar graphs represent the statistical significance (p<0.05) between the groups. ND, normal diet; HCD, high-cholesterol diet (4% cholesterol blended with ND); HCD+OSO [HCD with SO (final 20%, wt/wt)]; HCD+OSO [HCD with OSO (final 20%, wt/wt)].
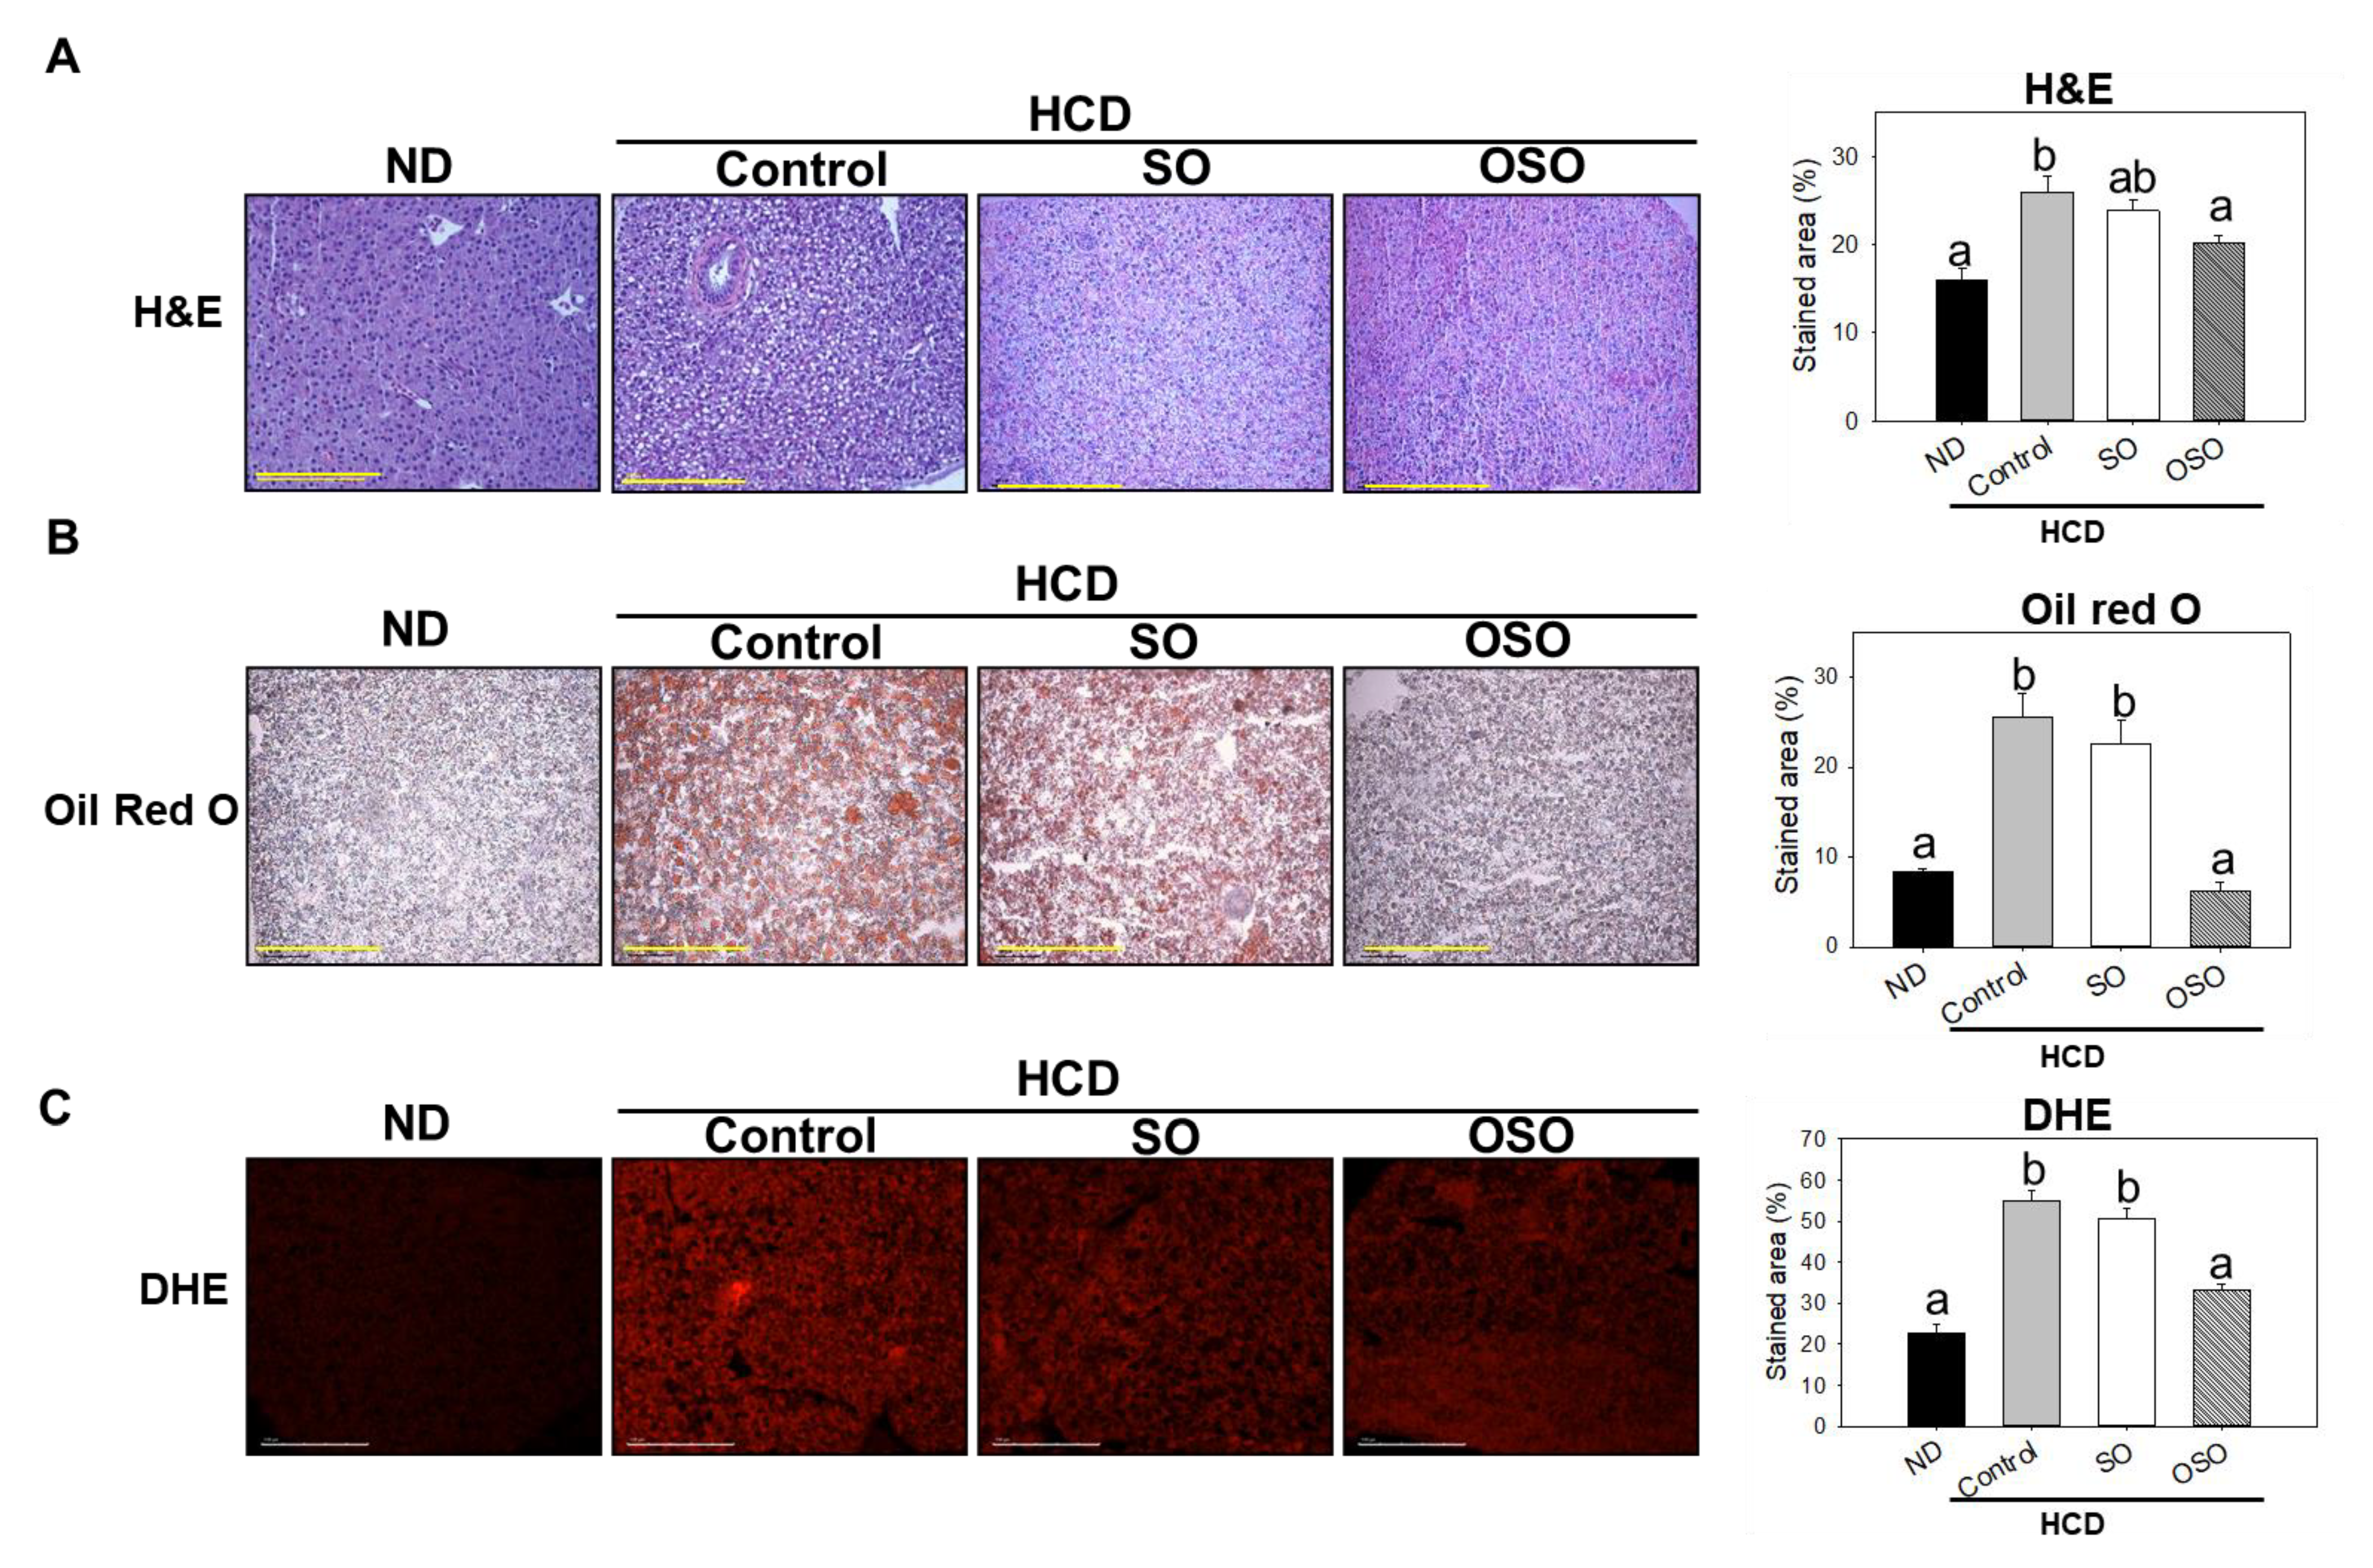
Figure 7.
Ozonated sunflower oil (OSO) mediated preventive events against carboxymethyllysine (CML) induced toxicity in zebrafish embryos and hyperlipidemic zebrafish.
Figure 7.
Ozonated sunflower oil (OSO) mediated preventive events against carboxymethyllysine (CML) induced toxicity in zebrafish embryos and hyperlipidemic zebrafish.
Disclaimer/Publisher’s Note: The statements, opinions and data contained in all publications are solely those of the individual author(s) and contributor(s) and not of MDPI and/or the editor(s). MDPI and/or the editor(s) disclaim responsibility for any injury to people or property resulting from any ideas, methods, instructions or products referred to in the content. |
© 2023 by the authors. Licensee MDPI, Basel, Switzerland. This article is an open access article distributed under the terms and conditions of the Creative Commons Attribution (CC BY) license (http://creativecommons.org/licenses/by/4.0/).
Copyright: This open access article is published under a Creative Commons CC BY 4.0 license, which permit the free download, distribution, and reuse, provided that the author and preprint are cited in any reuse.


