
Submitted:
11 May 2023
Posted:
12 May 2023
You are already at the latest version
Abstract
DBP and DEHP are two of the most common plasticisers used in modern industries, which have aroused a major concern over their ubiquitous occurrence and hazardous environmental effects. This study presents the first data of phthalates’ occurrence and distribution in the Maltese shoreline sand. DBP and DEHP occurrences’ was investigated in three busy and secluded beaches, respectively. Analytical determination involved quantifying DBP and DEHP from 75 samples using UPLC-MS/MS through triple repeatability. The concentrations ranged between 0.0095–0.07034 µg/g and <LOQ–0.0977 µg/g for DBP and DEHP, respectively. Statistical analysis of the comparison of phthalates in different beaches demonstrated that the occurrence of DBP and DEHP in Maltese shoreline sand varies. The differences in the occurrence of phthalates were attributed to the beaches’ topography and anthropogenic pressures. Analysis of the effects of anthropogenic activities on the occurrence of phthalates showed a positive association. Distribution analysis showed that DBP and DEHP exhibit an uneven distribution along the shoreline. Conversely, different distributions were observed at distances away from the sea. The uneven distributions observed were associated with anthropogenic activities, different chemodynamic properties and wave action. Cluster analysis was performed to prove the interactions between the phthalates’ concentrations and the characteristics of the beaches.
Keywords:
pollution
; environment
; sand
; DBP
; DEHP
; Maltese shoreline
; anthropogenic activities
1. Introduction
Over the past years, the world has been exposed to several adverse consequences of uncontrolled development of multiple anthropogenic activities such as transport, urbanization and agriculture. The ever-growing populations, along with the increase in consumer demand and high living standards have amplified pollution in the atmosphere, land and sea [1]. These act as the ultimate sinks to emerging pollutants as well as persistent organic pollutants. Emerging pollutants encompass compounds of a synthetic origin which are of worldwide use and are deemed as indispensible to the modern society [1]. Additionally, organic compounds which are resistant to degradation and that persist in the environment are referred to as persistent organic pollutants (POPs) [2]. The bioaccumulative properties as well as the toxicological effects of such pollutants to ecological integrities and humans contributed to them being of great global concern to the public.
Anthropogenic activities such as personal care , industrial operation and healthcare entails the use of materials that generate waste which give rise to both emerging pollutants and POPs [3]. This waste ends up in water bodies, consequently contaminating aquatic environments. Being constituents of emerging pollutants and POPs such contaminants are usually resistant to degradation. For this reason they tend to accumulate in the environment and persist for several decades rendering them hazardous to the ecosystem3. Another source of water pollution which contributes to the increase in concentration of emerging and POPs in aquatic environment is plastic [4] .
Plastics are defined as synthetic organic polymers which are molded into different forms for diverse uses [5]. Invented over 100 years ago, plastic is now the most used synthetic material [5]. It is estimated that 280 million tons of plastic are produced annually for the production of packaging materials, storage containers and automobiles to mention a few [5,6]. Originally deemed harmless, multiple decades of plastic release in the environment have engendered a vast range of associated problems. Annually, about 500 billion used plastic bags and 35 million plastic bottles also end up in our oceans [6]. Large bodies of water, primarily, the ocean gyres of the Atlantic, Indian and Pacific Ocean, are becoming sinks for myriad non-biodegradable polymers [6]. As a result, Earth’s aquatic bodies are being contaminated with plastic and its constituents. The contaminants can be consumed by the aquatic species and persist in their system or even pass on from one generation hence threatening the Earth’s freshwater and ocean ecosystem and biodiversity [6].
Plastics are composed of one or multiple polymers alongside other additives including inorganic fillers, flame retardants, colorants and plasticisers [7]. Plasticisers are chemicals added to plastic to improve their flexibility and plasticity whilst decreasing its viscosity and friction during manufacturing of synthetic or semi-synthetic polymers such as polyvinyl chloride (PVC) [8]. Their effectiveness in producing flexible materials has contributed them to being used in several industries ranging from the automotive industry to the medical field [9]. There are about 418 additives used in modern European industries which have been established by the European Chemicals Agency (ECHA) targeted to improve the polymer structure of specific plastics [10]. Nowadays, phthalates account for the majority of the plasticiser market. Their popularity is sustained by their low volatility and cost, high durability and ability to generate elastic and flexible materials [11].
Phthalates are diesters of 1,2-benzenedicarboxylic acid ( or phthalate acid) primarily used as plasticizers in the manufacture of vinyl and exhibit several industrial applications such as personal care products as solvents and plasticisers in making varnishes, lacquers and coatings [12]. Owing to their large production volumes and their widespread use, phthalates are deemed as the most ubiquitous man-made materials found in the environment [11,13,14]. They have been also detected throughout the worldwide environment in different matrices including: water, sediment, air, soil, sludge, biota and wastewater [13].
Some of the most common phthalates used in consumer products and to which humans have high exposure rates include: di(2-ethylhexyl) phthalate (DEHP), di-n-butyl phthalate (DBP); diethyl phthalate (DEP); butyl benzyl phthalate (BBzP) and diisobutyl phthalate (DiBP) [11,14,15]. Owing to their prevalence and adverse effects several studies have been conducted to assess phthalate exposure and achieve in-depth knowledge of their repercussions on human health [15].
Phthalates not chemically bound to plasticisers and are able to leach, migrate or evaporate to different matrices including food [16]. Moreover, most of consumer products contain phthalates and thus can result in both direct and indirect exposure. Direct exposure from consumer products results from direct use of these products whilst indirect exposure results from the leaching of phthalate acid esters (PAEs) into other products as well as from environment contamination [16]. Throughout their life, humans are exposed to phthalates through inhalation, ingestion and dermal exposure, including during intrauterine development. For this reason, several authorities have established monitoring systems and risk assessments among societies to monitor the exposure and to safeguard the environment and humans from high exposure rates of phthalates [16].
Recently, toxicological concerns about phthalates rose due to their possible endocrine- disrupting potency. The potential phthalates to cause negative effects on the development of humans and reproduction was evaluated by the National toxicology program centre for the evaluation of risks to human reproduction [16]. Due to lack of human studies with regard to toxicity, experimental animals were investigated and their effects were compared to the estimations and human exposure data. Based on such data it was established that PAEs may result in histological changes in testes, reduced sperm count and reduced fertility. With regards to developmental studies, it was reported that exposure to phthalates may result in prenatal mortality, reduced birth weight and growth and promote visceral, skeletal and external malformations [16].
The occurrences and persistence of phthalates in different environmental matrices, their exposure to species and their toxicological effects contribute in them being hazardous to the environment as well as to humans. Therefore, the monitoring of PAEs in different matrices is requisite to protect biological diversity, survey future natural events and implement effective environmental practices.
Being surrounded by the sea, the assessment of different classes of pollutants in the Maltese islands is usually performed in marine environment matrices. Vella et al. [17] assessed the organotin pollution in Maltese coastal zone specifically, in seawater and sediment of the Maltese marine environment. In such study, the tributyltin levels were recorded the highest in yacht marinas’ sediments and seawater samples from harbours and drydocks. Results obtained in this study were linked to the anthropogenic sources including agricultural pesticides, antifouling marine paints and shipyards operations involving hull cleaning.
Similar studies were carried out by Huntingford and Turner [18] in which trace metals were recorded in sediments from large harbours and public slipways in Malta. Comparison of data showed little difference between the sediments of the varied locations. Nonetheless, low concentrations of contaminant metals (Cr and Sn) were recorded lower ion slipways than in harbours thus attributing the sources of contaminant metals to diffuse and specific waste inputs from shipping and boating activities.
In a pilot study González-Mazo et al., [19] ten predominant target compounds were monitored in the Northern Maltese coast. The most prominent groups of compounds detected were; pharmaceutical products, synthetic fragrances and UV filters. The occurrence of such compounds was presumed to be of human action origin such as wastewater discharges, recreational activities and ship traffic.
Azzopardi et al. [20] assessed the presence of heavy metals pollution, primarily; Mn, Fe, Pb, Sr, Zn and Cu sandy beaches. In this study, bays of high heavy metal content were linked to the increased geological wear rate induced by waves and anthropogenic contamination. The results of the mentioned studies thus suggest that the major source of marine environment contamination is chiefly related to human interference.
The aim of this study is to investigate the presence of phthalates in the Maltese islands using sand as a matrix in two distinct categories of beaches exposed to different anthropogenic pressures. This study establishes whether the occurrence and distribution of phthalates in the Maltese shoreline sand are associated with different exposures to human activities. To our knowledge, this investigation is the first to report the occurrence of PAEs in the Maltese islands. The occurrence of phthalates in different matrices and the effect of anthropogenic sources are of great concern to the authorities to mitigate the pollution sources and safeguard the environment; thus, this study provides an in-depth overview of the occurrence of phthalates in conjunction with different artificial factors and human interferences, to improve such knowledge. This research is focused on the quantification of common PAEs, namely; Di-n-butyl phthalate (DBP) and Di-(2-ethyl) hexyl phthalate (DEHP) and their distribution in the Maltese shoreline sands. The sands from which the samples were collected were categorised as busy and secluded beaches to assess the occurrence with respect to the human impacts.
Assessment of PAEs in Maltese shoreline sand involved statistical analysis of the data acquired from the 75 samples collected which were analysed in triple repeatability. Statistical analysis allowed for comparison of data of occurrence of phthalates in different beaches. Moreover, statistical analysis also allowed for the characterisation of the distribution of DBP and DEHP along the shoreline and at perpendicular distances away from the tideline in different beaches to classify the occurrence of phthalates according to their possible anthropogenic sources.
2. Materials and Methods
2.1. The studied region
The presence of PAEs was studies in 6 sandy beaches in Malta (illustrated in supplementary Figure S1). Three of the beaches were categorised as busy beaches whilst another three were categorised as secluded beaches. The different categories of beaches account for different anthropogenic activities in the beaches. The category of ‘Busy Beaches’ consists of popular beaches in Malta which are frequented by many locals and tourists and thus, are subject to increased anthropogenic pressures such as littering and /or increased boat activity. For this reason, they are considered as pollution hotspots when compared to the secluded beaches which are not as frequented as the busy beaches and are less subjected to human interference. The locations which were investigated in this study, along with their coordinates, and number of samples are listed in Table 1. Supplementary Figure S2 provides more detail of the locations of the beaches investigated through aerial views showing the sampling points of each beach.
2.2. Collection of samples
A standard sampling procedure was established to sample different beaches. Such procedure involved the establishments of a line transect which was placed at the length of the beach. The line transect was set perpendicularly to the shoreline and a distance of 20m was maintained between each sampling station. At each sampling station a 1m2 metal quadrat was placed at the high tideline (origin). Using a metal ruler and a metal hand shovel, the uppermost 10 cm of sand (amounting to approximately 150g) were collected. Starting from the origin, the transect line was then divided into 4 m segments and the quadrat was placed along the transect line at 4m interval. A maximum of 12 m away from the shoreline distance was maintained when sampling large beaches. The sand samples collected were transferred to amber bottles with metal caps and were subsequently stored at -18◦C until extraction.
2.3. Chemicals used
All chemicals used were of HPLC grade. Methanol was obtained from BDH chemicals. Acetone and n-Hexane were purchased from Riedel-de Haën™ and Carlo Erba respectively. Ultra-pure water for mobile phase was obtained from Ultra-pure water of 18MΩ obtained from ElgaPure Lab Classic purifier. Di-n-butyl phthalate (DBP) (purity: 99.5%) and Bis (2-ethyl hexyl) phthalate (DEHP) (purity 99.5%) were purchased from Chem Service.
2.3. Extraction Procedure
DBP and DEHP were extracted from sand using the method suggested by Chen at al, [21] with some modifications. The sand samples were dried in an oven at a temperature of 105 °C for 24 hours. 5 grams of sand were weighed and placed in pre-cleaned glass vials. Subsequently, 15 mL of acetone/n-hexane solution with 1:1 volumetric ratio was added to the sand. Samples were placed in an ultrasonic device for 15 minutes. The extract was then filtered through a syringe filter of 0.45 µm to remove any sediment particles and to attain a clear extract. The extract was then evaporated to dryness under nitrogen flow and was the reconstituted to 0.5 mL with methanol for analysis.
2.4. PAEs Analysis and Instrumental Conditions
After extracting PAEs from the sieved sand samples, Ultra-performance liquid chromatography tandem mass spectrometry (UPLC–MS/MS) was used to quantify the concentrations of phthalates, based on the response areas given by the peaks at their respective retention time. This technique has significant technological advances including high resolution, sensitivity and speed of analysis. Additionally, it has substantially lower run time than the conventional liquid chromatography method thus reduces the solvent consumption [22].
In this investigation Waters® ACQUITY UPLC System coupled with TQ-D Detector (UPLC-MS/MS) was used for quantification of DBP and DEHP. MassLynx™ software v.4.1 was used for data acquisition and analysis of peaks. Chromatographic separation of phthalates was achieved using an ACQUITY UPLC® BEH C18 column 1.7µm (2.1× 500 mm). The system consisted of two mobile phases A and B. Mobile phases A and B were prepared by adding 0.1% formic acid in ultra-pure water and methanol respectively. The column temperature was increased to 40◦C and the injection volume was of 10 µL. The system had a flow rate was 0.5 mL/min and the total run time was 15 minutes. The UPLC MS/MS was also equipped with an ACQUITY UPLC isolator column (p/n: 186004476) between the mobile phase mixer and the sample manager injector. This allowed for any background phthalates to be retained on the Isolator column till they are eluted by the gradient via the analytical column at a later time than the analytes in the samples. In such manner, the separation of the analyte phthalate peak from the background phthalates peaks enable more reliable quantification as the background phthalates would be isolated. Additionally, week needle wash consisting of 1L of 25% methanol in water, strong needle wash consisting of 1L of 100% methanol and seal wash containing 1L of 10: 90 methanol/water were prepared. The wash solvents were used between each injection of the sample. The mass spectrometer conditions consisted of ES+ ionisation mode and source temperature and desolvation temperatures of 150 °C and 500 °C, respectively with desolvation gas rate of 500 L/ hr, 4kV capillary voltage, using Multiple Reaction Monitoring (MRM).
Quantification was performed by external standard method. A seven-point calibration curve at 0.0025, 0.005, 0.01, 0.05, 0.25, 0.5 and 1 ppm was plotted for DBP and DEHP respectively. The response areas were quantified at retention time 6.62 for DBP and at 7.91 for DEHP. The background phthalates of the respective analyte were detected at least 0.5 minutes later. The curves exhibited good linearity with R2 values greater than 0.9979. Each sample was quantified by triple repeatability, and an average concentration of the phthalates quantified was taken. A blank consisting of 100% methanol was injected between each sampling station, and none of the blanks showed contamination suggesting that there was no carryover from one sample to another. A calibration check was performed between each beach location by running a standard of a concentration within the calibration curve (0.05ppm) for both phthalates. After plotting the calibration curves, the limit of quantification (LOQ) and limit of detection (LOQ) were calculated for DBP and DEHP. The LOQ and LOD were 0.0008 µg/g and 0.0003 µg/g for respectively for DBP and 0.0084 µg/g and 0.0010 µg/g respectively for DEHP.
2.6. Recovery Studies
Prior to performing the above extraction procedure on all of the samples collected, three samples were collected to test the extraction efficiency. Different studies performed an extraction on different sand particle sizes [21,23,24]. For this reason the sand samples were sieved at different sizes namely: >500, 250 and 125 µm. Subsequently, the extraction procedure was performed on the three samples and was analysed by UPLC. The fraction of sand collected at 125 µm was the best detected in all samples as this fraction attained the largest response areas overall with respect to the other fractions. Accordingly, extraction recovery was performed on the sand fraction collected at 125 µm.
The extraction recovery involved weighing 5g of sand obtained in the fraction of interest and dividing it into two portions of 2.5g. One of the portions was spiked with 0.05 ppm of DBP and DEHP standards prior to performing the extraction process. Conversely, the other sand portion was left unspiked and the extraction procedure was performed and repeated three times. The extraction recovery was calculated through the concentrations obtained of spiked and unspiked samples and the expected concentration of the spiked sample after evaporation as shown in the below formula.
The average extraction recovery values for DBP and DEHP were 94.7% (± 3.6 %) and 119.2% (± 9.4 %), respectively. Thus, both within the acceptance limits (70-120%, RSD< 20%), hence the extraction process was regarded as efficient.
In order to determine the stability of the sample after collection as well as to detect systematic errors due to sample matrix, spike recovery was performed. Spike recovery was achieved by performing the extraction procedure on the sand with particle size of >125 µm which attained and ideal extraction recovery value. The reconstituted sample was thereafter split into two equal parts- one of which was spiked and the other was left unspiked. The spike recovery was calculated using the concentrations obtained of spiked and unspiked samples and the expected concentration of the spiked sample after adding the standard, as shown in the below formula:
The spike recovery value for DBP and DEHP obtained were 96.05 % and 93.90%, respectively. Since the extraction recovery values and the spike recovery values were in an acceptable range, the above extraction procedure was efficient to be performed on the samples for quantification of DBP and DEHP in the Maltese shoreline sand.
2.7. Statistical Analysis
IBM SPSS (Version 25.0) was used to perform statistical tests involving the normality of data, independent samples test such as Kruskal-Wallis test, Mann-Whitney U test and pairwise- comparison of data. The tests were performed with a 95% confidence interval on the obtained data. JMP Trial 16 software was used for cluster analysis.
3. Results and Discussion
3.1. Preliminary Extraction Studies
Prior to quantifying the concentrations of DBP and DEHP in the samples collected, recovery studies were carried out to test the efficiency of the extraction procedure. In preliminary test runs of random-collected samples phthalates were the best quantified in sand particles collected in a sieve size of 125 µm. This fraction was the finest fraction as it exhibited the smallest particle size of sieved sand, and attained the most prominent and sharpest peaks upon chromatographic analysis.
The improved quantification by sand of small particle size could be attributed to the enhanced extraction yield rendered by the increased contact of solvent with the sample of larger surface area. The extraction recovery values were within acceptable ranges (70%-120%). The differences in average recovery values by the two phthalates which were investigated under the same conditions could be attributed to the matrix effect. The latter refers to the effect on the analytical assay caused by other components in the system, in lieu of the analyte itself. The presence of co-eluting compounds in the matrix system might cause a change in the ionization efficiency of the target analytes [25]. Furthermore, matrix effect can either cause an increase or loss in response. The increase in response by the co-eluting compounds is referred to as “ion enhancement” whereas the loss in response is referred to as “ion suppression” [25]. Both phenomena might greatly affect the analytical performance method and hence should be taken into account when performing an analytical method. Although several theories have been proposed to account for this phenomenon, the exact mechanism is not fully understood; however, it has been widely acknowledged that the analytes’ ionization efficiency might be altered by the co-eluted matrix and might influence the signal intensity by the competition for access to the droplet surface for gas-phase emission in the electrospray process, causing a matrix effect [25]. The increased extraction recovery value by DEHP (119.2%) might be attributed to ion enhancement by the matrix effect. The matrix might have affected the ionization efficiency of DEHP causing an increase in response. Given that the average extraction recovery values were within the acceptable limits, the extraction method was ideal for quantification of DBP and DEHP.
As part of the quality assessment of the extraction procedure apart from extraction recovery, spike recovery, or recovery of known addition, was also performed. This technique is based on the addition of a known concentration of analyte to the matrix which is either similar to or identical to the sample [26]. As phthalates occur ubiquitously in our surrounding environment as well as in sand and sediments, it was difficult to obtain a sand sample which completely lacked DBP and DEHP. For this reason a regular sand sample was collected to perform spike recovery. The latter was performed by carrying out the extraction method on the extract of the sample extracted from sand collected at 125 µm and splitting the extract into two equal portions of equal concentrations. Spike recovery was performed on the sample to detect possible systematic errors by the matrix as well as to assess the sample’s stability after collection and storage [27]. The extracts were spiked with 0.05 ppm and the spiked recovery values for DBP and DEHP obtained were 96.1% and 93.9% and were within acceptable limits. Values outside the acceptable ranges might be due to sample deterioration or matrix-dependent relationship between the analyte’s concentration and the analytical signal. In such a case, the sample should be analysed by the method of standard additions [27].
From the above extraction recovery values as well as spike recovery values it could be determined whether the extraction procedure was suitable for the extraction of phthalates. The results obtained lied within acceptable limits for both extraction recovery as well as spike recovery. This suggested that apart from having a suitable extraction procedure, there were no systematic errors and no sample deterioration after collection. Hence, the extraction procedure could be performed on the samples to extract and quantify the concentrations of DBP and DEHP in the Maltese shoreline sand.
3.2. Quantification in Maltese shoreline sands
After performing the extraction procedure, the concentrated extracts were quantified through the calibration curve. Similarly to when plotting the calibration curve, triplicate readings were taken and an average of the three values was calculated. Triplicate readings allow for improved accuracy and reliability when quantifying the analytes of interest. The concentrations of DBP and DEHP in different beaches and their respective standard deviations (shown by error bars) are represented in Figure 1 and Figure 2.
From the results obtained, all samples contained DBP and DEHP indicating that they occur ubiquitously in sand. The concentrations of DBP and DEHP in the samples taken from secluded beaches of low- moderate anthropogenic activities ranged between the ranges of 0.0095-0.036 µg/g. Consequently, the DEHP values of the same samples were within the range of <LOQ- 0.0364 µg/g. When taking into account the phthalates values of the samples taken from busy beaches, the limits ranged between <0.00916-0.07034 µg/g and <LOQ- 0.0977 µg/g for DBP and DEHP respectively. Furthermore, the average concentrations of the phthalates for DBP and DEHP were 0.021530 µg/g (±0.0009) and 0.023609 µg/g (±0.0013), respectively. Overall, the DEHP concentrations seemed to be greater and exhibited larger concentration ranges than DBP.
Comparison of the overall data with other studies, suggested that the concentrations of phthalates under investigation were relatively low. In a study by Ramirez et al. [28] in the coast of Campche, Mexico, the concentrations of DBP and DEHP reported reached 20.119 µg/g 21.098 µg/g respectively. The samples taken from surface sediments of the coast of such a sea reached the concentrations of 40.87 µg/g of DEHP and 19.20 µg/g of DBP [29]. Furthermore, a similar trend was observed in the study carried out in the Persian Gulf whereby the concentrations of DEHP and DBP added to a total of 30.25 µg/g and 11.97 µg/g respectively [24]. Nonetheless, further analysis was carried out by performing statistical investigations of the data obtained to study further the distribution of the two phthalates in the Maltese shoreline sands with respect to other surrounding variables which might affect their occurrence. This allowed for more meticulous comparisons of the occurrence and distribution of phthalates in the Maltese shoreline sands with those reported in various literatures.
3.3. Statistical Analyses
3.3.1. Distribution of Data
Prior to performing statistical tests on the data in conjunction with the different variables, the distribution of data was analysed by testing for normality. This was done though Kolmogorov-Smirnov and Shapiro-Wilk tests at 95% confidence interval. Both normality test indicated that the data for the concentrations of DBP and DEHP was not equally distributed (p =0.00 by both tests). Subsequently, the occurrence and distribution of phthalates in the Maltese shoreline sand with respect to the different variables were compared through non-parametric statistical tests.
3.4. Analysis of PAEs in the Maltese Shoreline Sands
3.4.1. Occurrence of Phthalates in different beaches
The comparison of occurrence of DBP and DEHP in the beaches investigated was through Kruskal-Wallis test. Such test indicated that the phthalates concentrations varied between beaches as the null hypothesis of having identical concentrations between the different beaches was rejected (p= 0.00). Riviera Bay was characterised by the highest average concentration of DBP amongst the different shorelines, whilst White Tower Bay exhibited the lowest average DBP concentration. The concentrations were further investigated through pairwise comparison in order to determine which beaches exhibited statistical significance upon comparison.
Pairwise comparison of the average DBP concentrations indicated that the majority of the beaches which showed a statistical significance were beaches compared with Riviera. The statistical difference was mainly attributed to the fact that Riviera Bay attained a high DBP concentration. The large mean concentration of DBP on such a coast might be accredited to the high anthropogenic activity of the bay. Owing to its aesthetic value by the characteristic clay slopes, Riviera beach is highly frequented by locals and tourists hence, it is a subject to intense anthropogenic pressures [30]. One of the main pressures which affect coastline areas through anthropogenic activity is the introduction of abundant amounts of microplastic debris due to of littering and utilization of myriad plastic materials [31], which may leach out phthalates in shoreline sand. Phthalates, including DBP, are not chemically bound to plastics and can easily leach, evaporate and migrate through domestic and industrial effluents and indiscriminate disposal of phthalate –containing products [29].
The DBP concentrations in Riviera Bay were statistically significant from White Tower Bay (p= 0.000) , Għar Aħmar Bay (p=0.002) and Imġiebaħ Bay (p=0.012) (Table 2). This was speculated as the mentioned bays were categorized as bays of moderate- low anthropogenic activity; hence such result was expected as they are subject to less anthropogenic activities and thus less probability of being exposed to plastic debris. Nonetheless, when comparing the concentrations of DBP in other beaches such as Paradise Bay and Ġnejna Bay which were regarded as busy beaches, it was observed that the latter two attained a lower DBP concentration than the former beaches of moderate anthropogenic activity. This implies that apart from anthropogenic pressures, other congeners affect the DBP concentration on different beaches. In addition, Ġnejna Bay and Paradise Bay exhibited statistical significance when compared to Riviera Bay. Despite being considered busy beaches, there was a significant difference between Ġnejna and Riviera Bay as well as between Paradise Bay and Riviera Bay. This might suggest that there could be other sources contributing to an increased concentration levels in Riviera Bay.
A prominent escarpment surrounds Riviera Bay with clay slopes on the southern side of the plateau. The overlaying blue clay undergoes successive erosion events, which causes the slope to become steeper. Moreover, erosion also causes cliff edges to collapse under their weight causing massive boulders to move downslope over the mobile clay, chiefly in wet conditions [30]. The permeable coralline limestone also holds a perched aquifer which is supported by the blue clay aquiclude. Seepage from the aquifer and aquiclude results in the slope receiving abundant water that originates during the wet season and beyond from the upper land [30]. This water consists not only of rainwater but also of surface runoff from the higher land. The water flow from these slopes might be contaminated with contaminants such as phthalates which result from the transport of pollutants through the asphalt and ultimately to the slopes, urban runoff, which includes terrigenous material and agricultural discharge, which might be contaminated with PAEs [28]. DBP has been reported to enter soils via irrigation and through the application of plastic film and pesticides by intensive agricultural activities [24].
In a study by Xu et al., [32] the occurrence and degradation characteristics of DBP were investigated by analysing two kinds of soil collected from, non-cultivated, greenhouse, crop and vegetable fields from Hadan and Harbin districts in China. The results showed high residual levels of DBP in areas of cultivated fields such as in the black soils of Harbin District and in the fluo-aqcuic soils of Hadan district. The vegetable and greenhouse fields required intensive irrigation, pesticide use fertilizing and mulch application [32]. This suggests that cultivation methods and field management could have introduced phthalates contaminations. This study further supports the postulation that DBP concentration in Riviera was likely to be greater than other bays due to the cultivated fields high in close proximity of the bay as well as the slopes which receive urban runoff from the mainland. Steep clay slopes with acquifers do not surround Paradise Bay as Riviera; thus, any urban runoff which might reach the bay is less than that of Riviera. Although there are clay slopes in the vicinities of Ġnejna Bay they do not surround the bay as Riviera Bay hence possible leaches from such slopes are not in direct contact with the sand, possibly leading to lower DBP concentrations.
Other beaches which showed statistical significance in the average DBP concentration upon comparison include White –Tower bay and Għar Aħmar Bay and White Tower Bay and Imġiebaħ Bay, which were categorised as beaches of low anthropogenic pressures. White Tower Bay exhibited the lowest average DBP concentration, whilst Imġiebaħ Bay showed the highest. Imġiebaħ Bay is the most secluded one that visitors do not frequent much due to its inaccessibility, henceforth is not exposed to human disturbance. Despite this, Imġiebaħ Bay showed a statistically significant greater mean concentration of DBP than White Tower Bay. This beach is very small and is surrounded by boulder screes. Given that there is no unique habitat surrounding the bay and it exhibits reduced anthropogenic activities, the significantly high concentration of DBP in such a beach might be attributed to phthalates present in the sea. Due to its characteristic small size Imġiebaħ has small beach width. In increased wave action events, the sea might easily submerge the major area and could promote sorption of DBP to Sand from seawater. The presence of phthalates in sea water has been reported in several studies. In a study conducted by Cao et al., [33] DBP was one of the predominant PAE congeners in surface waters as well as bottom waters as it accounted for 42.7% and 25.8% of the total phthalates quantified in the samples. For this reason, the wave action and seawater interaction might be the ultimate sources of DBP in the shoreline. They might have caused the average DBP concentration in Imġiebaħ to be statistically significant from White Tower Bay and Għar Aħmar Bay. Moreover, phthalates from aquatic matrices adsorb to sand as the latter act as a filter. In a study by Liang et al.[34], four different wastewater treatment plants were investigated. Such a study reported that the total PAEs in a particular wastewater system using sand filtration, were abruptly reduced from 202.93 µg/L to 16.64 µg/L [34]. This suggests that phthalates present in water can interact with sand via adsorption; henceforth, the repetitive wave action that might submerge a significant part of the small shoreline might introduced more DBP contaminants in the sand than in other larger secluded beaches not wholly exposed to wave action and submerged as Imġiebaħ.
White Tower Bay exhibited a significantly lower concentration of DBP when compared to the concentrations recorded in Imġiebaħ. White Tower bay is a pocket beach that may be considered as a ‘sediment-tight’ system. This system refers to the wave diffraction and headland obstruction by the headlands of the beach, which restricts the transportation of sediments to the beach [35]. Such a lack of inter-beach sediment transport and suggests a similar lack of phthalates transport occurring in the sea as well as with sediments, hence the low average concentration for DBP in White Tower area was statistically significant from that of Imġiebaħ. The low concentration of White Tower Bay was also statistically significant than Għar Aħmar Bay. The latter bay is a moderately-busy beach situated Marsaxlokk. The higher average DBP concentration in Għar Aħmar Bay might be attributed to the increased anthropogenic pressures by power plant industry in nearby areas and/ or sea vehicles. These may introduce phthalates including DBP through possible discharges via direct emissions from the industry. Additionally, boats which frequent the harbour might release phthalate-containing pollutants in the sea resulting in the sand to be contaminated by higher concentration of DBP upon wave action. In a study by Chen et al, [21] DBP was one of the major phthalates which occurred in China’s harbour sediments. In such a study DBP was detected in 38% of the samples and the concentrations ranged between 0.013 and 1.13 mg/ kg [21]. This suggests further that the higher average DBP concentration in Għar Aħmar might be related to the harbour activities in the nearby area.
Similarly, the average DEHP concentrations were studied through Kruskal-Wallis tests. Similarly to the DBP, the hypothesis of having similar concentrations in different beaches was rejected (p<0.05). Upon pairwise comparisons, White Tower Bay showed statistical significance when compared to Għar Aħmar, Paradise Bay, Rivera (p values=0.000) and Ġnejna (p=0.001) (Table 2). The low average DEHP concentration in White Tower Bay could be attributed to the aforementioned ‘sediment-tight’ system described when speculating the possibility of having a low average DBP concentration.
The average DEHP concentrations in Paradise Bay were statistically significant from four different bays as it exhibited a large average concentration. Paradise Bay is a busy beach of great popularity with locals and tourists which might introduce increased plastic waste to the shoreline. Beach litter monitoring in Paradise Bay conducted by Pfeiffer et al. [36] demonstrated that the area was highly littered with plastic materials, including plastic bottles, plastic bottle caps, plastic containers and some fabric material- all of which might be sources of DEHP which contributed to a significant high average concentration when compared to the other beaches. The high average concentration of DEHP in Paradise Bay might also be attributed to its location as it is situated next to the Cirkewwa terminal, implying that it is exposed to further anthropogenic pressures from the adjacent harbour. Significant concentrations of DEHP have been reported in seawater and sediments of Kaohsiung Harbour in Taiwan by municipal wastes and other water discharges in the water channel [21].
Għar Aħmar attained the highest mean DEHP concentrations compared to the five other beaches studied. Moreover, it showed a significant difference upon comparisons with Imġiebaħ Bay (p= 0.000), Ġnejna (p=0.000), White Tower Bay (p=0.000) and Riviera Bay (p=0.007). Although not highly frequented by visitors, unlike popular beaches such as Ġnejna Bay and Riviera Bay, Għar Aħmar showed a higher mean concentration of DEHP. The possible increase in the average concentration of DEHP in this area might be attributed to the power plant installed in a nearby location. This industry might release DEHP into the environment through the air or through possible oils, petrochemicals and other waste discharge to aid in supplying electricity to the Maltese islands. Industries which utilized petrochemicals along with oilfield industries have contributed to large concentrations of PAEs in Laizhou Bay, China [37].
As suggested by the pairwise comparison, there was a statistical difference between the average concentrations of Riviera with that of Imġiebaħ (p= 0.007). This implies that the significant difference observed by the bays is attributed to the increased anthropogenic pressures in Riviera, which might have introduced higher DEHP concentrations in the bay. Moreover, other factors, such as the unique topography characterised by the bay, might have promoted an increase in the DEHP concentration from the upland, particularly from surface runoff of the cultivated fields of the surroundings. The trends in the average concentrations of DBP and DEHP were further investigated to determine whether their occurrence in the Maltese shoreline sand is related to anthropogenic activities. The latter was assessed by comparing mean phthalates’ concentrations in busy beaches with those categorized as having moderate-low anthropogenic activities.
3.4.2. The effect of Anthropogenic Activities on the Occurrence of Phthlates
The presumed effects of anthropogenic activities on the occurrence of phthalates were investigated through statistical analysis of comparison of means for the phthalates’ concentrations obtained in busy beaches with the average concentrations of those obtained in the beaches of moderate-low anthropogenic activities. Comparison of concentration means of DBP and DEHP was carried out using the Mann-Whitney U test. The comparisons of DBP and DEHP concentrations in beaches of anthropogenic activities suggested that there was a significant difference in the occurrence of DBP (p=0.004) and DEHP (p=0.000) in the two categories of anthropogenic activity. The Mann-Whitney U test showed a mean rank obtained for DBP of 122.33 for busy beaches and 96.42 for secluded beaches. Additionally, the mean ranks for DEHP calculated were 127.48 and 87.26 for busy beaches and beaches of low anthropogenic activity, respectively (Table 3). The mean rank is calculated based on the ranking observations of all groups. DBP and DEHP attained a high mean rank in busy beaches compared to beaches of low anthropogenic activity. This further suggests that the occurrence of phthalates between the two categories of beaches varies and that greater concentrations characterise the busy beaches. Consequently, the high mean ranks show that the occurrence of phthalates in the Maltese islands is related to anthropogenic activities. Main sources of anthropogenic activities which might have caused an increase in mean ranks in concentrations of busy beaches include plastic littering and agricultural activities.
The significant increase in plastic waste in different marine environments, such as sands, sediments and seawater, by human intervention, has introduced an increase in plasticizers, including phthalates, in the marine environment. Several studies have tested the migration of phthalates under various conditions. Paluselli et al.[38] investigated the phthalates’ occurrence in marine environments by migration to seawater phase was investigated through plastic garbage bags and electric cables which are both sources of phthalates in the environment by anthropogenic activity. This study demonstrated that Electric cables and plastic garbage bags which composed of PVC and PE, respectively and are both major sources of pollution through leaching of phthalates.
In recent years, the mulching of soil with the plastic film has been used widely, chiefly in semiarid or arid areas [39]. Plastic film mulching, also known as greenhouse, has developed into a common agricultural practice for its economic benefits and rapid production, which contribute to improving crop quality and greater crop yields. Phthalates are the major constituents of such plastic films. A plastic film is estimated to contain about 10-60% of PAEs [39]. With the extensive use of plastic mulching, significant amounts of plastic residues accumulate in soils on a yearly basis, eliciting plastic pollution. The use of agricultural film has been considered a prime source of PAEs in soils. PAEs are loosely incorporated in polymer structure in the absence of covalent bonding and thus can be released from plastic materials into soils by leaching, abrasion and migration [39]. The PAEs leached from the agricultural materials might have contributed to a higher mean rank of phthalates in beaches such as Riviera, Paradise Bay and Ġnejna, which are also uniquely characterised by headlands of cultivated soils in the nearby upland area. The leached phthalates might have migrated to the sea by surface runoff from the soil.
3.4.3. Spatial Distribution of Phthalates in Maltese shoreline sands
The presence of phthalate esters in the Maltese shoreline sands was further investigated by analysing their distribution. This was achieved by investigating the relationship between the occurrences of the two phthalates with respect to distance. The distribution was studied vertically by comparing the average concentrations of DBP and DEHP in quadrats away from the sea, and horizontally through comparison of mean concentrations obtained along the shoreline in different sampling stations to analyse the overall trends in the beaches.
The distribution of phthalates along the shoreline was investigated by analysing the concentrations of DEHP and DBP in each sampling station. The hypothesis to account for significant differences in concentrations along the shoreline was tested using the Kruskal-Wallis test. This test allowed for a comparison of the average concentrations along the shoreline. The hypothesis of having equal concentrations in different sampling stations was rejected by DBP (p=0.036) and DEHP (p=0.000) suggesting unequal distribution. , the highest mean concentration of DBP occurred at a 60m distance and showed a statistical significance with sampling station at 0m upon pairwise comparisons(p= 0.037). Pairwise comparisons for DEHP indicated a statistical significance between distances of 40 m and 60 m (p= 0.000), 0 m and 60 m (p=0.001) and 20 m and 60 m (p=0.004) along the shoreline (Table 4). A similar trend was observed when comparing the overall DEHP average concentration along the shoreline, whereby the highest average concentration was observed at 60m. Nevertheless, as opposed to DBP, DEHP showed a statistical significance between three comparisons, proposing that DEHP is more unevenly distributed than DBP in the Maltese shoreline sands.
In several studies, the occurrence of PAEs has been thoroughly investigated to identify the primary congeners of phthalates which account for their spatial distribution. The spatial distribution of phthalates in the Persian Gulf was investigated by analysing 16 PAEs along the coast [24]. In this study, the total concentration of phthalates varied between 4.25- 94.00 µg/g at four different stations along the Asalouyeh coasts [24]. The highest phthalates concentration range was obtained in the sampling station near industrial areas, while the lowest concentrations were recorded in agricultural and urban stations. The spatial distribution of phthalates in Asalouyeh coasts was attributed to the anthropogenic pressures as the highest concentrations were recorded in industrialised areas [24]. The primary identified sources were solvents and plasticisers used in different chemical industries, the use of plastic films, applications of fertilisers and pesticides, and polymer irrigation pipes in greenhouse fields [24].
The distribution of phthalates is generally investigated along extensive coastlines which cover long distances to the extent that the concentrations of phthalates at sampling stations along the beaches are reach areas which are exposed to different anthropogenic activities in their proximities. In this investigation, the statistical difference in the distribution of phthalates at different distances in Maltese shoreline sand is highly unlikely to be related to different anthropogenic activities, between different stations as suggested in the above studies. This is due to the fact that the beaches studied are substantially smaller, and the sampling stations were established at shorter distances. Thus, since the sampling stations occurred at close proximities to each other it would be unlikely for any significant difference between the sampling stations to be attributed to unique individual sources of contamination. For this reason, the statistically significant concentrations at different distances by DBP and DEHP are attributed to other factors rather than the non-point sources.
The uneven distribution of phthalates in the shoreline sand was shown by the significant difference between the mean concentrations at 60 m along the shoreline and 0 m. Both phthalates showed an enhanced mean concentration at 60 m. The increased overall mean concentration at 60 m could be due to the fact that this sampling station was solely assembled in busy beaches as the secluded beaches investigated were not as extensive as the popular beaches. Hence the sampling station at 60 m could not be assembled in secluded beaches. Subsequently, higher overall mean concentrations at the 60 m sampling station could be attributed to higher anthropogenic activities as they are subject to more point sources of contaminants such as the littering of plastic materials by visitors.
The high overall mean DBP and DEHP concentrations at 60 m might be attributed to the increased accumulation of the contaminants at such distances. The sampling stations at 60 m were assembled at the peripheral areas of the coasts. These areas might not be as trampled upon as the central areas on the beach. Consequently, the sampling stations at 0 m, 20 m and 40 m, which were assembled close to or near central areas of the coast, might have been characterised by lower overall mean concentrations as such areas could be more subject to trampling. Furthermore, trampling activities might distribute DBP and DEHP more evenly between the sampling stations in central areas; hence the contaminants would accumulate less. The increased distribution in the central areas could have caused lower overall mean concentrations causing a significant difference between the sampling stations at the centre and that at 60 m, thus leading to the rejection of the hypothesis of equal distribution between different sampling stations along the shoreline.
The uneven distribution of the overall mean concentrations of DBP and DEHP in the Maltese shoreline sand might also be attributed to the chemodynamic properties of the phthalate esters. The overall distribution of the phthalates investigated might have been effected by their rate of migration. Russel and McDuffie [40] reported that phthalate esters exhibit differing physiochemical properties such as mobility and rate of migration. This study showed that DBP has a lower partition coefficient and is able to migrate more. This might have caused DBP to be less unevenly distributed than DEHP as it has a less tendency of accumulating.
The distribution of phthalates in the Maltese shoreline sand was also investigated at a distance away from the sea. Analysis of the overall mean concentration of phthalates at perpendicular distance to the tideline and away from the sea could indicate whether the sea or its dynamics impact the distribution of the contaminants. This was achieved by investigating the overall mean concentrations at four-meter interval from the high tideline. The comparison of means of concentrations of phthalates away from the shoreline was investigated by the Kruskal-Wallis test. The hypothesis of having equal concentrations of DBP and DEHP at distances away from the tideline was accepted by DBP (p= 0.850) and rejected by DEHP (p=0.000). From this result it is deduced that DBP is evenly distributed at a perpendicular distance from the sea whilst DEHP is unevenly distributed. The highest overall mean concentration of DEHP was observed at 12 m distance from the high tideline. There was a gradual increase in the DEHP average concentrations with increased perpendicular distance to the shoreline. The point of origin (0 m) showed a significant difference between the overall mean concentrations at 8 m and 12 m, respectively (Table 5). This suggests that the overall longitudinal distribution and increase in mean concentration from the shoreline might be more attributed to the anthropogenic sources and human activity on the sand than the sea.
In a study by La Nasa et al. [41] the qualification and quantification of phthalates and microplastics were investigated. Samples from the foreshore and the backshore of the same transect were analysed to evaluate differences in the phthalates’ occurrence as a function of distance from water [41]. The foreshore samples contained lower concentrations of phthalates when compared to the backshore samples. La Nasa et al. attributed this difference to the enhanced leaching by the action of seawater on the sand41. Phthalates present in the sand at close distances to the high tideline are subjected to wave action, as opposed to the backshore samples. The mechanical action of waves could also favour the suspension of plastic particles causing a decrease in point sources and concentrations of phthalates at distances close to the sea.
The longitudinal spatial distribution observed indicates that the occurrence is likely related to anthropogenic activities, as the increase in average overall concentration of DEHP was observed at distances further from the sea. This suggests that the pre-eminent sources of phthalates on the shoreline that effect the distribution are related to point sources in the shoreline or other non-point sources that interact with the sand rather than non-point sources from the sea. Furthermore, different sources by different anthropogenic pressures might have contributed to the varied distribution of DBP and DEHP in the Maltese shoreline sand.
3.4.4. Cluster Analysis
The distribution of DBP and DEHP away from the shoreline was further investigated through cluster analysis. This allowed for the grouping of the concentrations DBP and DEHP into different clusters based on the distance away from the tideline. Cluster analysis was used to prove the interactions between the concentrations attained for the beaches of different anthropogenic pressures and the distance away from the tideline. The four dendrograms obtained at the four different distances from the sea (0 m, 4 m, 8 m, 12 m from the tideline) were further investigated by analysing the occurrences of the beaches in the clusters obtained.
As shown in Figure 3, the concentrations of DBP and DEHP were grouped into 5 main clusters. The first cluster which was characterised by low phthalates concentrations (denoted by blue colours of the heat map) consisted of four different beaches, namely Imġiebaħ, Paradise Bay, Ġnejna and White Tower (Figure 4). A similar trend was observed in cluster 2 as low DEHP concentrations by Imġiebaħ, Riviera and White Tower were observed. Large concentrations of DBP were observed in cluster 3 by Imġiebaħ and Riviera Bay and in cluster 5 by samples from Paradise Bay. However, the former two clusters were much smaller than clusters 1 and 2 indicating that the majority of the samples in this dendrogram were observed at low concentrations. This further implies that overall, the DBP and DEHP concentrations at distances near the tideline occur at low concentrations in the six different beaches.
The dendrogram obtained by the samples from the six different beaches at 4 m away from the tide line (Figure 5) was grouped into three major clusters. Cluster 1 was the largest cluster obtained and consisted of 5 different beaches: Imġiebaħ, Riviera, Ġnejna, White Tower, Paradise Bay (Figure 6). Taking into account the heat map obtained, the predominance of the blue colouration depicts that the majority of the concentrations at such beaches occur at low concentrations. Furthermore, the second cluster grouped samples taken from Għar Aħmar, Ġnejna and Paradise Bay which were identified as having low DBP concentration and large DEHP concentration. The majority of the data which was grouped in this cluster was of Għar Aħmar, which was characterised by 50% of the data clustered. The third cluster grouped data of samples from Riviera and Għar Aħmar which showed large concentration of DBP and low concentrations of DEHP. In this cluster, the majority of the data obtained was of Riviera Bay. Additionally, as shown Figure 5 the heat map showed an increase in the frequency of large concentrations both by DBP and DEHP when compared to the first dendrogram as the clusters obtained which identified high concentrations ( primarily, cluster 2 and 3) were larger than the clusters observed in the Figure 3. This demonstrates that the concentrations of phthalates increases with increasing distance from the tideline.
As shown in Figure 7, the first cluster was grouped by data of samples from Għar Aħmar, Paradise Bay, Ġnejna and White tower which exhibited low DBP and DEHP concentrations and moderately high DEHP concentrations. This cluster links samples from Għar Aħmar and Paradise Bay depicting moderately high concentrations of DEHP. Furthermore, the second cluster grouped samples of moderately high DBP concentration, with a majority of 60% of the data of this cluster originating from Paradise Bay (Figure 8). The third cluster was mapped on fewer numbers of samples and consisted of equal number of samples from Paradise Bay and Riviera. This cluster exhibited the highest concentrations of DBP and DEHP when compared to the other clusters in this dendrogram. This overall increase in concentrations by DBP and DEHP verifies the previously discussed outcome of having higher phthalates concentrations at distances away from the tideline. In addition to this, the large concentrations mapped in the third cluster could be attributed to the anthropogenic activities associated with Paradise Bay and Riviera Bay.
The dendrogram obtained by the samples at 12 meters distance from the tideline showed three major clusters (Figure 9). The first cluster grouped samples from Paradise Bay, Ġnejna, Riviera and White tower of low to moderate concentrations of DBP and DEHP suggesting that some of the samples from beaches of different exposure to anthropogenic activities occurred at low concentrations at 12 m distance from the tideline. However, heat maps of clusters 2 and 3 depicted samples from Paradise Bay, Ġnejna and Riviera as having high concentrations of phthalates. Taking into account cluster 3, samples from Paradise Bay and Ġnejna, which were categorised as busy beaches, were linked together depicting high concentrations of DEHP by an equal number of sampling points, shown by the 50% frequency of samples from the two beaches (Figure 10). Moreover, samples from Paradise Bay also showed high concentrations of DBP as depicted by the heat map. The third cluster was mapped on fewer beaches’ occurrences as it was only grouped by samples from Riviera Bay. Samples in this cluster were mapped for high concentrations of DBP and low concentration of DEHP.
As shown in the above dendrograms and heat maps the high concentrations of phthalates increased with increasing distance from the tideline. This was depicted by the increased phthalate concentration from cluster analysis 1 to cluster analysis 4. This further suggests that the concentration of phthalates is affected by the distance from the sea and could thus proves that low concentrations of phthalates at distances close to the tideline are attributed to the increased wave action which leaches the contaminants to seawater. In addition to this, the majority of the clusters which were mapped as having high concentrations of phthalates and which were clustered together at different distances form the tideline consisted of sampling points located in busy beaches (Paradise Bay, Riviera and Ġnejna). This thus proves that wave action and anthropogenic activities are the main factors for the increase in phthalates concentrations at distances away from the sea in Maltese shoreline sands.
5. Conclusions
The results obtained provide the first data of the occurrence and distribution of phthalates acid esters in Maltese shoreline sand. The quantification of DBP and DEHP concentrations demonstrated that overall the Maltese shoreline sand is characterized by lower phthalate esters concentrations than those quoted in literature. Moreover, DEHP attained higher concentrations and more extensive concentration ranges than DBP. The occurrence of the two phthalate esters was investigated by statistical analysis of the comparison of concentration means in different beaches.
The comparison of mean DBP and DEHP concentrations in different beaches suggested that the occurrence of phthalate esters varies significantly. . The statistical significance in the average DBP and DEHP concentrations in different beaches was attributed to different factors such as littering, topography and agricultural activities that characterise the beaches distinctively. The presumed anthropogenic pressures were analysed by comparing the average DBP and DEHP concentrations in busy and secluded beaches. Statistical analysis demonstrated that the DBP and DEHP concentrations are related to anthropogenic activities as a higher mean rank was obtained by the two phthalates in beaches categorised as busy.
The study of the distribution of phthalates along the beach showed that the average concentrations along the shoreline vary, and both phthalates are not equally distributed. The analysis of the distribution of phthalates at distances away from the shore showed that DBP and DEHP exhibit different distributions. DBP showed a homogenous distribution, whilst DEHP showed an uneven distribution. The differences in distribution were attributed to the topography of the different chemodyanmic properties of the two phthalates, wave action and anthropogenic activities. Cluster Analysis confirmed that the increase in concentrations at distances away from the sea is attributed to wave action and anthropogenic stresses.
Further scientific analysis is suggested to assess the phthalates occurrences by investigating the presence of more PAEs and to scrutinize the distribution temporally in attempt of minimizing the pollution on sandy beaches and to reduce the ecological risks.
Supplementary Materials
The following supporting information can be downloaded at the website of this paper posted on Preprints.org, Figure S1: The geographical location of Malta in the centre of the Mediterranean. ; Figure S2: The location of the Maltese beaches sampled.
Author Contributions
Conceptualization, E.S., F.L. and M.M.; methodology, F.L and M.M.; software, F.L and M.M.; validation, F.L and M.M.; formal analysis, M.M., F.L., E.S.; resources, E.S., F.L.; writing—original draft preparation, M.M, F.L., E.S.; writing—review and editing, M.M, F.L., E.S.; supervision, E.S., F.L. All authors have read and agreed to the published version of the manuscript.
Funding
This research received no external funding.
Data Availability Statement
Not applicable.
Conflicts of Interest
The authors declare no conflict of interest.
References
- Gavrilescu, M.; Demnerová, K.; Aamand, J.; Agathos, S.; Fava, F. Emerging Pollutants in the Environment: Present and Future Challenges in Biomonitoring, Ecological Risks and Bioremediation. New Biotechnol. 2015, 32, 147–156. [Google Scholar] [CrossRef]
- Alharbi, O. M. L.; Basheer, A. A.; Khattab, R. A.; Ali, I. Health and Environmental Effects of Persistent Organic Pollutants. J. Mol. Liq. 2018, 263, 442–453. [Google Scholar] [CrossRef]
- Dimpe, K. M.; Nomngongo, P. N. Current Sample Preparation Methodologies for Analysis of Emerging Pollutants in Different Environmental Matrices. TrAC Trends Anal. Chem. 2016, 82, 199–207. [Google Scholar] [CrossRef]
- Thushari, G. G. N.; Senevirathna, J. D. M. Plastic Pollution in the Marine Environment. Heliyon 2020, 6. [Google Scholar] [CrossRef] [PubMed]
- Worm, B.; Lotze, H. K.; Jubinville, I.; Wilcox, C.; Jambeck, J. Plastic as a Persistent Marine Pollutant. Annu. Rev. Environ. Resour. 2017, 42, 1–26. [Google Scholar] [CrossRef]
- Sigler, M. The Effects of Plastic Pollution on Aquatic Wildlife: Current Situations and Future Solutions. Water. Air. Soil Pollut. 2014, 225. [Google Scholar] [CrossRef]
- King, R.; Grau-Bové, J.; Curran, K. Plasticiser Loss in Heritage Collections: Its Prevalence, Cause, Effect, and Methods for Analysis. Herit. Sci. 2020, 8. [Google Scholar] [CrossRef]
- Billings, A.; Jones, K. C.; Pereira, M. G.; Spurgeon, D. J. Plasticisers in the Terrestrial Environment: Sources, Occurrence and Fate. Environ. Chem. 2021, 18. [Google Scholar] [CrossRef]
- Rahman, M.; Brazel, C. The Plasticizer Market: An Assessment of Traditional Plasticizers and Research Trends to Meet New Challenges. Prog. Polym. Sci. 2004, 29, 1223–1248. [Google Scholar] [CrossRef]
- Hennebert, P. Hazardous Properties of Plasticisers That May Hinder the Recycling of Plastics. Detritus 2022, No. 21, 35–44. [Google Scholar] [CrossRef]
- Pecht, M. G.; Ali, I.; Carlson, A. Phthalates in Electronics: The Risks and the Alternatives. IEEE Access 2018, 6, 6232–6242. [Google Scholar] [CrossRef]
- Hauser, R. PHTHALATES AND HUMAN HEALTH. Occup. Environ. Med. 2005, 62, 806–818. [Google Scholar] [CrossRef] [PubMed]
- Net, S.; Sempéré, R.; Delmont, A.; Paluselli, A.; Ouddane, B. Occurrence, Fate, Behavior and Ecotoxicological State of Phthalates in Different Environmental Matrices. Environ. Sci. Technol. 2015, 49, 4019–4035. [Google Scholar] [CrossRef] [PubMed]
- Hannon, P. R.; Flaws, J. A. The Effects of Phthalates on the Ovary. Front. Endocrinol. 2015, 6. [Google Scholar] [CrossRef] [PubMed]
- Johns, L. E.; Cooper, G. S.; Galizia, A.; Meeker, J. D. Exposure Assessment Issues in Epidemiology Studies of Phthalates. Environ. Int. 2015, 85, 27–39. [Google Scholar] [CrossRef] [PubMed]
- Heudorf, U.; Mersch-Sundermann, V.; Angerer, J. Phthalates: Toxicology and Exposure. Int. J. Hyg. Environ. Health 2007, 210, 623–634. [Google Scholar] [CrossRef]
- Vella, A. J.; Mintoff, B.; Axiak, V.; Agius, D.; Cassone, R. Organotin Pollution in Malta Coastal Zone. Toxicol. Environ. Chem. 1998, 67, (3–4). [Google Scholar] [CrossRef]
- Huntingford, E. J.; Turner, A. Trace Metals in Harbour and Slipway Sediments from the Island of Malta, Central Mediterranean. Mar. Pollut. Bull. 2011, 62, 1557–1561. [Google Scholar] [CrossRef]
- González-Mazo; Universidad de Cádiz; Gonzalez, E.; Leon, V.; Lara-Martin, P. A.; Sinagra, E.; Pintado-Herrera, M. Assesment on the Occurrence and Distribution of Persistent and Emerging Organic Contaminant On The Maltese Coast. In proceedings of SIQUIMAR, Barcelona,Spain, 01/07/2020.
- Azzopardi, I. M.; Lia, F.; Costa, C. Assessment of Heavy Metal Distributions in Sand Beaches in the Maltese Islands. Appl. Sci. 2022, 12. [Google Scholar] [CrossRef]
- Chen, C.-W.; Chen, C.-F.; Dong, C.-D. Distribution of Phthalate Esters in Sediments of Kaohsiung Harbor, Taiwan. Soil Sediment Contam. Int. J. 2013, 22, 119–131. [Google Scholar] [CrossRef]
- Wu, T.; Wang, C.; Wang, X.; Xiao, H.; Ma, Q.; Zhang, Q. Comparison of UPLC and HPLC for Analysis of 12 Phthalates. Chromatographia 2008, 68, (9–10). [Google Scholar] [CrossRef]
- Net, S.; Delmont, A.; Sempéré, R.; Paluselli, A.; Ouddane, B. Reliable Quantification of Phthalates in Environmental Matrices (Air, Water, Sludge, Sediment and Soil): A Review. Sci. Total Environ. 2015, 515–516, 162–180. [Google Scholar] [CrossRef] [PubMed]
- Arfaeinia, H.; Fazlzadeh, M.; Taghizadeh, F.; Saeedi, R.; Spitz, J.; Dobaradaran, S. Phthalate Acid Esters (PAEs) Accumulation in Coastal Sediments from Regions with Different Land Use Configuration along the Persian Gulf. Ecotoxicol. Environ. Saf. 2019, 169, 496–506. [Google Scholar] [CrossRef]
- Zhou, W.; Yang, S.; Wang, P. G. Matrix Effects and Application of Matrix Effect Factor. Bioanalysis 2017, 9, 1839–1844. [Google Scholar] [CrossRef] [PubMed]
- Thakur, D.; Parakash Dubey, N.; Singh, R. A Review on Spike and Recovery Method in Analytical Method Development and Validation. Crit. Rev. Anal. Chem. 2022, 1–19. [Google Scholar] [CrossRef]
- Keith, L. H.; Corporation, R.; Crummett, W.; Deegan, J.; Libby, R. A.; Taylor, J. K.; Wentler, G. Principles of Environmental Analysis’.
- Borges Ramirez, M. M.; Dzul Caamal, R.; Rendón von Osten, J. Occurrence and Seasonal Distribution of Microplastics and Phthalates in Sediments from the Urban Channel of the Ria and Coast of Campeche, Mexico. Sci. Total Environ. 2019, 672, 97–105. [Google Scholar] [CrossRef]
- Hassanzadeh, N.; Esmaili Sari, A.; Khodabandeh, S.; Bahramifar, N. Occurrence and Distribution of Two Phthalate Esters in the Sediments of the Anzali Wetlands on the Coast of the Caspian Sea (Iran). Mar. Pollut. Bull. 2014, 89, (1–2). [Google Scholar] [CrossRef]
- Schembri, P. J.; Lanfranco, E.; Micallef, S.-A.; Fava, G. An Ecological survey of the Ghajn Tuffieha area prepared for the GAIA Foundation as part of the Management plan for the areas; Malta University Services Limited, University Campus, Msida, Malta.
- Delvalle de Borrero, D.; Fábrega Duque, J.; Olmos, J.; Garcés-Ordóñez, O.; Amaral, S. S. G. do; Vezzone, M.; de Sá Felizardo, J. P.; Meigikos dos Anjos, R. Distribution of Plastic Debris in the Pacific and Caribbean Beaches of Panama. Air Soil Water Res. 2020, 13, 117862212092026. [Google Scholar] [CrossRef]
- Xu, G.; Li, F.; Wang, Q. Occurrence and Degradation Characteristics of Dibutyl Phthalate (DBP) and Di-(2-Ethylhexyl) Phthalate (DEHP) in Typical Agricultural Soils of China. Sci. Total Environ. 2008, 393, 333–340. [Google Scholar] [CrossRef]
- Cao, Y.; Li, J.; Lin, H.; Lao, J.-Y. Phthalate Esters in Seawater and Sediment of the Northern South China Sea: Occurrence, Distribution, and Ecological Risks. Sci. Total Environ. 2021, No. 811, 11. [Google Scholar] [CrossRef]
- Liang, J.; Ning, X.; Kong, M.; Liu, D.; Wang, G.; Cai, H.; Sun, J.; Zhang, Y.; Lu, X.; Yuan, Y. Elimination and Ecotoxicity Evaluation of Phthalic Acid Esters from Textile-Dyeing Wastewater. Environ. Pollut. 2017, 231, 115–122. [Google Scholar] [CrossRef] [PubMed]
- Schembri, P. J.; Deidun, A. Is Faunal Diversity on Maltese Sandy Beaches Related to Intensity of Human Use?; Department of Biology, University of Malta: Msida, Malta; pp 1–7.
- Pfeiffer, R.; Valentino, G.; D’Amico, S.; Piroddi, L.; Galone, L.; Calleja, S.; Farrugia, R. A.; Colica, E. Use of UAVs and Deep Learning for Beach Litter Monitoring. Electronics 2022, 12, 198. [Google Scholar] [CrossRef]
- Zhang, B.-T.; Gao, Y.; Lin, C.; Yang, W.; Liu, T.; Liu, X.; Wang, Y. Spatial Distribution of Phthalate Acid Esters in Sediments of the Laizhou Bay and Its Relationship with Anthropogenic Activities and Geochemical Variables. Sci. Total Environ. 2020, 722, 137912. [Google Scholar] [CrossRef] [PubMed]
- Paluselli, A.; Fauvelle, V.; Galgani, F.; Sempéré, R. Phthalate Release from Plastic Fragments and Degradation in Seawater. Environ. Sci. Technol. 2019, 53, 166–175. [Google Scholar] [CrossRef]
- Lü, H.; Mo, C.-H.; Zhao, H.-M.; Xiang, L.; Katsoyiannis, A.; Li, Y.-W.; Cai, Q.-Y.; Wong, M.-H. Soil Contamination and Sources of Phthalates and Its Health Risk in China: A Review. Environ. Res. 2018, 164, 417–429. [Google Scholar] [CrossRef]
- Russell, D. J.; McDuffle, B. Chemodynamic Properties of Phthalate esters: Partitioning and soil migration.
- La Nasa, J.; Biale, G.; Mattonai, M.; Modugno, F. Microwave-Assisted Solvent Extraction and Double-Shot Analytical Pyrolysis for the Quali-Quantitation of Plasticizers and Microplastics in Beach Sand Samples. J. Hazard. Mater. 2021, 401, 123287. [Google Scholar] [CrossRef]
Figure 1.
Bar graphs showing the average DBP and DEHP concentrations (µg/g) in different quadrats at the secluded beaches of (a) Imgiebah (b) Ghar ahmar (c) White Tower and their respective standard deviation indicated by the error bars ; * represents DEHP concentrations <LOQ.
Figure 1.
Bar graphs showing the average DBP and DEHP concentrations (µg/g) in different quadrats at the secluded beaches of (a) Imgiebah (b) Ghar ahmar (c) White Tower and their respective standard deviation indicated by the error bars ; * represents DEHP concentrations <LOQ.
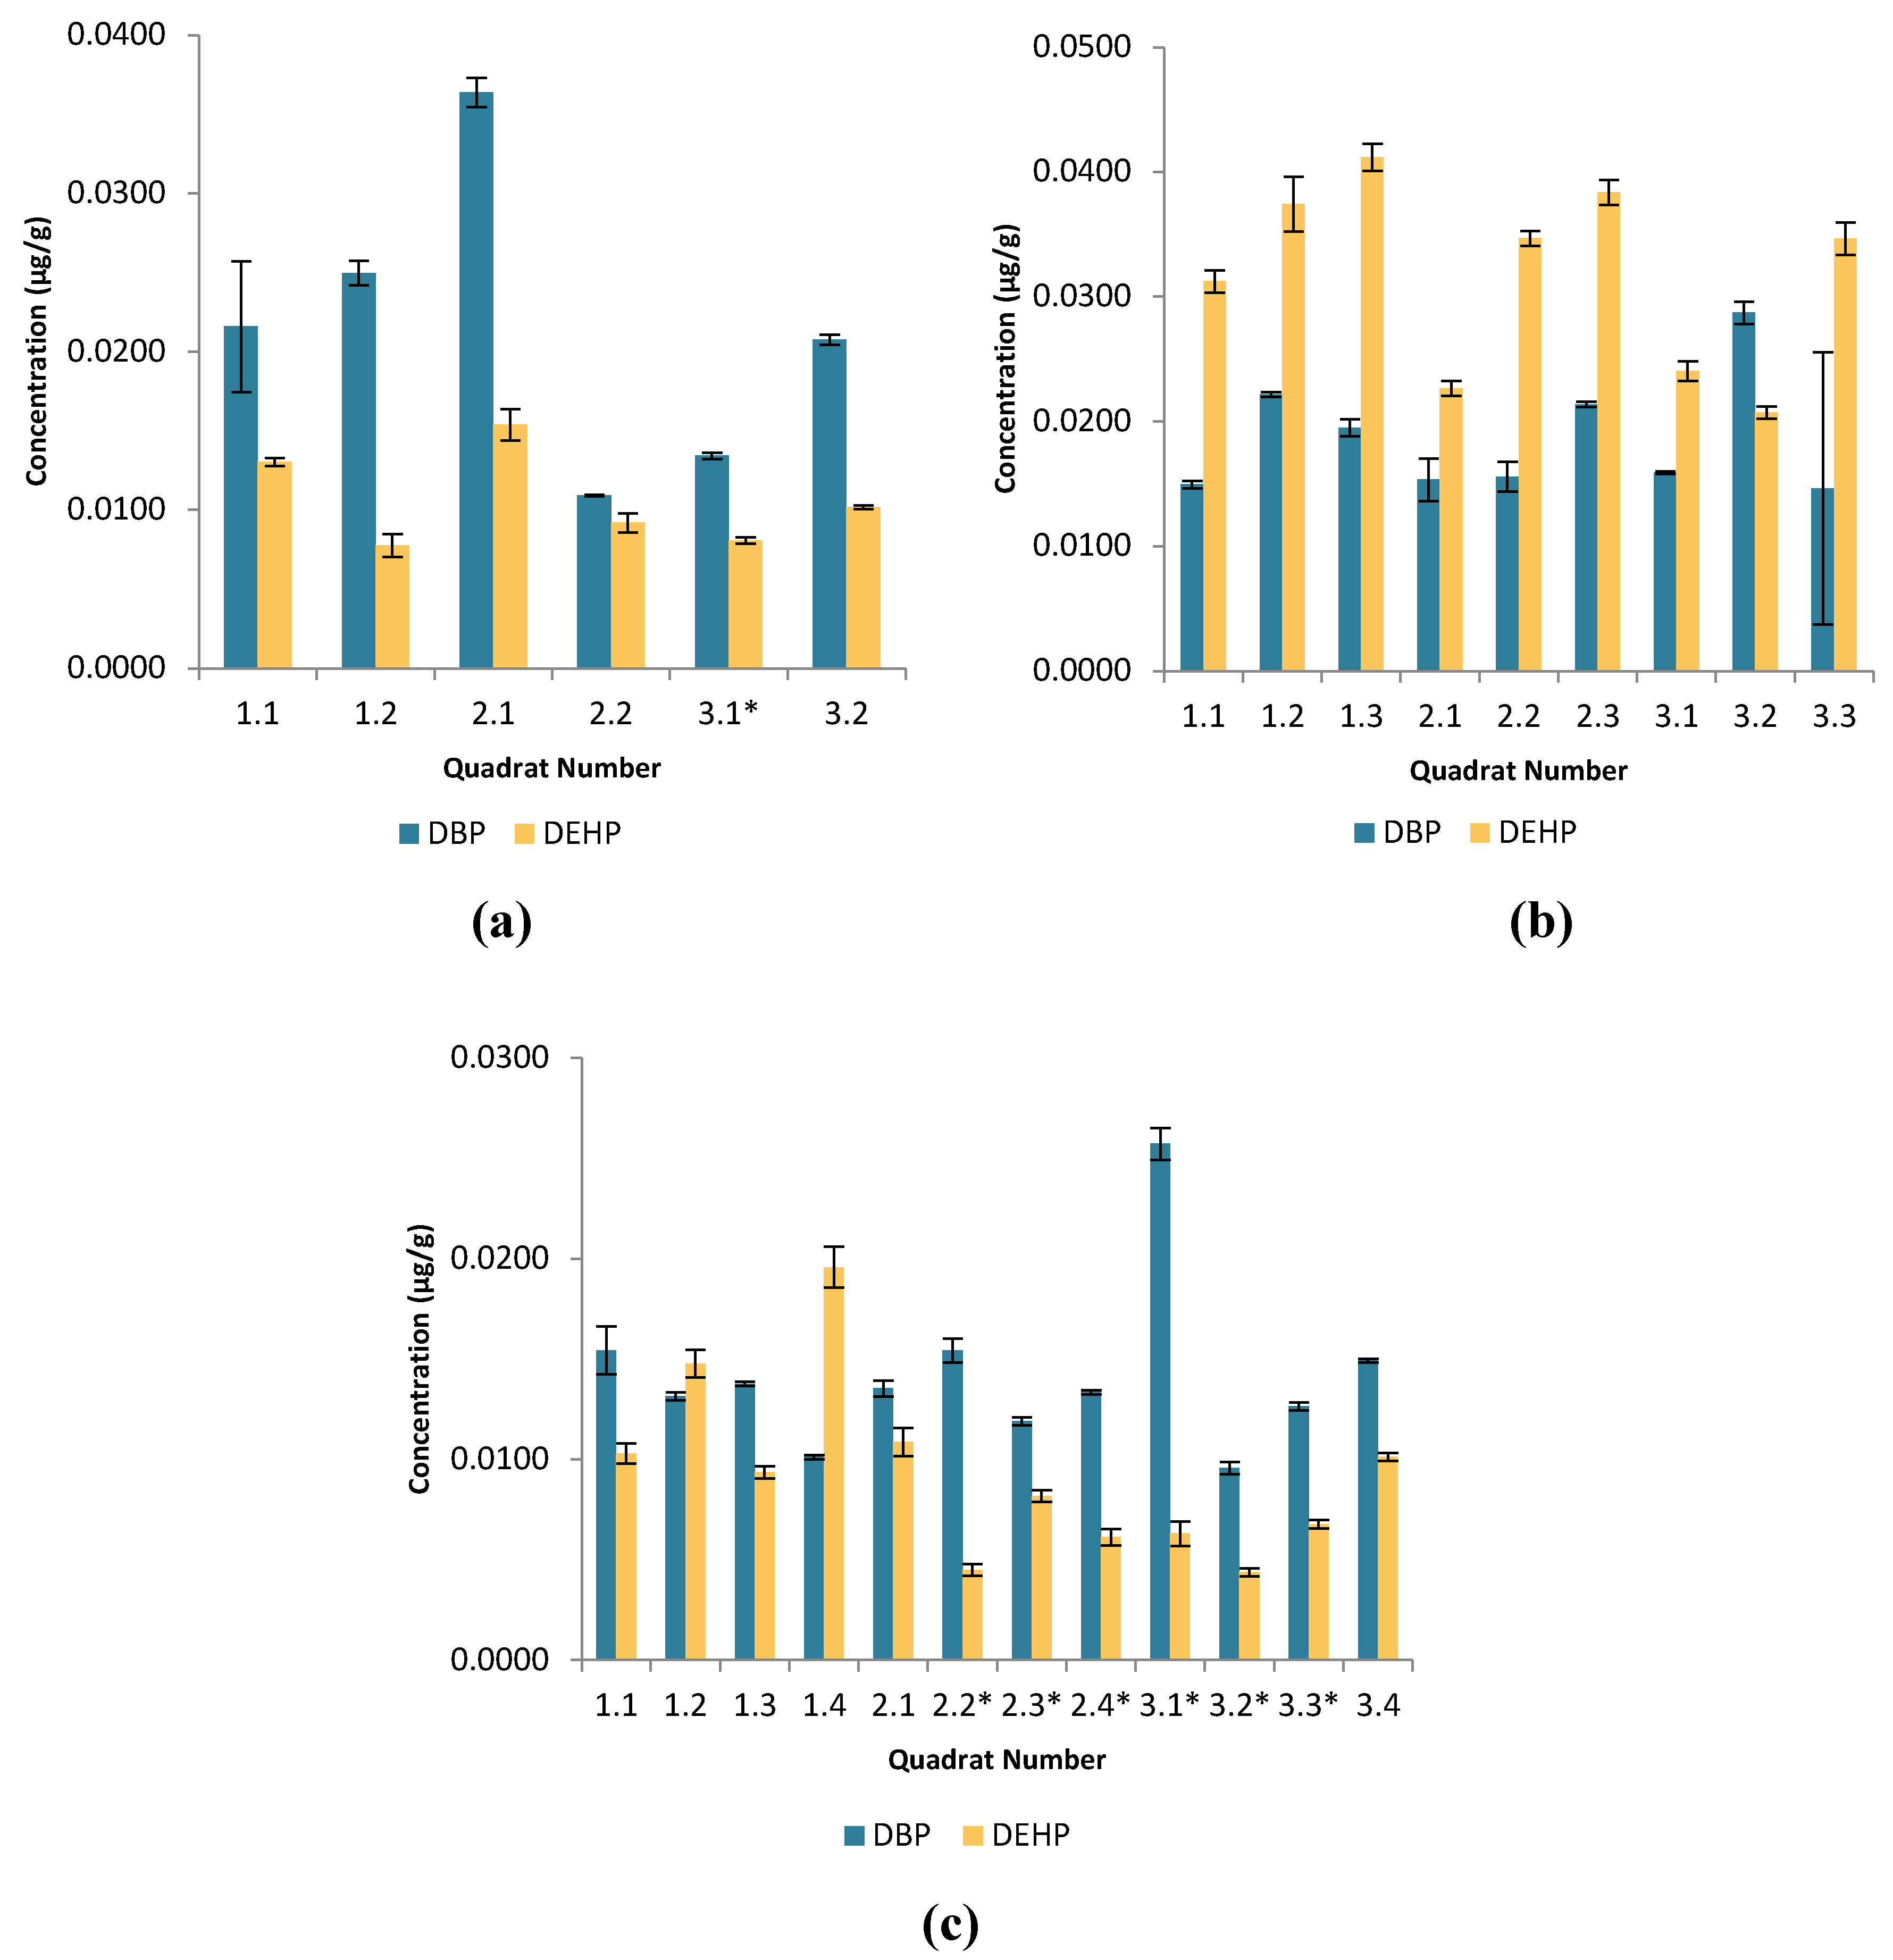
Figure 2.
Bar graphs showing the average DBP and DEHP concentrations (µg/g) in different quadrats at the busy beaches of (a) Paradise Bay (b) Ġnejna (c) Riviera and their respective standard deviation indicated by the error bars.
Figure 2.
Bar graphs showing the average DBP and DEHP concentrations (µg/g) in different quadrats at the busy beaches of (a) Paradise Bay (b) Ġnejna (c) Riviera and their respective standard deviation indicated by the error bars.
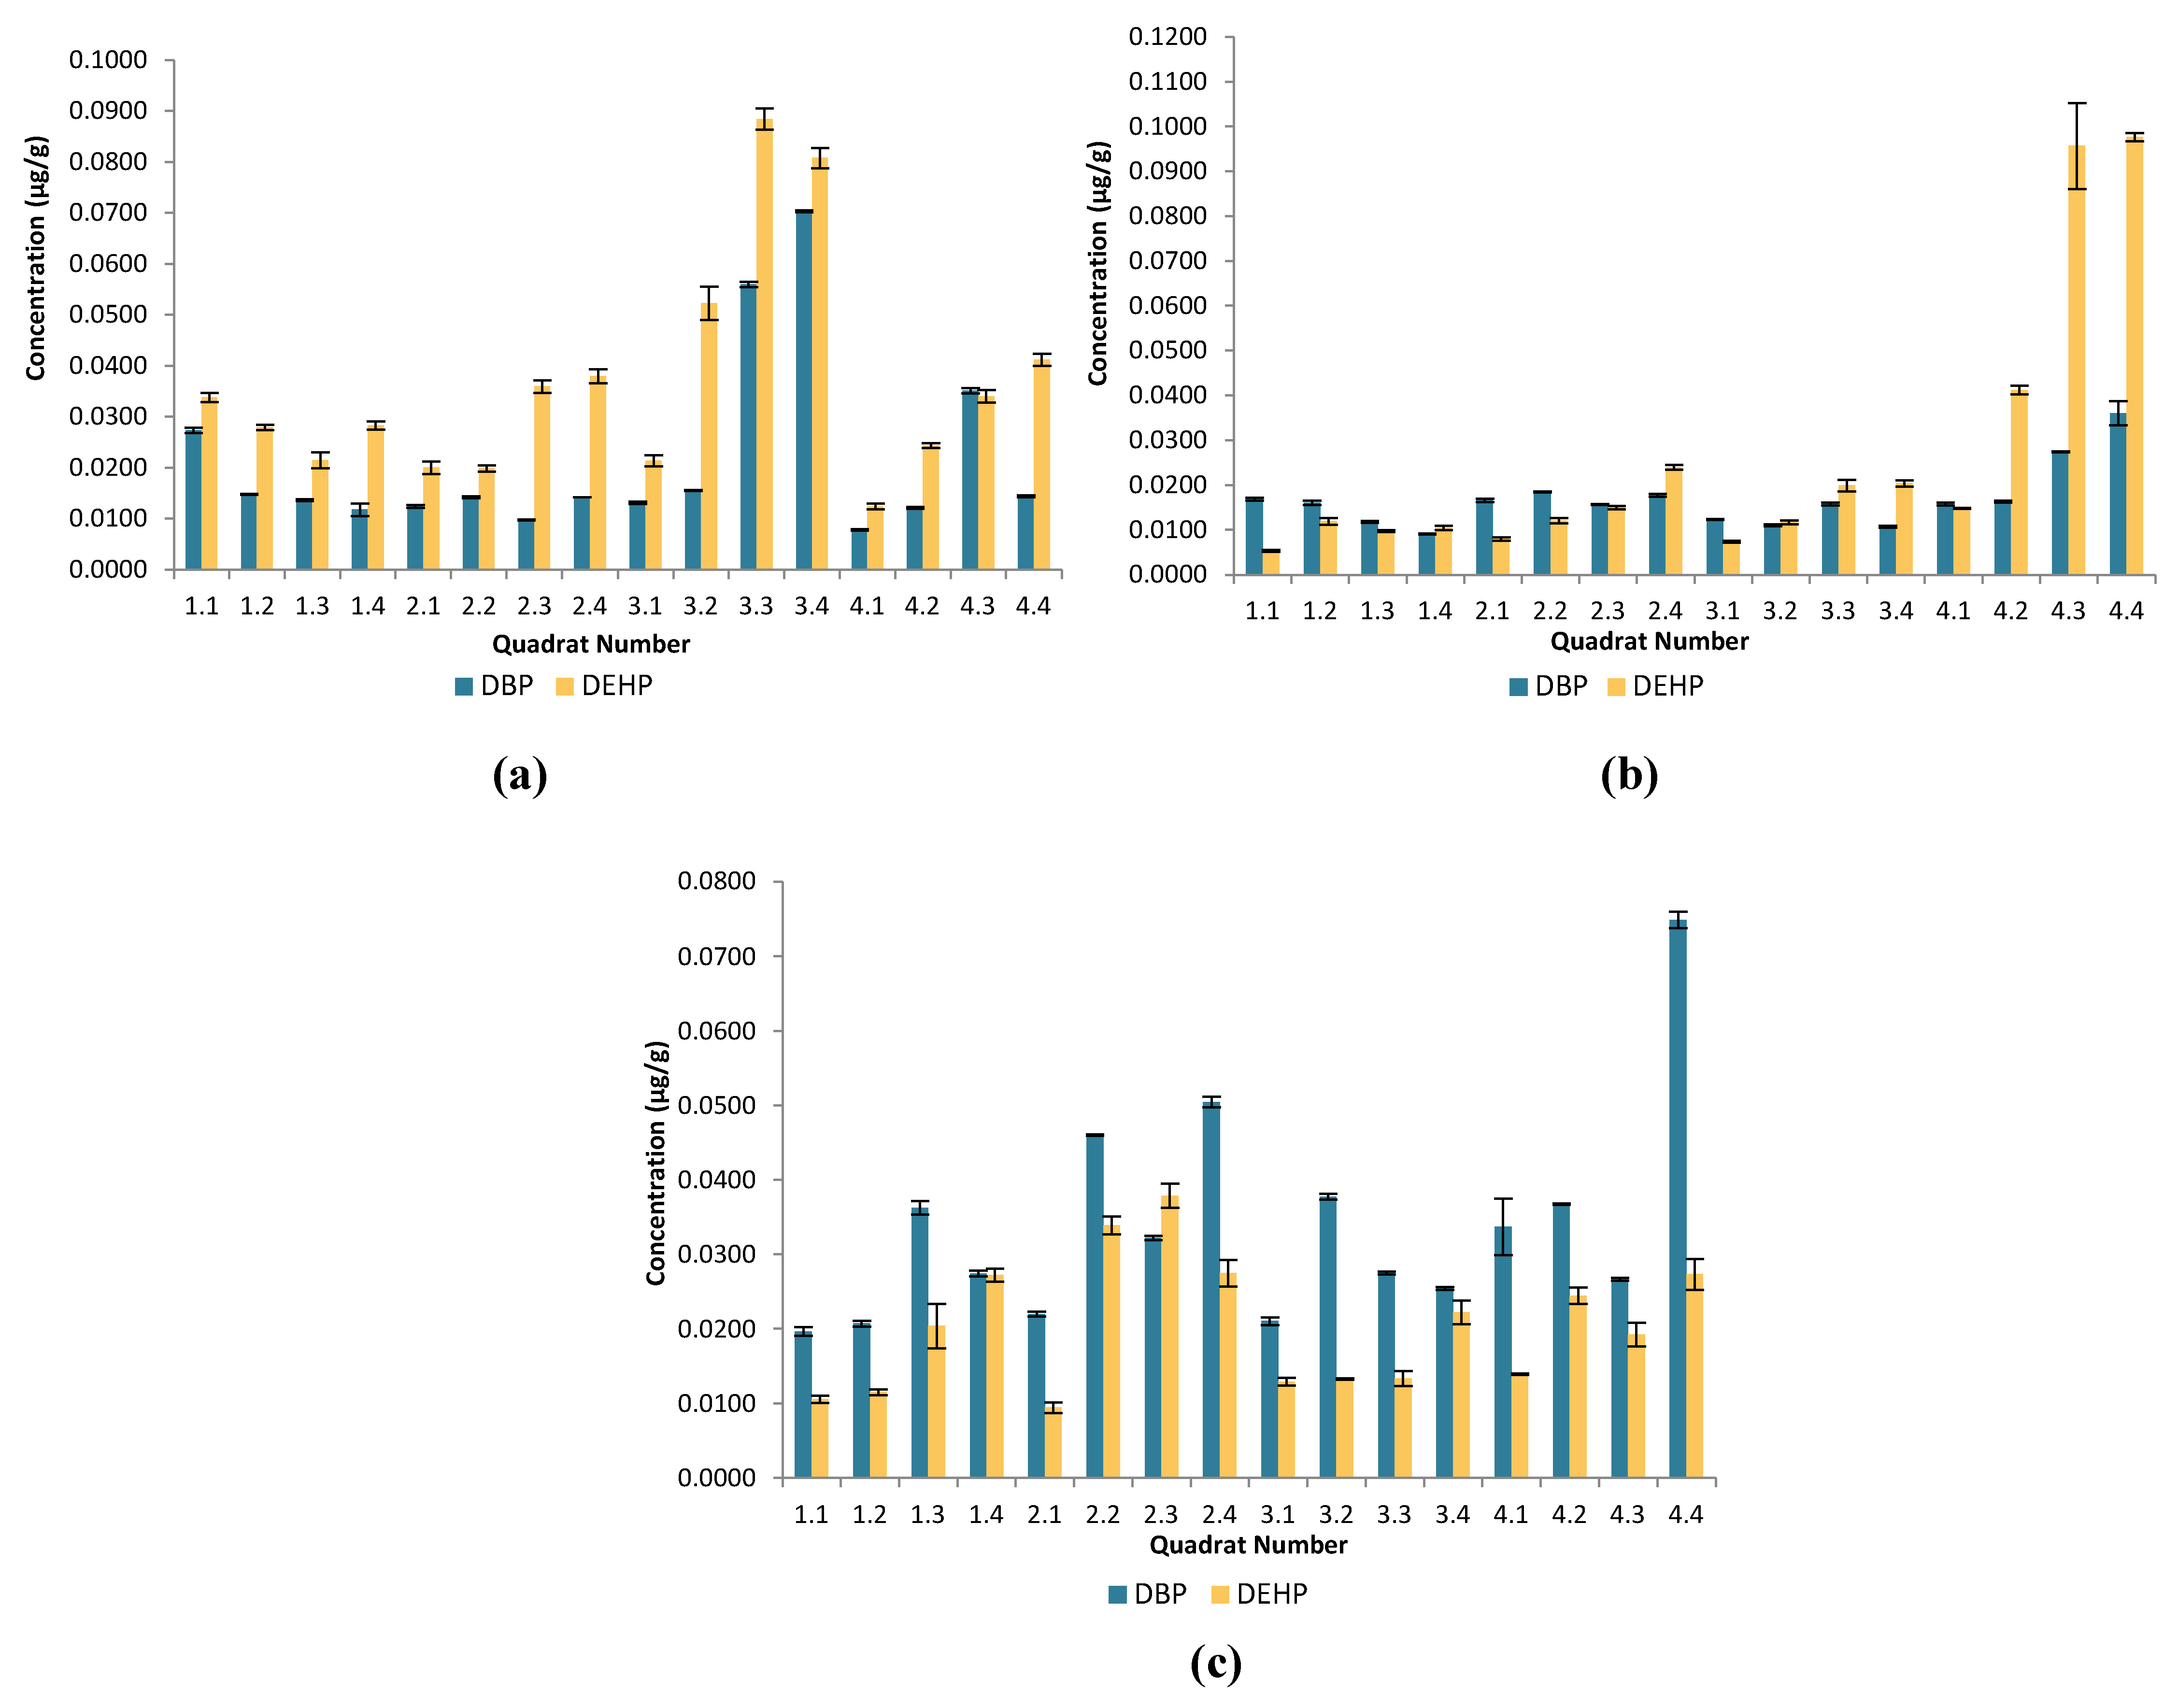
Figure 3.
Cluster analysis showing dendrogram and heat map (blue boxes representing low concentrations and red boxes representing high concentration) of the DBP and DEHP at a distance at the tideline (0m from the sea) , 1-Imġiebaħ 2- Għar Aħmar, 3-Paradise Bay, 4- Ġnejna, 5-Riviera, 6-White Tower.
Figure 3.
Cluster analysis showing dendrogram and heat map (blue boxes representing low concentrations and red boxes representing high concentration) of the DBP and DEHP at a distance at the tideline (0m from the sea) , 1-Imġiebaħ 2- Għar Aħmar, 3-Paradise Bay, 4- Ġnejna, 5-Riviera, 6-White Tower.
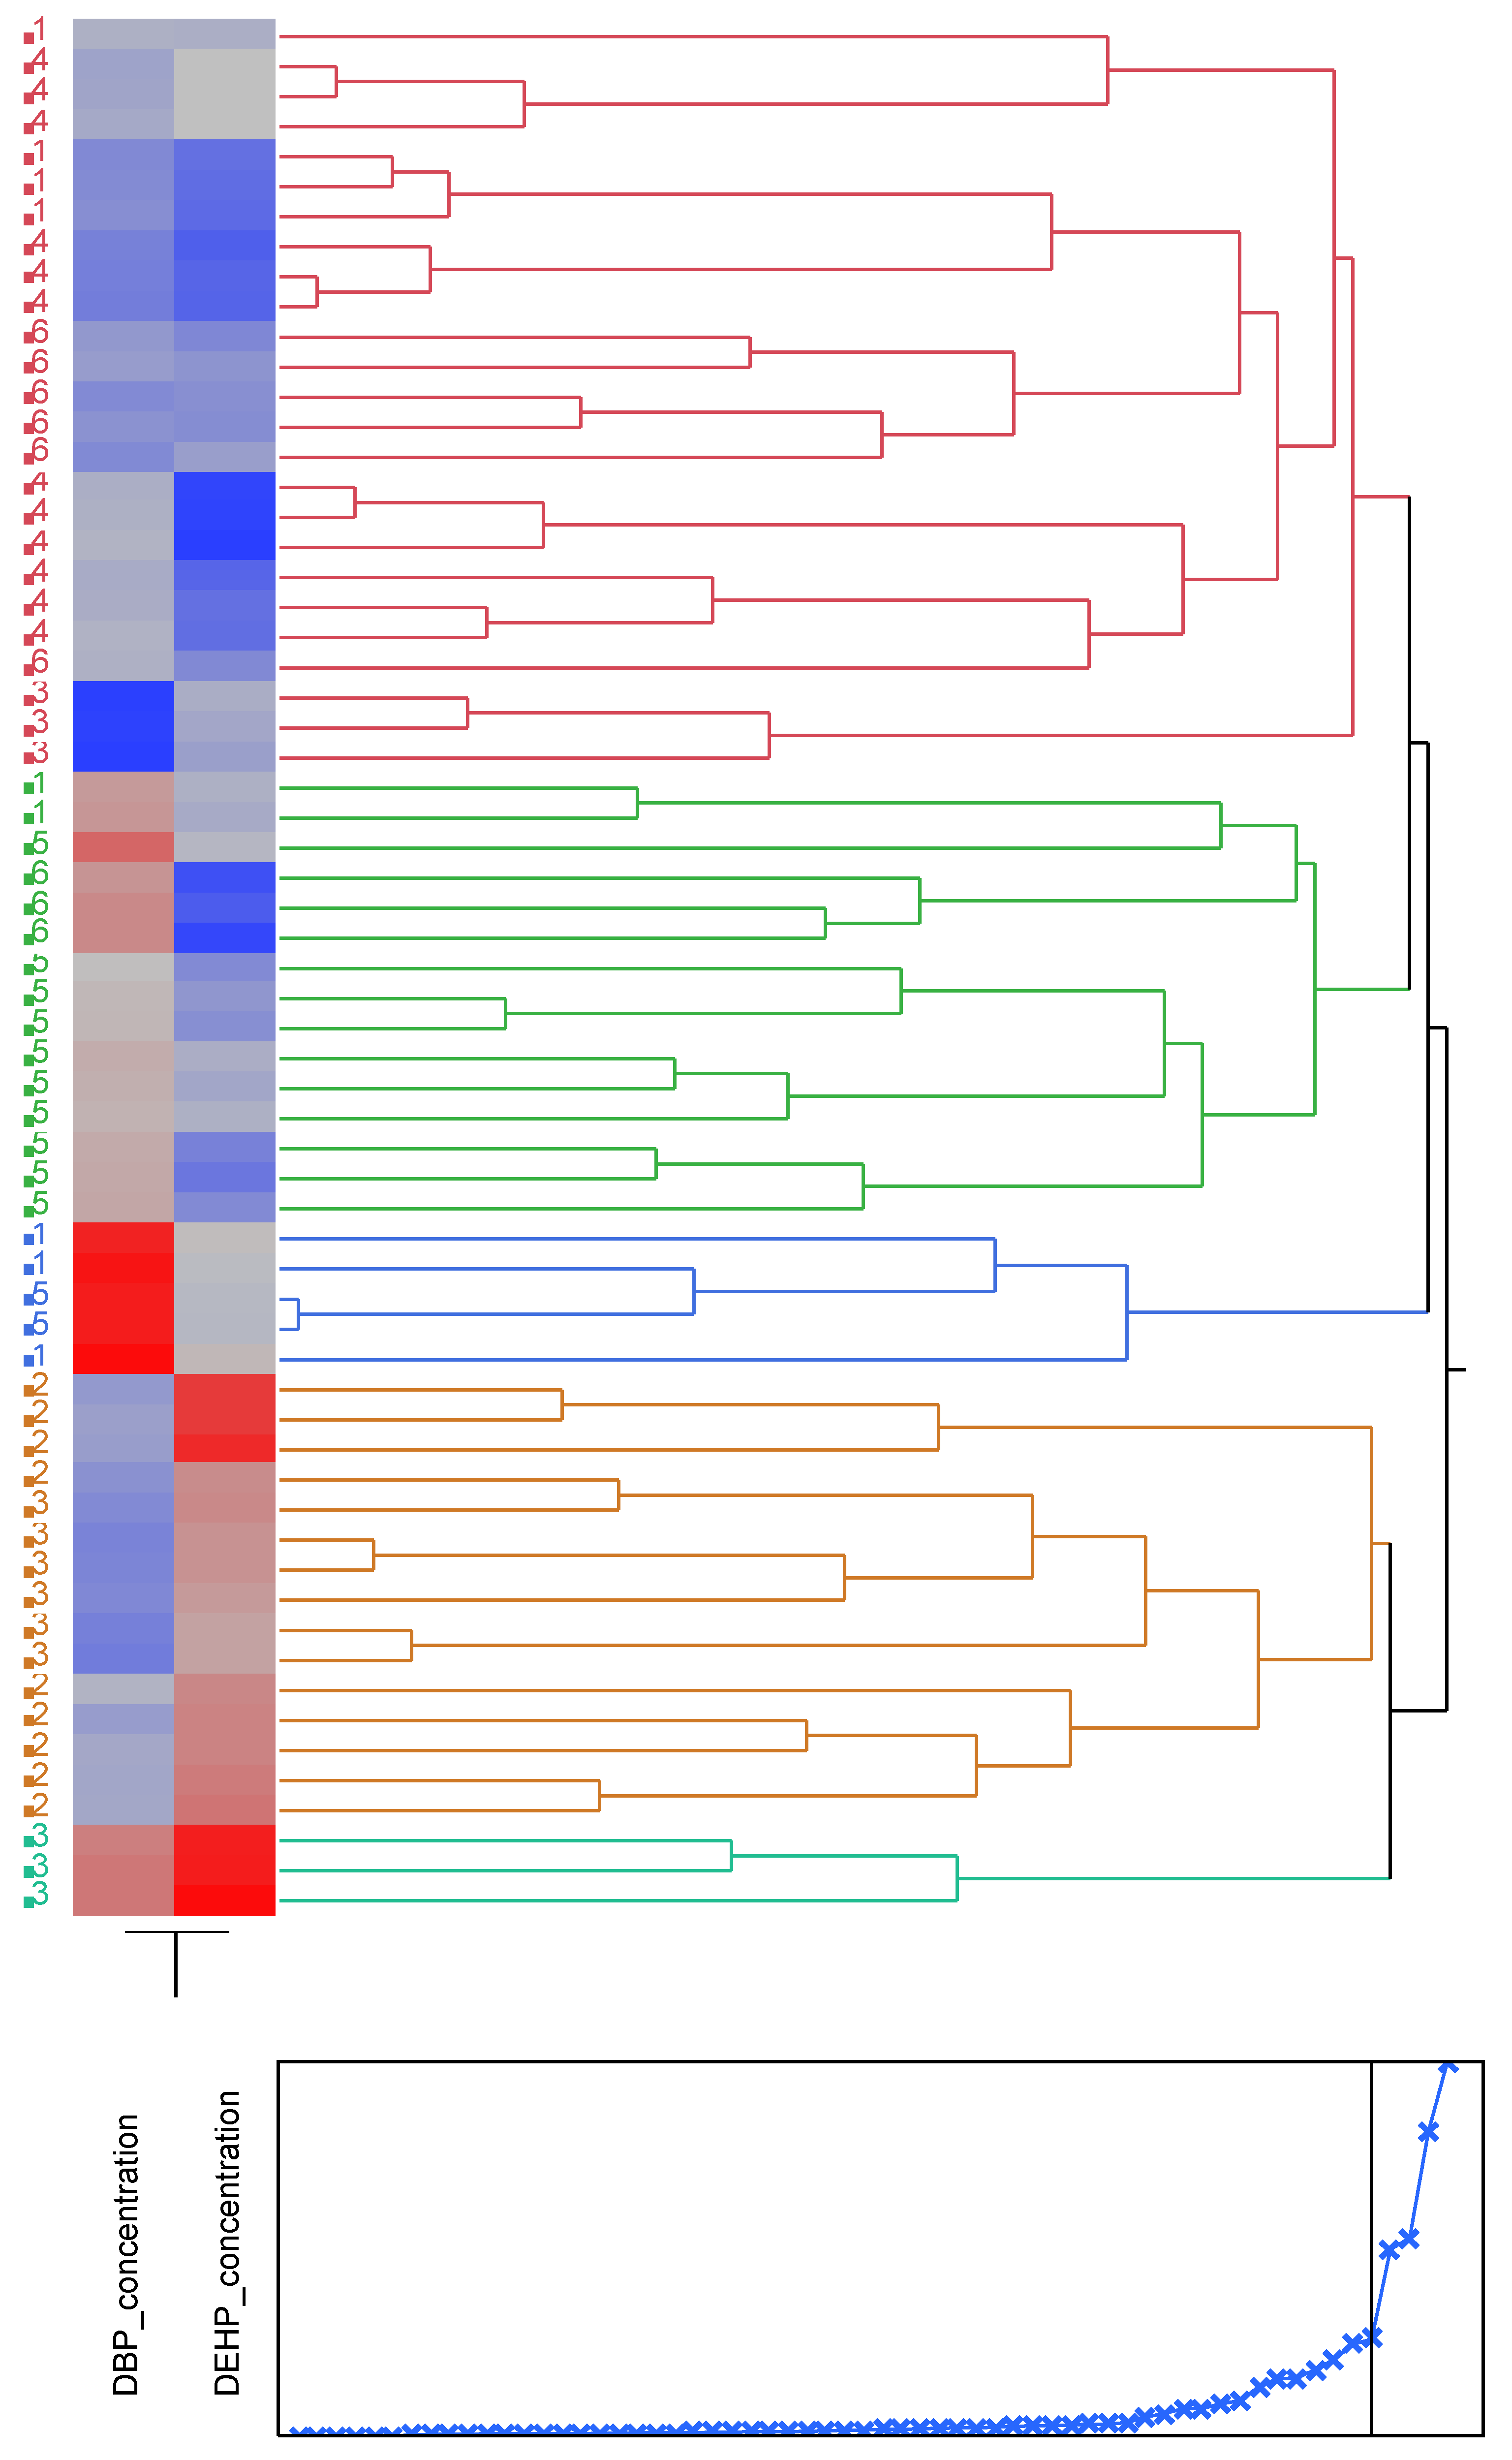
Figure 4.
Pie charts showing the percentage occurrence of the beaches in each cluster of the dendrogram and heat map at distance at the tideline (0 m from the sea) , 1-Imġiebaħ 2- Għar Aħmar, 3-Paradise Bay, 4- Ġnejna, 5-Riviera, 6- White Tower.
Figure 4.
Pie charts showing the percentage occurrence of the beaches in each cluster of the dendrogram and heat map at distance at the tideline (0 m from the sea) , 1-Imġiebaħ 2- Għar Aħmar, 3-Paradise Bay, 4- Ġnejna, 5-Riviera, 6- White Tower.
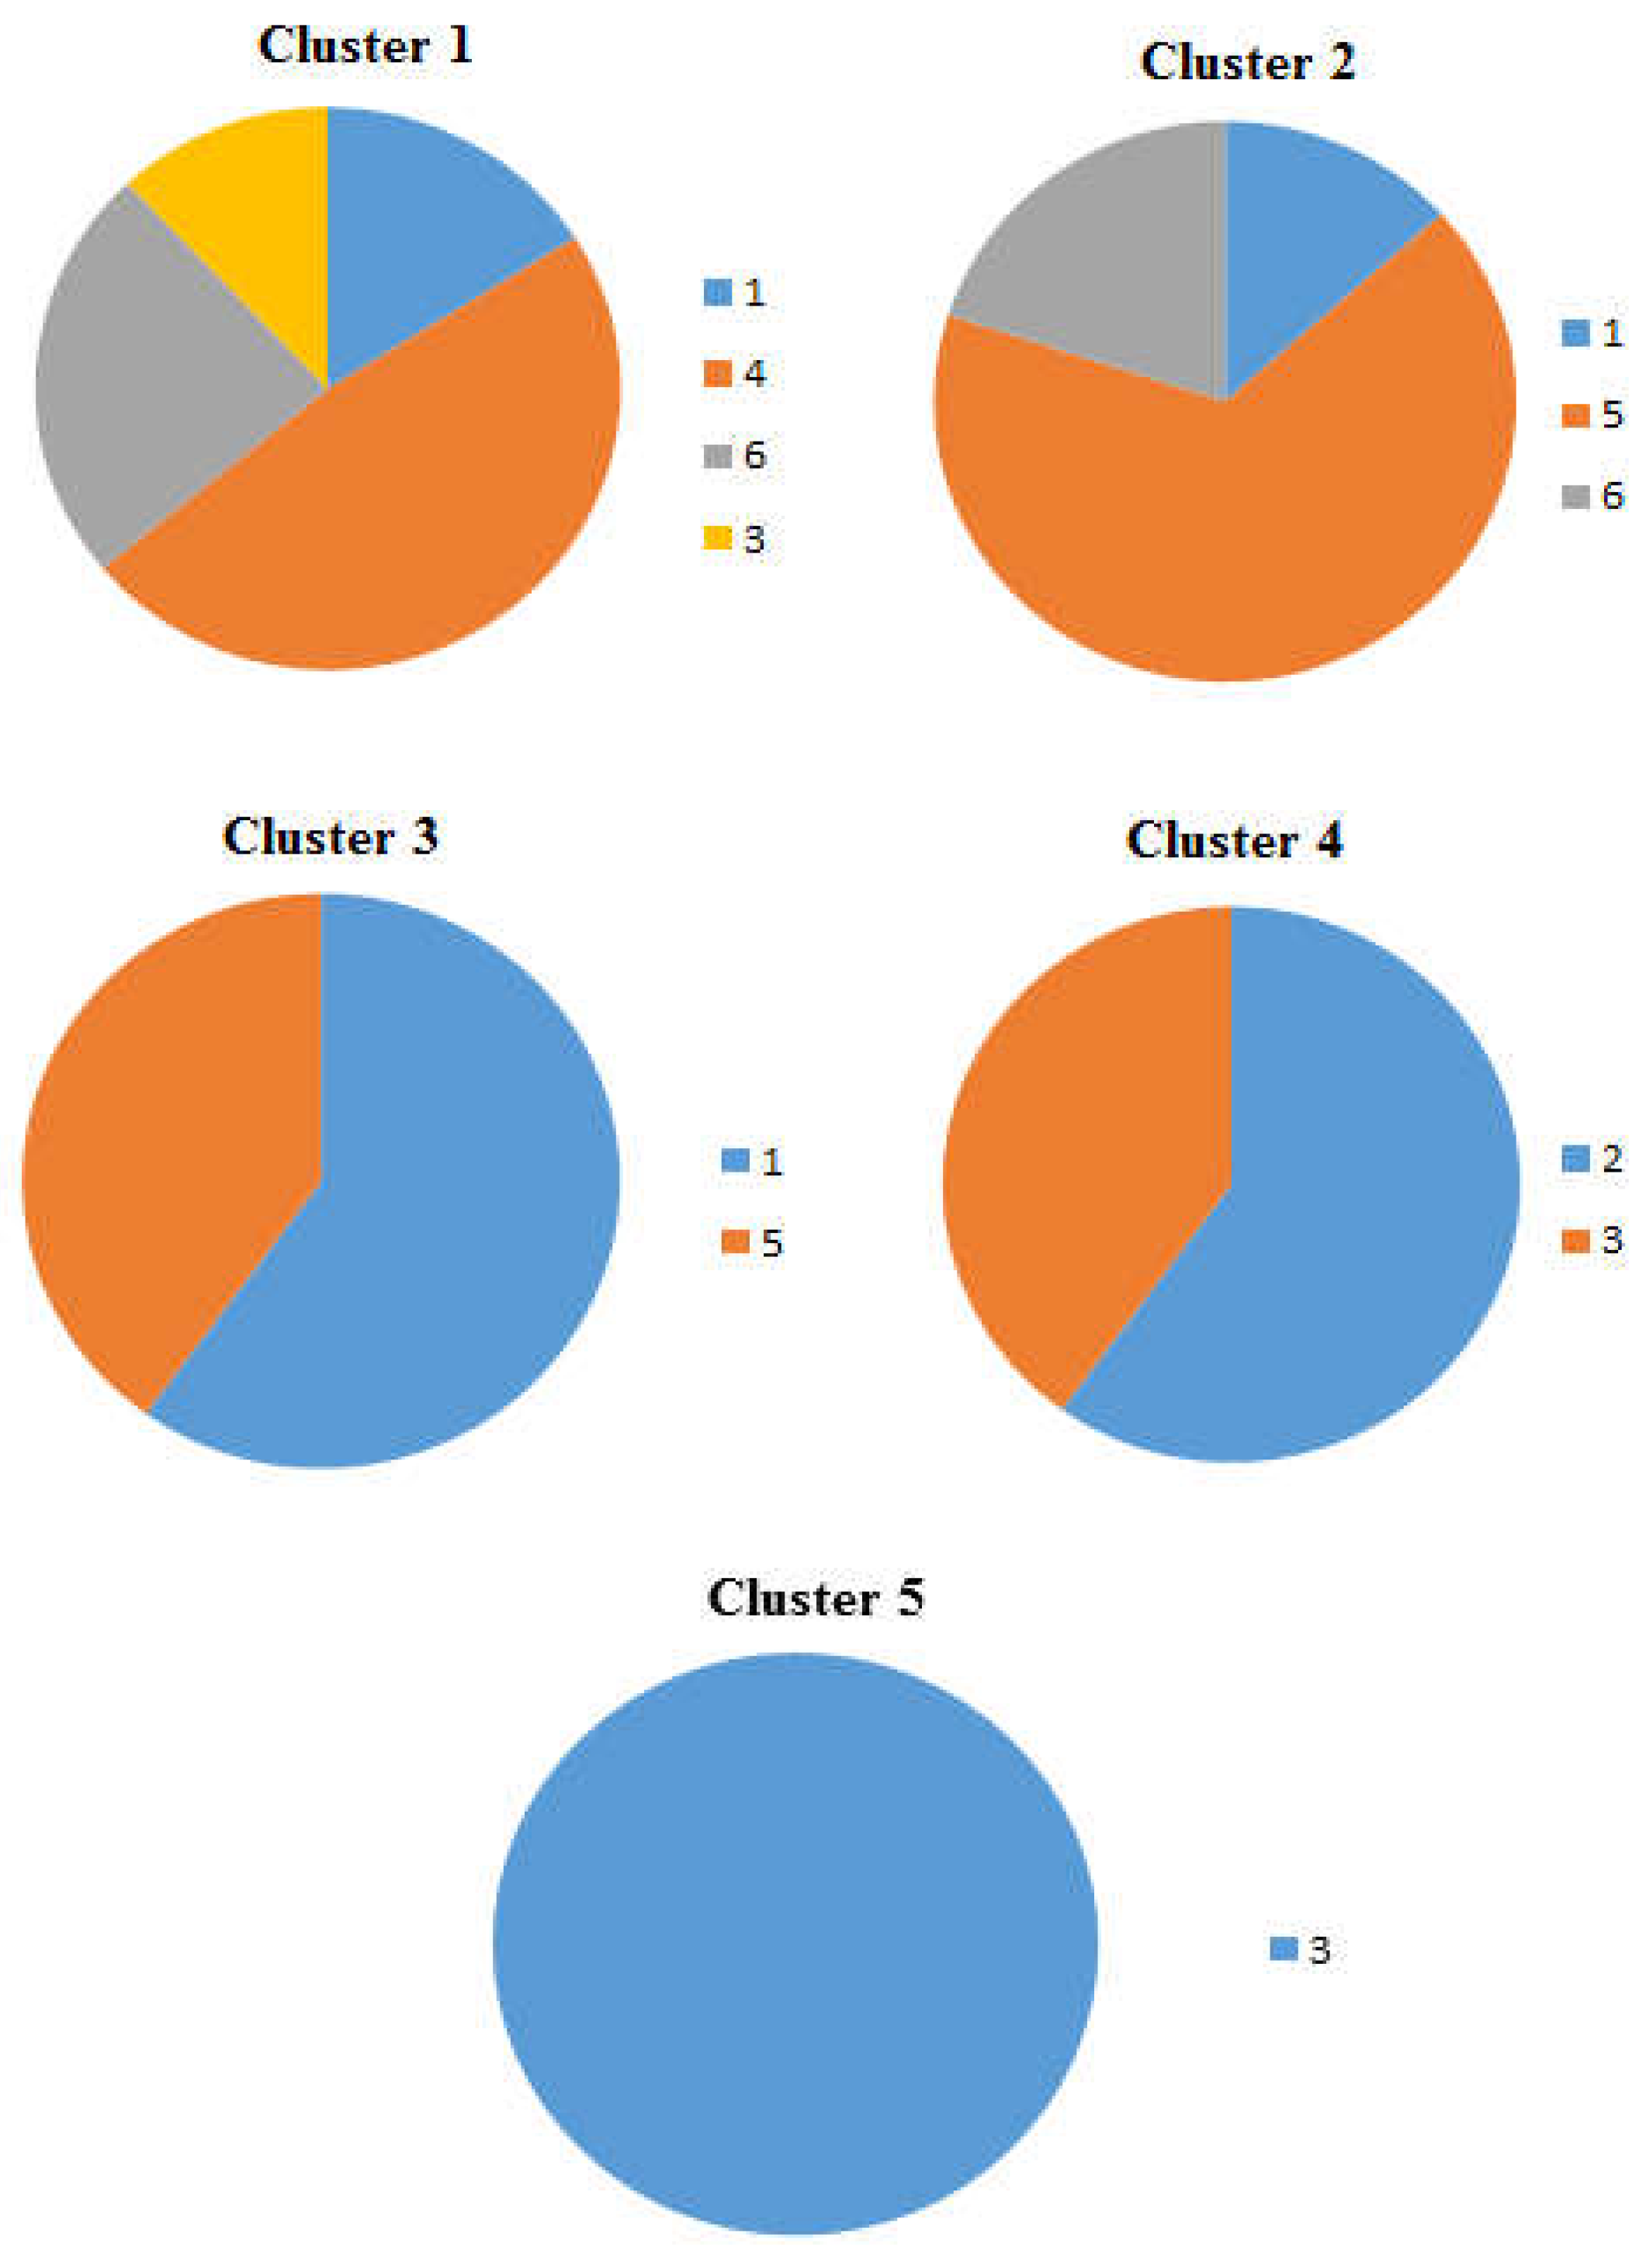
Figure 5.
Cluster analysis showing dendrogram and heat map (blue boxes representing low concentrations and red boxes representing high concentration) of the DBP and DEHP at a distance of 4 m from the tideline , 1-Imġiebaħ 2- Għar Aħmar, 3-Paradise Bay, 4- Ġnejna, 5-Riviera, 6-White Tower.
Figure 5.
Cluster analysis showing dendrogram and heat map (blue boxes representing low concentrations and red boxes representing high concentration) of the DBP and DEHP at a distance of 4 m from the tideline , 1-Imġiebaħ 2- Għar Aħmar, 3-Paradise Bay, 4- Ġnejna, 5-Riviera, 6-White Tower.
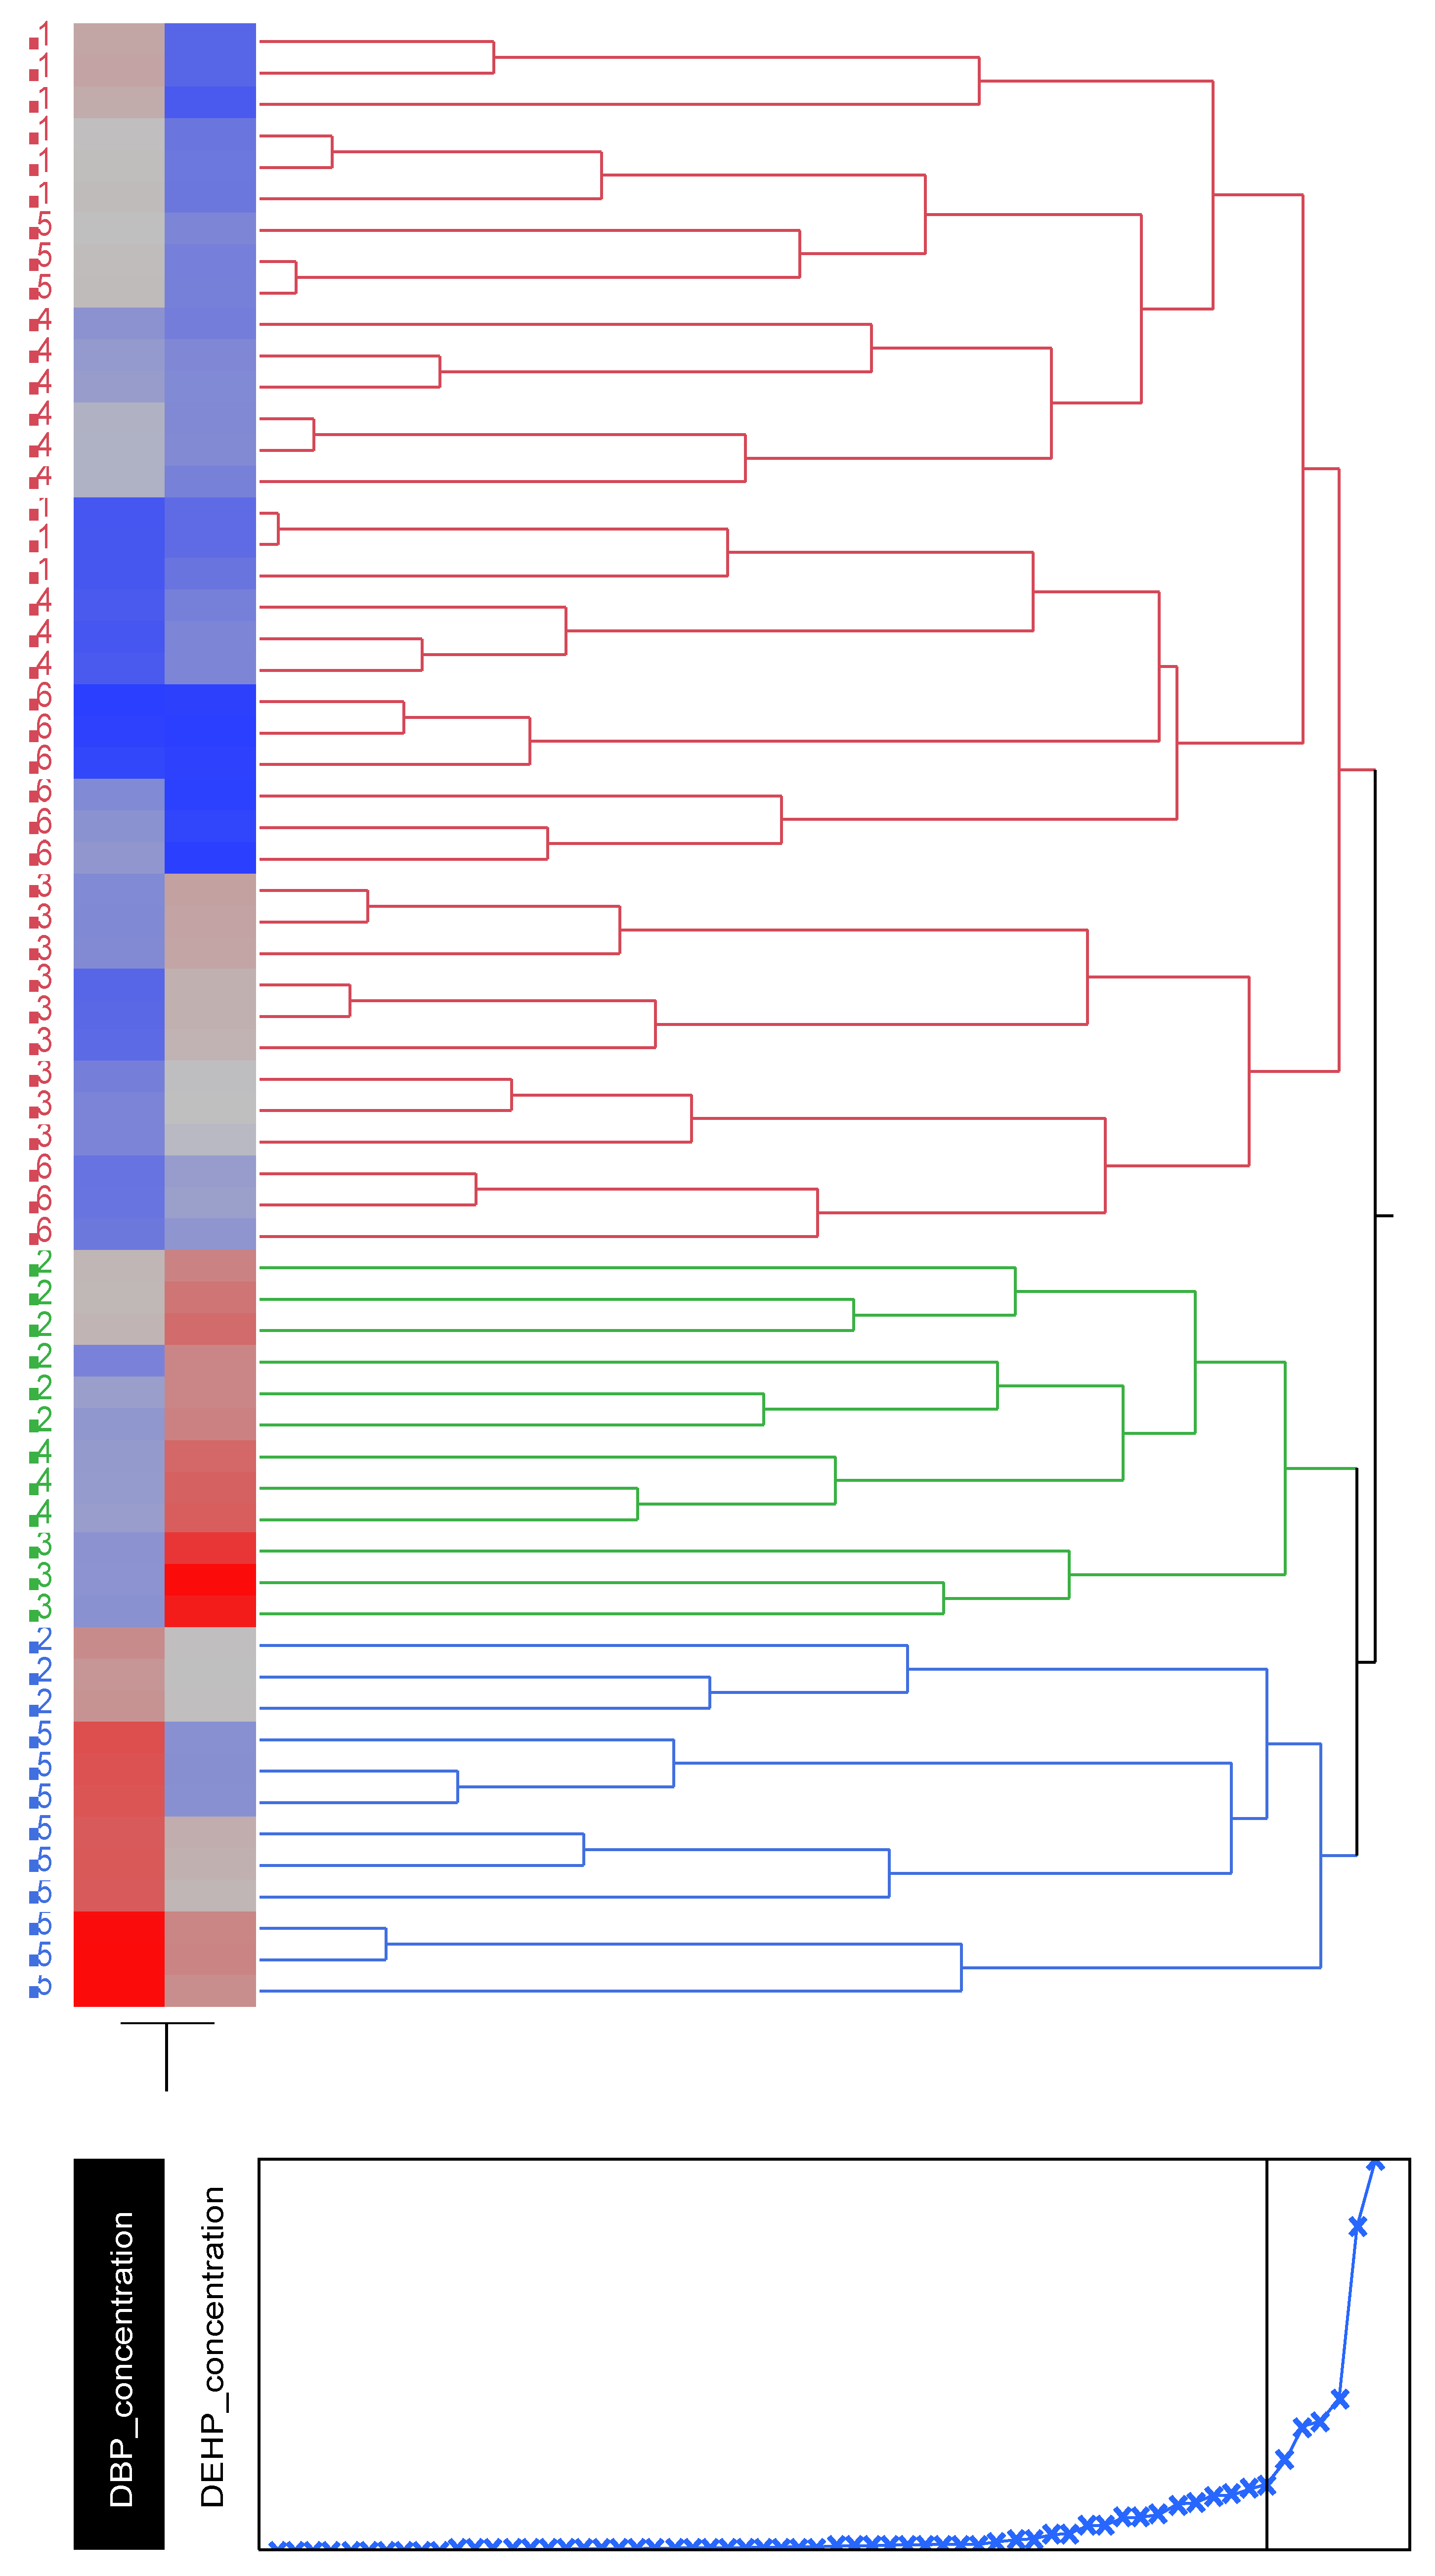
Figure 6.
Pie charts showing the percentage occurrence of the beaches in each cluster of the dendrogram and heat map at distance of 4 m from the tideline , 1-Imġiebaħ 2- Għar Aħmar, 3-Paradise Bay, 4- Ġnejna, 5-Riviera, 6- White Tower.
Figure 6.
Pie charts showing the percentage occurrence of the beaches in each cluster of the dendrogram and heat map at distance of 4 m from the tideline , 1-Imġiebaħ 2- Għar Aħmar, 3-Paradise Bay, 4- Ġnejna, 5-Riviera, 6- White Tower.
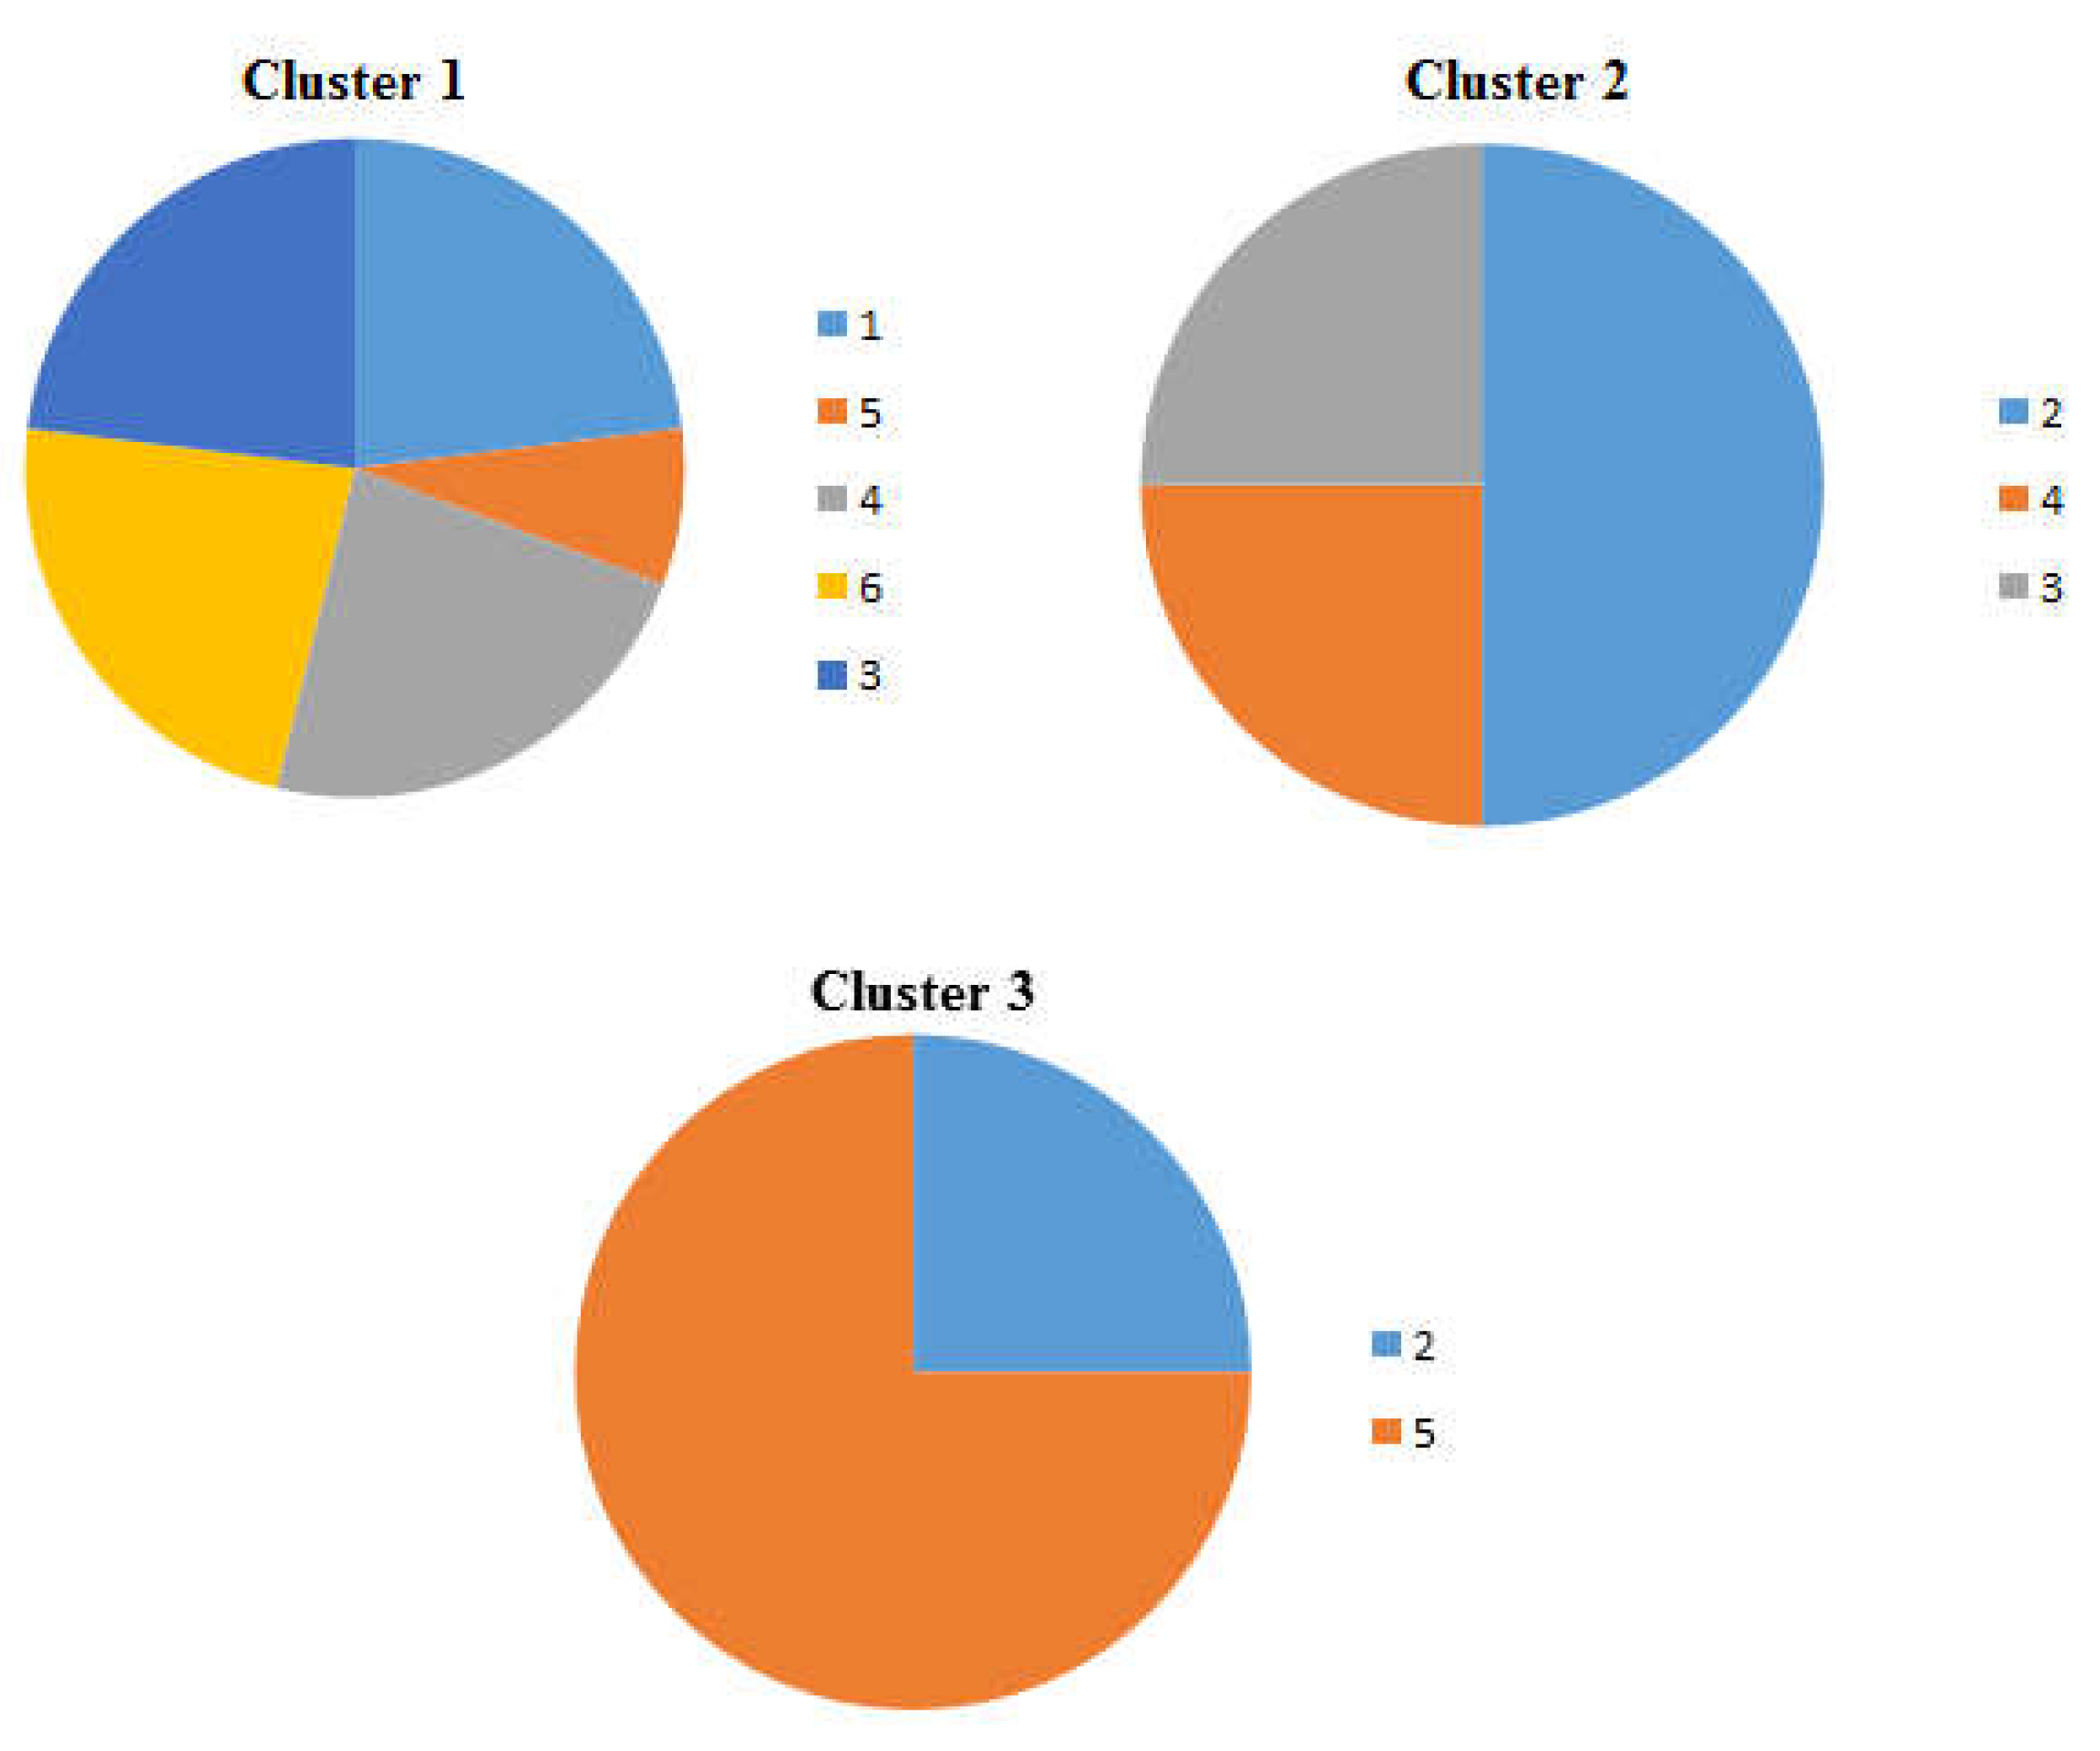
Figure 7.
Cluster analysis showing dendrogram and heat map (blue boxes representing low concentrations and red boxes representing high concentration) of the DBP and DEHP at a distance of 8 m from the tideline , 1-Imġiebaħ 2- Għar Aħmar, 3-Paradise Bay, 4- Ġnejna, 5-Riviera, 6-White Tower.
Figure 7.
Cluster analysis showing dendrogram and heat map (blue boxes representing low concentrations and red boxes representing high concentration) of the DBP and DEHP at a distance of 8 m from the tideline , 1-Imġiebaħ 2- Għar Aħmar, 3-Paradise Bay, 4- Ġnejna, 5-Riviera, 6-White Tower.

Figure 8.
Pie charts showing the percentage occurrence of the beaches in each cluster of the dendrogram and heat map at distance of 8 m from the tideline , 1-Imġiebaħ 2- Għar Aħmar, 3-Paradise Bay, 4- Ġnejna, 5-Riviera, 6- White Tower.
Figure 8.
Pie charts showing the percentage occurrence of the beaches in each cluster of the dendrogram and heat map at distance of 8 m from the tideline , 1-Imġiebaħ 2- Għar Aħmar, 3-Paradise Bay, 4- Ġnejna, 5-Riviera, 6- White Tower.
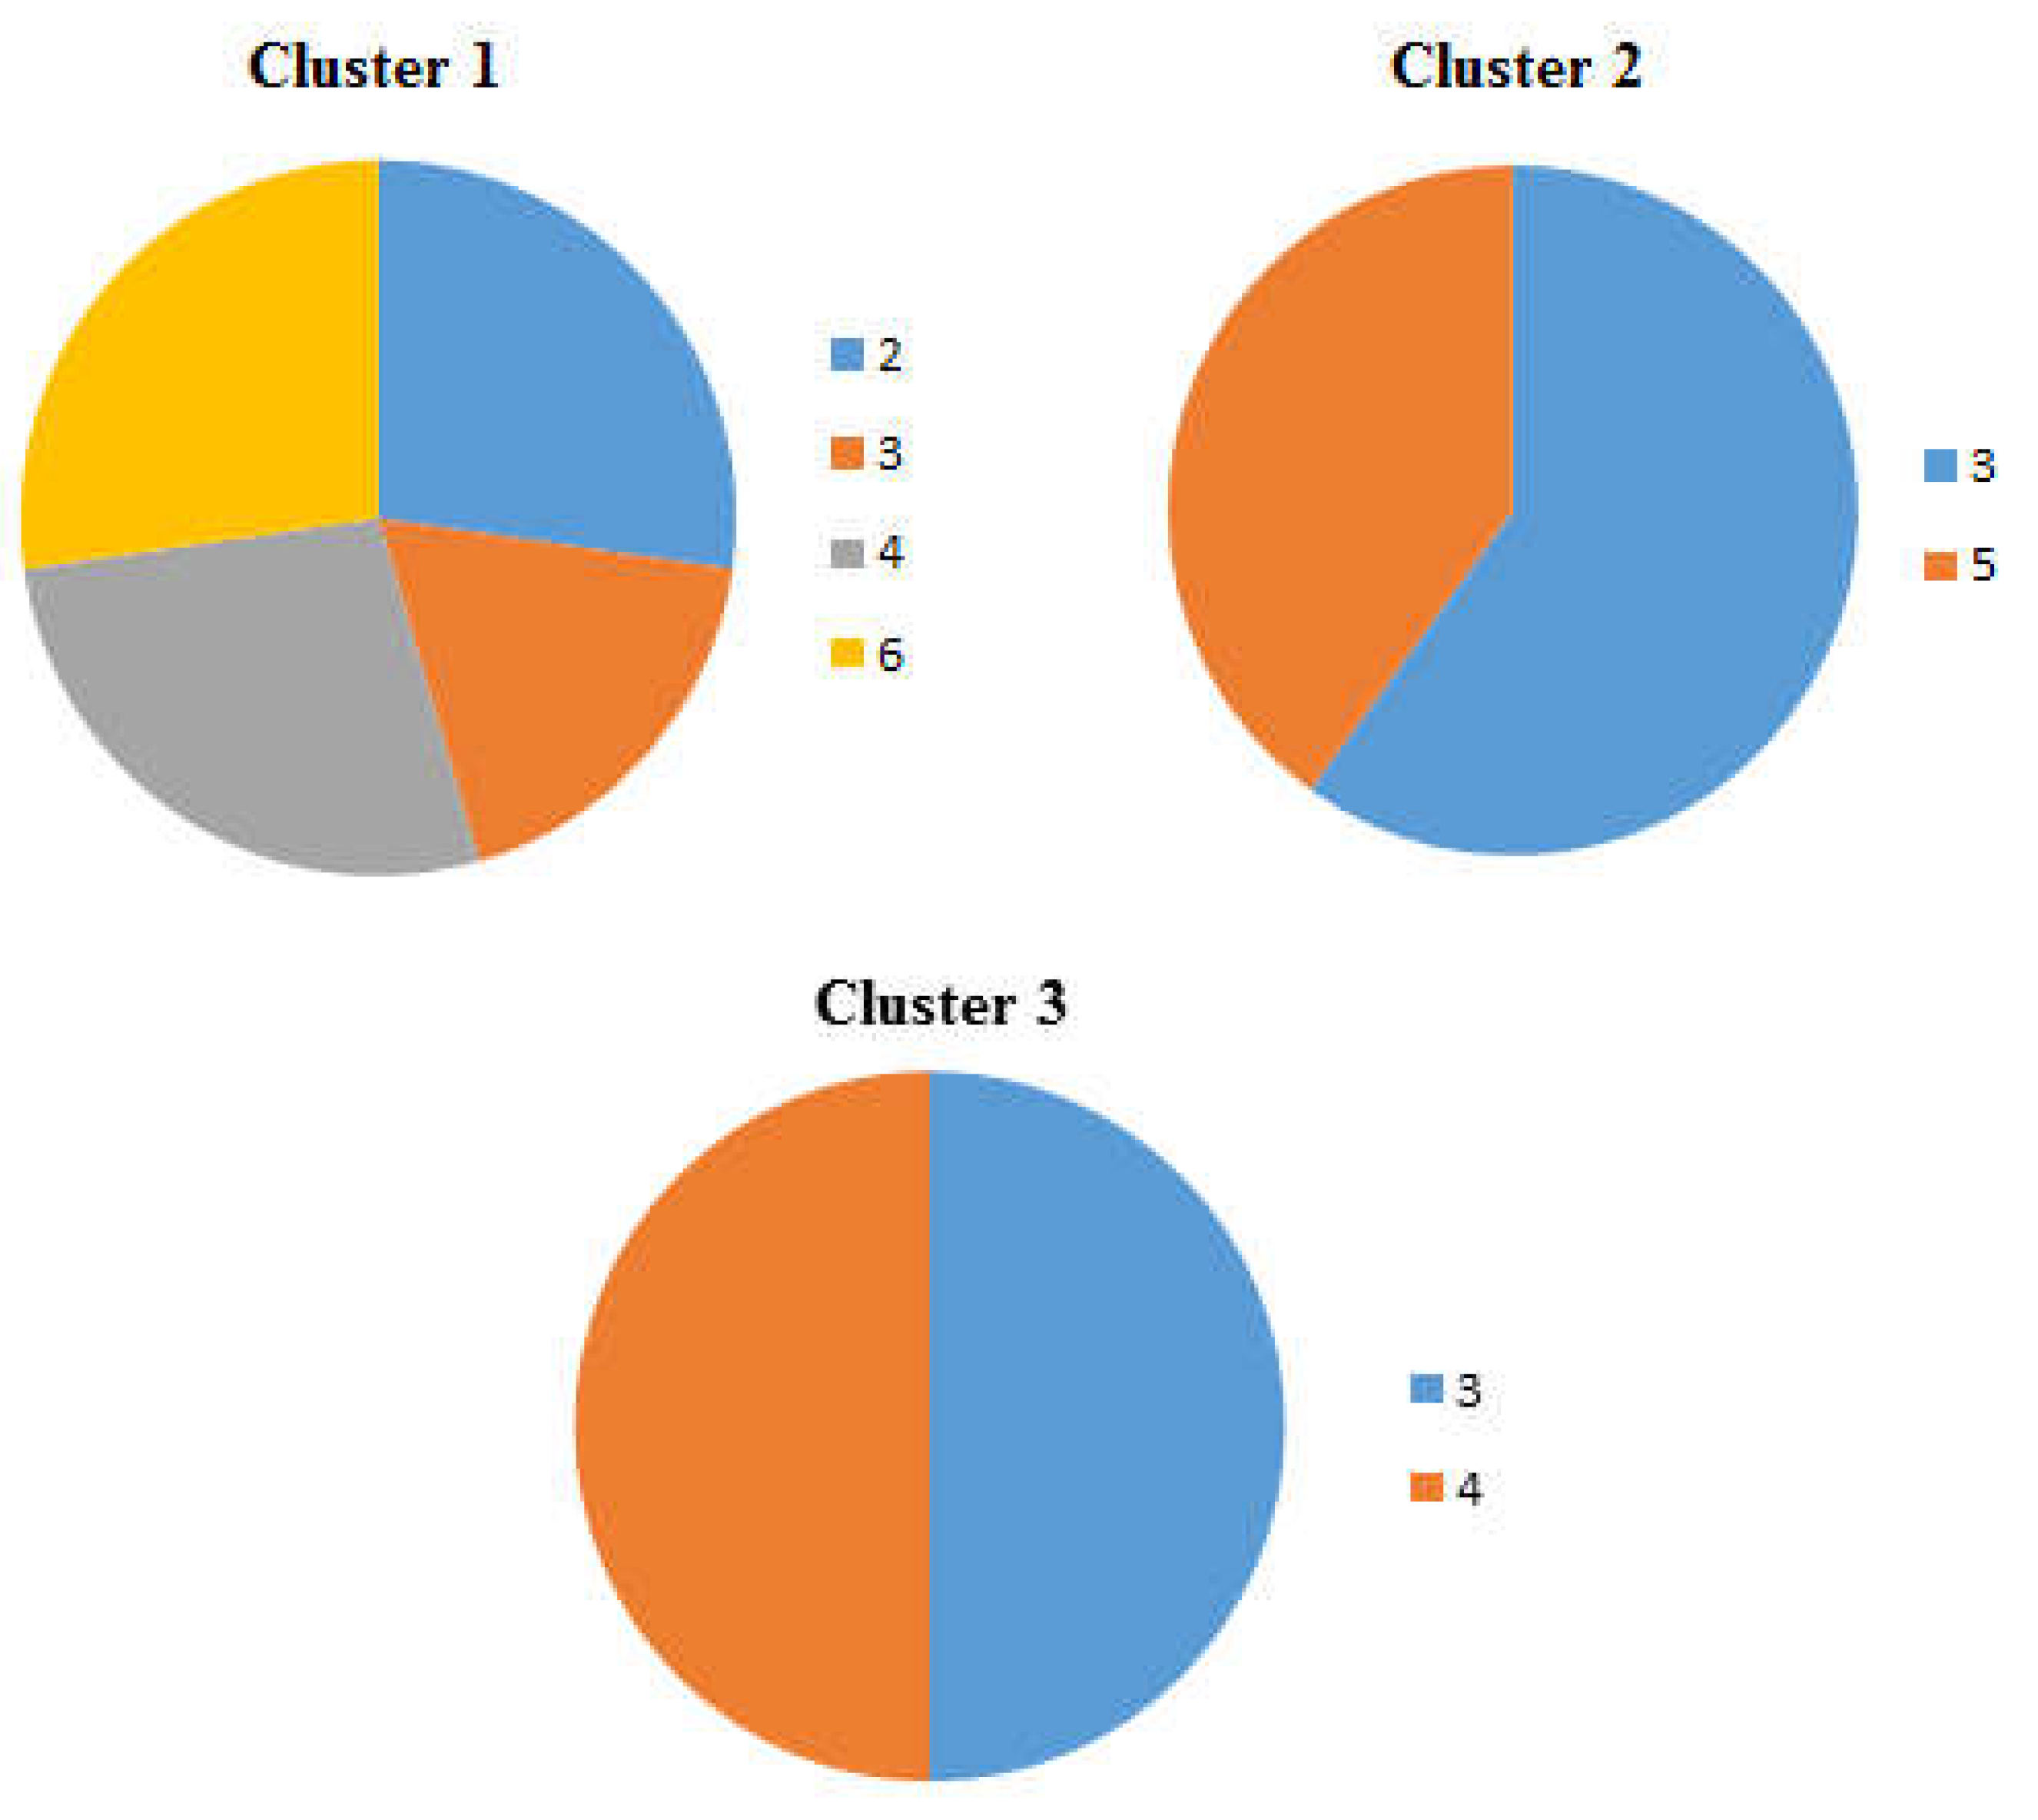
Figure 9.
Cluster analysis showing dendrogram and heat map (blue boxes representing low concentrations and red boxes representing high concentration) of the DBP and DEHP at a distance of 12 m from the tideline , 1-Imġiebaħ 2- Għar Aħmar, 3-Paradise Bay, 4- Ġnejna, 5-Riviera, 6-White Tower.
Figure 9.
Cluster analysis showing dendrogram and heat map (blue boxes representing low concentrations and red boxes representing high concentration) of the DBP and DEHP at a distance of 12 m from the tideline , 1-Imġiebaħ 2- Għar Aħmar, 3-Paradise Bay, 4- Ġnejna, 5-Riviera, 6-White Tower.
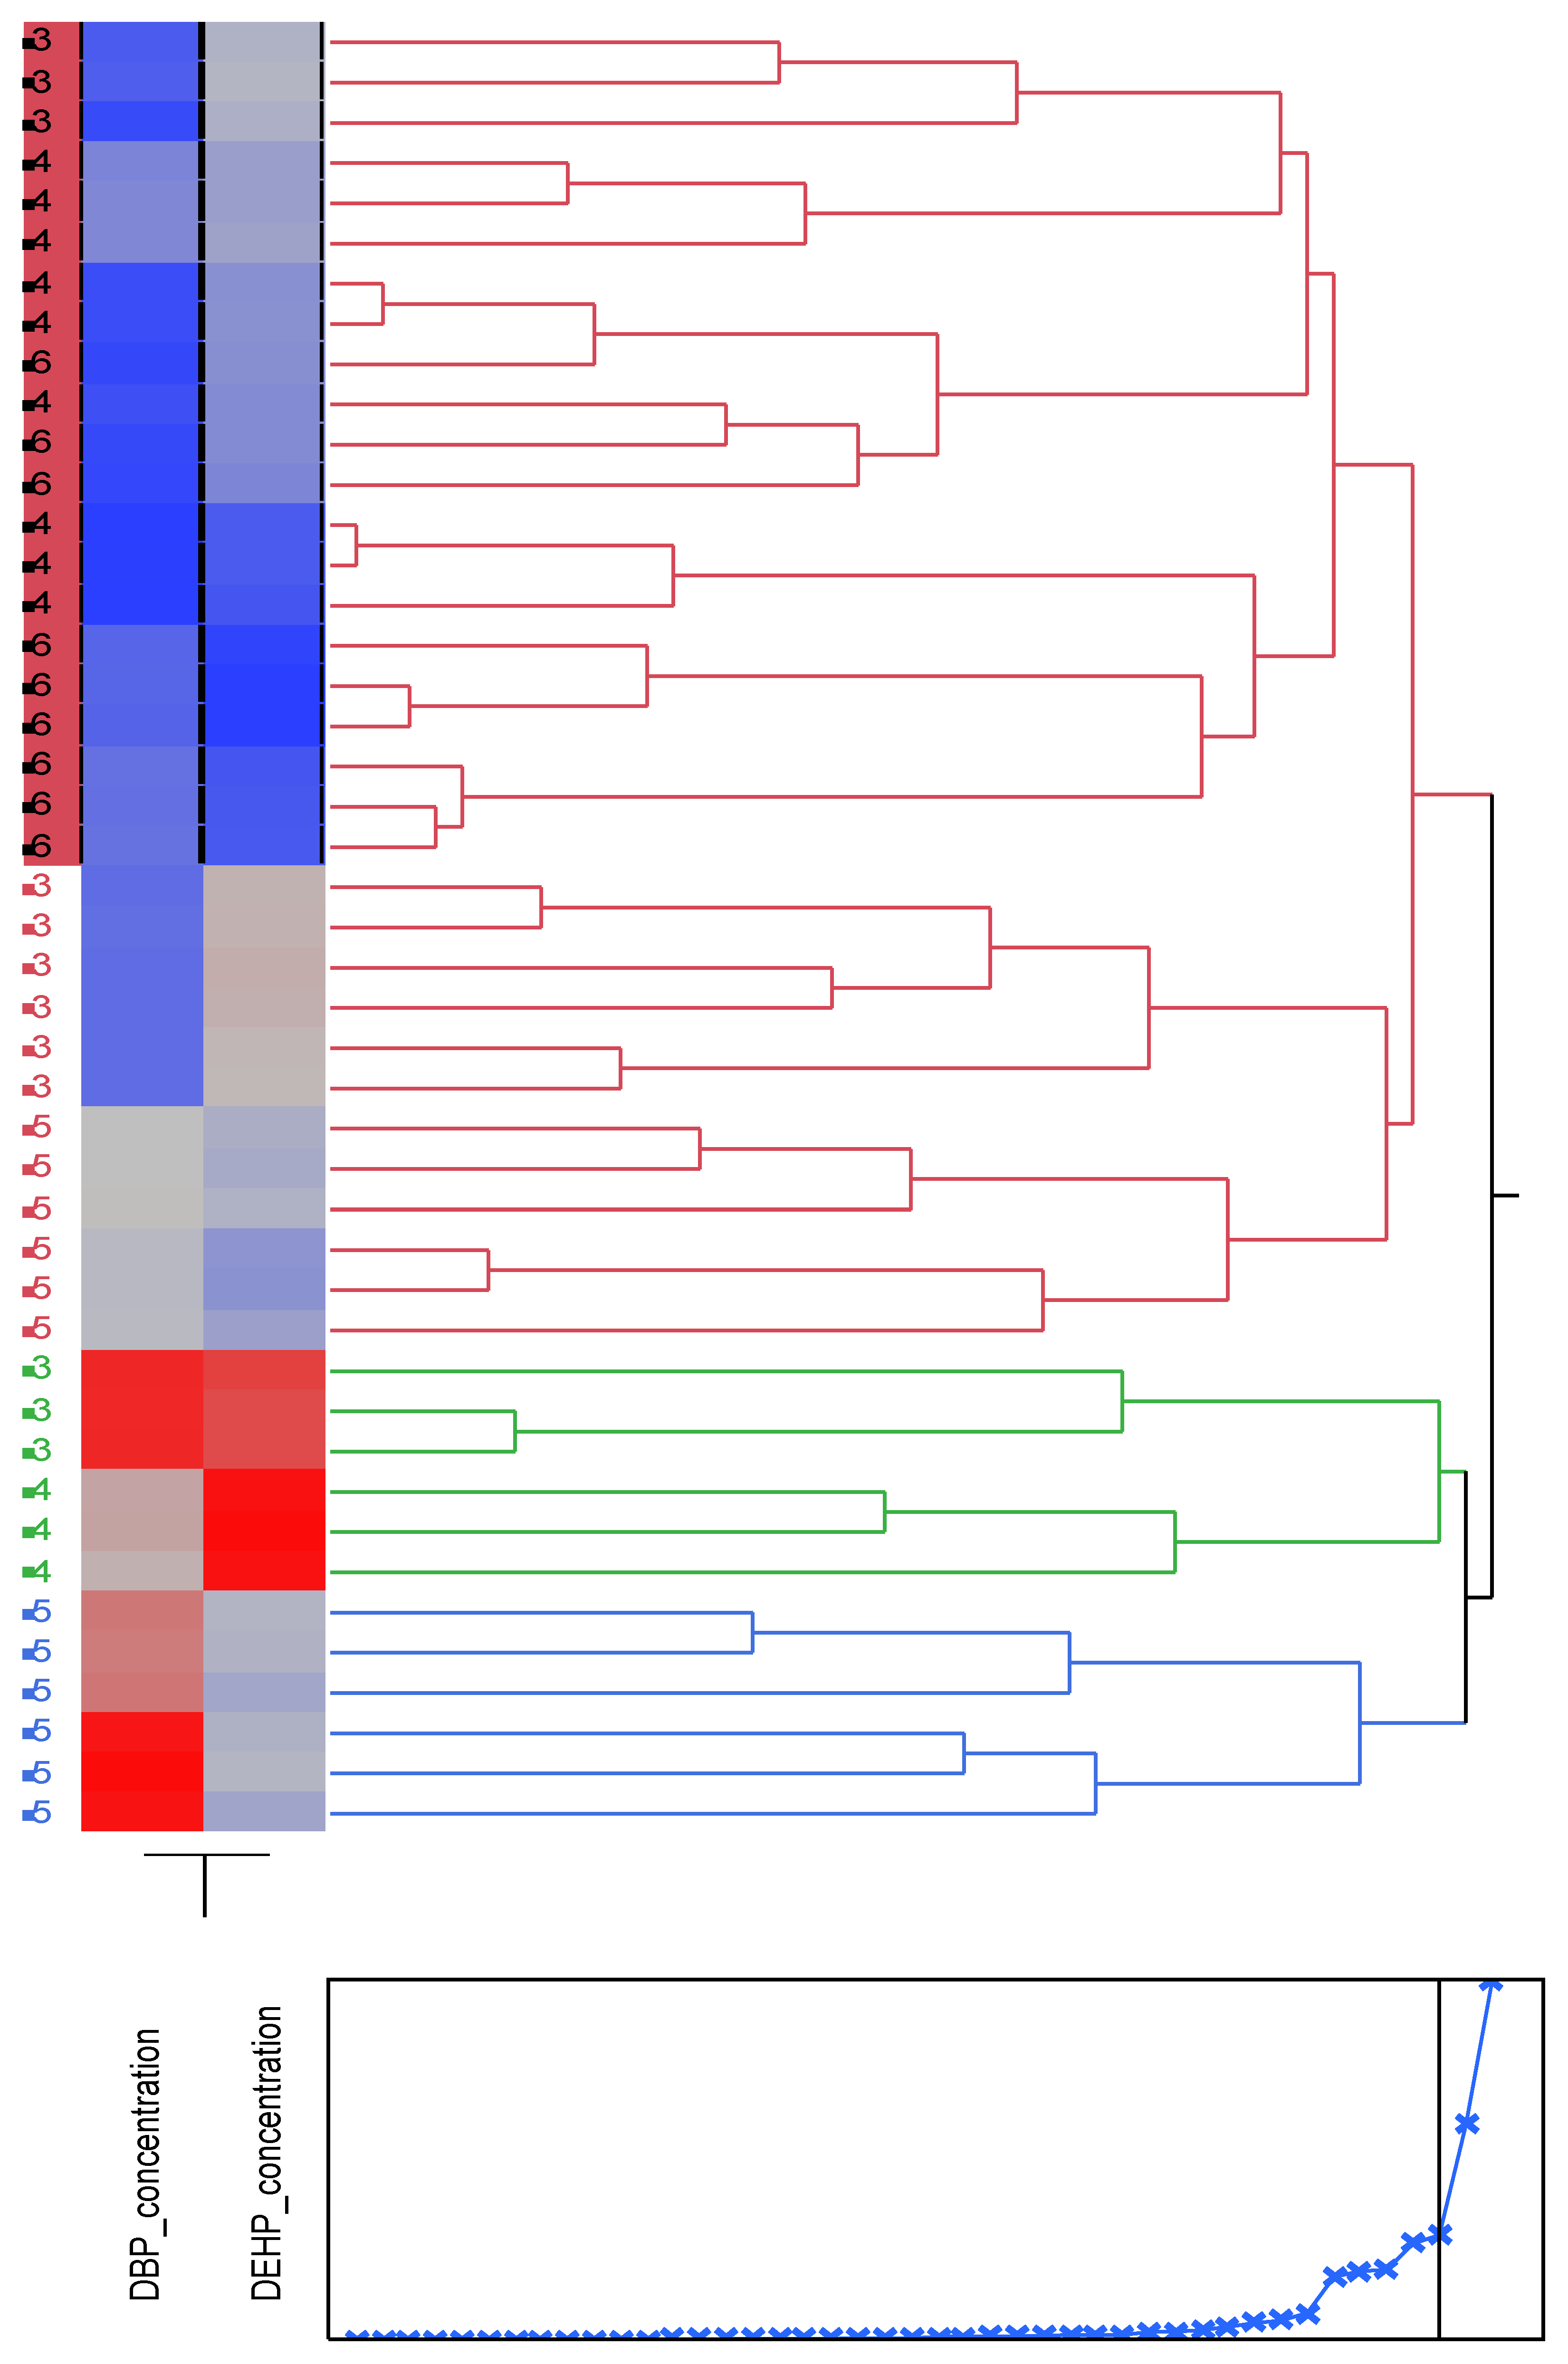
Figure 10.
Pie charts showing the percentage occurrence of the beaches in each cluster of the dendrogram and heat map at distance of 12 m from the tideline , 1-Imġiebaħ 2- Għar Aħmar, 3-Paradise Bay, 4- Ġnejna, 5-Riviera, 6- White Tower.
Figure 10.
Pie charts showing the percentage occurrence of the beaches in each cluster of the dendrogram and heat map at distance of 12 m from the tideline , 1-Imġiebaħ 2- Għar Aħmar, 3-Paradise Bay, 4- Ġnejna, 5-Riviera, 6- White Tower.
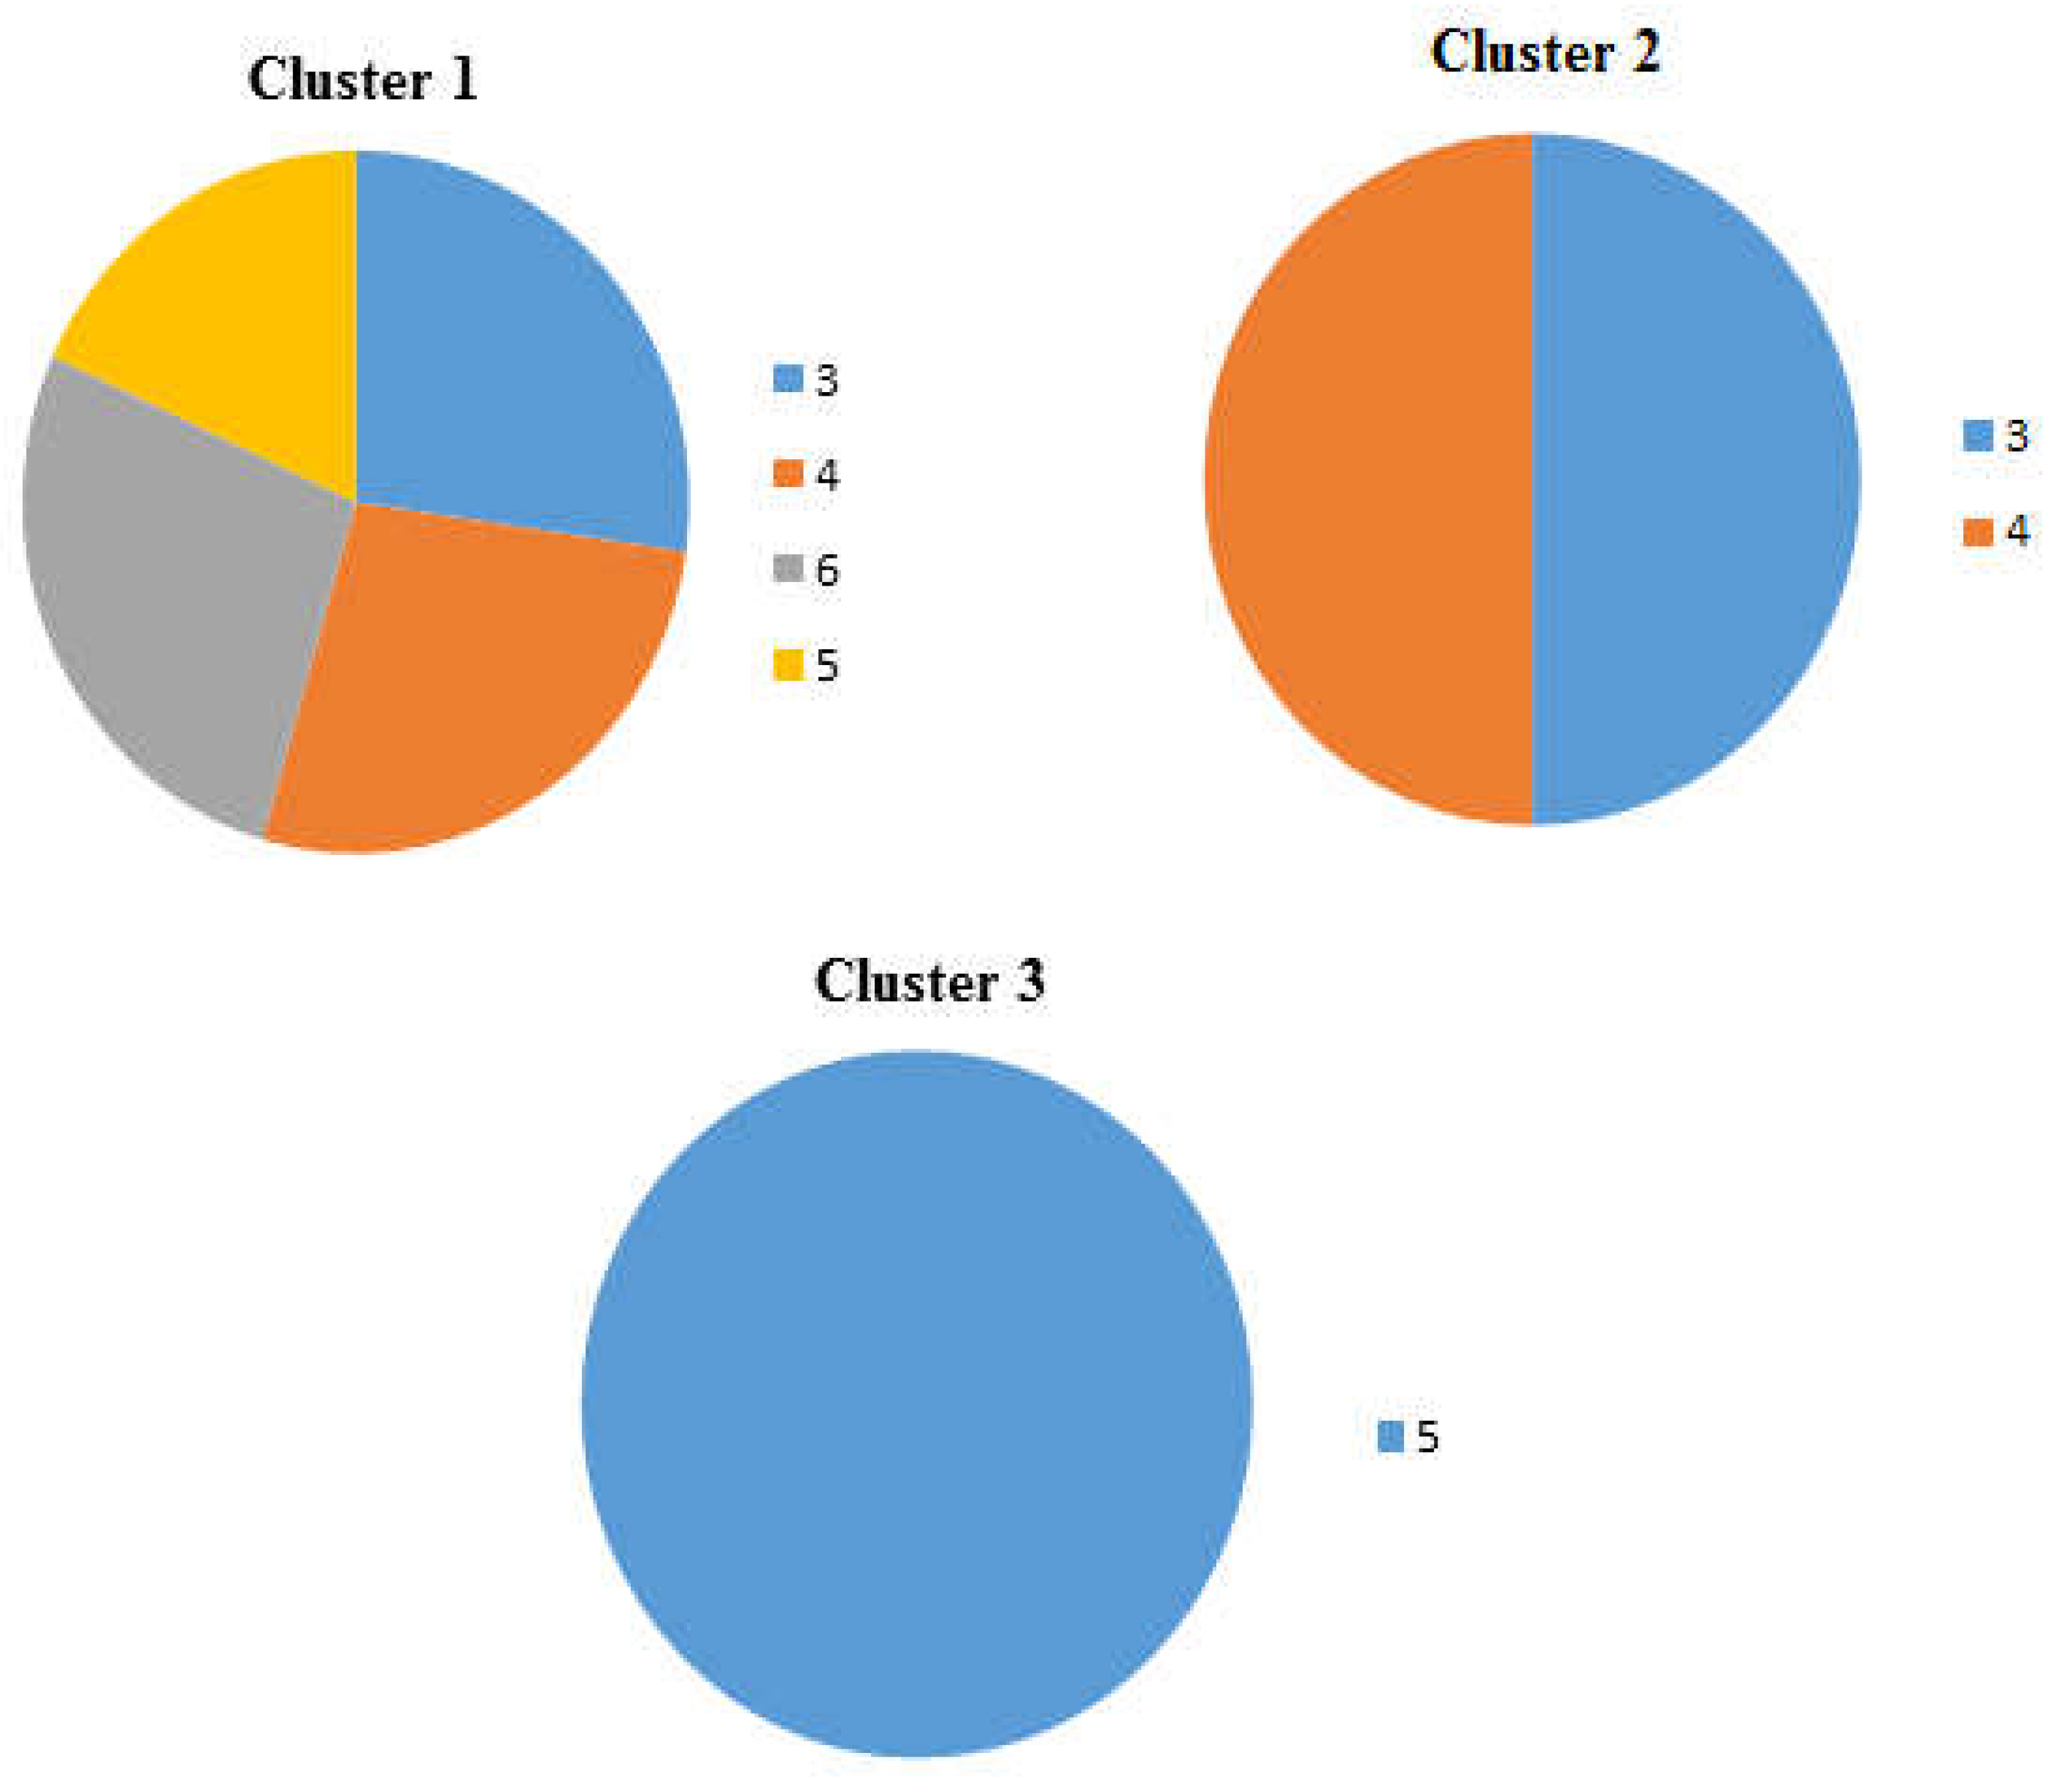

Table 1.
A list of the sandy beaches and their corresponding coordinates and number of samples.
| Category | Location Name | Location Coordinates | No. of Samples |
|---|---|---|---|
| Secluded Beaches | Imġiebaħ | 35◦58’03.91”N | 6 |
| 14◦22’55.07”E | |||
| White Tower | 35◦59’32.91”N | 12 | |
| 14◦21’55.63”E | |||
| Għar Aħmar | 35◦50’00.95”N | 9 | |
| 14◦32’42.01”E | |||
| Busy Beaches | Ġnejna | 35◦55’13.38”N | 16 |
| 14◦20’36.27”E | |||
| Paradise Bay | 35◦58’55.07”N | 16 | |
| 14◦19’56.69”E | |||
| Riviera | 35◦55’45.57”N | 16 | |
| 14◦20’41.94”E |
Table 2.
A summary of the bays which showed a statistical significance (p<0.05) upon pairwise comparisons of Kruskal-Wallis test when comparing PAEs concentrations in different beaches.
Table 2.
A summary of the bays which showed a statistical significance (p<0.05) upon pairwise comparisons of Kruskal-Wallis test when comparing PAEs concentrations in different beaches.
| Pairwise Comparison | p values of pairwise comparisons of Kruskal-Wallis Test | |
|---|---|---|
| Bay 1-Bay 2 | DBP Concentrations | DEHP Concentrations |
| Paradise Bay-Riviera Bay | 0.000 | 0.006 |
| Ġnejna Bay –Riviera Bay | 0.000 | - |
| White Tower bay –Riviera Bay | 0.000 | 0.000 |
| Għar Aħmar – Riviera Bay | 0.002 | 0.011 |
| White tower Bay-Għar Aħmar | 0.006 | - |
| Imġiebaħ- Riviera Bay | 0.012 | 0.007 |
| White tower Bay- Imġiebaħ | 0.035 | - |
| Imġiebaħ-Għar Aħmar | - | 0.000 |
| Imġiebaħ-Paradise bay | - | 0.000 |
| Ġnejna Bay- Għar Aħmar | - | 0.000 |
| Ġnejna Bay- Paradise Bay | - | 0.000 |
| White Tower Bay- Għar Aħmar | - | 0.000 |
| White Tower Bay –Paradise Bay | - | 0.000 |
| White Tower Bay-Ġnejna Bay | - | 0.001 |
Table 3.
The meak ranks of the concentrations of PAEs in secluded beaches and busy beaches.
| Mean Ranks | ||
|---|---|---|
| Secluded Beaches | Busy Beaches | |
| DBP Concentrations | 96.42 | 122.33 |
| DEHP Concentrations | 87.26 | 127.48 |
Table 4.
A summary of the distances along the shoreline at which the PAEs concentrations showed a statistical significance (p<0.05) upon pairwise comparisons of Kruskal-Wallis test.
Table 4.
A summary of the distances along the shoreline at which the PAEs concentrations showed a statistical significance (p<0.05) upon pairwise comparisons of Kruskal-Wallis test.
| Pairwise Comparisons | p values of pairwise comparisons of Kruskal-Wallis Test | |
|---|---|---|
| Distance along the shoreline (m) | DBP Concentrations | DEHP Concentrations |
| 0.00-60.00 | 0.037 | 0.001 |
| 20.00-60.00 | - | 0.004 |
| 40.00-60.00 | - | 0.000 |
Table 5.
A summary of the distances away from the shoreline at which the DEHP concentrations showed a statistical significance (p<0.05) upon pairwise comparisons of Kruskal-Wallis test.
Table 5.
A summary of the distances away from the shoreline at which the DEHP concentrations showed a statistical significance (p<0.05) upon pairwise comparisons of Kruskal-Wallis test.
| Pairwise Comparison | p values of pairwise comparisons of Kruskal-Wallis Test |
|---|---|
| Distance (m) | DEHP Concentrations |
| 0.00-8.00 | 0.000 |
| 0.00-12.00 | 0.000 |
| 4.00-12.00 | 0.048 |
Disclaimer/Publisher’s Note: The statements, opinions and data contained in all publications are solely those of the individual author(s) and contributor(s) and not of MDPI and/or the editor(s). MDPI and/or the editor(s) disclaim responsibility for any injury to people or property resulting from any ideas, methods, instructions or products referred to in the content. |
© 2023 by the authors. Licensee MDPI, Basel, Switzerland. This article is an open access article distributed under the terms and conditions of the Creative Commons Attribution (CC BY) license (http://creativecommons.org/licenses/by/4.0/).
Copyright: This open access article is published under a Creative Commons CC BY 4.0 license, which permit the free download, distribution, and reuse, provided that the author and preprint are cited in any reuse.


