
Submitted:
12 May 2023
Posted:
12 May 2023
You are already at the latest version
Abstract
In eutrophic waters, such as Mikawa Bay, Japan, anoxic bottom water develops in summer. This causes sulfide release into seawater by sulfate reduction in the sediment, leading to environmental problems. The addition of iron to sediments is a method used to improve the sediment environment, which was devised from a natural phenomenon. However, this method has not yet been quantitatively evaluated. In this study, we aim to quantitatively evaluate the suppressive effect of iron on sulfide release. First, we develop a sediment model that focuses on S and Fe. We then attempted to reproduce the observations and experiments on sulfide dynamics using the model. Consequently, the proposed model was able to reproduce field sulfur and Fe dynamics in sediments. Additionally, the model described the characteristics of sulfide release considering the effects of additive iron materials. Finally, we conducted predictive calculations and quantitatively evaluated the effects of adding iron materials to the sediments in terms of sulfur and iron cycles.
Keywords:
sediment model
; sulfur and iron cycles
; semi-enclosed bay
1. Introduction
The release of sulfides (sum of H2S-S, HS−-S, and S2−-S, hereafter referred to as H2S), which occurs in summer in the anoxic bottom waters of semi-enclosed bays near large cities, severely damages fishery production, habitat, and the marine environment [1,2]. In such bays, eutrophication is caused by an increase in the organic matter (OM) load from rivers and a decrease in tidal flats and shallow areas due to land reclamation [3]. Large amounts of particulate OM (POM) result from the eutrophication of seafloor deposits. The deposited POM is decomposed by microbial decomposition, during which dissolved oxygen (DO) is consumed. If the consumption of DO exceeds its supply, anoxic water masses are generated in the bottom water. When DO is depleted, POM is decomposed by anaerobic processes and the electron acceptors are consumed in the following order: nitrate (NO3−), manganese dioxide (MnO2), iron hydroxide (FeOOH), and sulfate (SO42−) [4]. Because of the abundance of SO42− in seawater and sediments, when electron acceptors other than SO42− are depleted, all anaerobic processes in the sediments proceed via sulfate reduction, producing H2S, which is released into the bottom water. H2S is highly toxic to organisms and causes blue tides, resulting in the death of organisms and generation of foul smells. Thus, polluted sediments contribute to the occurrence of anoxic water masses, and it is necessary to develop methods to suppress H2S release from sediments.
There is a natural phenomenon called the iron curtain, in which H2S is removed by reacting with divalent iron ions (Fe2+) and depositing iron sulfide (FeS) in sediments [5]. Inspired by this phenomenon, a method for improving the sediment environment has been devised to suppress H2S release into the bottom water by adding iron materials to the sediment, causing it to react with H2S [6].
In a study on methods for improving the sediment environment, Ito et al. [7] examined the suppression of H2S release from coastal marine sediments and the release of ammonium, nitrogen, and phosphorus by the application of steelmaking slag. They reported that this release could be suppressed by pH control. Kanaya and Kikuchi [8] confirmed that the accumulation of H2S could be suppressed for at least 20 days by adding 10–20 g/L of iron to sediments containing high concentrations of hydrogen sulfide under strongly reducing conditions. Hagino et al. [9] and Yasser et al. [10] collected undisturbed sediments from the inner part of Mikawa Bay from June to September, added various iron materials, and conducted H2S release experiments four times to investigate the effects of iron materials in removing H2S and the appropriate amount of iron materials to be added.
Some models address the early diagenetic processes in sediments, such as those proposed by Berg et al. [11] and Fossing et al. [5]. Kasih et al. [12] modified and applied them to the Ago Bay. Inoue et al. [13,14] studied Hakata and Yonago bays. These comprehensive sediment models incorporate OM decomposition processes in sediments and their interactions with metabolites. Further modeling studies coupled with such sediment models with 3D, pelagic flow, and ecosystem models have been proposed [15,16,17,18]. However, it is still difficult to reproduce H2S concentrations and seasonality.
Observational data are essential for validation in modeling studies. To contribute to future blue tide countermeasures in Mikawa Bay, the Aichi Fisheries Research Institute (AFRI) conducted monthly observations and obtained vertical distributions of H2S, Fe2+, and FeS, which are essential for understanding sulfur and Fe dynamics [19].
The purpose of this study is to quantitatively evaluate the suppression of H2S release by adding iron materials to enclosed bay sediments. First, we developed a vertical 1D model that described the chemical and physical processes of various compounds in the early diagenetic processes, including H2S dynamics. Second, our model was validated by reproducing field sediment data from Mikawa Bay (monthly observations by AFRI). Then, we attempted to reproduce experiments on H2S release (Hagino et al. [9]) and production rates (Miyatsuji et al. [20]) using the abovementioned validated results, which represent the distribution of sediment compounds in each month, as the initial conditions for the analysis. Finally, we conducted predictive calculations for adding iron materials to the model to evaluate the sulfur and iron balances.
2. Materials and Methods
2.1. Study Area
Mikawa Bay, the study area, is a eutrophic enclosed bay in Japan with an average depth of 9 m and an area of 604 km2 surrounded by the Chita and Atsumi Peninsulas (Figure 1). Although fishery production activities centered on clams are active, anoxic water masses develop every year in the bottom waters, particularly in summer, and cause serious disturbances to the marine environment, including fishery production, habitat of organisms, and water quality. Mikawa Bay has a narrow mouth, and the exchange of seawater with the open sea is small compared to that of Ise Bay. Additionally, the presence of more than 40 rivers of various sizes, including the Yahagi and Toyokawa Rivers, provides a large supply of nutrients. Furthermore, depending on meteorological factors, such as wind, anoxic water masses frequently upwell to shallow coasts, causing severe damage to bivalves that inhabit tidal flats and adjoining shallow areas [21].
2.2. Experiments on Sulfide Release
In this section, we present the methodology of the H2S release experiment reproduced using this model. The undisturbed sediment cores used in the experiment were collected monthly from June to September 2017 from St. 9 (34°42'N. 137°18'E, C.D.L. = 10.2 m) in the inner part of Mikawa Bay (Figure 1). The core was collected by inserting a circular acrylic pipe (inner diameter: 10 cm; outer diameter: 11 cm; height: 50 cm) directly into the sediment to prevent disturbance.
As shown in Figure 2, the cores were placed in a thermostatic tank and covered with a blackout curtain (to maintain dark conditions) to match the temperature and light conditions near the sampling site. After the seawater above the cores was discharged, the overlying water above the sediments was gently replaced with filtered seawater that was originally collected from the bottom layer near the sampling site. The water was nitrogen-aerated for at least 30 min and the cores were closed immediately to maintain anoxic conditions. The water in the cores was agitated by a plastic propeller with a stirring speed of 30 rpm to maintain gentle agitation adequate to avoid sediment resuspension.
Iron was added to the cores before the overlying water was poured. Iron was added in the form of iron powder of ferric oxide (Fe2O3) and ferric hydroxide (FeOOH), which were added softly and uniformly to the surface layer of the cores (Table 1). These amounts were set to equalize the Fe content (equivalent to 3.5 g of Fe). In the June experiment, the amount of Fe2O3 added was varied in three steps.
Sulfide release experiments using these cores were conducted for 21 days each month (June to September 2017), and water in the cores was sampled on the measurement days (Days 1, 2, 3, 4, 7, 8, 14, 20, and 21), with the initial measurement day being Day 0. Concentrations were measured using the methylene blue method on H2S and phenanthroline method on Fe2+. After sampling, the same amount of water (filtered nitrogen-aerated bottom water near the sampling site) was added to each core. Compared with the model calculations described below, the concentrations were corrected for the effect of seawater replacement on the concentration measurements.
2.3. Experiment on Sulfide Production Rate
Along with the H2S release experiments, experiments on H2S production rates were parallelly conducted [20]. In these experiments, we investigated the H2S production rate due to chemical reactions in sediments by packing sediment into syringes, periodically sampling a small amount of sediment, and analyzing the H2S concentration. Three sediment cores were used for the experimental samples, which were collected from July to September 2017 at the same point and date as the release experiments.
First, the top 0–5 cm of the sediment was sliced into five layers with 1 cm each. Then, each layer of the sediment sample was packed into a 30 mL glass syringe. The syringes were incubated for 21 d in a thermostatic tank maintained at the on-site water temperature (Figure 3 (1)). The H2S concentration in the sediment pore water was measured periodically using the methylene blue method, and the H2S production rate based on the time variation in the concentration was calculated.
Although the volume of pore water in the syringe was very small, the H2S concentration was high. Using this characteristic, a dilution procedure was adopted to measure the concentration, as shown in Figure 3. The method was based on that of Sugahara et al. [22]. First, 2.5 mL of the sediment sample in the 30 mL glass syringe was transferred into a 20 mL sub-glass syringe (Figure 3 (2)). Diluted water was added to the sub-syringe (Figure 3 (3,4)) and mixed thoroughly (Figure 3 (5)). To maintain anoxic conditions, nitrogen-aerated distilled water was used as the dilution water. Diluted water was injected using a glass syringe to prevent entry of oxygen. For the final extraction of the pore water, we filtered at least 5 mL of the mixture into a 20 mL sub syringe and adjusted the volume to 10 mL with dilution water. The dilution rate was measured in advance for analysis to determine the exact concentration.
The measurement days were Days 1, 2, and 21 in July and August and Days 1, 2, 3, 7, 14, and 21 in September. In many of the results for July and August, the H2S concentration temporarily decreased on Day 2 and increased on Day 21. Therefore, the H2S production rate per day was calculated by dividing the H2S concentration difference between Days 2 and 21 by the day interval.
2.4. Construction of Sediment Model
To construct this model, we referred to the model proposed by Fossing et al. [5]. As shown in Table 2, the model classified all 15 sediment compounds into three types: dissolved (with or without adsorption) and particles.
In this model, the upper 20 cm of sediments is modeled as a diffuse boundary layer (DBL) of 0.03 cm and a 19.97 cm sediment layer with exponentially varying layer thickness, for a total of 100 layers. The calculations were performed with a time step of 5 s, and the basic equation of mass balance shown in Equation (1) was used for the iterative calculations.
The definitions of each symbol are listed in Table 3. ξ and ζ are introduced to describe three types of sediment compounds (Table 2). The first term on the right-hand side of Equation (1) is the diffusion term, the second is the burial term, and the third is the net production and consumption term. Diffusion and sedimentation terms were calculated using equations proposed by Fossing et al. [5].
2.4.1. Production and Consumption
The net production and consumption terms reflect the reaction rate and stoichiometry of each chemical reaction involving the substance in question for all substances in all layers. The biochemical reactions considered in this model are listed in Table 4, and the substances and their cycles are shown in Figure 4. Biochemical reactions are divided into primary and secondary stages. The primary reaction is the decomposition of POC. The microbial decomposition produces metabolites (CO2, NH4+, PO43−, and H2O) and by-products (N2, Mn2+, Fe2+, and H2S) from POC as reactants. The reactants, POC, are classified as fast (f), slow (s), and non (n) decomposable according to their decomposition characteristics and are represented as CH2O in the chemical reaction in Table 4.

Table 4.
(1) Biochemical reactions in the model. Reactions are referred from the study of Fossing et al. [5].
Table 4.
(1) Biochemical reactions in the model. Reactions are referred from the study of Fossing et al. [5].
| Primary reactions | |
|---|---|
| O2 + CH2O → CO2 + H2O | (R1) |
| 4NO3− + 5CH2O + 4H+ → 2N2 + 5CO2 + 7H2O | (R2) |
| 2MnO2 + CH2O + 8H+ → 2Mn2+ +CO2 + 3H2O | (R3) |
| 4FeOOH + CH2O + 8H+ → 4Fe2+ + CO2 +7 H2O | (R4) |
| SO42− + 2CH2O + 2H+ → H2S + 2CO2 + 2H2O | (R5) |
Table 4.
(2) Biochemical reactions in the model. Reactions are referred from the studies of Fossing et al. [5] (R6–19) and Kasih et al. [12] (R20,21).
| Secondary reactions | |
|---|---|
| NH4+ + 2O2 → NO3− + H2O + 2H+ | (R6) |
| FeOOH + PO43− → FeOOH≡PO43− | (R7) |
| 2Fe2+ + MnO2 + 2H2O → 2FeOOH + Mn2+ + 2H+ | (R8) |
| 2Mn2+ + O2 + 2H2O → 2MnO2 + 4H+ | (R9) |
| H2S + 2FeOOH≡PO43− + 4H+ → S0 + 2Fe2+ + 4H2O + 2PO43− | (R10a) |
| 4Fe2+ + O2 + 6H2O → 4FeOOH + 8H+ | (R11) |
| H2S + 2FeOOH + 4H+ → S0 + 2Fe2+ + 4H2O | (R10b) |
| H2S + MnO2 + 4H+ → S0 + Mn2+ + 2H2O | (R12) |
| H2S + Fe2+ → FeS + 2H+ | (R13) |
| FeS + S0 → FeS2 | (R14) |
| SO42− + 3H2S + 4FeS + 2H+ → 4FeS2 + 4H2O | (R15) |
| H2S + 2O2 → SO42− + 2H+ | (R16) |
| FeS + 2O2 → Fe2+ + SO42− | (R17) |
| 2FeS2 + 7O2 + 2H2O → 2Fe2+ + 4SO42 + 4H+ | (R18) |
| 4S0 + 4H2O → 3H2S + SO42− + 2H+ | (R19) |
| MnO2A → MnO2B | (R20) |
| FeOOHA → FeOOHB | (R21) |
| FeSA → FeSB | (R22) |
The primary reactions were classified into five electron acceptors, consisting of DO (oxygen respiration), NO3− (denitrification), MnO2 (manganese reduction), iron reduction (FeOOH), and SO42− (sulfate reduction). In this model, the five electron acceptors were modeled in sequence, and the boundary between the aerobic and anaerobic layers was automatically determined based on the reactions. The electron acceptors are recovered in secondary reactions using the reaction products in the primary reaction (metabolites and byproducts) as reactants.
2.4.2. Boundary Condition
As boundary conditions, particulate sediment compounds (POC, FeOOH, and MnO2) at the sediment surface were considered as settling fluxes, and dissolved sediment compounds (DO, SO42−, NO3−, NH4+, PO43−) as concentrations in the water above the sediments. The boundary conditions for the dissolved and substances were assigned to the model as the concentrations at the top of the DBL and at the top layer of the sediments, respectively.校正
2.4.3. Reproduction of Field Observations
The sediment model has many variables, and because it is used as the initial condition to reproduce laboratory experiments, it is necessary to reasonably estimate all these values in advance. Therefore, we applied the sediment model constructed in Section 2.4 to Mikawa Bay and obtained a seasonal steady-state solution of the vertical distribution of sediment compound concentrations. Then, using this solution as the initial condition, we performed a reproductive calculation of the H2S release experiments for each month.
In the calculation to reproduce the on-site sediments, the boundary conditions were different depending on the state of the sediment compounds, as shown in Figure 5. The boundary condition for the dissolved substances was given to the model reflecting the DBL concentration of the previous step to represent the diffusion in water. The boundary condition for particulate substances was applied to the model by converting the flux to the concentration in the top layer of sediments and adding it to the concentration in the previous step. The flux of the particle substance was incorporated into the calculation after it was converted to a concentration using Equation 6:
where Φ is the boundary condition (flux) given to the model per second, ∆CΦ is the concentration changes with Φ in the first layer of sediments, ∆t is the time step, ∆x3 is the thickness of the top layer of sediments, ρs is the soil particle density, and φ is the porosity.
We set certain conditions for reproducing the on-site sediments, as shown in Table 5 and Figure 6. The vertical distribution of porosity was set based on AFRI observations, as shown in Figure 6(a). The boundary conditions of the model were given as the concentration in the upper part of the concentration boundary layer for dissolved substances and the sedimentation flux for particulate substances (Figure 6(b) and Table 5).
Regarding the seasonal cycle of the boundary conditions, the temperature and DO concentration were based on bottom water observations by AFRI, which were observed on the same day and site as the sediment sampling. Phosphate-phosphorus (PO4−P) was based on seasonal data from the Wide-area Comprehensive Water Quality Survey conducted by the Ministry of the Environment (measurement site: Aichi Prefecture No. 61, reference period: 2006–2016). The seasonal variation in POC sedimentation flux is shown in Figure 10(a) of Yamamoto et al. [23]. At site A-10 in the figure (Water Quality Survey of Public Water Area by Aichi Prefecture), which is close to the observation site, the annual variation from 1978 to 1990 was estimated to be sinusoidally seasonal, with an annual maximum value of approximately 300–500 mg/m2/d in summer and a minimum value of almost 50 in winter. Based on these results, the proposed model approximates the seasonal variation with a sinusoidal function, with a maximum value of 500 in August and a minimum value of 50 in February.
The calculations were performed with an initial condition of zero concentration of all sediment compounds and repeated under the boundary and temperature conditions. We obtained a seasonally steady solution by repeating the calculations for more than 40 years. To validate the model, the calculated results were compared with data from a sediment survey conducted by the AFRI in Mikawa Bay, Japan.
2.4.4. Reproduction of Experiment on Sulfides Release
As mentioned in Section 2.2, the period of the H2S release experiment was relatively short (21 d), and the experimental cores were kept airtight under anoxic conditions. Therefore, we assumed zero DO concentration and no particle substance flux in the boundary conditions for reproducing the release experiment, and all concentrations in the previous step were reflected. It also ignores burial owing to sedimentation from seawater. The input values for the water temperature were the values measured in the experiment.
Additionally, we considered a bulk water layer with homogeneous solute concentrations above the DBL to describe temporal concentration changes in the overlying water of the experimental cores. The thickness of the bulk water layer was set based on the diameter of the experimental core and the amount of water, and C0 was calculated by considering only the diffusion from C1 (C is shown in Figure 5).
As the first step in the calculation procedure, we utilized the calculated results described in Section 2.4.2 as the initial distribution of the substance concentrations for each month from June to September. Second, for the initial conditions of iron, we set the concentrations of iron in the upper layer of the sediments to correspond to the amount of iron materials added. The range of addition was assumed to be the top three layers (total 0.1 cm thickness), and the concentration was inversely proportional to the thickness of the three layers. Calculations were performed for the duration of the experiment (21 days) to reproduce the change in H2S concentration in the overlying water.
The reaction pathways of the iron materials were assumed to be the same as those of the naturally occurring FeOOH and H2S (R10 in Table 4 and Figure 4). The reaction rate coefficients with Fe2O3 and FeOOH (added in the experiment) were set to R23 and R24, respectively, and these values were tuned based on the reaction rate coefficient of R10 to consider the difference in the reaction rate of each iron material (Table 6).
3. Results
3.1. Reproduction of Field Observations
Figure 7 shows the seasonal variations in the vertical distribution of the major chemical concentrations (H2S, Fe2+, FeS, PO43−, and DO). The distributions of H2S, Fe2+, and FeS were compared with those observed at four sites (St. 0, 8, 9, and 10), as shown in Figure 1. St. 9 was the closest to the sampling points of the two experiments; therefore, its reproducibility was particularly important.
Observations from May to November, including the experimental period (June to September), revealed that H2S reached the near-water-sediment interface from May to September, and the H2S concentration near the interface decreased from September to November. This trend was also observed in the calculated values. Moreover, DO penetrated approximately 0.5 cm into the upper layer of the sediments in May, disappeared from July to August, and began to recover in September.
The calculated seasonal variations in H2S, Fe2+, and FeS were also compared with the observations. Although slightly underestimated throughout the year, we could reproduce the disappearance of Fe2+ during summer. Additionally, for H2S, it was possible to reproduce seasonal changes and orders of magnitude in the sediments of Mikawa Bay, particularly in the upper layers.
3.2. Reproduction of Sulfide Release Experiment
Figure 8 shows a comparison between the experimental and model-calculated H2S concentrations for the H2S release experiments for each month (June to September). The error ranges of the experimental values were due to differences in the cores, and the dots indicate the average concentrations.
In the experimental data of June, there was a delay in the start of H2S release into the water overlying the cores. The concentrations of electron acceptors (DO, NO3−, MnO2, FeOOH, and SO42−) are shown in Figure 9 as initial conditions for each month were nonzero in June but were almost zero from July to September, which is consistent with the lag time. The model calculations also quantitatively described the lag time of H2S release due to the remaining electron acceptors, i.e., the process whereby oxidants are consumed in the sediments in the early phase of the experiment, and H2S is released with a delay.
The experimental results for the control (additive-free) cores from July to September showed an almost constant increase rate of concentrations during the experiment after a short time lag when H2S release started. This tendency is reproduced well by the model. In contrast, the rate gradually decreased during the experiment for the cores with iron additives, indicating that the iron materials suppressed H2S release, but the effect was delayed. This trend was not observed in June, indicating that the amount of iron was too small. The model calculations also reproduced the increasing trend of H2S concentration in the control cores and the delay in the suppression effect of H2S release in the cores with iron additives. However, the concentrations in the control cores were still underestimated.
3.3. Experiment on Sulfide Production Rate
Figure 10 and Figure 11 show the experimental results for the H2S production rate in July, August, and September. In July, the H2S concentrations in all layers of all the cores temporarily decreased on the second day and then increased. This trend is also observed in August. The mean H2S production rate estimated from the experiments in July and August was calculated from the values obtained on Days 2 and 21. The rate of all cores by depth, in July, shows that the 0–1 cm layer and 2–3 cm layer are relatively large (4.00 and 4.31 mg/L/d, respectively), while the 4–5 cm layer is small (1.86 mg/L/d). These mean rates obtained in August were slightly lower than that obtained in July, with a maximum of 3.01 mg/L/d (0–1 cm layer). The production rate was higher in the upper layer in both months, suggesting that all electron acceptors other than SO42− (DO, NO3−, MnO2, and FeOOH) were exhausted during the primary reactions.
In contrast, in the September experiment, the concentrations in each layer of all cores temporarily decreased from Days 3–7 and then increased (Figure 11(a)). The mean H2S production rate estimated from the experiment in September was calculated for each period (Day 1–2, 2–3, 3–7, 7–14, 14–21) (Figure 11(b–f)). Compared to August, the order of the rate increased, with the highest rate in the 0–1 cm layer (13.56 mg/L/d). The 0–1 cm layer (13.56 mg/L/d) exhibited a relatively high rate. Unlike in July and August, the 4–5 cm layer had a relatively high rate of 8.80 mg/L/d.
4. Discussion
4.1. Analysis of Sulfide Production Rate
As mentioned in Section 3.3, the H2S concentration in all layers of all cores temporarily decreased on the second day and then increased in July and August. A possible cause of this trend is that oxygen may have been contaminated while measuring the concentration on Day 1. Another factor could be that the reaction of H2S with iron or manganese compounds was delayed.
Figure 12 shows the vertical distribution of the H2S production rate in each layer in the experiment (5 layers) and calculation (field-reproduced, 100 layers). The rate in the calculation was considered equal to R5 in Figure 4. In the model, H2S production mostly occurred in the upper 0.5 cm, with little production in the lower layers. There are several possible explanations for the discrepancy. First, in field reproduction, phenomena such as molecular diffusion, biodiffusion, sedimentation, and burial were observed. However, these phenomena were not observed in the experiment. Second, there was an inhibition term for H2S in the model, and the production rate was inhibited beyond a certain concentration. It can be inferred that, in the reproduction calculation, the inhibition of H2S is enabled at the bottom, while in the upper part, H2S is released to water at every step and the inhibition is disabled. Therefore, the thresholds that limit the inhibition term in the model must be recalibrated.
Additionally, sulfate reduction is known to be controlled by the availability of electron acceptors, availability of decomposable OM, and pH [25,26,27], which may not be fully considered in this model.
Figure 12(c) shows the seasonal variations in the production rate (averaged, as in the experimental layers) and the monthly averaged vertical distribution in the calculation. There are discrepancies in the distributions between the experimental and calculated values; however, our model could reproduce the trend of H2S production becoming more inactive in all layers (especially the upper), with hypoxic conditions in summer and inactive with the recovery of DO.
4.2. Annual Cycle of Iron and Sulfur
We created a diagram of the average fluxes to discuss the sulfur and iron cycles and the suppression effect on H2S release by iron (Figure 13). First, all values input to the diagram were calculated in units of mmol/cm2/d, with the direction of the arrow being positive. Arrows between the sediments and water connecting the same compounds represent release or sedimentation fluxes, whereas arrows pointing to the bottom of the sediments represent burial fluxes. The arrows connecting the different compounds represent the fluxes due to changes in the form of the reaction pathways shown in Table 4.
The annual and seasonal mean fluxes are shown in Figure 15 and Figure 16, respectively. Both the fluxes were averaged over a depth of 15 cm. The seasonal fluxes were averaged from March to May (spring), June to August (summer), September to November (autumn), and December to February (winter). Seasonal cycle diagrams were discussed based on the annual cycle. The POM decomposition fluxes due to SO42− (R5) and H2S release were relatively small in spring, reached a maximum in summer, and then decreased in fall and winter. As shown in Figure 9, the results indicate that the electron acceptors in POM decomposition, except for SO42−, are consumed during spring and summer, causing the production and release of a large amount of H2S. The R5 and H2S release fluxes during the summer months accounted for 70% and 93% of the annual fluxes, respectively.
Each reaction pathway with a seasonal maximum value is shown in Figure 16. For example, during spring, the FeS formation rate (R13) reached its maximum, whereas the H2S release rate was significantly suppressed. The sulfate reduction (R5) and H2S release were at a maximum during summer. The trend during autumn was similar to that of spring, but the cycling of FeOOH and Fe2+ (R4, R8), pyrite (FeS2) production (R14) and its consumption (R18), and S0 production (R10) and disproportionation (R19) were maximized. In winter, almost all reactions were suppressed because of the lower temperature.
4.3. Effect of Iron Curtain
As mentioned previously, iron curtains are a phenomenon in which iron reacts with H2S. This reaction causes H2S to settle as FeS, thereby suppressing the H2S release into the seawater. This effect was explained in terms of the reaction pathway. Equations (7) and (8) are the reaction equations for oxygen and H2S, respectively, obtained by unifying the number of moles of O2.
9H2S + 18O2 → 9SO42− + 18H+
12H2S + 8FeOOH → 8FeS+4S0 + 16H2O
8FeS + 18O2 + 12H2O → 8FeOOH + 8SO42− + 16H+
8FeS + 18O2 + 12H2O → 8FeOOH + 8SO42− + 16H+
In the absence of Fe, 18 mol of O2 reacted with 9 mol of H2S, whereas in the presence of Fe, the same amount of O2 reacted with 12 mol of H2S, as shown in the equation, indicating that H2S could be removed approximately 1.3 times. Furthermore, because Fe returns to its original form, FeS regains its oxidizing power. An advantage of the iron curtains is that FeOOH acts catalytically and maintains its ability to remove H2S. Furthermore, because Fe is a part of the OM decomposition process (R4 in Figure 4), it may delay the generation of H2S by extending the period during which electron acceptors in the OM decomposition process are converted to sulfates.
In the simulation of iron material addition to the field, we calculated for one year using the results of the field reproduction and assumed that 637 g/m2 of iron material (Fe2O3, equivalent to 5 g in the experimental system) was added once to the upper three layers on June 1st without any further additions. By comparing the cases with and without the addition of iron material (Figure 17), we found that the addition of iron material suppressed H2S release by 14 mmol/m2/d and increased the reaction with FeOOHA by 87.1 mmol/m2/d. This indicates that the main pathways related to FeS production and consumption are larger and clearly indicates that the iron material reacts with H2S, but the suppression of H2S release is not as significant. This is considered to be due to its smaller suppression effect compared to H2S production. In terms of the suppression of H2S release, R13 is as important a reaction as R10; however, the values of R13 and R10 are smaller than those of R5. Therefore, the added amount of iron was insufficient to completely suppress H2S release. A comparison of Figure 17 (b) with the seasonal results (Figure 16) suggests that the result is similar to the spring result owing to the relatively larger production rate of FeS (R13) using iron materials.
4.4. Model Setting Conditions
Future research should focus on improving the accuracy of field sediment reproduction and optimizing the reaction paths and rates between iron materials and H2S.
4.2.1. Improvement of the reproduction accuracy of field sediments
The boundary conditions of DBL significantly influence the internal composition and material cycle of sediments in the reproduction calculations of field sediments. For example, setting the sedimentation flux of FeOOH as an oxidant is considered important, as are the DO and NO3− concentrations. However, in previous models, including ours, FeOOH was assigned seasonally constant values. In contrast, in an ecosystem model, P loading is usually given in the form of an LQ equation that depends on the river flow rate. The run-off characteristics of Fe are similar to those of phosphorus [28,29], and a similar LQ equation can be used in the analysis. Wijsman et al. [30] constructed a sediment model with the Black Sea as the target water body and suggested that large rivers are the primary source of reactive iron (e.g., FeOOH) to the continental shelf. In this study, in the area around the station, there are several rivers, such as the Toyo, Shio, Kamita, Umeda, and Yahagi Rivers. It is possible that reactive iron from these rivers affects the sediment compounds. It is a future prospect to consider the seasonal variations in the boundary conditions to consider the inflow of iron from the rivers and to evaluate the effect of this change.
4.2.2. Reaction of Iron Materials with Sulfides
For the reaction rate between the iron materials and H2S, the model calculations assumed the same reaction pathway as that of naturally occurring FeOOH and H2S, and the reaction rate was tuned. The reaction rate between FeOOH and H2S can be expressed by first-order reaction kinetics, which are affected by several factors, such as pH, common ion species, and the crystal structure of ferric oxide [31,32]. The pH is yet to be reproduced in the model, as observed in the field and laboratory experiments. There are many unclear points regarding the rate equations for the reaction of H2S with iron and other candidate materials (e.g., steel slag) used in the experiments and the dependence of the rate constants on the reaction conditions. This issue needs to be addressed in future studies.
5. Conclusions
In this study, we developed a sediment model based on the work of Fossing et al. [5] and adapted it to Mikawa Bay. Additionally, we attempted to reproduce the concentration distribution of major substances in field sediments and experimental results using field sediment cores. Moreover, we predicted the addition of Fe to the field sediments.
The following results were obtained:
- In the sulfide production rate experiment, we calculated the rate based on the concentration in the sediment cores during the summer months. This rate tends to increase in the upper layers over time. However, the reproducibility of the model remains an issue.
- Our model, which was developed by focusing on sulfur and iron dynamics, was able to reproduce the vertical concentration distributions of the major substances in the sediments and their seasonal trends.
- By reproducing the sulfide release experiment, our model could reproduce the effect and difference in the amount, type, and time of addition of iron materials.
- Predictive calculations for the addition of iron materials to the sediments, particularly during the summer season when the release was most prevalent, allowed us to quantify the difference in the amount of H2S released with and without the addition of iron materials in terms of fluxes.
Author Contributions
Conceptualization, Y.N.; methodology, Y.N. and T.I.; software, F.M.; validation, F.M.; formal analysis, F.M. and T.M; investigation, T.M., Y.N., and T.I; resources, T.I.; data curation, F.M. and T.M.; writing—original draft preparation, F.M.; writing—review and editing, F.M., Y.N., and T.I.; visualization, F.M.; supervision, Y.N.; project administration, Y.N.; and funding acquisition, Y.N. All authors have read and agreed to the published version of the manuscript.
Funding
This research was funded by the Steel Foundation for Environmental Protection Technology, grant numbers 41(2016) and 36(2017) (soil and water quality).
Data Availability Statement
Publicly available datasets were analyzed in this study. These data can be found here: [https://water-pub.env.go.jp/water-pub/mizu-site/mizu/kouiki/dataMap.asp].
Acknowledgments
The authors express their sincere appreciation to the Aichi Fisheries Research Institute for helping in the collection of field sediment samples for this study, Tokyo Kyuei Co., Ltd. (Mr. Hagino, Kobayashi, and Shigeoka) for helping in the H2S release experiment, and Professor Sugahara at Shimane University for helping in the H2S production experiments. We also thank the editors and reviewers for their comments on the manuscript. We would like to thank Editage [http://www.editage.com] for editing and reviewing this manuscript for English language.
Conflicts of Interest
Fumika Mochida is an employee of IDEA Consultants Inc.
Appendix A
Table A1.
Parameters set in the model.
| Parameter | Value*1 | Unit | Source*2 | |
|---|---|---|---|---|
| diffusivity in free water | DO | 11.7 + 0.334T + 0.00505T2 | cm2/s | [5] |
| NO3− | 9.72 + 0.365T | cm2/s | [5] | |
| H2S | 8.74 + 0.264T + 0.004T2 | cm2/s | [5] | |
| SO42− | 4.96 + 0.226T | cm2/s | [5] | |
| NH4+ | 9.76 + 0.398T | cm2/s | [5] | |
| Mn2+ | 3.04 + 0.153T | cm2/s | [5] | |
| Fe2+ | 3.36 + 0.148T | cm2/s | [5] | |
| PO43− | 9.76 + 0.398T | cm2/s | [5] | |
| biodiffusivity | Particle | 3.51 × 10⁻⁶ | cm2/s | [5] |
| Dissolved | 2.8 × 10⁻⁷ | cm2/s | [5] | |
| Q10 | Primary | 3.8 | - | [5] |
| Secondary | 2.0 | - | [5] | |
| adsorption | NH4+ | 2.2 | cm3/g | [5] |
| Mn2+ | 13 | cm3/g | [5] | |
| Fe2+ | 500 | cm3/g | [5] | |
| PO43− | 2.0 | cm3/g | [5] | |
| existence ratio to carbon | C/N | 8 | - | [5] |
| C/P | 80 | - | [5] | |
| reaction rate | R6 | 2.5 × 10⁻⁶ | /µM/s | [5] |
| R7 | 5.0 × 10⁻¹⁴ | /s | [12] | |
| R8 | 7.5 × 10⁻¹¹ | /µM/s | [11] | |
| R9 | 1.5 × 10⁻⁵ | /µM/s | [5] | |
| R10 | 2.0 × 10⁻⁷ | /µM/s | [12] | |
| R11 | 5.0 × 10⁻⁴ | /µM/s | [5] | |
| R12 | 3.0 × 10⁻⁹ | /µM/s | [5] | |
| R13 | 3.75 × 10⁻⁵ | /µM/s | [12] | |
| R14 | 3.0 × 10⁻¹² | cm3/nmol/s | [12] | |
| R15 | 7.5 × 10⁻¹² | /µM/s | [12] | |
| R16 | 5.0 × 10⁻⁵ | /µM/s | [5] | |
| R17 | 6.0 × 10⁻⁷ | /µM/s | [5] | |
| R18 | 1.6 × 10⁻⁸ | /µM/s | [5] | |
| R19 | 7.0 × 10⁻⁷ | /s | [5] | |
| R20 | 1.3 × 10⁻⁹ | /s | [11] | |
| R21 | 9.0 × 10⁻¹⁰ | /s | [5] | |
*1 T is temperature. *2 Numbers in the sources correspond to references.
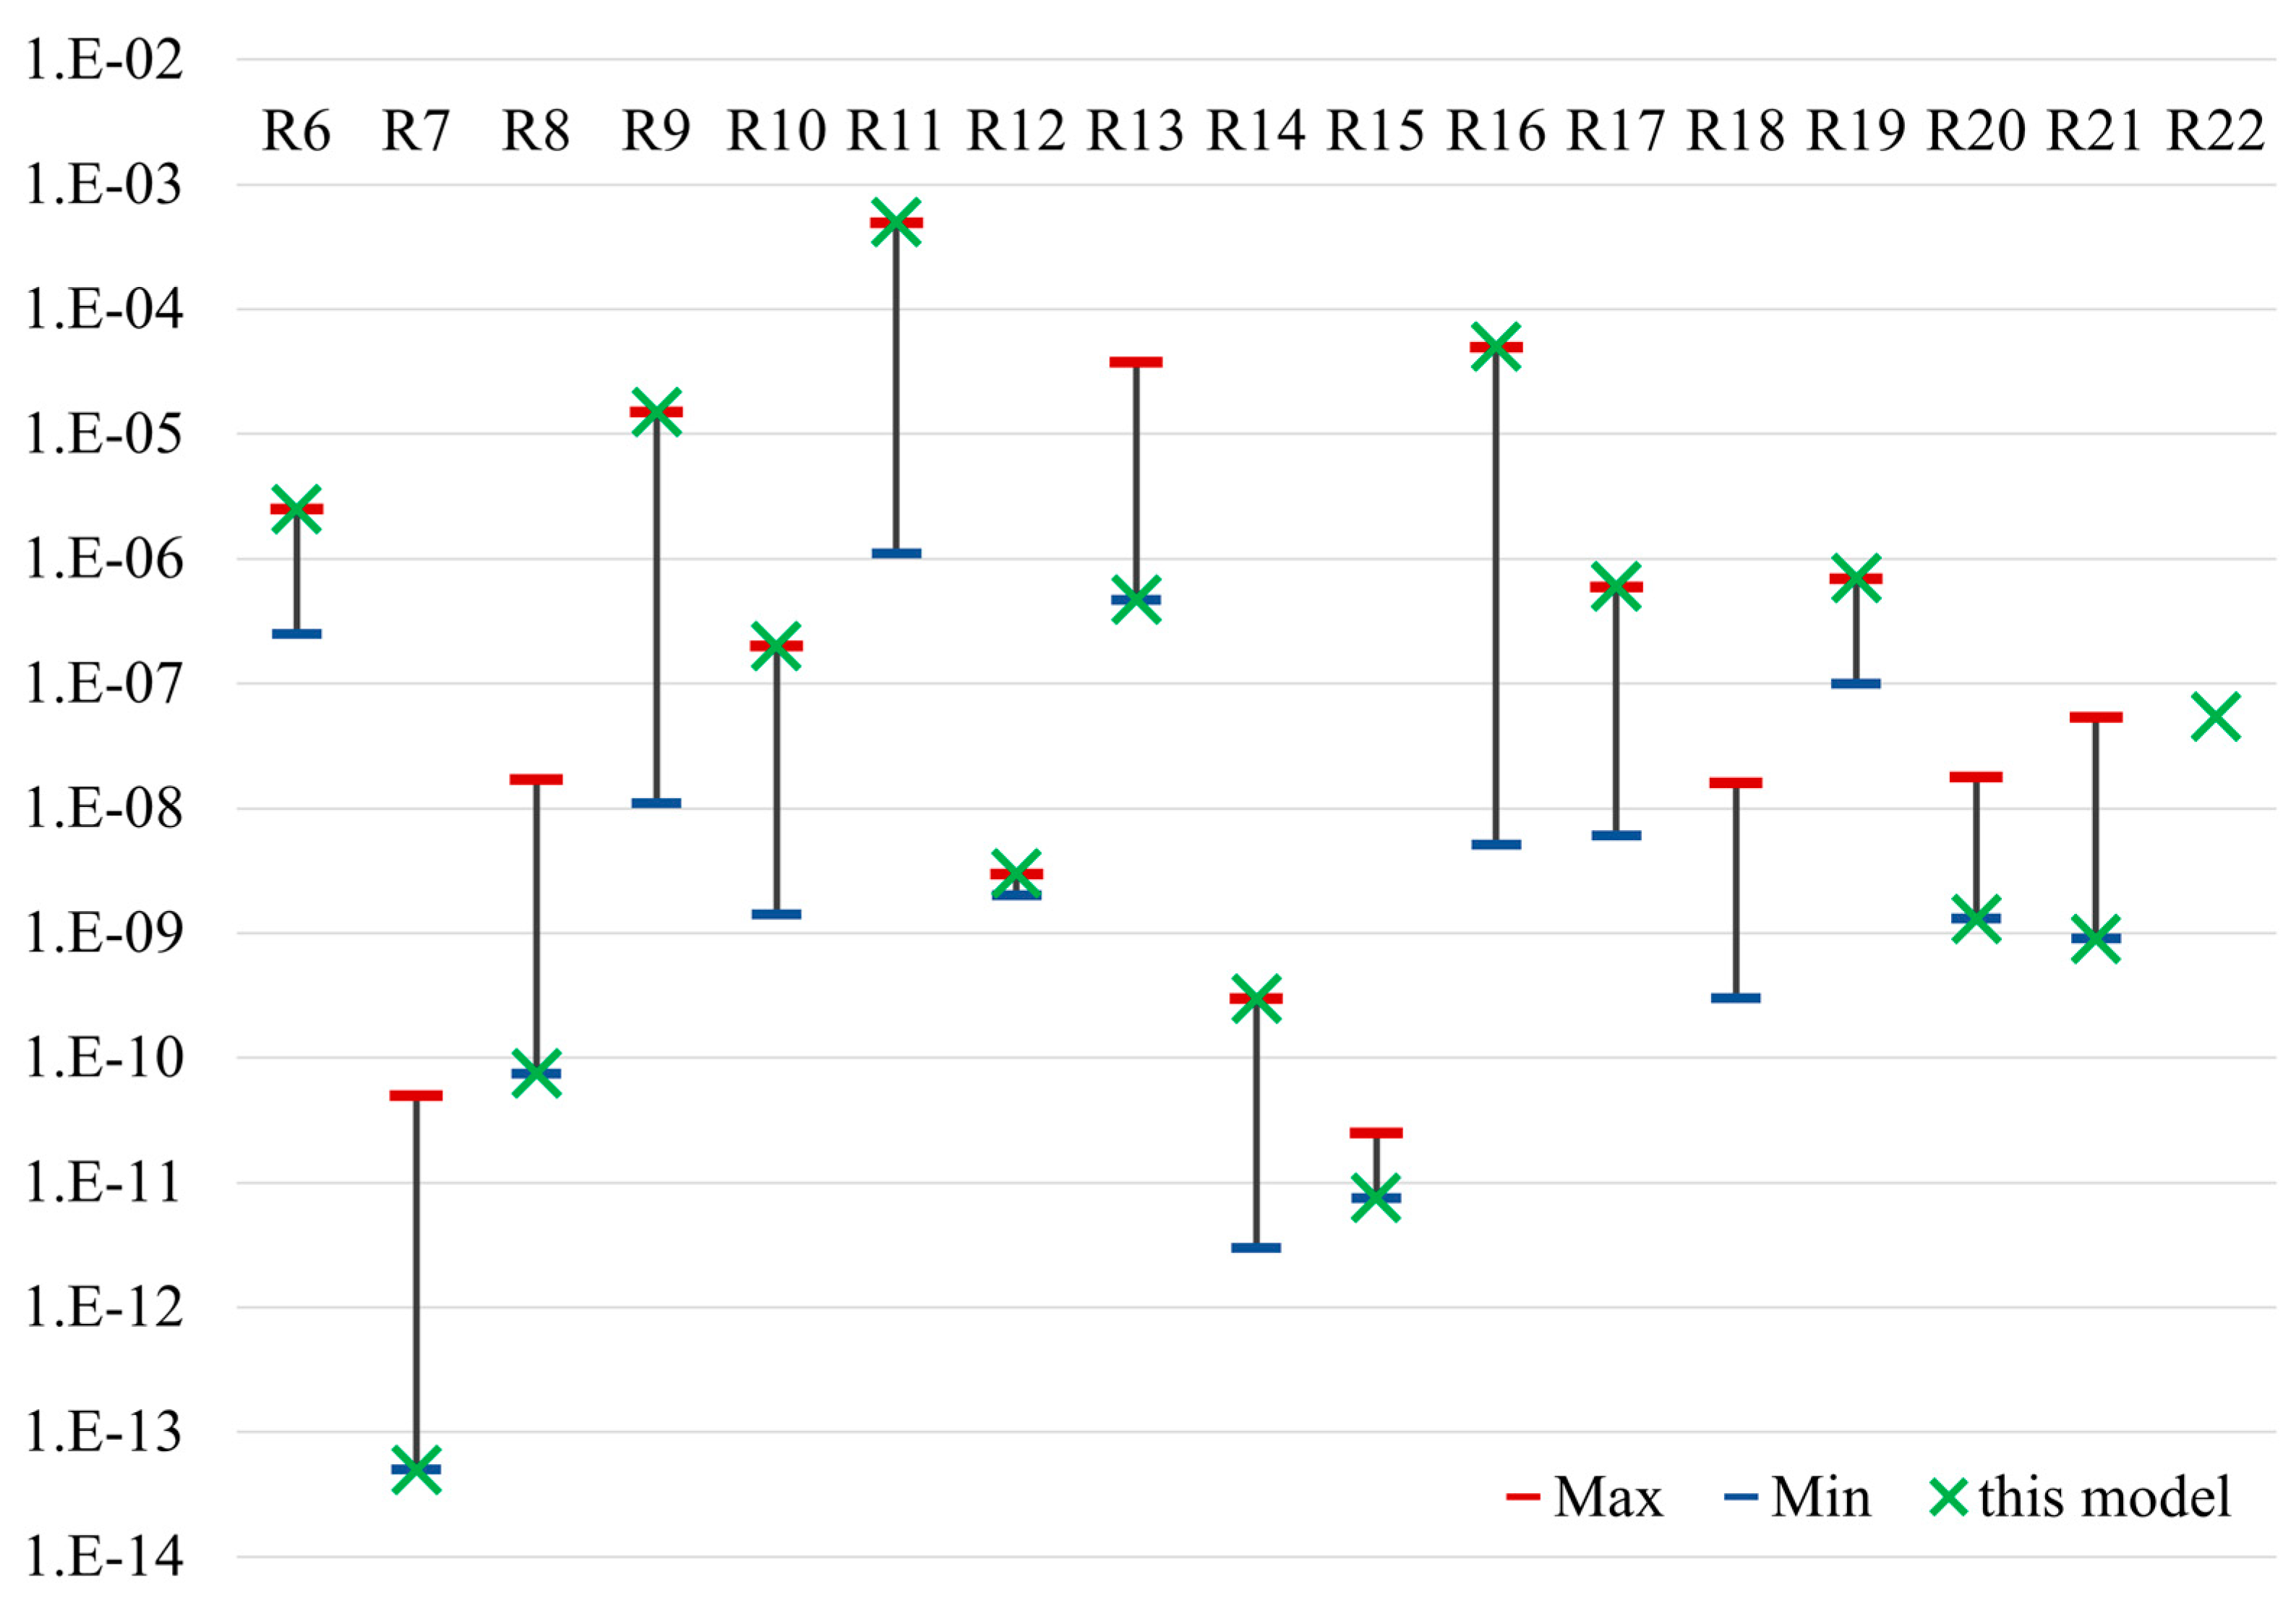
Figure A1.
Result of tuning reaction rate (Max. and Min. are determined from reference values).
References
- Tobler, M.; Schlupp, I.; Heubel, U.K.; Riesch, R.; de León F.J.; Giere, O.; Plath, M.; Life on the edge: hydrogen sulfide and the fish communities of a Mexican cave and surrounding waters. Extremophiles 2006, 10(6), pp.577-585. [CrossRef]
- Tsujimoto, A.; Nomura, R.; Yasuhara, M.; Yamazaki, H.; Yoshikawa, S. Impact of eutrophication on shallow marine benthic foraminifers over the last 150 years in Osaka Bay, Japan. Marine Micropaleontology 2006, 60, pp.258-268. [CrossRef]
- Fisher T. R.; Hagy III, J.D.; Boynton, W.R.; Williams, M.R.; Cultural eutrophication in the Choptank and Patuxent estuaries of Chesapeake Bay. Limnology and Oceanography 2006, 51(1, part2), pp.435-447. [CrossRef]
- Canfield, D.E.; Thamdrup, B.; Hansen, J.W. The anaerobic degradation of organic matter in Danish coastal sediments: Iron reduction, manganese reduction, and sulfate reduction. Geochimica et Cosmochimica Acta 1993, 57, pp.3867-3883. [CrossRef]
- Fossing, H.; Berg, P.; Thamdrup, B.; Rysgaard, S.; Sorensen, H. M.; Nielsen, K. A model set-up for an oxygen and nutrient flux model for Aarhus Bay (Denmark). NERI Technical Report 2004, No.483.
- Inoue, T.; Hagino, Y. Effects of three iron material treatments on hydrogen sulfide release from anoxic sediments. Water Science and Technology,2022, 85(1), pp.305–318. [CrossRef]
- Ito, K.; Nishijima, W.; Shoto, E.; Okada, M. Control of Sulfide and Ammonium Release from Coastal Bottom Sediments by Converter Slag (in Japanese). Journal of Japan Society on Water Environment 1997, 20(10), pp.670-673. [CrossRef]
- Kanaya, G.; Kikuchi, E.; Precipitative removal of free hydrogen H2S from estuarine muddy sediment by iron addition (in Japanese). Northeast Asian studies 2009, 13, pp.17-28. http://hdl.handle.net/10097/44070.
- Hagino, Y.; Kobayashi, T.; Shigeoka, Y.; Inoue, T.; Nakamura, Y.; Miyatsuji, T.; An Investigation on Removal Capability of Hydrogen H2S by Iron Materials Addition to Sediments (in Japanese). Annual Conference of Japan Society on Water Environment, Sapporo, Japan, 17th March 2018.
- Ahmad Seiar, Y.; Nakamura, Y.; Miyatsuji, T.; Hagino, Y.; Kobayashi, T.; Shigeoka, Y.; Inoue, T. Remediation of Coastal Marine Sediment using Iron, ONM-CozD 2019 (In Proceedings of the 5th International Conference on Geographical Information Systems Theory, Applications and Management (GISTAM 2019)) 2019, pp.335-339. [CrossRef]
- Berg, P.; Rysgaard; S.; Thamdrup, B. Dynamic Modeling of Early Diagenesis and Nutrient Cycling. A Case Study in an Arctic Marine Sediment. American Journal of Science 2003, 303, pp.905–955. [CrossRef]
- Kasih, G. A. A.; Chiba, S.; Yamagata, Y.; Shimizu, Y.; Haraguchi, K. Numerical model on the material circulation for coastal sediment in Ago Bay, Japan. J. Marine Systems, 2009, 77, pp.4-60. [CrossRef]
- Inoue, T.; Nakamura, Y. Response of benthic soluble reactive phosphorus transfer rates to step changes in flow velocity, Journal of Soils Sediments 2012, 12, pp.1559–1567. [CrossRef]
- Inoue, T.; Sugahara, S.; Seike, Y.; Kamiya, H.; Nakamura, Y. Short-term variation in benthic phosphorus transfer due to discontinuous aeration/oxygenation operation. Limnology 2017, 18, pp.195-207. [CrossRef]
- Nagao, K.; Hata, K.; Yoshikawa, S.; Hosoda, M.; Fujiwara, T. Biogeochemical Model with Benthic-Pelagic Coupling Applied to Tokyo Bay (in Japanese). Proceedings of Coastal Engineering, JSCE 2008, 55, pp.1191-1195. [CrossRef]
- Tanaka, Y.; Nakamura, Y.; Suzuki, K.; Inoue, T.; Nishimura, Y.; Uchida, Y.; Shirasaki, M. Development of a Pelagic Ecosystem Model Considering the Microbial Loop and Field Evaluation in Ise Bay (in Japanese). Journal of Japan Society of Civil Engineers, Ser. B2 (Coastal Engineering), 2011, 67(2), pp. I_1041-I_1045. [CrossRef]
- Wang, K.; Nakamura, Y.; Sasaki, J.; Inoue, T.; Higa, H.; Suzuki, T.; Hafeez, M. A. An effective process-based modeling approach for predicting hypoxia and blue tide in Tokyo Bay. Coastal Engineering Journal, 2022, 64(3), pp.458–476. [CrossRef]
- Inoue, T., Komuro, T. Analysis of Lower Trophic Ecosystem Model and Fish Catches Using a New Fish Ecosystem Model (in Japanese). Technical Note of the Port and Airport Research Institute, 2020, 1368, pp.1–38. URL(https://www.pari.go.jp/en/report_search/detail.php?id=20200417155802).
- Kamohara, S.; Sone, R. Effect of hypoxia and sulfide on habitat and reproduction of fishes and shellfishes in Mikawa Bay. In: Proposals of the Effective Countermeasures against the Attack of Oxygen Depleted Water Mass and Blue Tide to Tidal Flat and Sea Grass Beds Enclosed by Artificial Coastline, Final Report of the Environment Research and Technology Development Fund (5-1404). 2017, pp.27-46. URL (https://www.erca.go.jp/suishinhi/seika/db/search.php?research_word).
- Miyatsuji, T.; Ahmad Seiar, Y..; Nakamura, Y.; Inoue, T.; Sugahara, S.; Hagino, Y.; Kobayashi, T.; Shigeoka, Y.; Experimental Study on Hydrogen Sulfide Release from and its Production Rates in the Sediment of Mikawa Bay (in Japanese). Annual Conference of Japan Society on Water Environment, Sapporo, Japan, 17th March 2018.
- Aoyama, H.; Kai, M.; Suzuki, T.; Nakao, T.; Imao, K. The formulation of the mortality of Japanese littleneck clam (Ruditapes phillippinarum) caused by a deficiency of dissolved oxygen in Mikawa Bay -The second attempt- (in Japanese). Journal of Advanced Marine Science and Technology Society 1998, 4(1), pp.35-40. [CrossRef]
- Sugahara, S.; Yurimoto, T.; Ayukawa, K.; Kikmoto, K.; Senga, Y.; Okumura, M.; Seike, Y. A Simple in situ Extraction Method for Dissolved Sulfide in Sandy Mud Sediments Followed by Spectrophotometric Determination and Its Application to the Bottom Sediment at the Northeast of Ariake Bay (in Japanese). The Japan Society for Analytical Chemistry 2010, 59(12), pp.1155-1161. [CrossRef]
- Yamamoto Y.; Nakata, K.; Suzuki, T. Research on process of formation of oxygen depleted water mass in Mikawa Bay (in Japanese). Journal of Advanced Marine Science and Technology Society 2008, 14(1), pp.1-14. [CrossRef]
- Wide-area Comprehensive Water Quality Survey by the Ministry of the Environment URL (https://water-pub.env.go.jp/water-pub/mizu-site/mizu/kouiki/dataMap.asp) (measurement site: Aichi Prefecture No.61, reference period: 2006-2016).
- Smolders, A. J. P.; Lamers, L. P. M.; Lucassen, E. C. H. E. T.; Van der velde, G.; Roelofs, J. G. M. Internal eutrophication: How it works and what to do about it – a review. Chemistry and Ecology 2006, 22(2), pp.93-111. [CrossRef]
- Holmer, M.; Storkholm, P. Sulphate reduction and sulphur cycling in lake sediments: a review. Freshwater Biology, 2001, 46, pp.431-451. [CrossRef]
- Lamers, L. P. M.; Els ten dolle, G.; Van den berg, S. T. G.; Van delft, S. P. J.; Roelofs, J. G. M. Differential responses of freshwater wetland soils to sulphate pollution. Biogeochemistry, 2001, 55, pp.87–102. [CrossRef]
- Iwata, S.; Endo, T.; Inoue, T.; Yokota, K.; Okubo, Y. Runoff Characteristics of Nutrient Loads from Small Rivers - Case of the Hamada River, Aichi Prefecture -. Journal of Japan Society on Water Environment 2013, 36(2), pp.39-47. [CrossRef]
- Otsuka, H.; Furuta, M.; Yamamoto, H.; Arakawa, Y. Estimation of yearly mass loading of iron, phosphorus and manganese in a river by the use of concentration correlations to automatically monitored turbidity. Bulletin of Aichi Environmental Research Center, 1981, 9, pp.40-45.
- Wijsman, J. W. M.; Herman, P. M. J.; Middelburg, J. J.; Soetaert, K. A model for Early Diagenetic Processes in Sediments of the Continental Shelf of the Black Sea, Estuarine, Coastal and Shelf Science 2002, 54(3), pp.403-421. [CrossRef]
- Sum, j.; Zhou, J.; Shang, C.; Kikkert, G.A. Removal of aqueous hydrogen sulfide by granular ferric hydroxide—Kinetics, capacity and reuse. Chemosphere 2014, 117, pp.324–329. [CrossRef]
- Afonso, M.D.S.; Stumm, W. Reductive dissolution of iron (III) (hydr)oxides by hydrogen sulfide. Langmuir 1992, 8(6), pp.1671-1675. [CrossRef]
Figure 1.
Sampling sites of sediment cores (St. numbers are from Kamohara and Sone [19]) (This map is based on the GSI tiles and vector published by Geospatial Information Authority of Japan).
Figure 1.
Sampling sites of sediment cores (St. numbers are from Kamohara and Sone [19]) (This map is based on the GSI tiles and vector published by Geospatial Information Authority of Japan).
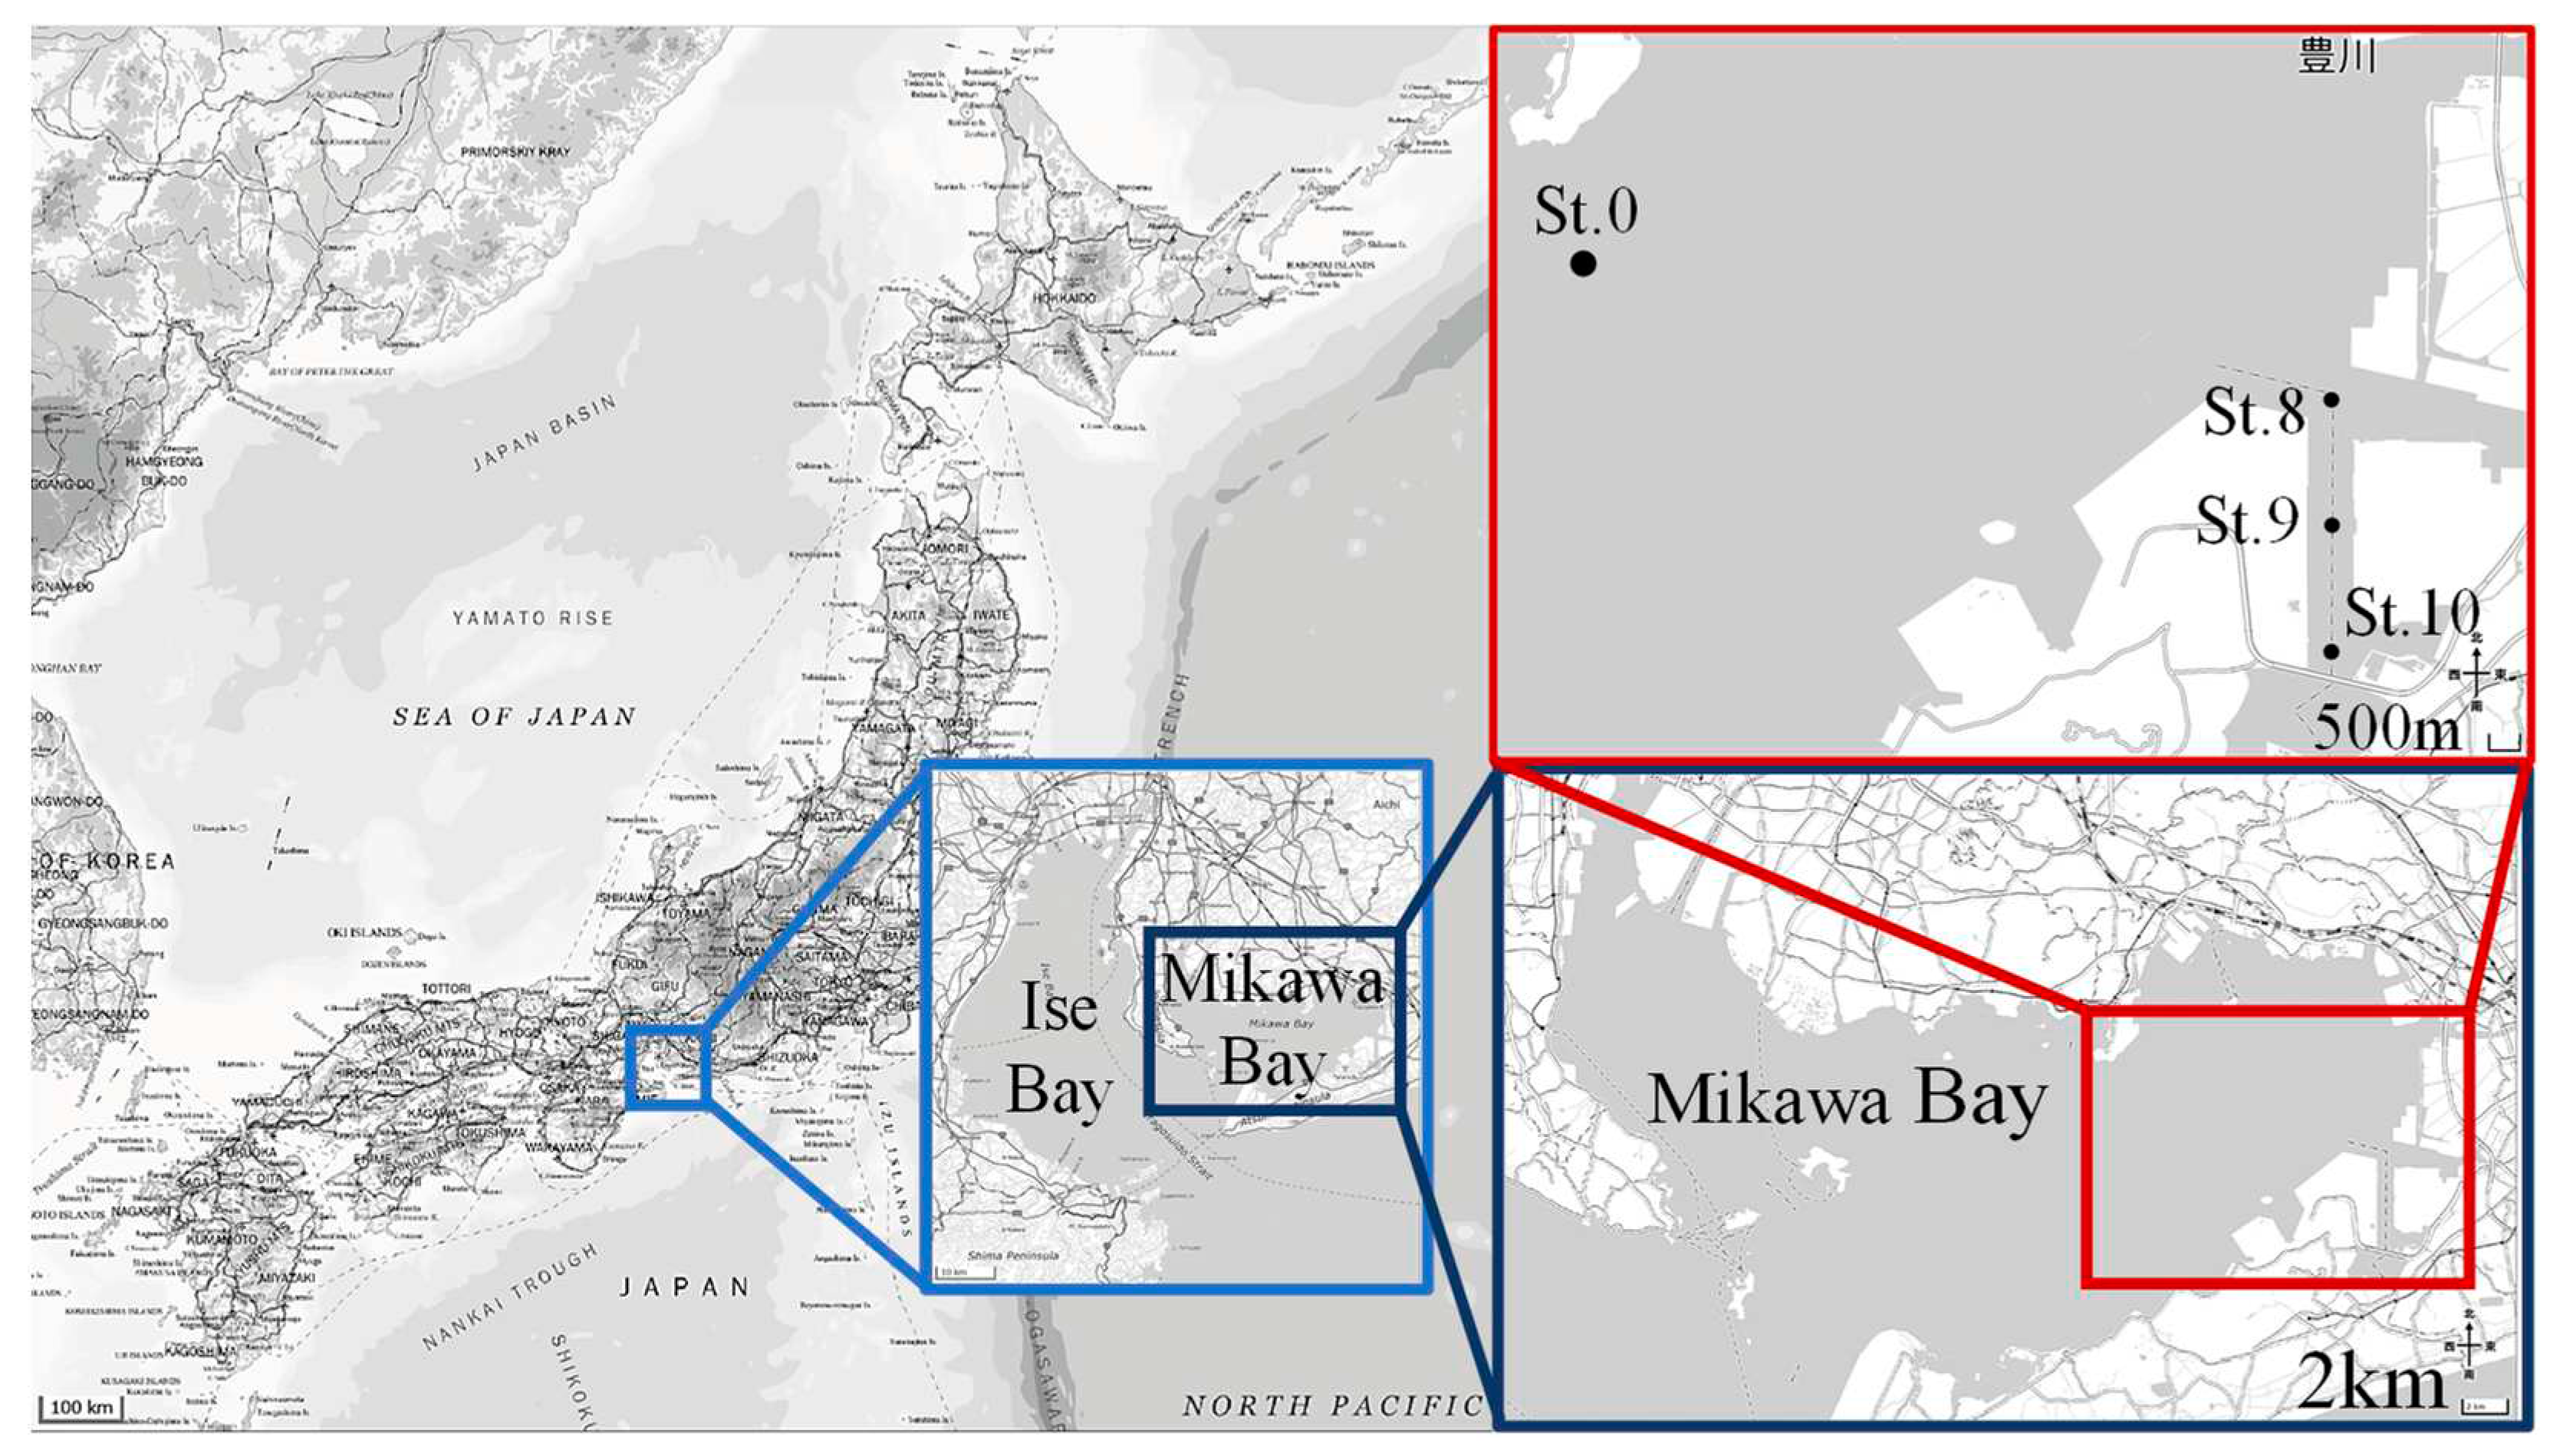
Figure 2.
Schematic of H2S release experiment.
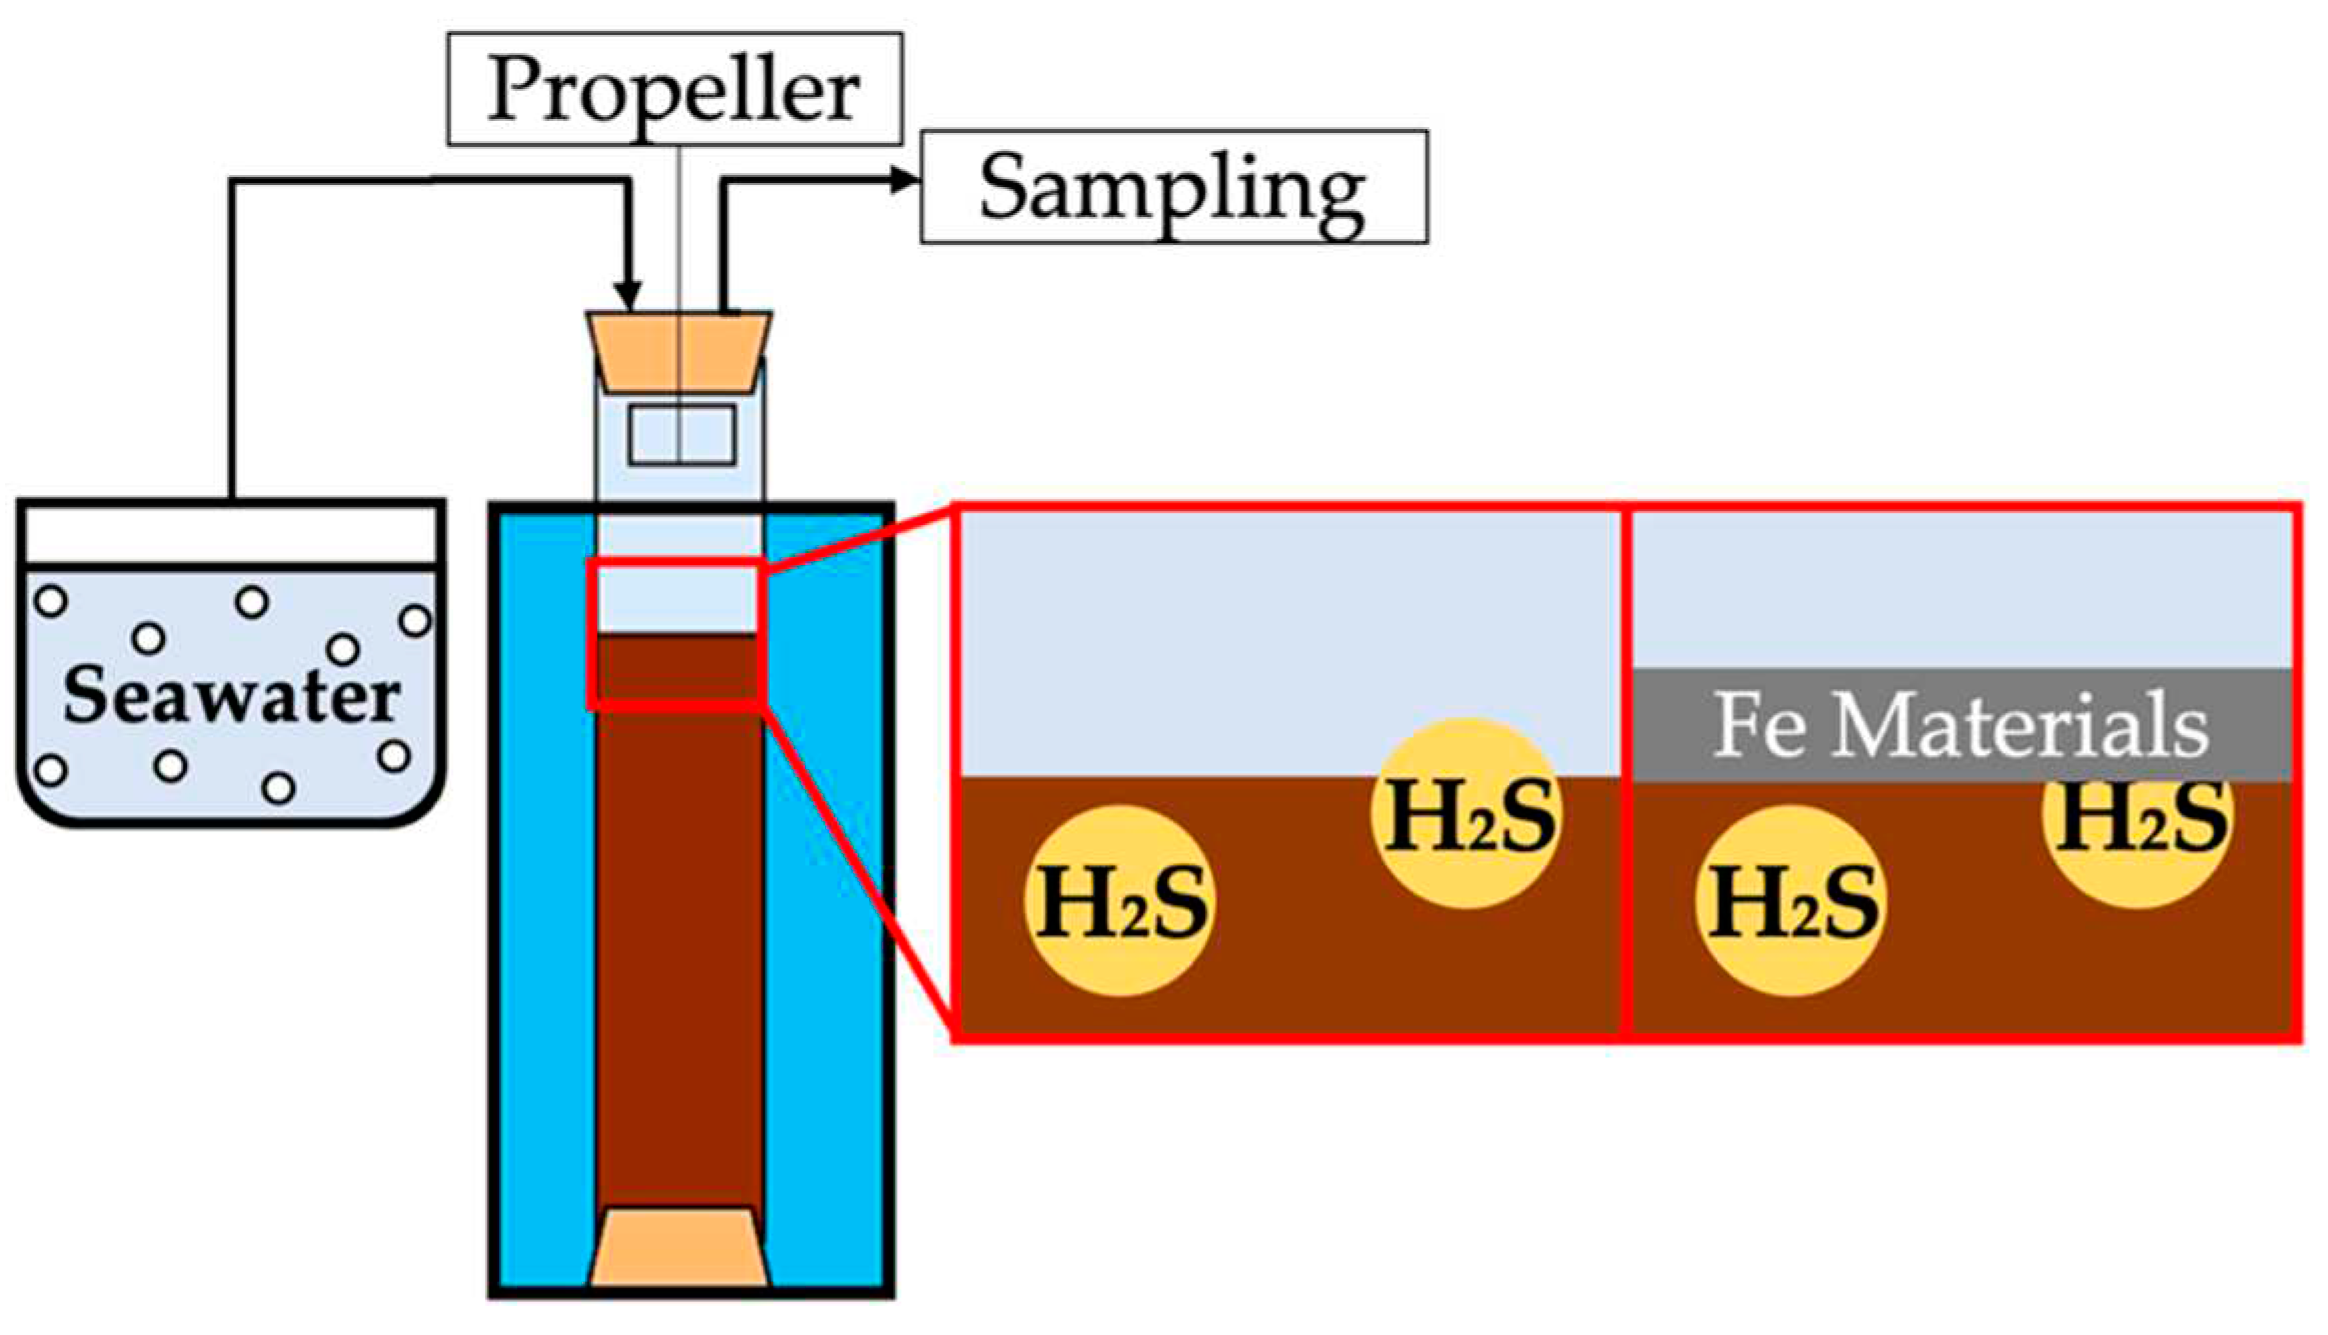
Figure 3.
Procedure for H2S production rate experiments.
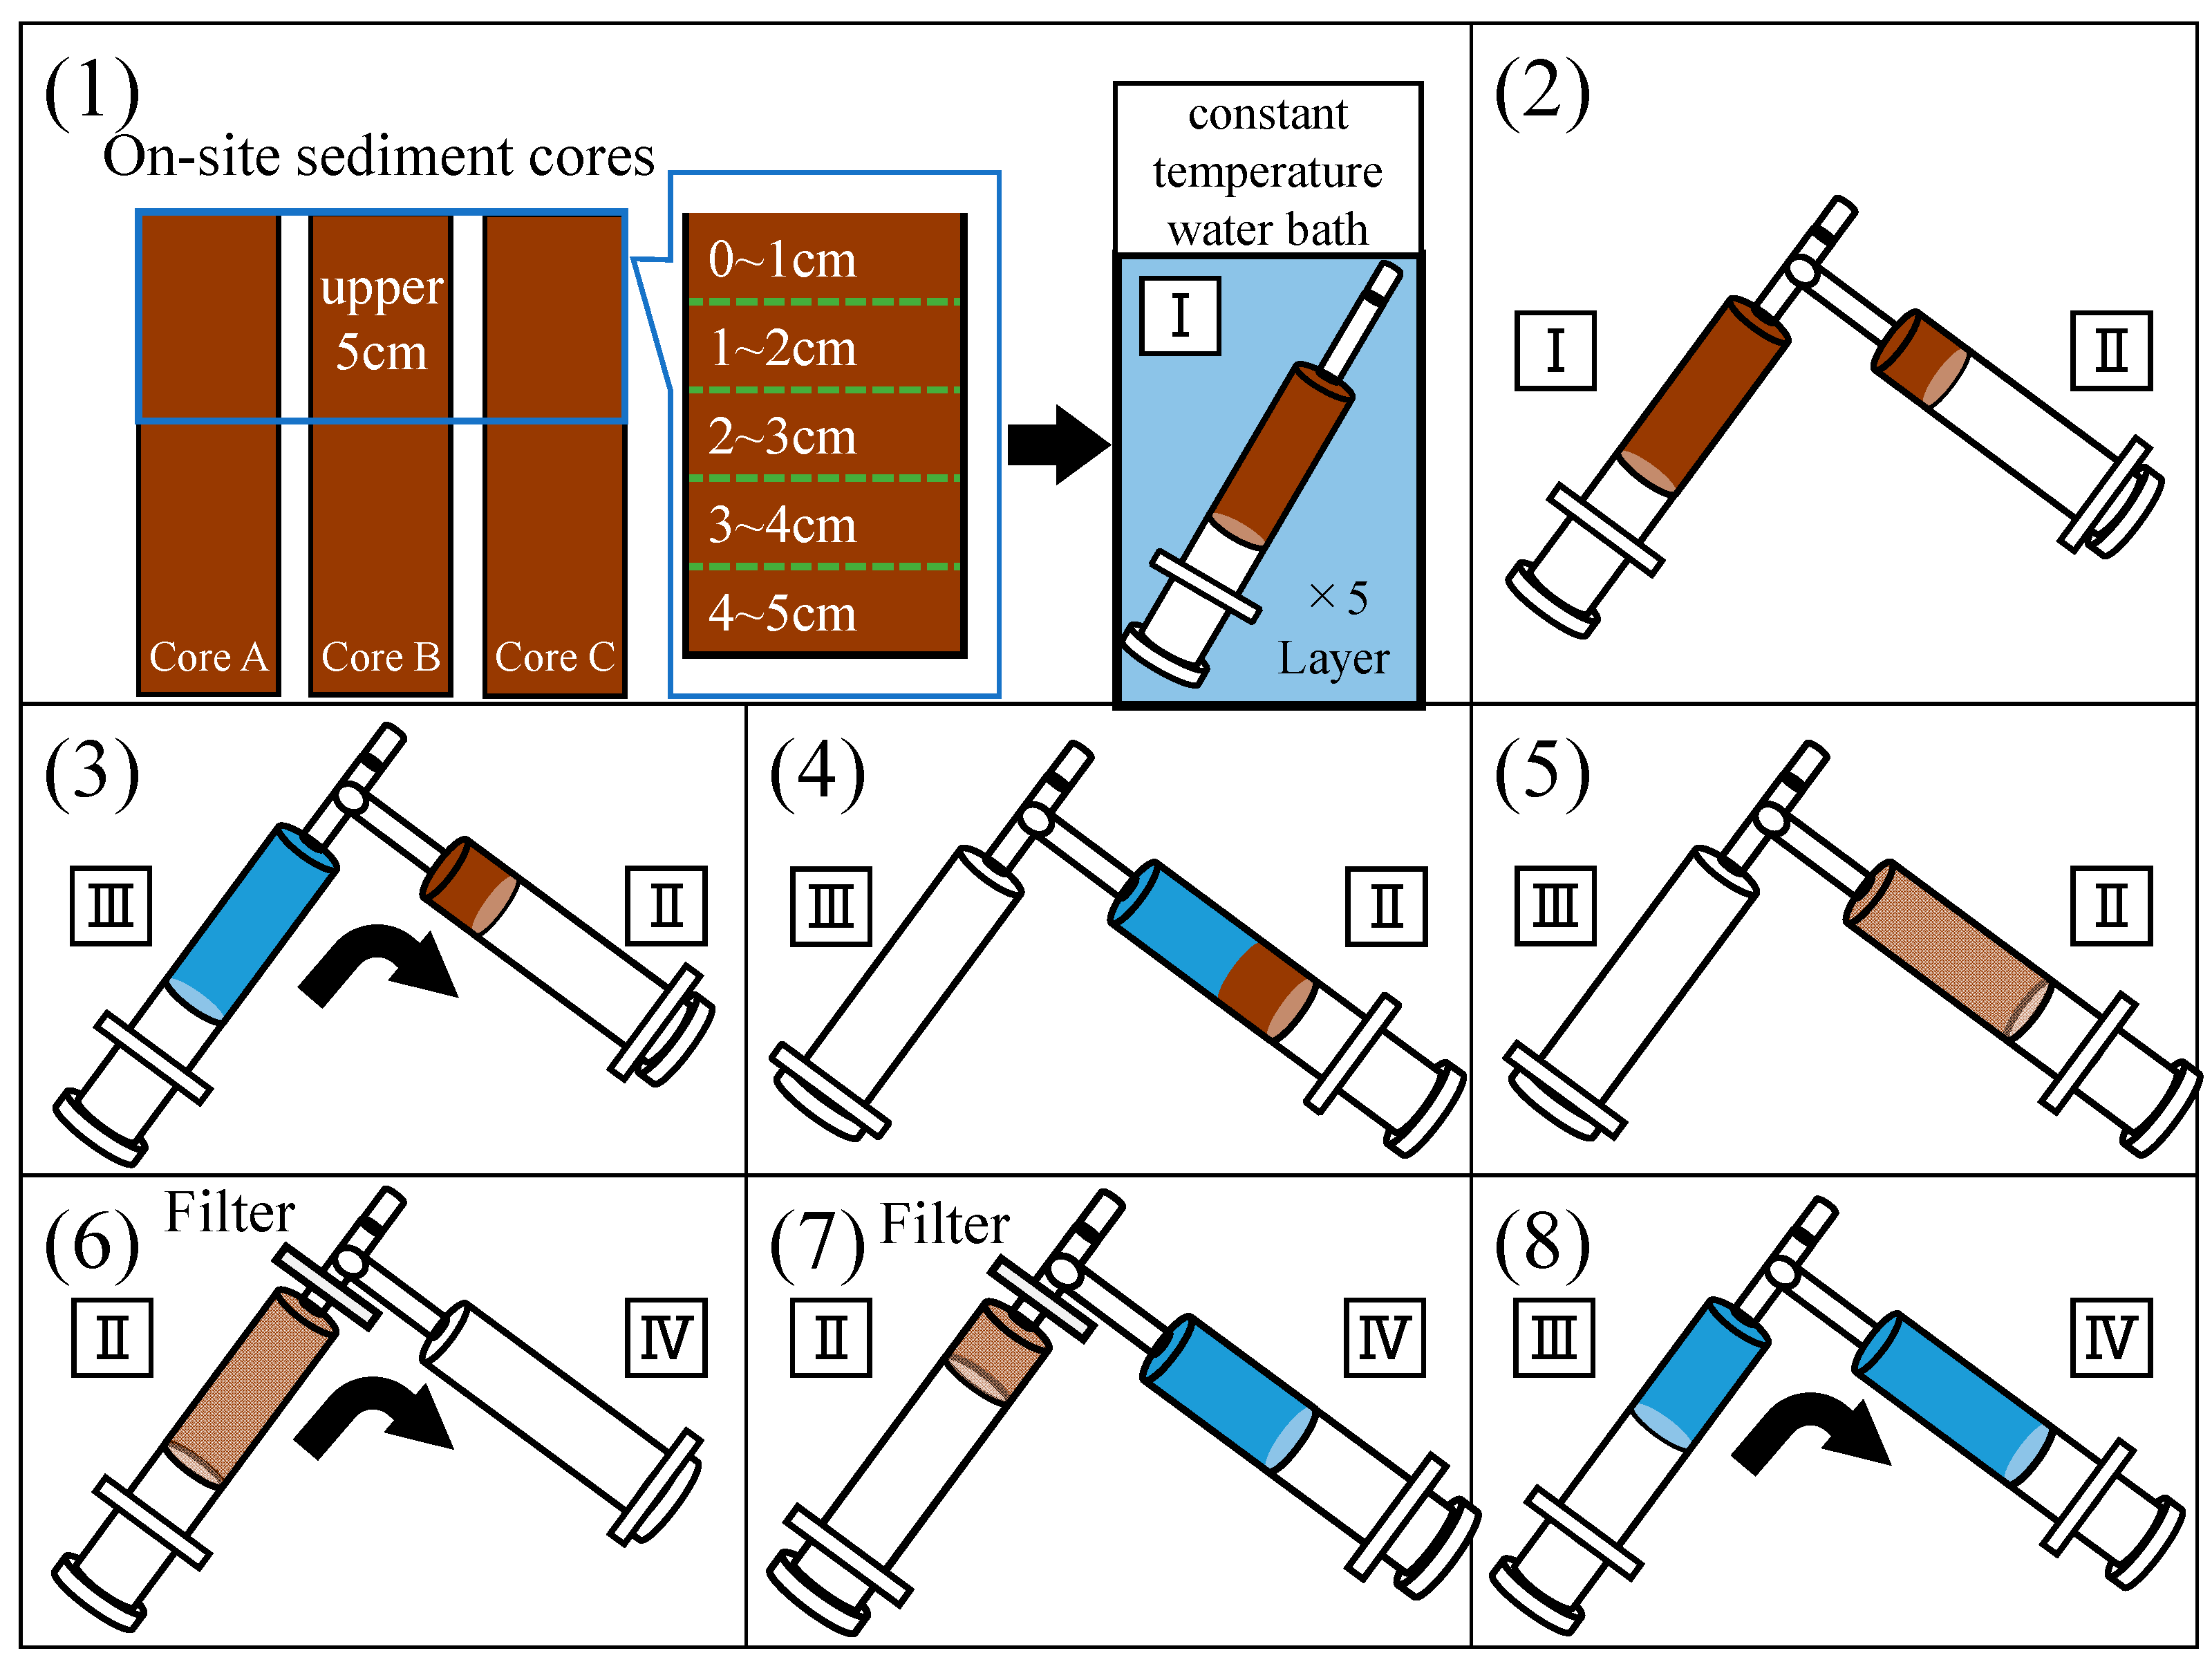
Figure 4.
Nutrient cycles in the model. R numbers correspond to Table 4. Substances surrounded by the solid line are particle and dashed line are dissolved. Green, red, blue, and gray colors of the reaction represents primary reactions, recovery of electron acceptors, interaction between outside the cycle (release to water or transform non-reaction state), and other secondary reactions, respectively.
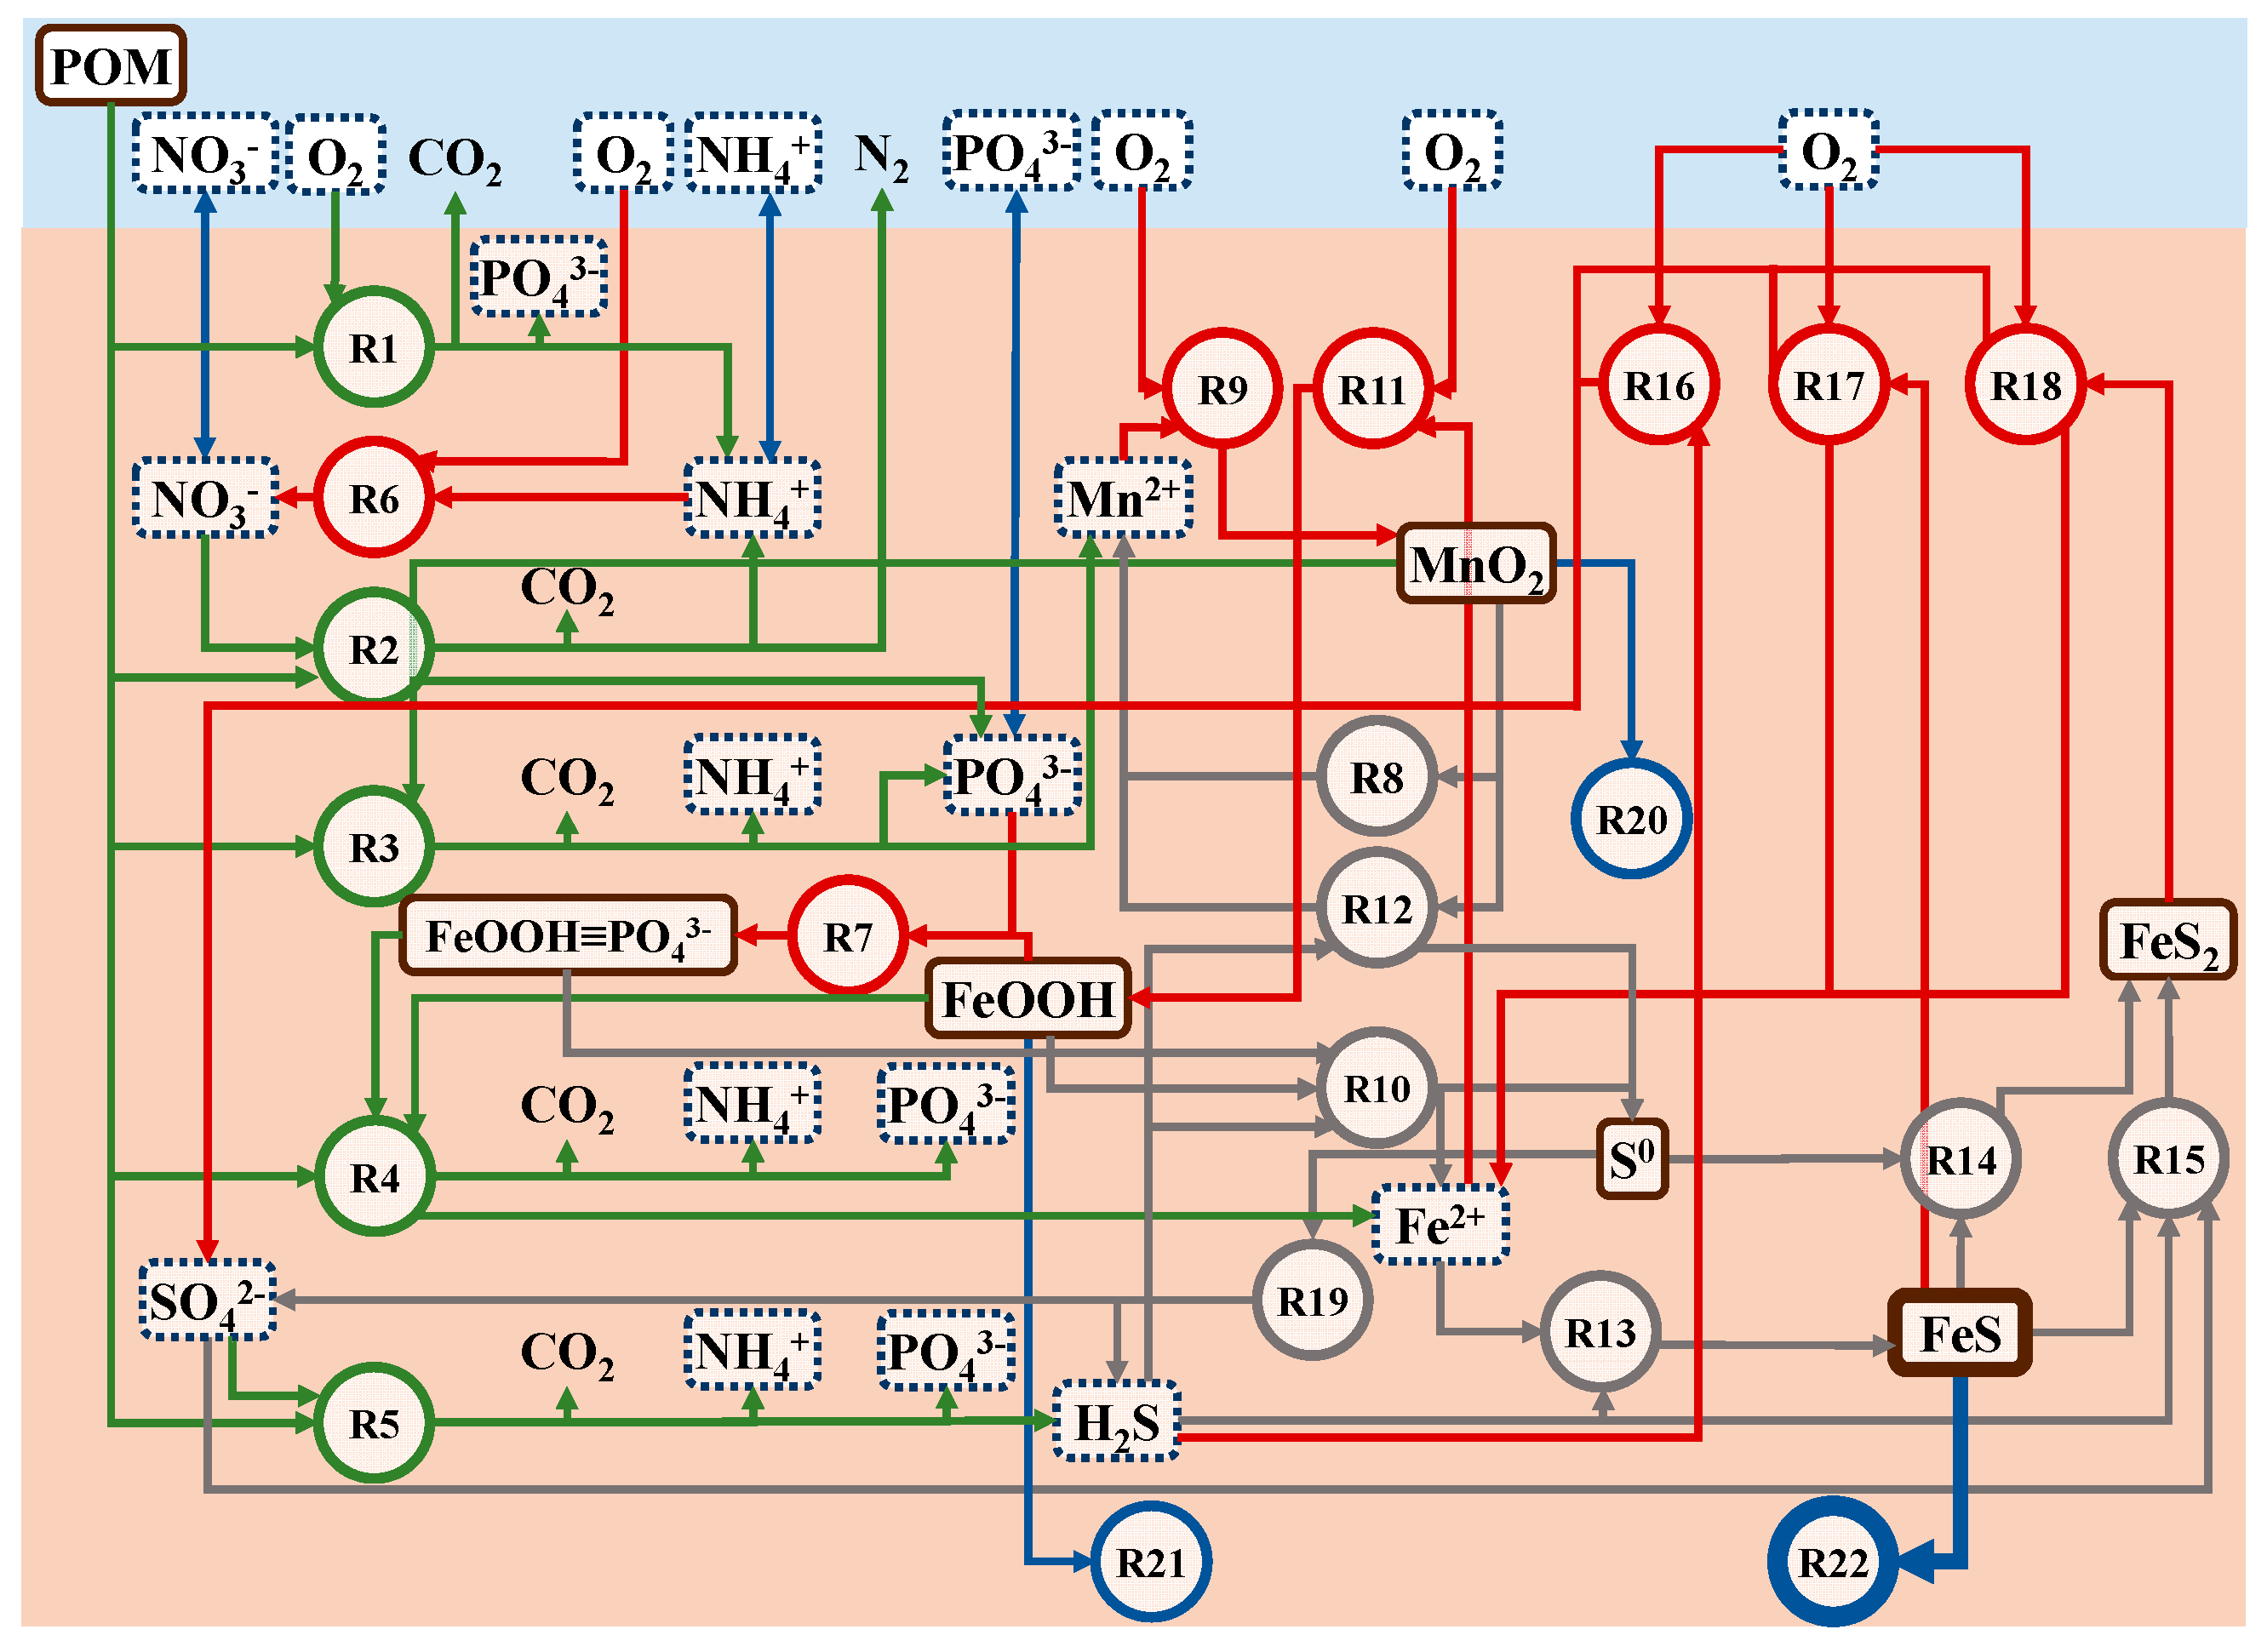
Figure 5.
Diagram of the relationship between boundary conditions and calculation steps.
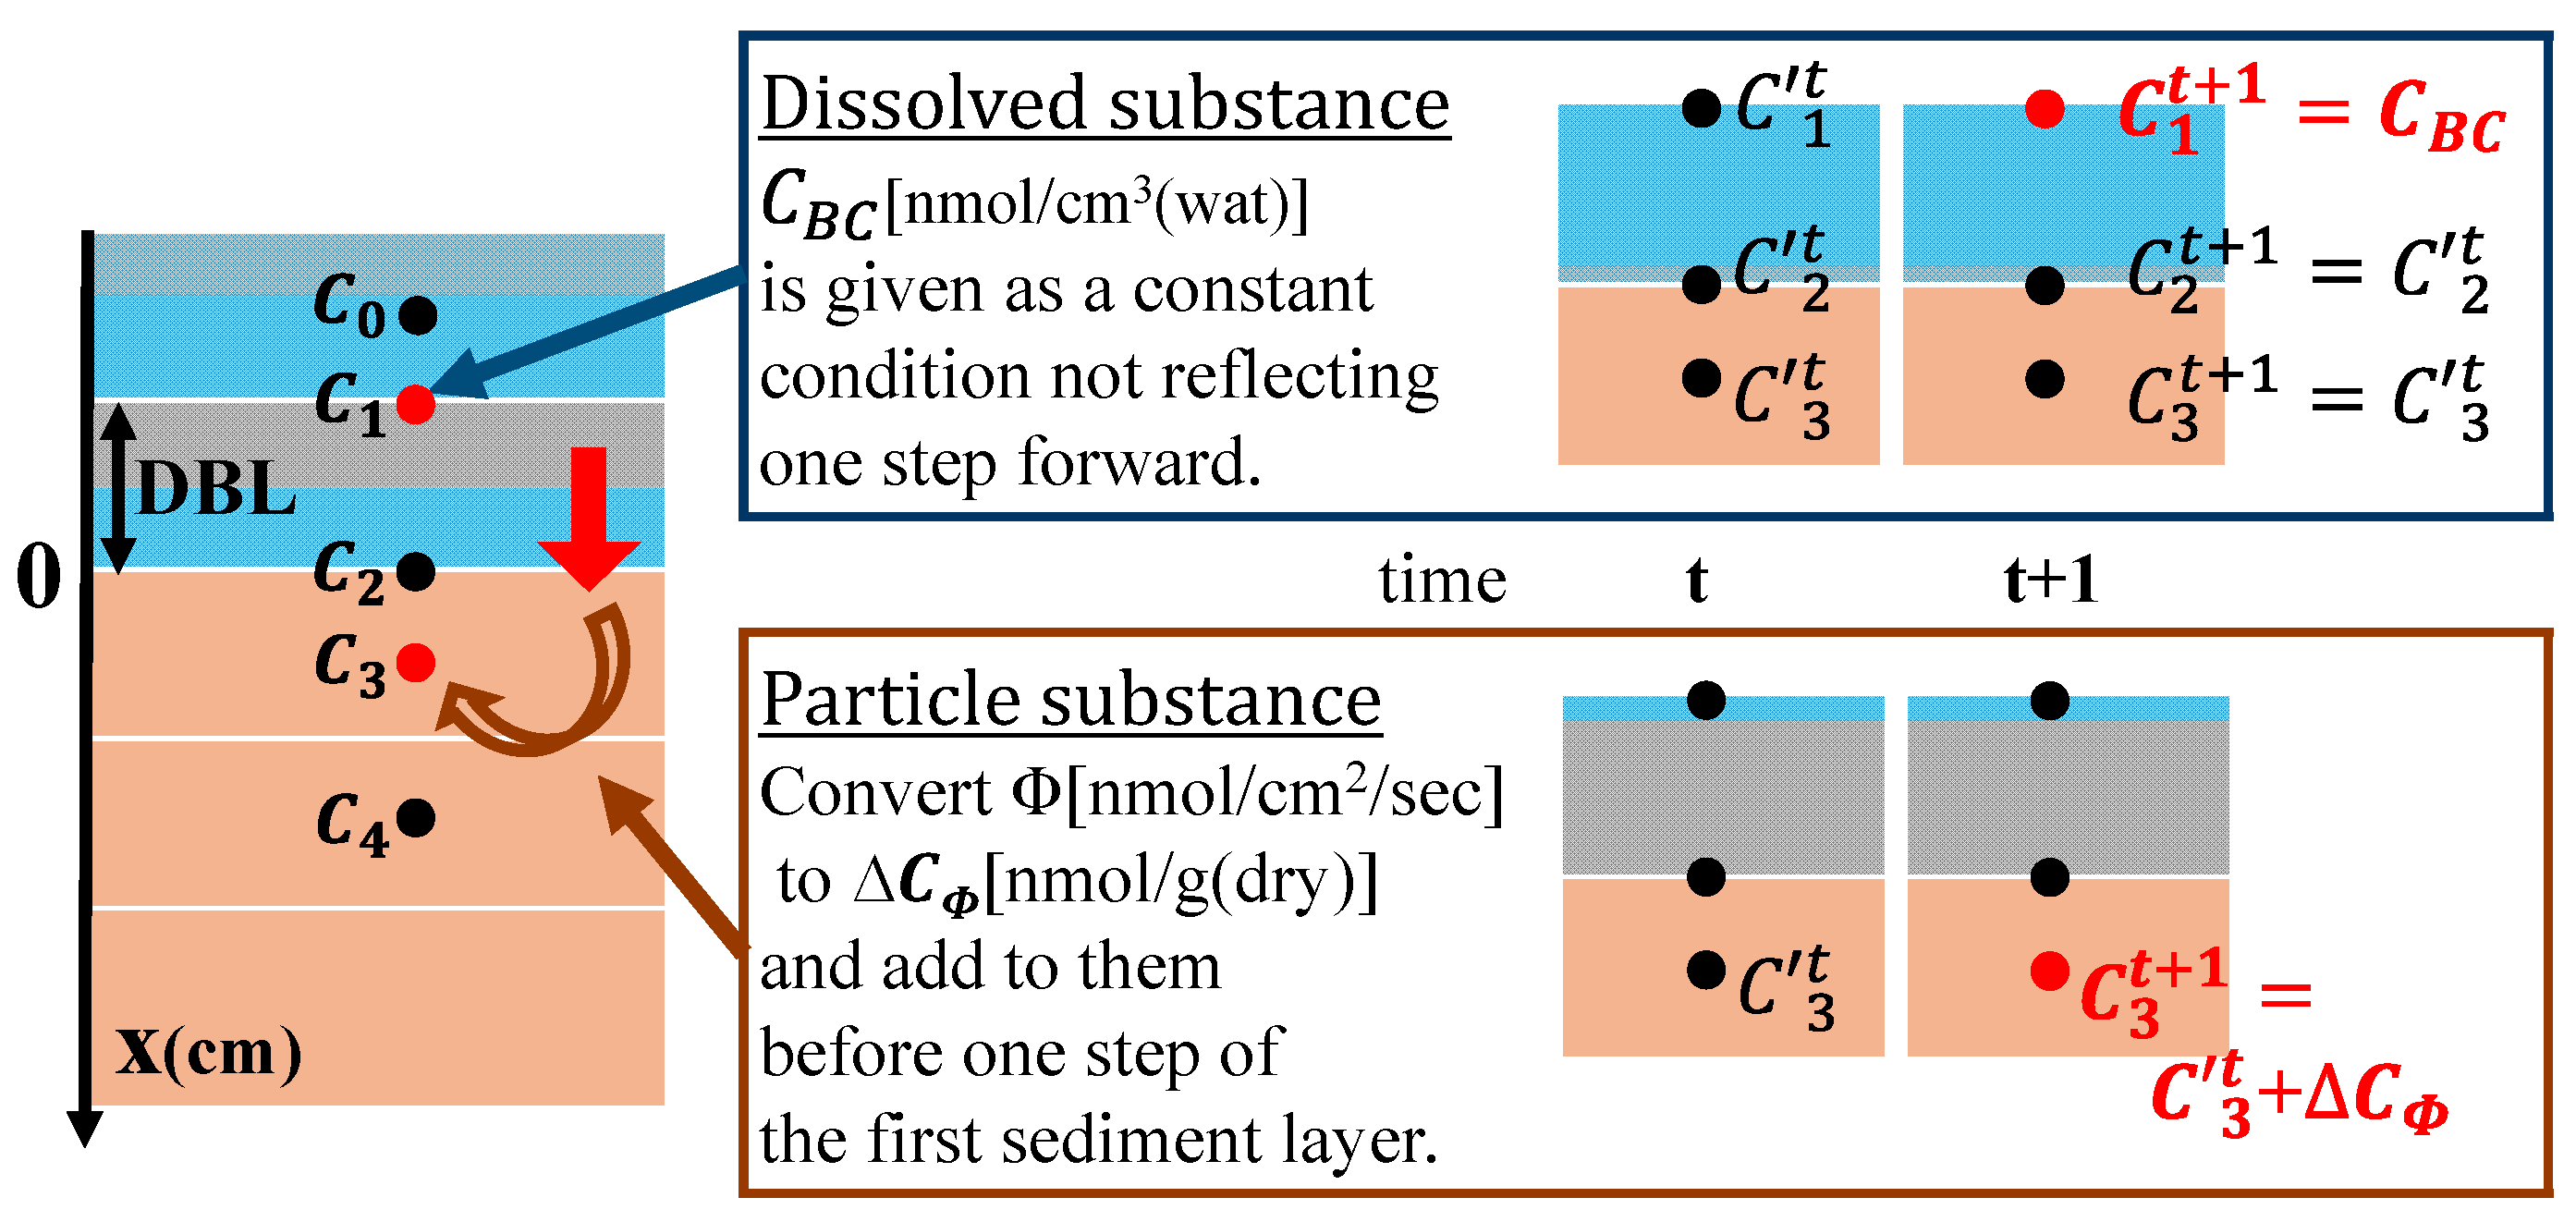
Figure 6.
Conditions for reproducing field observations. (a) Vertical distribution of porosity (Observation points correspond to those in Figure 1 and the average is calculated from all points); (b) Seasonal variations of boundary conditions.
Figure 6.
Conditions for reproducing field observations. (a) Vertical distribution of porosity (Observation points correspond to those in Figure 1 and the average is calculated from all points); (b) Seasonal variations of boundary conditions.
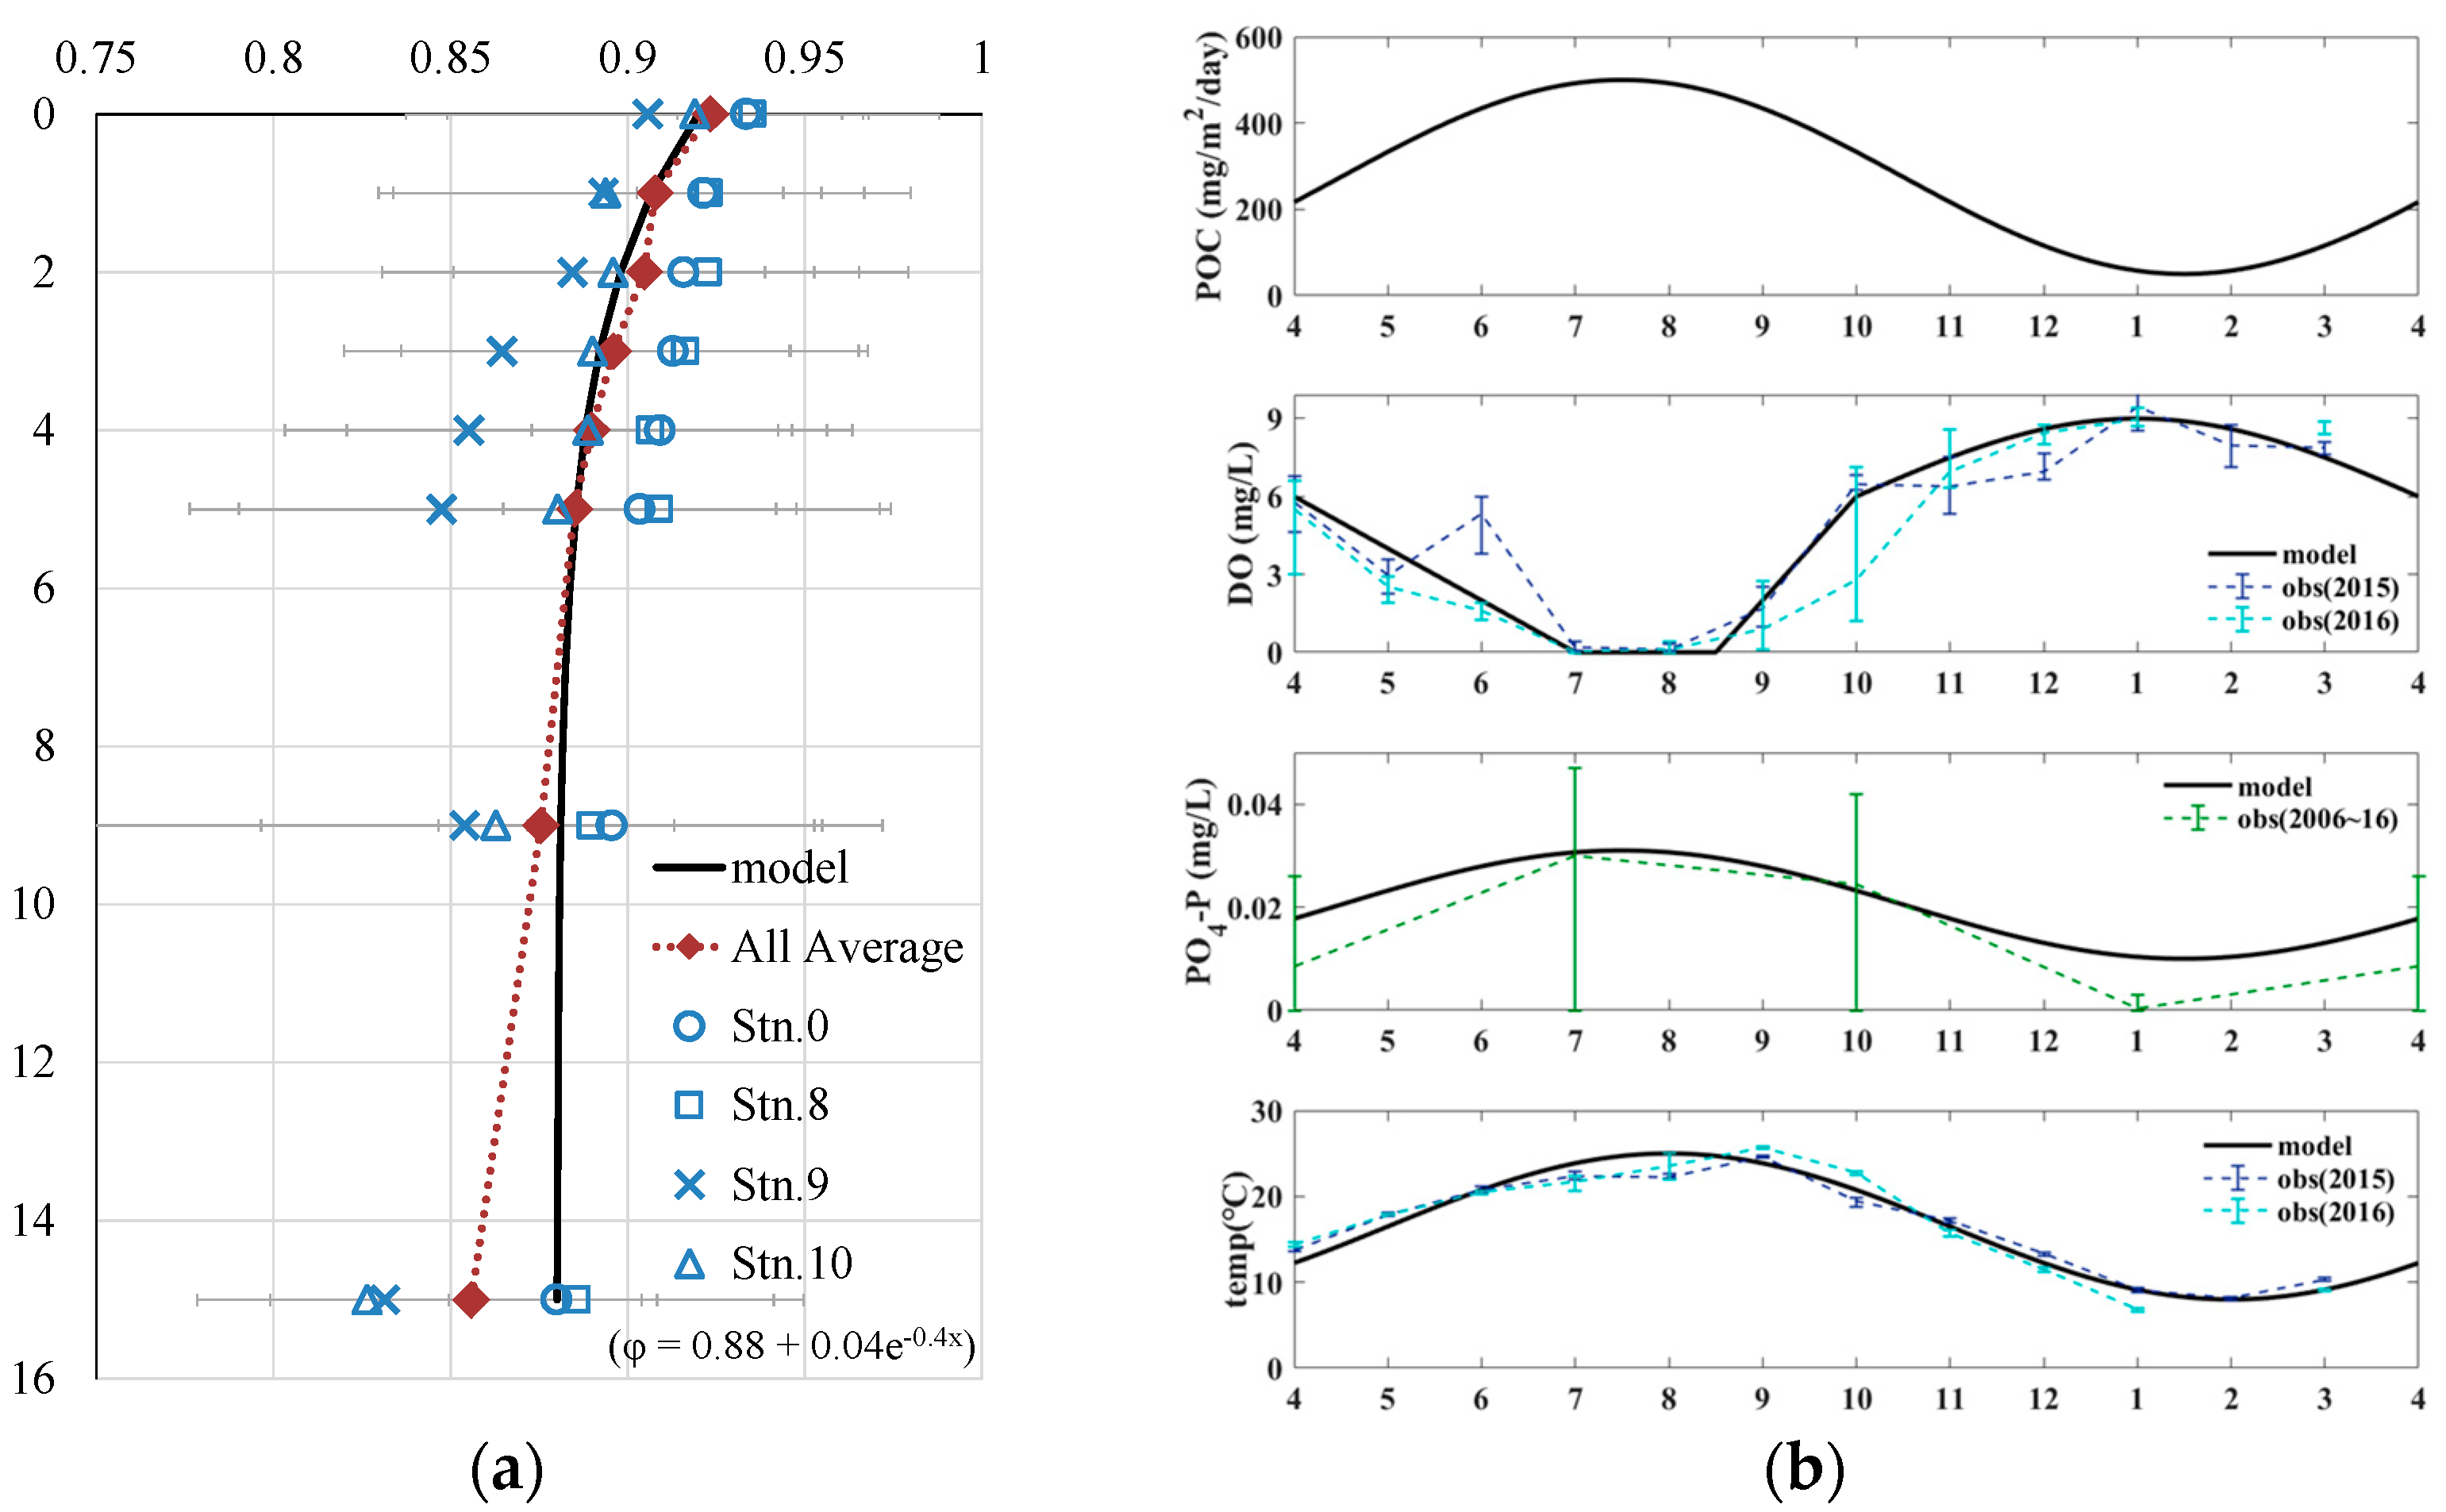
Figure 7.
Seasonal variations of the vertical distribution on major chemical concentrations. Observation points correspond to those in Figure 1.
Figure 7.
Seasonal variations of the vertical distribution on major chemical concentrations. Observation points correspond to those in Figure 1.
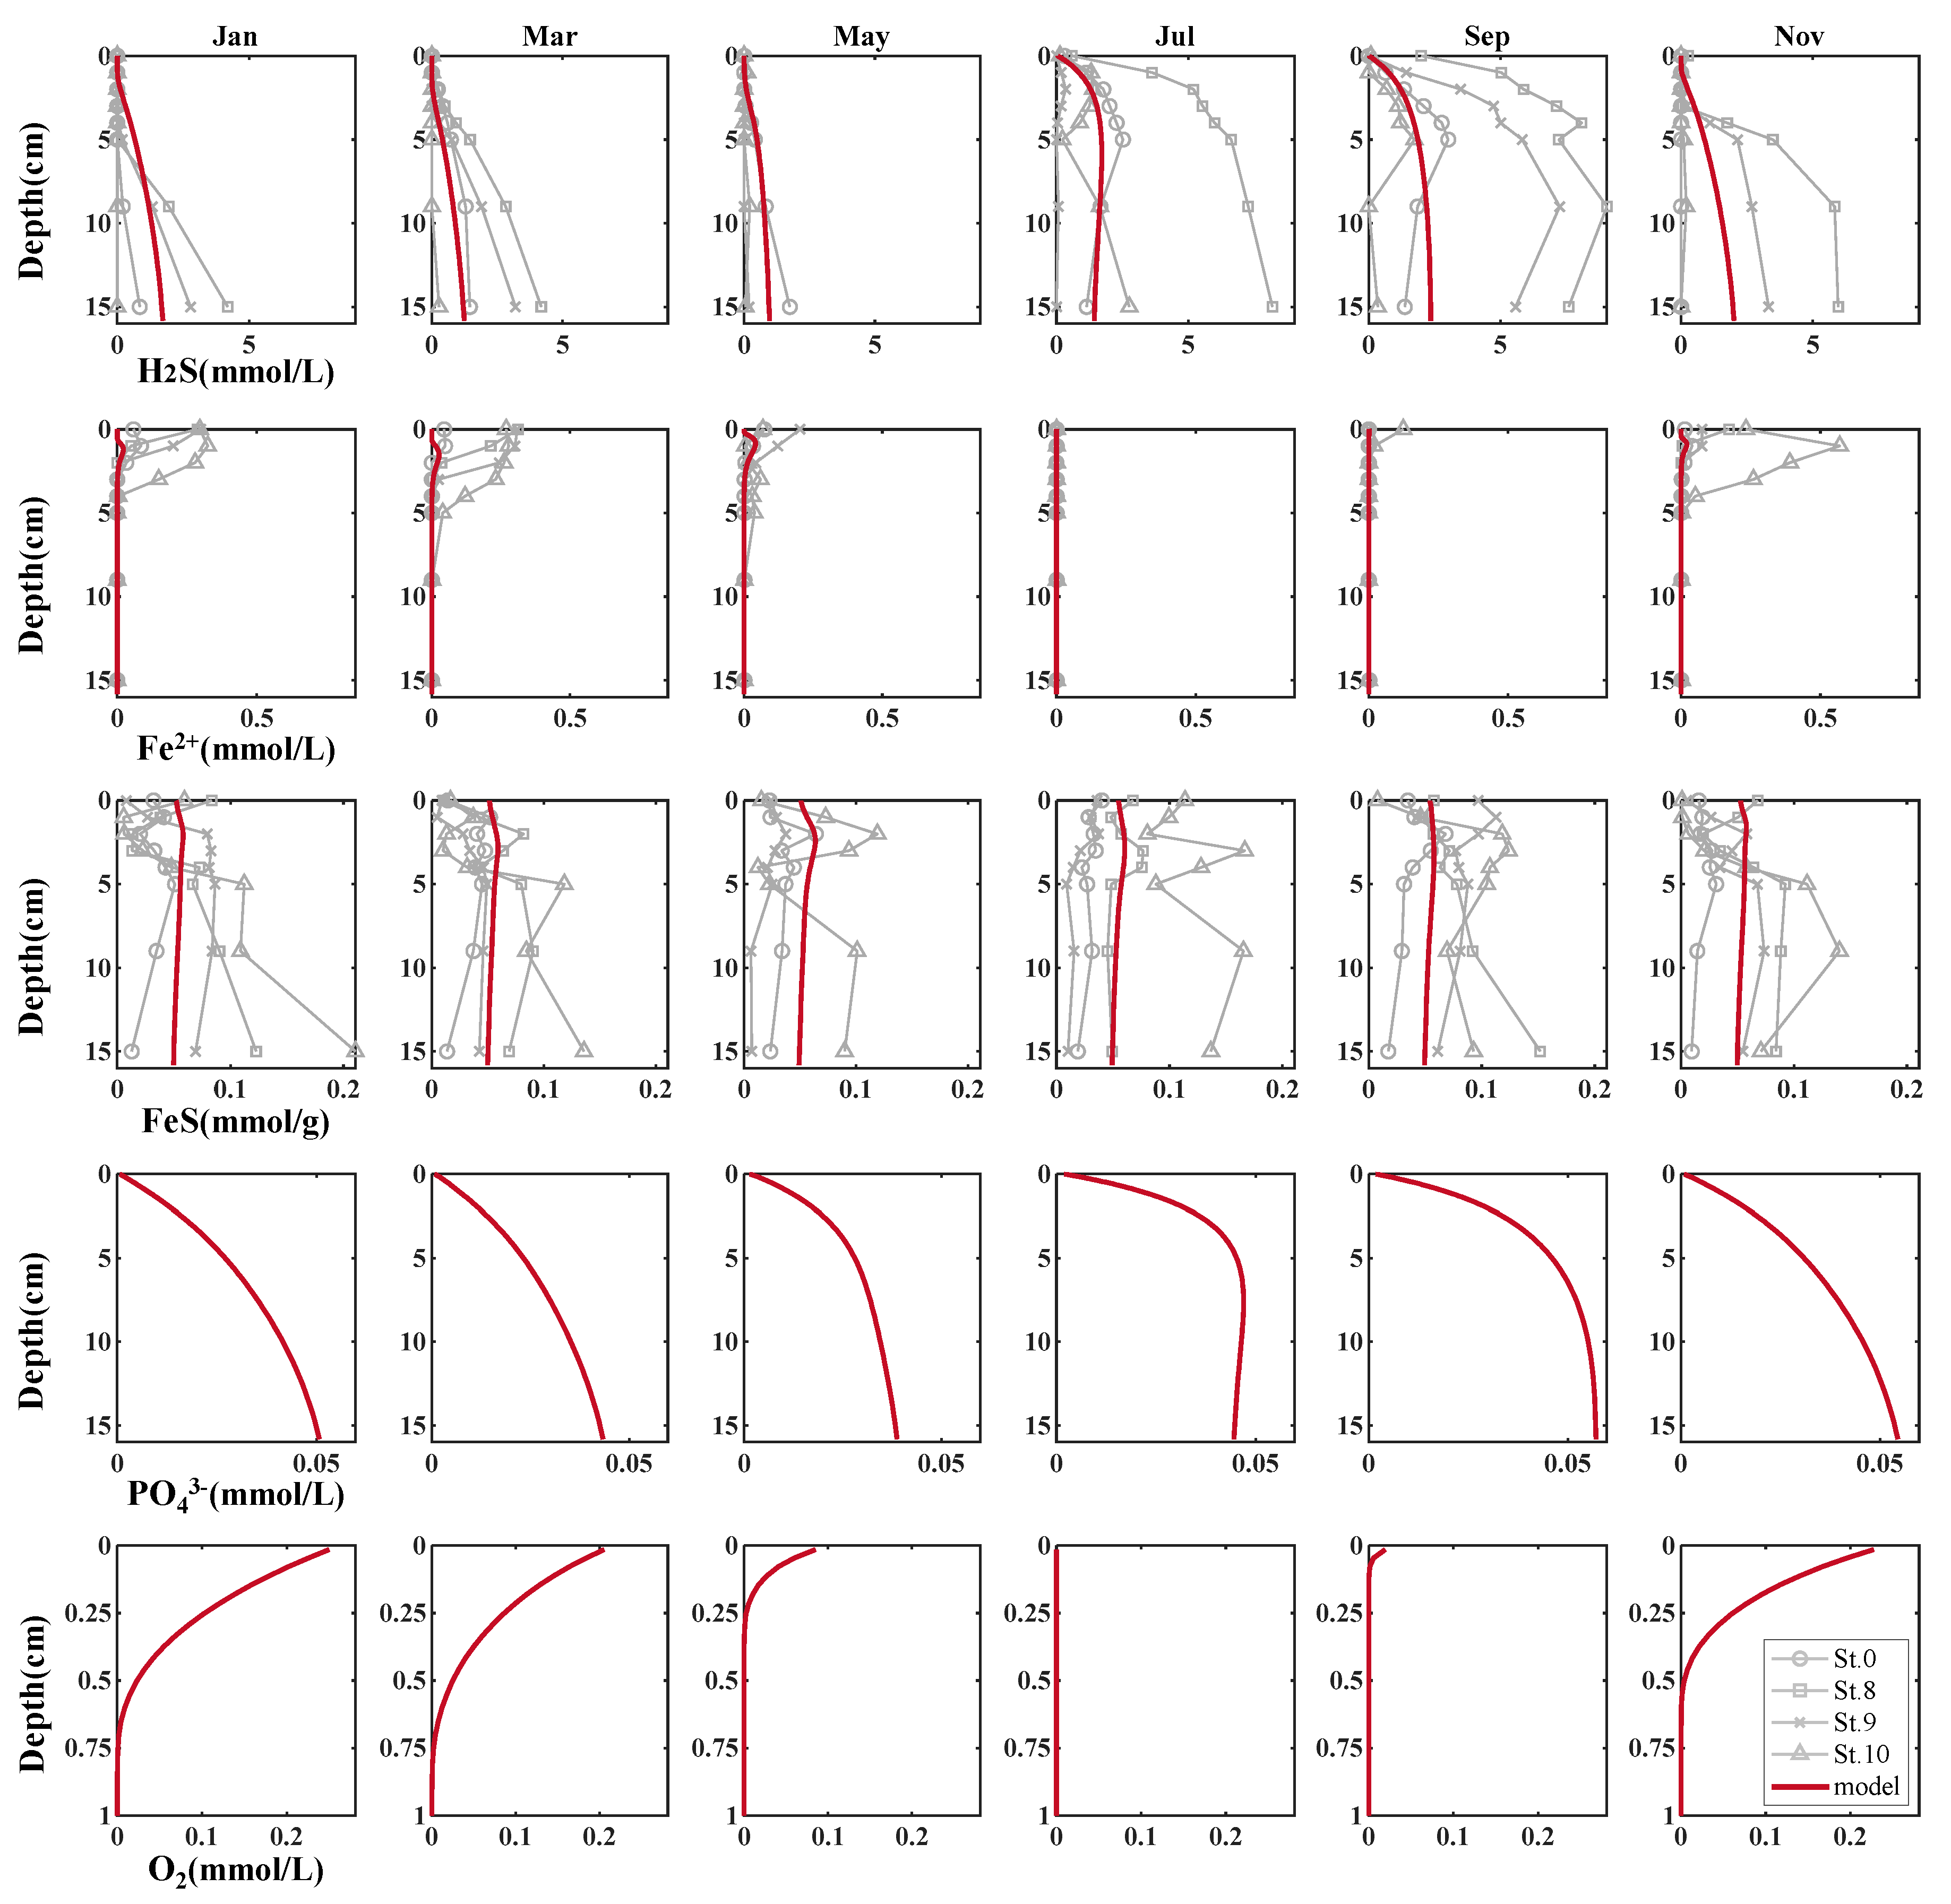
Figure 8.
Reproduction of time variations of H2S concentration in the water above the cores. (a) June; (b) July; (c) August; and (d) September.
Figure 8.
Reproduction of time variations of H2S concentration in the water above the cores. (a) June; (b) July; (c) August; and (d) September.
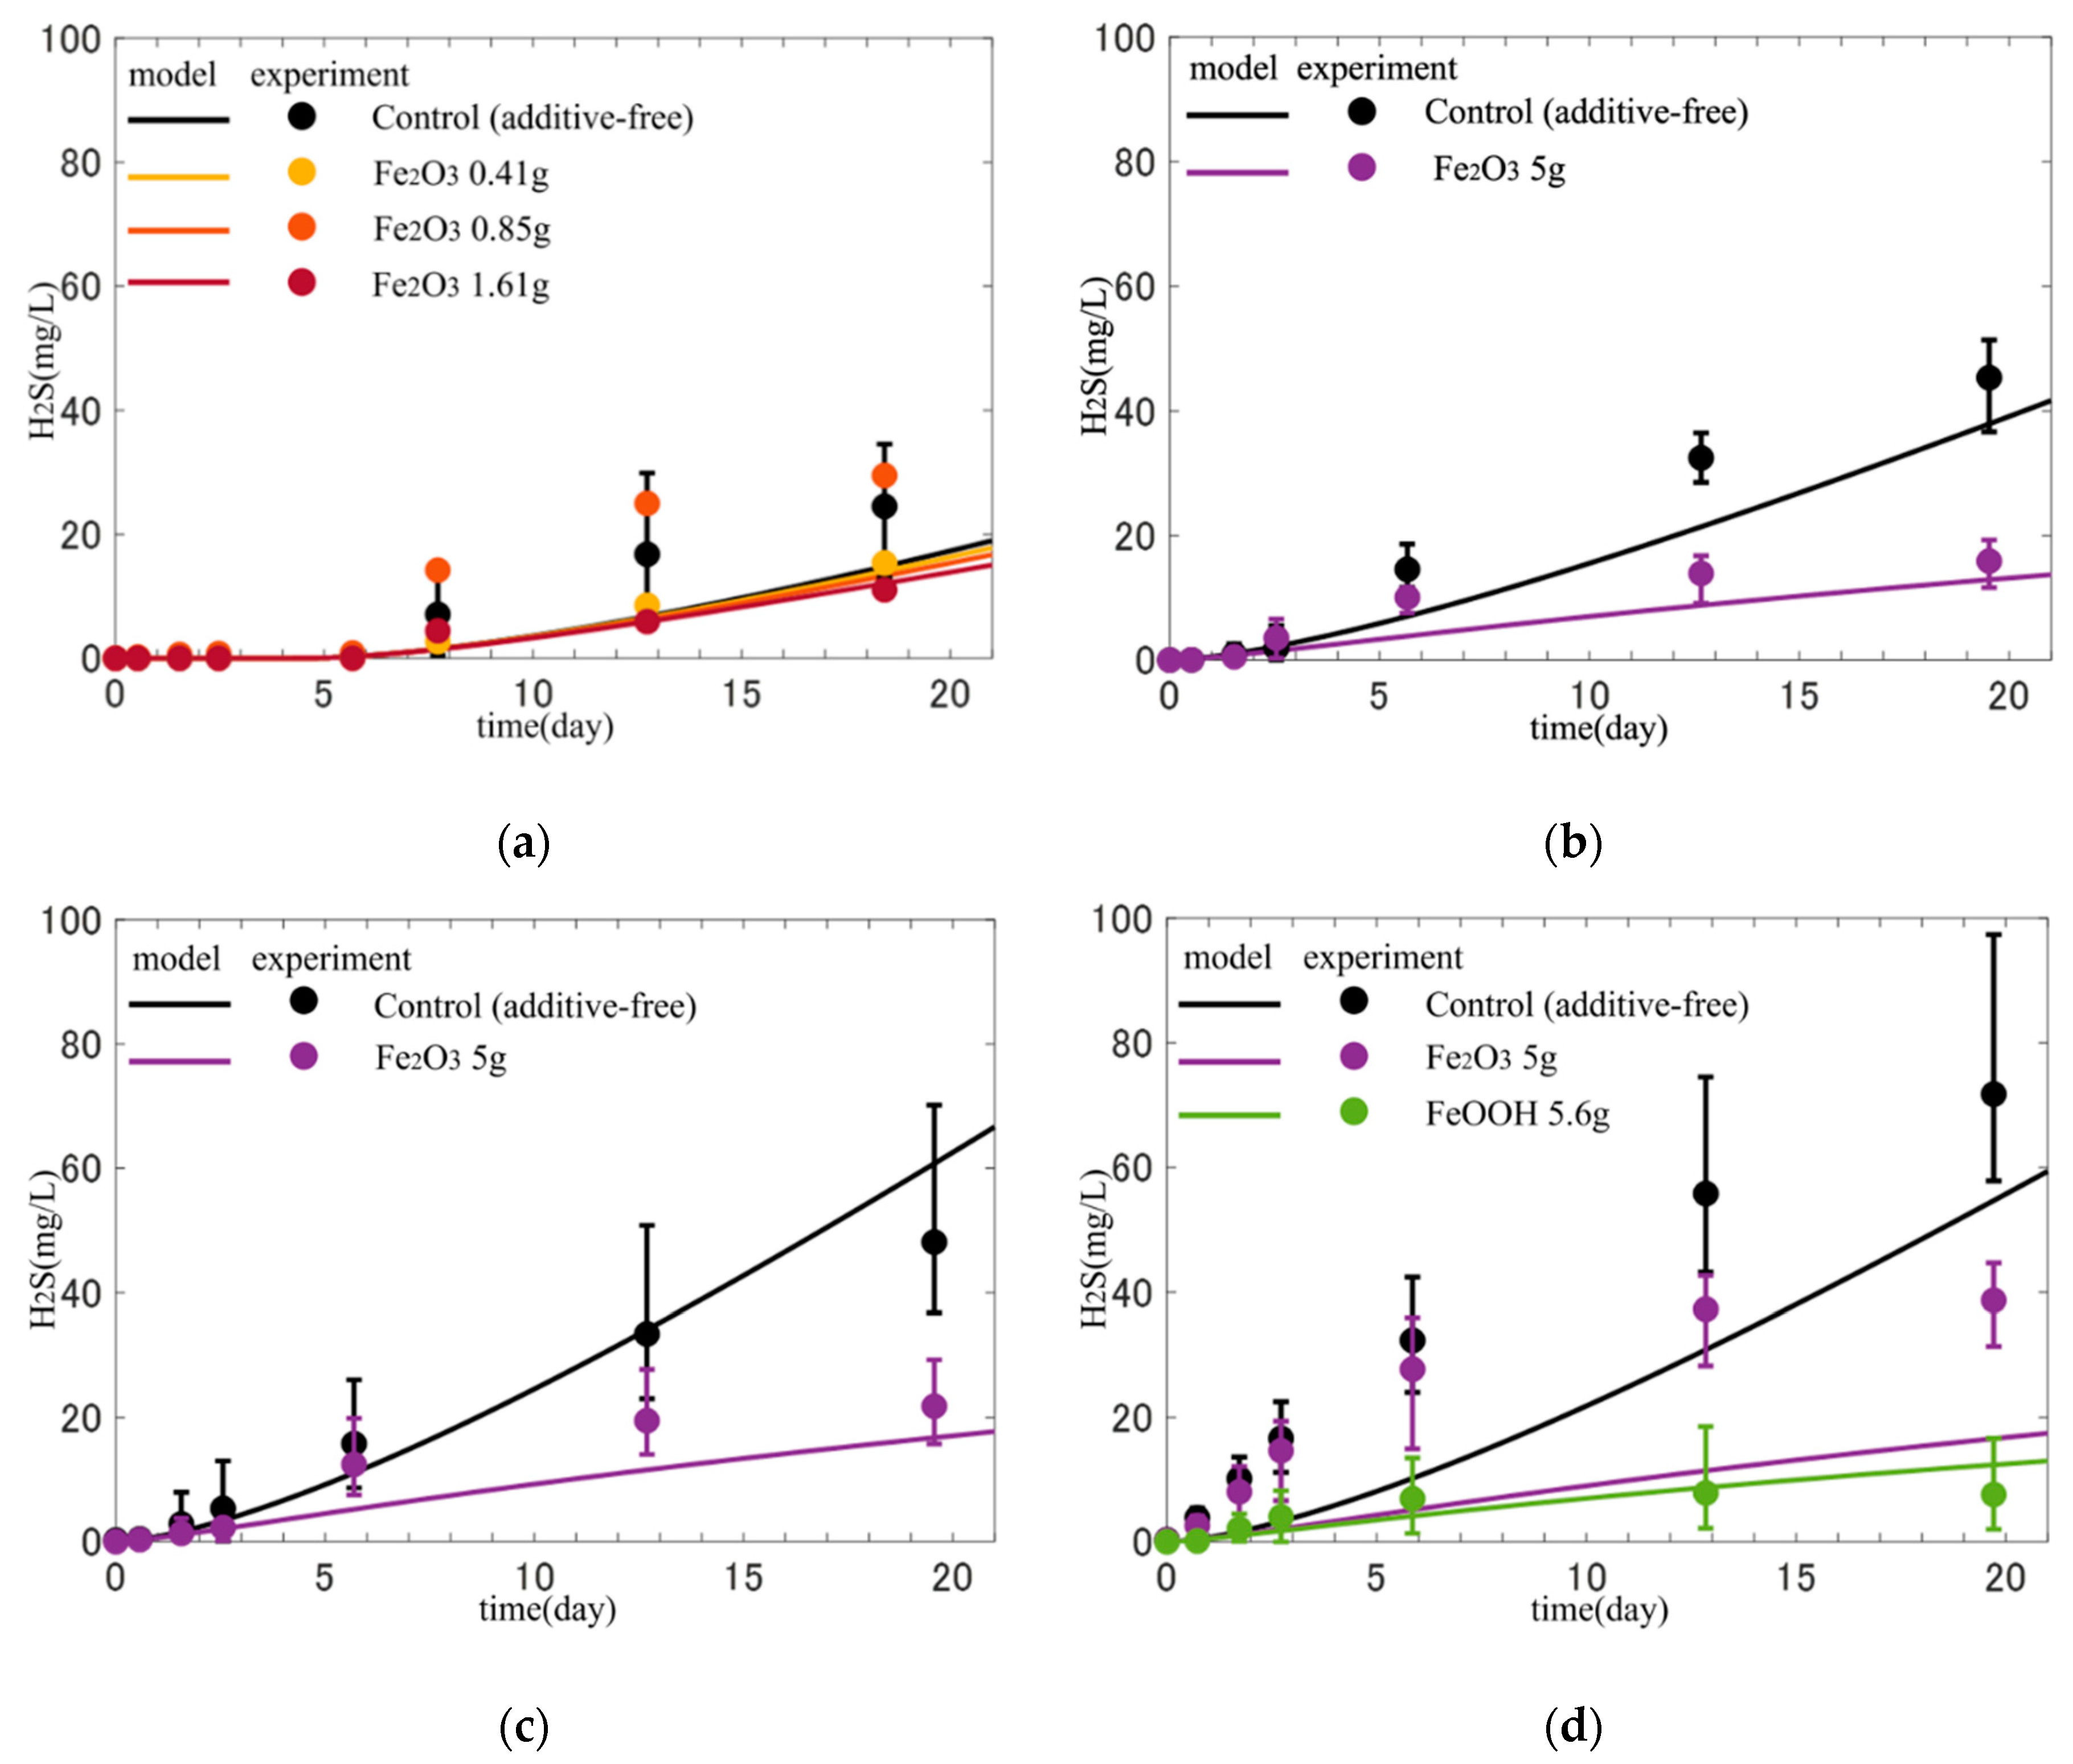
Figure 9.
Initial condition of electron acceptors.
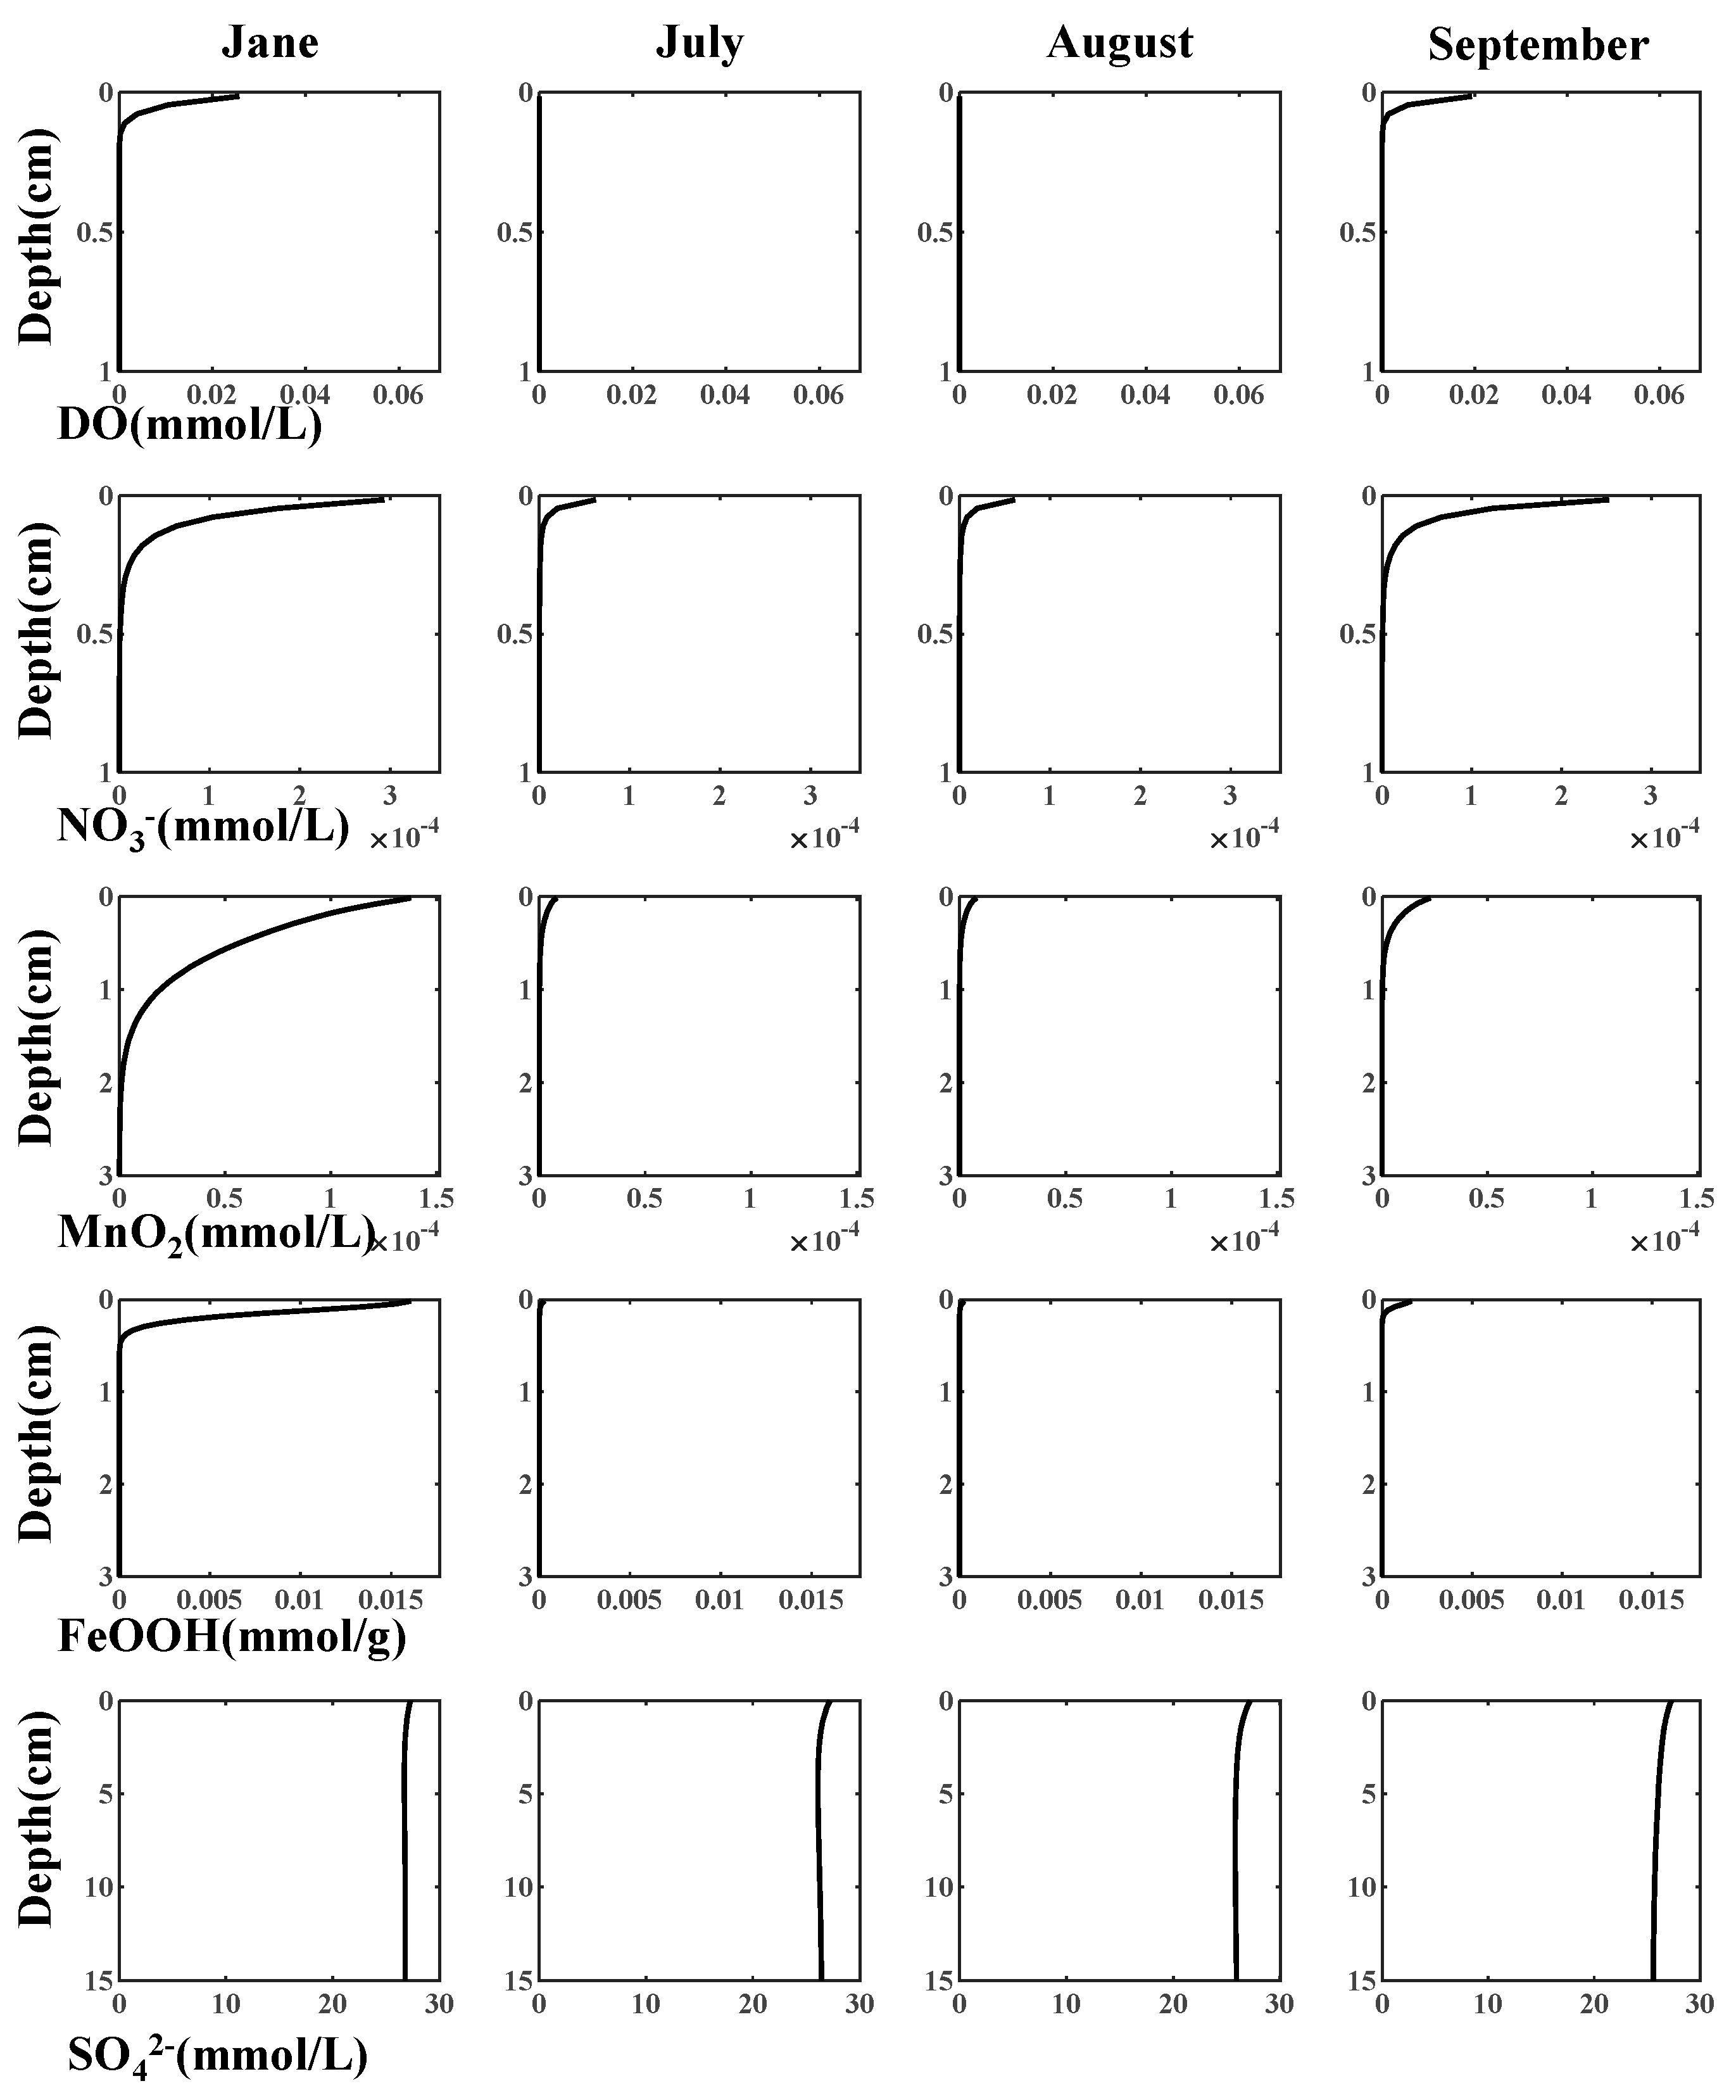
Figure 10.
Experimental results obtained in July (a, b) and August (c, d). Error ranges are due to cores, and the dots or bar indicate average. (a, c) Time variations of H2S (mg/L) in each layer; (b, d) H2S (mg/L/d) in each layer.
Figure 10.
Experimental results obtained in July (a, b) and August (c, d). Error ranges are due to cores, and the dots or bar indicate average. (a, c) Time variations of H2S (mg/L) in each layer; (b, d) H2S (mg/L/d) in each layer.
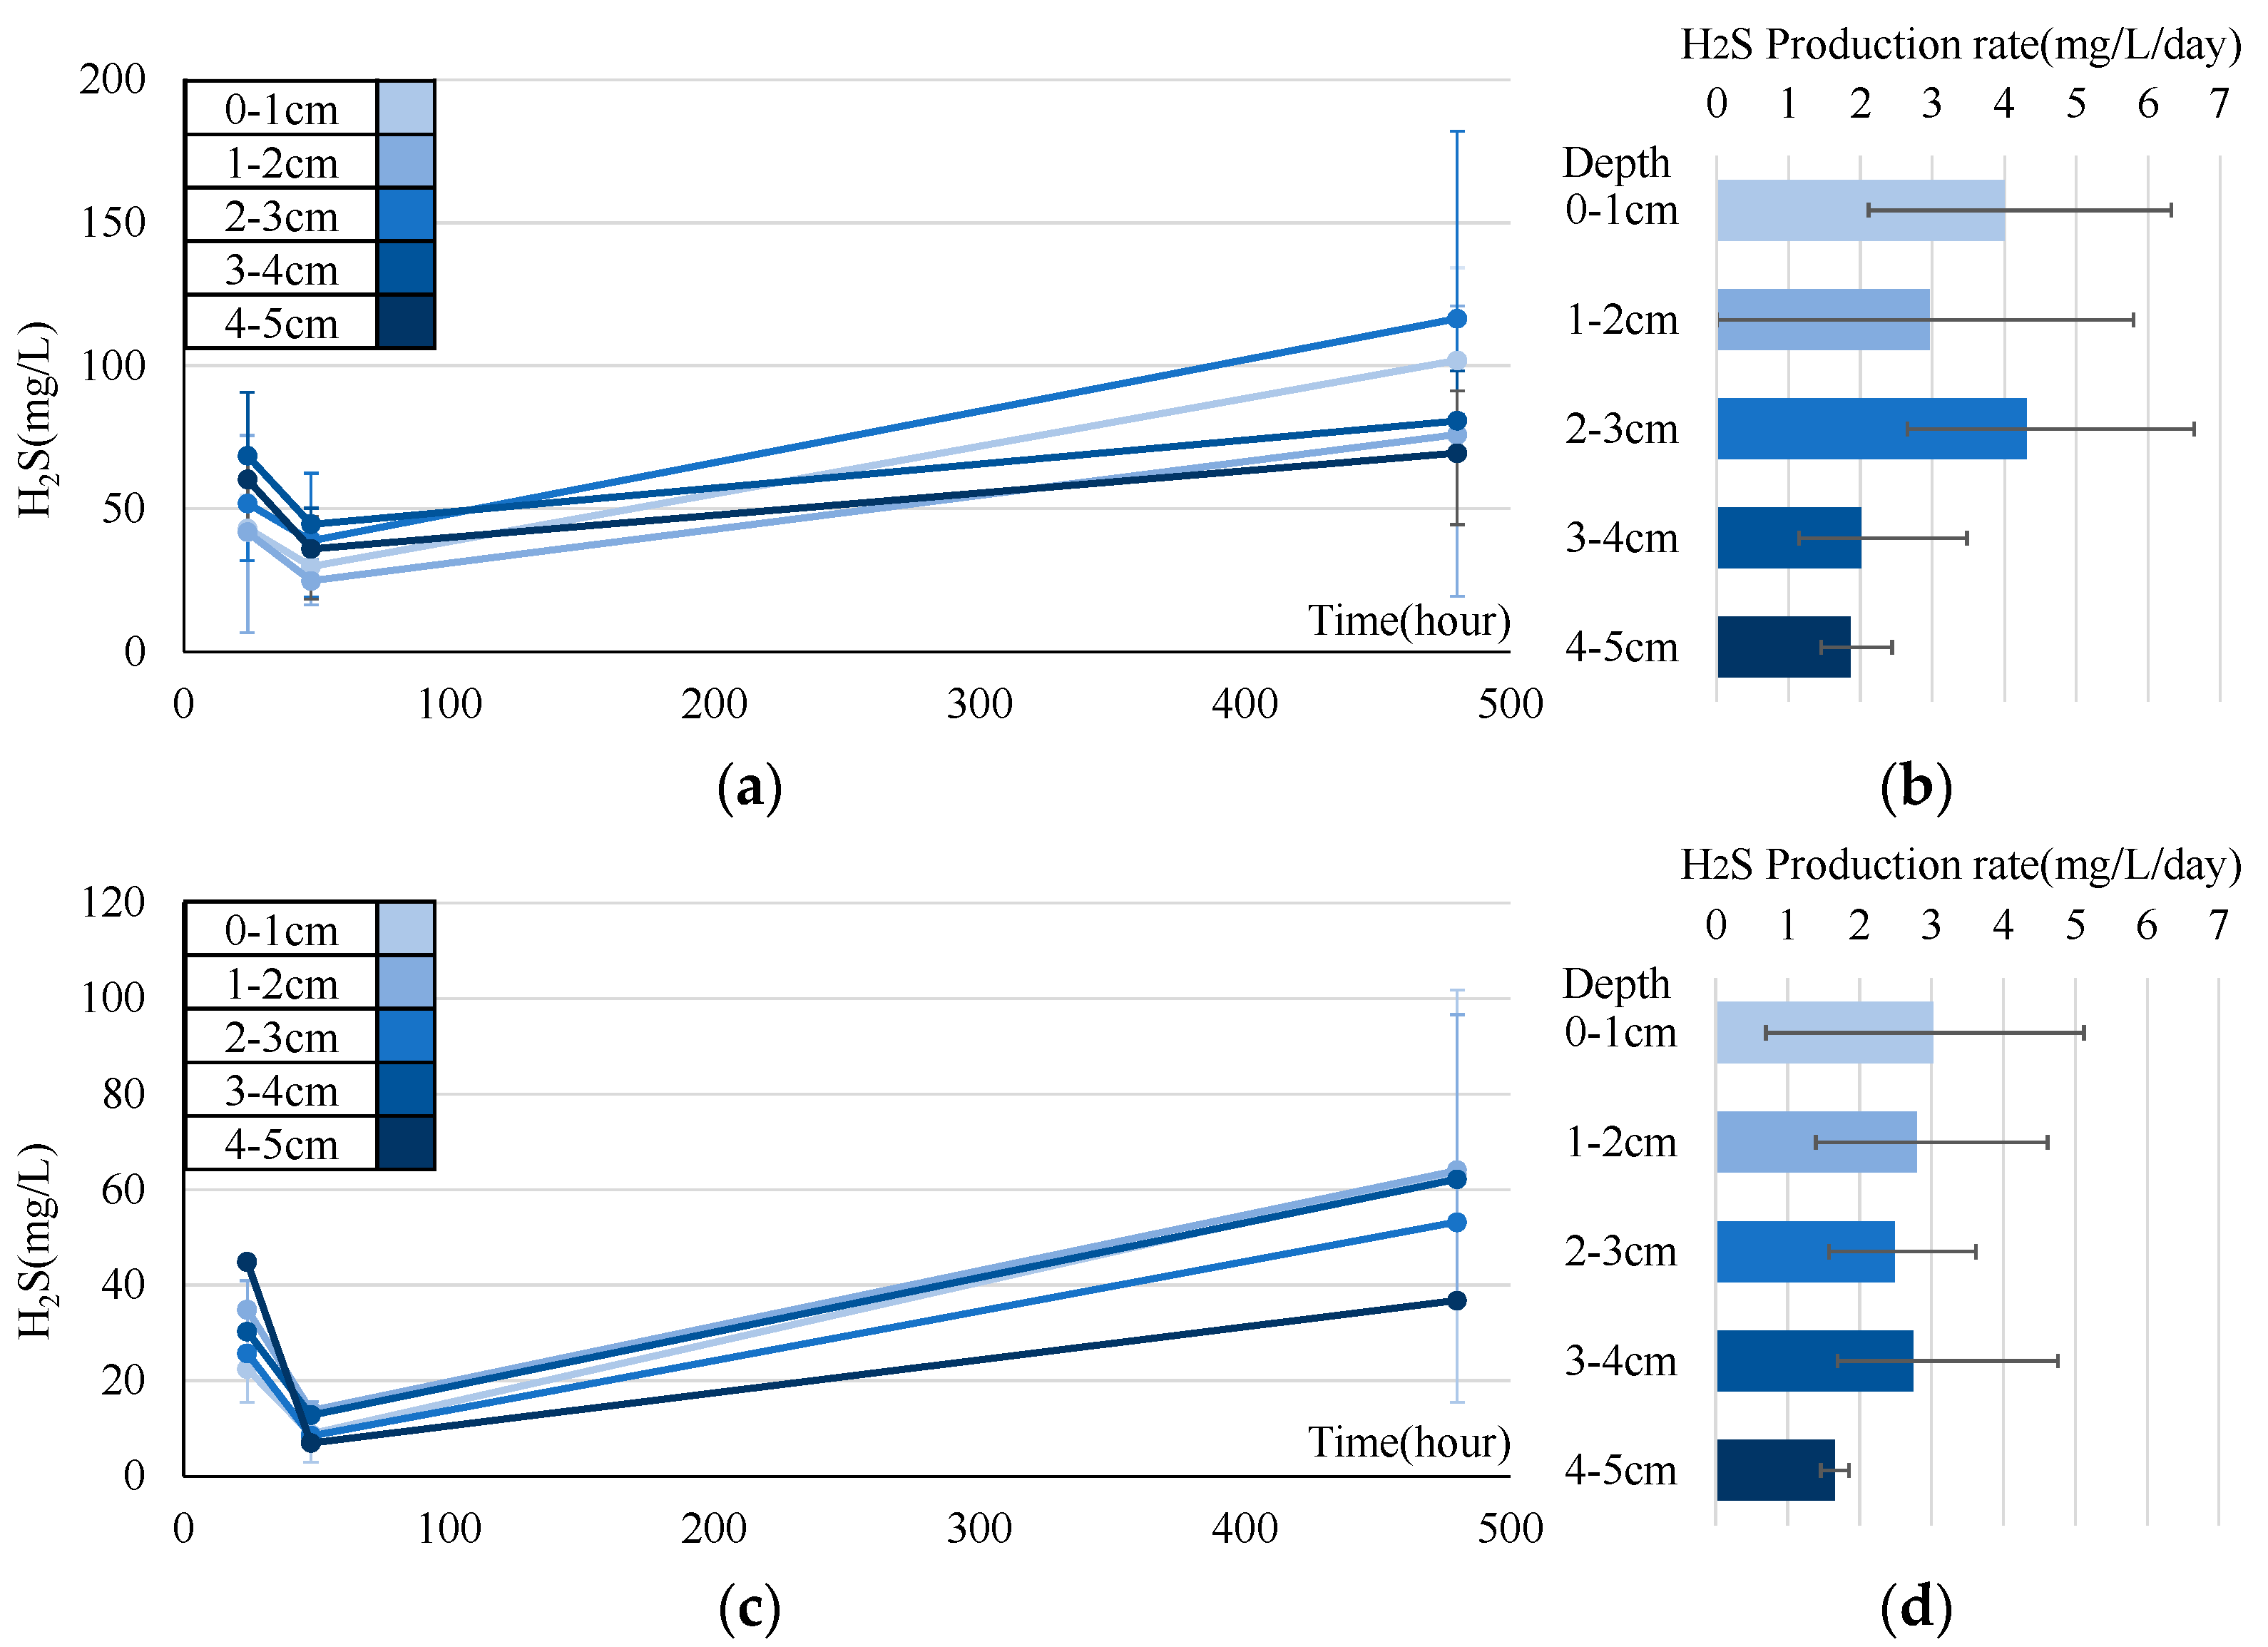
Figure 11.
Experimental results obtained in September. Error ranges are due to cores, and the dots or bar indicate average. (a) Time variations of H2S (mg/L) in each layer; (b–f) H2S (mg/L/d) in each layer and period.
Figure 11.
Experimental results obtained in September. Error ranges are due to cores, and the dots or bar indicate average. (a) Time variations of H2S (mg/L) in each layer; (b–f) H2S (mg/L/d) in each layer and period.
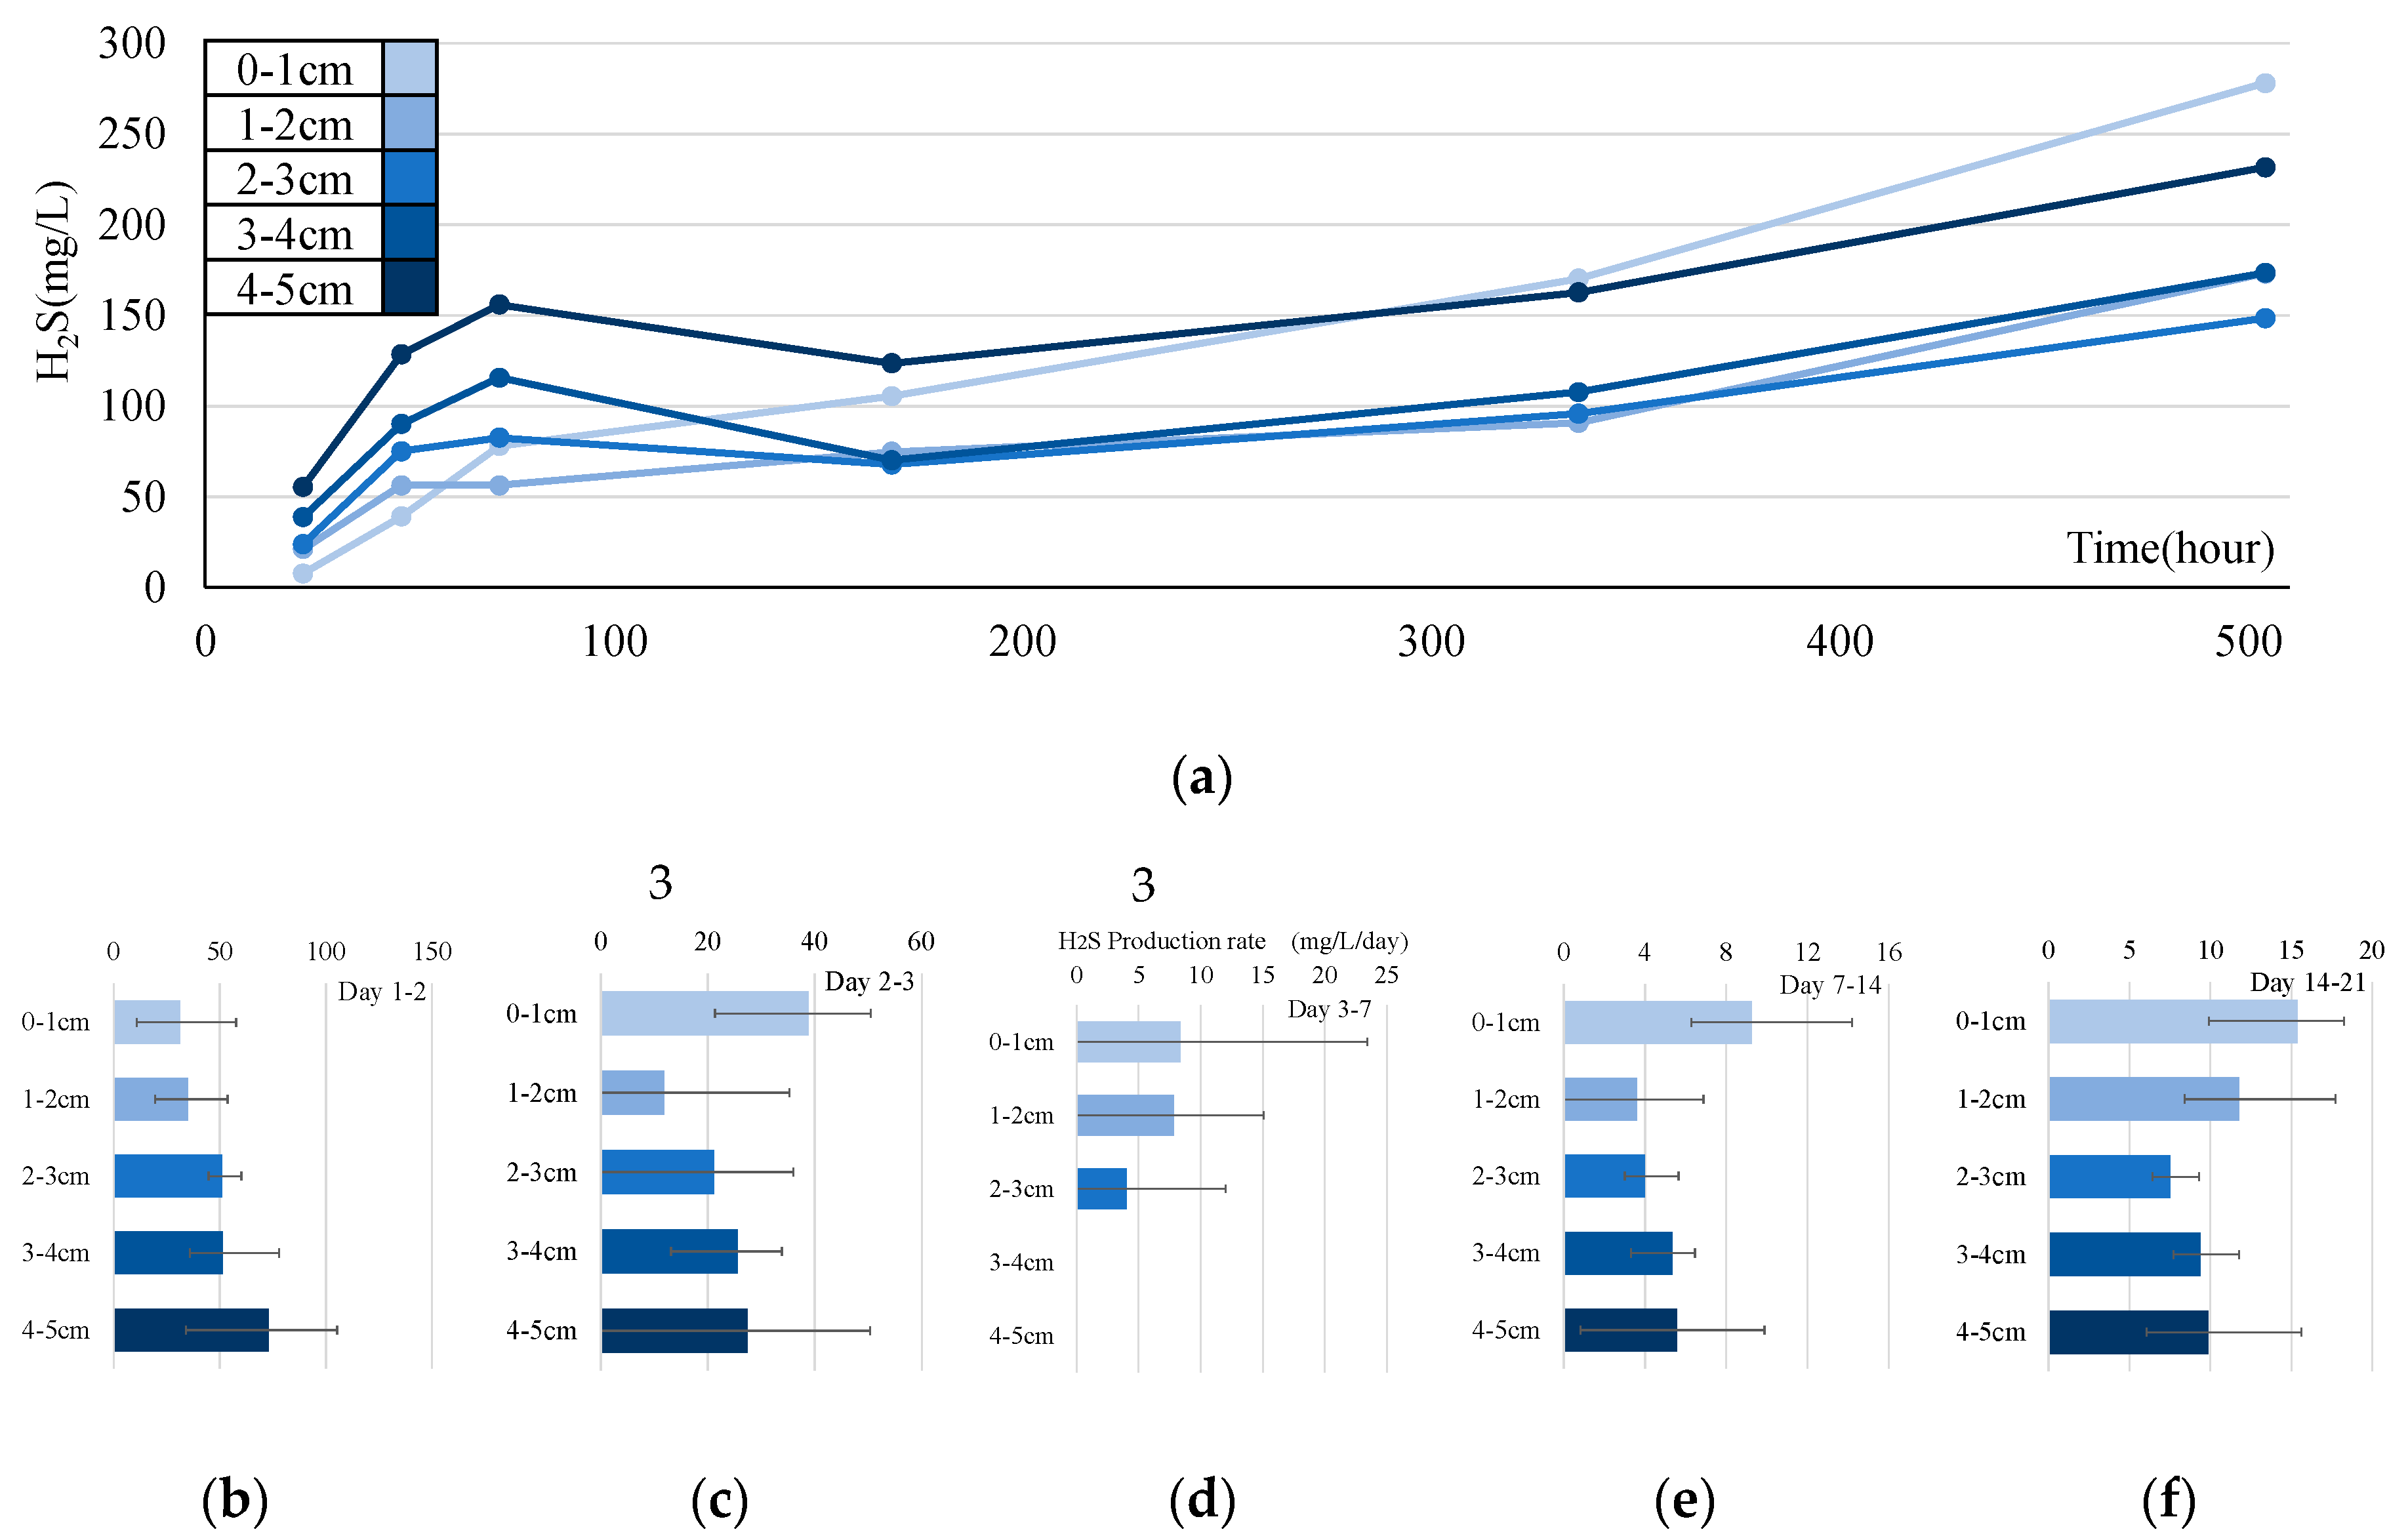
Figure 12.
(a, b) Comparison of vertical distribution of H2S production rate obtained experimentally and theoretically: (a) July and (b) August. (c) The vertical distribution of H2S production rate in the reproduction calculation of observation (each month).
Figure 12.
(a, b) Comparison of vertical distribution of H2S production rate obtained experimentally and theoretically: (a) July and (b) August. (c) The vertical distribution of H2S production rate in the reproduction calculation of observation (each month).
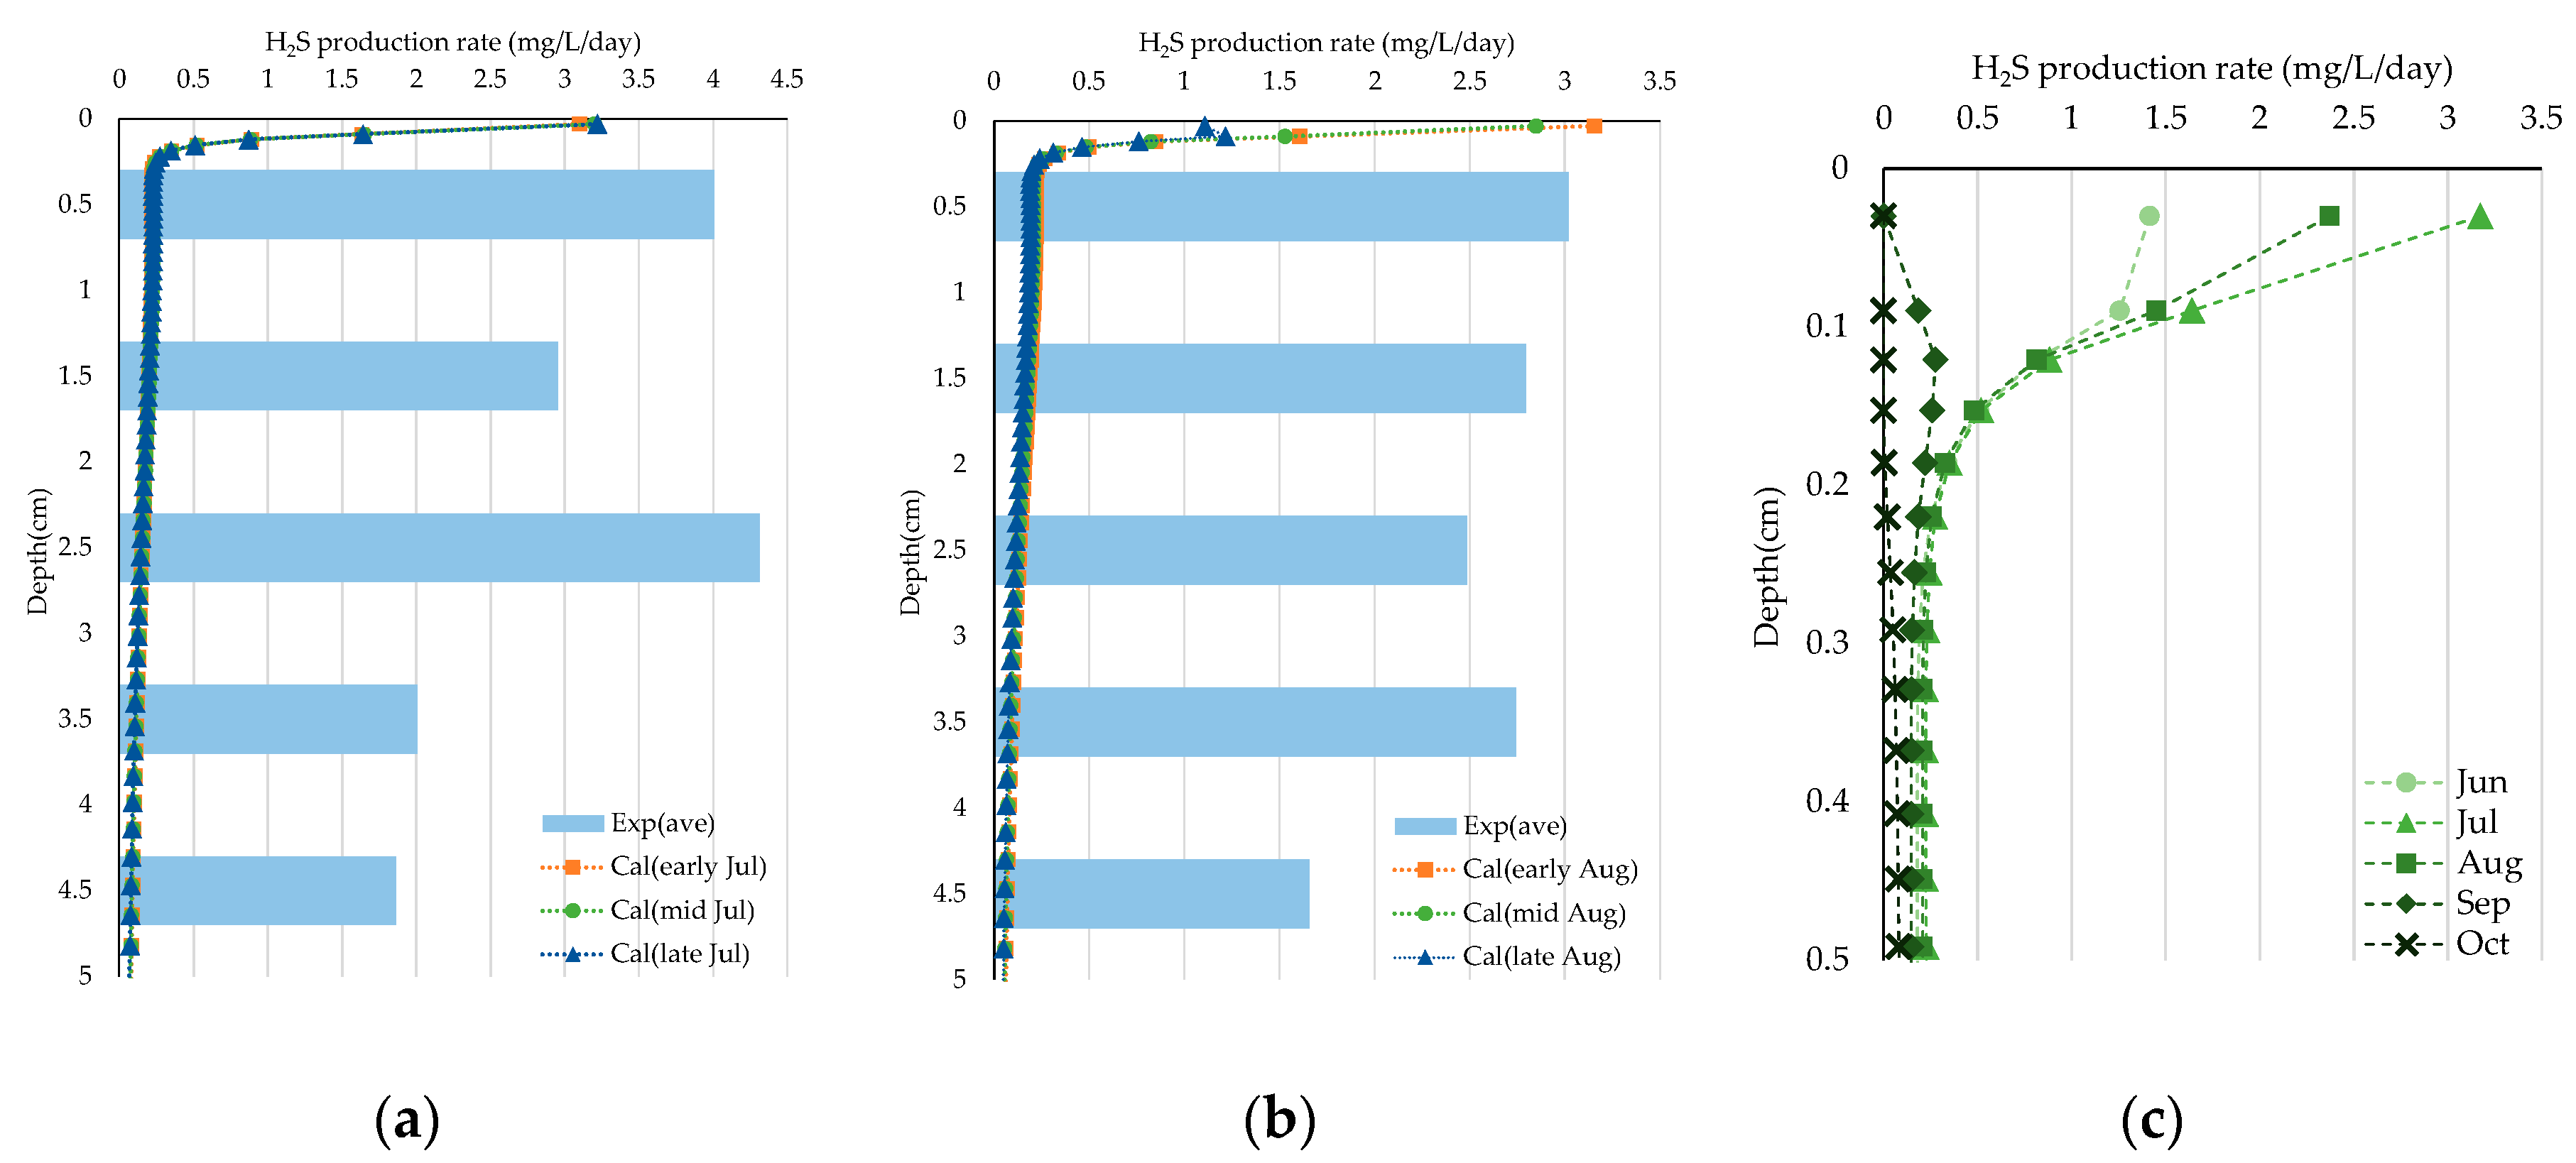
Figure 13.
Schematic diagram of cycles of sulfur and iron. Orange, blue, and green arrows represent sulfur, iron, and both cycles, respectively. Note that R10, R14, and R15 are separately illustrated in the figure.
Figure 13.
Schematic diagram of cycles of sulfur and iron. Orange, blue, and green arrows represent sulfur, iron, and both cycles, respectively. Note that R10, R14, and R15 are separately illustrated in the figure.
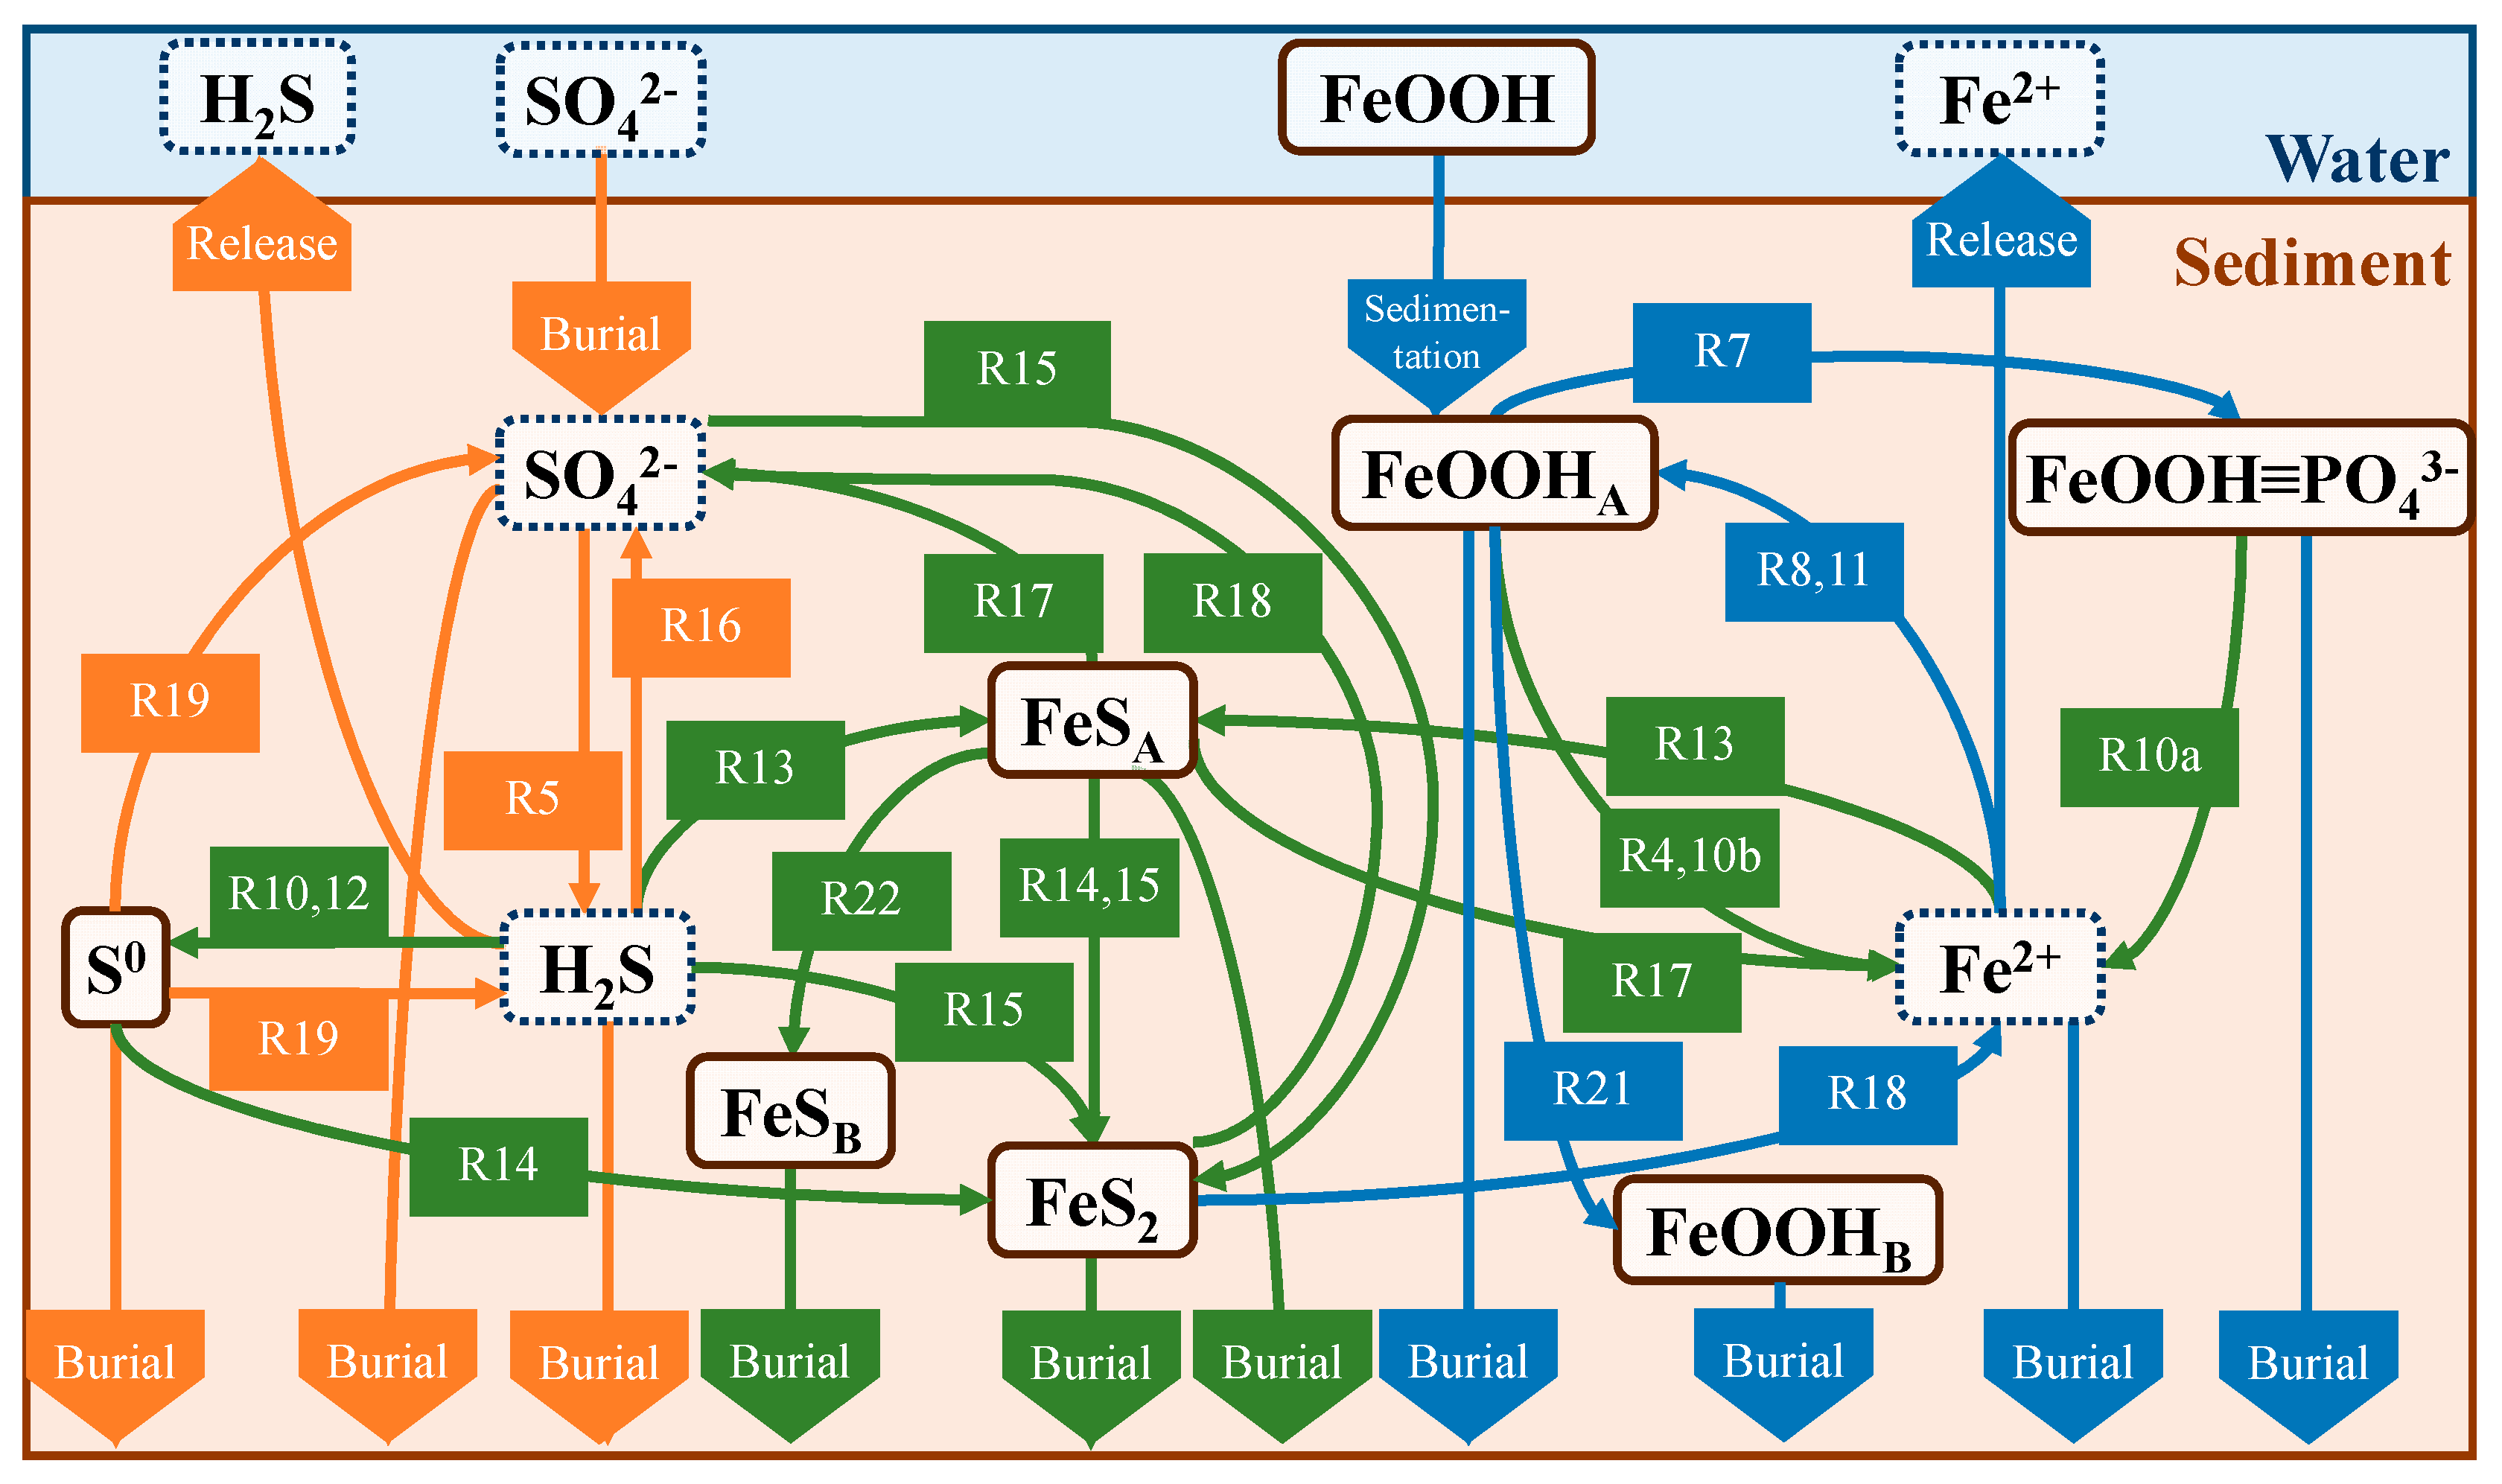
Figure 14.
Annual average flux (mmol/m2/d).
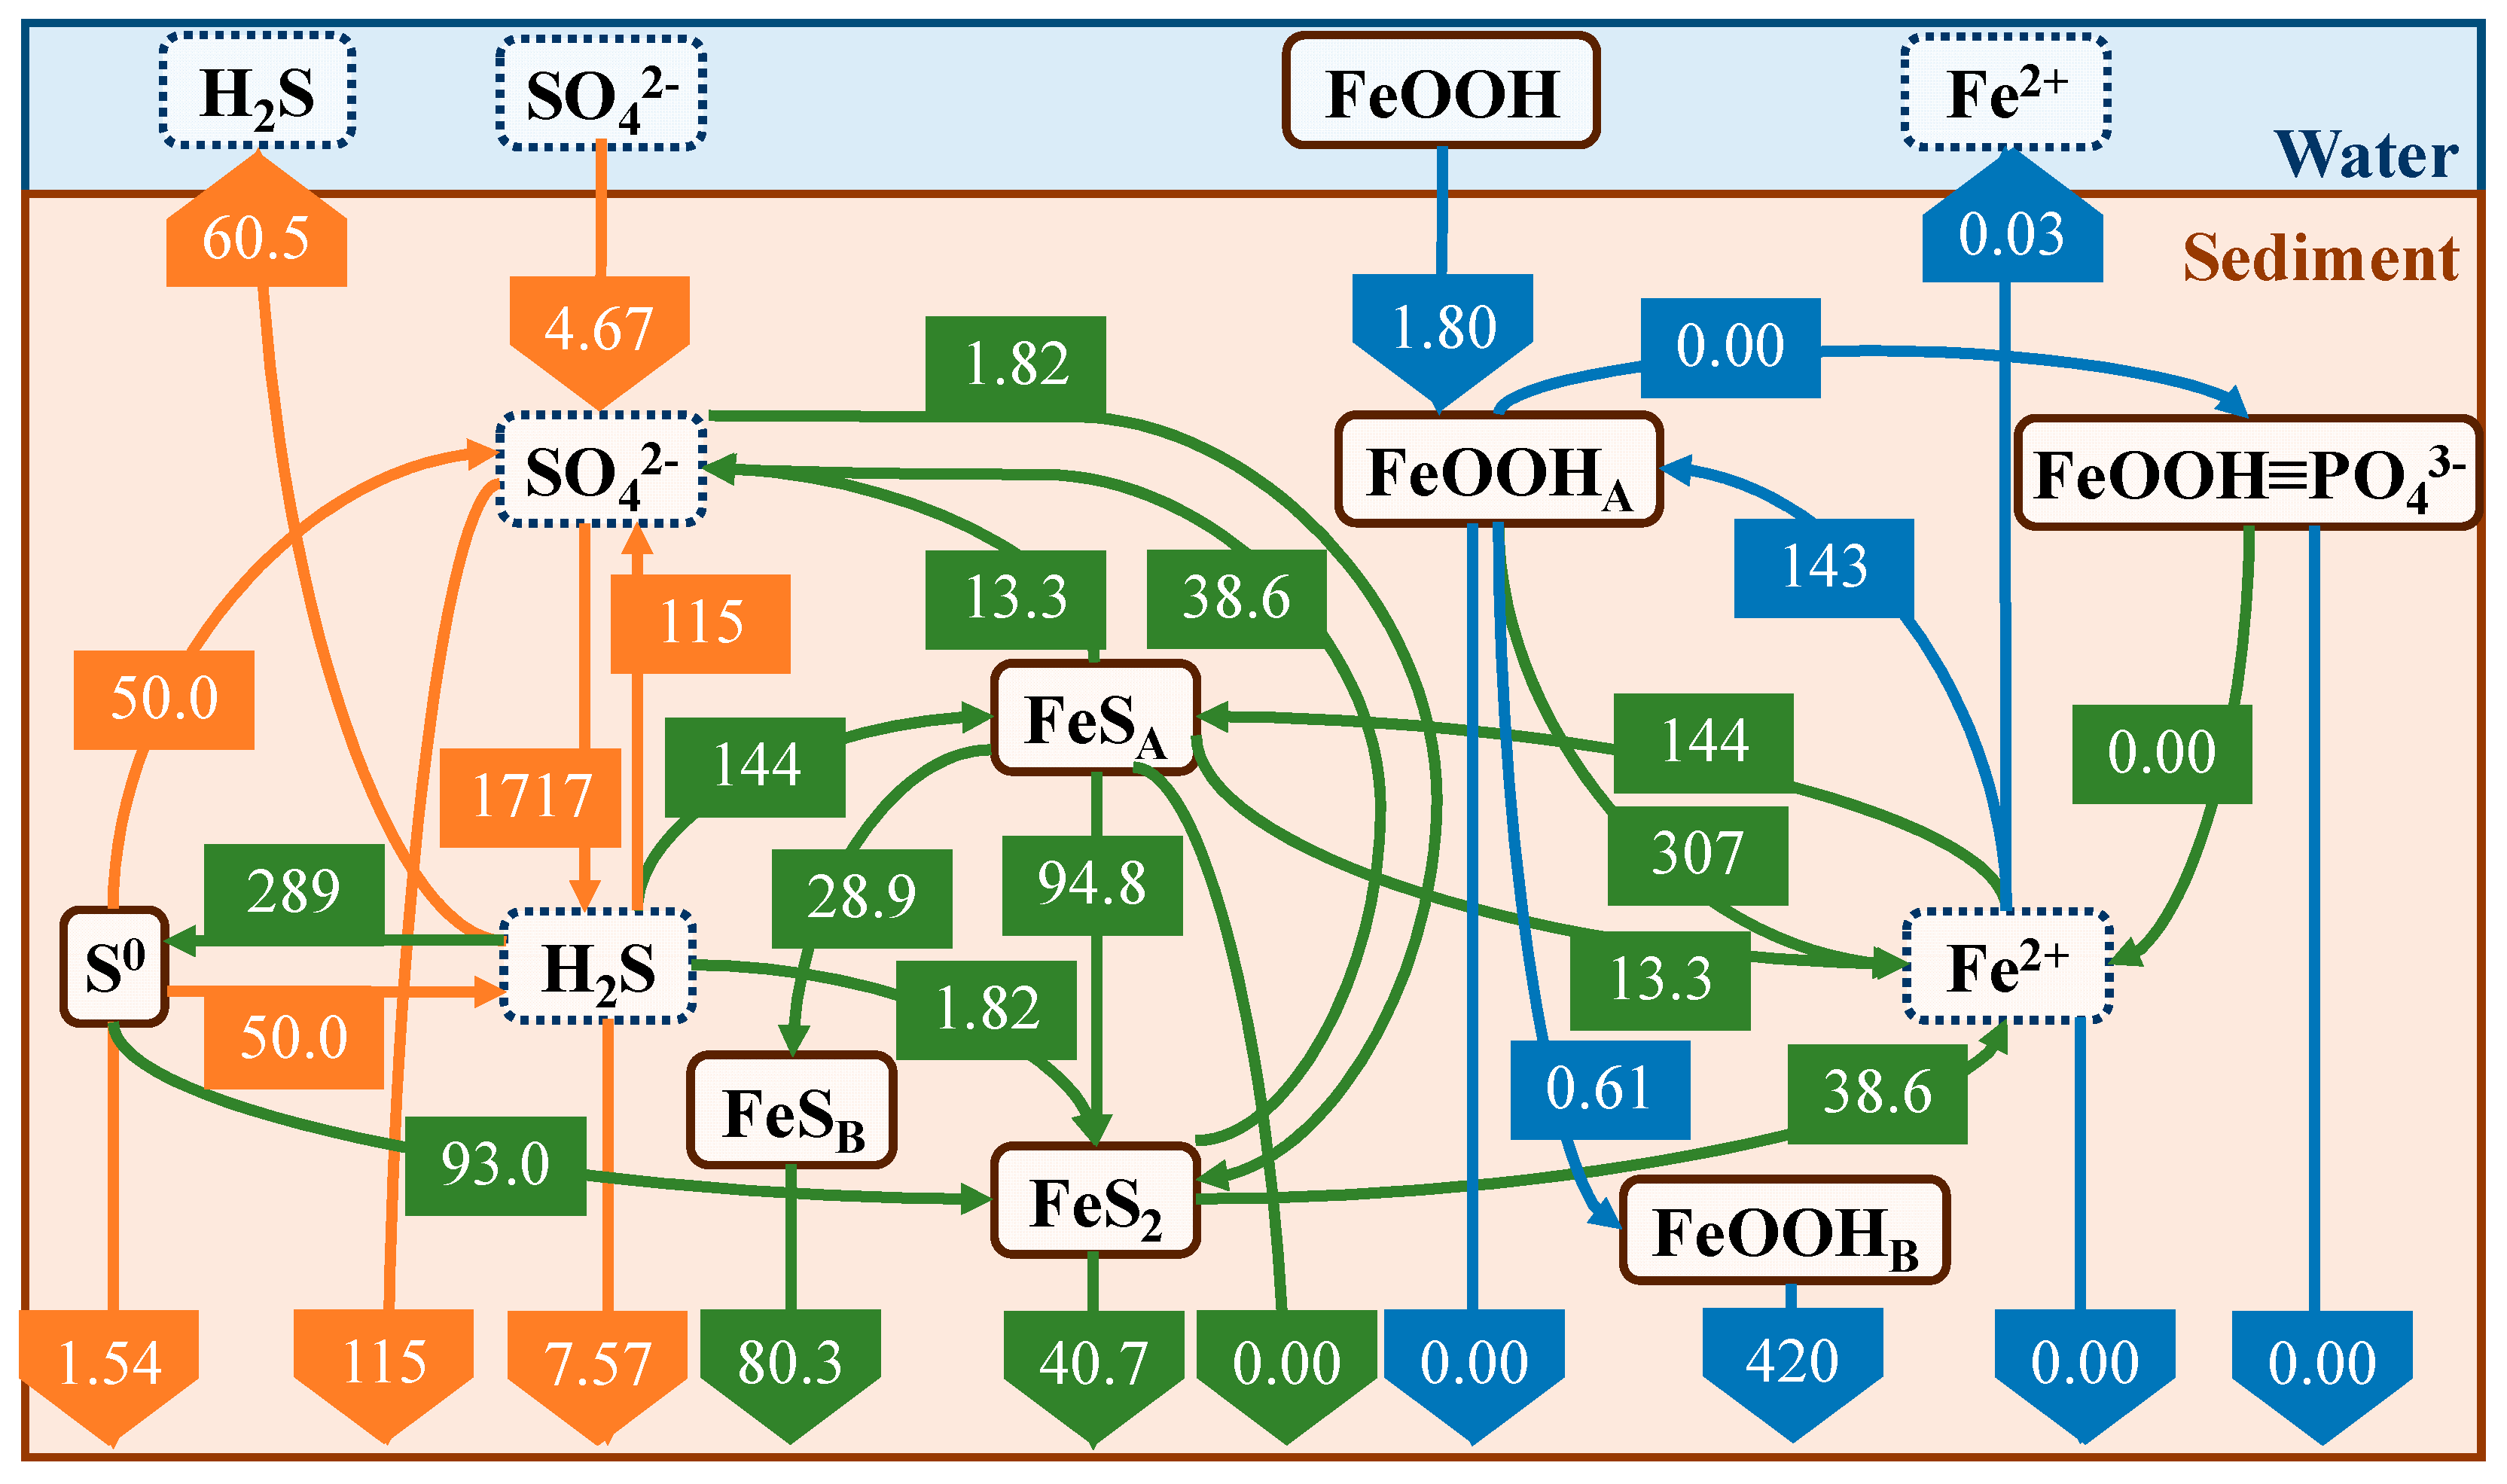
Figure 15.
Seasonal average flux (mmol/m2/d). For each reaction process, the seasonal path with the maximum value is highlighted. (a) Spring; (b) Summer; (c) Autumn; (d) Winter.
Figure 15.
Seasonal average flux (mmol/m2/d). For each reaction process, the seasonal path with the maximum value is highlighted. (a) Spring; (b) Summer; (c) Autumn; (d) Winter.
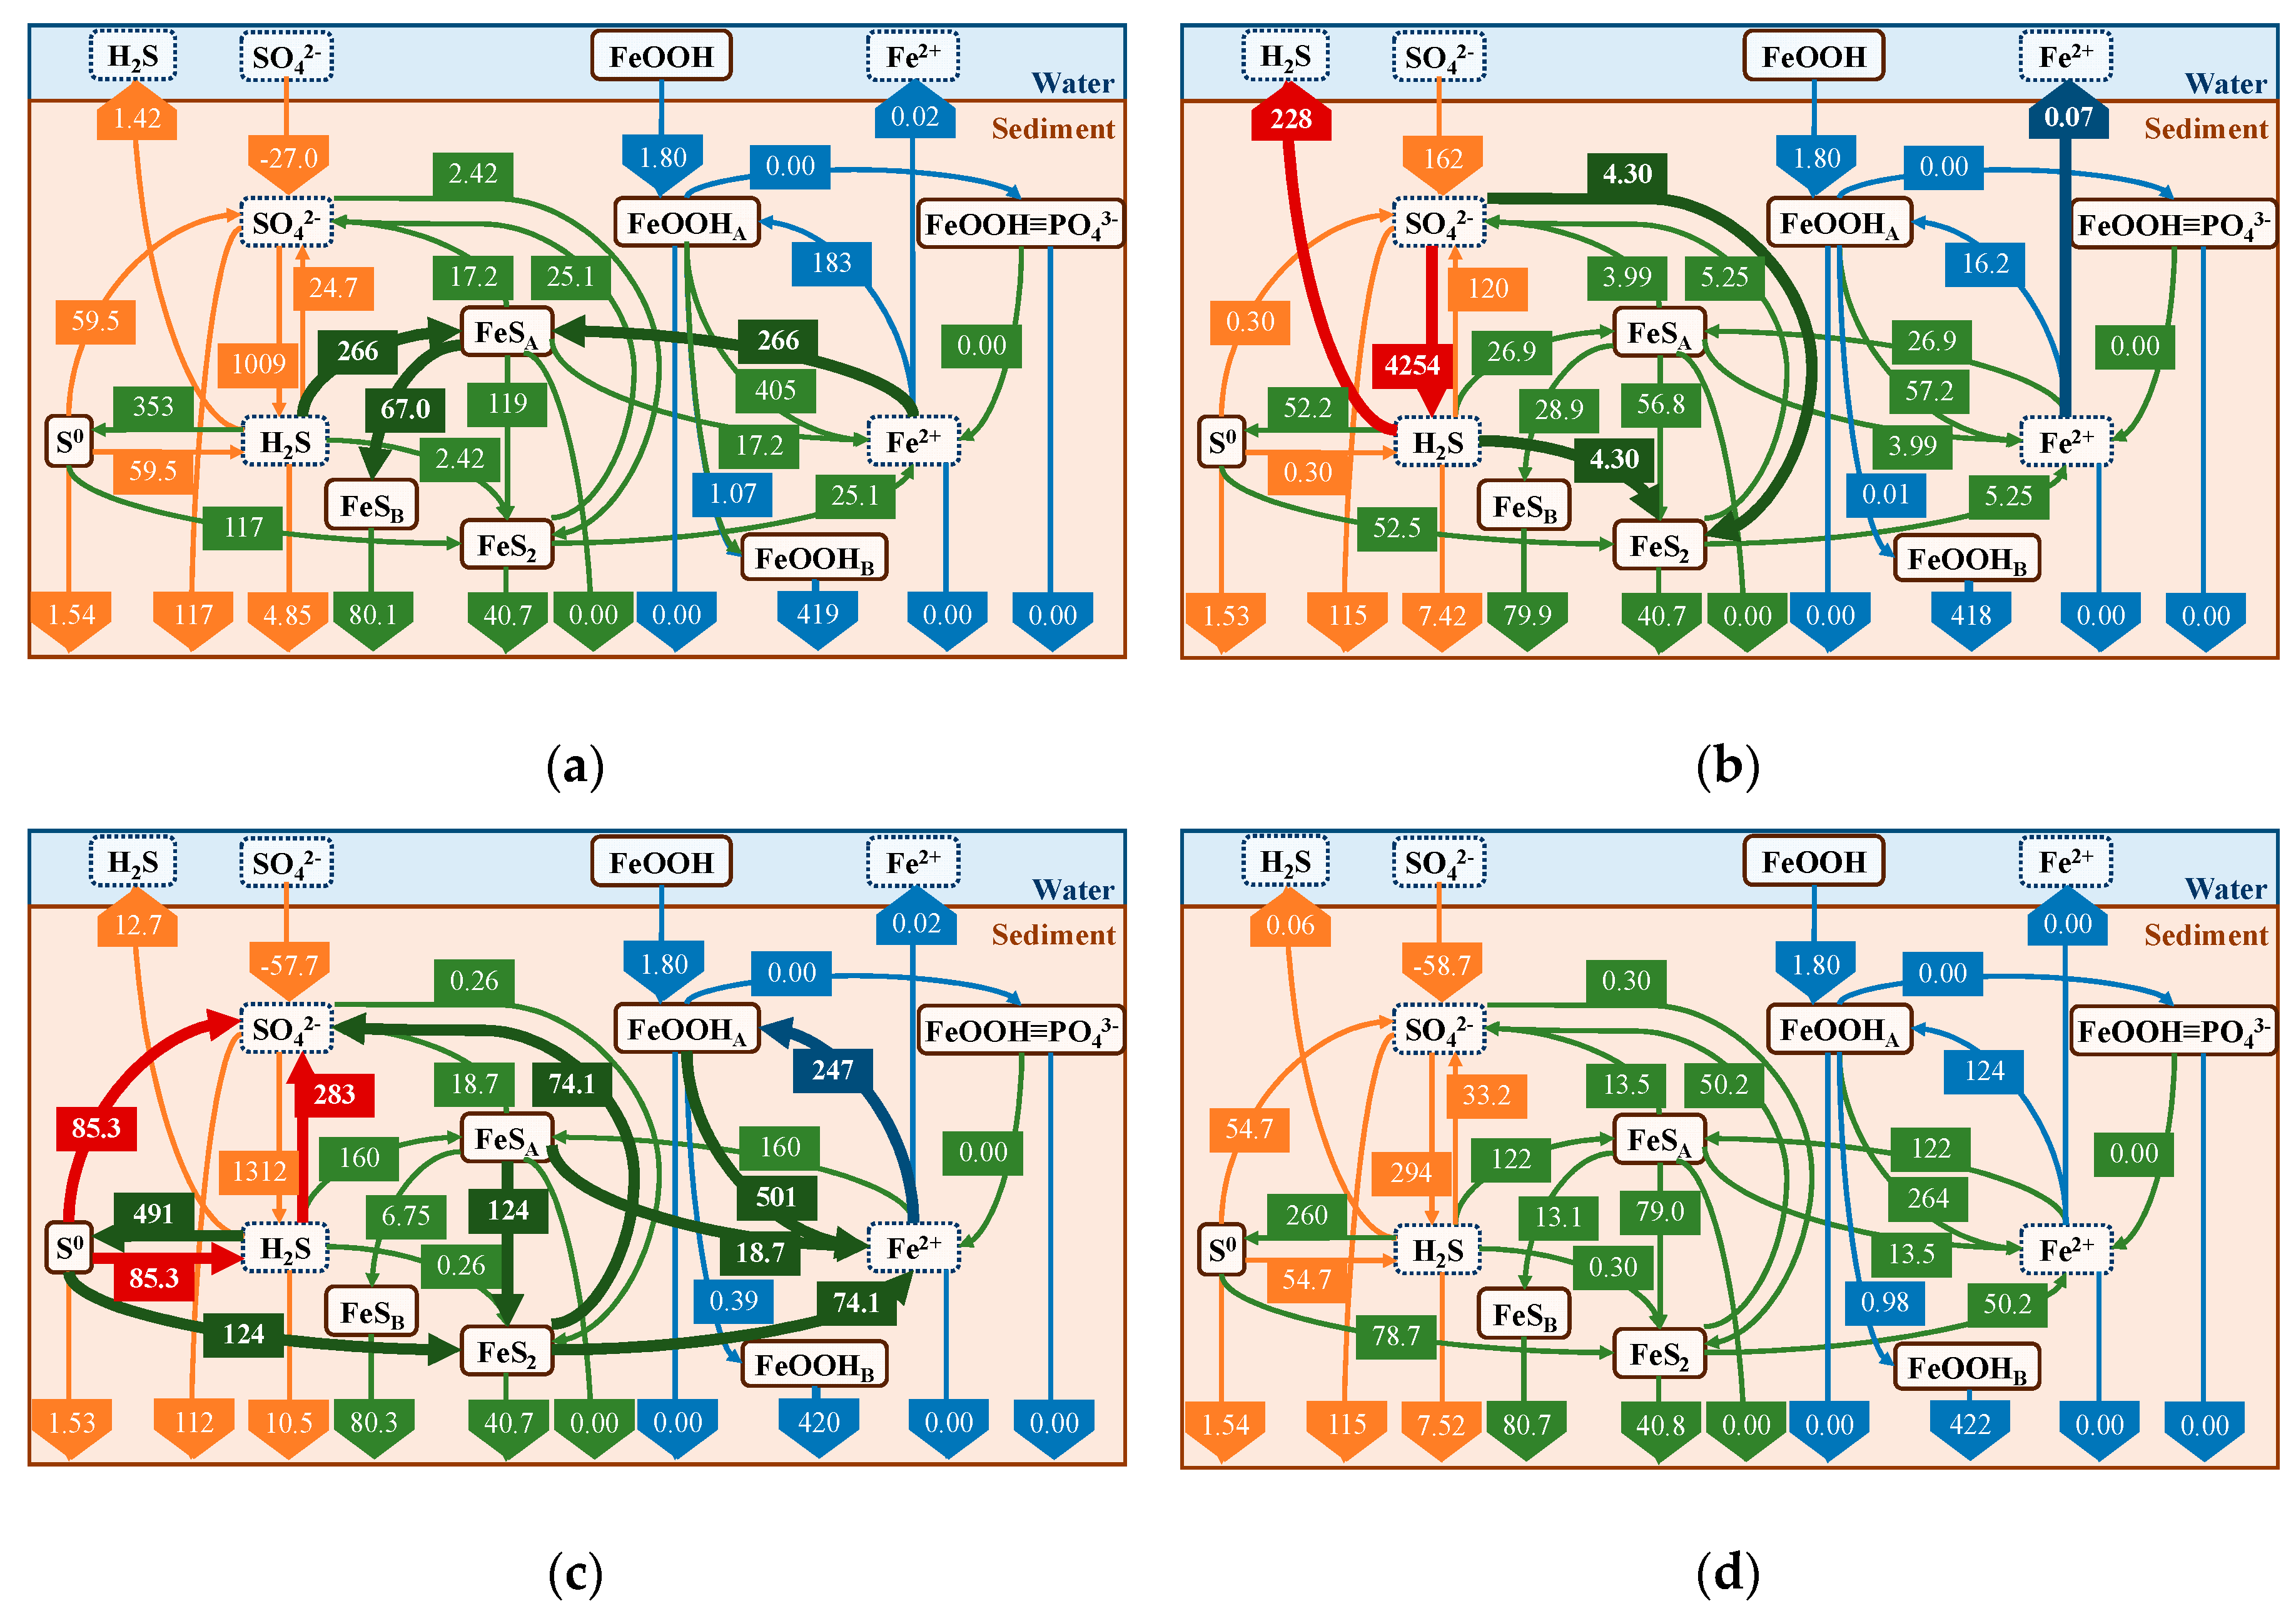
Figure 16.
Comparison with average flux in summer: (a) no addition of iron; and (b) addition of iron. Reaction processes that were significantly altered by the addition of iron are shown in bold lines.
Figure 16.
Comparison with average flux in summer: (a) no addition of iron; and (b) addition of iron. Reaction processes that were significantly altered by the addition of iron are shown in bold lines.
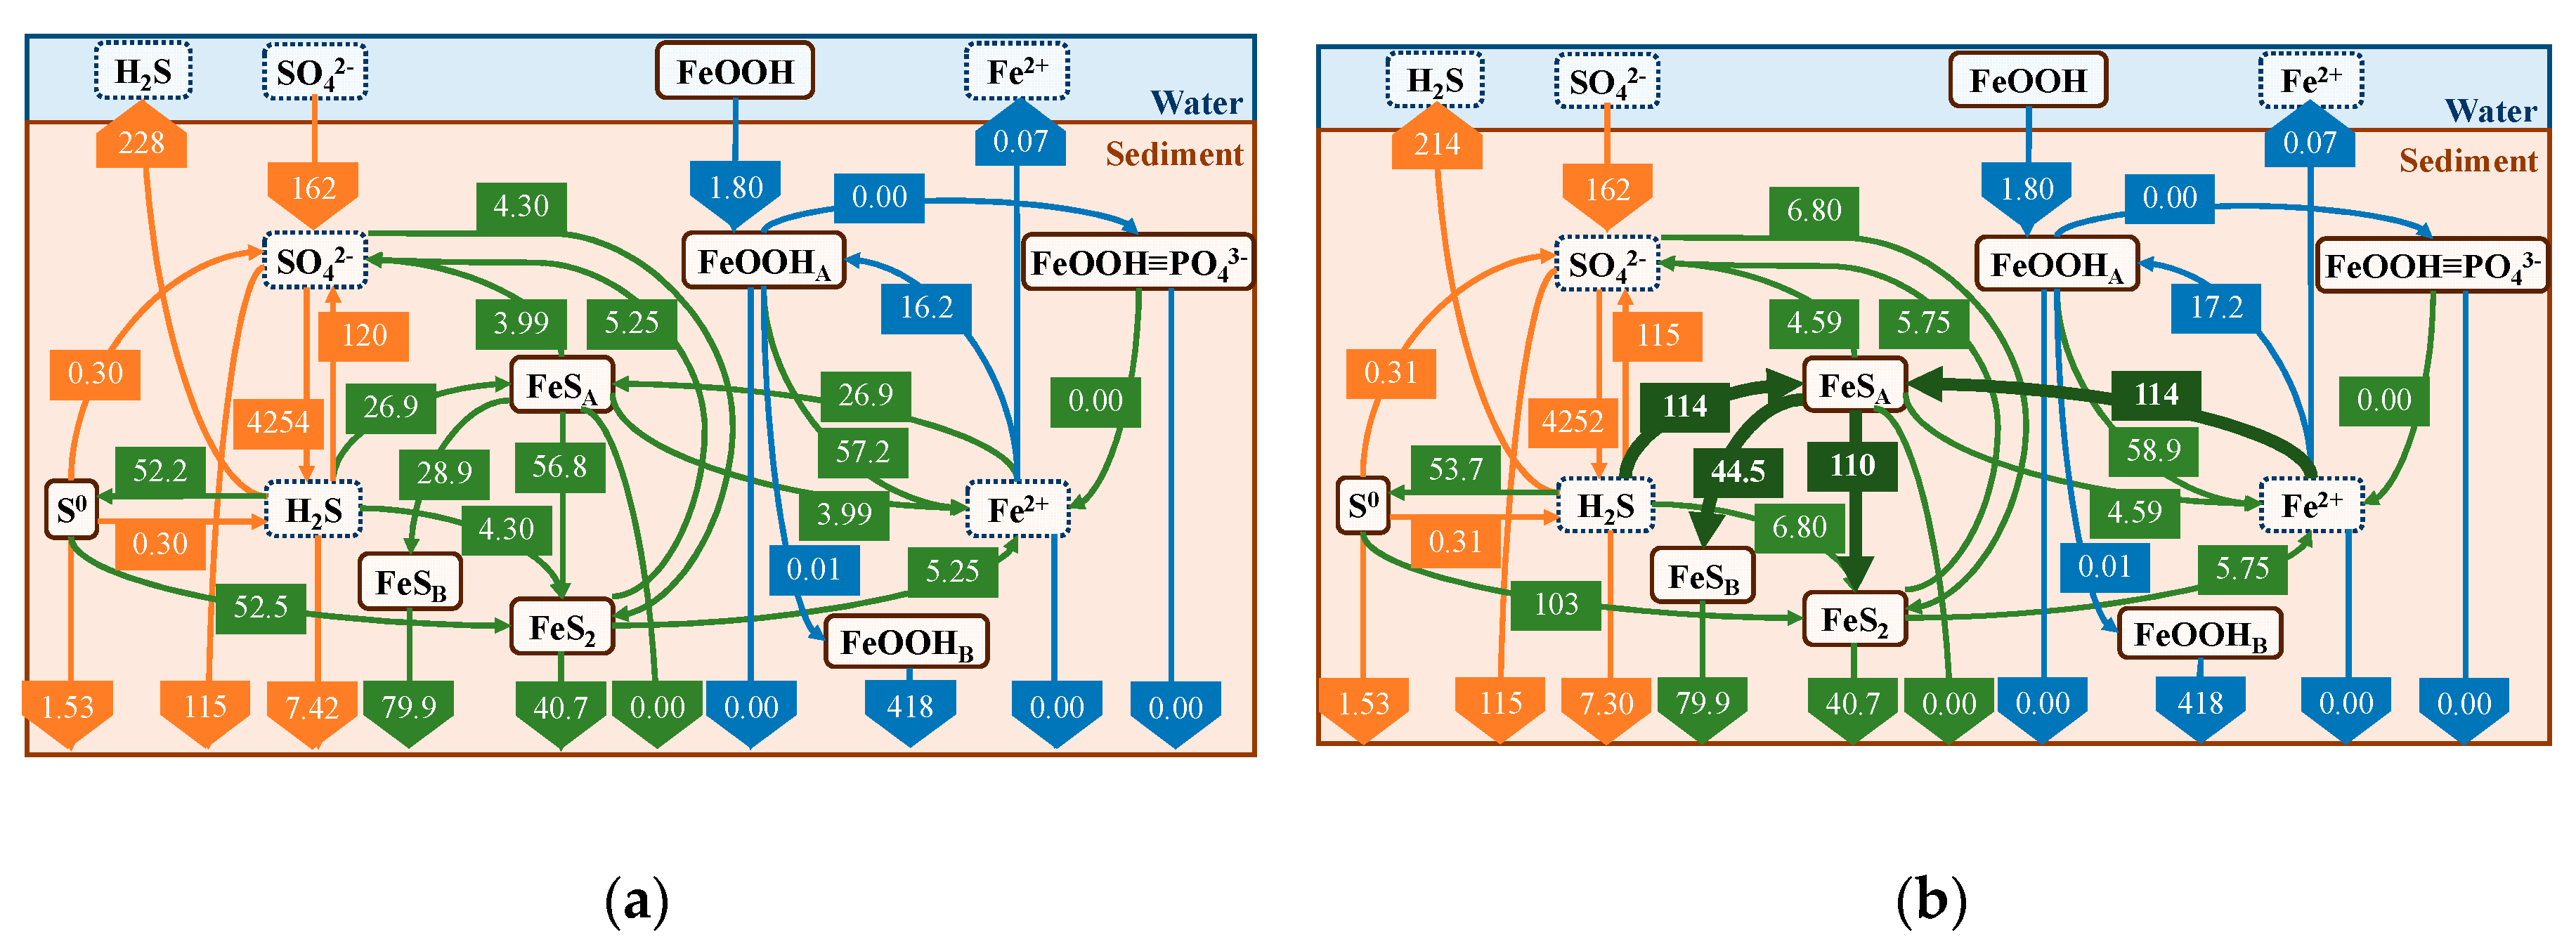
Table 1.
Types of experimental cores.
| June | July | August | September |
|---|---|---|---|
| control (3)* | control (3) | control (3) | control (3) |
| Fe2O3 0.41 g (1) 0.85 g (1) 1.61 g (1) |
Fe2O3 5 g (3) |
Fe2O3 5 g (3) |
Fe2O3 5 g (3) |
| FeOOH 5.6 g (3) |
* The numbers in parentheses correspond to the number of cores.
Table 2.
Form of the substance in the model.
| Dissolved | Particle | ||
|---|---|---|---|
| No adsorption | Adsorption | ||
| DO | NH4+ | S0 | MnO2 |
| NO3− | Mn2+ | FeS2 | FeOOH |
| H2S | Fe2+ | FeS | FeOOH≡PO43− |
| SO42− | PO43− | POC | |
Table 3.
List of symbols for the equation of the material balance.
| Symbol | Parameter | Unit |
|---|---|---|
| concentration | dissolved: nmol/cm3(wat)* particle: nmol/g(dry) |
|
| time | s | |
| vertical coordinates | cm (sed) | |
| porosity | cm3 (wat)/cm3 (sed) | |
| sedimentation rate | cm (sed)/s | |
| density | g (dry)/cm3 (dry) | |
| adsorption coefficient | cm2 (wat)/g (dry) | |
| biodiffusivity of solutes | cm2 (sed)/s | |
| biodiffusivity of solids | cm2 (sed)/s | |
| sediment diffusivity | cm2 (sed)/s | |
| production and consumption | nmol/cm3(sed)/s | |
| particle = 0, dissolved = 1 | ||
| particle or dissolved with adsorption = 1 dissolved without adsorption = 0 |
||
* Pore water (wat), dry soil (dry), and sediment (pore water and dry soil) (sed) are attached to the units.
Table 5.
Conditions for reproducing field observations.
| Parameter | Value | Unit | Source*1 | |
|---|---|---|---|---|
| porosity | Figure 6(a) | - | [19] | |
| density | 2.69 | g (dry)/cm3 | ||
| sedimentation rate | 0.5 | cm (sed)/year | ||
| yotal POC flux | Figure 6(b) | mg/m2/d | [23] | |
| POC ratio (f:s:n) | 1:2:7 | - | ||
| decomposition rate | POCf | 1.4 × 10⁻⁷ | /s | [12] |
| POCs | 1.4 × 10⁻⁸ | /s | [12] | |
| POCn | 1.4 × 10⁻¹⁰ | /s | [12] | |
| flux (B.C.)*2 | MnO2 | 2.0 × 10⁻² | mmol/m2/d | [11] |
| FeOOH | 1.8 | mmol/m2/d | [11] | |
| MnO2A/MnO2B | 0.5 | - | [5] | |
| FeOOHA/FeOOHB | 0.5 | - | [5] | |
| concentration (B.C.) | SO42− | 2500 | mmol/cm3 (wat) | [5] |
| H2S | 0 | mmol/cm3 (wat) | [5] | |
| DO | Figure 6(b) | mg/L (wat) | [19] | |
| NO3− | 0.01 | mmol/cm3 (wat) | [5] | |
| NH4+ | 0.09 | mmol/cm3 (wat) | [5] | |
| PO4−P | Figure 6(b) | mg/L (wat) | [24] | |
| Mn2+ | 0 | mmol/cm3 (wat) | [5] | |
| Fe2+ | 0 | mmol/cm3 (wat) | [5] | |
| reaction rate (R22) | 2.5 × 10⁻⁹ | /s | ||
| water temperature | Figure 6(b) | ℃ | [19] | |
*1 Numbers in the sources correspond to the references (Blank cells are tuning values). *2 (B.C.) is the boundary condition.
Table 6.
Initial conditions for reproduction of H2S release experiment.
| Parameter | Value | Unit | Source* | |
|---|---|---|---|---|
| reaction rate | (R23) | 2.5 × 10⁻⁹ | µM/s | - |
| (R24) | 2.5 × 10⁻⁸ | µM/s | - | |
| water temperature | (Jun) | 20.3 | ℃ | [9,10] |
| (Jul) | 21.7 | ℃ | [9,10] | |
| (Aug) | 25.7 | ℃ | [9,10] | |
| (Sep) | 24.0 | ℃ | [9,10] | |
* Numbers in the sources correspond to references (blank cells are tuning values).
Disclaimer/Publisher’s Note: The statements, opinions and data contained in all publications are solely those of the individual author(s) and contributor(s) and not of MDPI and/or the editor(s). MDPI and/or the editor(s) disclaim responsibility for any injury to people or property resulting from any ideas, methods, instructions or products referred to in the content. |
© 2023 by the authors. Licensee MDPI, Basel, Switzerland. This article is an open access article distributed under the terms and conditions of the Creative Commons Attribution (CC BY) license (http://creativecommons.org/licenses/by/4.0/).
Copyright: This open access article is published under a Creative Commons CC BY 4.0 license, which permit the free download, distribution, and reuse, provided that the author and preprint are cited in any reuse.


