
Submitted:
10 May 2023
Posted:
10 May 2023
You are already at the latest version
Abstract
This work is related to the environmental toxicology risk assessment and evaluation of possible transformation of carbon-based nanomaterials (CNMs) after the contact with marine microalgae. The materials used in the study represent common and widely applied multiwalled carbon nanotubes (CNTs), fullerene (C60), graphene (Gr), and graphene oxide (GrO). The toxicity was evaluated as growth rate inhibition, esterase activity, membrane potential, and reactive oxygen species generation changes. The measurement was performed with flow cytometry after 3, 24, 96 h, and 7 days. Biotransformation of nanomaterials were evaluated after 7 days of microalgae cultivation with CNMs by FTIR and Raman spectroscopy. The calculated toxic level (EC50 in mg/L, 96 h) of ued CNMs reduced in the following order: CNTs (18.98) > GrO (76.77) > Gr (159.40) > C60 (414.0). Oxidative stress and membrane depolarization was the main toxic action of CNTs and GrO. At the same time, Gr and C60 decreased the toxic action with time and had no negative impact on microalgae even at concentration of 125 mg/L. Moreover, C60 and Gr after seven days of the contact with microalgae cells obtained structural deformations.
Keywords:
carbon nanotubes
; graphene
; fullerene
; nanotoxicology
; bioassay
; growth rate inhibition
; flow cytometry
; nanoparticles
; oxidative stress
; environmental fate
1. Introduction
The production and application of carbon-based nanomaterials (CNMs) become an exponentially growing market last years [1,2,3], which valued at $2.9 billion and projected to reach $31.6 billion by 2031 according to the report of Allied Market Research. The group of CNMs include fullerene (C60 or C70), graphene (Gr), graphene oxide (GrO), carbon nanotubes (CNTs), carbon quantum dots, and other derivatives [4]. CNMs has unique mechanical, electrical, thermal, optical, and chemical properties [5] and found application in multiple areas such as drug carriers [2,6], bio-sensors [7], compounds for bionanocomposites [8,9], energy conversion and storage devices [10,11], water purification [12,13], recovery of valuable compounds such as rare earth elements and other metals [14,15], etc.
The growing production and application of CNMs lead to increase of the risks for environmental contamination and especially aquatic environment because of surface wash, atmospheric sedimentation, leakage, and other direct and indirect contamination. One of the important sources of aquatic contamination with CNMs is the application of CNMs for water purification as cost-effective and eco-friendly option [16,17,18]. Moreover, CNMs are widely used in agriculture [19] which as the other source of water contamination by further surface wash.
The environmental risk assessment of nanomaterials represent a very difficult task, because the toxicity of nanomaterials significantly varies depending on particle properties, such as size, shape, functional groups, oxygen content, surface charges, hydrophobicity, and defect sites [20]. Except that, the toxic impact can significantly vary between the used test organisms, and the transformation of CNMs in aquatic environment can further differ the initial toxic properties of the substance [21].
Carbon nanotubes is considered as the most promising and widely studied allotrope of carbon representing a graphene sheet rolled-up in a form of tube [22]. The hydrophilic nature and large particle length determine poor stability of pristine CNT dispersions in water [23]. Fullerene C60 is a molecule having a shape of a soccer ball that consist of 60 carbon atoms, arranged as 12 pentagons and 20 hexagons. C60 behaves like electron deficient alkenes and reacts readily with electron rich species [24]. The aqueous solubility of C60 is extremely limited by very high hydrophobicity [25]. Graphene is a two-dimensional sheet of sp2-hybridized carbon atoms which have a structure of honeycomb lattice of six-membered rings. The other common graphene related materials represented by oxidized form of graphene named graphene oxide (GO) and reduced graphene oxide (rGO) produced by elimination of oxygen-containing functional groups of GO. In general, graphene sheets have a strong tendency to form agglomerates and finally to rebuild graphite [26,27]. The concentration and size of graphene play crucial role in agglomeration.
This work is related to the evaluation of toxic levels and toxic effects caused by the impact of four typical representatives of CNMs in marine microalgae Heterosigma akashiwo. The second part of the study include evaluation of possible transformation of CNMs after the contact with microalgae cells. The chosen CNMs were multiwalled carbon nanotubes (CNTs), fullerene (C60), graphene powder (Gr), and graphene oxide (GrO).
2. Results
2.1. Growth Rate Inhibition and Cell Size Changes
The no observed effect level (NOEL) and calculated effective concentrations of the four used CNMs which caused 10% (EC10) and 50% (EC50) inhibition of microalgal growth rate, as well as NOEL concentrations of microalgae cell size change are given in Table 1. The changes in the microalgae growth rate and in cell size distribution after 96 h and 7 days of the exposure to four types of CNMs are represented visually in Figure 1. The data of all the statistical significance calculations represented in Table S1.
The growth rate inhibition results (Table 1, Figure 1a,b) demonstrated the highest toxicity of sample CNTs to microalgae H. akashiwo. All the tested samples can be listed from the highest to lower cytotoxic effect in the following order: CNTs > GrO > Gr > C60. All the samples had dose-dependent cytotoxicity in microalgae H. akashiwo after 96 h of the exposure (Figure 1a). However, after 7 days of the exposure only sample CNTs showed the increase of toxic level, while the toxic impact of all the other samples on microalgae growth rate was reduced (Figure 1b). Furthermore, samples Gr and C60, which has the lowest toxicity among the others, after 7 days of the exposure demonstrated almost no toxic impact on the growth rate of microalgae cells even at the highest used concentration, namely 125 mg/L (Figure 1b). At the same time, these samples caused significant growth rate inhibition after 7 days of the exposure at concentrations of 5–25 mg/L (Table S1), which most likely means sedimentation of the particles at higher concentrations and microalgae adaptation to these conditions.
All the used CNMs had significant impact on the size distribution of microalgae cells (Figure 1c, d). Samples CNTs, C60, and Gr caused decrease in microalgae cell size after 96 h and 7 days, as significantly more cells appeared in the size range of 6–10 µm compared to control. It should be noted that after 7 days of the exposure the impact of CNTs on microalgae cell size distribution has reduced at concentrations below 100 mg\L, C60 caused the same cell size change in both timepoints, and Gr provoked higher microalgae cell size decrease after 7 days compared to 96 h exposure (Figure 1c,d). In contrast to all the other samples, GrO caused increase in microalgae cell size after 96 h exposure (Figure 1c) at highest concentrations, and more cells were registered in the size range of 10–15 µm. After 7 days of the exposure, GrO caused decrease in the size of H. akashiwo cells, the same way as demonstrated all the other samples, but the effect was not dose-dependent and reduced at concentrations above 75 mg/L.
The microscopic pictures of H. akashiwo cells from the control group after 7 days of exposure represented in Figure 2. Microalgae cells after 7 days of the exposure to four types of CNMs represented in Figure 3.
Microscopic observation demonstrated spherical-shaped cells of H. akashiwo exposed to CNTs (Figure 3a), and irregular, dissected form of the cells exposed to samples C60 and GrO (Figure 3b,d), compare to relatively smooth shape of the cells of control group (Figure 2). Moreover, cell debris was observed in agglomerated clusters of CNMs. At the same time, there was no alive microalgae cells absorbed to agglomerated CNMs. This observation can indicate high sensitivity of shell-less H. akashiwo cells [28] to mechanical damage associated with cell-particle interaction.
2.2. Cellular Response Evaluation
The NOEL concentrations of esterase activity, membrane potential, and ROS generation changes are given in Table 2. The changes of all these endpoints after the exposure of H. akashiwo to four types of CNMs are represented visually in Figure 4.
Figure 4a demonstrated that CNT, C60, and GrO had early response after 3 h exposure to these CNMs with esterase activity inhibition. This effect was observed only for the highest concentration used in this series of the assays (50 mg/L). Moreover, in the cases of CNTs and GrO, microalgae esterase activity was normalized after 24 h (Figure 4b). Sample Gr revealed no significant esterase activity change after both 3 and 24 h of the exposure. These results can indicate the adaptational ability of H. akashiwo cells to the impact of CNMs.
Considering the change in microalgae membrane potential, the highest membrane depolarization was registered after 3 and 24 h of CNTs exposure at concentrations 10–50 mg/L (Figure 4c, d), and after 24 h exposure of GrO at 50 mg/L (Figure 4d). Interestingly, CNTs concentration of 1 mg/L after 3 and 24 h exposure, Gr at 25 mg/L, and GrO at 25 and 50 mg/L after 3 h exposure caused hyperpolarization of cell membranes (Figure 4c). All the registered hyperpolarization effects neutralized after 24 h of the exposure (Figure 4d). Sample C60 with the lowest cytotoxic effect (Figure 1a,b) caused no significant effect on membrane potential of microalgae cells (Figure 4c,d). Based on these results, we can highlight that in cases with high toxic impact (CNTs and high concentrations of GrO) microalgae cells undergo depolarization and following disfunction and death, while low toxic impact (Gr at 25 mg/L, and low concentrations of GrO) provoked cell hyperpolarization which can result either in adaptation to the toxicant or in following cell exhaustion and membrane depolarization. Correspondingly, the samples with no significant toxic impact (C60 and Gr at all concentrations except 25 mg/L) caused no change in microalgae membrane polarization.
The highest ROS generation increase was observed for CNTs at 50 mg/L both after 3 and 24 h exposure (Figure 4e,f). The sample with the second microalgae cytotoxicity, GrO increased microalgae ROS generation at concentrations 25 and 50 mg/L only after 24 h exposure, and it demonstrated no effect after 3 h exposure. Interestingly that relatively moderate ROS generation increase caused least toxic sample C60 (at 50mg/L after 3h, and at 25 and 50 mg/L at 24 h exposure). These results partly indicate the mode of action for used CNMs and activation of microalgae adaptation mechanisms. In other words, the toxic action of CNTs and GrO include oxidative stress, and in this cases, H. akashiwo was unable to tolerate the level of ROS generation increase with inner antioxidative system. However, this adaptation probably was successful for lower oxidative stress impact, caused by C60 sample, and ROS generation increase did not result in microalgae growth rate inhibition.
2.3. Particle Biotransformation Assessment
Fourier-transform infrared spectroscopy (FTIR) analysis was applied to assess the possible transformation of the tested CNMs after the incubation with microalgae cells for seven days. The comparison of FTIR spectra obtained from the particles incubated in only seawater and in seawater with microalgae represented in Figure 5. The used concentration of CNMs was 25 mg/L.
In general, it should be marked that all the obtained spectra has specific broad absorption band at 3600–3200 cm-1 which is reported as characteristic vibration mode for hydroxyl groups from intermolecular hydrogen bonded OH:OH or absorbed water [29,30] and probably indicate the residual moisture in the samples. However, the spectra of pristine CNMs which had no incubation in seawater and dried overnight in oven with the other samples had the same pick in this area (spectra not represented). This mean that the sample preparation and measurement should be reevaluated to exclude moisture absorption during FTIR measurement.
Compared to seawater control, sample CNTs obtained a pick of 1382.96 cm-1 (Figure 5a) which is typical C-H bonds and reported for CH2 or CH3 [31].
Fullerene C60 after seven days of incubation with microalgae culture demonstrated the pick in the alicyclic area between 3000 and 2900 cm-1 (Figure 5b), which also reported for fullerene C60 as CH2 or CH3 impurities [32,33]. The absorption bands at about 1850–1750 cm-1 may be assigned to oxidation of C60 [29,32,33], which has more intensive signal after incubation with microalgae (Figure 5b). The bands of 1530–1460 cm-1 were previously reported for C70 fullerene [34].The bands of 570–550 cm-1 indicated coexistence of C60 and C70 fullerenes [35].
In Figure 5c, the absorption bands at 1645 and about 1545–1530 cm-1 indicates amide group in graphene structure [36,37]. Graphene oxide (Figure 5d) indicated no observable modifications after the exposure to microalgae compared to seawater control, except the band at 1225 cm-1 which might be attributed to epoxy group modification of GrO [36,38]
The results of Raman spectroscopy analysis represented in Figure 6. Except the samples incubated in seawater, we also analyzed the initial CNMs without any exposure.
All the obtained spectra revealed the areas typical for CNMs, namely D band (disorder induced mode, around 1300 cm-1) and G band (graphite mode, around 1550 cm−1). It should be noted, that the best match of the spectra demonstrated sample GrO (Figure 5d), which mean that after seven days of incubation in seawater with and without microalgae cells graphene oxide nanoparticles had no structural changes. CNTs also revealed the similar intensity both in D and G bands (Figure 5a), but had some signs of impurity in all the other area of obtained spectra compare to pristine and seawater incubated CNTs. C60 demonstrated increase of intensity both around G and D bands compared to the same material not exposed with microalgae (Figure 5b), which indicates the potential of fullerene C60 to highest biotransformation among the other tested CNMs. Gr revealed increase only in D band (Figure 5c) in the probe, exposed with microalgae, which demonstrated the increase of structural disorder in graphene.
3. Discussion
Considering the growing interest in production and application of different types of CNMs, the problem of their safety evaluation becomes more important. The present study was designed to determine the differences in the effect of multiwalled carbon nanotubes, fullerene, graphene powder, and graphene oxide in marine microalgae H. akashiwo and to assess the possible biotransformation of these materials after the interaction with microalgae cells.
One of the most interesting results of this study is the demonstration of strong membrane depolarization in microalgae cells under the impact of the samples with the highest observed toxicity (Figure 4c,d), namely CNTs and GrO. The stable function of cellular membrane permeability and mitochondrial membrane potential represent a crucial component of normal physiological function of cells [39]. Therefore, depolarization of microalgae membranes is a mark of upcoming cell death.
Moreover, the toxicity of CNTs and GrO was coupled with increased ROS generation in microalgae cells (Figure 4e,f). Intensive ROS formation causes destruction in proteins, lipids, and carbohydrates, and lead to oxidative stress in microalgae [40]. Except mechanical impact and shading effect on microalgae, the toxic impact of CNTs might be associated with metal impurities remained after the catalytic production of the particles [41]. The used sample of CNTs contain residuals of Al and Co (Table 3). It was reported that Co might become toxic at high concentrations, despite it is one of the essential metals for cell function [40,42]. Al can induced oxidative stress, ultrastructural changes, changes in lipid metabolism, degradation of cellular organelles, and suppression of antioxidant enzymatic activity in microalgae [43,44]. The presence of metal residuals caused oxidative stress in H. akashiwo, which further resulted in membrane dysfunction and cell death.
It is known that graphene family NMs could directly penetrate into the cell membrane of algae through cell pores [45,46,47]. It was reported that GrO enters into the cells of Chlorella vulgaris and damage organelles, enhanced the generation of ROS, and disrupted antioxidant enzymes [48]. This results are in agreement with our study where GrO caused 2.5 fold increase of ROS production in H. akashiwo cells after 7 days of the exposure to GrO concentration of 50 mg/L (Figure 4f).
Interestingly that H. akashiwo revealed high adaptational ability to the impact of used CNMs, except CNTs. It can be seen by significant increase in EC10 and EC50 concentrations of microalgae growth rate inhibition after 7 days of the exposure to GrO, compared to 96 hours exposure (Table 1). Moreover, samples C60 and Gr after 7 days of exposure had no toxic impact on growth of H. akashiwo even at concentration of 125 mg/L.
It is assumed that mechanical damage, oxidative stress, and shading effect are the main reasons of CNMs toxicity to microalgae [47,49]. In this study, we can conclude that shading effect had no strong impact on the growth of microalgae, because of particle agglomeration and sedimentation, and the fact that H. akashiwo is motile and mostly surface living species [50]. Therefore, the cells of H. akashiwo could be not subjected to prolonged mechanical impact of CNMs if they would rapidly agglomerated and sedimented. In this study the highest agglomeration and sedimentation rate in seawater had sample CNTs. The reasoning above also exclude prolonged shading effect of sedimented CNMs. Hence, only the samples which caused oxidative stress have significant toxic impact in H. akashiwo.
Despite there is no stated and widely accepted environmentally relevant concentrations of graphene family and carbon nanomaterials, it can be estimated in order of µg/L or even ng/L [51,52]. The calculated EC10 concentration for CNTs was between 1 and 2 mg/L, and for GrO between 8 and 35 mg/L, based on the results of 96 h and 7 days of exposure (Table 1). This level of toxicity surpass the possible environmentally relevant concentrations of CNMs in several orders of magnitude. However, it is important to establish the level of toxicity for different materials and consider their possible transformation and combined action with other toxicants in the environment.
Environmental transformation, such as agglomeration, interaction with natural organic mater (NOM), “biomolecular corona” formation, and interaction with organisms can change the bioavailability and toxicity of CNMs [53,54]. This study revealed that the most stable used CNMs was GrO, which showed no changes in FTIR and Raman spectra after the incubation with microalgae. CNTs obtained only CH2 and CH3 inclusions and has no structural defects. C60 except CH2 and CH3 inclusions was oxygenated and obtained more disordered structure. Gr undergo inclusion of amide group and indicated structural disorder. Based on the results of biotransformation study, it should be concluded that structural disorders were increased only in samples with lowest toxicity (C60 and Gr). The contact H. akashiwo with these types of CNMs were less dangerous to microalgae cells, which allowed them to have more interaction.
Further study should implement more species from different trophic levels in the assessment of different common fictionized and pure CNMs, including the assessment of food chain transfer.
4. Materials and Methods
4.1. Nanoparticles
In this work we used four types of CNMs (Table 1), namely multiwalled carbon nanotubes (CNTs), fullerene (C60), graphene powder (Gr), and graphene oxide (GrO). These types of NPs were chosen to compare the toxic effects and biotransformation between different CNMs in contact with marine microalgae H. akashiwo.
4.2. Microalgae Culture
The culture of a raphidophyte microalgae Heterosigma akashiwo (Raphidophyceae) [28] was provided by The Resource Collection Marine biobank of the National Scientific Center of Marine Biology, Far Eastern Branch of the Russian Academy of Sciences (NSCMB FEB RAS). H. akashiwo is a useful object for bioassays and it is commonly used in ecotoxicology [55,56,57]. It should be highlighted that the cells of H. akashiwo does not have a shell compared to most of the algae species, instead the cells have amorphous vesicles under the cell wall [28]. H. akashiwo has a mixed feeding, which includes photosynthesis, direct nutrition uptake, and eating of the bacterium [58].
Culturing of microalgae and toxicity test conditions were maintained following the guidance of OECD No.201 [59] with minor modifications as stated below. Microalgae were cultured with Guillard’s f/2 medium [60]. Filtered (pore diameter of the filter was 0.22 µm) and sterilized seawater with salinity 33 ± 1‰, pH 8.0 ± 0.2 was used for the experiments. The cultivation was carried out at a temperature of 20 ± 2 °C with an illumination intensity of 300 µmol photons/m2s, and a light:dark cycle of 12:12 h. All the bioassays were performed at the same conditions.
Before the experiment microalgae cells were cultivated in 250 mL Erlenmeyer’s flasks. Algal culture in the exponential growth phase was taken for bioassays. The initial cell density for all the bioassays was 1.5–2 ×10⁴ cells per mL.
4.3. Experimental Desigh and Sample Preparation
In general, all the performed experiments can be divided into three following parts: (1) microalgae growth inhibition assessment, (2) evaluation of cellular biochemical responses, and (3) the assessment of CNMs biotransformation by FTIR and Raman spectroscopy.
Before each series of the experiments, the used CNMs were diluted into filtered and sterilized seawater (the same as used for microalgae culturing) to exclude negative impact of salinity change on microalgae. The prepared stock concentration for all the used CNMs was 250 mg/mL. To prevent the agglomeration of NPs, the stock suspensions were sonicated with ultrasound homogenizer Bandelin Sonopuls GM 3100 (Bandelin Electronic GmbH & Co. KG, Germany) with the high-frequency power of 100W for 30 minutes. The sonication was performed on ice in 40 mL Sonopuls Rosette cell RZ-2 to prevent sample heating.
The first part of the study, namely the growth rate inhibition test, was performed in 24-well plates, where each well contained 1 mL of microalgae aliquots and 1 mL of the tested sample. The wells of a control group had only 1 mL of microalgae aliquots with addition of 1 mL of f/2 medium. The treated wells had 1 mL of microalgae, and the other 1 mL of liquid included calculated volume of the prepared CNMs stock suspension and f/2 medium to obtain the final exposure concentrations of 1, 5, 10, 25, 50, 75, 100, and 125 mg/mL. All the concentrations and control group for each tested CNM were executed in quadruplicate. Cell count was performed with a flow cytometer CytoFLEX (Beckman Coulter, Indianapolis, IN, USA) after 96 h and 7 days of the exposure. The protocol of cell count and post processing of the results described in the following section.
The second part of the study, which was the evaluation of cellular biochemical responses, included the assessment of esterase activity, membrane potential, and ROS generation changes in microalgae cells. These tests were performed separately in 24-well plates as described above, but the used final exposure concentrations were 1, 10, 25, and 50 mg/L. The concentrations were chosen based on the calculated in the previous stage EC10 and EC50 values. The measurements were executed after 3 and 24 h of the exposure to assess early response and its further dynamic. To assess the chosen biochemical responses, the sample from each well of 24-well plates was gently pipetted and 500 µL of liquid was transferred in 48-well plate and stained with fluorescent dyes as described in the following section. All the used concentrations and control group were executed in quadruplicate.
The third part of the study included the assessment of CNMs biotransformation. This experimental series was performed in 250 mL Erlenmeyer’s flasks. To evaluate the transformation of CNMs after the incubation with microalgae cells, all the used CNMs were incubated separately in filtered sterilized seawater (comparative control) and with microalgae aliquot (treatment). The only chosen concentration of CNMs was 25 mg/L. The total volume of liquid in each replicate was 100 mL, which included 50 mL of CNMs suspension and either 50 mL of seawater, or 50 mL of microalgae aliquot. All the tests were performed in triplicate. The duration of exposure was seven days. Every day the flasks were gently shaken.
The method of CNMs separation for FTIR analysis was described in work of Chouhan et al. (2016) [61]. After seven days, all the samples were collected and centrifuged in 50 mL centrifuge tubes with Eppendorf Centrifuge 5810R (Eppendorf, Hamburg, Germany) at 3900 rpm and 4 °C for 20 minutes. The pellets were washed once with deionized water obtained with Siemens Ultra-Clear TWF EDI UV UF TM Water Purification System (Siemens, Munich, Germany) and three times with methanol. To detach microalgae cells and cell debris, the samples were sonicated by ultrasound homogenizer with the high-frequency power of 40W for 5 minutes. Then the samples were centrifuged at the same conditions as before, supernatant was withdrawn, and CNMs from the pellets were phase separated in 1:1 mixture of hexane and deionized water. The separated NMs were collected from the thin ring on the phase-contact area and transferred to glass vials. The samples were dried in the oven overnight at 100 °C and stored in a desiccator until used for FTIR and Raman spectroscopy analysis. The samples with microalgae and the once with only seawater were collected by completely the same procedure to exclude the impact of different separation protocol.
4.4. Flow Cytometry: Cell Count, Staining Protocols, and Post Processing
CytoFLEX flow cytometer (Beckman Coulter, Indianapolis, IN, USA) with the software package CytExpert v.2.5 was used to measure the growth rate inhibition, size and biochemical changes in microalgae cells after the exposure to CNMs. The application of fluorescence dyes allowed to distinguish live and dead microalgae cells and evaluate biochemical changes in exposed microalgae cells. All the used endpoints and parameters of their registration are summarized in Table 4. In all the cases, the excitation source was a blue laser (488 nm) of the CytoFLEX flow cytometer. The excitation source and emission channels were selected according to the maximum emission of the used fluorescent dyes, provided by the manufacturer (Molecular Probes, Eugene, OR, USA). The optimization of the used dyes concentrations and duration of staining were described in our previous work [62] and reevaluated directly before each series of the measurements.
The evaluation of microalgae growth rate inhibition was completed with direct cell counting. Microalgae cells were distinguished using the parameters of microalgae cell size and granularity (in dot cytogram of forward and side scattering of blue laser), and fluorescence of chlorophyll a (emission channel 690 nm). To exclude dead cells from the count, the probes were stained with propidium iodide (PI) according to the standard bioassay protocol [63]. The mechanism of PI action is the incorporation between DNA or RNA base pairs, whereupon the dye increases its fluorescence intensity by 20–30 times [64]. Since PI is not able to penetrate intact membranes of living cells, the cells with dramatically increased fluorescent intensity in the emission filter of 610 nm should be considered and excluded from the count.
In this series of the assays, each sample was measured at a flow rate of 50 μl/min for 30 s. During the cell count, the number of cells in the control group was taken as 100%. Based on the obtained results, we determined no effect level concentrations (NOEL) and calculated the effective concentrations of the CNMs caused 10% (EC10) and 50% (EC50) inhibition of microalgae growth rate after 96 h and 7 days of exposure. The calculation of EC10 and EC50 values were performed by nonlinear regression fit in GraphPad Prism 8.0.2 (GraphPad Software, San Diego, CA, USA). The 96 h and 7 days EC10 and EC50 descriptors were chosen as one of the most common values used for evaluation cytotoxic effects in macroalgae bioassay [65,66].
To determine the size of microalgae cells, a size calibration kit, batch F13838 (Molecular Probes, Eugene, OR, USA) with the certified size distribution of 1, 2, 4, 6, 10, and 15 μm was used for the forward scatter emission channel. The distribution of control group cells between the size ranges was taken as 100%.
The change in esterase activity of microalgae exposed to the CNMs was evaluated using non-fluorescent lipophilic dye fluorescein diacetate (FDA), which activates under the influence of microalgae esterases [67]. Thus, the changes in metabolic activity of microalgae cells can be evaluated according to the intensity of fluorescein fluorescence inside the cells, registered in the emission filter of 525 nm.
Membrane potential of microalgae cells was assessed by a lipophilic, positively charged fluorescent dye 3,3′-dihexyloxacarbocyanine iodide (DiOC6), which is capable of binding to membranes (mitochondria and endoplasmic reticulum) and other hydrophobic negatively charged cell structures [68]. If the inner membrane potential of the cell decreases and the cells become more electronegative compared to control then more of the dye will be absorbed, which indicates hyperpolarization. If the membrane potential increases and the cell becomes less electronegative compared to the control group, the dye will be removed from the cell and thus indicate depolarization [69].
The level of reactive oxygen species (ROS) generation in microalgae cells exposed to the nanoparticles was assessed using non-fluorescent dye 2',7'-dichlorodihydrofluorescein diacetate (H2DCFDA) which activates in the presence of ROS and indicate general oxidative stress in microalgae cells [70]. The efficiency of the staining was furthermore checked by the test with addition of 1.7 µM hydrogen peroxide, which increased MFI of the cells in order of magnitude.
In the cases of esterase activity, membrane potential, and ROS generation changes, the flow cytometry measurements were performed at a flow rate of 100 μl/min until 2000 cells were registered to adequately compare cellular responses in each treatment conditions. In this series of the assays, the MFI of the control group cells in 525 nm filter was taken as 100% and considered as positive control. To obtain negative control level, microalgae cells were heat treated at 98 °C for 15 minutes, cooled at room temperature, and measured the same way as the other samples in this series (in quadruplicate). The MFI of negative control group was taken as 0%. All the obtained results were normalized using the data of control groups. Based on the obtained results, we determined NOEL concentrations for each endpoint and compared the cellular responses to different treatment conditions. The 3 and 24 h registration points allows to detect possible early metabolic response of the algae over short exposure periods and dynamic change of that response, respectfully [71,72].
4.5. Microscopy
Morphological changes of microalgae cells were observed and captured by optical microscope Axio Observer A1 (Carl Zeiss, Oberkochen, Germany).
4.6. FTIR and Raman spectroscopy
The samples obtained as described in section 4.3 were analyzed by IRTracer-100 FTIR spectrometer (Shimadzu, Kyoto Japan) with a DTGS detector. In total 100 scans with a wide spectral range from 400 to 4000 cm−1 were collected in order to obtain appropriate signal to noise ratio. The spectral resolution was set to 4 cm-1. The prepared samples were mixed with 300 mg of potassium bromide powder (KBr) at concentration 0.03 wt%. The mixture were pressed in pellet for 10 minutes at 10 ton (Ø 13 mm).
Raman spectra were collected with a NTEGRA II Raman microscope and spectrometer (NT-MDT Spectrum Instruments, Moscow, Russia) equipped with a 473 nm laser and a 100 fold objective. Signal accumulation time for each measurement was 30 seconds. The spectra were analyzed by a grating-type spectrometer (diffraction grating 1800 lines/mm) with an electrically cooled CCD camera.
4.7. Statistical Analysis
Statistical analyzes were performed by GraphPad Prism 8.0.2 (GraphPad Software, San Diego, CA, USA). The statistical significance was tested by one-way ANOVA with Dunnett's multiple comparisons test. Normality of residuals was checked by the Anderson-Darling test. A value of p ≤ 0.05 was considered statistically significant.
5. Conclusions
In general, this study demonstrated the level of toxicity and mode of toxic action of multiwalled carbon nanotubes (CNTs), fullerene (C60), graphene powder (Gr), and graphene oxide (GrO) in microalgae H.akashiwo. The toxic impact of used CNMs on microalgae growth rate reduces in the following order: CNTs > GrO > Gr > C60. Oxidative stress and membrane depolarization was indicated among the main toxic action of CNTs and GrO. At the same time, Gr and C60 reduced the toxic action with time and had no negative impact on microalgae even at concentration of 125 mg/L. Moreover, this study revealed the presence of structural deformation in C60 and Gr after seven days of the contact with microalgae cells. Therefore, the results of biotransformation assay correlate with the toxic properties of the CNMs, and less toxic materials more likely to be transformed after the contact with aquatic organisms.
Supplementary Materials
The following supporting information can be downloaded at the website of this paper posted on Preprints.org, Table S1: The statistical significance calculation of growth rate inhibition, cell size change, esterase activity, membrane potential, and ROS generation in H. akashiwo cells.
Author Contributions
Conceptualization, K.P.; methodology, K.P. and S.A.J.; validation, R.S.A.; investigation, K.P.; resources, S.A.J. and R.S.A.; writing—original draft preparation, K.P.; writing—review and editing, K.G.; visualization, K.P.; project administration, K.P.; funding acquisition, K.P. All authors have read and agreed to the published version of the manuscript.
Funding
The work was supported by the Russian Science Foundation (RSF), project number 21-74-00023.
Institutional Review Board Statement
Not applicable.
Informed Consent Statement
Not applicable.
Data Availability Statement
Not applicable.
Conflicts of Interest
The authors declare no conflict of interest.
References
- Jordan, C.C.; Kaiser, I.; Moore, V.C. 2013 nanotechnology patent literature review: Graphitic carbon-based nanotechnology and energy applications are on the rise. Nanotech. L. & Bus. 2014, 11, 111. [Google Scholar]
- Debnath, S.K.; Srivastava, R. Drug delivery with carbon-based nanomaterials as versatile nanocarriers: progress and prospects. Frontiers in Nanotechnology 2021, 3, 644564. [Google Scholar] [CrossRef]
- Zhang, J.-N. Carbon-Based Nanomaterials for Energy Conversion and Storage: Applications in Electrochemical Catalysis; Springer Nature: Berlin/Heidelberg, Germany, 2022; Volume 325. [Google Scholar]
- Mishra, R.; Militky, J. Nanotechnology in textiles: theory and application; Woodhead Publishing: Cambridge, UK, 2018. [Google Scholar]
- Zhou, X.; et al. Production, structural design, functional control, and broad applications of carbon nanofiber-based nanomaterials: A comprehensive review. Chemical Engineering Journal 2020, 402, 126189. [Google Scholar] [CrossRef]
- Maiti, D.; et al. Carbon-based nanomaterials for biomedical applications: a recent study. Frontiers in pharmacology 2019, 9, 1401. [Google Scholar] [CrossRef]
- Eivazzadeh-Keihan, R.; et al. Applications of carbon-based conductive nanomaterials in biosensors. Chemical Engineering Journal 2022, 136183. [Google Scholar] [CrossRef]
- Makvandi, P.; et al. Biofabricated nanostructures and their composites in regenerative medicine. ACS Applied Nano Materials 2020, 3, 6210–6238. [Google Scholar] [CrossRef]
- Liu, H.; et al. Carbon-based nanomaterials for bone and cartilage regeneration: a review. ACS Biomaterials Science & Engineering 2021, 7, 4718–4735. [Google Scholar]
- Yogeswari, B.; et al. Role of carbon-based nanomaterials in enhancing the performance of energy storage devices: Design small and store big. Journal of Nanomaterials 2022, 2022. [Google Scholar] [CrossRef]
- Zhu, C.-y.; et al. Design and synthesis of carbon-based nanomaterials for electrochemical energy storage. New Carbon Materials 2022, 37, 59–92. [Google Scholar] [CrossRef]
- Liu, D.; et al. Recent advances in MOF-derived carbon-based nanomaterials for environmental applications in adsorption and catalytic degradation. Chemical Engineering Journal 2022, 427, 131503. [Google Scholar] [CrossRef]
- Smith, S.C.; Rodrigues, D.F. Carbon-based nanomaterials for removal of chemical and biological contaminants from water: A review of mechanisms and applications. Carbon 2015, 91, 122–143. [Google Scholar] [CrossRef]
- Cardoso, C.E.; et al. Recovery of rare earth elements by carbon-based nanomaterials—a review. Nanomaterials 2019, 9, 814. [Google Scholar] [CrossRef]
- Iftekhar, S.; et al. Porous materials for the recovery of rare earth elements, platinum group metals, and other valuable metals: a review. Environmental Chemistry Letters 2022, 20, 3697–3746. [Google Scholar] [CrossRef]
- Kotia, A.; et al. Carbon nanoparticles as sources for a cost-effective water purification method: A comprehensive review. Fluids 2020, 5, 230. [Google Scholar] [CrossRef]
- Madima, N.; et al. Carbon-based nanomaterials for remediation of organic and inorganic pollutants from wastewater. A review. Environmental Chemistry Letters 2020, 18, 1169–1191. [Google Scholar] [CrossRef]
- Abbas, A.; et al. Heavy metal removal from aqueous solution by advanced carbon nanotubes: critical review of adsorption applications. Separation and Purification Technology 2016, 157, 141–161. [Google Scholar]
- Shojaei, T.R.; et al. Applications of nanotechnology and carbon nanoparticles in agriculture, in Synthesis, technology and applications of carbon nanomaterials; Elsevier: Amsterdam, The Netherlands, 2019; pp. 247–277. [Google Scholar]
- Malhotra, N.; et al. Toxicity studies on graphene-based nanomaterials in aquatic organisms: Current understanding. Molecules 2020, 25, 3618. [Google Scholar] [CrossRef] [PubMed]
- Turan, N.B.; et al. Nanoparticles in the aquatic environment: Usage, properties, transformation and toxicity-A review. Process Safety and Environmental Protection 2019, 130, 238–249. [Google Scholar] [CrossRef]
- Gupta, N.; Gupta, S.M.; Sharma, S. Carbon nanotubes: Synthesis, properties and engineering applications. Carbon Letters 2019, 29, 419–447. [Google Scholar] [CrossRef]
- Jiang, L.; LGao; Sun, J. Production of aqueous colloidal dispersions of carbon nanotubes. Journal of colloid and interface science 2003, 260, 89–94. [Google Scholar] [CrossRef] [PubMed]
- Yadav, B.; Kumar, R. Structure, properties and applications of fullerenes. International Journal of Nanotechnology and Applications 2008, 2, 15–24. [Google Scholar]
- Alargova, R.G.; Deguchi, S.; Tsujii, K. Stable colloidal dispersions of fullerenes in polar organic solvents. Journal of the American Chemical Society 2001, 123, 10460–10467. [Google Scholar] [CrossRef]
- Hu, X.; Zhou, M.; Zhou, Q. Ambient water and visible-light irradiation drive changes in graphene morphology, structure, surface chemistry, aggregation, and toxicity. Environmental Science & Technology 2015, 49, 3410–3418. [Google Scholar]
- Su, Y.; et al. Colloidal properties and stability of aqueous suspensions of few-layer graphene: Importance of graphene concentration. Environmental Pollution 2017, 220, 469–477. [Google Scholar] [CrossRef] [PubMed]
- Hara, Y.; Chihara, M. MORPHOLOGY, ULTRASTRUCTURE AND TAXONOMY OF THE RAPHIDOPHYCEAN ALGA HETEROSIGMA-AKASHIWO. Botanical Magazine-Tokyo 1987, 100, 151–163. [Google Scholar] [CrossRef]
- Ţucureanu, V.; Matei, A.; Avram, A.M. FTIR spectroscopy for carbon family study. Critical reviews in analytical chemistry 2016, 46, 502–520. [Google Scholar] [CrossRef] [PubMed]
- Baykal, A.; et al. Acid functionalized multiwall carbon nanotube/magnetite (MWCNT)-COOH/Fe 3 O 4 hybrid: synthesis, characterization and conductivity evaluation. Journal of Inorganic and Organometallic Polymers and Materials 2013, 23, 726–735. [Google Scholar] [CrossRef]
- Liao, L.; Pan, C. Enhanced electrochemical capacitance of nitrogen-doped carbon nanotubes synthesized from amine flames. Soft Nanosci. Lett 2011, 1, 16–23. [Google Scholar] [CrossRef]
- Indeglia, P.A.; et al. Physicochemical characterization of fullerenol and fullerenol synthesis by-products prepared in alkaline media. Journal of nanoparticle research 2014, 16, 1–15. [Google Scholar] [CrossRef]
- Katiyar, R.; Bag, D.S.; Nigam, I. Synthesis and evaluation of swelling characteristics of fullerene (C60) containing cross-linked poly (2-hydroxyethyl methacrylate) hydrogels. Advanced Materials Letters 2014, 5, 214–222. [Google Scholar] [CrossRef]
- Menon, M.; Richter, E.; Subbaswamy, K. Structural and vibrational properties of fullerenes and nanotubes in a nonorthogonal tight-binding scheme. The Journal of chemical physics 1996, 104, 5875–5882. [Google Scholar] [CrossRef]
- Iglesias-Groth, S.; Cataldo, F.; Manchado, A. Infrared spectroscopy and integrated molar absorptivity of C60 and C70 fullerenes at extreme temperatures. Monthly Notices of the Royal Astronomical Society 2011, 413, 213–222. [Google Scholar] [CrossRef]
- Obreja, A.C.; et al. Isocyanate functionalized graphene/P3HT based nanocomposites. Applied Surface Science 2013, 276, 458–467. [Google Scholar] [CrossRef]
- Bykkam, S.; et al. Synthesis and characterization of graphene oxide and its antimicrobial activity against klebseilla and staphylococus. International Journal of Advanced Biotechnology and Research 2013, 4, 142–146. [Google Scholar]
- Dou, Y.-y.; et al. Flexible free-standing graphene-like film electrode for supercapacitors by electrophoretic deposition and electrochemical reduction. Transactions of Nonferrous Metals Society of China 2014, 24, 1425–1433. [Google Scholar] [CrossRef]
- Cardol, P.; Forti, G.; Finazzi, G. Regulation of electron transport in microalgae. Biochimica et Biophysica Acta (BBA)-Bioenergetics 2011, 1807, 912–918. [Google Scholar] [CrossRef] [PubMed]
- Liang, S.X.T.; et al. Toxicity of metals and metallic nanoparticles on nutritional properties of microalgae. Water, Air, & Soil Pollution 2020, 231, 1–14. [Google Scholar]
- Sanchez, V.C.; et al. Biological interactions of graphene-family nanomaterials: an interdisciplinary review. Chemical research in toxicology 2012, 25, 15–34. [Google Scholar] [CrossRef] [PubMed]
- Leonardo, T.; et al. Determination of elemental distribution in green micro-algae using synchrotron radiation nano X-ray fluorescence (SR-nXRF) and electron microscopy techniques–subcellular localization and quantitative imaging of silver and cobalt uptake by Coccomyxa actinabiotis. Metallomics 2014, 6, 316–329. [Google Scholar]
- Ameri, M.; et al. Aluminium triggers oxidative stress and antioxidant response in the microalgae Scenedesmus sp. Journal of plant physiology 2020, 246, 153114. [Google Scholar] [CrossRef] [PubMed]
- Trenfield, M.A.; et al. Aluminium, gallium, and molybdenum toxicity to the tropical marine microalga Isochrysis galbana. Environmental toxicology and chemistry 2015, 34, 1833–1840. [Google Scholar] [CrossRef]
- Zhang, Y.; et al. Humic acid alleviates the ecotoxicity of graphene-family materials on the freshwater microalgae Scenedesmus obliquus. Chemosphere 2018, 197, 749–758. [Google Scholar] [CrossRef] [PubMed]
- Hazeem, L.J.; et al. Toxicity effect of graphene oxide on growth and photosynthetic pigment of the marine alga Picochlorum sp. during different growth stages. Environmental Science and Pollution Research 2017, 24, 4144–4152. [Google Scholar] [CrossRef] [PubMed]
- Long, Z.F.; et al. Systematic and Quantitative Investigation of the Mechanism of Carbon Nanotubes' Toxicity toward Algae. Environmental Science & Technology 2012, 46, 8458–8466. [Google Scholar]
- Hu, X.; et al. Interactions between graphene oxide and plant cells: Regulation of cell morphology, uptake, organelle damage, oxidative effects and metabolic disorders. Carbon 2014, 80, 665–676. [Google Scholar] [CrossRef]
- Schwab, F.; et al. Are Carbon Nanotube Effects on Green Algae Caused by Shading and Agglomeration? Environmental Science & Technology 2011, 45, 6136–6144. [Google Scholar]
- Kim, H.; Spivack, A.J. Menden-Deuer, S. pH alters the swimming behaviors of the raphidophyte Heterosigma akashiwo: implications for bloom formation in an acidified ocean. Harmful Algae 2013, 26, 1–11. [Google Scholar] [CrossRef]
- Nouara, A.; et al. Carboxylic acid functionalization prevents the translocation of multi-walled carbon nanotubes at predicted environmentally relevant concentrations into targeted organs of nematode Caenorhabditis elegans. Nanoscale 2013, 5, 6088–6096. [Google Scholar] [CrossRef] [PubMed]
- Reed, R.B.; et al. Detection of single walled carbon nanotubes by monitoring embedded metals. Environmental Science: Processes & Impacts 2013, 15, 204–213. [Google Scholar]
- Pikula, K.; Johari, S.A.; Golokhvast, K. Colloidal Behavior and Biodegradation of Engineered Carbon-Based Nanomaterials in Aquatic Environment. Nanomaterials 2022, 12, 4149. [Google Scholar] [CrossRef]
- Neagu, M.; et al. Protein bio-corona: critical issue in immune nanotoxicology. Archives of toxicology 2017, 91, 1031–1048. [Google Scholar] [CrossRef]
- Pikula, K.; et al. Individual and Binary Mixture Toxicity of Five Nanoparticles in Marine Microalga Heterosigma akashiwo. International Journal of Molecular Sciences 2022, 23, 990. [Google Scholar] [CrossRef] [PubMed]
- Wang, J.; et al. Is hydrodynamic diameter the decisive factor?-Comparison of the toxic mechanism of nSiO2 and mPS on marine microalgae Heterosigma akashiwo. Aquatic Toxicology 2022, 252, 106309. [Google Scholar] [CrossRef] [PubMed]
- Ge, J.; et al. Microplastics impacts in seven flagellate microalgae: Role of size and cell wall. Environmental Research 2022, 206, 112598. [Google Scholar] [CrossRef]
- Matcher, G.; Lemley, D.A.; Adams, J.B. Bacterial community dynamics during a harmful algal bloom of Heterosigma akashiwo. Aquatic Microbial Ecology 2021, 86, 153–167. [Google Scholar] [CrossRef]
- OECD, Test No. 201: Freshwater Alga and Cyanobacteria, Growth Inhibition Test. 2011.
- Guillard, R.R.; Ryther, J.H. Studies of marine planktonic diatoms. I. Cyclotella nana Hustedt, and Detonula confervacea (cleve) Gran. Canadian journal of microbiology 1962, 8, 229–239. [Google Scholar] [CrossRef] [PubMed]
- Chouhan, R.S.; et al. Nanomaterial resistant microorganism mediated reduction of graphene oxide. Colloids and Surfaces B: Biointerfaces 2016, 146, 39–46. [Google Scholar] [CrossRef]
- Pikula, K.S.; et al. Toxicity assessment of particulate matter emitted from different types of vehicles on marine microalgae. Environmental Research 2019, 179, 108785. [Google Scholar] [CrossRef]
- Crowley, L.C.; et al. Measuring cell death by propidium iodide uptake and flow cytometry. Cold Spring Harbor Protocols 2016, 2016, pdb. prot087163. [Google Scholar] [CrossRef]
- Suzuki, T.; et al. DNA staining for fluorescence and laser confocal microscopy. Journal of Histochemistry & Cytochemistry 1997, 45, 49–53. [Google Scholar]
- Zhao, Q.; et al. Microalgal microscale model for microalgal growth inhibition evaluation of marine natural products. Scientific reports 2018, 8, 1–10. [Google Scholar] [CrossRef]
- Zhang, C.; et al. Toxic effects of microplastic on marine microalgae Skeletonema costatum: interactions between microplastic and algae. Environmental pollution 2017, 220, 1282–1288. [Google Scholar] [CrossRef] [PubMed]
- Wang, R.; et al. Evaluating the effects of allelochemical ferulic acid on Microcystis aeruginosa by pulse-amplitude-modulated (PAM) fluorometry and flow cytometry. Chemosphere 2016, 147, 264–271. [Google Scholar] [CrossRef] [PubMed]
- Sabnis, R.W.; et al. DiOC(6)(3): a useful dye for staining the endoplasmic reticulum. Biotechnic & Histochemistry 1997, 72, 253–258. [Google Scholar]
- Grégori, G.; et al. A flow cytometric approach to assess phytoplankton respiration, in Advanced Flow Cytometry: Applications in Biological Research; Springer: Dordrecht, The Netherlands, 2003; pp. 99–106. [Google Scholar]
- Baruah, P.; Chaurasia, N. Ecotoxicological effects of alpha-cypermethrin on freshwater alga Chlorella sp.: Growth inhibition and oxidative stress studies. Environmental Toxicology and Pharmacology 2020, 76, 103347. [Google Scholar] [CrossRef] [PubMed]
- Franklin, N.M.; et al. Development of an improved rapid enzyme inhibition bioassay with marine and freshwater microalgae using flow cytometry. Archives of Environmental Contamination and Toxicology 2001, 40, 469–480. [Google Scholar]
- Franklin, N.M.; Stauber, J.L.; Lim, R.P. Development of flow cytometry-based algal bioassays for assessing toxicity of copper in natural waters. Environmental Toxicology and Chemistry: An International Journal 2001, 20, 160–170. [Google Scholar]
Figure 1.
The growth rate inhibition and cell size distribution of H. akashiwo after the exposure to CNMs: (a) growth rate inhibition after 96 h of the exposure; (b) growth rate inhibition after 7 days of the exposure; (c) cell size distribution after 96 h of the exposure; (d) cell size distribution after 7 days of the exposure. *, p < 0.05; **, p < 0.005; ***, p < 0.0005; ****, p < 0.0001. 95% confidence limits presented by the whiskers.
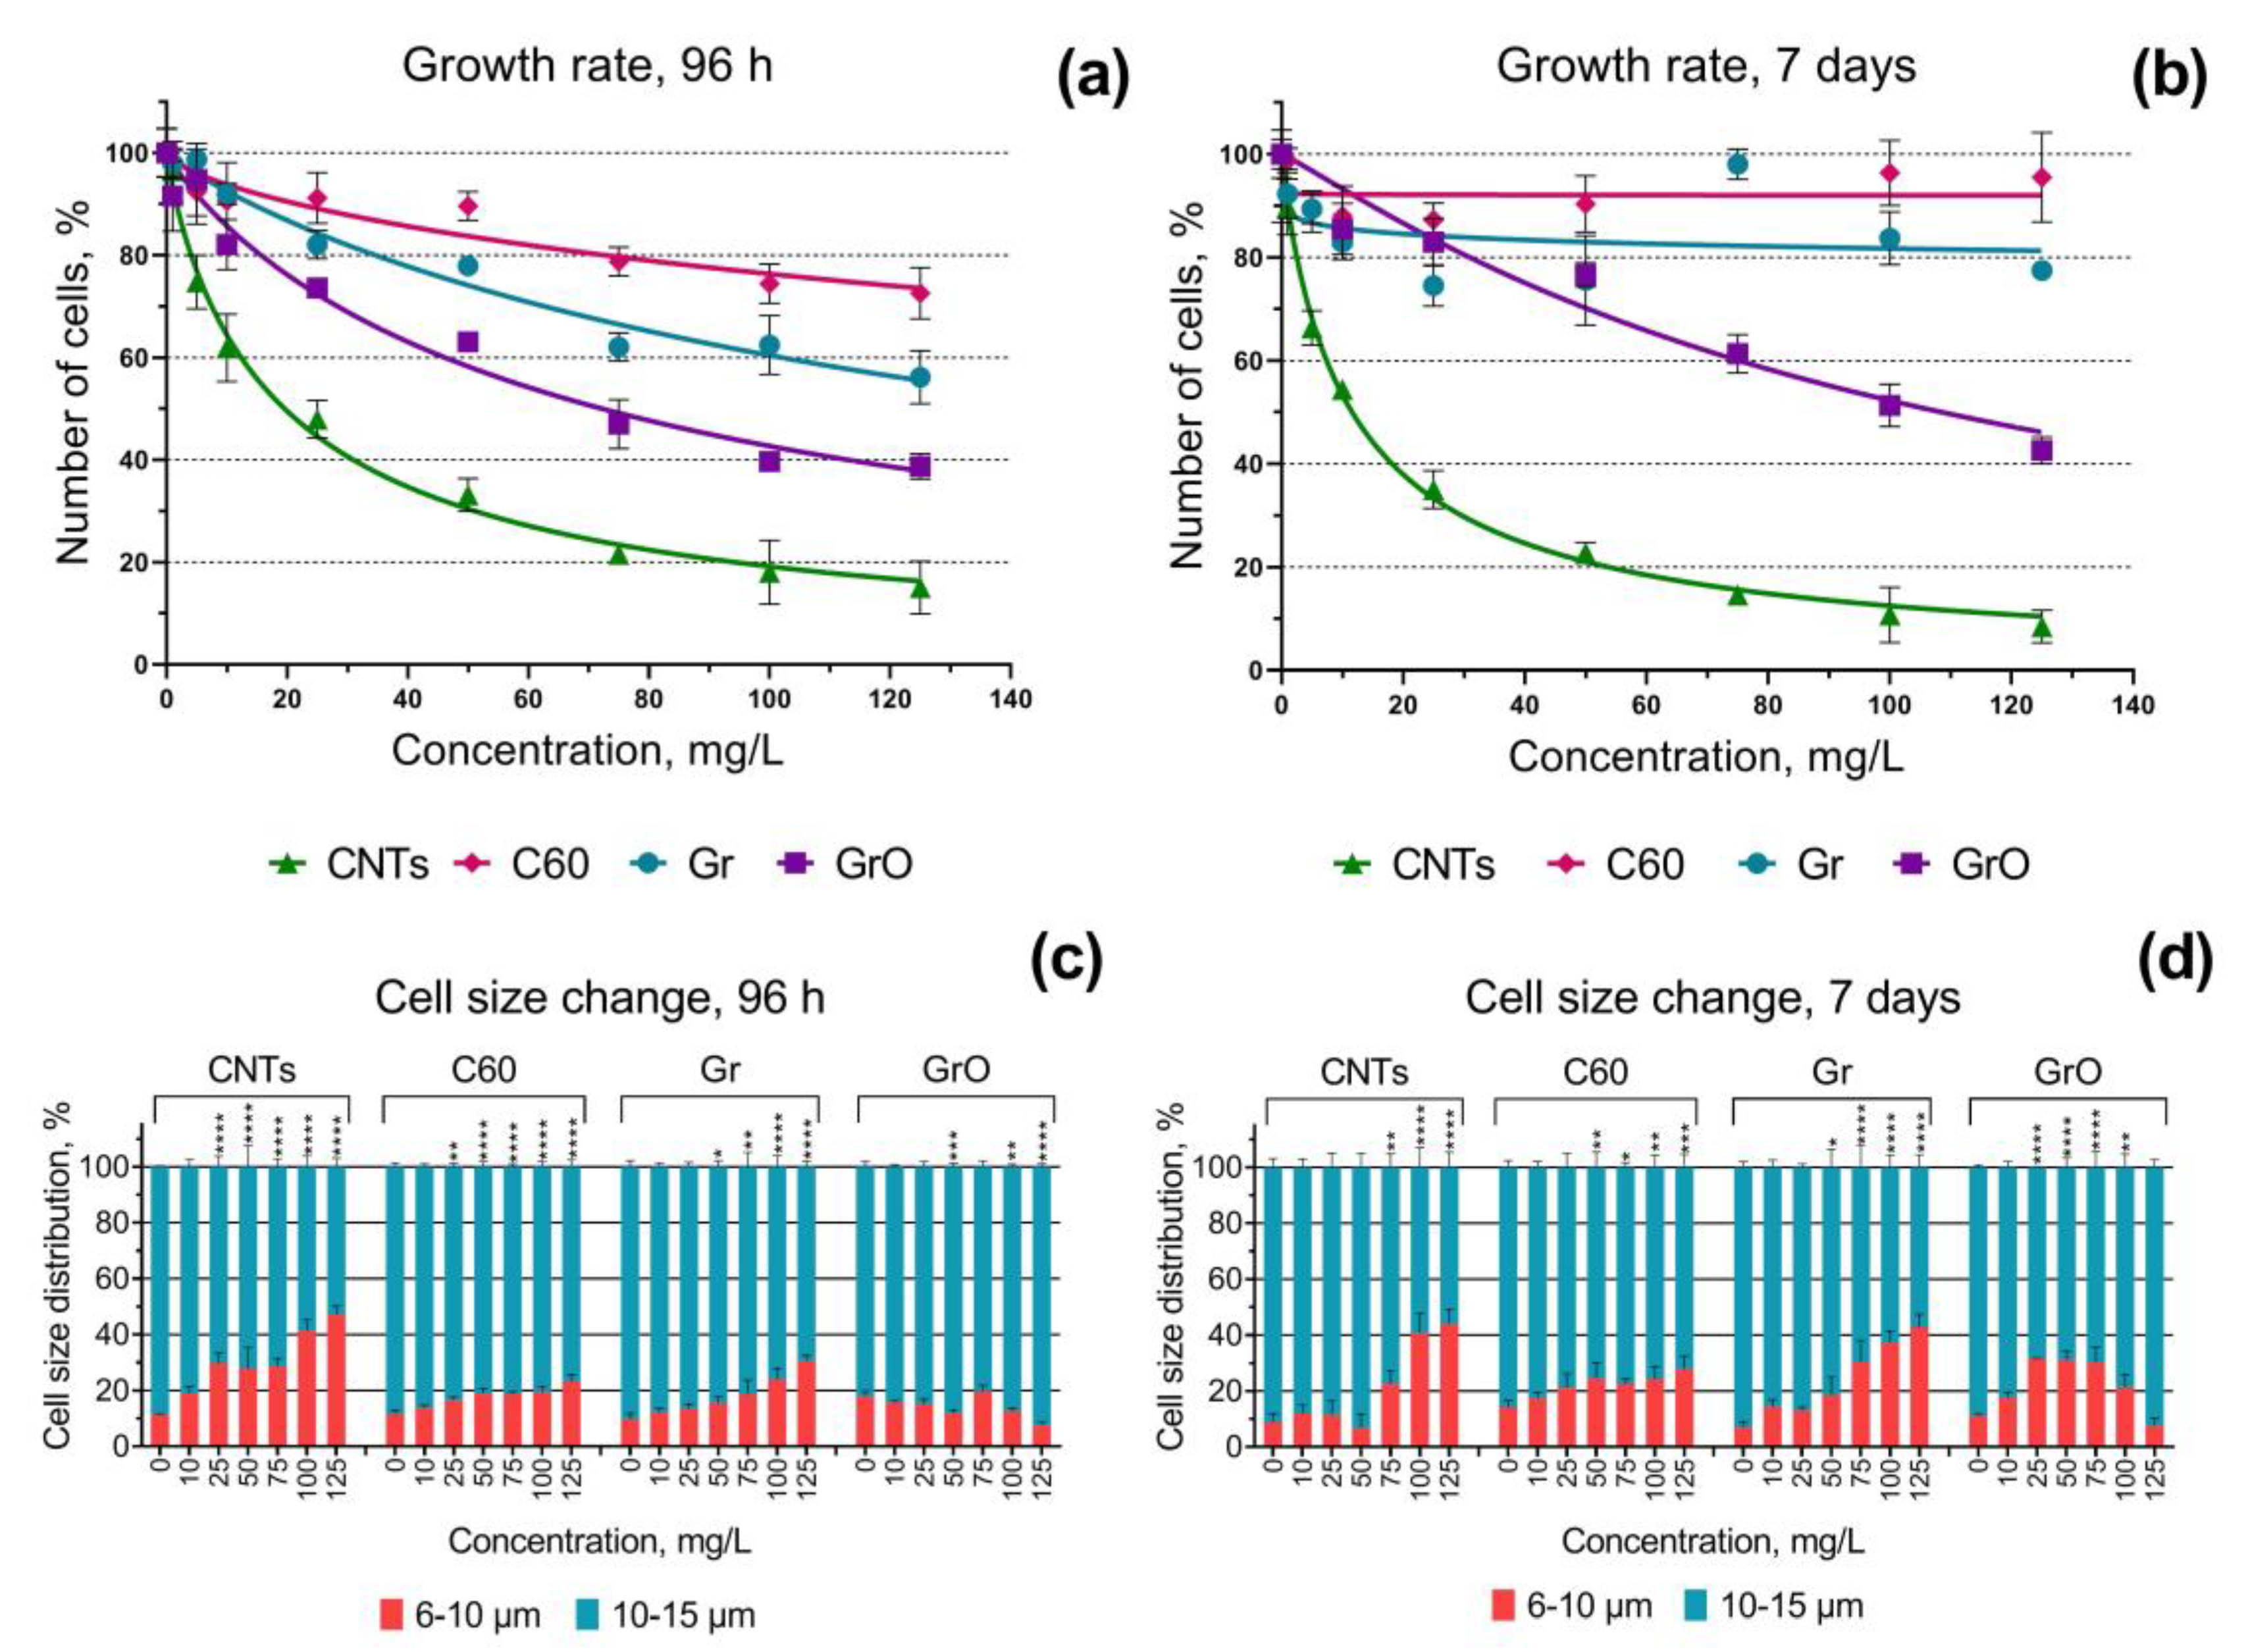
Figure 2.
Microscopic pictures of H. akashiwo from the control group after 7 days of the exposure. Magnification 1000 ×.
Figure 2.
Microscopic pictures of H. akashiwo from the control group after 7 days of the exposure. Magnification 1000 ×.
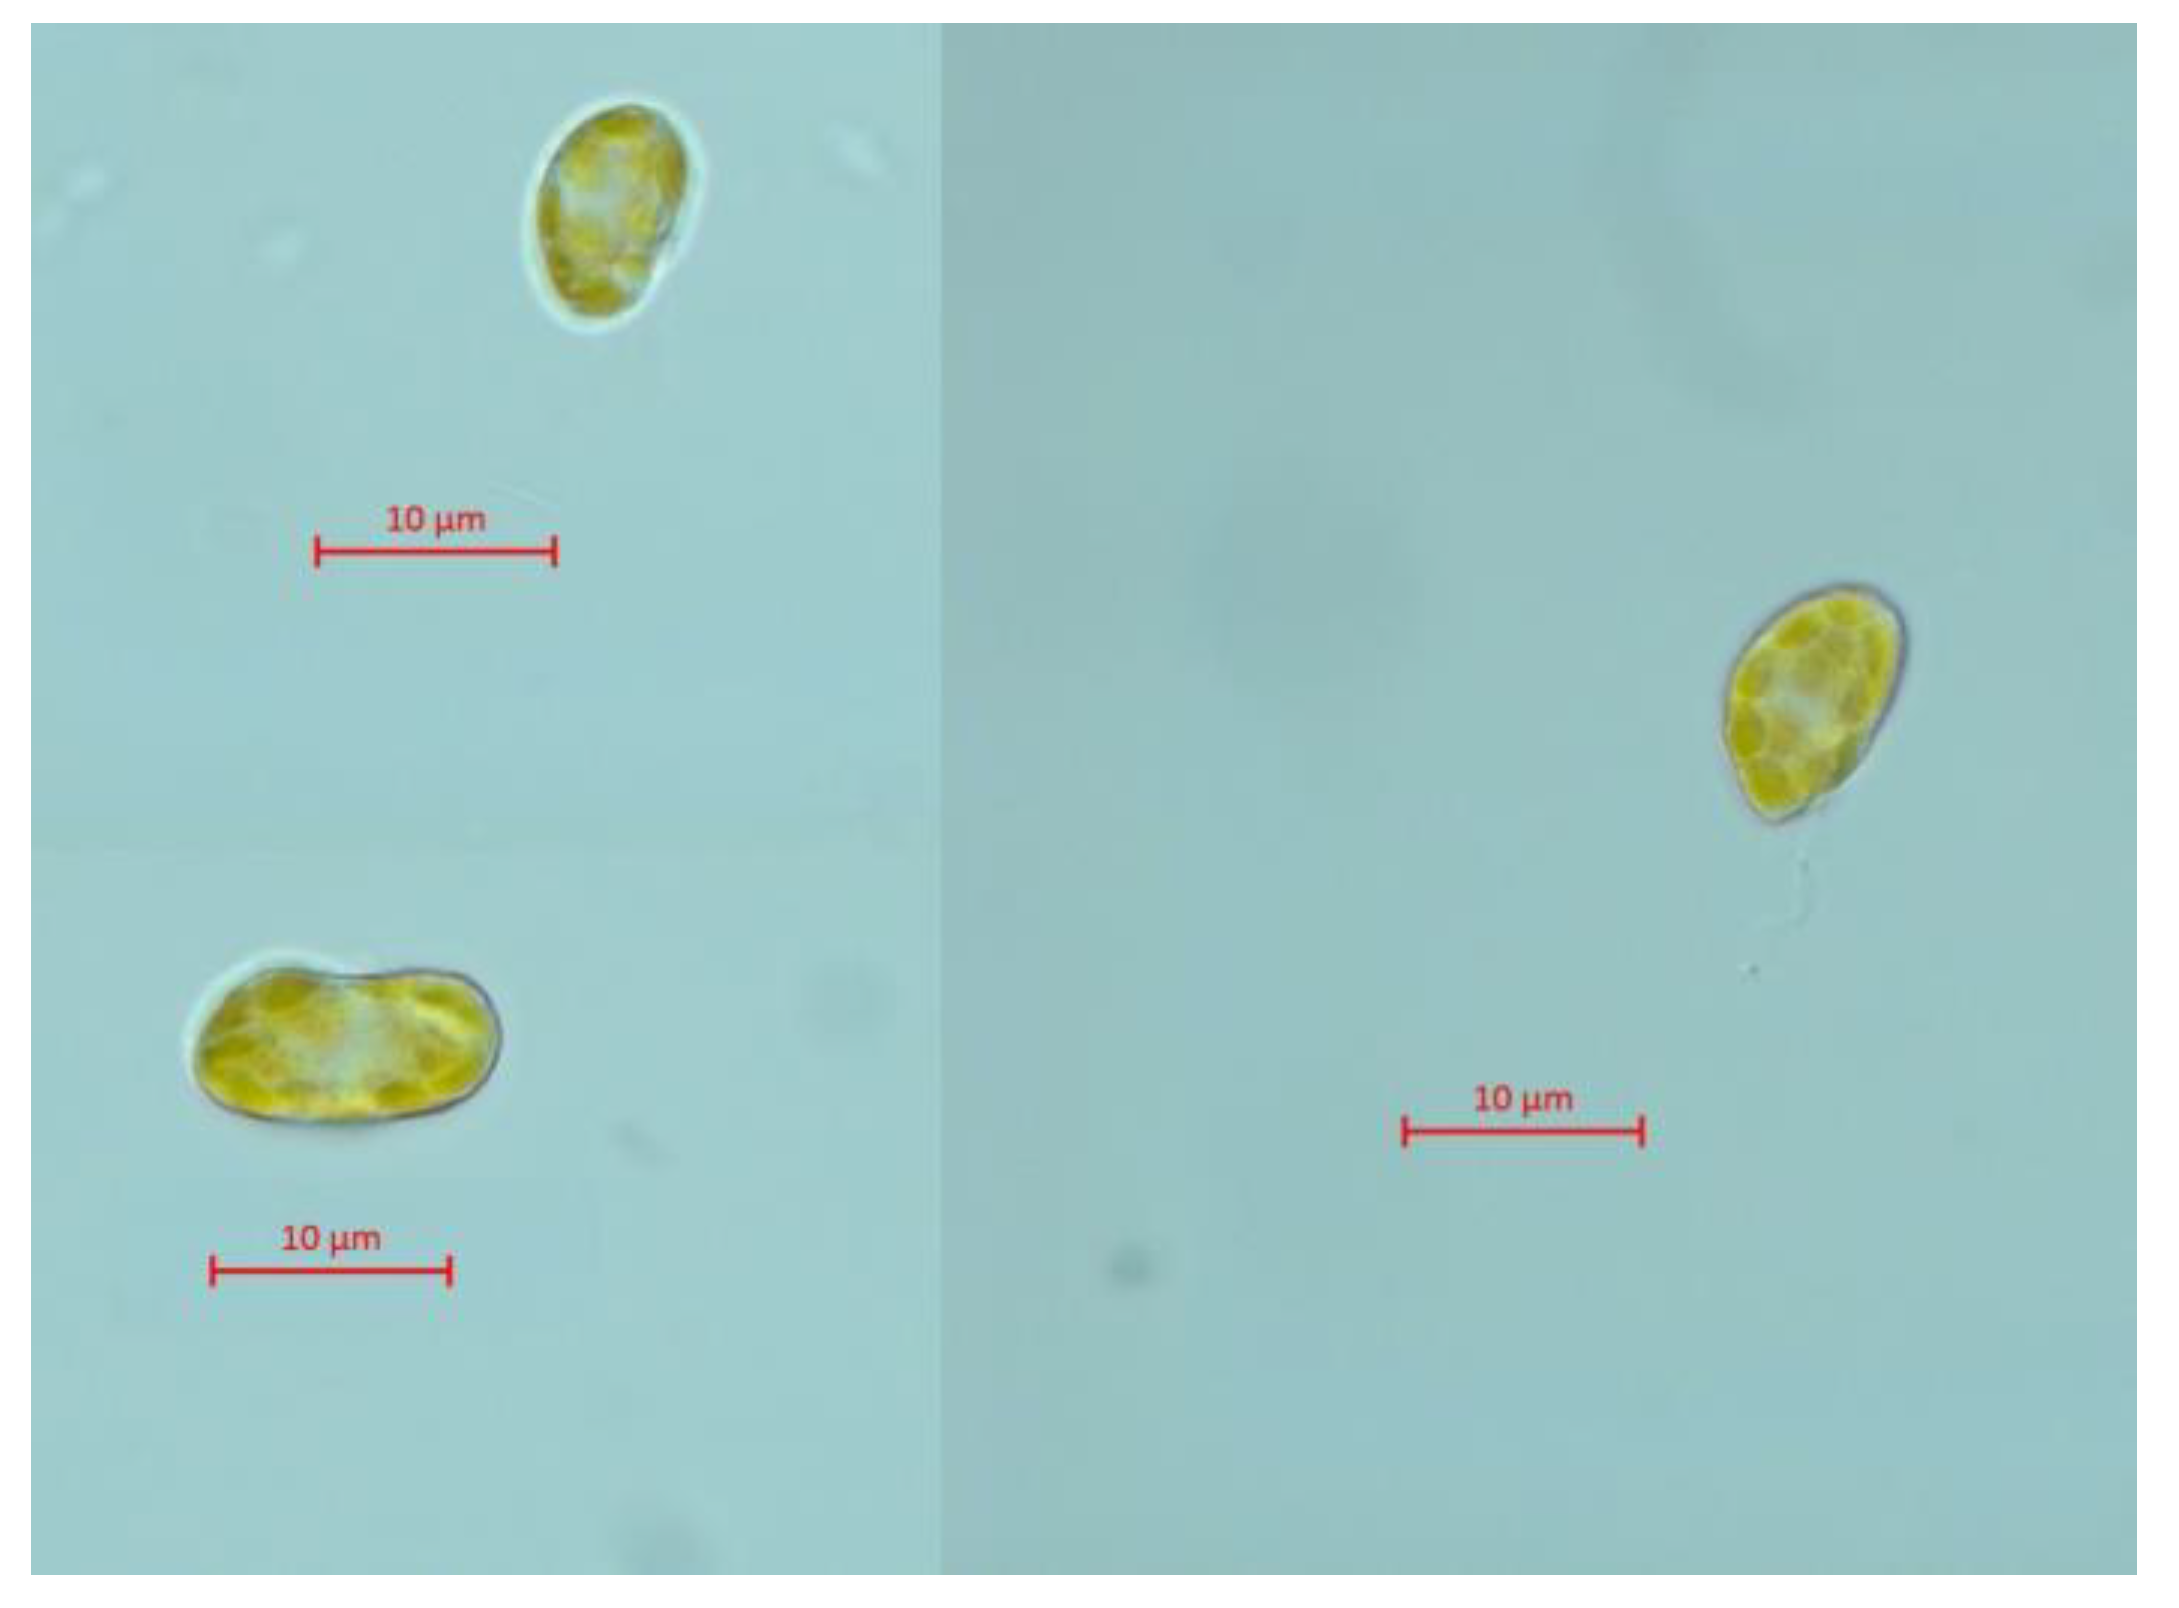
Figure 3.
Microscopic pictures of H. akashiwo cells after 7 days of the exposure to CNMs at concentration of 25 mg/L: (a) multiwalled carbon nanotubes (sample CNTs) (b) fullerene (sample C60); (c) graphene powder (sample Gr); (d) graphene oxide (sample GrO). Magnification 1000 ×.
Figure 3.
Microscopic pictures of H. akashiwo cells after 7 days of the exposure to CNMs at concentration of 25 mg/L: (a) multiwalled carbon nanotubes (sample CNTs) (b) fullerene (sample C60); (c) graphene powder (sample Gr); (d) graphene oxide (sample GrO). Magnification 1000 ×.
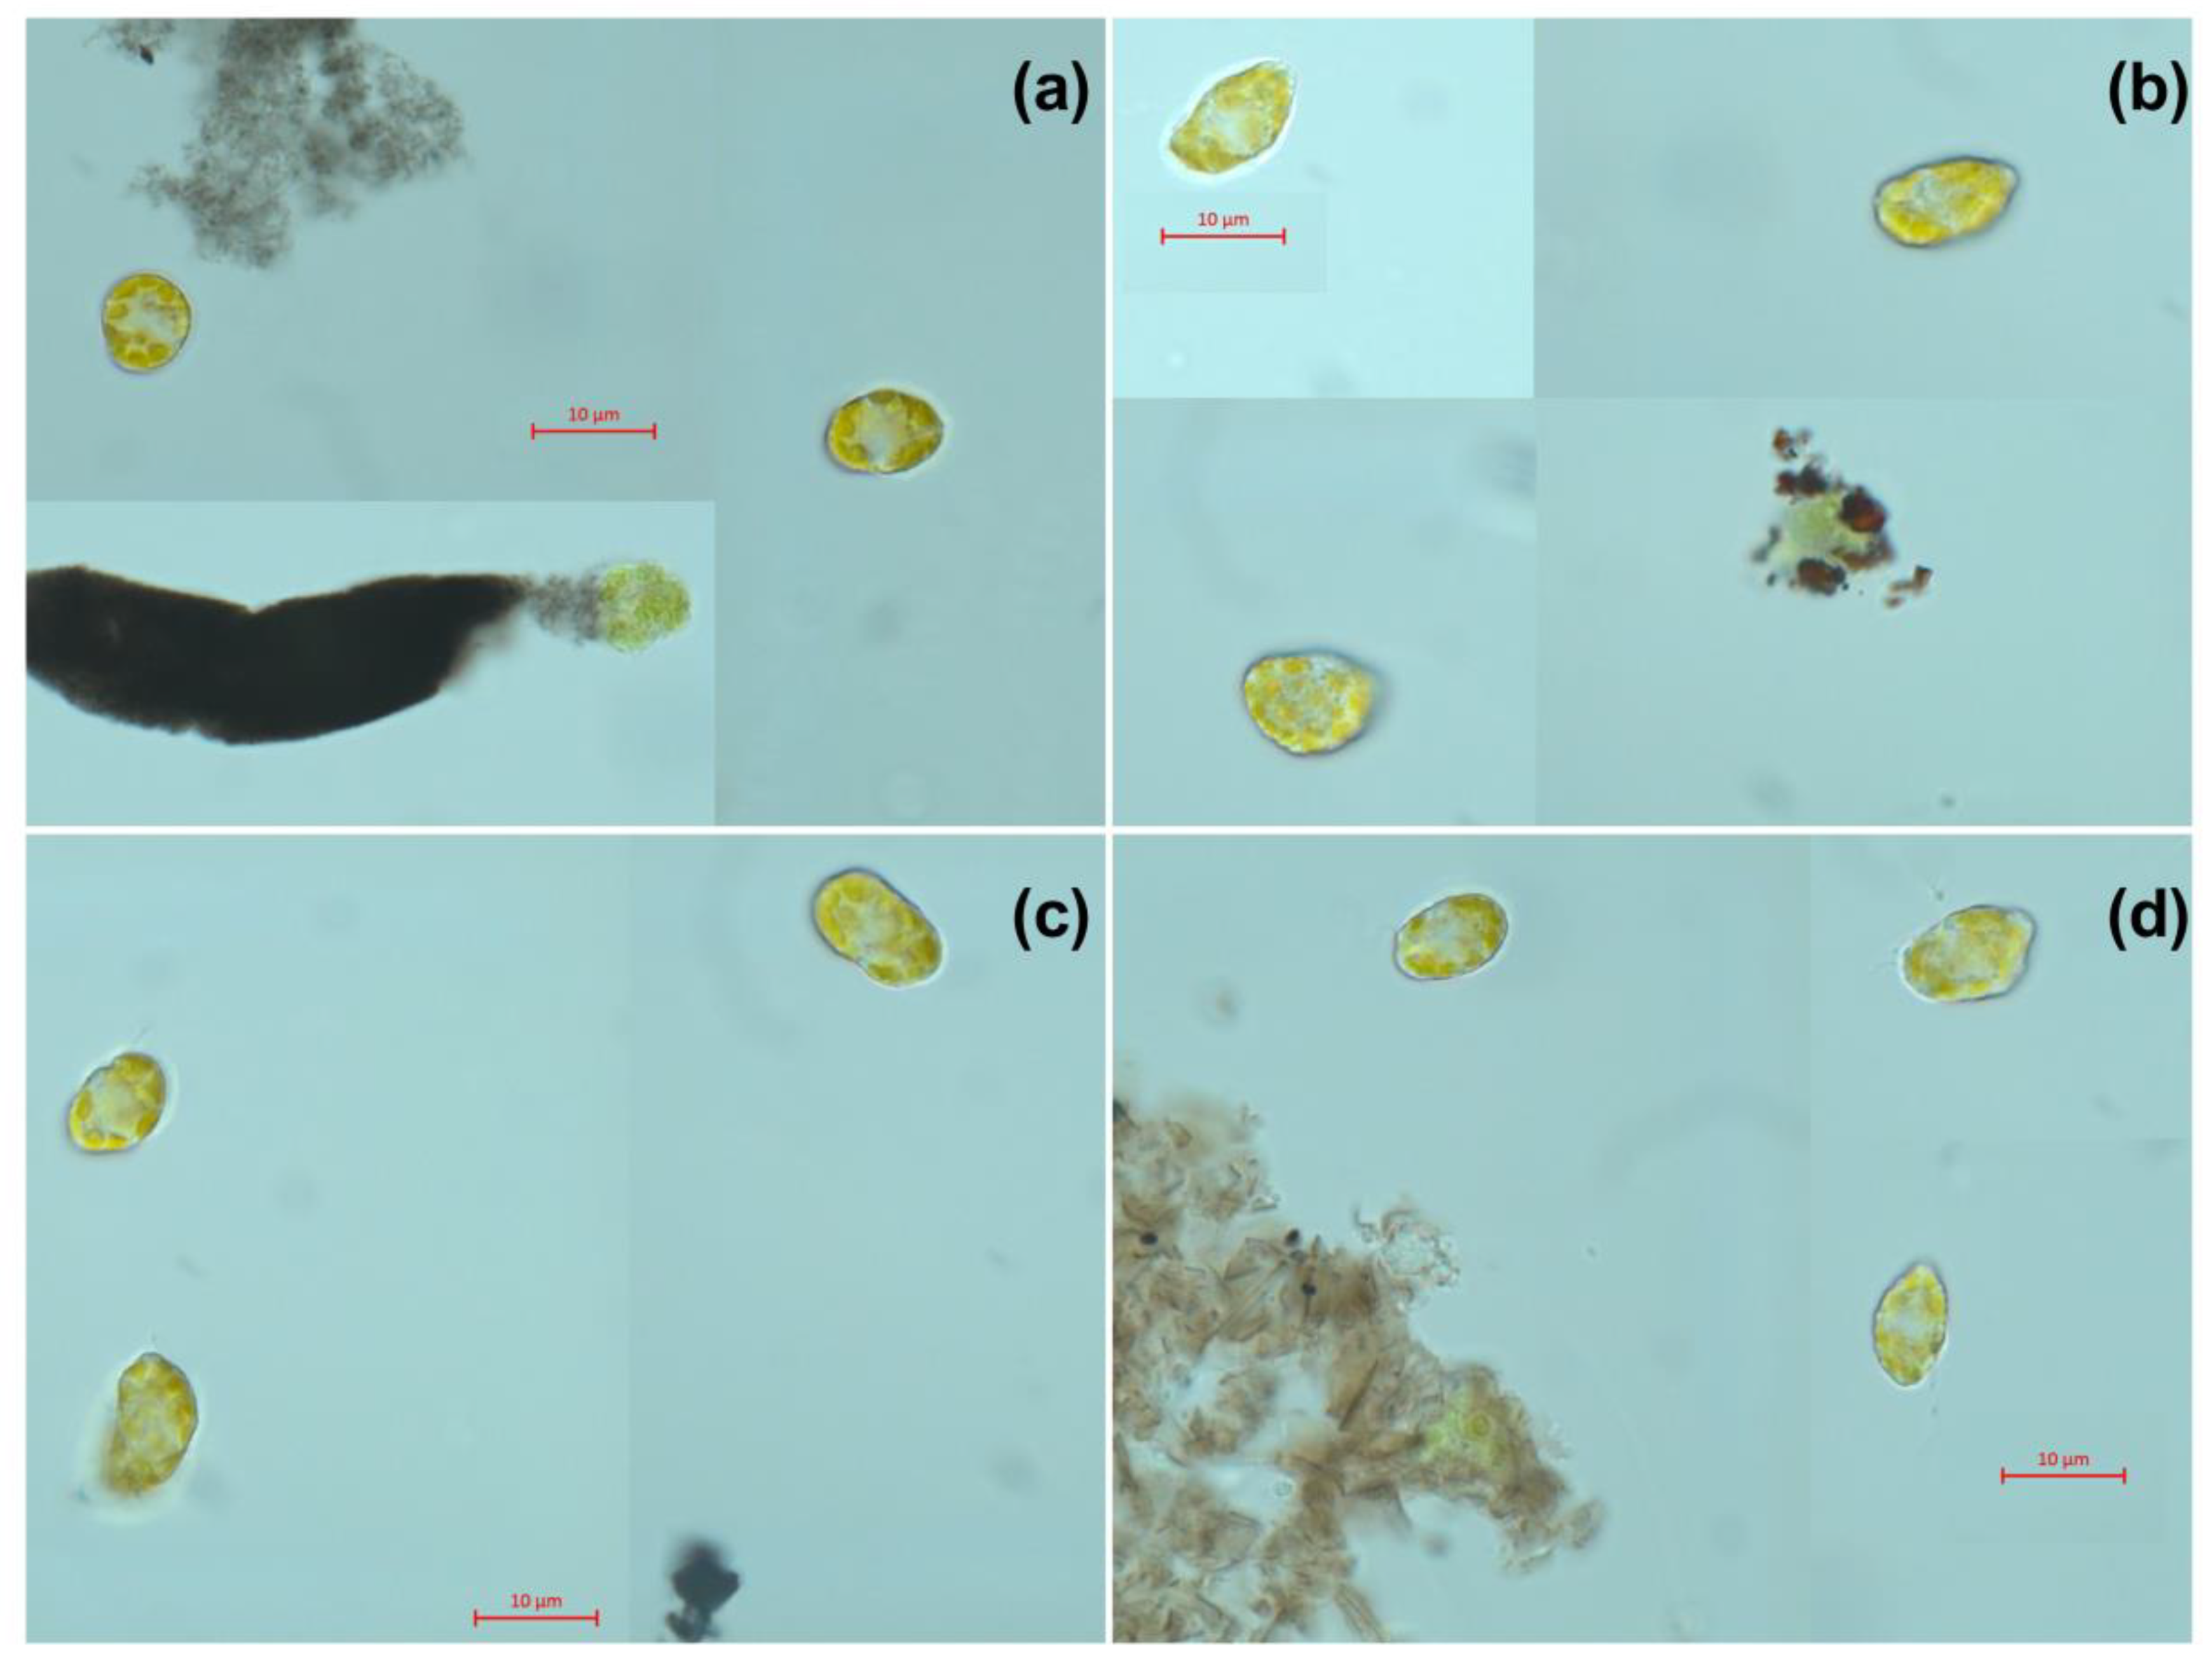
Figure 4.
Biochemical changes in microalgae cells after 3 and 24 h of the exposure to CNMs: (a, b) esterase activity change after 3 and 24 h, respectively; (c, d) membrane potential change after 3 and 24 h, respectively; (e, f) reactive oxygen species (ROS) generation change after 3 and 24 h, respectively. *, p < 0.05; **, p < 0.005; ***, p < 0.0005; ****, p < 0.0001. The used endpoints were calculated compared to control, where 0% is negative control (heat treated cells) and 100% is positive control (cells with no exposure to nanoparticles).
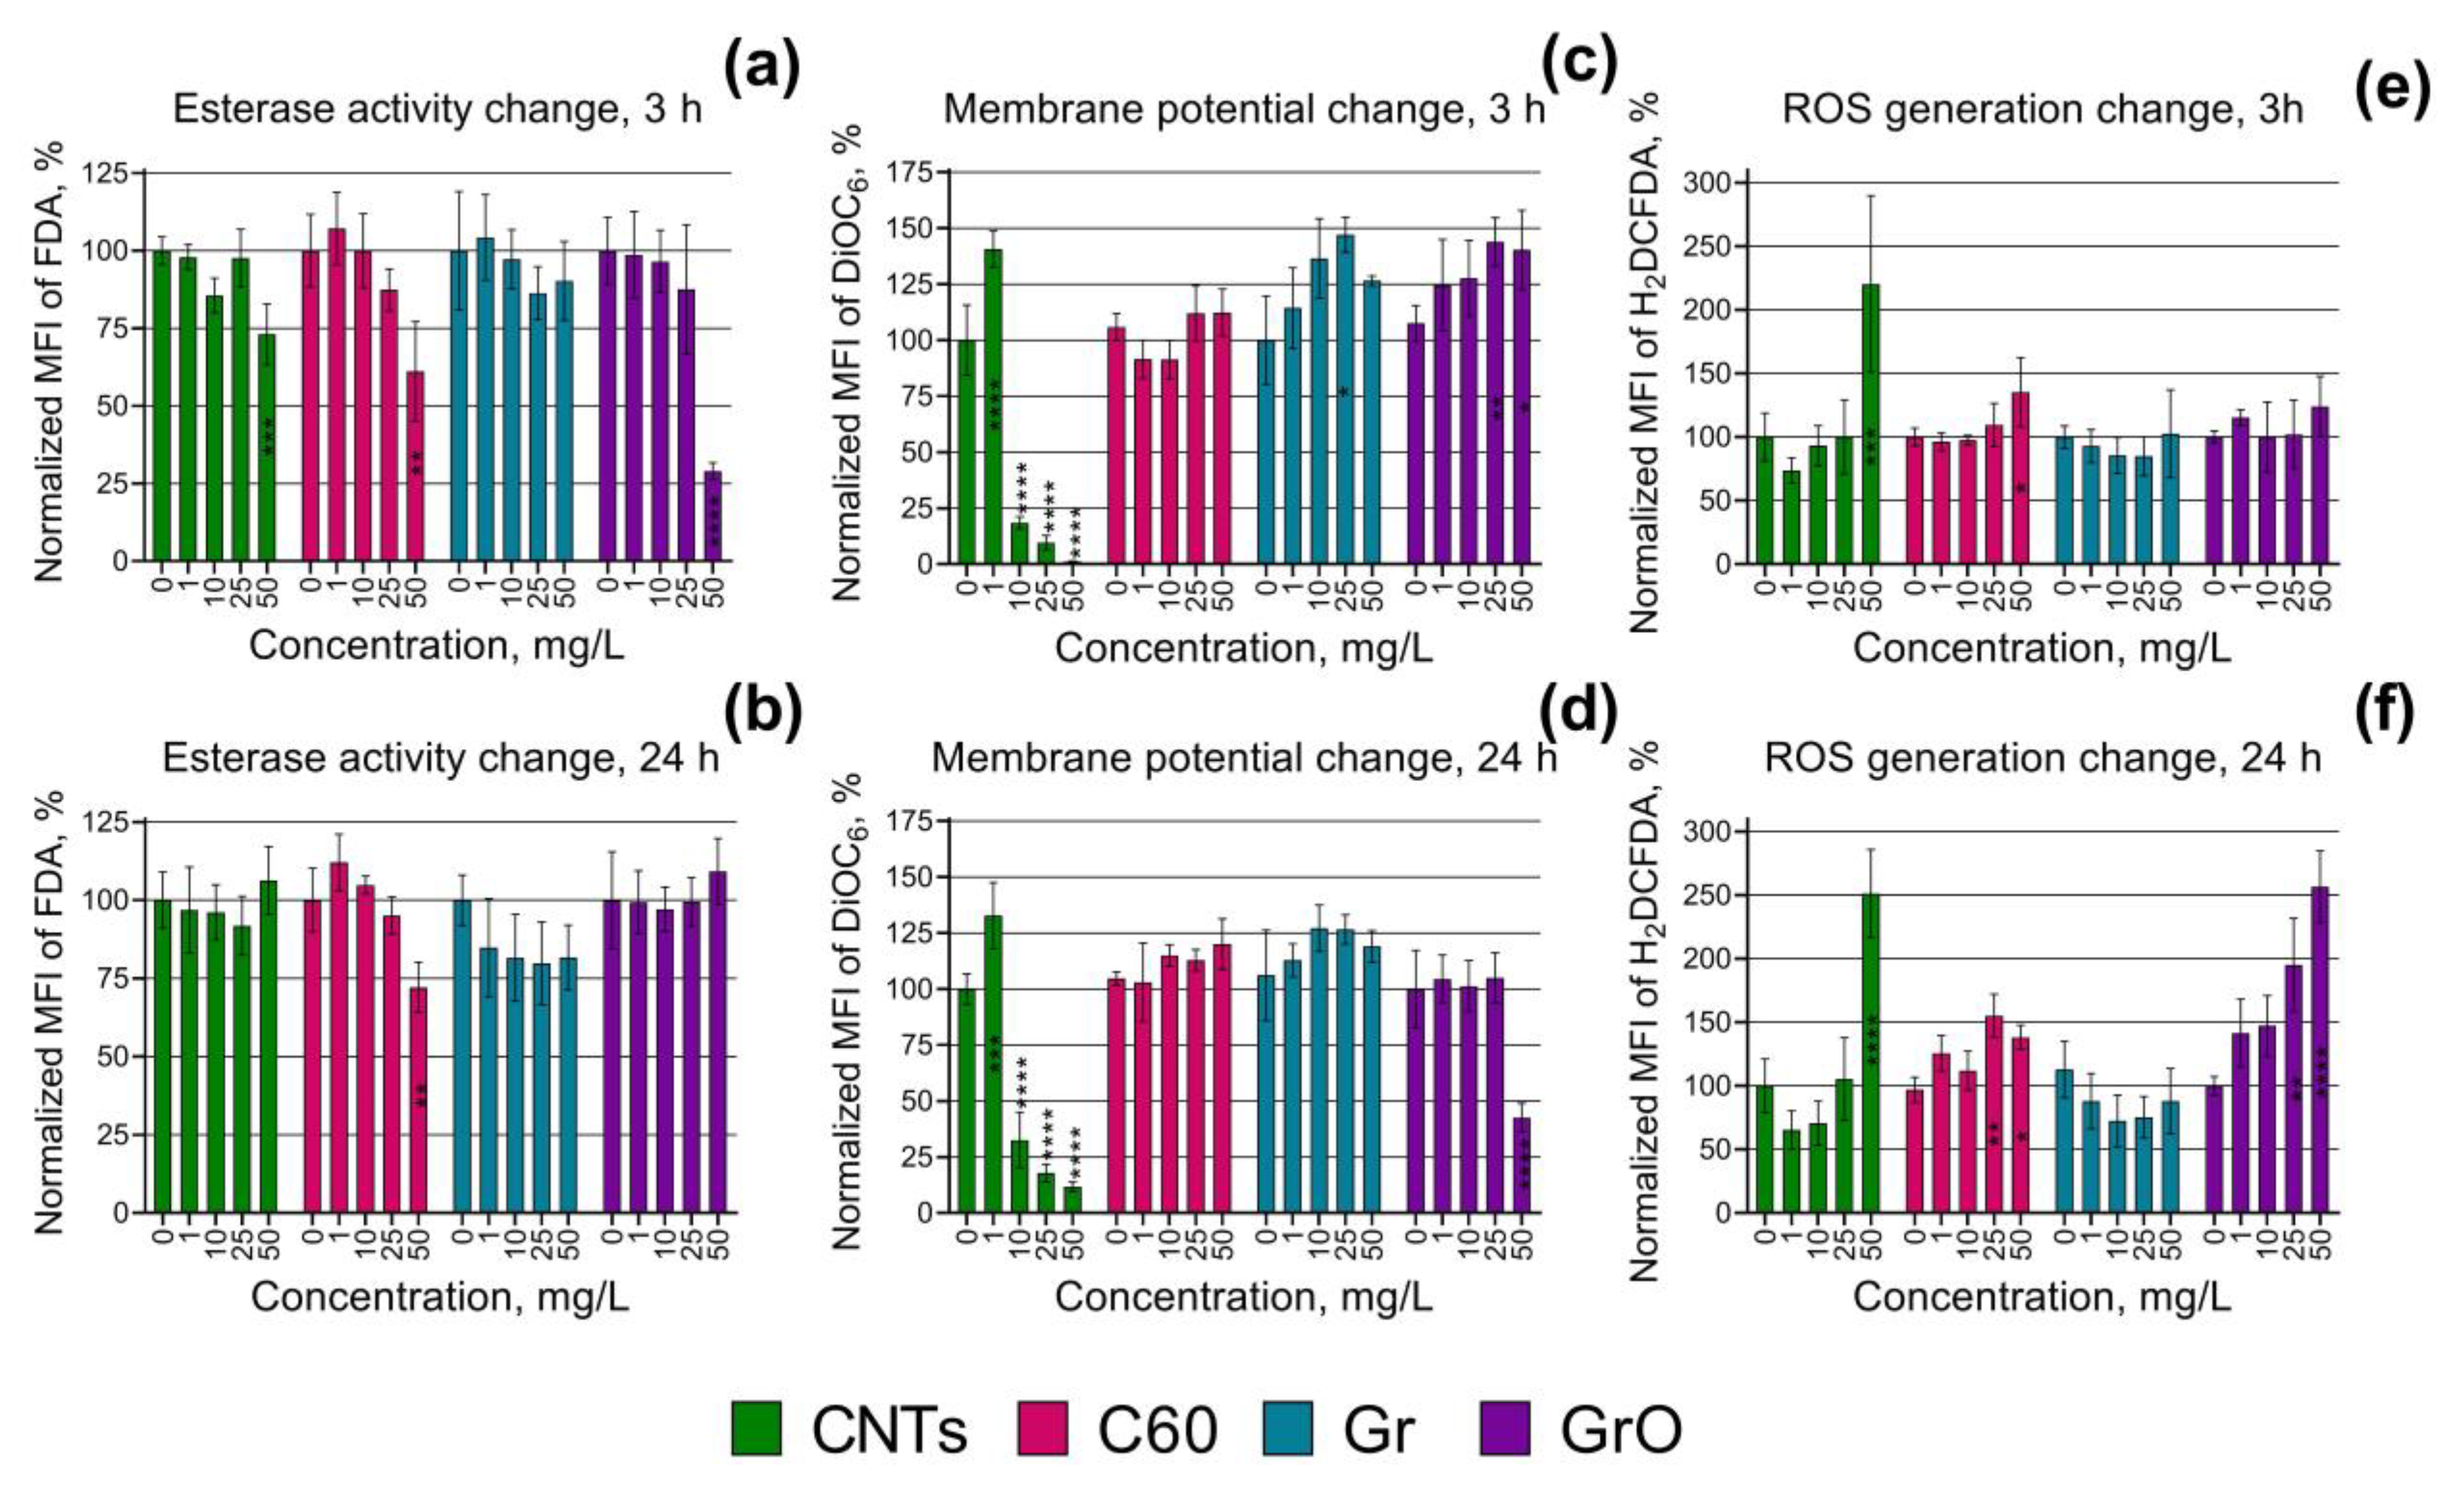
Figure 5.
FTIR spectra of CNMs incubated in seawater with and without microalgae for seven days at particle concentration of 25 mg/L: (a) CNTs; (b) C60; (c) Gr; (d) GrO. Red line, CNMs incubated in seawater without microalgae; Black line, CNMs incubated in seawater with microalgae.
Figure 5.
FTIR spectra of CNMs incubated in seawater with and without microalgae for seven days at particle concentration of 25 mg/L: (a) CNTs; (b) C60; (c) Gr; (d) GrO. Red line, CNMs incubated in seawater without microalgae; Black line, CNMs incubated in seawater with microalgae.
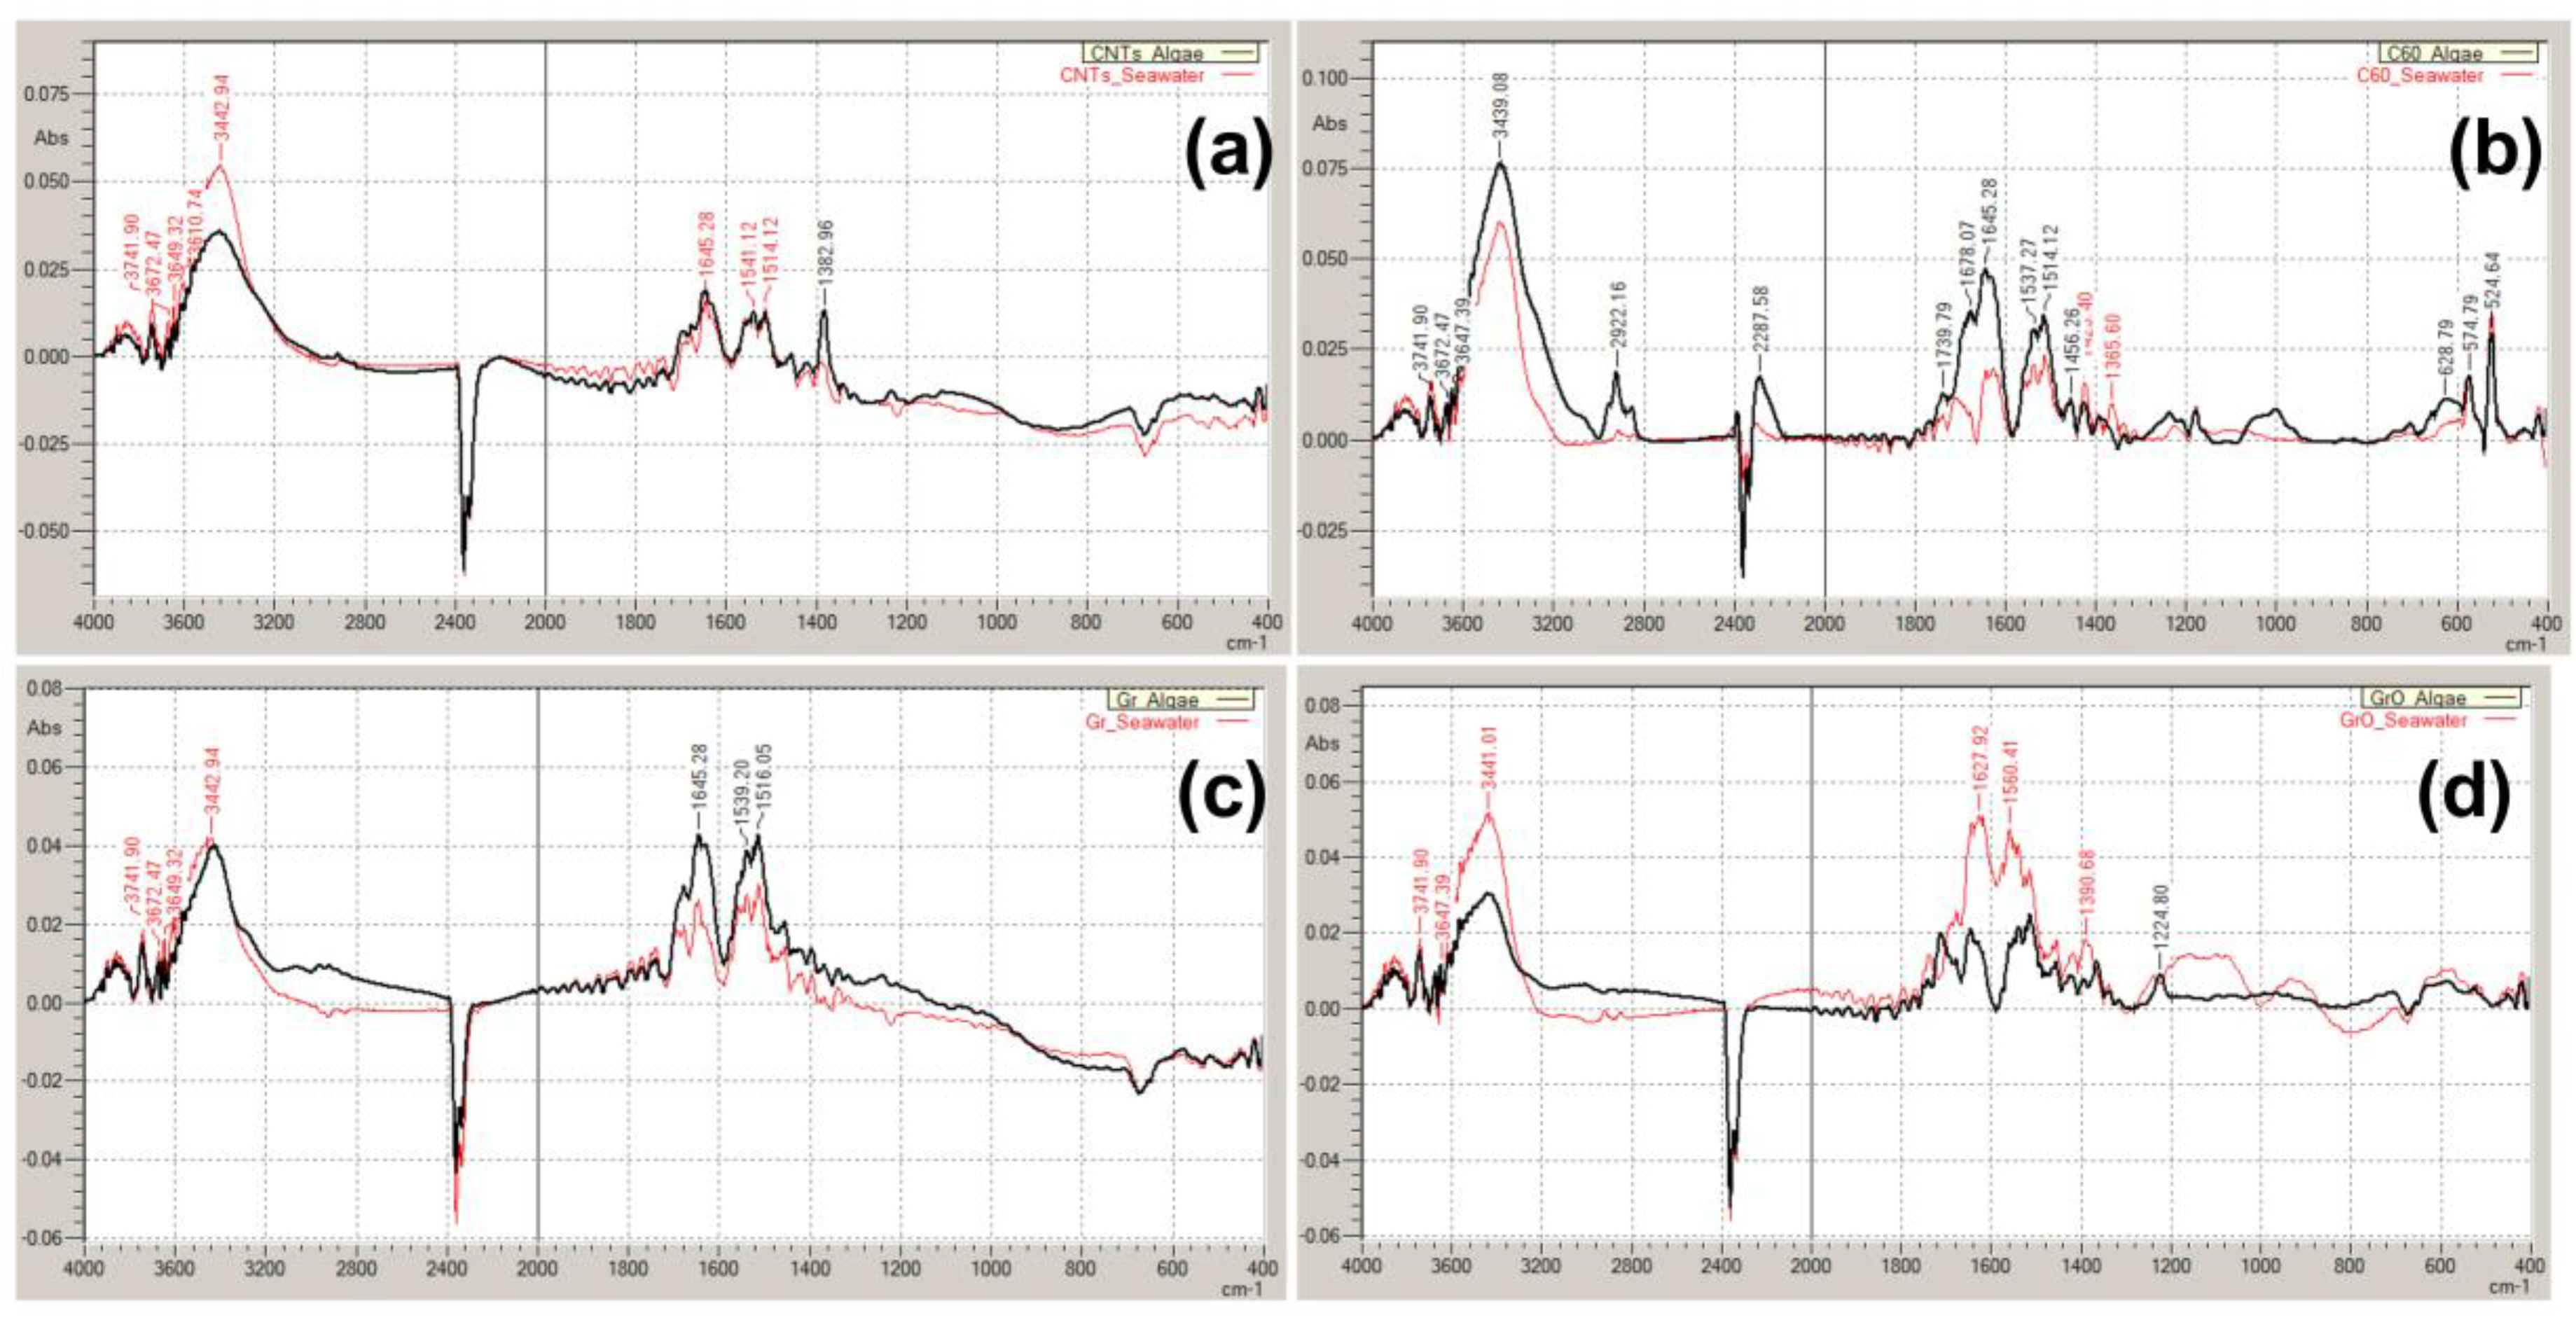
Figure 6.
Raman spectra of CNMs incubated in seawater with and without microalgae for seven days at particle concentration of 25 mg/L: (a) CNTs; (b) C60; (c) Gr; (d) GrO. ; Black line, initial CNMs without any exposure; Red line, CNMs incubated in seawater without microalgae; Blue line, CNMs incubated in seawater with microalgae.
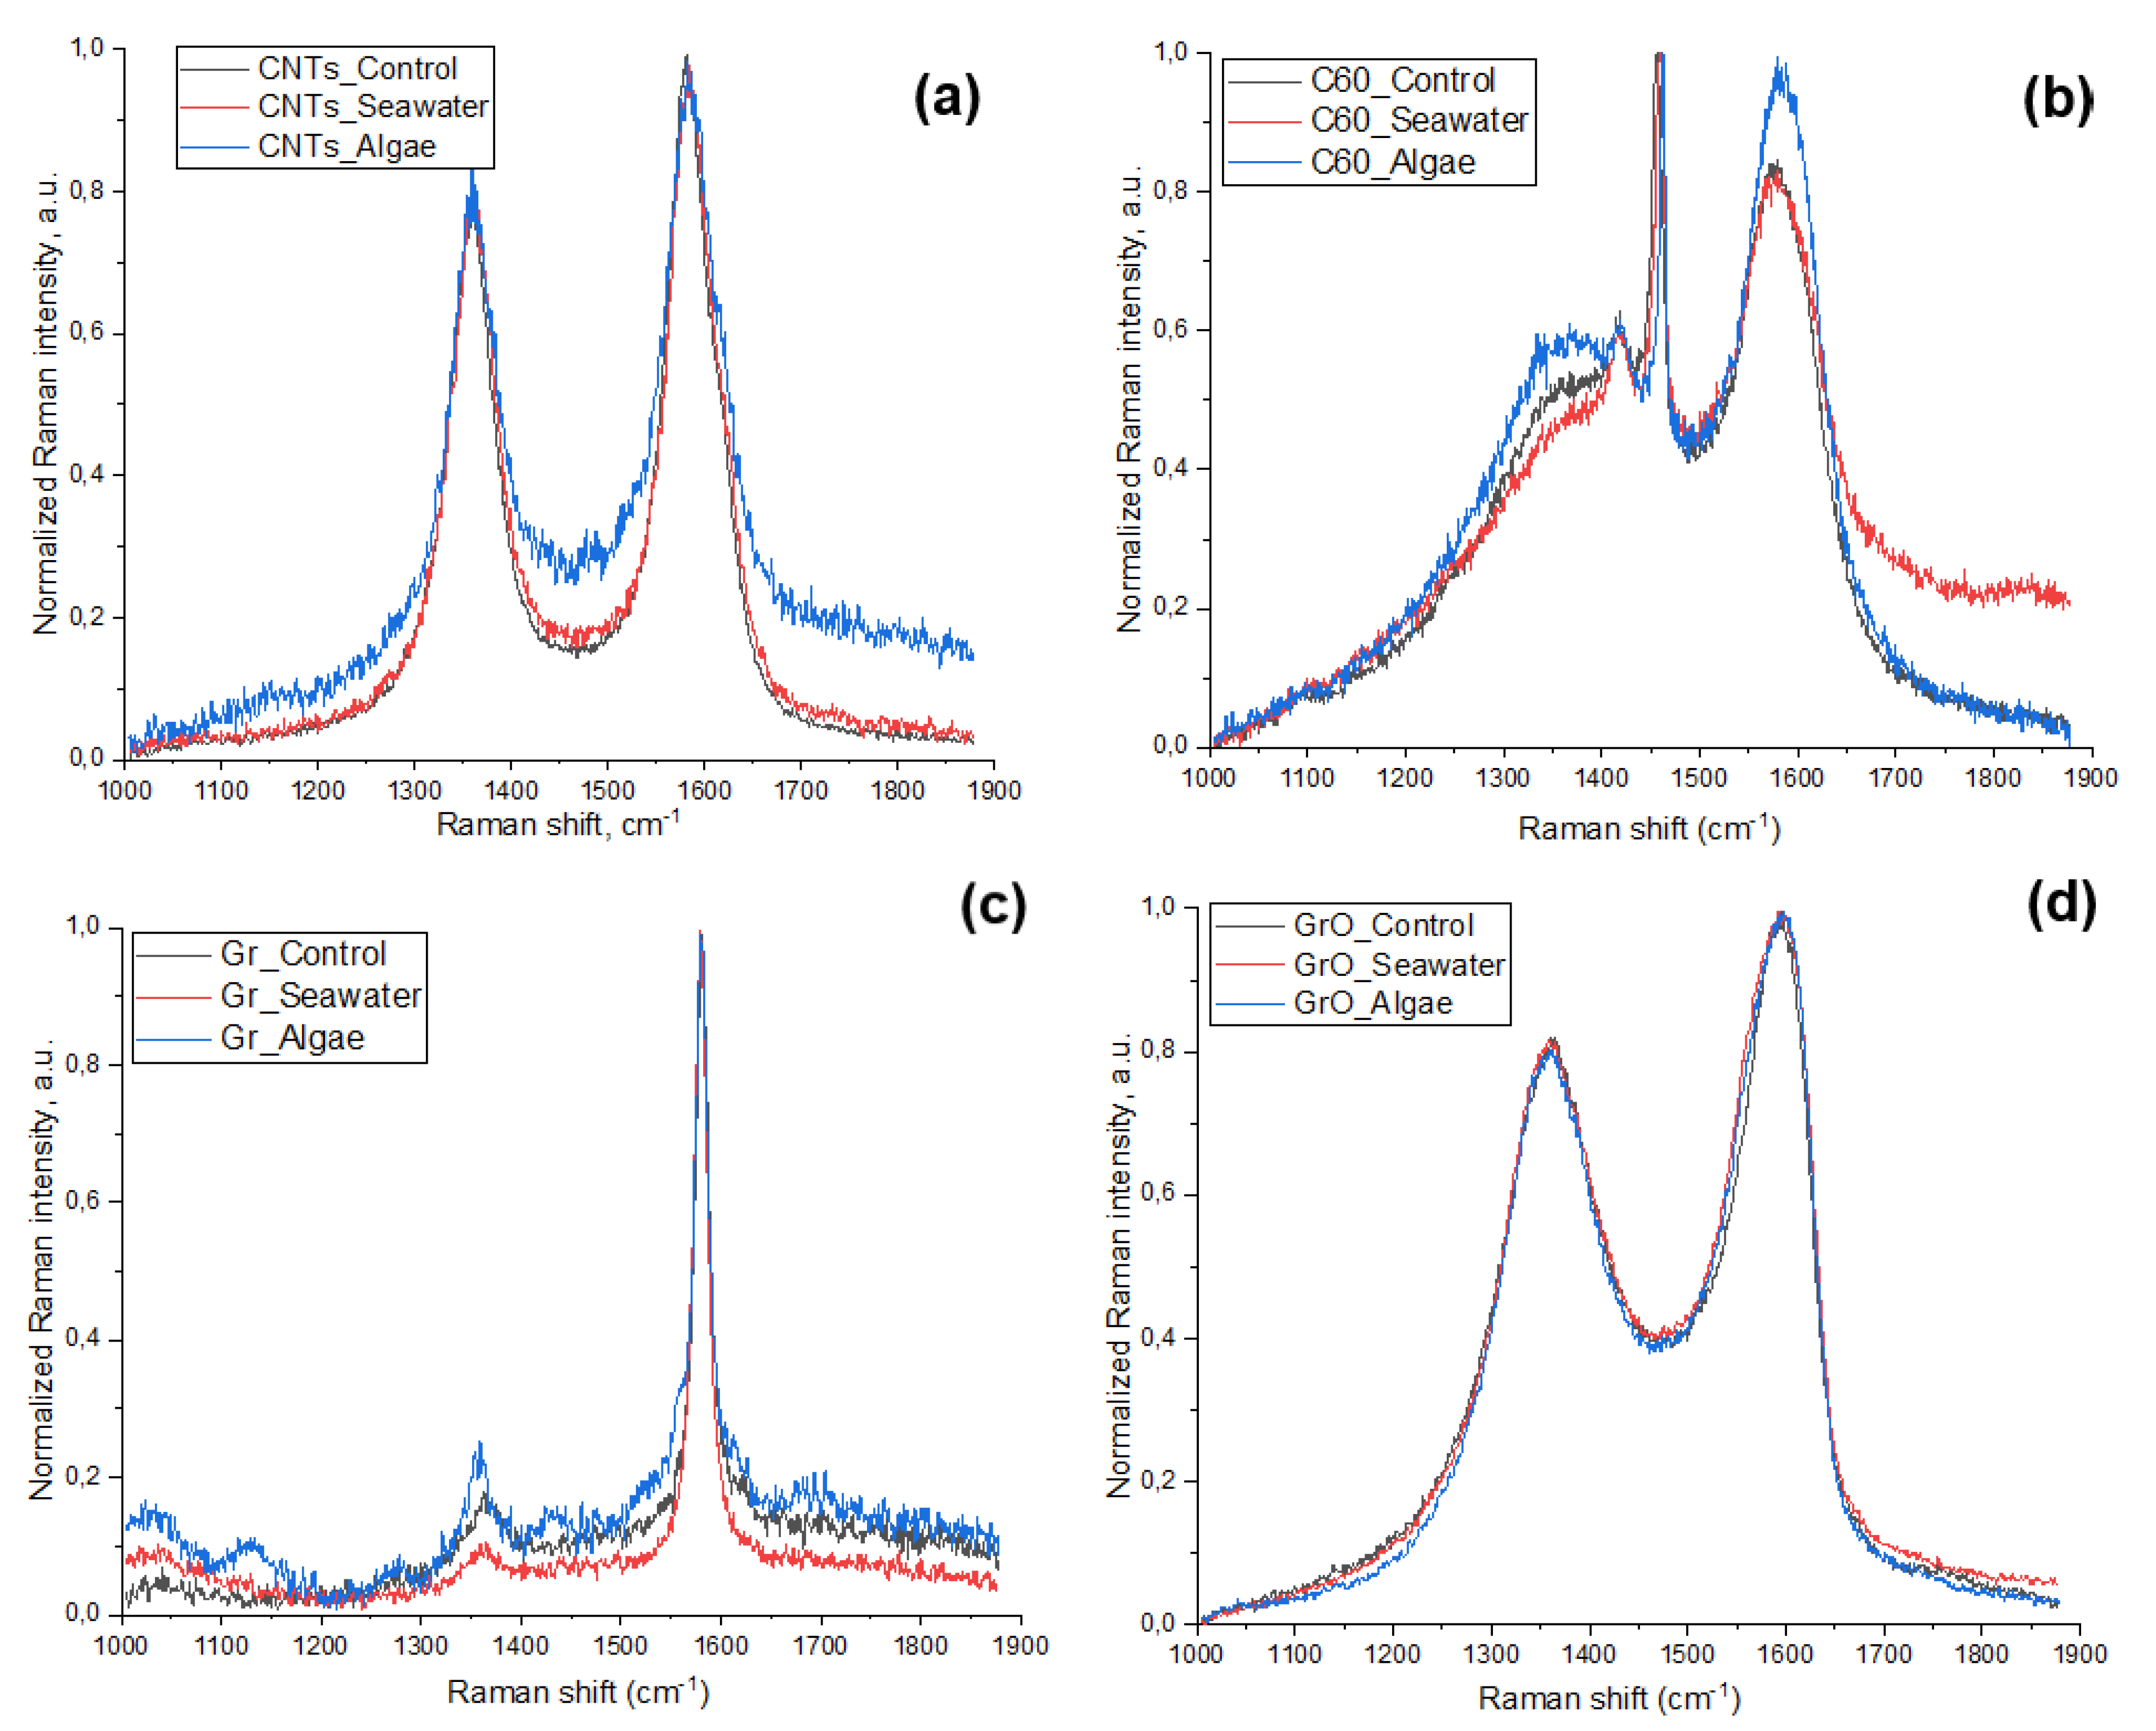

Table 1.
The toxicity descriptors of CNMs exposure to H. akashiwo.
| Duration of exposure | Toxicity descriptor | CNTs, mg/L | C60, mg/L | Gr, mg/L | GrO, mg/L |
|---|---|---|---|---|---|
| Growth rate inhibition | |||||
| 96 h | NOEL | 1 | 25 | 5 | 5 |
| EC10 | 1.52 (0.99–2.25) | 34.57 (9.54–63.90) | 13.80 (8.52–20.51) | 8.22 (4.84–12.90) | |
| EC50 | 18.98 (15.92–22.49) | 414.0 (218.10–1431) | 159.40 (137.10–192.60) | 76.77 (66.82–87.68) | |
| 7 days | NOEL | 1 | 1 | 1 | 1 |
| EC10 | 1.37 (0.98–1.89) | n/a | n/a | 34.39 (24.69–44.08) | |
| EC50 | 13.41 (11.52–15.53) | n/a | n/a | 118.0 (109.30–129.10) | |
| Cell size change | |||||
| 96 h | NOEL | 10 | 10 | 25 | 25 |
| 7 days | NOEL | 50 | 25 | 25 | 10 |
Table 2.
The no observed effect level concentrations of esterase activity, membrane potential, and ROS generation changes in H. akashiwo cells after the exposure to CNMs.
Table 2.
The no observed effect level concentrations of esterase activity, membrane potential, and ROS generation changes in H. akashiwo cells after the exposure to CNMs.
| Endpoint | Duration of exposure | CNTs, mg/L | C60, mg/L | Gr, mg/L | GrO, mg/L |
|---|---|---|---|---|---|
| Esterase activity change | 3 h | 25 | 25 | 50 | 25 |
| 24 h | 50 | 25 | 50 | 50 | |
| Membrane potential change | 3 h | <1 | 50 | 10 | 10 |
| 24 h | <1 | 50 | 50 | 25 | |
| ROS generation change | 3 h | 25 | 25 | 50 | 50 |
| 24 h | 25 | 10 | 50 | 10 |
Table 3.
Characteristics of the used carbon nanomaterials.
| Sample | Size | Purity | Synthesis or manufacturer information |
|---|---|---|---|
| CNTs | Diameter: 6-13 nm; Length: 2.5-20 µm |
> 98% (main trace metals: Al - 10000 ppm, Co – 2652 ppm) | Batch Number: MKCM1457; Sigma Aldrich, St. Louis, MO, USA |
| C60 | Diameter: 0.8 nm | > 95.5% (oxide C60) | Batch Number: 120722; Modern Synthesis Technology (MST), Saint-Petersburg, Russia |
| Gr | Thickness: 3-10 nm; Diameter: 0.5-10 µm |
> 99% | Type #1, CAS#: 1034343-98-0; Modern Synthesis Technology (MST), Saint-Petersburg, Russia |
| GrO | Diameter:10-100 µm | Carbon: 46%; Oxygen: 49%; Hydrogen: 2,5%; Sulfur: 2,5% | CAS#: 1034343-98-0; Modern Synthesis Technology (MST), Saint-Petersburg, Russia |
Table 4.
Bioassay endpoints and registration parameters.
| Endpoint | Fluorescent Dye or Registered Parameter | Duration of microalgae exposure before the measurement | Dye concentration / Duration of Staining | Emission Channel / Band Width, nm |
|---|---|---|---|---|
| Growth rate inhibition | PI | 96 h, 7 days | 15 µM/20 min | 610/20 |
| Cell size change | Forward scatter intensity (size calibration kit F13838 by Molecular Probes, USA) | 96 h, 7 days | – | FSC |
| Esterase activity change | FDA | 3, 24 h | 50 µM/20 min | 525/40 |
| Membrane potential change | DiOC6 | 3, 24 h | 0.5 µM/20 min | 525/40 |
| ROS generation change | H2DCFDA | 3, 24 h | 50 µM/30 min | 525/40 |
ROS, Reactive oxygen species; PI, Propidium iodide; FDA, Fluorescein diacetate; DiOC6, 3,3′-dihexyloxacarbocyanine iodide; H2DCFDA, 2',7'-dichlorodihydrofluorescein diacetate.
Disclaimer/Publisher’s Note: The statements, opinions and data contained in all publications are solely those of the individual author(s) and contributor(s) and not of MDPI and/or the editor(s). MDPI and/or the editor(s) disclaim responsibility for any injury to people or property resulting from any ideas, methods, instructions or products referred to in the content. |
© 2023 by the authors. Licensee MDPI, Basel, Switzerland. This article is an open access article distributed under the terms and conditions of the Creative Commons Attribution (CC BY) license (http://creativecommons.org/licenses/by/4.0/).
Copyright: This open access article is published under a Creative Commons CC BY 4.0 license, which permit the free download, distribution, and reuse, provided that the author and preprint are cited in any reuse.


