
Submitted:
06 May 2023
Posted:
08 May 2023
You are already at the latest version
Abstract
Road infrastructure is a key public asset because it benefits the social and economic development of any country. It plays an important role for the development of the industrial complex, the production sector and the road surfaces of transport roads should be of high quality, have a long service life. Road infrastructure, as well as all infrastructure, requires preservation, maintenance and repair. There are special requirements for the roadway that must be observed during construction or repair. This article is devoted to a detailed study of the use of fiber optics sensors (FOS) based on the fiber Bragg grating (FBG) for road surface monitoring. Such a fiber sensor consisting of a fiber Bragg grid and a pair of grids can offer the possibility of simultaneous measurement of deformation and temperature for monitoring the pavement. Temperature and deformation measurements were carried out by installing a sensor on the surface of a made asphalt sample. The built-in fiber sensor based on FBG provides important information about how the pavement structure can withstand the load, subsidence of soil, timely implement road safety and stability measures evaluate and predict the service life of the pavement. The results of the study showed that the synchronicity, repeatability and linearity of the characteristics of the fiber sensor are excellent. The difference between the experimental and theoretical results is about 7%. Thus, based on the results of the obtained data, the fiber sensor on the FBG can be used for monitoring, designing road surfaces and in general transport infrastructure.
Keywords:
fiber sensor
; fiber Bragg grating
; monitoring
; road surface
; temperature
; deformation
1. Introduction
Currently, the number of vehicles in our country is growing and this leads to the activation of monitoring systems that monitor the condition of the road surface. This increase in the number of vehicles on the roads also leads to more damage and damage to the road surface. The condition of the road surface must be accurately assessed to determine the severity of the damage to the road surface and the types of damage to the road surface. The condition of the road surface has a direct impact on road safety, operating costs, driving comfort and economic results in society. Paved and unpaved roads require regular maintenance to ensure and maintain user usability, accessibility and safety. For a long time, the road surface deteriorates under the influence of the environment, transport load, temperature and water. Every day, road surfaces are subjected to vibration, deformation and temperature effects. Therefore, monitoring systems are considered an important stage of maintenance processes. To date, various control methods have been developed, which required a lot of time to inspect and process the data received and cost money and also all the roads were built decades ago, need strengthening, restoration and replacement. Damage caused to roads may not be easy to visually observe initially, as well as to assess, it is important to detect damage at the early stages of its development [1].
The main common types of asphalt pavement destruction are rutting, cracking and subsidence [2] caused by movement through channels and overloading of the pavement [3]. Pavement design is a process of long-term design evaluation, which is necessary to ensure the effective distribution of traffic loads at all levels of the overall road structure. The general construction of the road consists of an upper layer, one or more base layers, a base and a roadbed. Stresses and deformations occurring at these levels should be within the capabilities of the materials used. Pavement design is the creation of an engineering structure that will efficiently distribute transport loads within the selected load parameters by minimizing the cost of the pavement over the entire service life, including work costs; user costs; environmental impact and so on. To monitor the road surface, it is necessary to obtain a complete analysis not only from above, but preferably from inside the road surface. Currently, effective and reliable sensing elements are in great demand for predicting mechanical properties and the occurrence of damage to road surfaces. The development of information and sensor technologies has led to the invention of advanced pavement monitoring systems. A significant number of innovative sensor systems based on fiber sensors have been developed, which have a number of distinctive advantages, such as small size, light weight, resistance to electromagnetic interference [4,5,6,7,8], corrosion [4,5,9], the ability to conduct distributed and long-range measurements [10,11], harsh environmental conditions and resistance to high temperatures [12], high accuracy, easy integration [10,13] and high sensitivity [4,11,14], which can be effectively used for the necessary applications. Many fibers sensor-based monitoring systems have been developed for continuous measurement and real-time evaluation of various engineering structures, such as bridges, buildings, tunnels, pipelines, wind turbines, railway and highway infrastructure, and geotechnical structures. The on-site pavement detection technology is based on a wide selection of sensors (humidity, pressure, deformation, temperature, etc.) capable of continuously and in real time collecting information about the characteristics of the pavement and the environment, overcoming the aforementioned limitations of traditional external methods. In this scientific study, we will provide a detailed description of the basic principles of operation of a fiber optics sensor (FOS) based on a fiber Bragg grating (FBG). Consider the use of fiber temperature and strain sensors based on fiber Bragg gratings in pavement monitoring systems to find out whether these systems provide reproducible and suitable results for long-term monitoring.
2. Materials and Methods
Road surface monitoring. Monitoring the condition of the road surface plays an important role in ensuring the safety and comfort of driving for road users, from pedestrians to drivers. Modern road surfaces are multi-layered structures, which is a combination of layers of granular and higher-quality materials such as asphalt, binder and concrete. The figure shows an example of the construction of the road surface.
Figure 1.
Road surface construction.
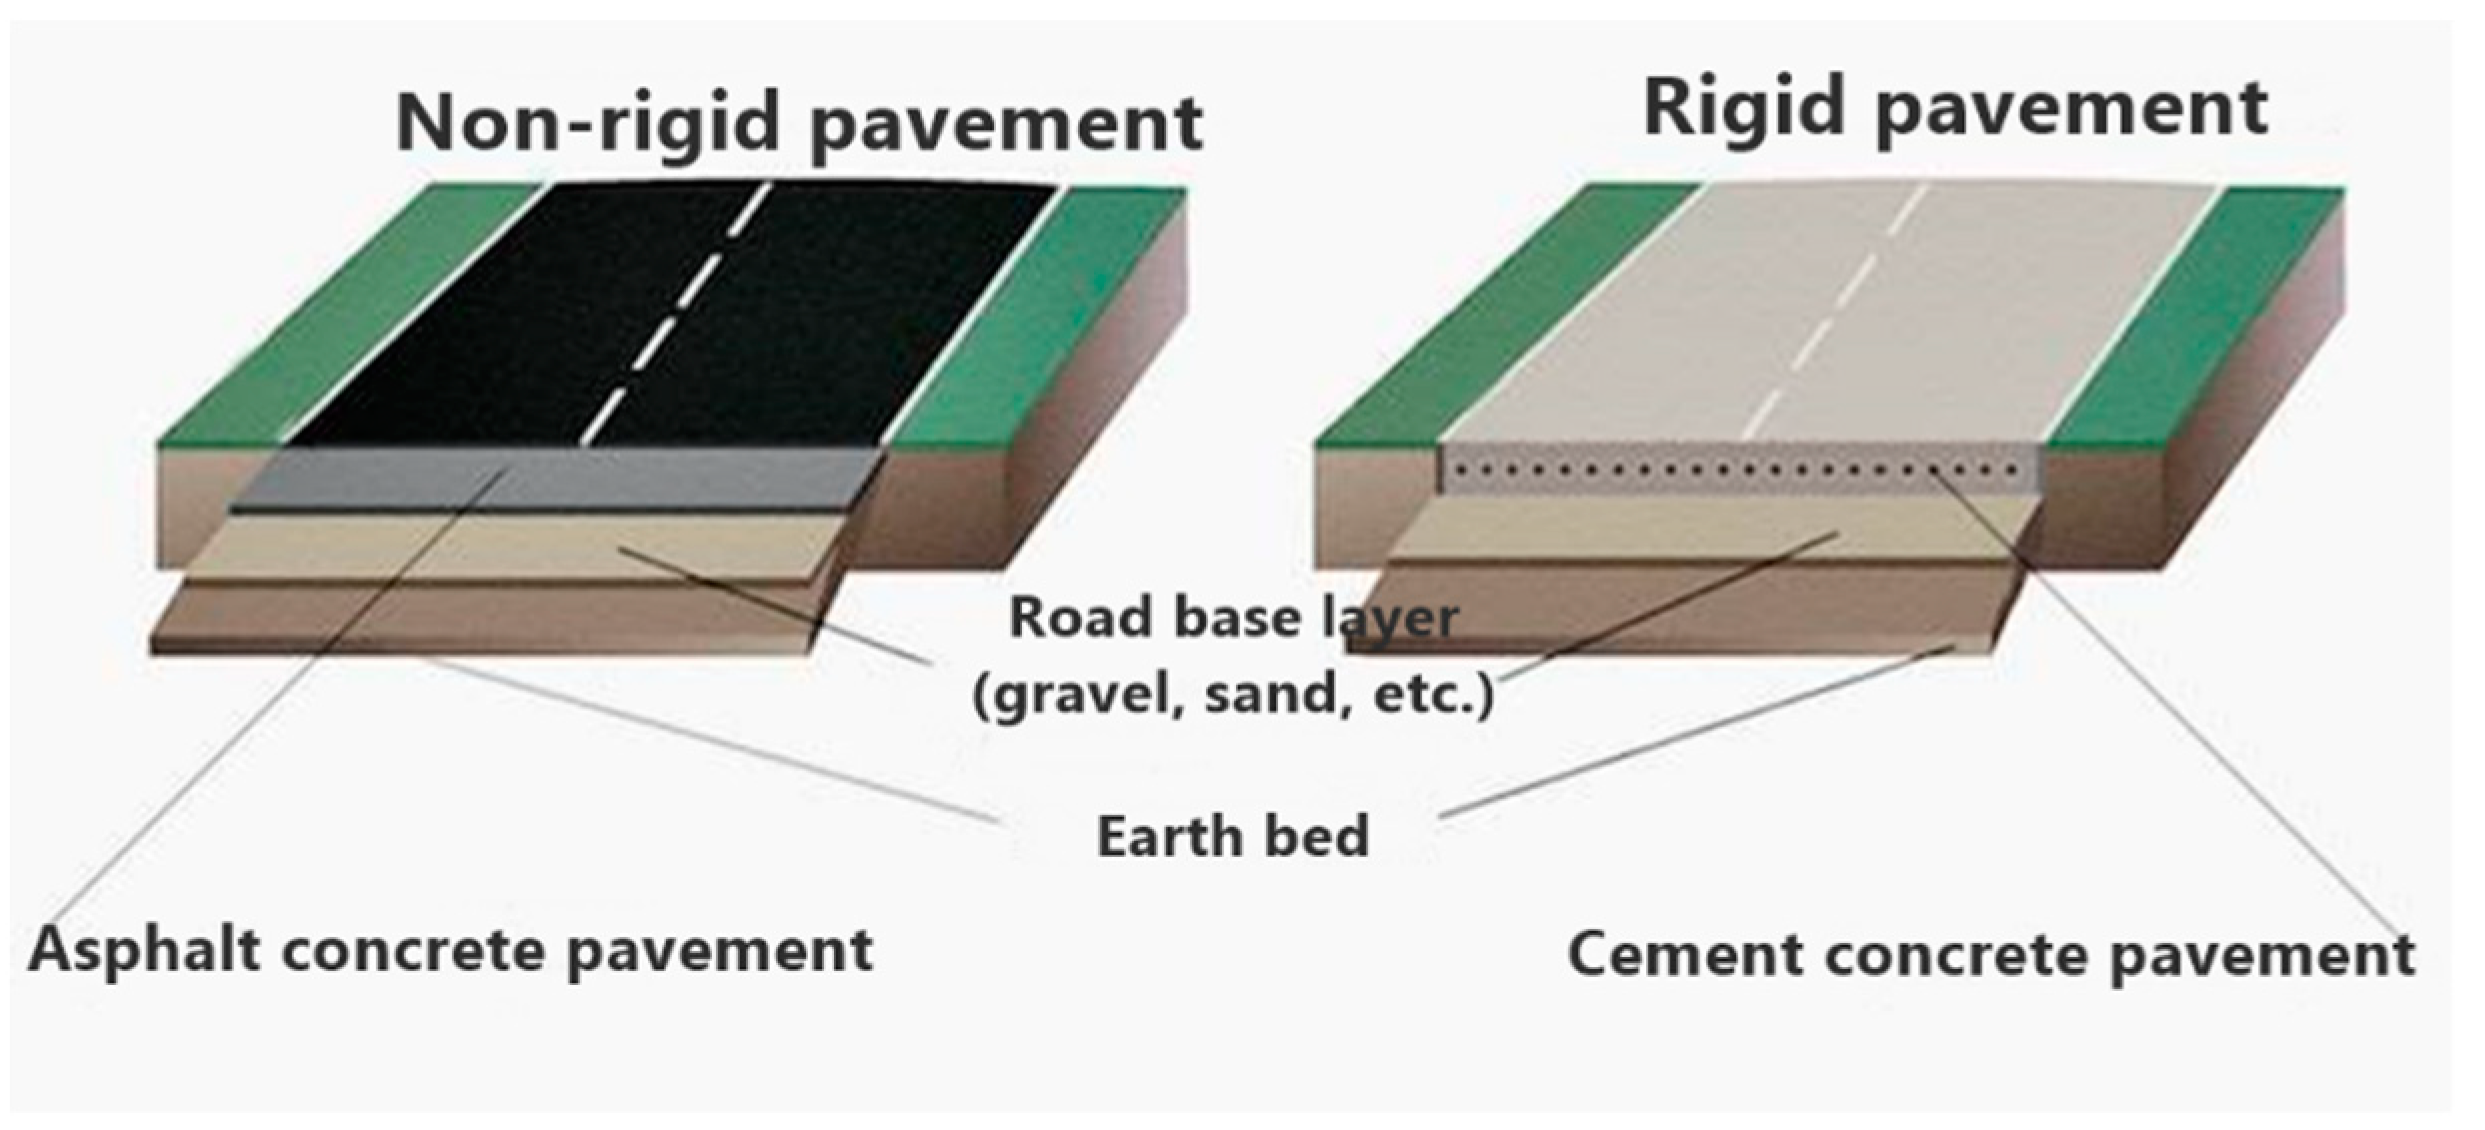
Dirt or gravel roads are usually made from a mixture of natural materials consisting of gravel and shallow slopes, such as silt and clay, which are used to increase the adhesion of gravel roads. This type of road usually consists of three layers: a road surface, a layer of gravel and a layer of roadbed. The surface layer consists of sandy, rocky or rocky slopes, depending on the geographical location of the area. Unpaved roads cannot provide high speed and a safe surface for vehicles and pedestrians.
Asphalt is a composite material commonly used to cover roads, parking lots, airports and in bulk dams. It consists of a mineral aggregate bound together with an asphalt binder, laid in layers and rammed.
The concrete pavement of the road is a cement-concrete monolithic road of high quality. Sometimes a concrete road surface means a road made of concrete slabs, which is not monolithic, but such a structure belongs to the category of temporary highways. The concrete pavement of the road has high performance characteristics, which makes it possible to use it for the construction of highways with high traffic congestion.
The complexity of pavement materials due to the uncertainty of composition, temperature sensitivity, viscoelasticity characteristics [15] and compaction level [16] is a problem that hinders the development of effective means of damage detection and monitoring of road structures.
Today, pavement design is considered an important factor in maintaining the best characteristics of infrastructure in cities and ensuring the safety of road users. The road surface deteriorates and, consequently, affects the quality of driving and the safety of users. Consequently, the need for a significant monitoring system becomes necessary for the application of appropriate maintenance processes in accordance with the type of faults.
Figure 2 shows the main types of destruction of road surfaces.
Road surface monitoring is a visual control of the surface, monitoring of traffic and weather, as well as measurements on the road surface. Usually, this monitoring is carried out by the operator from a moving vehicle or using automated sensors installed on the vehicle. For more accurate diagnostics, sensors can be embedded in the road surface. Over the past few decades, a wide variety of sensors have been developed to measure the distribution of deformations and stresses in pavement structures. The data obtained as a result of various on-site measurements (stress, deformation, displacement, etc.) are necessary for a better understanding of the behavior of the pavement and identification of the main mechanism of destruction, which is difficult to determine due to the variability of the pavement, sensitivity to temperature and viscoelasticity of the pavement materials. By combining these data with numerical models [17,18], it is possible to predict damage to the road surface more reliably.
Sensors used to monitor the road surface must be compatible with the heterogeneous nature and mechanical properties of materials and take into account the unique features of the road surface. They must meet the following requirements:
- sensors should be as small as possible so that they are not too intrusive in the layers of the road surface;
- to measure the deformation, the stiffness of the sensors must match the stiffness of the pavement mixture in order to properly measure the mechanical properties of the pavement;
- sensors should pull out the highest loads experienced during the construction of the pavement (loads such as temperature and compression);
- for long-term monitoring of the road surface, the sensors must be resistant to corrosion and thermomechanical conditions.
Fiber sensors meet these requirements.
3. Results
Fiber sensor based on fiber Bragg grating in pavement monitoring systems.
Fiber sensors are used in road infrastructure due to their unique advantages: small size, lightweight, high sensitivity, corrosion resistance, immunity to electromagnetic interference, high throughput, ability to integrate into an aggressive environment, ease of installation and long service life. These advantages can be a potential solution for reliable sensors for long-term monitoring of the road surface. Fiber sensors can be used to perform local or distributed measurements with high accuracy over a wide range of voltages and temperatures. Fiber sensor technology has already been used for experimental investigation of the behavior of the road surface [19,20] and monitoring of the road surface [21,22] with positive results. Namely, the most proven, of course, is the technology of using a fiber sensor based on a fiber Bragg grating [23].
Typically, such sensors are used in civil engineering and are widely used in the field to measure loads, deformations and temperature. A single fiber sensor based on FBG can potentially provide many traffic parameters, such as weight, speed and type of vehicle, road surface wear and temperature.
Thus, the use of fiber sensors based FBG for road surface monitoring can be used as a new research method for a long-term process in real time.
The fiber Bragg grating is a microstructure (several millimeters long) created by modifying a standard single-mode telecommunications fiber doped with germanium using an ultraviolet laser. This microstructure creates a periodic change in the refractive index of the optical fiber. When light travels along the fiber, the Bragg grating reflects a very narrow range of wavelengths; all other wavelengths are transmitted through the grating. The center of this band of reflected wavelengths is known as the Bragg wavelength. The period in FBG increases due to physical stretching or compression of the optical fiber. This change results in a shift in the Bragg wavelength, which is then detected and recorded by the data acquisition system.
To measure the deformation and for use in monitoring the asphalt layer, sensors based on FBG were used and investigated [24].
Several authors have studied the change in deformation when the gap is opened under the influence of a load on the wheel and the detection of road surface precipitation by installing fiber-optic sensors using Brillouin optical time domain analysis technology along the road boundary and on the surface of the road surface [25,26]. Also, some studies have experimentally proved that embedded FBG coated with an adhesive polyethylene composite of 5 mm in diameter can potentially directly determine the behavior of asphalt, even if asphalt has a low modulus of elasticity, since flexible FBG have a slight reinforcing effect on the deformation field [27].
The use of sensors based on FBG and Brillouin optical reflectometry, which could provide information about the sediment of the roadbed and ruts in real time [28]. The potential and feasibility of practical application have been proven during laboratory tests. FBG sensors can also be applied and work well in harsh enviro FBG can identify weak, compacted areas based on different values of the FBG sensor response and can serve as a long-term monitoring system for the condition of the pavement structure [29].
Figure 3 shows the principle of operation of a fiber sensor based on the FBG.
Many sensors can measure only point deformations inside the pavement or deformation on the surface, as well as the temperature effect on the pavement separately.
Sensors based on FBG are sensitive to deformation and temperature. This allows for use in FBG for temperature monitoring, but it also means that it is good practice to combine a temperature sensor with a strain sensor to compensate for the effect of temperature on the strain sensor. In addition to deformation and temperature, sensors based FBG can be used in transducers to monitor a variety of other parameters, such as tilt, acceleration, pressure and other similar parameters.
To distinguish the temperature and deformation parameters in the fiber Bragg grating, it occurs by using the core-shell mode coupling.
The core and shell modes exhibit different heat sensitivity, while the sensitivity to deformation is approximately the same. Monitoring of the resonance of the core-core mode coupling and the resonance of the core-shell mode coupling in the spectrum of one FBG makes it possible to separate the wavelength shifts caused by temperature and deformation.
Mathematical modeling allows you to determine several properties of sensors. For sensors, the relationships linking individual quantities and parameters are very complex. Therefore, modeling of such sensors requires a matrix approach.
Matrix equations of sensors with Bragg gratings allow us to determine the relations describing the method of processing the measured values (for example, deformation and temperature at the same time) on the values of the grating parameters, and on their basis to determine this value.
Let us consider the analysis of the construction of matrix equations for sensor systems with the use in FBG for measuring deformation and temperature. Due to the large number of FBG systems currently being developed, used to measure deformation and temperature, have been reviewed, analyzed and classified based on various criteria. Highlights: the operating principle used in the sensor, the type of grating parameter that is used to determine the measured size, as well as the type and number of grilles used.
To obtain matrix equations of systems with FBG for simultaneous measurement of deformation and temperature, one must begin by recording the dependence on the Bragg wavelength for a homogeneous grating, which takes the following form:
where neff - is the effective refractive index in the core of the fibers on which the grating is written, Λ - is the grating period. The appearance of changes in the temperature of the ΔТ and the deformation of the Δε causes a change in the Bragg wavelength in accordance with the dependence:
in which T denotes the grating temperature, ε is the relative deformation described by the dependence:
where determines the change in the length of the gratings, - is the initial length.
λB = 2neff ⋅Λ,
Let P1 and P2 denote two different parameters of the Bragg gratings, which will change as a result of the induced deformation or temperature change of the gratings. The matrix equation of temperature and strain sensor processing takes the following form:
where KT1 is the sensitivity of parameter P1 to temperature, KT2 is the sensitivity of parameter P2 to temperature, KƐ1 is the sensitivity of parameter P1 to deformation, and KƐ2 is the sensitivity of parameter P2 to deformation.
Analyzing equation (4), it can be seen that simultaneous measurement of deformation and temperature is possible if for a given measuring system we determine two different grating parameters (or a system of several grating) that show different sensitivity to the quantities under consideration, and the inequality P1 ≠ P2 is satisfied. The analysis of equation (4) also allows us to conclude that, knowing (or determining, for example, experimentally) the sensitivity of the gentle parameters P1 and P2 to deformation, respectively KT1, KƐ1 and KT2, KƐ2, it is possible to determine temperature and deformation simultaneously.
Defining the algebraic complements of all sensitive KT1, KƐ1 and KT2, KƐ2 from equation (4) is obtained:
that when the nonzero condition of the determinant of the matrix from equation (4) is met, it allows to construct its complement matrix based on equation (5), which can be written as:
where D is the determinant of the matrix from equation (4) and is equal to:
d11 = (–1) 1+1 KƐ2 = KƐ2, d12 = (–1) 1+2 KT2 = – KT2,
d21 = (–1) 2+1 KƐ1 = – KƐ1, d22 = (–1) 2+2 KT1 = KT1,
d21 = (–1) 2+1 KƐ1 = – KƐ1, d22 = (–1) 2+2 KT1 = KT1,
D = KT1, KƐ2 – KT2, KƐ1 ,
The condition of various sensitive ratios of parameters P1 and P2 to temperature and deformation makes it possible to simultaneously determine the deformation and temperature by measuring the values of these parameters. Assuming that the measured parameters P1 and P2 are the shifts of the Bragg wavelength in the wavelength Δ𝝀B1 and in the wavelength Δ𝝀B2, and knowing the values of the constants of the fiber on which the mesh is recorded, we can determine the theoretical values of sensitivity to temperature and deformation. The sensitivity of the wavelength to temperature is determined by the dependence:
where kT is the coefficient of relative sensitivity to temperature, equal to.
The parameter - is the coefficient of thermal expansion of the optical fiber (for quartz glass, its value is 0,55·10-6К-1), αn the coefficient of thermo-optical fiber (αn =8,6·10-6 К-1).
The sensitivity of the wavelength to deformation is determined, in turn, as follows:
in which kɛ is the coefficient of relative sensitivity to deformation and is equal to:
kɛ= 1–pɛ ,
where pɛ is the elastooptic coefficient describing the change in the refractive index of the fiber under the action of deformation (pɛ ≈ 0,22).
Based on the analysis of equations (8) and (10), it is possible to determine the deformation and temperature sensitivity of the gratings for a given Bragg wavelength. Substituting equation (9) into equation (8) and (11) into (10) and taking into account the values of the characteristic coefficients, the theoretical values of the gratings sensitivity to temperature and deformation are obtained, equal respectively to
KT =14.2 pm/oC and K ɛ =1.2 nm/ mε.
Since the gratings reacts to changes in deformation and temperature by shifting the Bragg wavelength, according to equation (2), it can be assumed that the parameters P1 and P2, on the basis of which the values under consideration are determined, will be shifts of the Bragg wavelength, for example, a system of two gratings at the output Δ𝝀B1and at the output Δ𝝀B2. In this situation, a differential system can be used in which the Bragg wavelength shift of two gratings Δ𝝀B1 and Δ𝝀B2 is used due to temperature changes [30], deformation [31], force [32] or dispersion [33]. Measurement of two different Bragg wavelengths is also used [34].
3.1. Simultaneous Measurement of Deformation and Temperature Using Fiber Bragg Gratings
Based on the mathematical model, we will consider the option of simultaneous FBG with different Bragg wavelengths.
To conduct the experiment, a fiber sensor based on FBG was installed on the surface of asphalt concrete samples to test reliability. Several temperature ranges were used during the tests. The sample was heated, then cooled and simulated natural conditions for road surfaces. The deformation measurements of pavement structures were verified by installing a sensor on the surface of an asphalt concrete sample under indirect tensile load conditions.
Figure 4 shows a laboratory bench using two FBG with different Bragg wavelengths for simultaneous measurement of deformation and temperature [35].
The system consists of the following components:
- SLD1 and SLD2-superluminescent diodes at a wavelength of 1325nm and 1550nm;
- controller;
- fiber optic connector;
- two grilles FBG1 and FBG2;
- optical spectrum analyzer;
- temperature chamber.
The measurements were carried out in two stages: the first with uniform heating of the entire grid and a certain point of the grid.
The error of the temperature measuring device does not exceed ± 0.5 °C at temperatures ranging from 20 °C to 135 °C. Also, this stand can be tested at low temperatures. This can be realized using liquid nitrogen and the effect of a heating element. The grate is heated by a resistive heating plate. Temperature control is provided by an autotransformer. Environmental conditions:
- operating temperature: from +5 to +40 ° C;
- storage temperature: from -5 to +40 ° C;
- humidity max 70% relative humidity;
- maximum voltage: +/-1000 µε
- reflective spectrum: <0.25 nm in 3 dB;
- reflective: 70- 90%;
- bandwidth (reflection) at -0.5 dB: <0.12nm;
- bandwidth (reflection) at -25 dB: 0.5 nm;
- transmission spectrum: <0.25 nm in 3 dB.
Light from a configurable super luminescent diode SLD1 with a central wavelength of 1050nm and a half-band width (FWHM) equal to 50nm, controlled by a controller (3 in Figure 4), the power and temperature of the diode are directed by a single-mode fiber SMF 28 to a fiber optic connector (5 in Figure 4 ). At the same time, the light from the second SLD2 diode with an average wavelength of 1550 nm and a transmission width of the spectral characteristic equal to 110 nm is directed by the same fiber optic connector into a system with two grilles FBG1 and FBG2. The gratings were recorded on a single-mode fiber injected with hydrogen using the phase mask technique in such a way that their Bragg wavelengths were λB1=1035.250nm, respectively, and λB2 =1565.035nm. The signal after passing through the grating was integrated using an optical detector, and the spectrum recorded using an optical spectrum analyzer with a resolution of 0.01nm. The grilles attached to the bracket were placed in a specially designed temperature chamber (8 in Figure 4) with controlled and regulated temperature of the passing air.
For such a system with two Bragg gratings with different wavelengths at different temperatures, the matrix equation (4) will take the following form:
where and denote a change (understood as a shift) in the Bragg wavelength of the grating FBG1 and FBG2, respectively, KT1 and KƐ1 in the system under consideration are the sensitivity of the grating FBG1 to temperature and deformation, respectively, whereas KT2 and KƐ2 denote the sensitivity of the grating FBG2 to temperature and deformation, respectively.
The sensitivity to deformation of both gratings KƐ1 and KƐ2 was determined experimentally by measuring the Bragg wavelength shifts of the gratings and inducing their deformation at a constant temperature.
The temperature sensitivities of KT1 and KT2 were determined experimentally by measuring the Bragg wavelength shifts of gratings at different temperatures, but with constant deformation.
The gratings were glued onto a metal sample, which was then subjected to a tensile force of a known value, in the system shown in Figure 5.
Taking into account the equality of the moments of forces F and Q and the equality of the length of the arms on which the forces act, as well as the amount of stress in the sample and its physical dimensions, it is possible to determine the amount of deformation that the sample will undergo, according to the dependence:
where r2 is the length of the shoulder on which the force Q acts, r1 is the length of the shoulder on which the force F acts, Q is gravity, m is the mass of the weight, r2, g is the acceleration of the earth, s and w are the width and thickness of the sample, respectively (s=10 mm, w =1 mm), whereas E is Young's modulus (E ≈ 20,55·1010 N/m2).
Temperature tests carried out using a thermal chamber (Figure 6) allowed direct temperature measurements, which eliminated the need to determine them based on intermediate values, as was the case in the case of measuring the previous size (deformation) - in accordance with equation (13).
Performing a series of calibration measurements makes it possible to determine the sensitivity of the gratings to both measured values. Then, based on changing the gratings parameters and inverting the matrix (12), it is possible to simultaneously determine the temperature and deformation. The results of measurements of the wavelength depending on the deformation are shown in Figure 7, and measurements depending on the value of the variable temperature are shown in Figure 8.
The results obtained during experiments with variable deformation (Figure 7) were subjected to linear regression. Simple ones were assigned, on the basis of which the non-linearity error of the sensor processing characteristic was determined. The nonlinearity is determined by the magnitude of the nonlinearity error calculated in accordance with the dependence (14) [36]:
where the value of absolute differences, determined by the equation of simple regression, and the straight line obtained from the measurement results.Index i denotes the number of the gratings for which the error is calculated (i = 1 or 2 for FBG1 and FBG2, respectively), _and the maximum and minimum values of the Bragg wavelength shift differences of the i-th grating, respectively.
The values of the nonlinearity errors indicated in this way were the initial =0,06% and the initial =0,08% for FBG1 and FBG2, respectively. Pearson's linear regression correlation coefficient [36] was 0.987 for FBG1 and 0.985 for FBG2.
Based on the slope angle of simple regressions, the values of sensitivity to deformation of the gratings used in the studies were determined. They were respectively KƐ1= 0.77 nm/mε and KƐ2= 1.22 nm/mε.
The next step of laboratory research was to determine the errors in the nonlinearity of the processing characteristics of the constructed sensor-this time used to measure temperature. The measurement results are shown in Figure 8 In this case, the nonlinearity errors were 3.43% and 2.36%, and the temperature sensitivities KT1 = 9.45 pm/°C and KT2 = 14.34 pm/°C, respectively, for the FBG1 and FBG2 gratings.
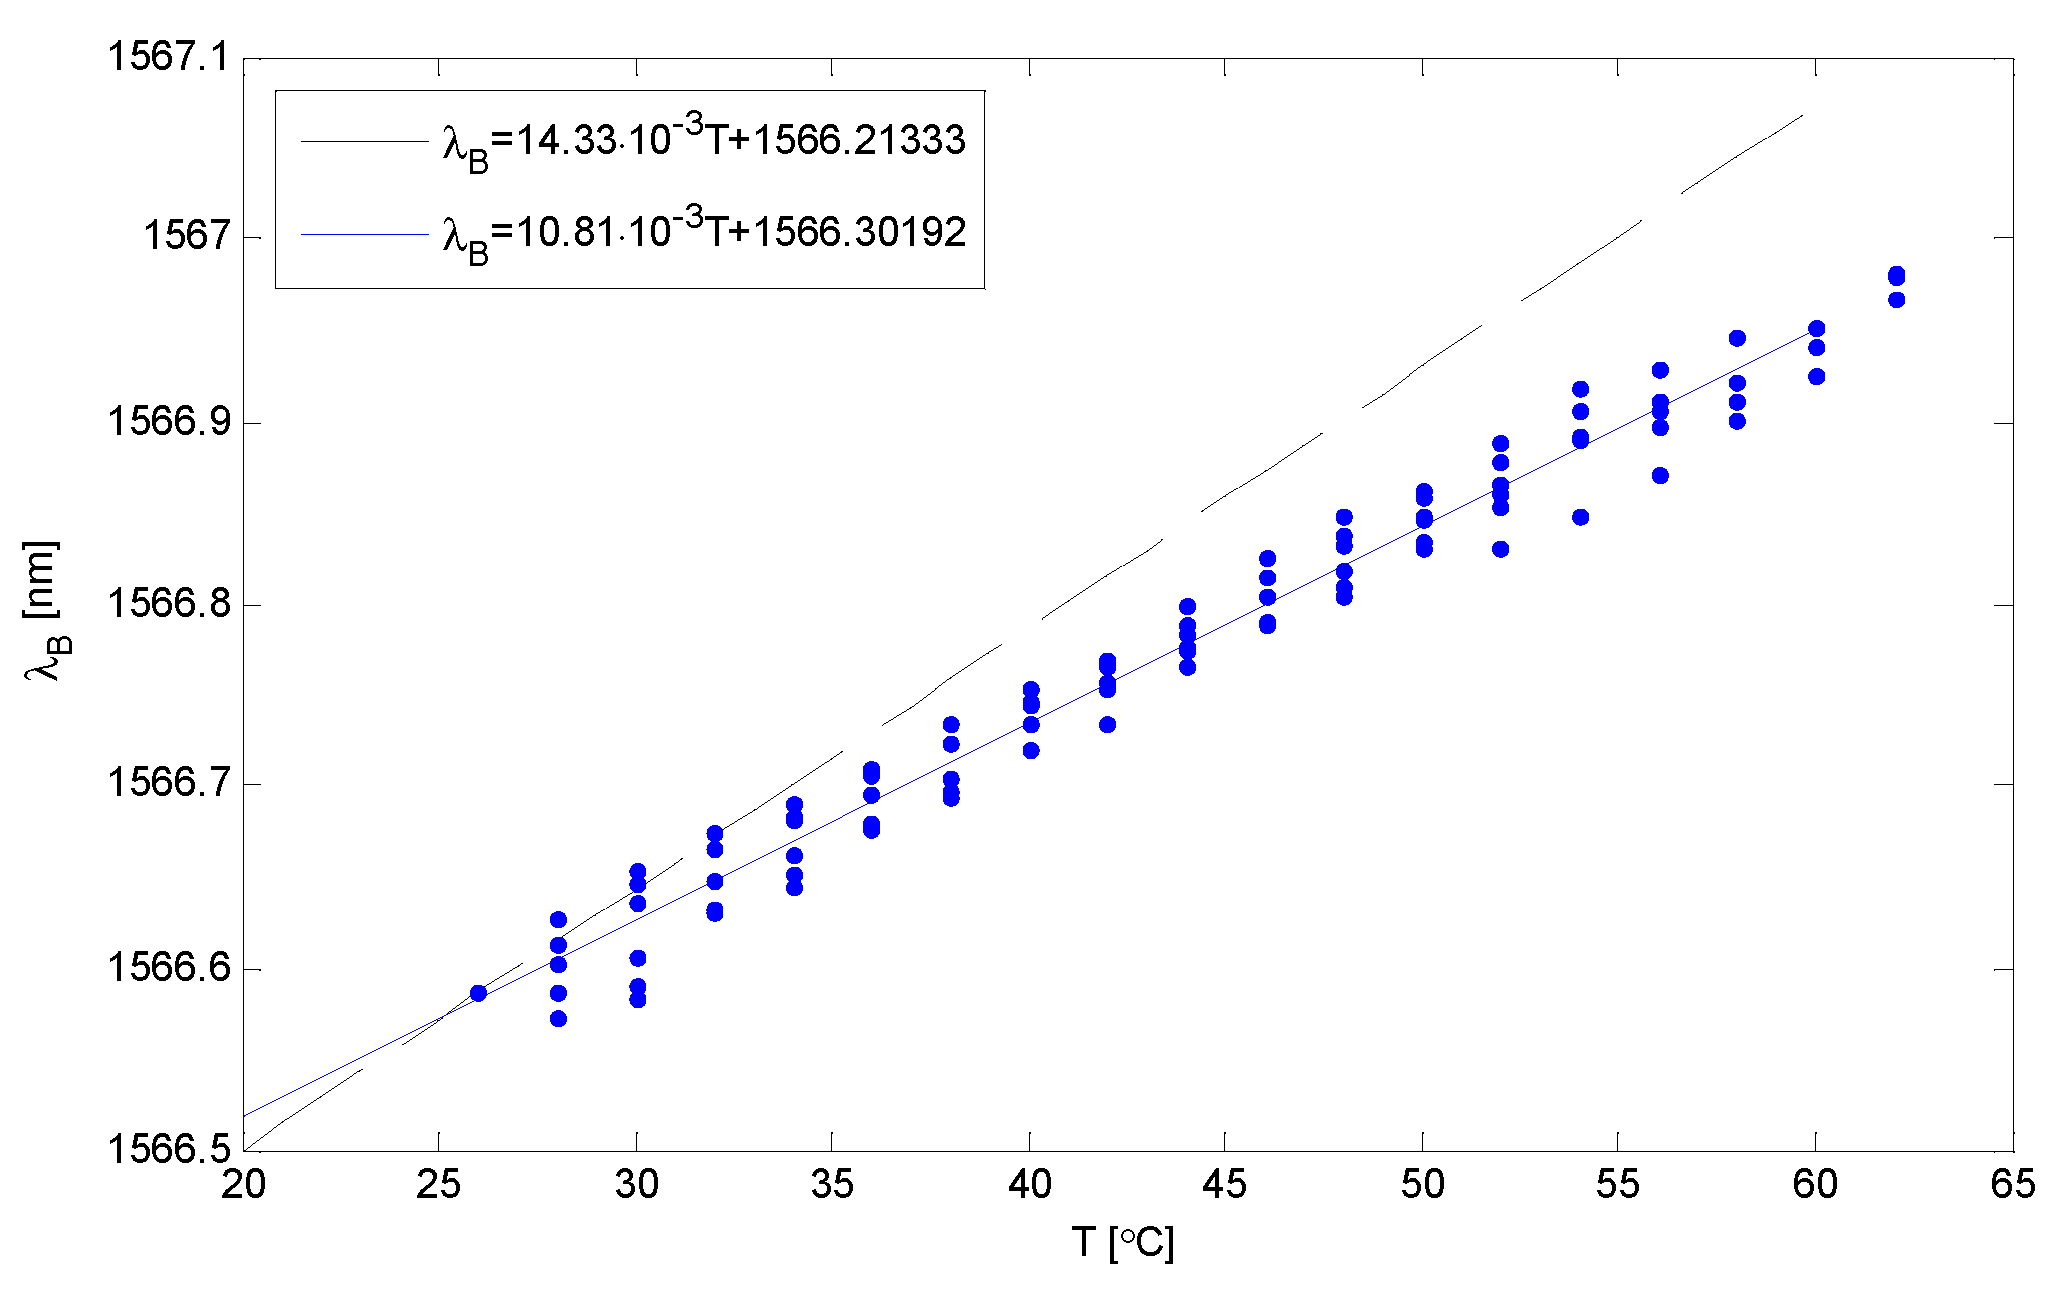
Figure 9, Figure 10, Figure 11show graphs of the dependence of the Bragg wavelength on temperature obtained experimentally. The black line and dotted line respectively show the theoretical dependence and the red and blue line correspond to the experimental result. And it can be seen that the Bragg gratings function is linear. Linearity is the ability of a fiber sensor based FBG material in a structure, to maintain a linear response under external excitation and is a prerequisite for reasonable monitoring.
The new matrix from equation 6 can be written after taking into account the values in the experiment has the form:
The nonzero determinant of the matrix D indicates that the matrix containing the coefficients of wavelength sensitivity to temperature and deformation is well conditioned.
Summing up the above considerations, we can conclude that it is possible to simultaneously measure deformation and temperature using two Bragg gratings with two different resonance constants. The measurement errors of the wavelength offset are determined by the resolution of the spectrum analyzer (0.01 nm). Knowing the resolution of the OSA, it becomes possible to determine the errors in determining the coefficients KT1 KƐ1 and KT2 KƐ2, which, in turn, allows you to determine the error of the standard determinant of the matrix D.
Conclusion: in order to obtain a high measurement sensitivity, it is necessary to build a measuring system in order to obtain the maximum possible absolute value of the determinant of the matrix |D|. This is possible when the two components in equation (7) KT1 KƐ1 and KT2 KƐ2 will have opposite signs. It is worth paying attention to this element, because in many works the absolute values of similar factors are very unfavorably close [38]. A greater difference between the factors under consideration can be obtained by choosing another type of fiber with high birefringence (for example, fibers with an elliptical core) [39].
It follows from the analysis that if we use two fiber-optic elements (for example, Bragg gratings) with the same sensitivity as a sensor for measuring deformation and temperature, we should choose elements with opposite directions of reaction to one type of quantity (for example, deformation) and simultaneously with the same directions of reaction to the second quantity (for example, temperature).
When transferring the above principle to the field of other measuring applications, it is necessary either to choose two types of fiber-optic elements (these do not necessarily have to be only Bragg gratings), or to organize a way to place and install them on the measured object in order to make them sensitive to one of the measured values had the opposite sign and at the same time had the same sign. and the value for another of the measured values.
4. Discussion
The presented experimental characteristics prove that it is possible to use a measurement method using a sensor with two Bragg gratings. One of them was subjected to deformation and changing temperature and the other was only exposed to temperature.
The formulation of a matrix equation for a sensor with two homogeneous Bragg gratings used for equal measurement of deformation and temperature, and after experimental measurement of the individual sensitivity of the gratings placed in the sensor processing matrix demonstrates the possibility of determining changes in temperature and deformation through further use of the matrix due to its good conditionality.
Analysis of the influence of fiber optical properties on matrix equations and determination of such gratings parameters that must be measured to simultaneously determine the relative and temperature deformation. For sensors for measuring strain and temperature equally using the correct way of placing Bragg gratings on properly designed fibers, it can be shown that the relationship between the parameters of the gratings and the total deformation experienced by a pair of gratings can be expressed in matrix form. In order to show which parameter of the gratings or the Bragg gratings layout, to what extent and on what magnitude it is measured (temperature or deformation) depends, the analysis of matrix equations for processing the selected systems is carried out.
From the experimental results obtained in Figure 7 and Figure 8, it can be seen that the Bragg grating’s function is linear. The values of the nonlinearity errors indicated in this way were the initial = 0,06% and the initial = 0,08% for FBG1 and FBG2, respectively.
The measured sensitivity of the Bragg grating is 0,03 higher than the theoretical ones. The excellent stability the fiber sensor based of FBG is suitable for controlling the pavement system and ensuring its safety.
It can be seen that the repeatability and reliability of long-term temperature monitoring is ensured by using this type of FBG sensor, capable of measuring temperature with an accuracy of no more than 1oC for at least one day, can be easily performed in a reasonable manner within the experimental errors, which are mainly due to instrumental resolution and environmental fluctuations. The excellent stability characteristics of this FBG sensor made it possible to monitor pavement structures in difficult conditions with reasonable accuracy for a very long period of time.
Summing up it can be noted that the nature of both studied dependences of deformation and temperature turned out to be linear and within the margin of error. This main result of the work is in full accordance with the theoretical as well as practical data available at the moment. This section may be divided by subheadings. It should provide a concise and precise description of the experimental results, their interpretation, as well as the experimental conclusions that can be drawn.
5. Conclusions
Currently, fiber sensors are widely used to monitor various designs. The article considered a fiber sensor based on FBG for monitoring the road surface. Any structure bridges, buildings, road surfaces are subjected to some loads and temperature changes. The deformation and temperature varies from point to point in these structures. It is necessary to measure these parameters from time to time. Monitoring of the technical condition of the road surface ensures safe operation and is the main tool for timely detection of trends of negative changes in the road surface at an early stage. Real-time monitoring of road performance using built-in sensors is a powerful tool for assessing road surface wear over time. The aforementioned sensor technologies allow measuring stress, deformation, deflection, humidity, traffic characteristics, temperature, which directly affect the reaction of the pavement under loads caused by vehicles and the environment. It was found that the duration of the load and the temperature of the pavement can greatly affect the magnitude of the resulting deformations in the layers of the pavement. The road surface is affected by such parameters as ambient temperature and deformation from external factors. The deformation varies depending on the temperature. At normal temperature, the strain value decreases and increases at high temperatures. Therefore, it is very important to take into account the temperature of the road when measuring deformation from passing vehicles.
A matrix equation for a sensor with two homogeneous Bragg gratings used for equal measurement of deformation and temperature, and after experimental measurement of the individual sensitivity of the gratings placed in the sensor processing matrix demonstrates the possibility of determining temperature and deformation changes by means of an inverse matrix due to its good conditionality. To simulate pavement structures under various loads and environmental conditions, an the fiber sensor based of FBG was embedded in asphalt samples for simultaneous measurement of temperature and deformation. In addition, in future works, this type of sensors will already be implemented in real pavement structures for testing reliability and performance.
We hope that based on the research results, the considered sensor can be used not only to improve the monitoring of test sections of the road surface using the concept of an intelligent infrastructure system, but also to provide data and information in real time for the design and construction of the road surface. And it will also be able to benefit the development and application of new materials for the design procedure of mixtures and the improvement of the road surface management system.
Acknowledgments
The research was carried out within the framework of the project of the GF "Zhas Galym" № AP 14972921 "Research and development of a fiber sensor for monitoring the condition of road surfaces".
References
- A. Abdelgawad and K. Yelamarthi, “Internet of Things (IoT) platform for structure health monitoring,” Wireless Communications and Mobile Computing, vol. 2017, Article ID 6560797, 10 pages, 2017. [CrossRef]
- H. Wang, W. Liu, J. He et al., “Functionality enhancement of industrialized optical fiber sensors and system developed for full-scale pavement monitoring,” Sensors, vol. 14, no. 5, pp. 8829–8850, 2014. [CrossRef]
- J. Xie, H. Li, L. Gao, and M. Liu, “Laboratory investigation of rutting performance for multilayer pavement with fiber Bragg gratings,” Construction and Building Materials, vol. 154, pp. 331–339, 2017. [CrossRef]
- Budnicki, D.; Parola, I.; Szostkiewicz, Ł.; Markiewicz, K.; Hołdy ´nski, Z.; Wojcik, G.; Makara, M.; Poturaj, K.; Kukli ´nska, M.; Mergo, P.; et al. All-Fiber Vector Bending Sensor Based on a Multicore Fiber With Asymmetric Air-Hole Structure. J. Light. Technol. 2020, 38, 6685–6690.
- Ekechukwu, G.K.; Sharma, J. Well-scale demonstration of distributed pressure sensing using fiber-optic DAS and DTS. Sci. Rep. 2021, 11, 12505. [CrossRef]
- Lu, F.; Wright, R.; Lu, P.; Cvetic, P.C.; Ohodnicki, P.R. Distributed fiber optic pH sensors using sol-gel silica based sensitive materials. Sens. Actuators B Chem. 2021, 340, 129853. [CrossRef]
- Liu, Y.; Zhou, A.; Yuan, L. Multifunctional fiber-optic sensor, based on helix structure and fiber Bragg gratings, for shape sensing. Opt. Laser Technol. 2021, 143, 107327. [CrossRef]. [CrossRef]
- Senkans, U.; Braunfelds, J.; Lyashuk, I.; Porins, J.; Spolitis, S.; Bobrovs, V. Research on FBG-Based Sensor Networks and Their Coexistence with Fiber Optical Transmission Systems. J. Sens. 2019, 2019, 6459387. Sensors 2022, 22, 4581 14 of 14. [CrossRef]
- Fan, L.; Bao, Y. Review of fiber optic sensors for corrosion monitoring in reinforced concrete. Cem. Concr. Compos. 2021, 120, 104029. [CrossRef]
- Zheng, X.; Shi, B.; Zhang, C.C.; Sun, Y.; Zhang, L.; Han, H. Strain transfer mechanism in surface-bonded distributed fiber-optic sensors subjected to linear strain gradients: Theoretical modeling and experimental validation. Measurement 2021, 179, 109510. [CrossRef]
- He, C.; Korposh, S.; Correia, R.; Liu, L.; Hayes-Gill, B.R.; Morgan, S.P. Optical fibre sensor for simultaneous temperature and relative humidity measurement: Towards absolute humidity evaluation. Sens. Actuators B Chem. 2021, 344, 130154. [CrossRef]
- Wijaya, H.; Rajeev, P.; Gad, E. Distributed optical fibre sensor for infrastructure monitoring: Field applications. Opt. Fiber Technol. 2021, 64, 102577. [CrossRef]
- Lenner, M.; Frank, A.; Yang, L.; Roininen, T.M.; Bohnert, K. Long-Term Reliability of Fiber-Optic Current Sensors. IEEE Sens. J. 2020, 20, 823–832. [CrossRef]
- Baši´c, P. Fiber Optic Sensor Cable Based on Hollow Capillary Tube with Three Tightly Encapsulated Optical Fibers. In Proceedings of the 2nd International Colloquium on Smart Grid Metrology, Split, Croatia, 9–12 April 2019; pp. 1–4.
- H. Wang, W. Liu, J. He et al., “Functionality enhancement of industrialized optical fiber sensors and system developed for full-scale pavement monitoring,” Sensors, vol. 14, no. 5, pp. 8829–8850, 2014. [CrossRef]
- T. Yiqiu, W. Haipeng, M. Shaojun, and X. Huining, “Quality control of asphalt pavement compaction using fibre Bragg grating sensing technology,” Construction and Building Materials, vol. 54, pp. 53–59, 2014. [CrossRef]
- Chabot, A., et al.. Viscoroute 2.0: a tool for the simulation of moving load effects on asphalt pavement. RMPD Special Issue on Recent Advances in Numerical Simulation of Pavements, 11(2), 227-250, 2010.
- Chupin, O., et al.. Evaluation of the Structure-induced Rolling Resistance (SRR) for pavements including viscoelastic material layers. Materials and Structures, 46(4), 683- 696, 2013. [CrossRef]
- Loizos, A., et al.. Fiber optic sensors for assessing strains in cold in-place recycled pavements. International Journal of Pavement Engineering, 14(2), 125-133, 2013. [CrossRef]
- Weng, X., et al.. Experimental investigation of pavement behavior after embankment widening using a fiber optic sensor network Structural Health Monitoring, Structural Health Monitoring, 14(1), 46-56, 2015.
- Quintana, Juan A., et al.. SHM and evaluation of a continuous reinforced concrete pavement, Journal of Civil Structural Health Monitoring, 6(4), 681-689, 2016. [CrossRef]
- Nosenzo, G., et al.. Continuous monitoring of mining induced strain in a road pavement using fiber Bragg grating sensors, Photonic Sensors, 3(2), 144-158, 2013. [CrossRef]
- Kashaganova, G., Orazaliyeva, S., Balbayev, G., Alimseitova, Z., Carbone, G. Application of Apodized Fiber Bragg Gratings in Information Security Systems Mechanisms and Machine Science, 2022, 108 MMS, pp. 451–460.
- Whelan, B.E.; Brunton, M.; Nosenzo, G.; Kay, D.; Buys, H. Continuous monitoring of mining induced strain in a road pavement using fiber Bragg grating sensors. In Proceedings of the Asia Pacific Optical Sensors Conference, Sydney, Australia, 31 January–3 February 2012; p. 83513I.
- Lu, F.; Feng, M.; Gu, X.; Yang, S. Field experiment on monitoring of cracks in highway asphalt overlay. In Proceedings of the 16th International Symposium on: Smart Structures and Materials and Non-Destructive Evaluation and Health Monitoring, San Diego, CA, USA, 8 April 2009; p. 72940O.
- Iten, M.; Puzrin, A.M.; Schmid, A. Landslide monitoring using a road-embedded optical fiber sensor. In Proceedings of the 15th International Symposium on: Smart Structures and Materials and Non-Destructive Evaluation and Health Monitoring, San Diego, CA, USA, 7 April 2008; p. 693315.
- Imai, M.; Igarashi, Y.; Shibata, M.; Miura, S. Experimental study on strain and deformation monitoring of asphalt structures using embedded fiber optic sensor. J. Civ. Struct. Health Monit. 2014. [CrossRef]
- Liu, W.; Wang, H.; Zhou, Z.; Li, S.; Ni, Y.; Wang, G. Optical fiber based sensing system design for the health monitoring of multi-layered pavement structure. In Proceedings of the International Conference on Optical Instruments and Technology: Optical Sensors and Applications, Beijing, China, 22 November 2011; p. 81990K.
- Tan, Y.; Wang, H.; Ma, S.; Xu, H. Quality control of asphalt pavement compaction using fiber Bragg grating sensing technology. Constr. Build. Mater. 2014, 54, 53–59.
- Kersey A.D., Berkoff T.A., Fiber-Optic Bragg-Grating Differential Temperature Sensor, “IEEE PHOTONICS TECHNOLOGY LETTERS”, 1992 vol. 4, no. 10, s. 1183-1185. [CrossRef]
- Kaczmarek C., Kaczmarek T., Kaczmarek Z., Fiber Bragg Grating Differential Strain Sensor, “CADSM'2003 Lviv-Slasko”, 2003, s. 172- 174.
- Guo T., Zhang H., Liu B., Li G., Zhao Q., Dong X., Gaussian-Strain Chirped Fiber Bragg Grating Couple for Temperature-Insensitive and Intensity-Referenced Force Measurement, “IEEE SENSORS JOURNAL”, 2007 vol. 7, no. 10, s. 1390-1394.
- Diminstein O., Gorbatov N., Tur M., Dispersion-based differential wavelength measurements for Bragg grating sensors, “ELECTRONICS LETTERS”, 2001 vol. 37, no. 7, s. 12-14. [CrossRef]
- Reilly S.P., James S.W. Tatam R.P., Dual wavelength fibre Bragg grating external cavity semiconductor laser sources for sensor applications, “Optical Fiber Sensors Conference Technical Digest Ofs”, 2002 vol. 1, s. 281-284.
- Kisała P., Periodyczne struktury światłowodowe w optoelektronicznych czujnikach do pomiaru wybranych wielkości nieelektrycznych Monografie –Politechnika Lubelska Lublin 2012 p.181.
- Kisała P., Metrological conditions of strain measurement optoelectronic method by the use of fibre Bragg gratings, “Metrolology and Measurement Systems”, 2012 vol. 19, no. 3, s. 471-480. [CrossRef]
- Cohen J., Statistical power analysis for the behavioral sciences, Lawrence Erlbaum Associates, Inc., Publishers, 1988.
- Zhou D.-P., Wei L., Liu W.-K., Liu Y., Lit J.W.Y., Simultaneous measurement for strain and temperature using fiber Bragg gratings and multimode fibers, “Applied Optics”, 2008 vol. 47, issue 10, s. 1668-1672.
- Frazão O., Marques L.M., Santos S., Baptista J.M., Santos J.L., Simultaneous Measurement for Strain and Temperature Based on a LongPeriod Grating Combined With a High-Birefringence Fiber Loop Mirror, “IEEE PHOTONICS TECHNOLOGY LETTERS”, 2006 vol. 18, no. 22, s. 2407-2409. [CrossRef]
Figure 2.
The main types of road destruction: track, break and subsidence of the roadbed, pothole, open cracks, grid of cracks, crumbling of asphalt concrete.
Figure 2.
The main types of road destruction: track, break and subsidence of the roadbed, pothole, open cracks, grid of cracks, crumbling of asphalt concrete.
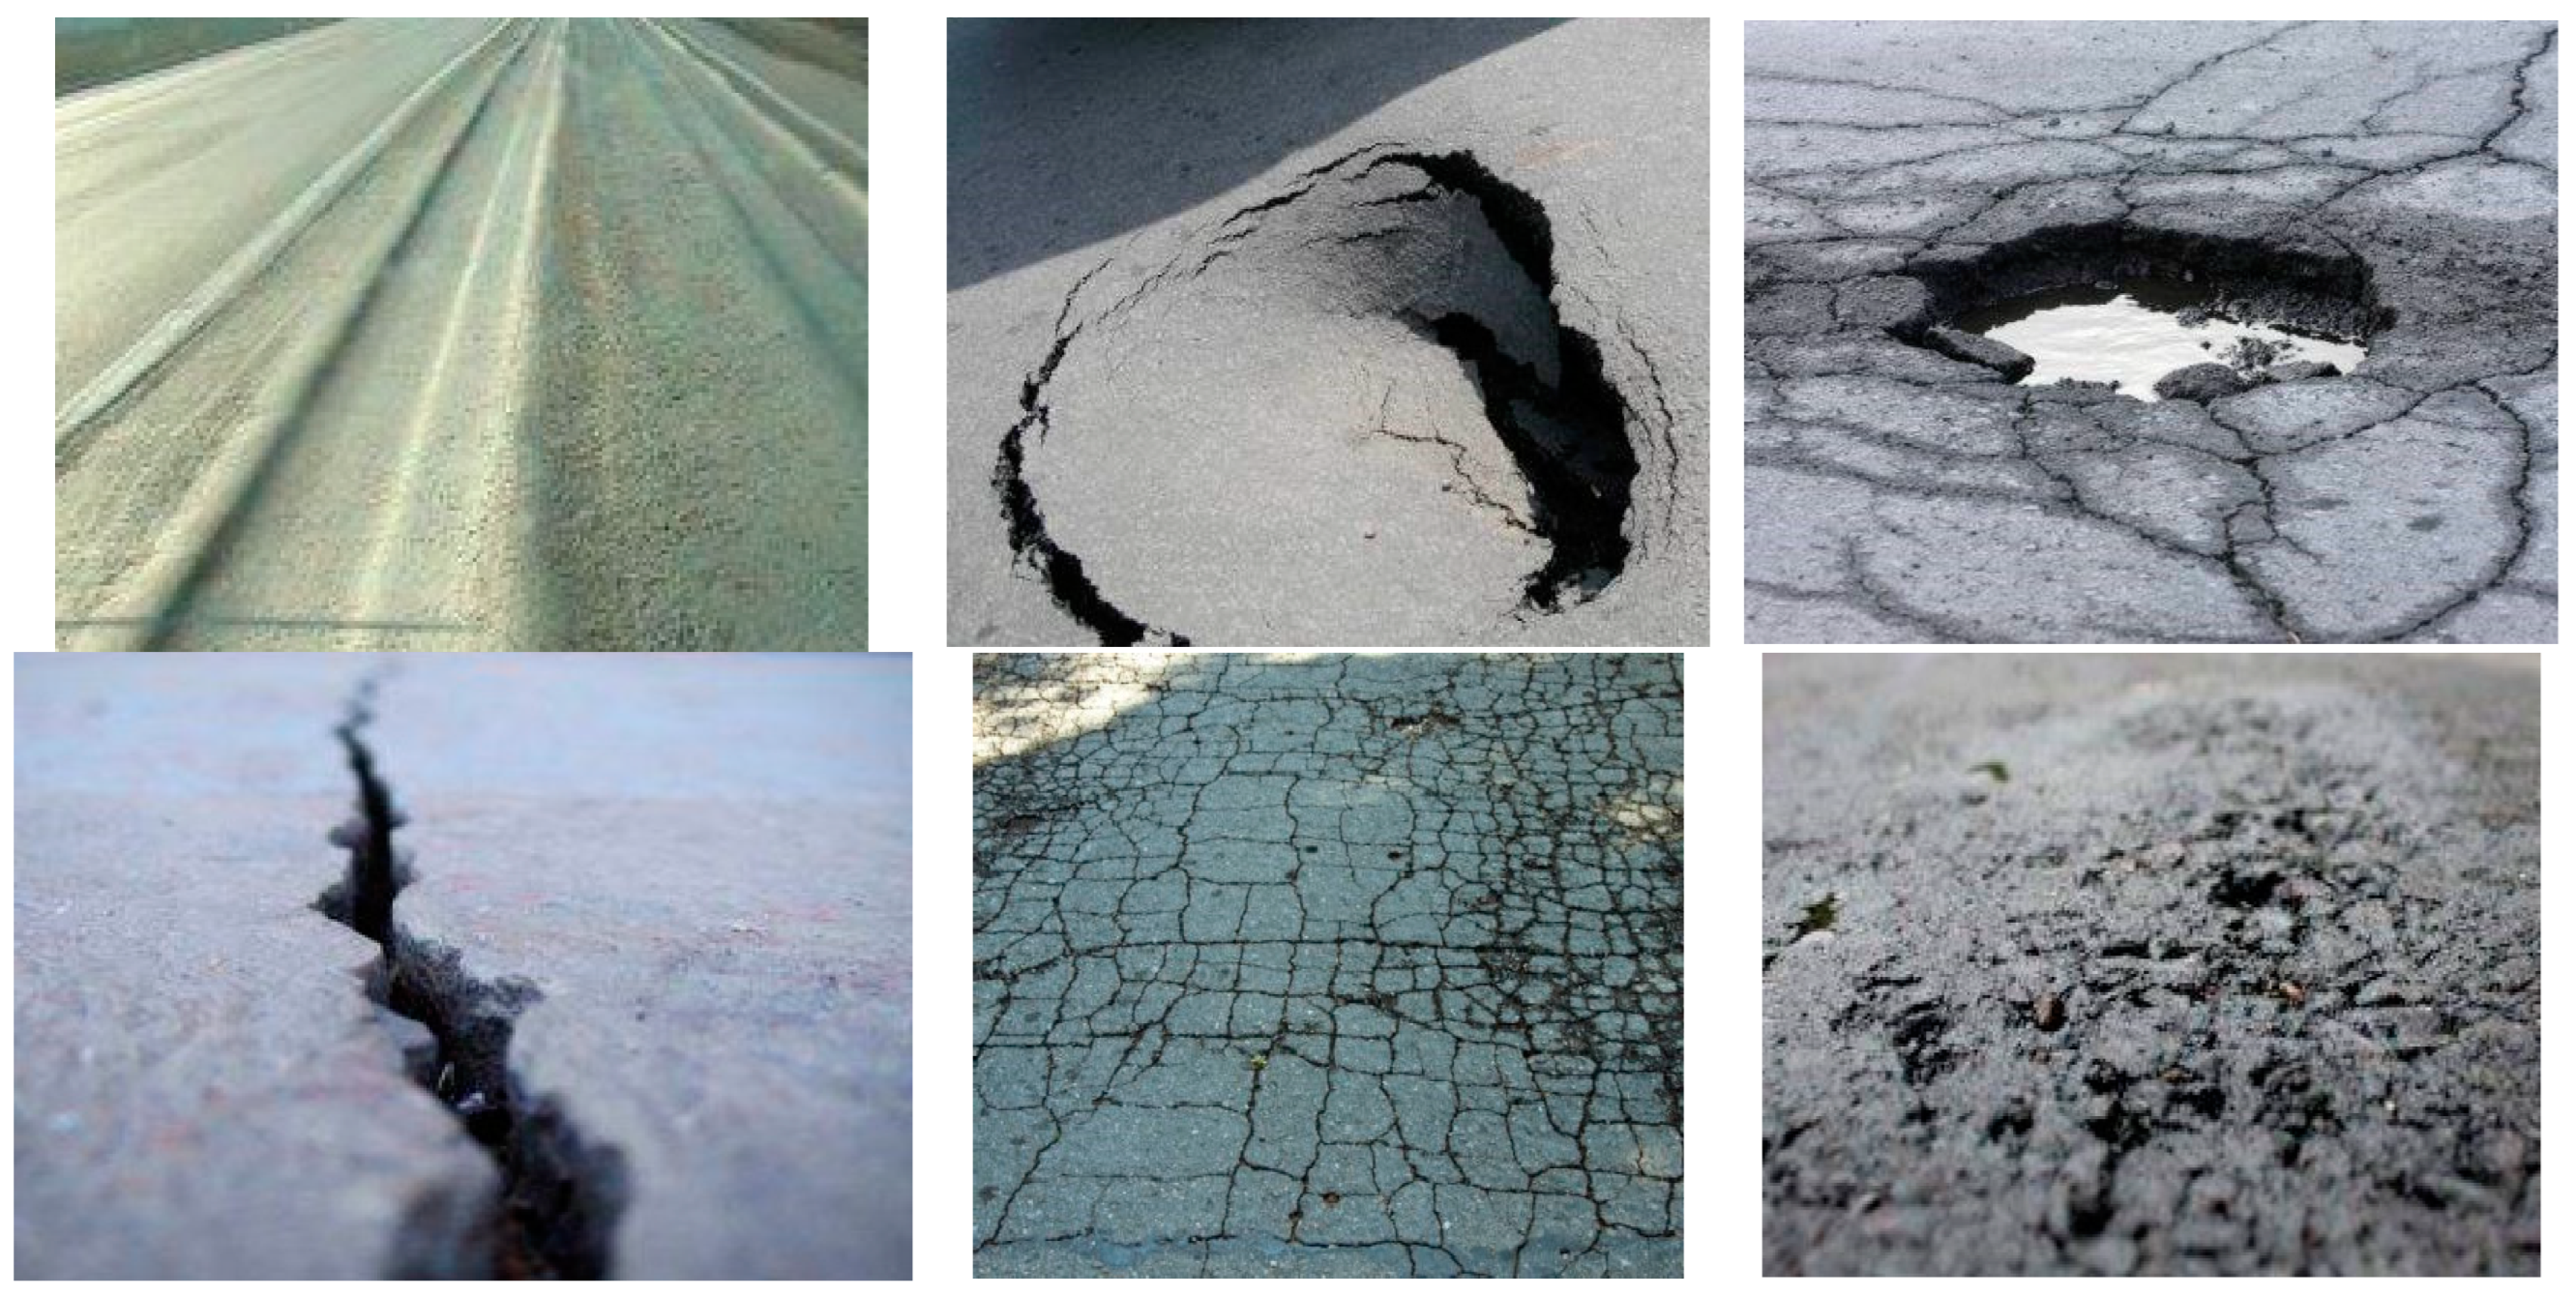
Figure 3.
The principle of operation of fiber sensors based on VRB.
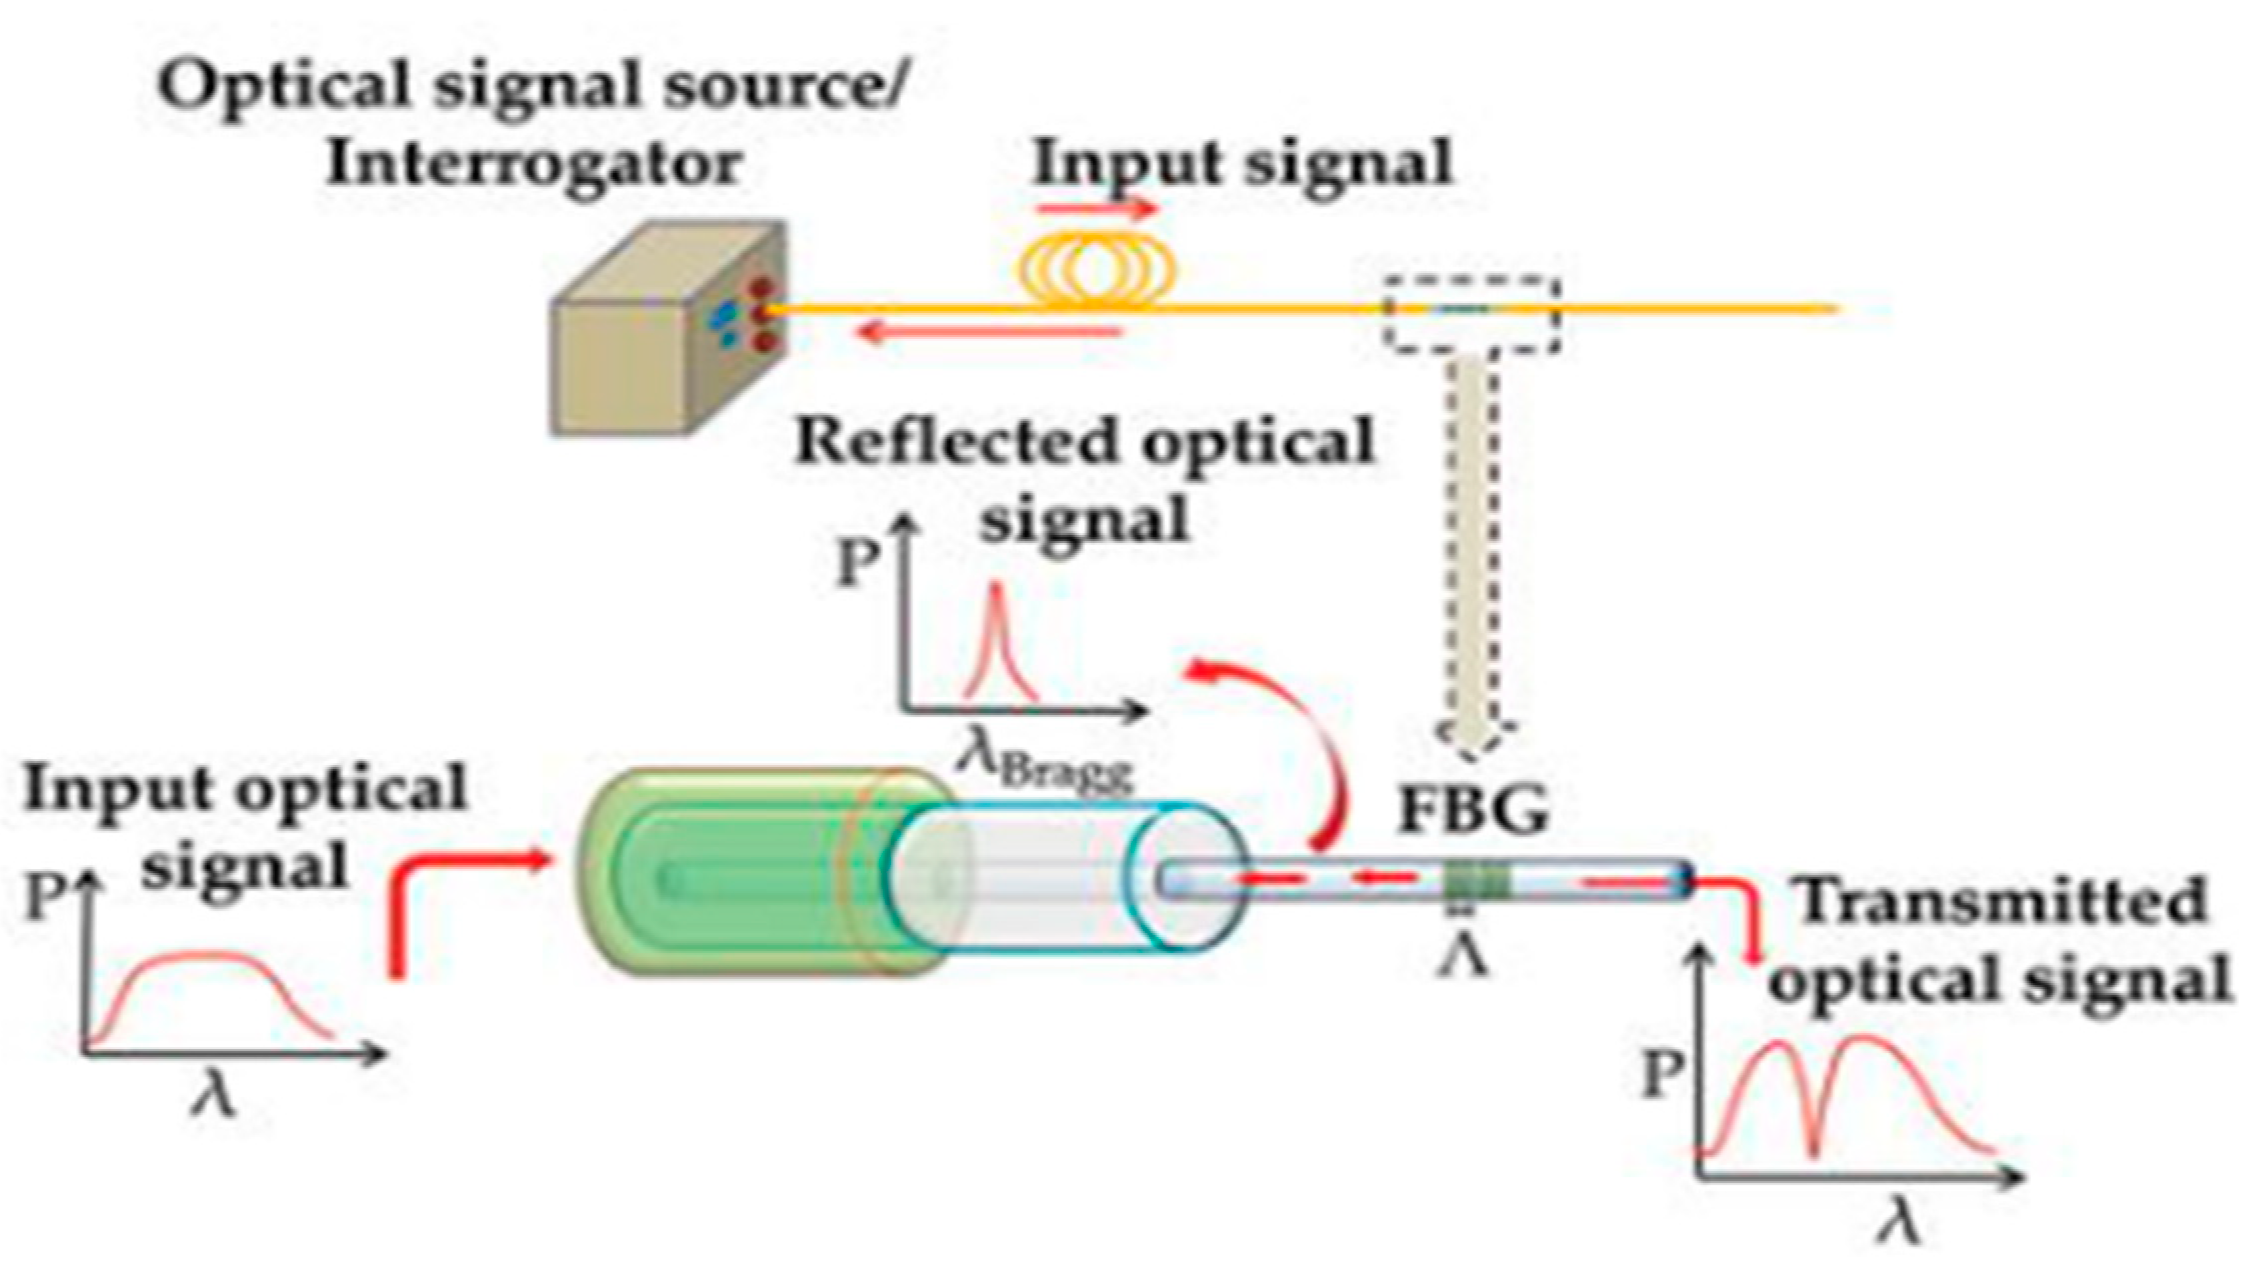
Figure 4.
The schematic Diagram of the measuring system used for simultaneous measurement of deformation and temperature.
Figure 4.
The schematic Diagram of the measuring system used for simultaneous measurement of deformation and temperature.
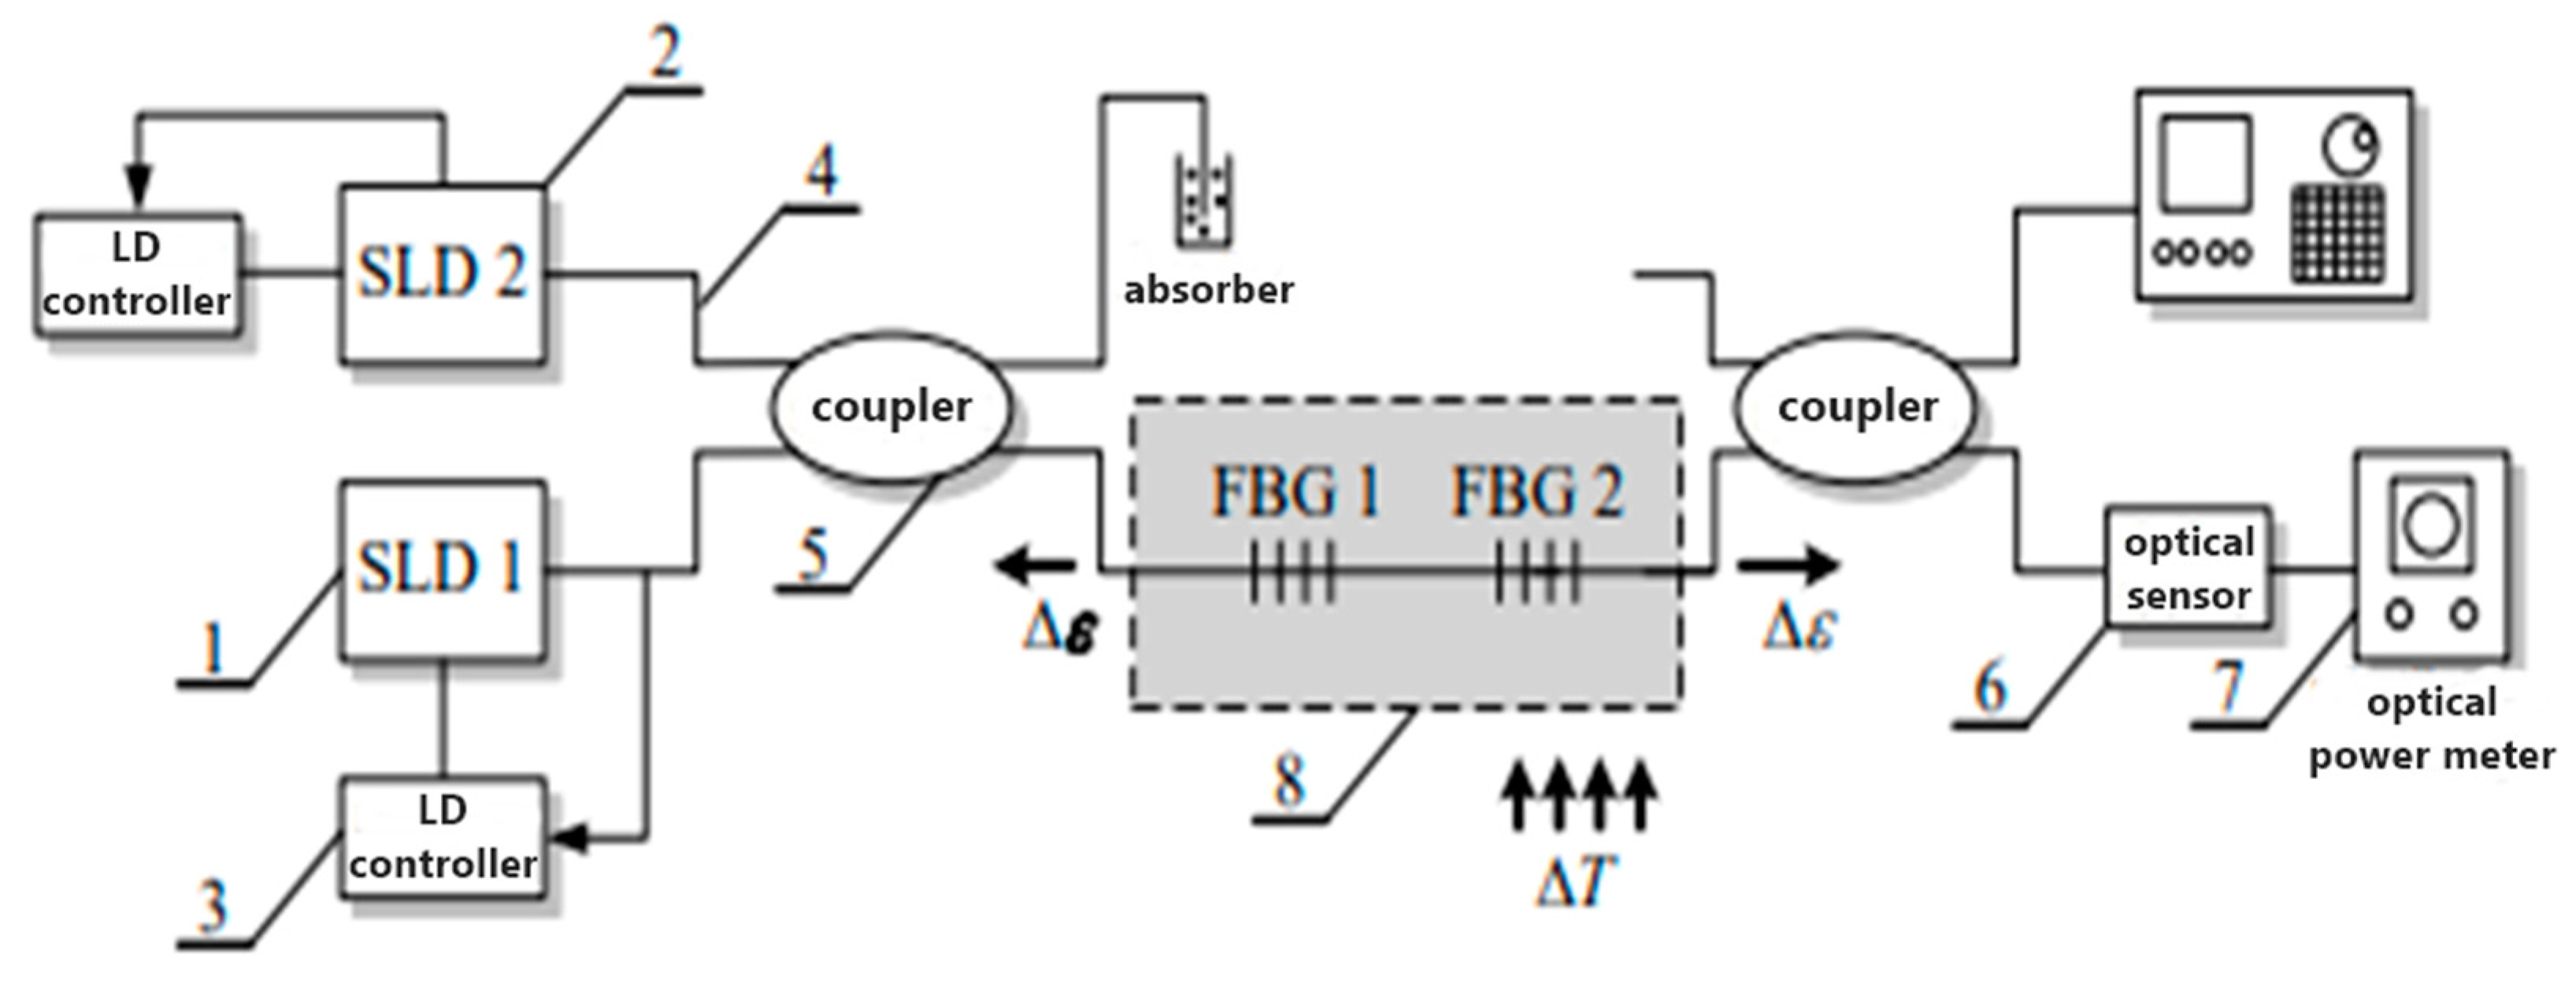
Figure 5.
Diagram and photo of the experimental systemю.
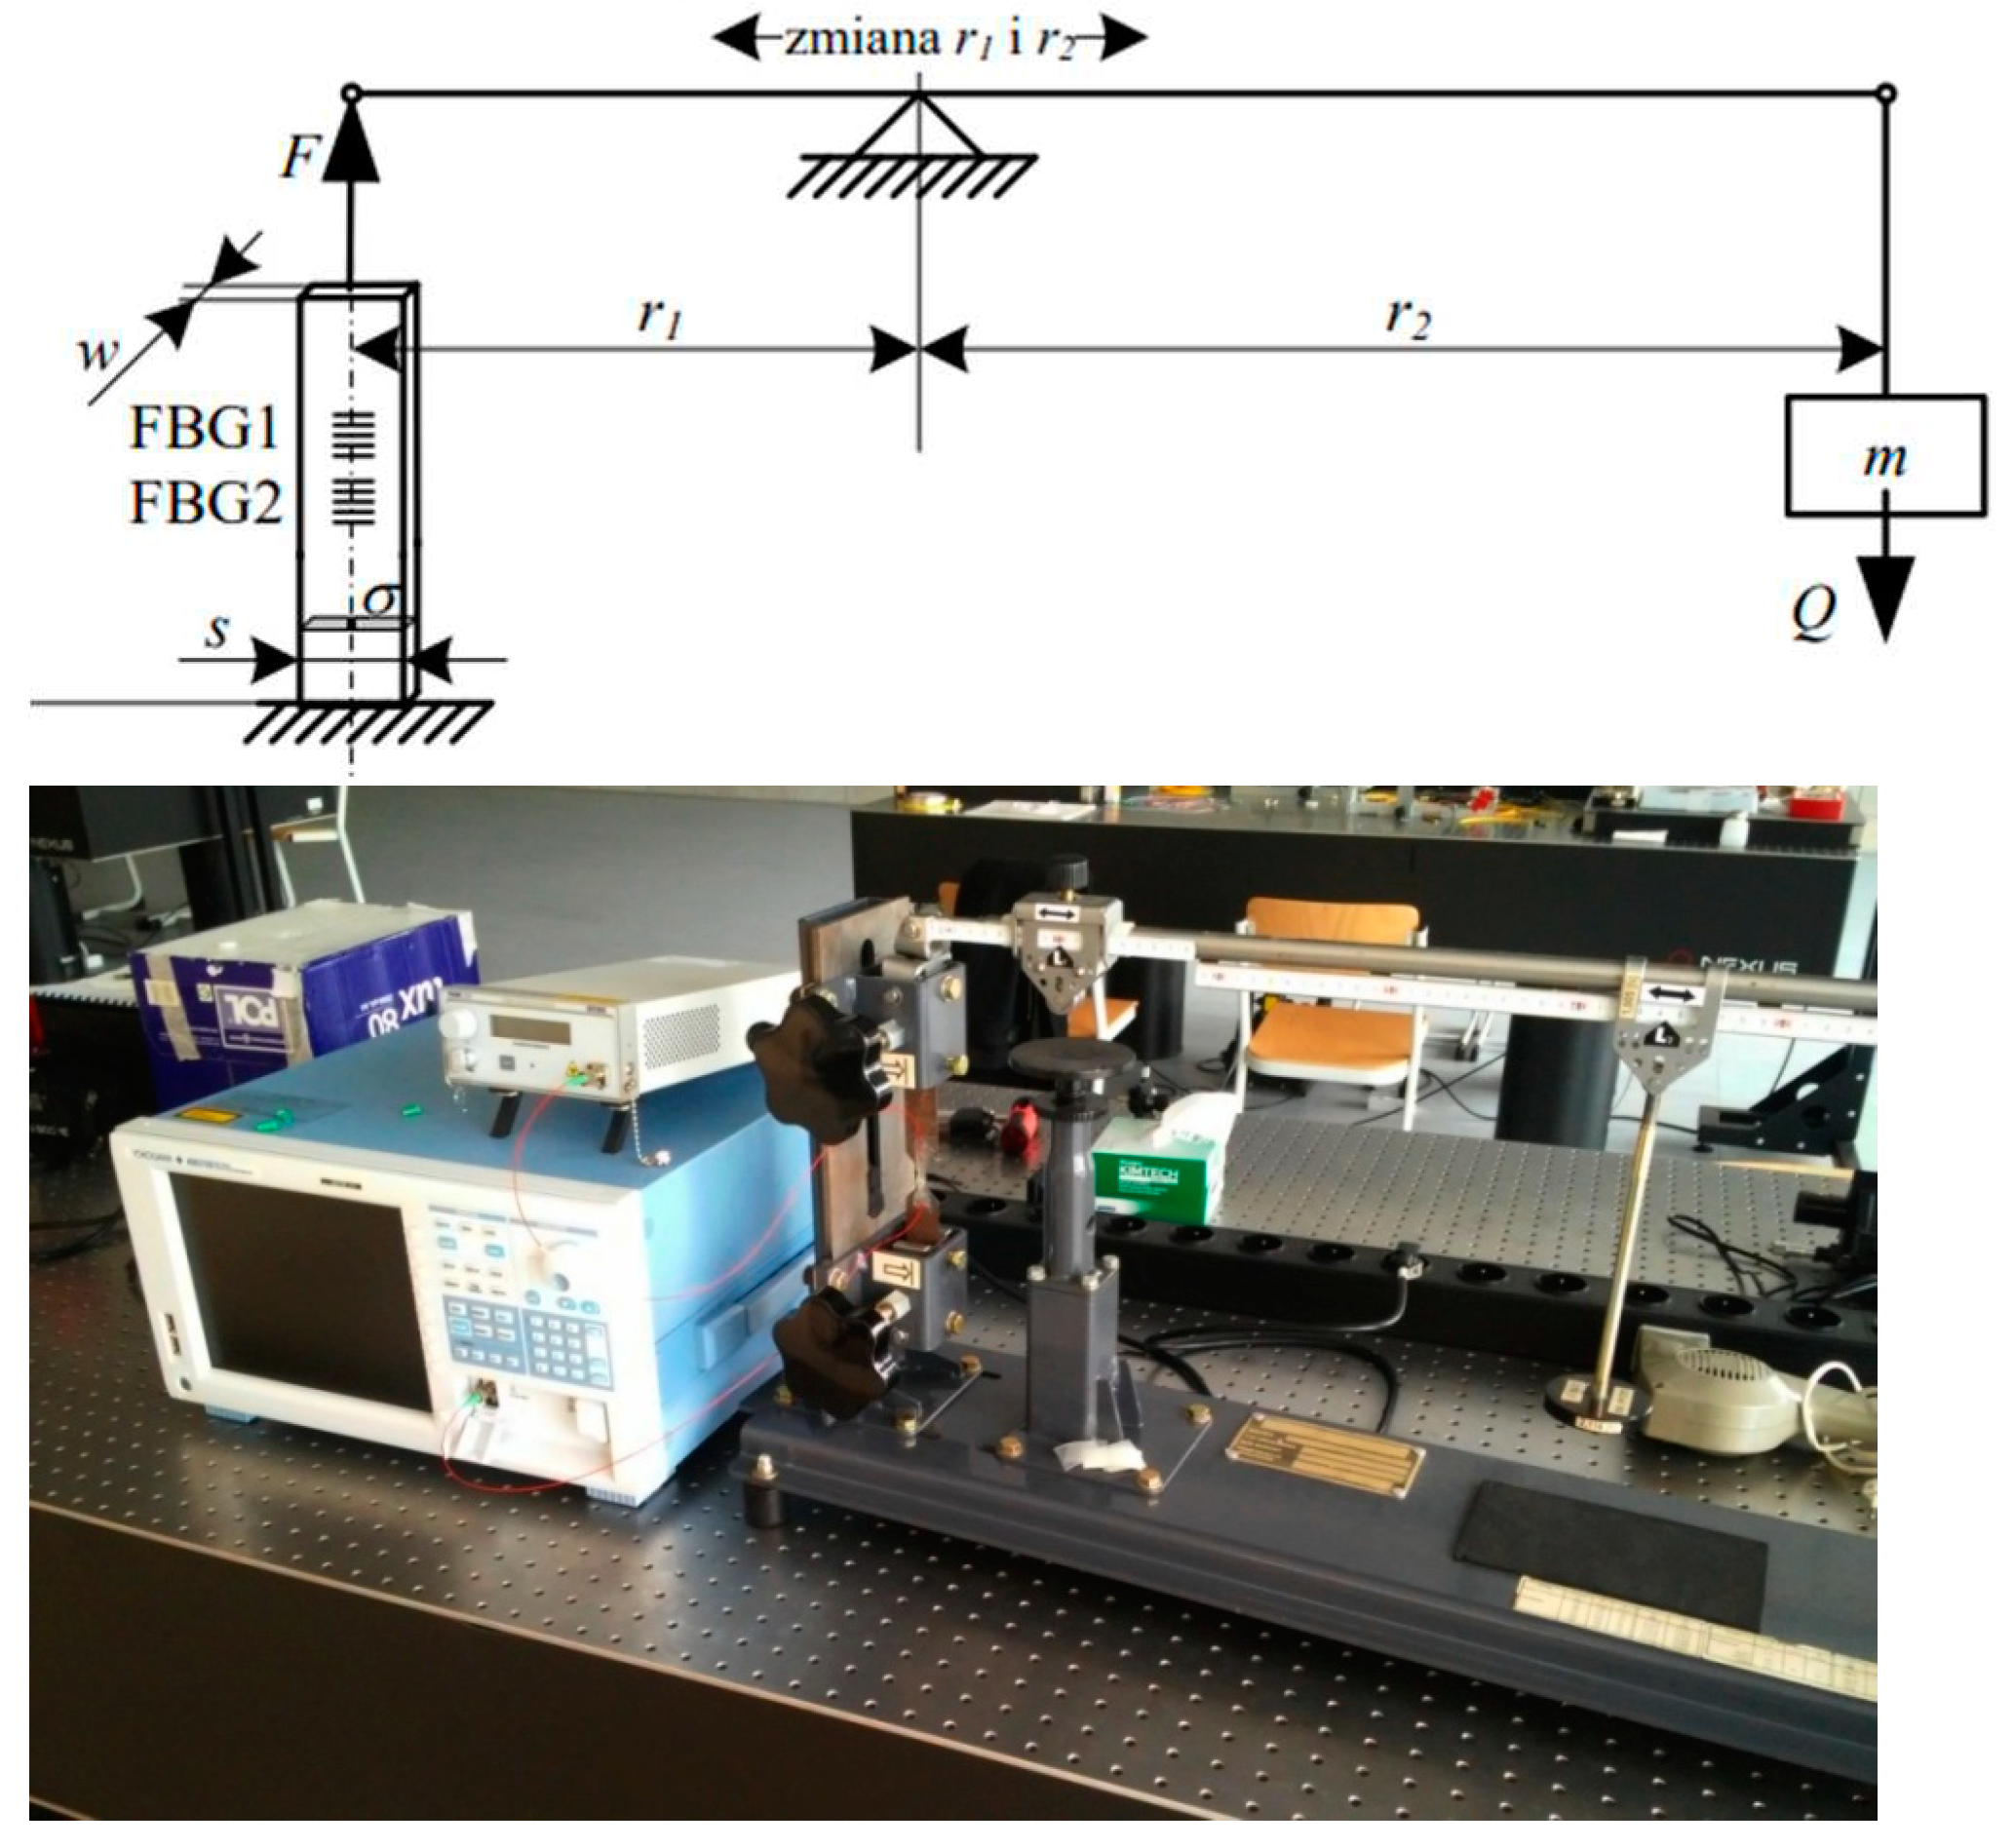
Figure 6.
Photo of the thermal chamber used in the experiment with the marking characteristic elements. 1-heat chamber, 2-air flow direction, 3-thermometer probe, 4-temperature measurement, 5-lever r1, 6-arm r2, 7-stretched sample.
Figure 6.
Photo of the thermal chamber used in the experiment with the marking characteristic elements. 1-heat chamber, 2-air flow direction, 3-thermometer probe, 4-temperature measurement, 5-lever r1, 6-arm r2, 7-stretched sample.
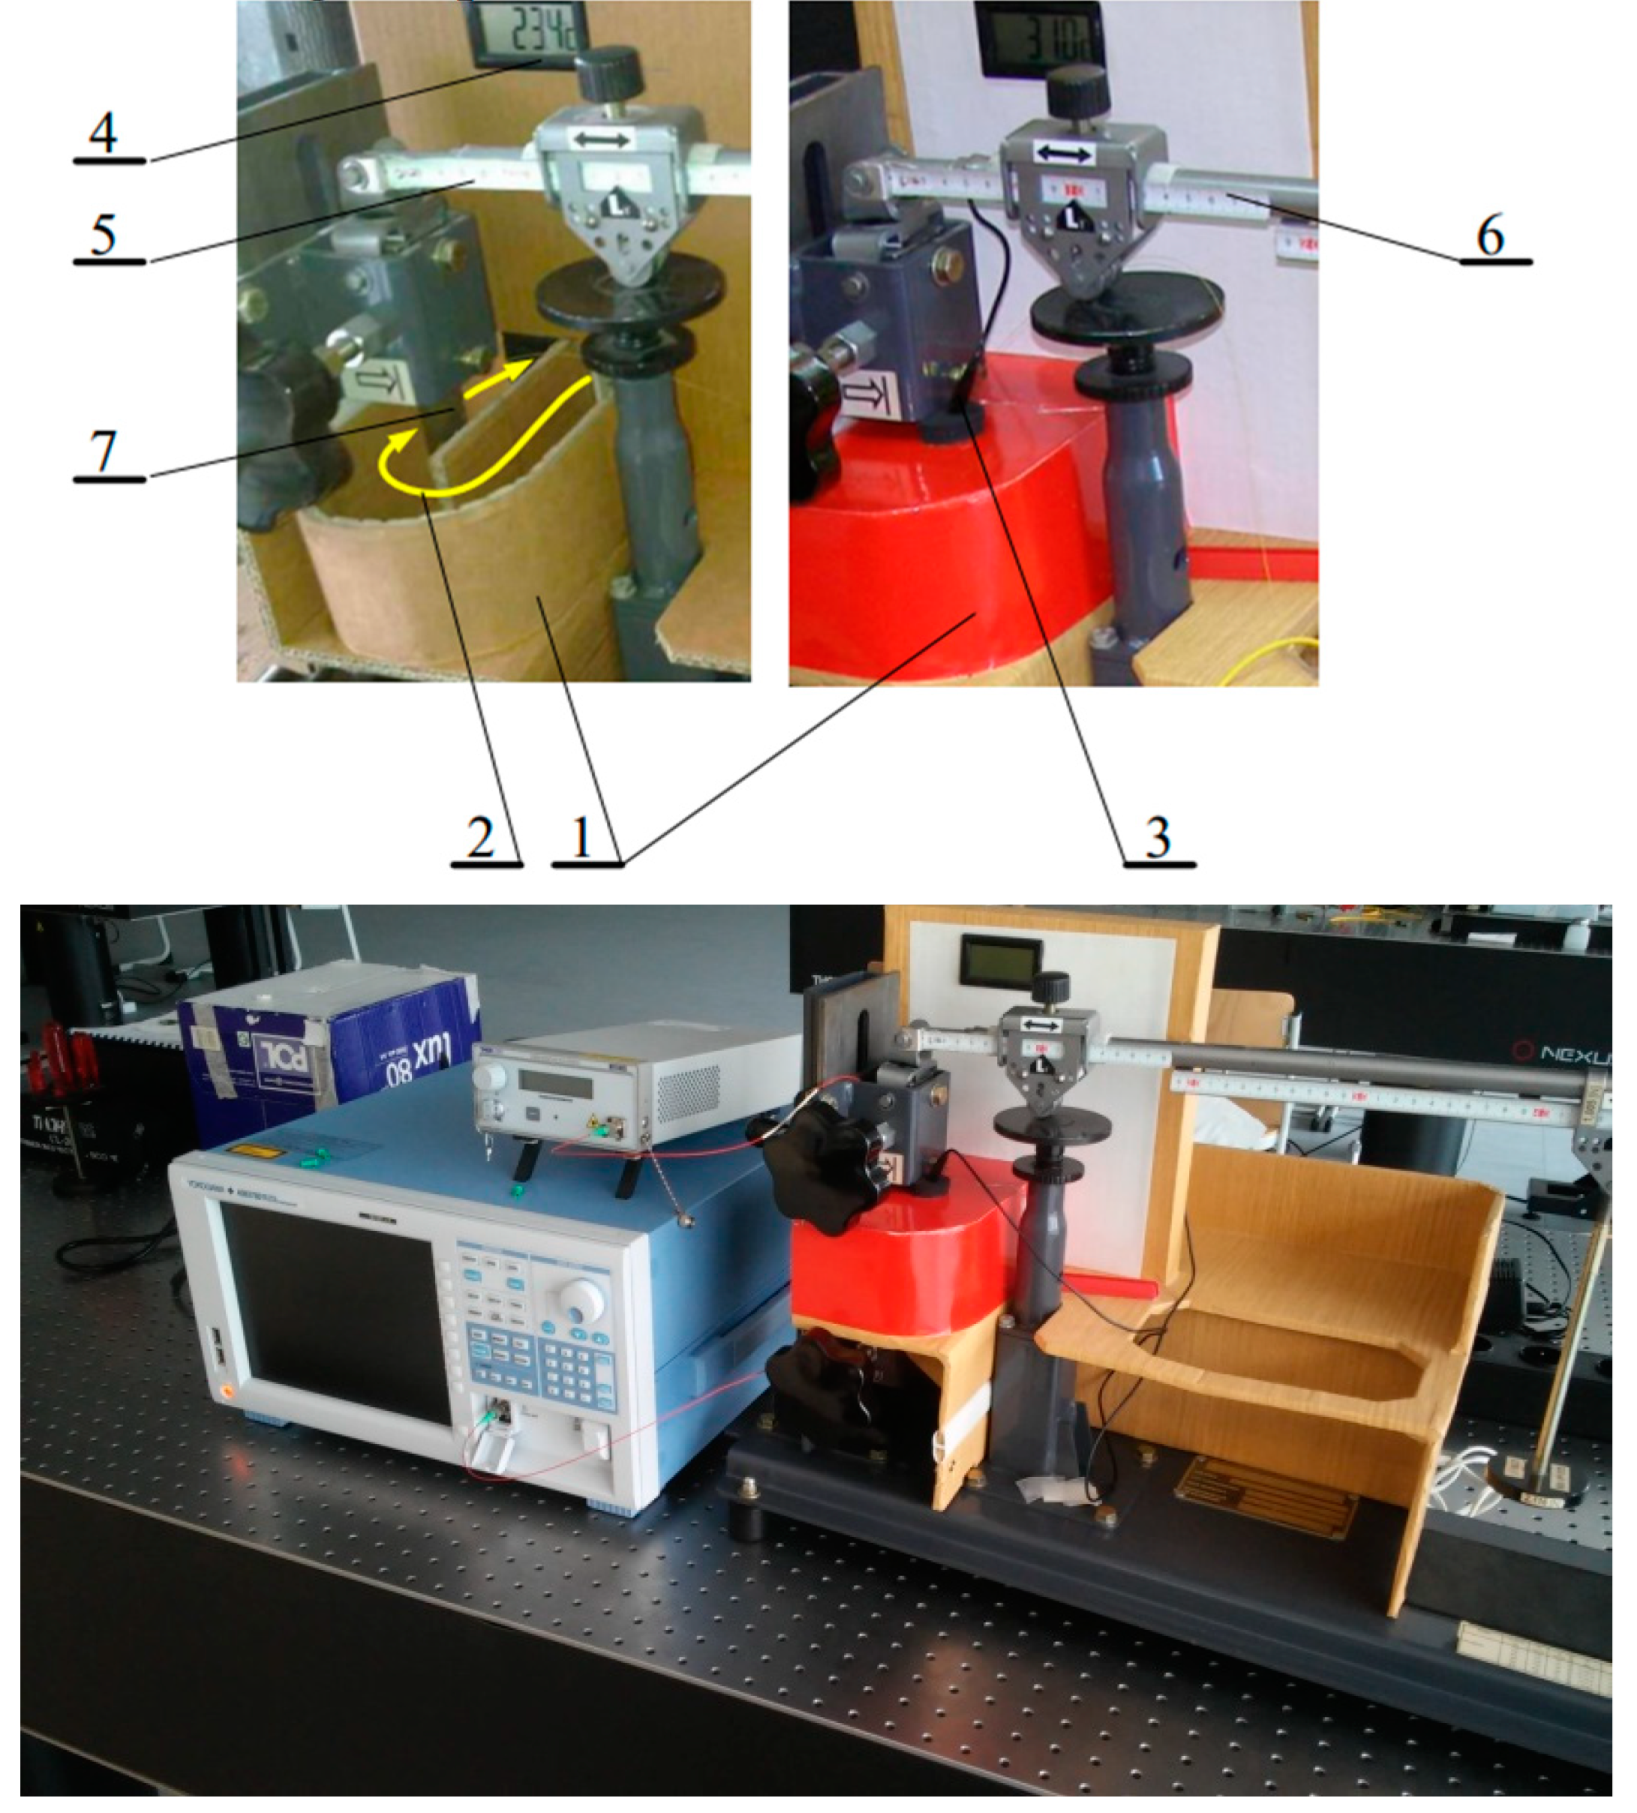
Figure 7.
Results of experimental measurements for variable deformation and constant temperature equal to 23.5oC.
Figure 7.
Results of experimental measurements for variable deformation and constant temperature equal to 23.5oC.
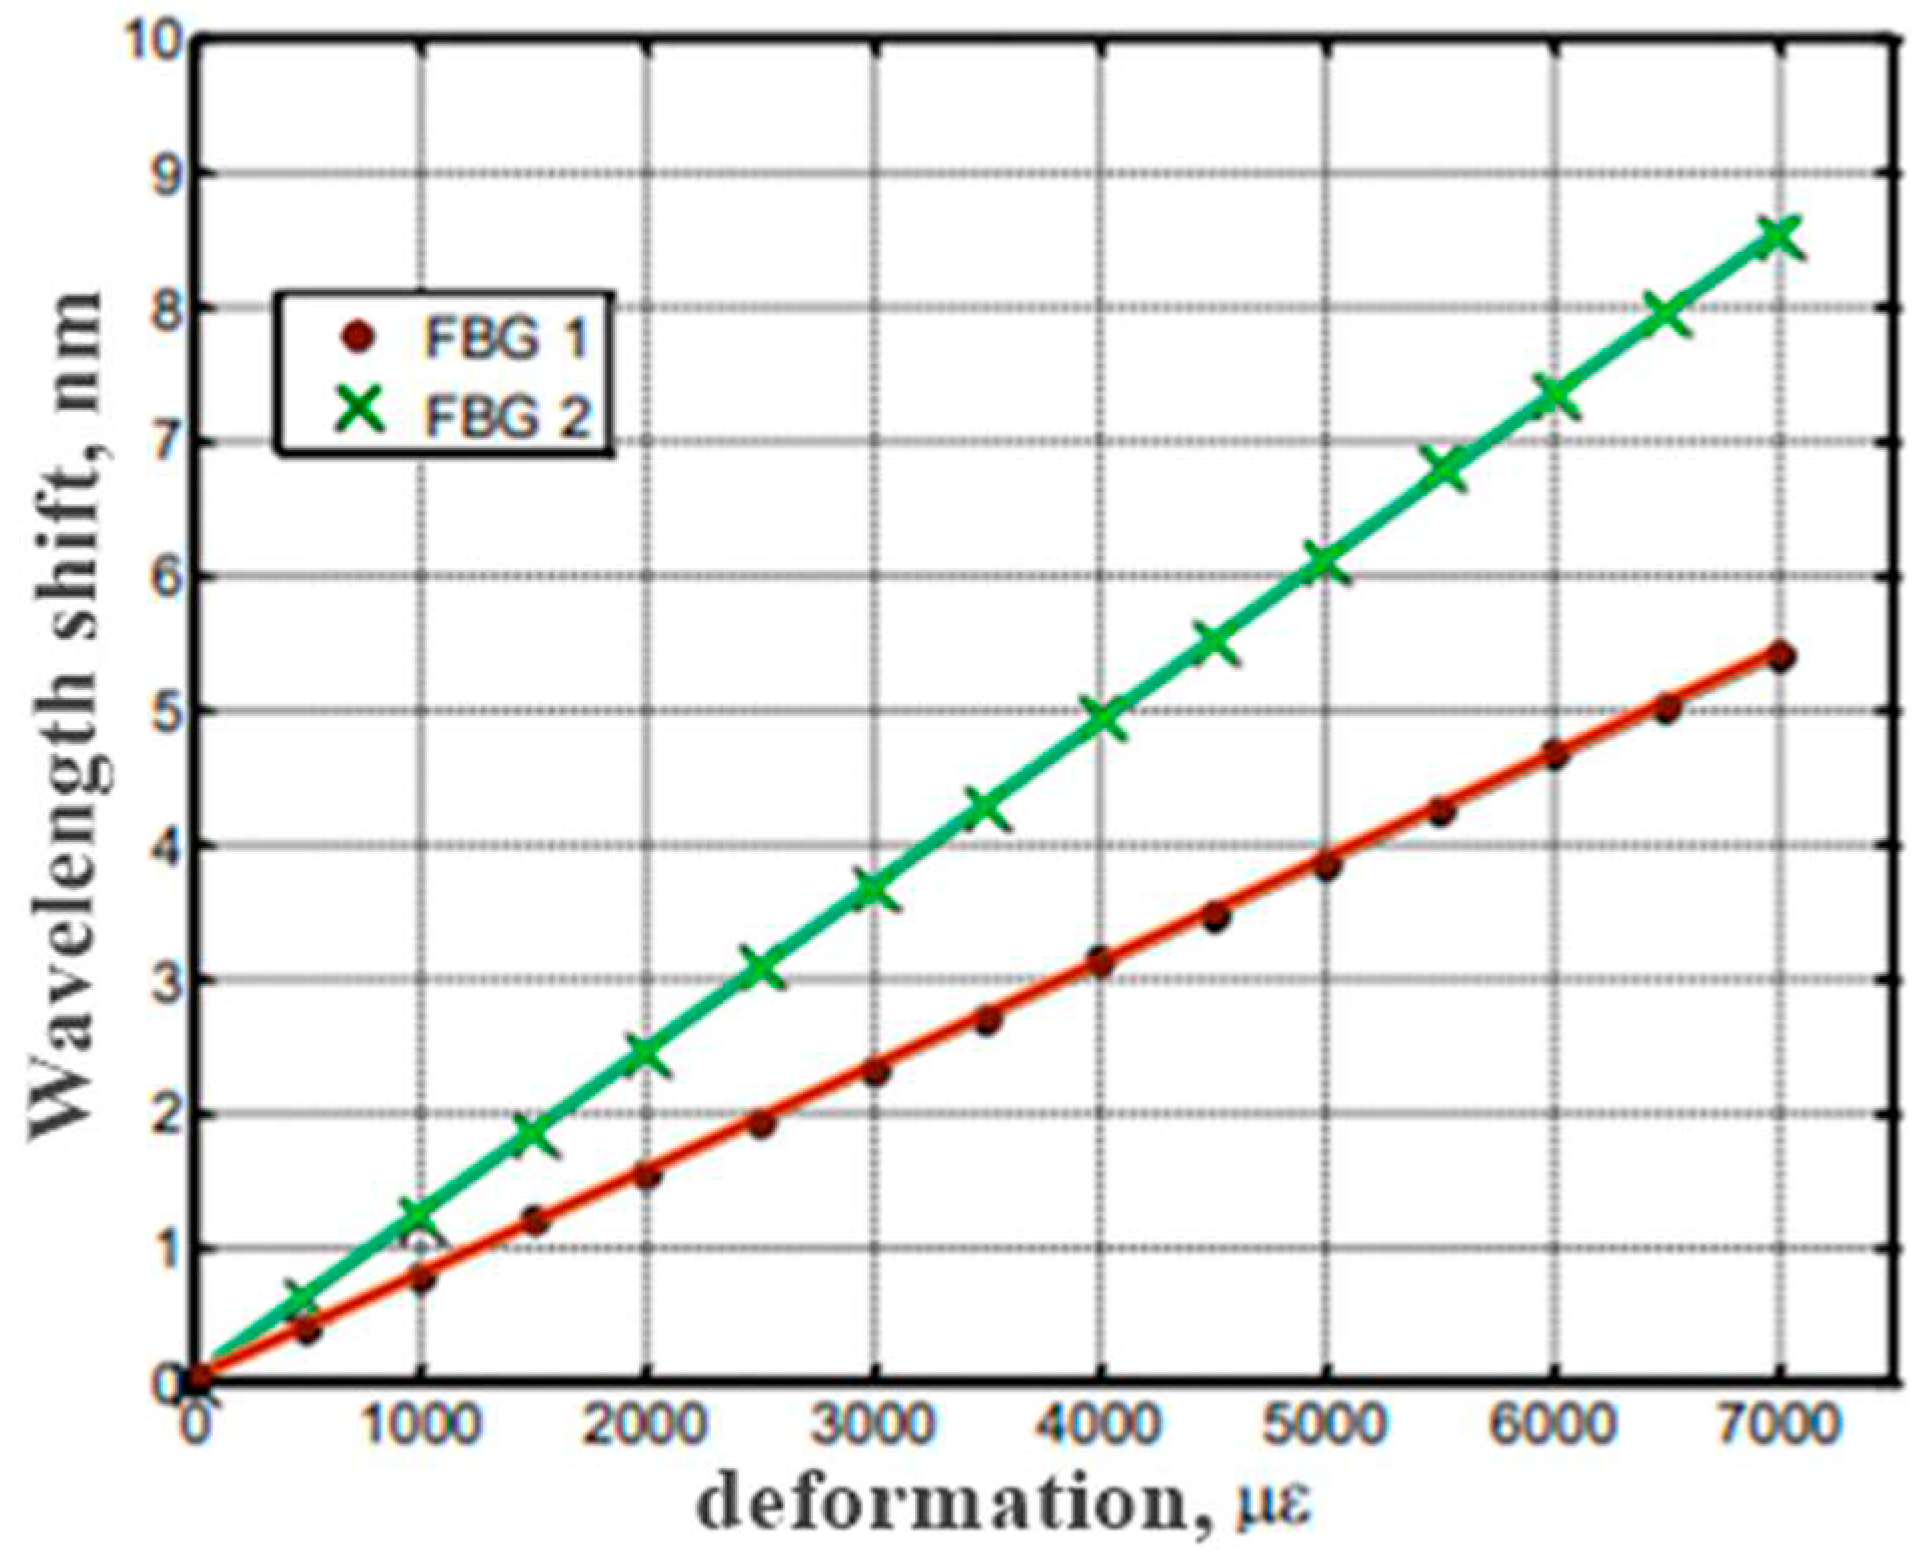
Figure 8.
Results of experimental measurements for variable temperature and constant strain value.
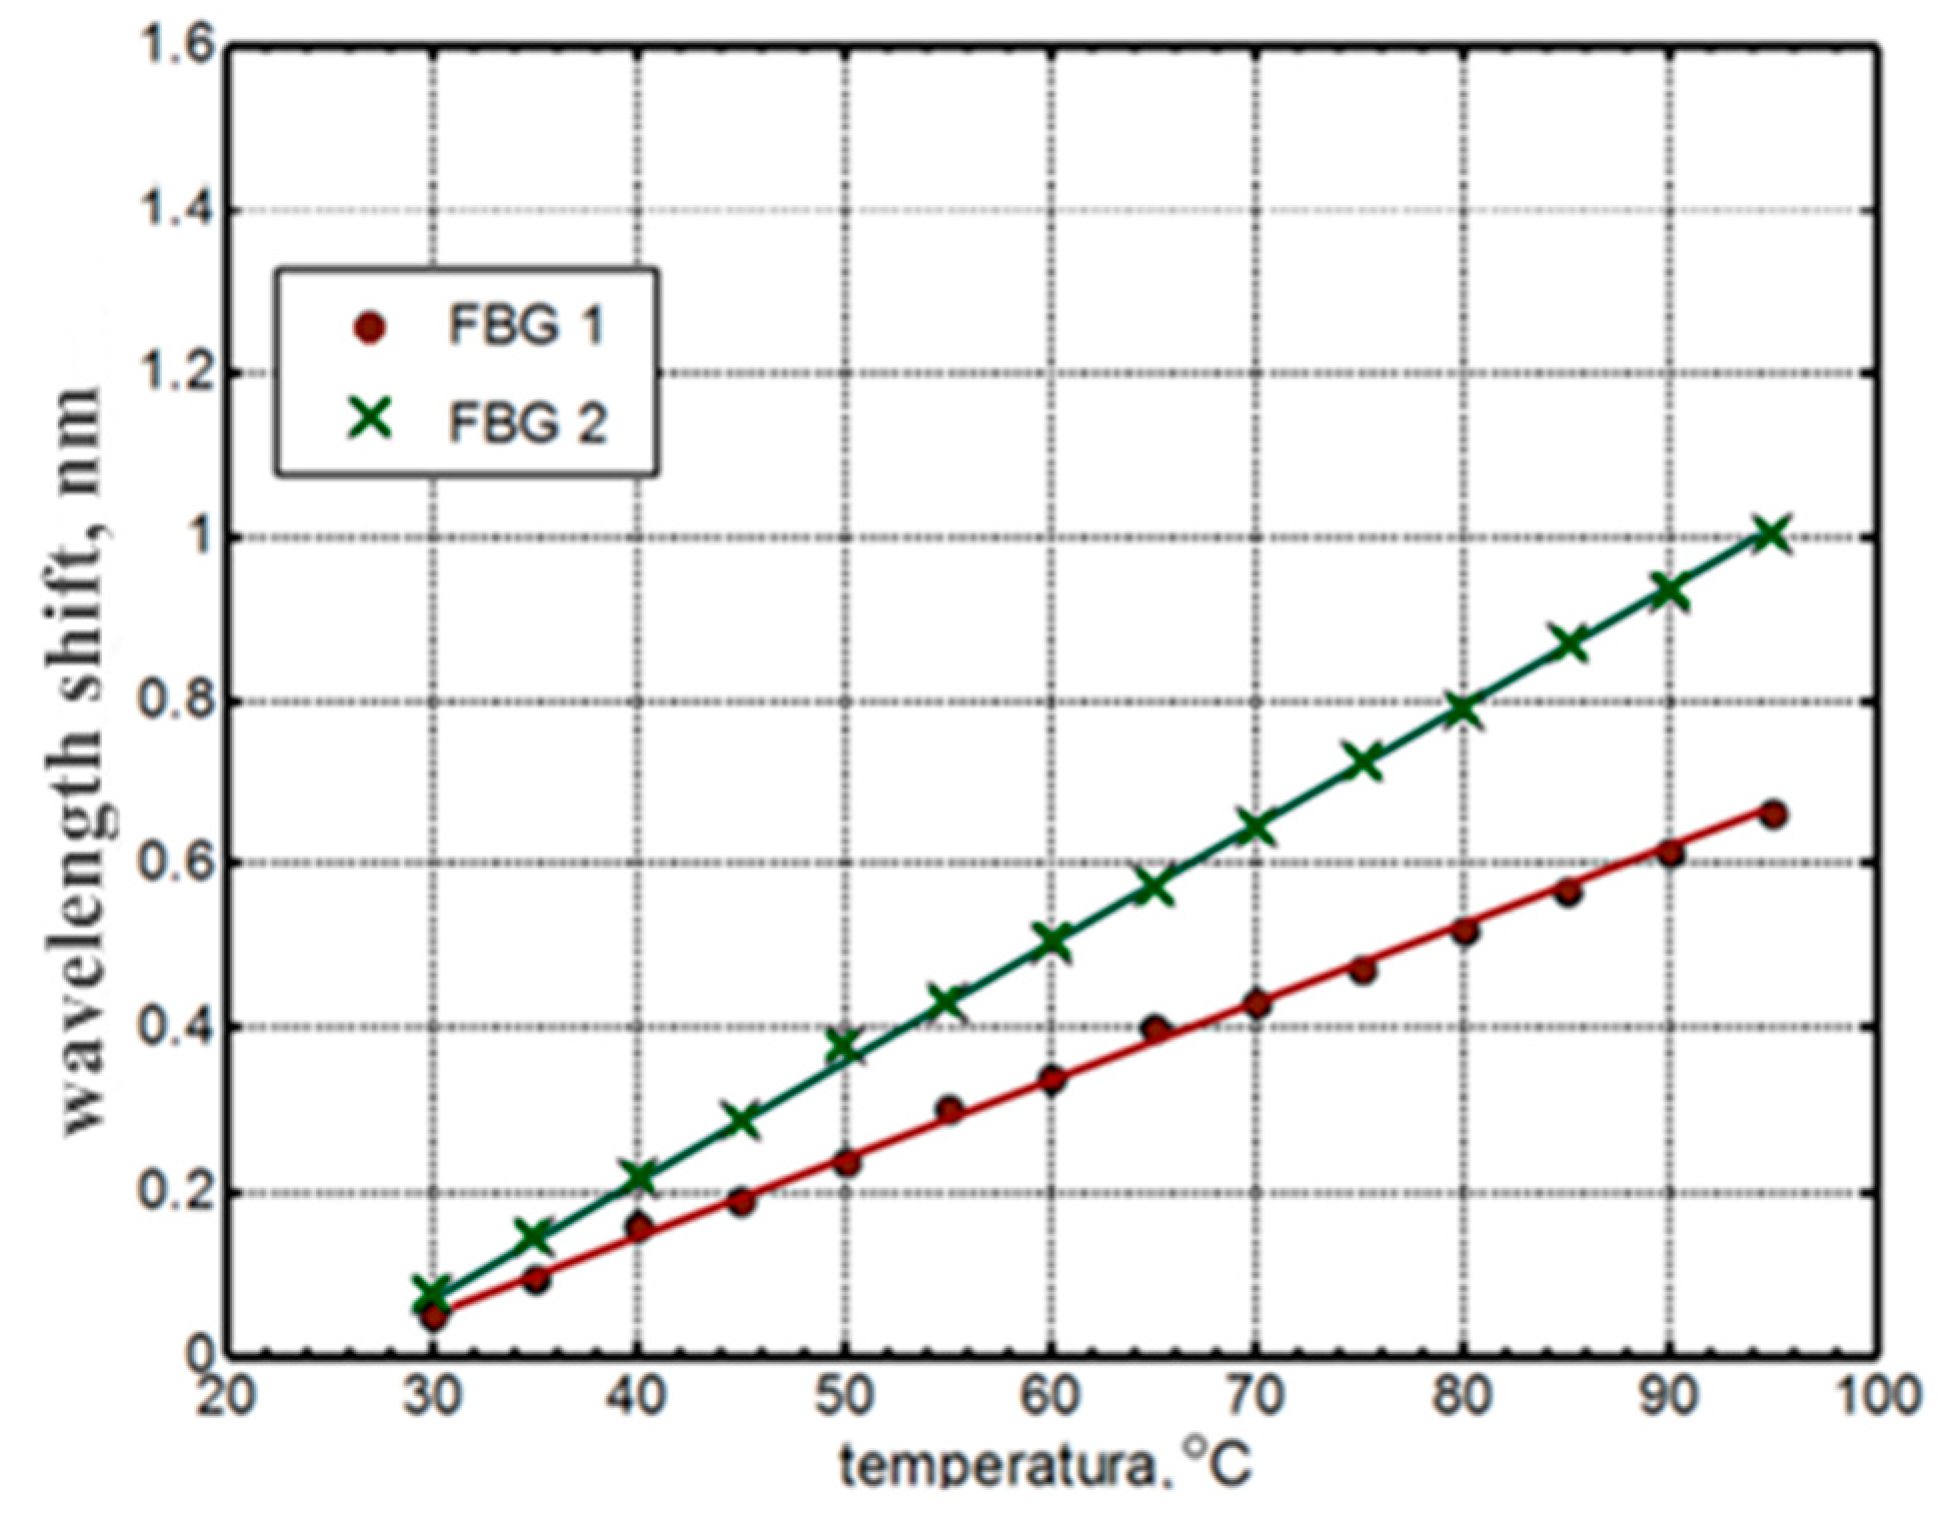
Figure 9.
Dependence of the Bragg wavelength λB on temperature.
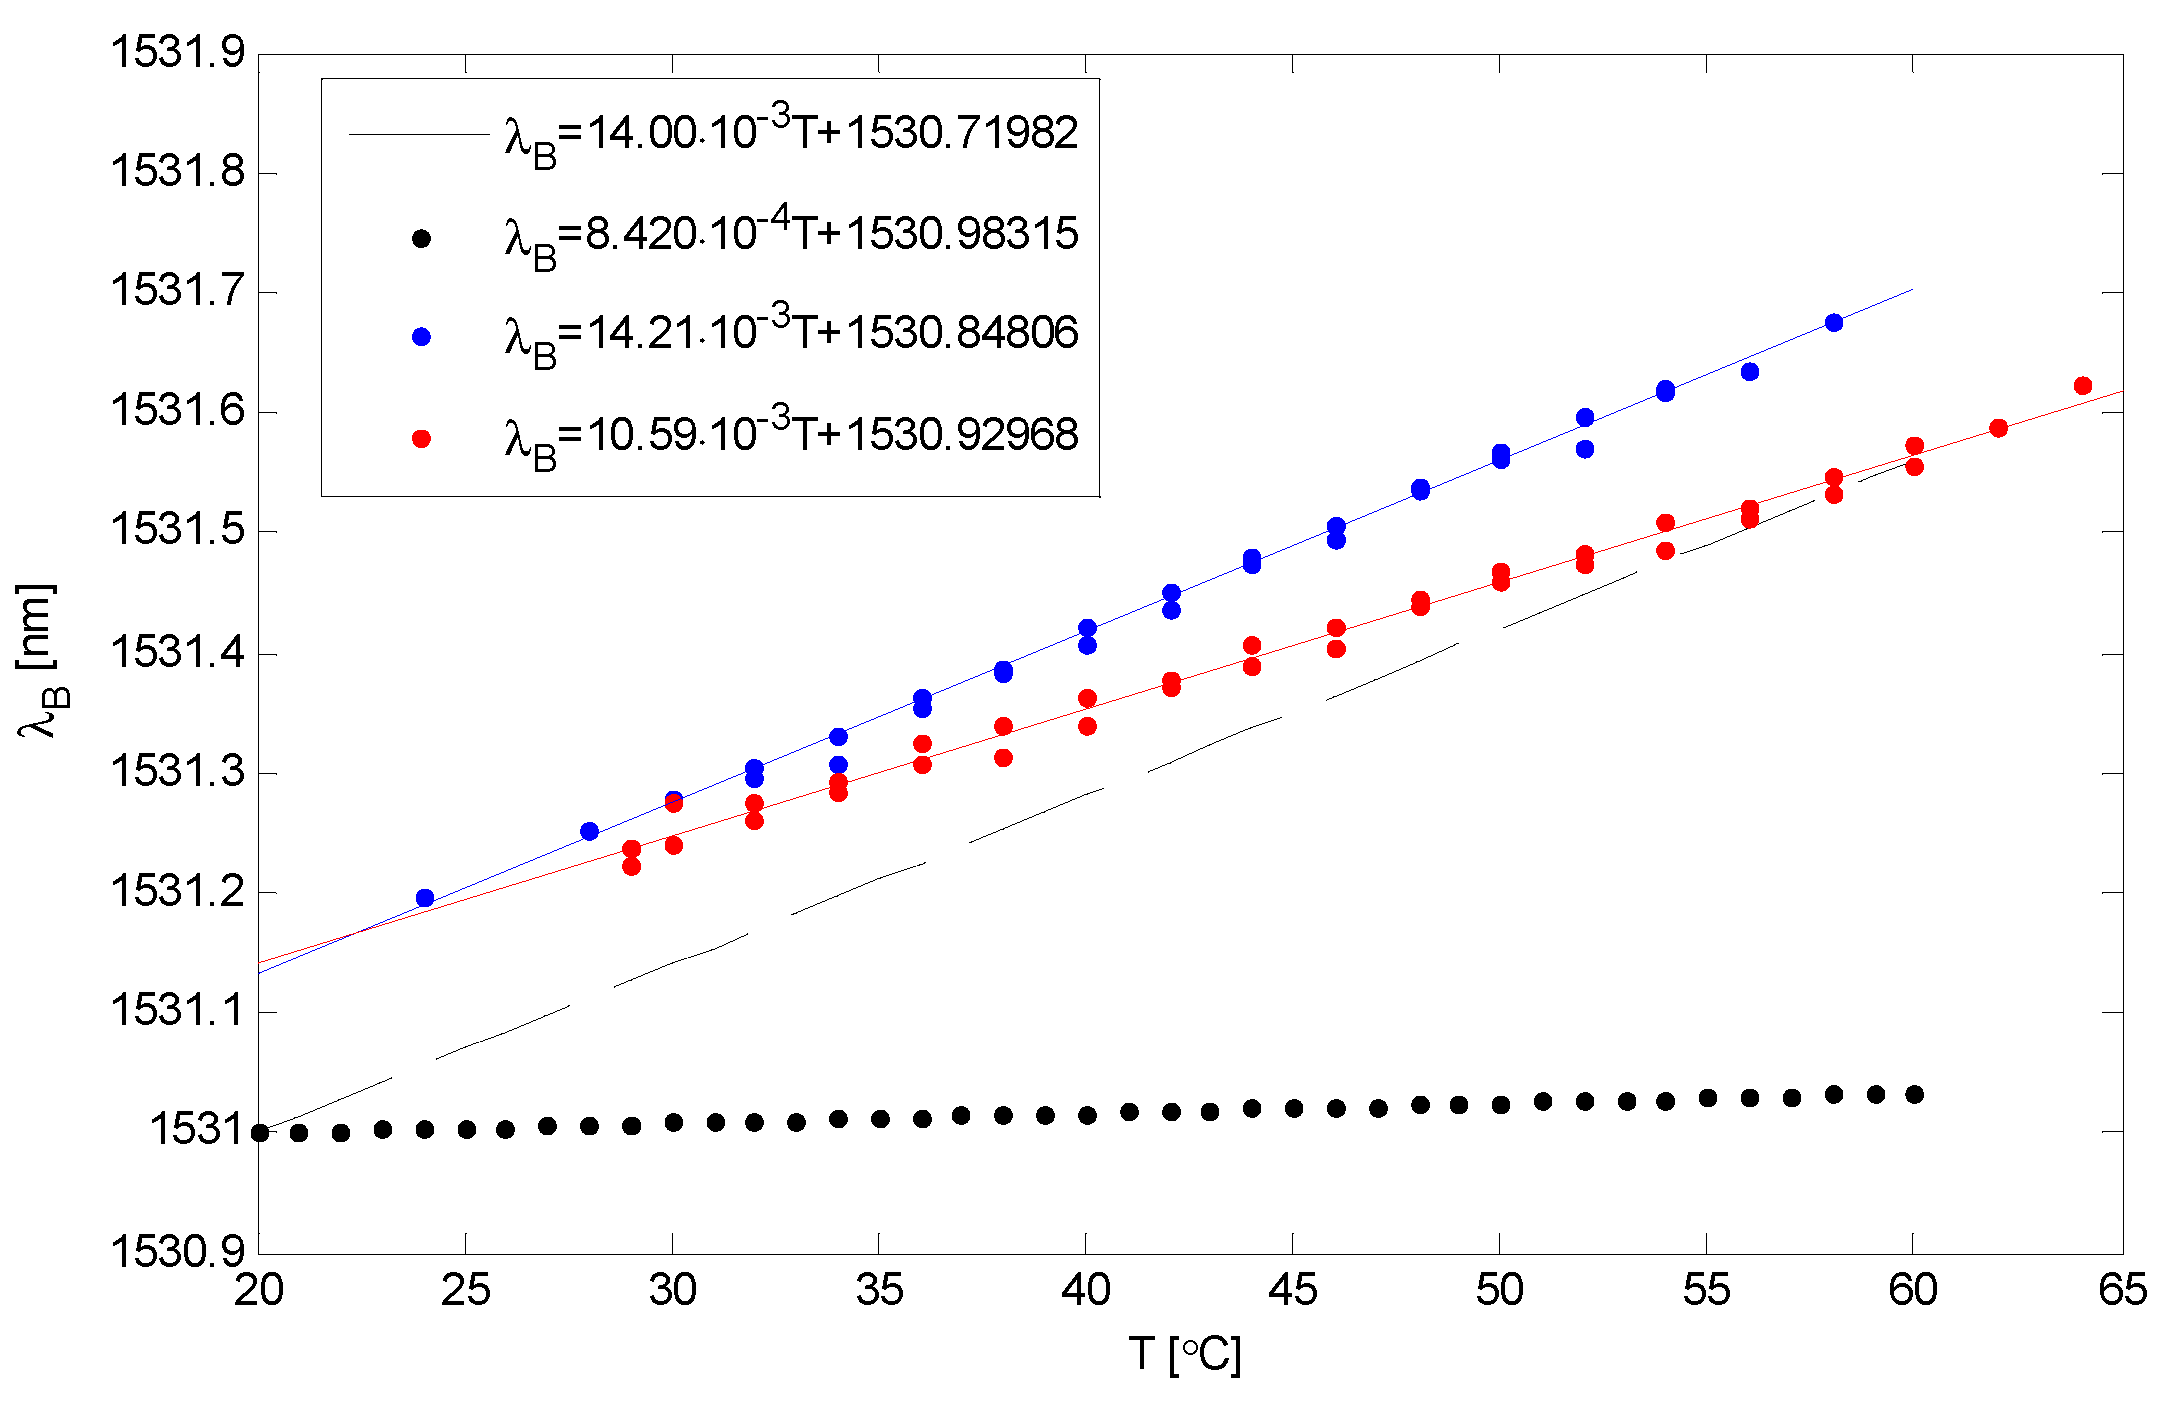
Figure 10.
Dependence of λB = 1554.4 nm on temperature.
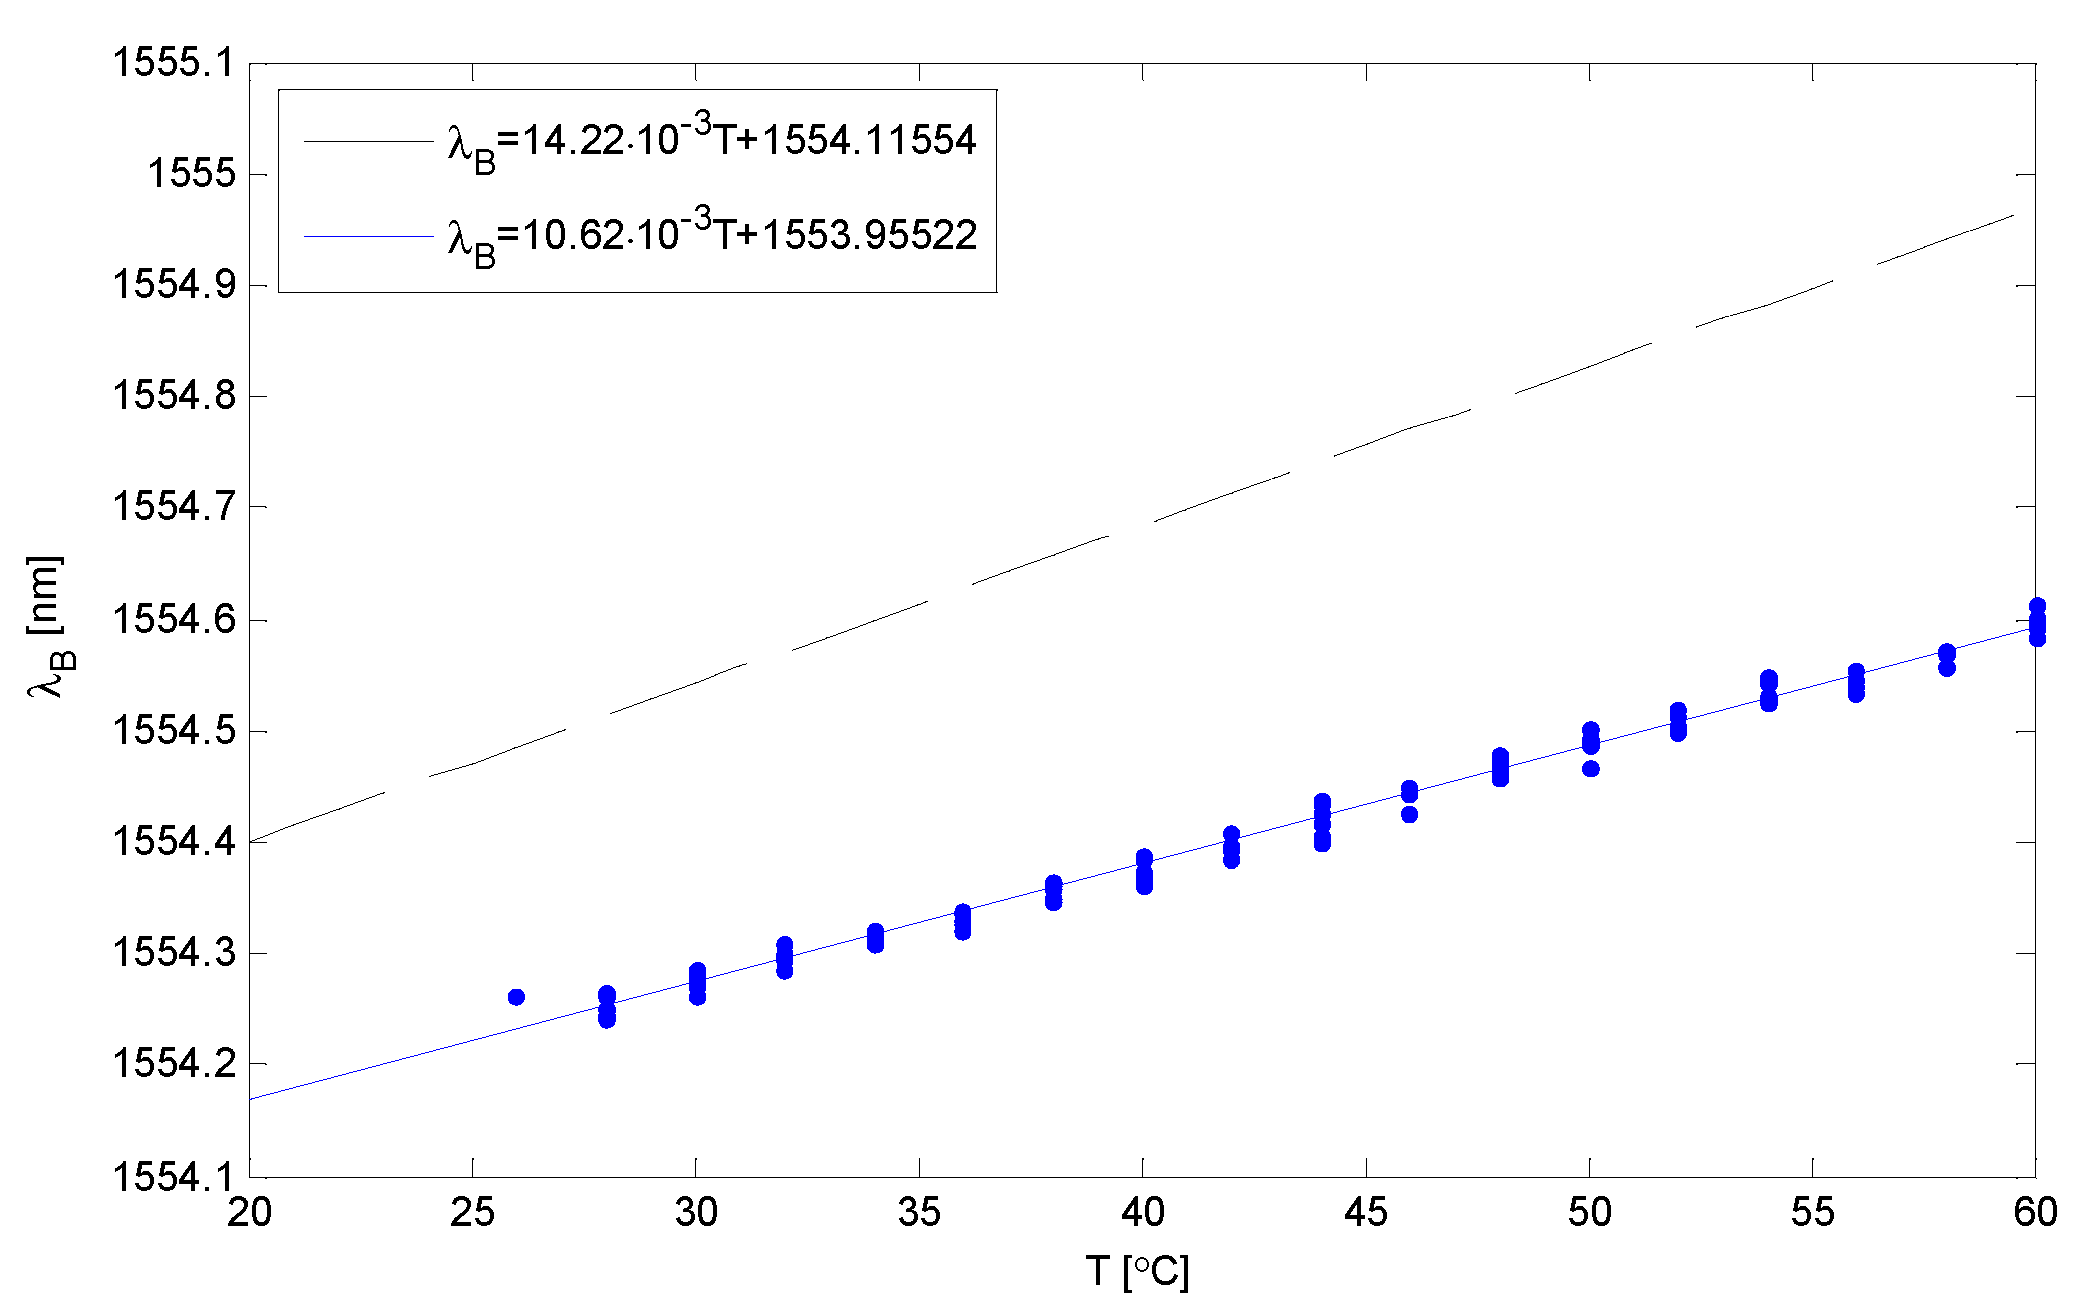
Figure 11.
Dependence of λB = 1566.5 nm on temperature.
Disclaimer/Publisher’s Note: The statements, opinions and data contained in all publications are solely those of the individual author(s) and contributor(s) and not of MDPI and/or the editor(s). MDPI and/or the editor(s) disclaim responsibility for any injury to people or property resulting from any ideas, methods, instructions or products referred to in the content. |
© 2023 by the authors. Licensee MDPI, Basel, Switzerland. This article is an open access article distributed under the terms and conditions of the Creative Commons Attribution (CC BY) license (http://creativecommons.org/licenses/by/4.0/).
Copyright: This open access article is published under a Creative Commons CC BY 4.0 license, which permit the free download, distribution, and reuse, provided that the author and preprint are cited in any reuse.


