Submitted:
05 May 2023
Posted:
06 May 2023
You are already at the latest version
Abstract
Decades of research have indicated that that the hypothalamus is responsible for multiple aspects of appetitive behavior. However, recent neuroimaging studies have led researchers to believe that the cerebellum may also serve a function in the regulation of appetite and satiation. Here we aim to identify, through the use of transcranial magnetic stimulation, or TMS, whether the inhibition of the cerebellum influences appetite in healthy participants. We hypothesized that inhibitory TMS, delivered to the cerebellum, would cause the participants to have an increase in appetite, resulting in overeating and a reduction in satiation. It was found that inhibitory TMS delivered to the cerebellar region increased consumption of high fat and calorie foods. These data support the previous research suggesting a cerebellar role in appetite. We propose that this and related studies may eventuate in a new alternative treatment option for those struggling with obesity and various other genetic disorders that cause overeating.
Keywords:
Cerebellum
; Satiation
; Transcranial Magnetic Stimulation
; TMS
Introduction
Satiety plays a critical role as a mechanism that aids in regulating the amount of food we consume [1]. Satiety is conceptualized as how satisfied or ‘full’ one feels after eating, or how willing an organism is to terminate the consumption of food [2]. Satiation has evolved to prevent the overconsumption of food, thus preventing disruptions to homeostatic metabolic mechanisms [1]. As such, a lack of satiety signaling may result in discrepancies in an individuals’ food regulation [3].
Satiety is controlled by numerous neural appetite circuits [4]. The hypothalamus has been previously established as the control center for the body’s endocrine system, aiding in homeostasis, the release and inhibition of hormones that affect other organs of the body such as the pituitary, thyroid, adrenal glands, and reproductive organs, as well as supporting the processing of associative and non-associative memories [5,6]. In addition, the hypothalamus induces, as well as reduces, satiation in the body [5]. The hypothalamus has paraventricular hypothalamus neurons (PVH), which facilitate regulating energy balance [7]. The PVH contains melanocortin-4-receptor-expressing neurons, which also play an important role in regulating satiety [8,9,10].
A key peptide in the regulation of food intake is leptin [4,11]. Leptin is synthesized, at least in part, via the obese (ob) gene and it is secreted from the fat cells found in adipose tissue [12]. After Leptin is secreted, it binds and activates the LEP-R receptor, which regulates body mass through a negative feedback mechanism [12,13]. The long leptin receptor, LRb, is highly expressed in both the hypothalamus and brainstem, the brain areas that control feeding [14]. Leptin decreases feelings of hunger in the body by binding to AgRP/NPY neurons and inhibiting the release of agouti-related peptides (AgRP), whereas Ghrelin has the opposite effect [15]. Ghrelin is a peptide hormone that is mainly produced in the stomach, that can bind to receptors found on agouti-related peptides (AgRP) and neuropeptide y (NPY) [16]. Therefore, Ghrelin increases food intake, as well as body weight gain by binding to AgRP/NPY neurons and releasing AgRP [15,17,18]. The two hormones are antagonistic and maintain a balance in the body to properly induce and reduce satiety at the appropriate times [19].
Neuropeptide AgRP is found primarily in the adrenal gland, subthalamic nucleus, and hypothalamus [20]. In the Paraventricular Hypothalamus, these AgRP neurons are responsible for the inhibition of oxytocin neurons, a behavior necessary to invoke feelings of hunger [21]. People born with Prader-Willi Syndrome (PWS), a genetic disorder characterized by low bone density, hypothyroidism, hypotonia, obesity, and excessive eating, were found to have higher levels of Ghrelin than those unaffected by PWS [22,23]. In addition to higher rates of Ghrelin, those with paternally inherited PWS (approximately 70% of cases) have a deletion of SNORD 116, a genetic cluster responsible for the adequate production of Pro Convertase 1 (PC1) [24,25]. Hormones such as NPY, oxytocin, brain-derived neurotrophic factors (BDNF), and AgRP, are processed by the enzyme PC1, which is found at very low levels in those with PWS [24]. This deficiency of PC1 serves as a potential explanation regarding the dysfunctional eating habits and other symptoms shown by those with PWS [26].
Establishing a connection between the cerebellum and satiety could potentially yield positive clinical, economic, and scientific solutions to combat obesity worldwide [27]. Low et al. (2021) suggested that there is indeed a link between satiation and the cerebellum [28]. While surprising, it is noted that the cerebellum is typically known to regulate motor function, coordination, neurocognitive development, language function, cognition, and balance [29,30]. The cerebellum is joined by the vermis and sub-divided into 3 parts: the anterior, posterior, and flocculondular lobes [31]. The anterior lobe contains the paravermis and parts of the vermis, which runs along the middle of the cerebellum and is responsible for coordinating the movements of the shoulders, neck, abdomen, thorax, and hips, in addition to maintaining muscle tone [31,32]. The posterior lobe is responsible for eye movement and gaze fixation, as well as the assessment and planning of consecutive movements throughout the entire body [31,33]. The flocculonodular lobe also aids in controlling eye movement, and regulates smooth eye pursuit and reflexive eye movements [34]. Damage to the cerebellum can cause cerebellar ataxia, or a loss of certain motor controls that may lead to disruptions in verbal working memory, perception of speech, grammar, loss of vision, loss of hearing, tremors, etc. [35,36].
Low et al. (2021) employed a reverse-translational to characterize the neural ensemble responsible that promotes satiation [28]. The results demonstrated that the task-based functional magnetic resonance (fMRI) had differences in cerebellar response in participants with the disorder that is characterized by insatiable appetite, or Prader-Willi Syndrome [28]. To further test this response, the researchers selectively activated anterior deep cerebellar nuclei and found that this activation substantially decreased the food intake [28].
We therefore applied TMS to the Cerebellum in an Inhibitory (1Hz) manner. Two control conditions were additionally examined (Parietal TMS and Sham TMS). Satiation was measured through both self-report as well as actually eating of food. If the recent reports were accurate, we predicted that 1Hz TMS applied to the Cerebellum should result in a decrease in satiation and an increase in actual consumption.
Methods
Participants were recruited as per local IRB guidelines via social media, email, flyers, and by word of mouth (IRB-FY21-22-2539). A total of 12 participants were chosen to participate in the study. Participants that were recruited ranged from ages 18 to 65 of age, passed an initial safety screening questionnaire, and had no food allergies or dietary restrictions. Each participant selected was only required to attend one session, lasting approximately one and a half hours. The participants were asked to fast for at least 12 hours prior to the experiment. To better ensure that the participants had fasted, the sessions were only scheduled in the morning, ranging from an 8 am start time, to an 11 am start time. In addition to fasting, participants were asked not to exercise any more or less than they usually do [37,38].
Prior to the participants arrival, choices of various snacks were weighed in grams. Each bowl was slightly overfilled. The snack selection included Cheez-Itz, salted pretzels, cheese puffs, donuts, cookies, Oreo cookies, popcorn, chips, and crackers. Upon arrival, participants were asked to complete an informed consent form. Following its completion, each participant was taken to receive their first round of TMS stimulation. A Magstim 200 Rapid pulse 1.5T was employed for all stimulation. Motor Threshold via Motor Evoked Potentials (MEPs) was first established for each participant. The MEP was the minimal amount of stimulation output needed to induce a motor evoked response [39] in 5 out of 10 trials.
Participants received 300 pulses of 1Hz (90% MT) TMS stimulation to PZ, ; CBz, and Sham (90 degrees oriented on CZ) [40]. The parietal and sham stimulation as a control region, while the CBz stimulation was chosen to target and disrupt cerebellar activity (Figure 1). Each participant therefore received 900 TMS pulses in total (plus MT measurement). was delivered in a random order (Figure 1).
Following completion of the first round of TMS, the participants were brought into the snack room. They were asked to fill out a satiety index subscale derived from a satiety score card, a visual analogue scale, a satiety labeled intensity magnitude scale, an unlabeled visual hunger/fullness category scale, and a “Teddy the Bear” hunger and satiety scale rating [41,42,43]. Subscale A asked the participants to rate their hunger on a scale of 1 to 10 from “very hungry” to “not hungry at all.” The following subscale, subscale B, asked the participants to draw a dash on a line starting from “extremely hungry” to “not at all hungry.” Subscale C asked the participants to circle one of the dashes, ranging from “greatest imaginable hunger” to “greatest imaginable fullness.” Subscale D showed a visual representation of 5 figures, each with varying amounts of food in their stomach, ranging from “not full at all” to “extremely full.” Lastly, subscale E also had 5 visuals asking the participants to choose which “Teddy” they felt like most, ranging from extremely hungry to extremely full.
Following completion of the satiety survey, the participants were asked to put on gloves prior to handling the food. They were then instructed to “eat as much as they wanted”, or “until they felt full”. The participants were then timed for 5 minutes. Once the time had elapsed, they were instructed to stop eating and to return to the TMS room. The researchers then weighed the mass of each type of snack. After the data from the session were recorded, the participants began the second round of TMS. The same procedure was repeated for all 3 TMS sessions. Total testing time was about 50 minutes including debriefing.
Results
We first examined actual consumption separately from self-reported satiation. We then examined the correlation between the two. The total weight of food consumed following Sham TMS (M=44.58, SD = 17.29), Parietal TMS (M=41.75, SD = 17.73), and Cerebellar TMS (M=67.08, SD = 43.87) was found to trend for significance utilizing a Repeated Measures ANOVA (F(2,22)=3.16,p=.06). Post-hoc Analysis revealed the only trend of significance was between Sham TMS and Cerebellar TMS (p=.06). Sham TMS compared to Parietal TMS (p=.63) and Parietal TMS compared to Cerebellar TMS (p=.11) was not significant (see Figure 2).
A finer grain analysis was then performed on nutritional aspects. Examining calories, it was found that the calories consumed across all three brain conditions were significantly different (F (2,22)=3.94, p=.03). Sham TMS (M= 223.29, SD= 88.26) differed significantly from Cerebellar TMS (M= 341.75, SD = 224.23). Sham TMS did not differ from Parietal TMS (M=237.23, SD = 93.62; p=.59). There was a trend (p=.07) for increased caloric consumption following Cerebellar TMS compared to Parietal TMS. These data indicate participants consumed greater calories following inhibition of the cerebellum compared to the other conditions (see Figure 3).
We then examined the fat content consumed across all three brain conditions, which demonstrated a difference (F (2,22)=5.0, p=.05). Sham TMS (M=11.68, SD =5.06) differed significantly from Cerebellar TMS (M=20.68, SD =16.13). There was also a trend for significance between Parietal TMS (M=12.91, SD= 5.48) and Cerebellar TMS (p=.09). There was no difference when Sham TMS and Parietal TMS were compared (p=.46).
There were no significant differences or trends for significance in terms of Protein consumption (F(2,22)=1.34,p=.28). Sham TMS (M=2.70, SD = 1.17) did not differ from Parietal TMS (M=2.61, SD =.96; p=.81) or Cerebellar TMS (p=.19). Cerebellar and Parietal TMS did not differ (p=.14). In terms of Carbohydrates, there was an overall trend for significance (). Both Sham TMS (M=28.03, SD= 11.55; p=.10) and Parietal TMS (M=28.94, SD=12.18; p=.08) trended to be significantly different from Cerebellar TMS (M=37.71, SD= 21.48). Sham TMS and Parietal TMS did not differ significantly from each other (p=.80).
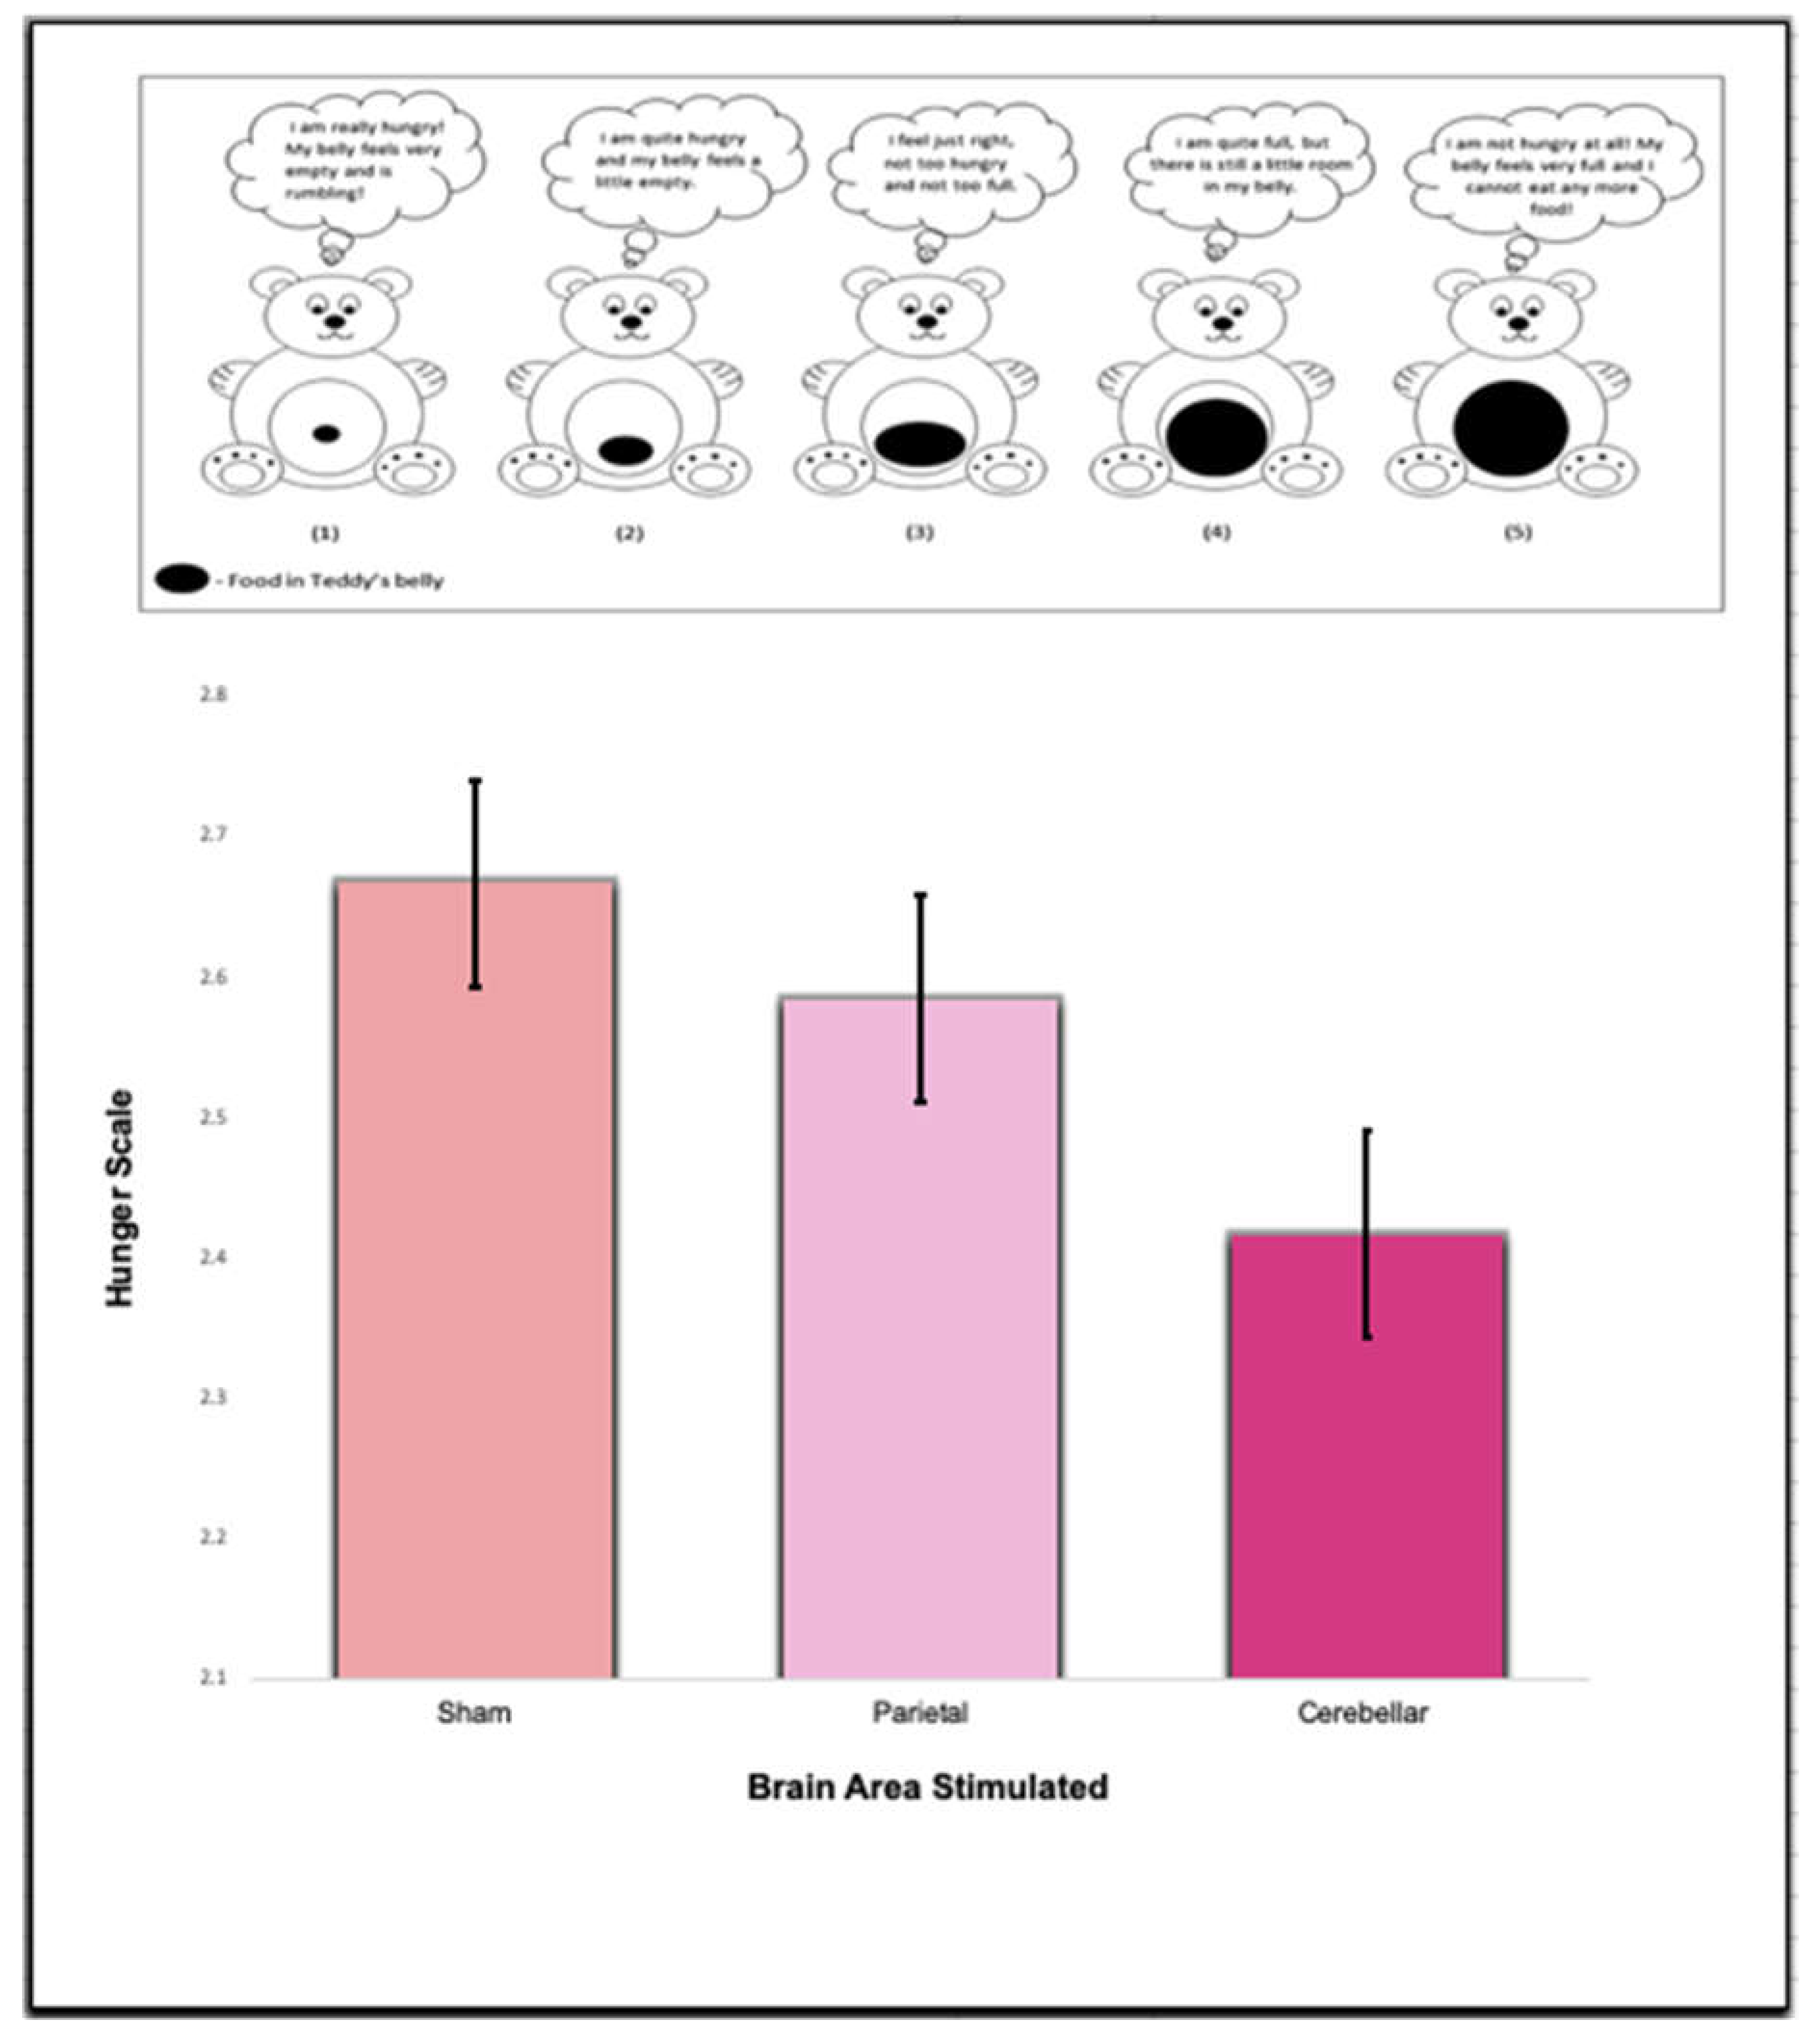
Interestingly, there was no difference or trends in the self-reported satiety scales. Using One-way Repeated ANOVAs no significance was found for Scale A (F (2,22)=.97, p=.40), Scale B (F (2,22)=.48, p=.63), Scale C (F (2,22)=.41, p=.67), Scale D (F (2,22)=.22, p= .80), and Scale E (F (2,22)=.18, p=.84). These data indicate that TMS did not influence self-reported hunger (see Figure 4, Figure 5, Figure 6, Figure 7 and Figure 8).
Because of the difference between actual consumption and self-reported hunger, we performed a simple correlation between the weights of food eaten and the scales. For Sham TMS, the only significant/trend (p=.055) was Subscale C and weight of food consumed (r(11)=-57). This indicated increased hunger correlated with the amount eaten, but only one on subscale (following Sham TMS). The same pattern was observed following Cerebellar TMS. Only Subscale C had a trend for significance (r(11)=.52, p=.09). However, following Parietal TMS, the amount eaten did not correlate with any of the satiety scales (p’s>.05).
Discussion
The question of the cerebellum’s role in satiety remains unknown. Recent research has indicated that the cerebellum plays a major role in satiation across a number of organisms [28]. In the current study, we found that inhibition of the cerebellum lead to decreased satiation as indicated by increased consumption. Inhibition of parietal regions had no such effect on consumption. These data support the previous findings that the cerebellum is, in fact, involved in satiation. Inhibition had no impact on self-reported satiation, and therefore led to a disconnection between intake and self-reported satiation.
Specifically, inhibition of the cerebellum had its greatest effect on high calorie, high fat foods. These results are contrary to the study conducted by Low et al. (2021), as the study found that in the lateral nucleus of mice, the DCN neurons were activated by food consumption, regardless of food nutritional content. The discrepancy between the data can be potentially attributed to difference in cerebellar function relating to satiety in mice versus humans [44]. While the mouse model has been widely used in neuroscience research, recent studies demonstrate that while certain regions of the mouse and human brain are extremely conserved, major differences including those in the cerebellum exist [45]. The difference in cerebellar stimulation resulting in greater consumption of high fat and high calorie content in humans could therefore potentially be a result of either neural differences between the species or other physiological factors, such as blood sugar [46].
A recent study found that in humans, there is approximately a three hour period of glucose absorption, along with suppression of endogenous glucose production and lipolysis [46]. However, in mice, it was found that the mice experience little to no suppression of endogenous glucose production and experience a rise in the levels of EGP [46,47]. In future studies, evaluating factors such as methodology, gender, hormones, or even overall diet, can provide further insight into the external factors that affect the complex neural ensemble of satiety. [48,49].
As for the self-reported satiation data, higher average hunger scores reported on the satiety index scales equated to feelings of satiety, while lower scores were correlated with feelings of hunger. There was no correlation between reported feelings of satiety in comparison to the actual amount of food the participants consumed. Bias likely played a role here in terms of wanting to under-report one’s desire to consume [50]. A disconnect between self-reported eating and consumption at an individual level is known in the literature and we believe that was likely occurring here [51,52].
Transcranial Magnetic Stimulation is employed both clinically and experimentally [39]. In clinical settings, TMS is primarily used for targeting anxiety and depression [53,54]. However, in the study, stimulating and activating the anterior deep cerebellar nuclei was found to decrease food intake, thus TMS can potentially be utilized as a therapy for patients who have issues with overeating [55]. From a clinical standpoint, if TMS applied to the cerebellum does indeed target satiety, TMS therapy could be used for patients with obesity and other disorders that affect the internal homeostasis which influences appetite [56]. This type of therapy could potentially provide a less invasive treatment option for patients who are severely overweight, in comparison to the gastric bypass surgery, which can pose a high risk for post-operative complications and issues [57,58]. It is important to note that the TMS procedural approach would be a more cost-effective option, as it is about $300 per session [59]. This is a drastic difference from gastric bypass surgery, which can cost anywhere from about $7,000 to $33,000 [60].
Future studies should examine the role of excitation via brain stimulation in satiation. For example, we predict that 10Hz (or higher) TMS would delivered to the cerebellum would decrease eating as satiation would increase. It would be of interest to see if the same profile (high carb eating vs proteins) would emerge. Further studies should examine larger samples as well, though here our study was based on previous findings and we felt confident in our replication of the cerebellums role in satiation.
Overall, the study established a connection between satiety and the cerebellum through the use of inhibitory transcranial magnetic stimulation to the Cerebellar region. Future studies should further examine the extent and duration of this effect. Identifying the precise mechanisms involved in this cerebellar satiety network could lead to promising new treatments for patients struggling with obesity and reform the way people view the cerebellum.
References
- Mandalari, G. Symposium ‘understanding and managing satiety: processes and opportunities’. J Nutr Sci 2020, 9, e42. [Google Scholar] [CrossRef]
- Njike, V.Y.; et al. Snack Food, Satiety, and Weight. Adv Nutr 2016, 7, 866–878. [Google Scholar] [CrossRef]
- Augustine, V.; Lee, S.; Oka, Y. Neural Control and Modulation of Thirst, Sodium Appetite, and Hunger. Cell 2020, 180, 25–32. [Google Scholar] [CrossRef]
- Xu, J.; et al. Genetic identification of leptin neural circuits in energy and glucose homeostases. Nature 2018, 556, 505–509. [Google Scholar] [CrossRef]
- Shahid, Z.; Asuka, E.; Singh, G. Physiology, Hypothalamus. In StatPearls; StatPearls Publishing Copyright © 2022; StatPearls Publishing LLC.: Treasure Island (FL), 2022. [Google Scholar]
- Burdakov, D.; Peleg-Raibstein, D. The hypothalamus as a primary coordinator of memory updating. Physiol Behav 2020, 223, 112988. [Google Scholar] [CrossRef]
- Hill, J.W. PVN pathways controlling energy homeostasis. Indian J Endocrinol Metab 2012, 16 (Suppl 3), S627–S636. [Google Scholar] [CrossRef]
- Bai, L.; et al. Genetic Identification of Vagal Sensory Neurons That Control Feeding. Cell 2019, 179, 1129–1143.e23. [Google Scholar] [CrossRef]
- Li, M.M.; et al. The Paraventricular Hypothalamus Regulates Satiety and Prevents Obesity via Two Genetically Distinct Circuits. Neuron 2019, 102, 653–667.e6. [Google Scholar] [CrossRef]
- Zhang, J.; et al. An excitatory ventromedial hypothalamus to paraventricular thalamus circuit that suppresses food intake. Nat Commun 2020, 11, 6326. [Google Scholar] [CrossRef]
- Yeung, A.Y.; Tadi, P. Physiology, Obesity Neurohormonal Appetite And Satiety Control. In StatPearls; StatPearls Publishing Copyright © 2022; StatPearls Publishing LLC.: Treasure Island (FL), 2022. [Google Scholar]
- Obradovic, M.; et al. Leptin and Obesity: Role and Clinical Implication. Front Endocrinol (Lausanne) 2021, 12, 585887. [Google Scholar] [CrossRef]
- Jang, Y.; et al. Angiopoietin-Like Growth Factor Involved in Leptin Signaling in the Hypothalamus. Int J Mol Sci 2021, 22. [Google Scholar] [CrossRef]
- Ahima, R.S.; Antwi, D.A. Brain regulation of appetite and satiety. Endocrinol Metab Clin North Am 2008, 37, 811–823. [Google Scholar] [CrossRef]
- Nakazato, M.; et al. A role for ghrelin in the central regulation of feeding. Nature 2001, 409, 194–198. [Google Scholar] [CrossRef]
- Goto, M.; et al. Ghrelin increases neuropeptide Y and agouti-related peptide gene expression in the arcuate nucleus in rat hypothalamic organotypic cultures. Endocrinology 2006, 147, 5102–5109. [Google Scholar] [CrossRef]
- Mizuno, T.M.; Makimura, H.; Mobbs, C.V. The physiological function of the agouti-related peptide gene: the control of weight and metabolic rate. Ann Med 2003, 35, 425–433. [Google Scholar] [CrossRef]
- Lv, Y.; et al. Ghrelin, a gastrointestinal hormone, regulates energy balance and lipid metabolism. Biosci Rep 2018, 38. [Google Scholar] [CrossRef]
- Seoane-Collazo, P.; et al. Incendiary Leptin. Nutrients 2020, 12. [Google Scholar] [CrossRef]
- Enriori, P.J.; et al. Diet-induced obesity causes severe but reversible leptin resistance in arcuate melanocortin neurons. Cell Metab 2007, 5, 181–194. [Google Scholar] [CrossRef]
- Atasoy, D.; et al. Deconstruction of a neural circuit for hunger. Nature 2012, 488, 172–177. [Google Scholar] [CrossRef]
- Feigerlova, E.; et al. Hyperghrelinemia precedes obesity in Prader-Willi syndrome. J Clin Endocrinol Metab 2008, 93, 2800–2805. [Google Scholar] [CrossRef]
- Gumus Balikcioglu, P.; et al. Macronutrient Regulation of Ghrelin and Peptide YY in Pediatric Obesity and Prader-Willi Syndrome. J Clin Endocrinol Metab 2015, 100, 3822–3831. [Google Scholar] [CrossRef]
- Alves, C.; Franco, R.R. Prader-Willi syndrome: endocrine manifestations and management. Arch Endocrinol Metab 2020, 64, 223–234. [Google Scholar] [CrossRef]
- Angulo, M.A.; Butler, M.G.; Cataletto, M.E. Prader-Willi syndrome: a review of clinical, genetic, and endocrine findings. J Endocrinol Invest 2015, 38, 1249–1263. [Google Scholar] [CrossRef]
- Burnett, L.C.; et al. Deficiency in prohormone convertase PC1 impairs prohormone processing in Prader-Willi syndrome. J Clin Invest 2017, 127, 293–305. [Google Scholar] [CrossRef]
- Marron, E.M.; et al. Prefronto-cerebellar neuromodulation affects appetite in obesity. Int J Obes (Lond) 2019, 43, 2119–2124. [Google Scholar] [CrossRef]
- Low, A.Y.T.; et al. Reverse-translational identification of a cerebellar satiation network. Nature 2021, 600, 269–273. [Google Scholar] [CrossRef] [PubMed]
- Koziol, L.F.; et al. Consensus paper: the cerebellum’s role in movement and cognition. Cerebellum 2014, 13, 151–177. [Google Scholar] [CrossRef]
- Maldonado, K.A.; Alsayouri, K. Physiology, Brain. In StatPearls; StatPearls Publishing Copyright © 2022; StatPearls Publishing LLC.: Treasure Island (FL), 2022. [Google Scholar]
- Jimsheleishvili, S.; Dididze, M. Neuroanatomy, Cerebellum. In StatPearls; Treasure Island (FL), 2022. [Google Scholar]
- Unverdi, M.; Alsayouri, K. Neuroanatomy, Cerebellar Dysfunction. In StatPearls; Treasure Island (FL), 2022. [Google Scholar]
- Manto, M.; et al. Consensus paper: roles of the cerebellum in motor control--the diversity of ideas on cerebellar involvement in movement. Cerebellum 2012, 11, 457–487. [Google Scholar] [CrossRef]
- Yoo, H.; Mihaila, D.M. Neuroanatomy, Vestibular Pathways. In StatPearls; Treasure Island (FL), 2022. [Google Scholar]
- Guell, X.; Hoche, F.; Schmahmann, J.D. Metalinguistic deficits in patients with cerebellar dysfunction: empirical support for the dysmetria of thought theory. Cerebellum 2015, 14, 50–58. [Google Scholar] [CrossRef] [PubMed]
- Perlman, S.L. , Cerebellar Ataxia. Curr Treat Options Neurol 2000, 2, 215–224. [Google Scholar] [CrossRef]
- Dorling, J.; et al. Acute and Chronic Effects of Exercise on Appetite, Energy Intake, and Appetite-Related Hormones: The Modulating Effect of Adiposity, Sex, and Habitual Physical Activity. Nutrients 2018, 10. [Google Scholar] [CrossRef] [PubMed]
- Hughes, D.C.; Ellefsen, S.; Baar, K. Adaptations to Endurance and Strength Training. Cold Spring Harb Perspect Med 2018, 8. [Google Scholar] [CrossRef] [PubMed]
- Chail, A.; et al. Transcranial magnetic stimulation: A review of its evolution and current applications. Ind Psychiatry J 2018, 27, 172–180. [Google Scholar] [PubMed]
- Todd, N.P.M.; Govender, S.; Colebatch, J.G. The human electrocerebellogram (ECeG) recorded non-invasively using scalp electrodes. Neurosci Lett 2018, 682, 124–131. [Google Scholar] [CrossRef] [PubMed]
- Forde, C. Measuring Satiation and Satiety Chapter Outline. 2017; 478. [Google Scholar]
- Solah, V.A.; et al. Effect of training on the reliability of satiety evaluation and use of trained panellists to determine the satiety effect of dietary fibre: a randomised controlled trial. PLoS One 2015, 10, e0126202. [Google Scholar] [CrossRef]
- Bennett, C.; Blissett, J. Measuring hunger and satiety in primary school children. Validation of a new picture rating scale. Appetite 2014, 78, 40–48. [Google Scholar]
- Beauchamp, A.; et al. Whole-brain comparison of rodent and human brains using spatial transcriptomics. Elife 2022, 11. [Google Scholar] [CrossRef]
- Loomba, S.; et al. Connectomic comparison of mouse and human cortex. Science 2022, 377, eabo0924. [Google Scholar] [CrossRef]
- Bruce, C.R.; et al. Translating glucose tolerance data from mice to humans: Insights from stable isotope labelled glucose tolerance tests. Mol Metab 2021, 53, 101281. [Google Scholar] [CrossRef]
- Pepper, A.R.; et al. Diabetic rats and mice are resistant to porcine and human insulin: flawed experimental models for testing islet xenografts. Xenotransplantation 2009, 16, 502–510. [Google Scholar] [CrossRef]
- Bédard, A.; et al. Gender Differences in the Appetite Response to a Satiating Diet. J Obes 2015, 2015, 140139. [Google Scholar] [CrossRef] [PubMed]
- Haase, L.; Green, E.; Murphy, C. Males and females show differential brain activation to taste when hungry and sated in gustatory and reward areas. Appetite 2011, 57, 421–434. [Google Scholar] [CrossRef] [PubMed]
- Mazor, K.M.; et al. A demonstration of the impact of response bias on the results of patient satisfaction surveys. Health Serv Res 2002, 37, 1403–1417. [Google Scholar] [CrossRef] [PubMed]
- Woodward, E.; et al. Comparison of Self-Reported Speed of Eating with an Objective Measure of Eating Rate. Nutrients 2020, 12. [Google Scholar] [CrossRef] [PubMed]
- Bartholome, L.T.; et al. A comparison of the accuracy of self-reported intake with measured intake of a laboratory overeating episode in overweight and obese women with and without binge eating disorder. Eur J Nutr 2013, 52, 193–202. [Google Scholar] [CrossRef] [PubMed]
- Sonmez, A.I.; et al. Accelerated TMS for Depression: A systematic review and meta-analysis. Psychiatry Res 2019, 273, 770–781. [Google Scholar] [CrossRef] [PubMed]
- Zengin, G.; et al. The Efficacy and Safety of Transcranial Magnetic Stimulation in Treatment-Resistant Bipolar Depression. Psychiatr Danub 2022, 34, 236–244. [Google Scholar] [CrossRef]
- Ferrulli, A.; et al. Deep transcranial magnetic stimulation in combination with skin thermography in obesity: a window on sympathetic nervous system. Acta Diabetol 2022, 59, 729–742. [Google Scholar] [CrossRef]
- Polidori, D.; et al. How Strongly Does Appetite Counter Weight Loss? Quantification of the Feedback Control of Human Energy Intake. Obesity (Silver Spring) 2016, 24, 2289–2295. [Google Scholar] [CrossRef]
- Andreasson, K.; Videhult, P. [Gastric bypass versus sleeve, pros and cons]. Lakartidningen 2017, 114. [Google Scholar]
- Schiavon, C.A.; et al. Effects of Bariatric Surgery in Obese Patients With Hypertension: The GATEWAY Randomized Trial (Gastric Bypass to Treat Obese Patients With Steady Hypertension). Circulation 2018, 137, 1132–1142. [Google Scholar] [CrossRef] [PubMed]
- Simpson, K.N.; et al. Cost-effectiveness of transcranial magnetic stimulation in the treatment of major depression: a health economics analysis. Adv Ther 2009, 26, 346–368. [Google Scholar] [CrossRef] [PubMed]
- Doble, B.; et al. What Are the Real Procedural Costs of Bariatric Surgery? A Systematic Literature Review of Published Cost Analyses. Obes Surg 2017, 27, 2179–2192. [Google Scholar] [PubMed]
Figure 1.
TMS was delivered to three sites at 1Hz, 90%MT for 300trains each. Site placement was based on the 10/20 system. PZ and CZ are standard sites. CBz is measured as 15% of the distance below OZ along the midline.
Figure 1.
TMS was delivered to three sites at 1Hz, 90%MT for 300trains each. Site placement was based on the 10/20 system. PZ and CZ are standard sites. CBz is measured as 15% of the distance below OZ along the midline.
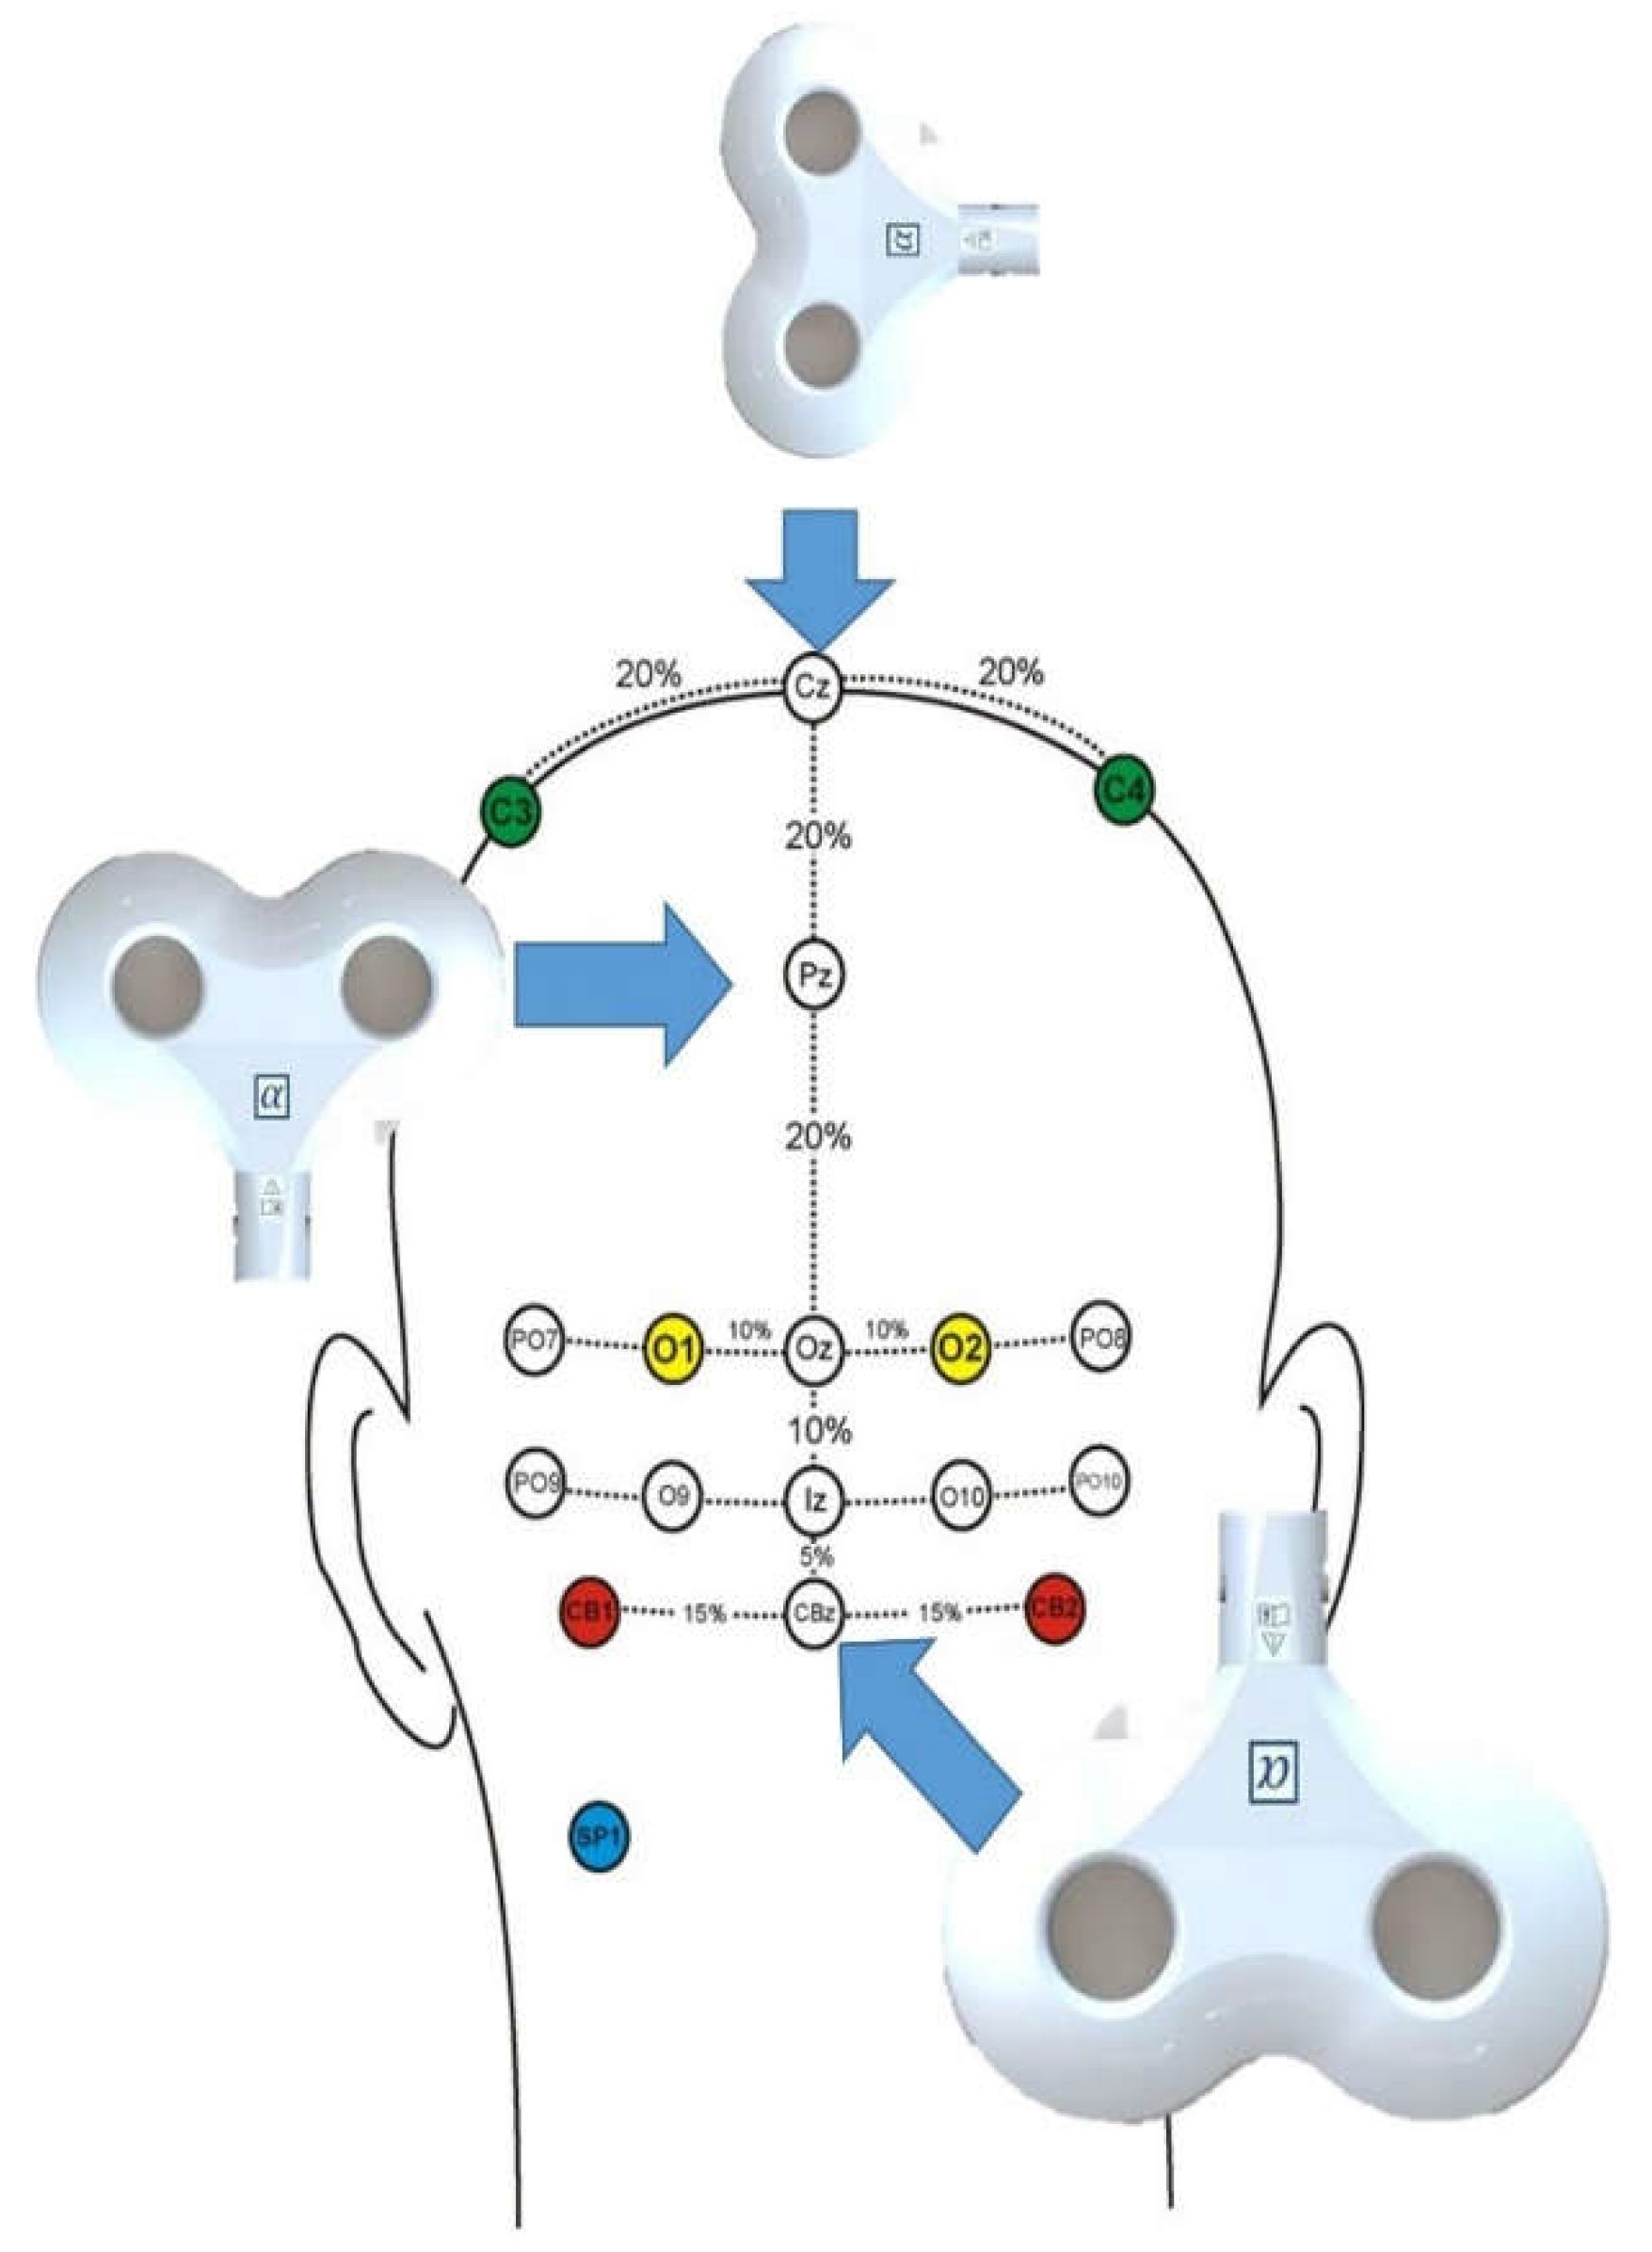
Figure 2.
The average food consumed, in grams, during the Sham, Parietal, and Cerebellar TMS trials.
Figure 2.
The average food consumed, in grams, during the Sham, Parietal, and Cerebellar TMS trials.

Figure 3.
Per brain area stimulated, the total number of proteins, carbohydrates, calories, and fats were calculated.
Figure 3.
Per brain area stimulated, the total number of proteins, carbohydrates, calories, and fats were calculated.
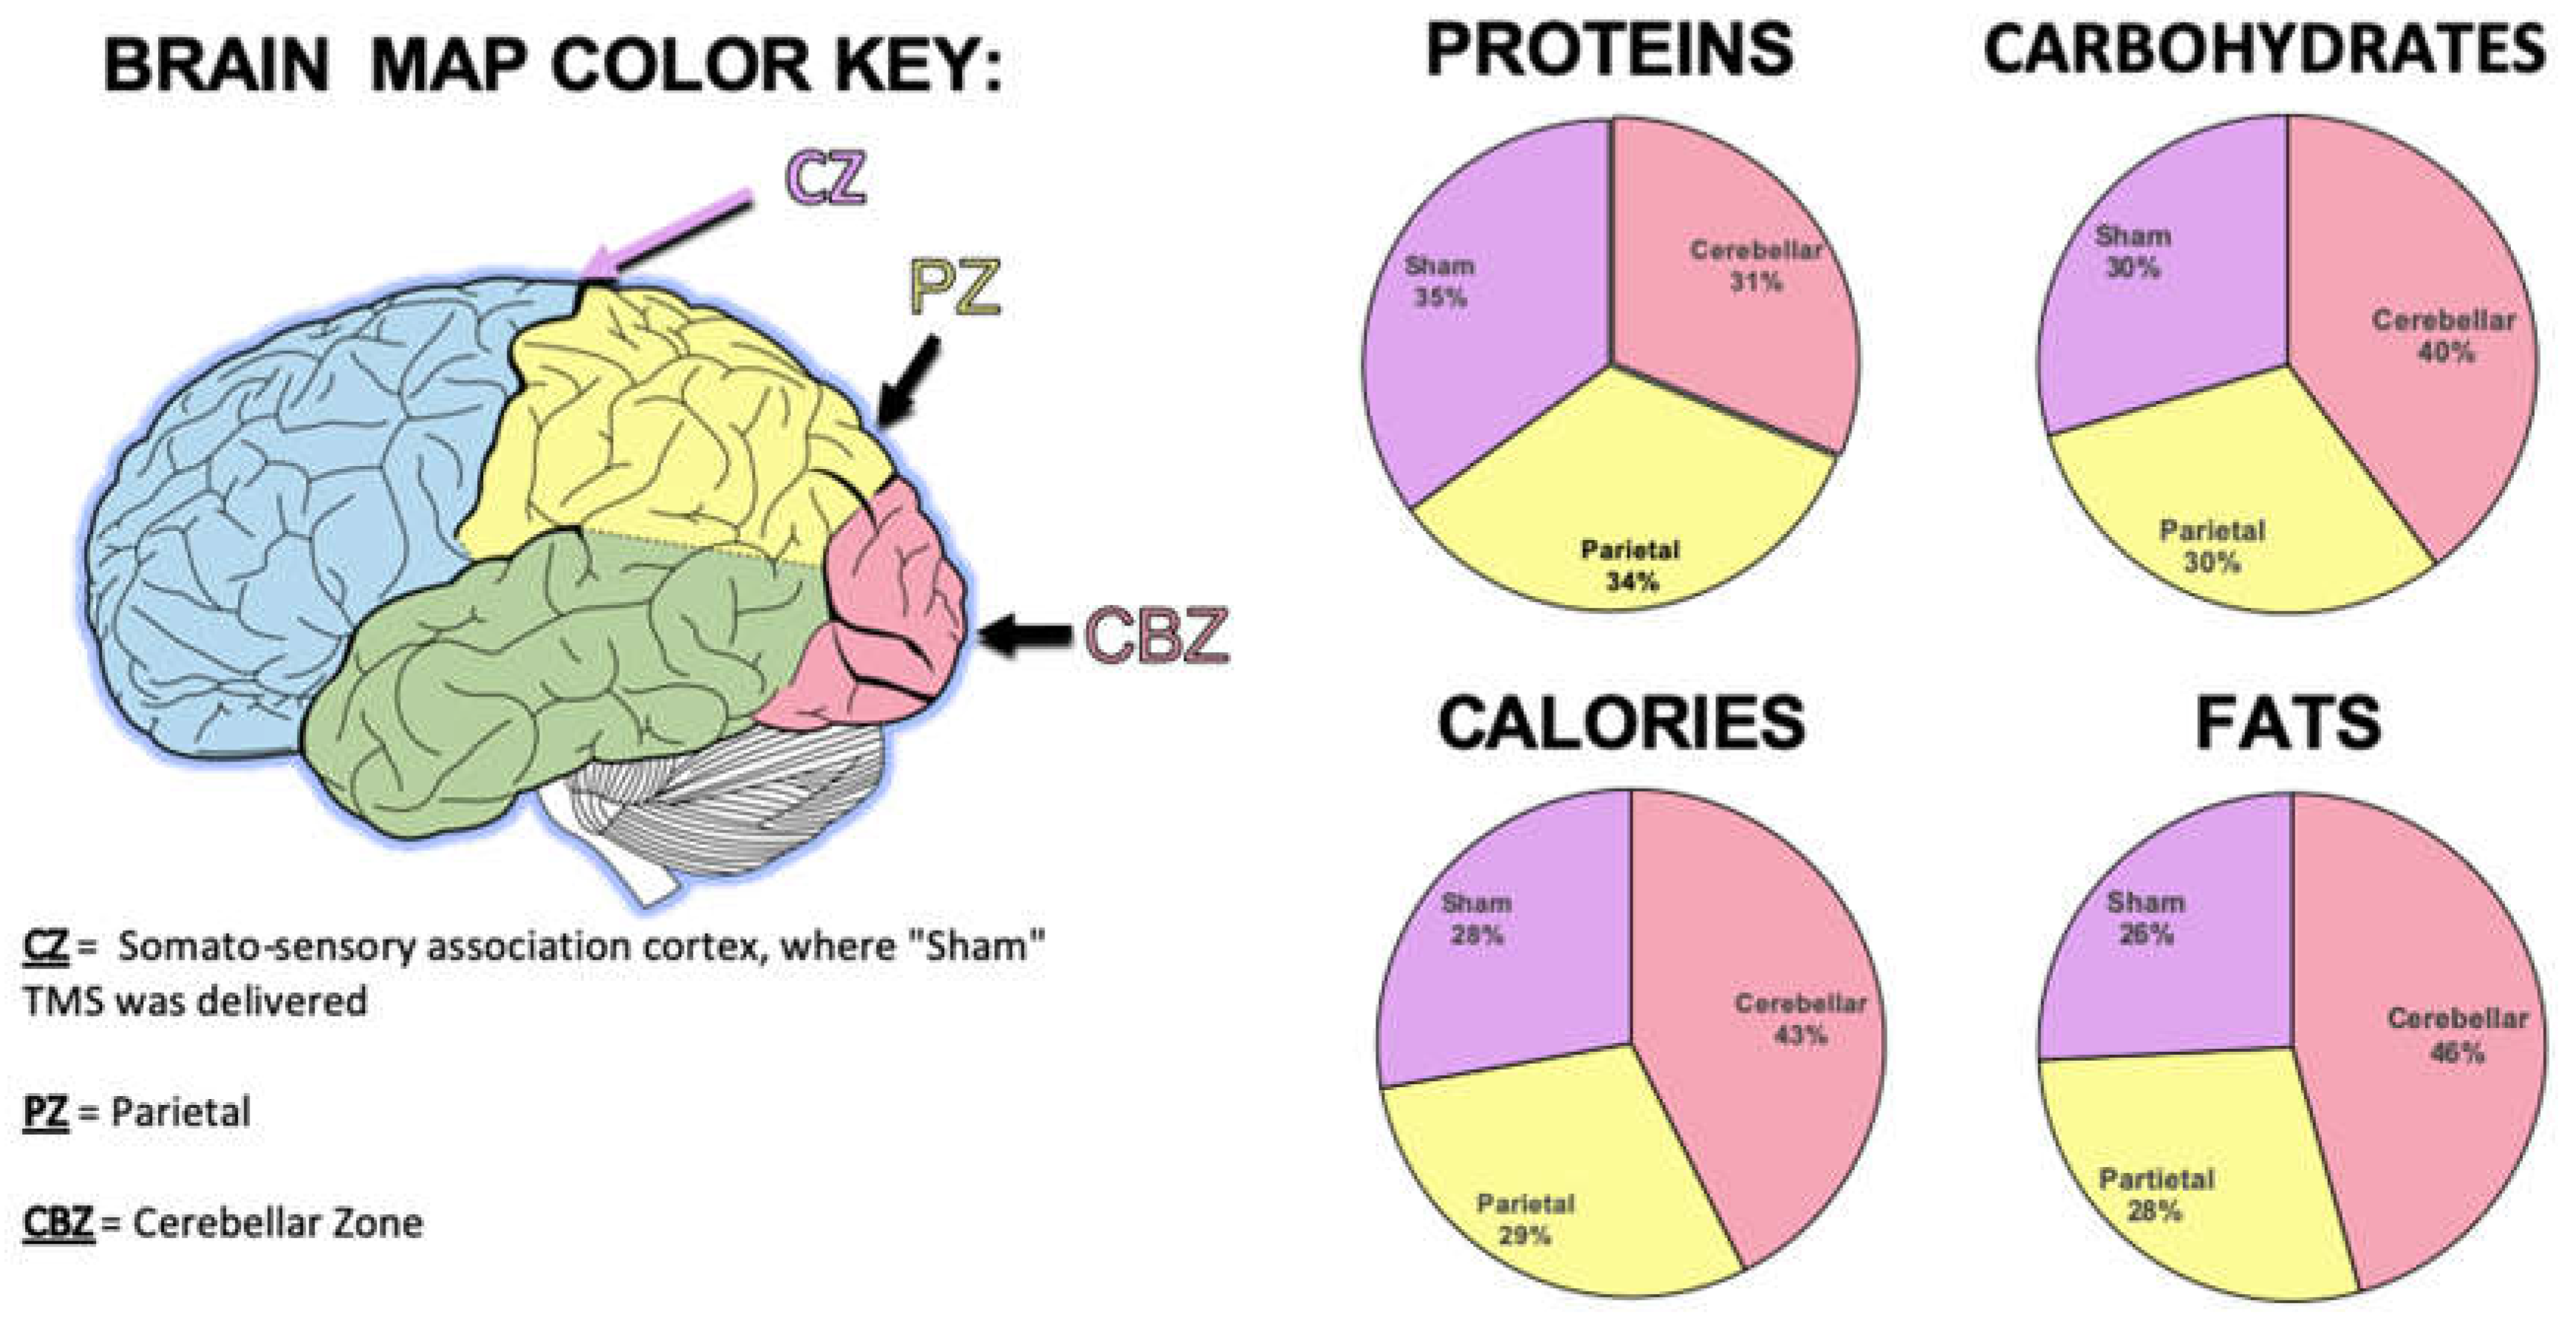
Figure 4.
Responses were obtained from the Sham, Parietal, and Cerebellar TMS trials. Participants filled out the satiety subscale questions prior to eating in each trial. The hunger scale in this question was measured on a scale of 1 to 10, ranging from extreme hunger, to extreme satiety. A lower score corresponds with lower satiety, while a higher score indicates a higher satiety index. There was no significance between the groups (p > .05).
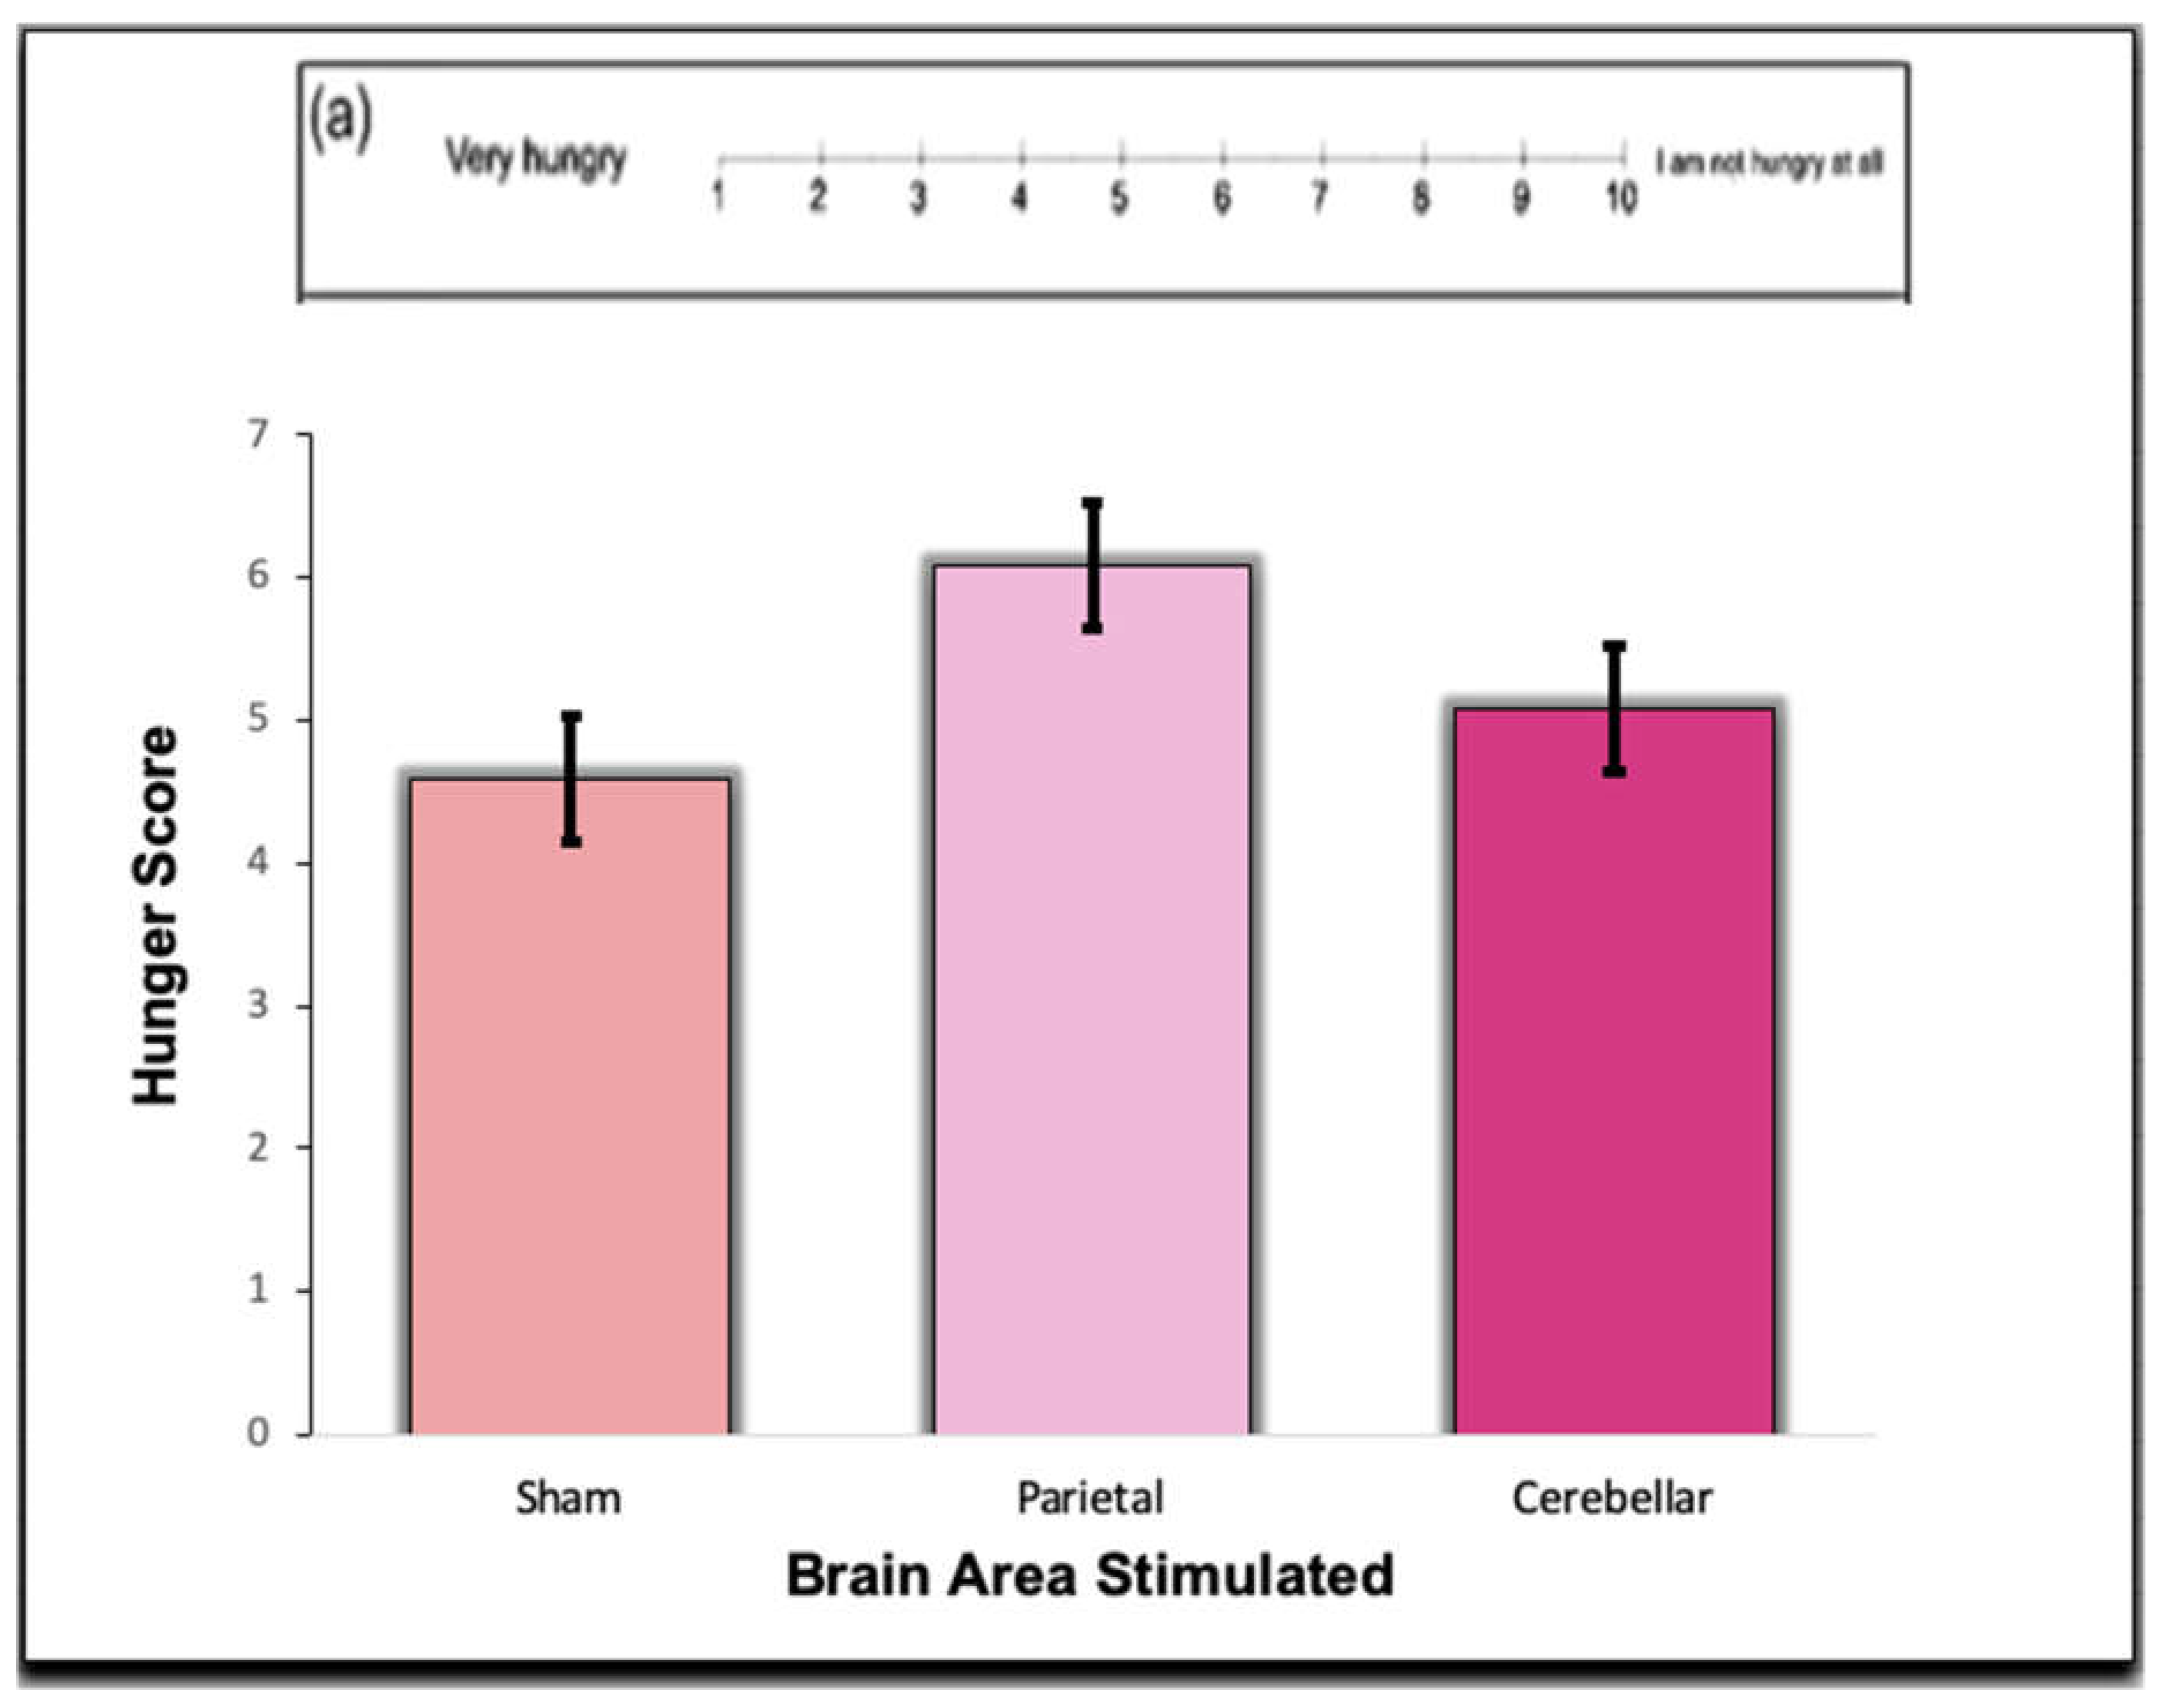
Figure 5.
Responses were obtained from the Sham, Parietal, and Cerebellar TMS trials. Participants filled out the satiety subscale questions prior to eating in each trial. The hunger score in this question was measured by drawing a mark along the line, ranging from extreme hunger, to extreme satiety. A mark, measured from left to right, in millimeters, corresponds with lower satiety, while a mark further along the line indicates a higher satiety index. There was no significance between the groups (p > .05).
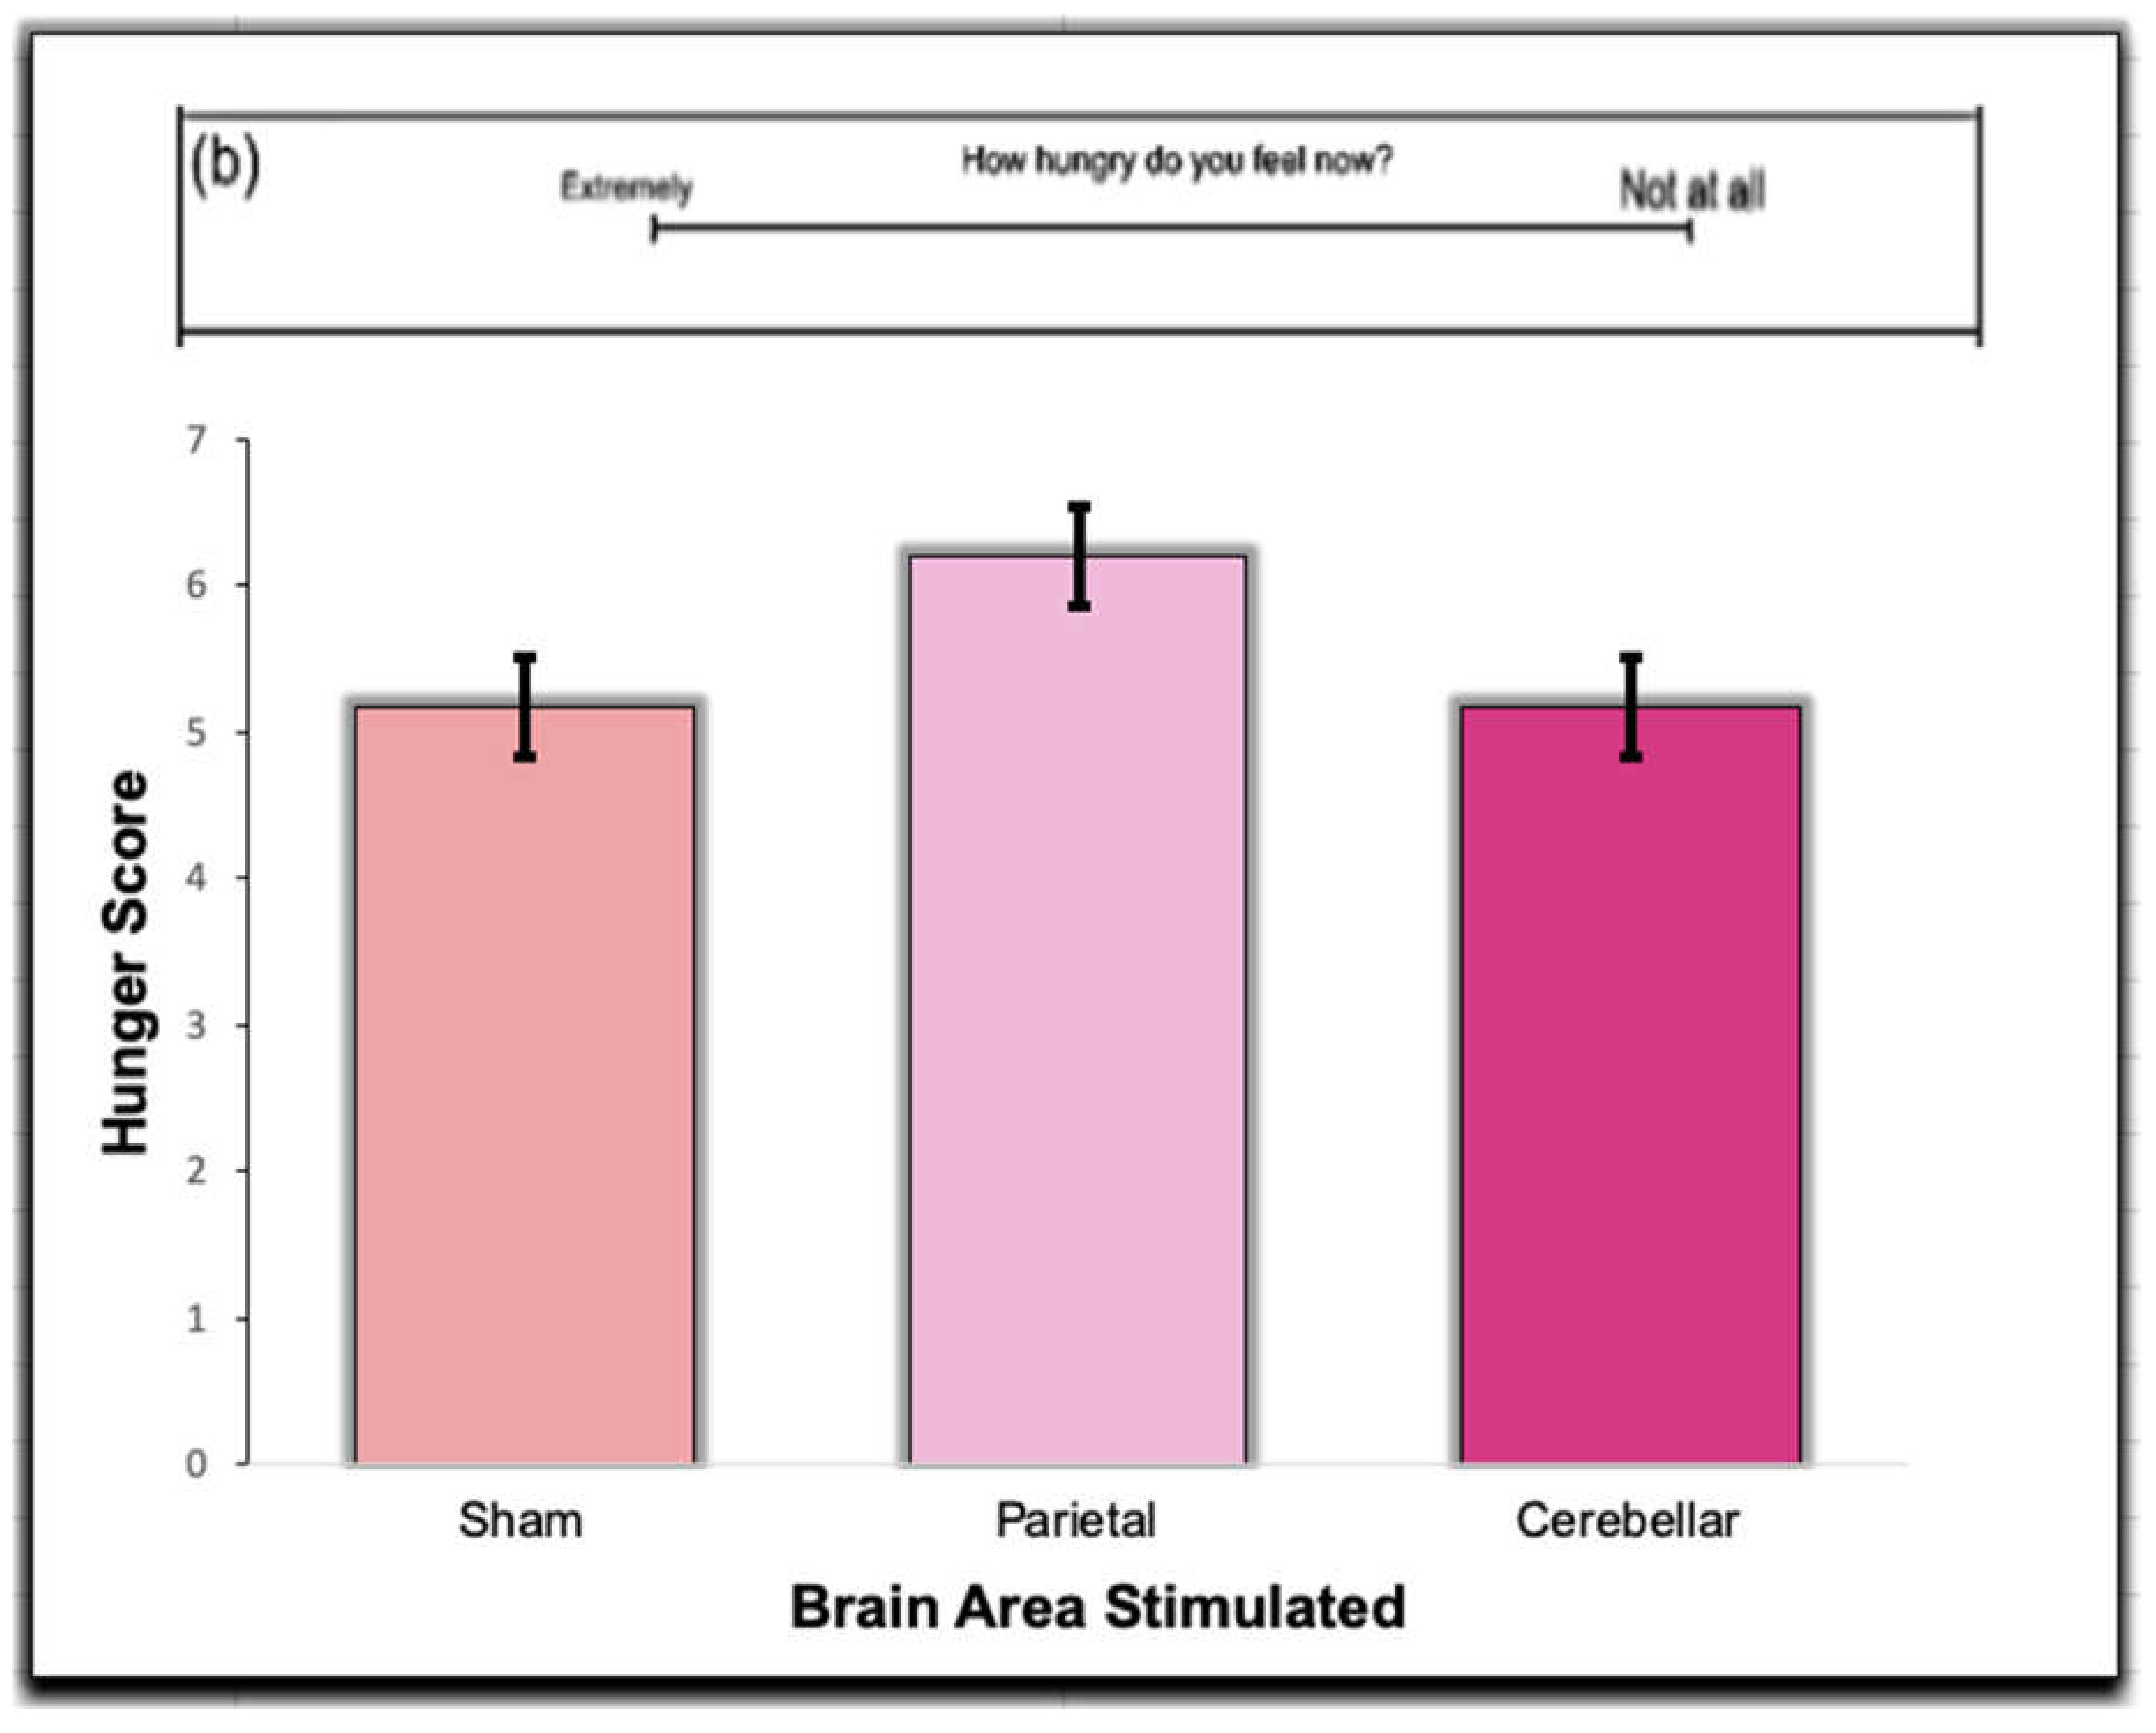
Figure 6.
Responses were obtained from the Sham, Parietal, and Cerebellar TMS trials. Participants filled out the satiety subscale questions prior to eating in each trial. The hunger score in this question was measured from “Greatest imaginable huger” to “Greatest imaginable fullness.” There was no significance between the groups (p > .05).
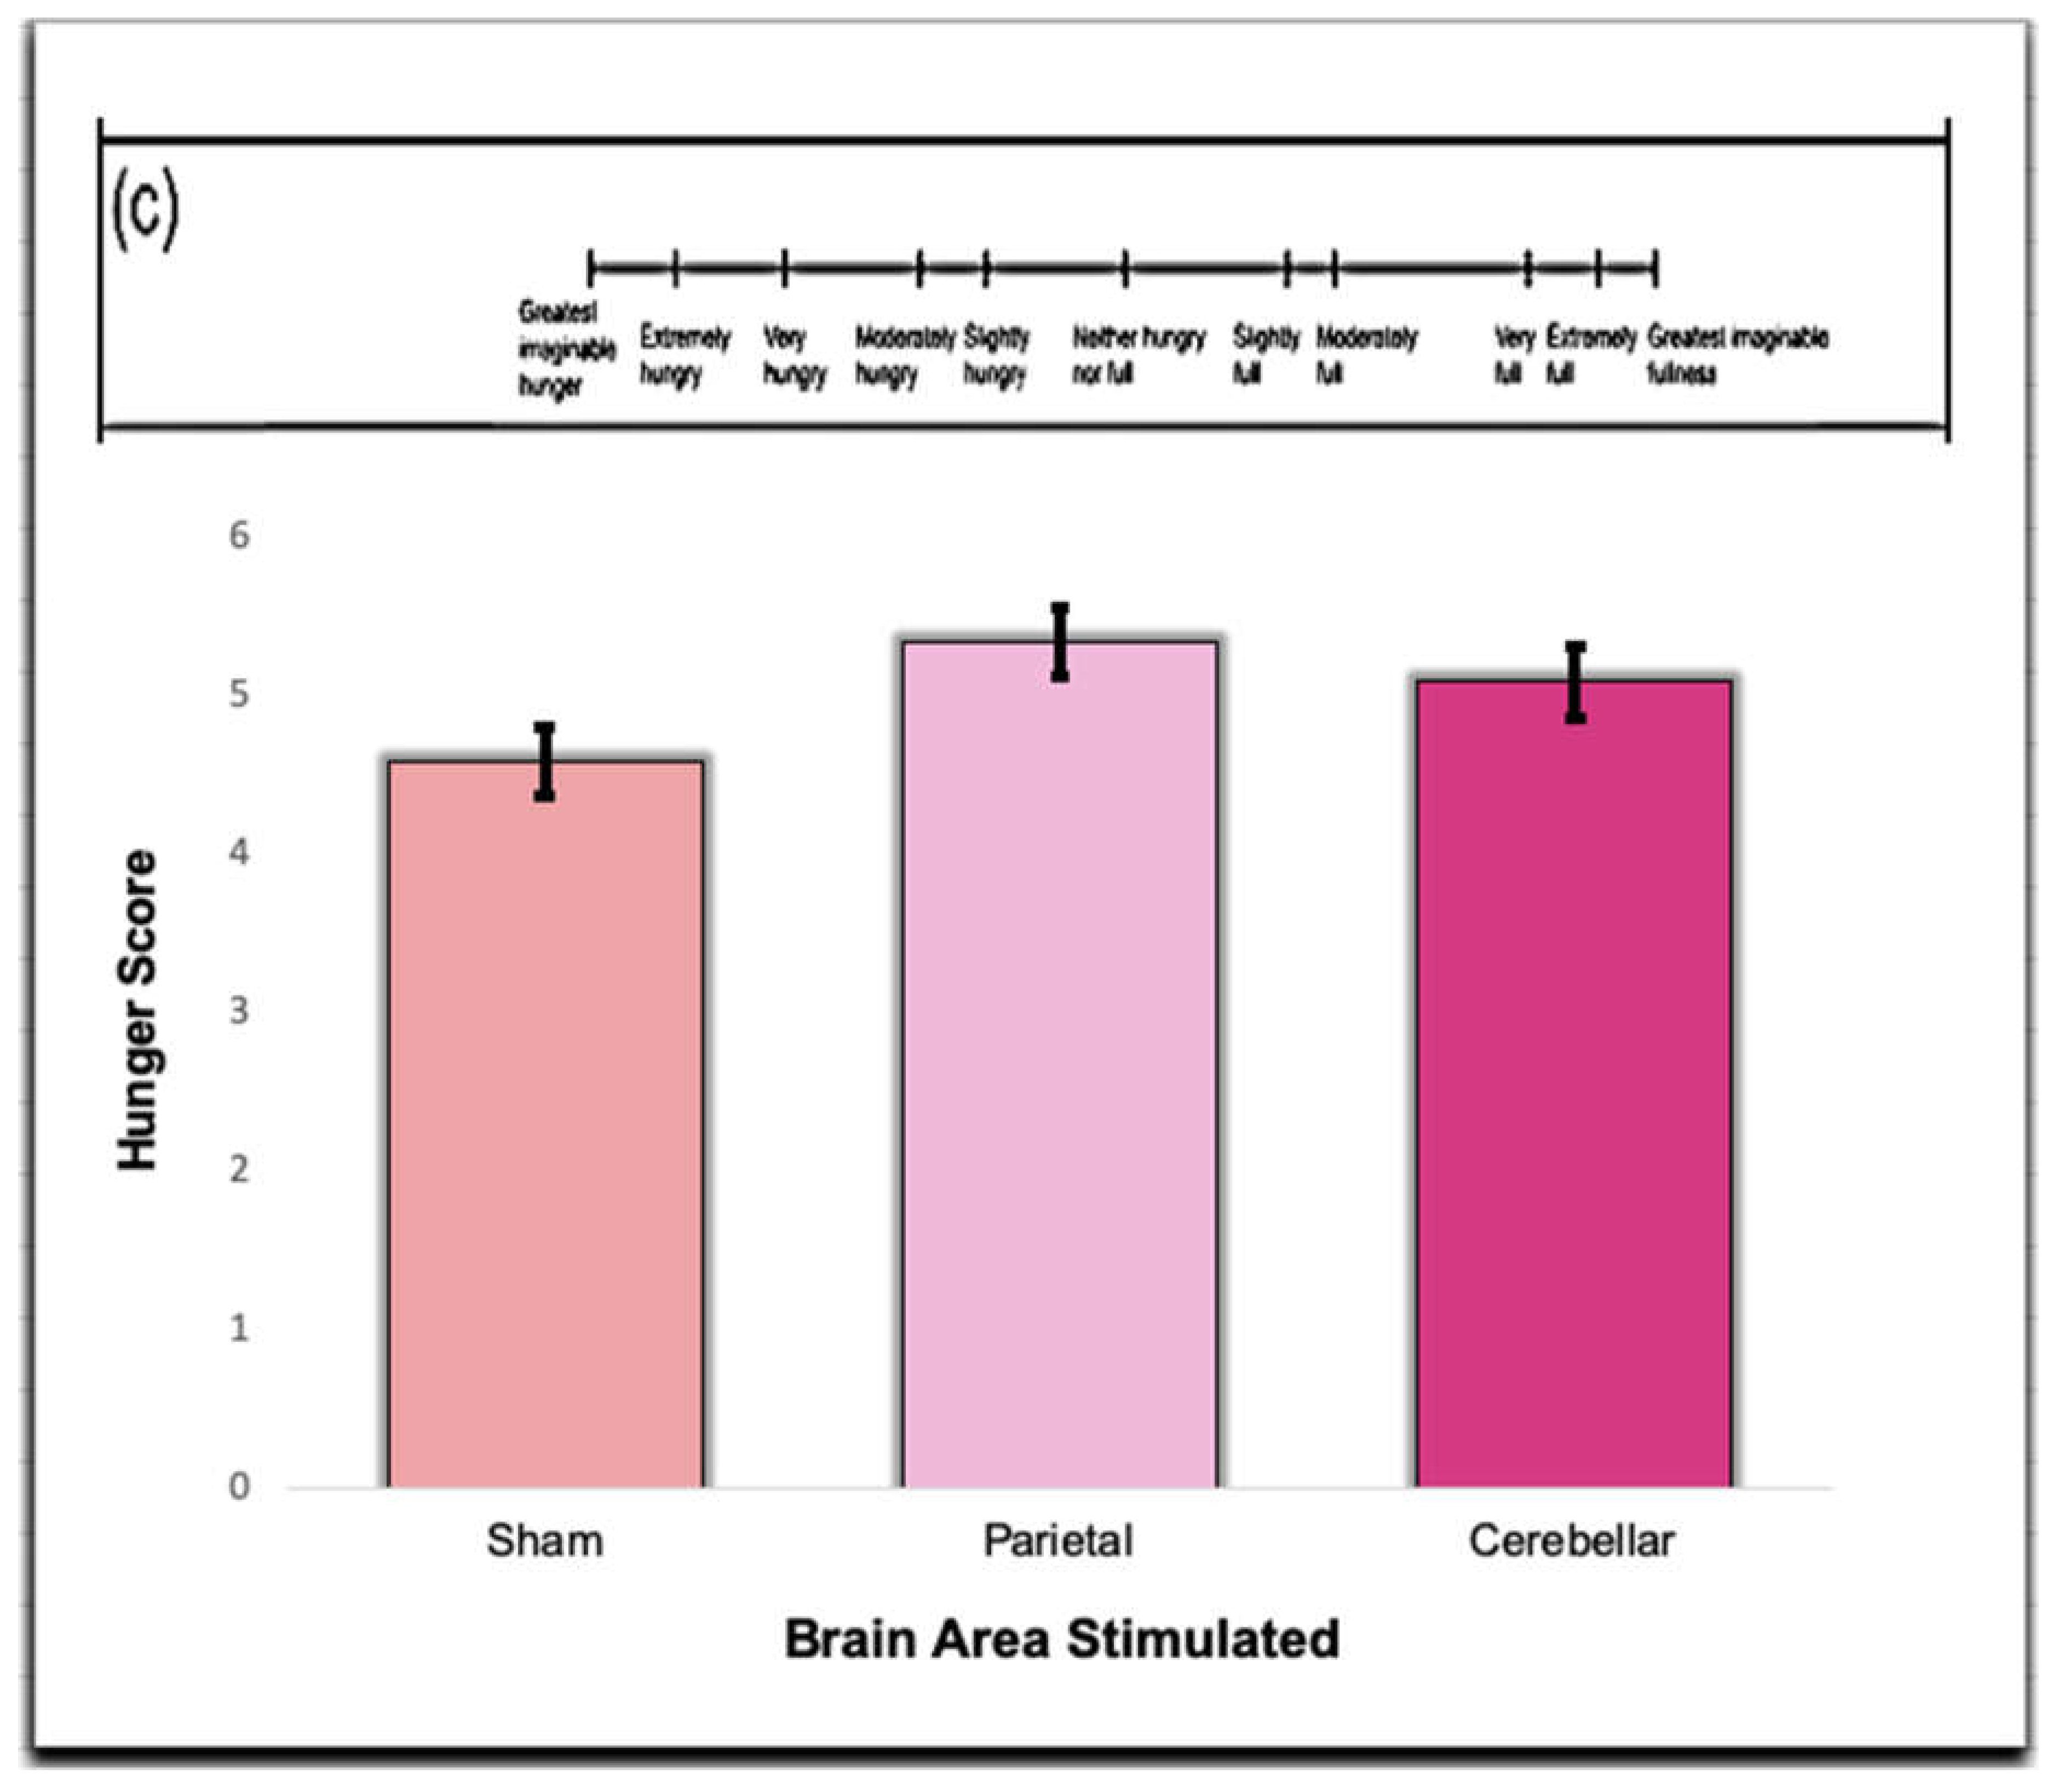
Figure 7.
Responses were obtained from the Sham, Parietal, and Cerebellar TMS trials. Participants filled out the satiety subscale questions prior to eating in each trial. The hunger score in this question was measured on a scale of 1 to 5, ranging from “Greatest imaginable hunger”, reflected by the image of the individual with little food in their stomach on the far left, to “Greatest imaginable fullness”, represented by the image of the individual with a full stomach on the far right. There was no significance between the groups (p > .05).
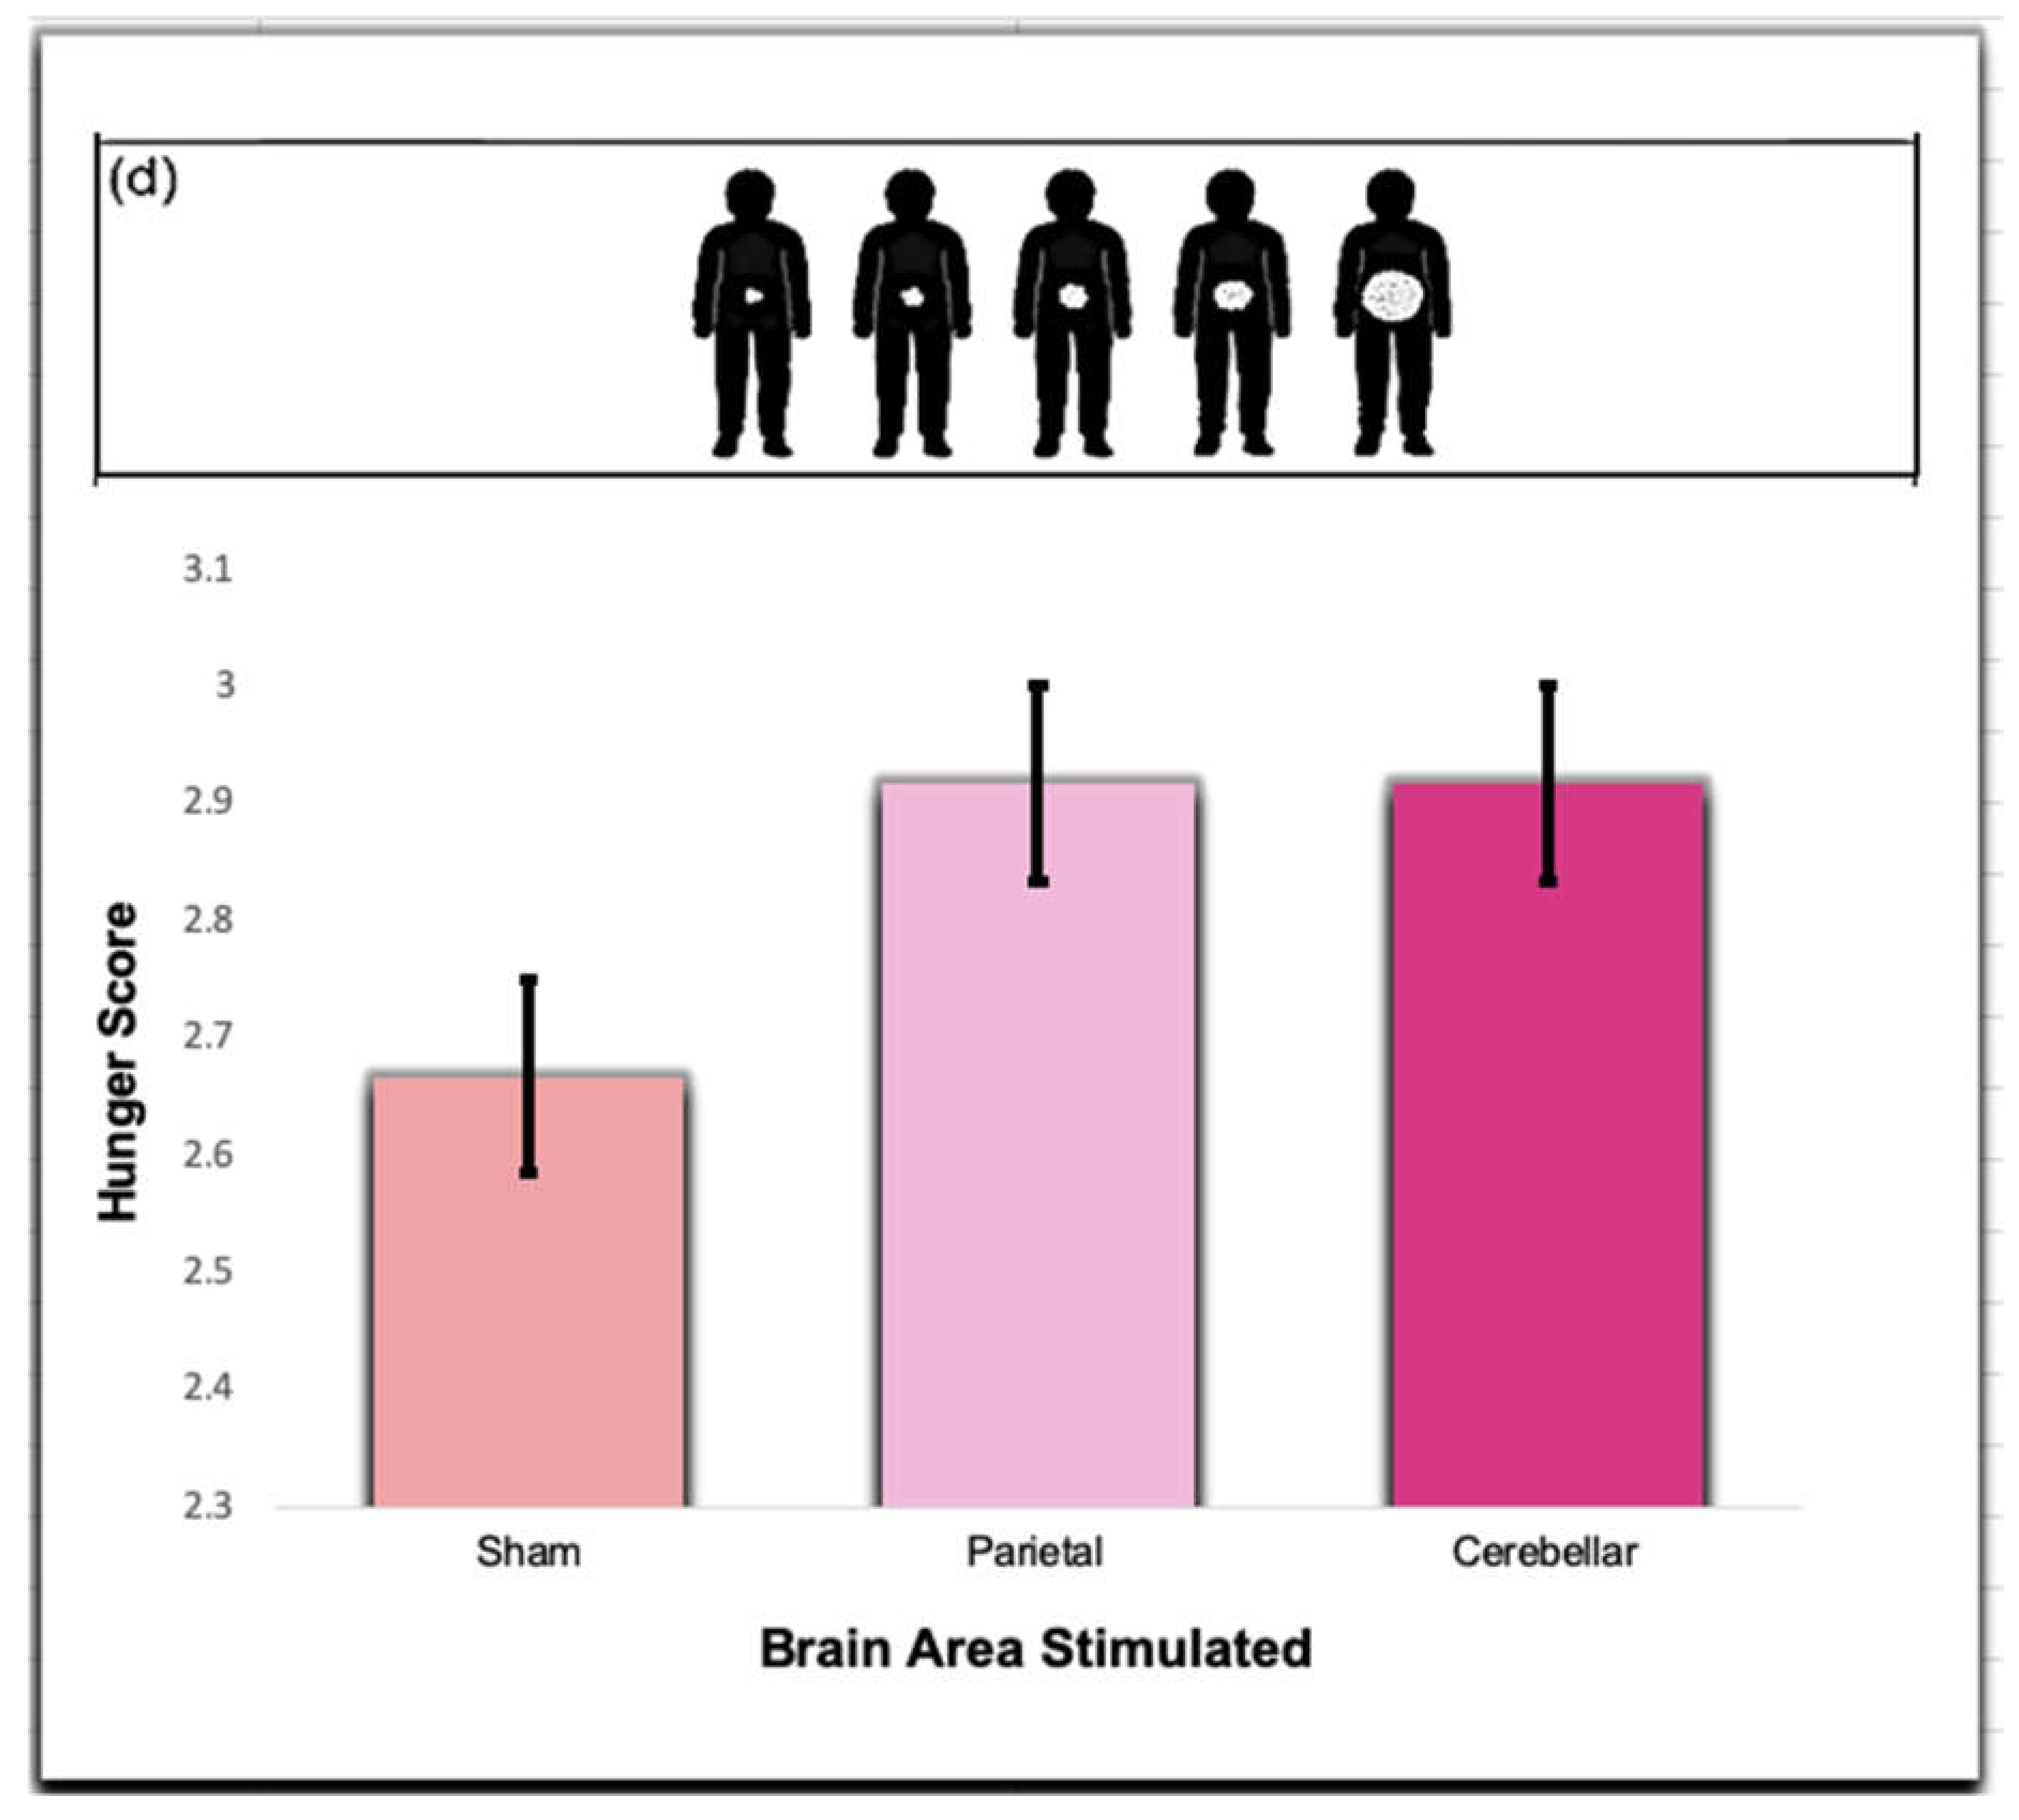
Figure 8.
Responses were obtained from the Sham, Parietal, and Cerebellar TMS trials. Participants filled out the satiety subscale questions prior to eating in each trial. The hunger score in this question was measured from “Teddy 1” that represented greatest imaginable hunger, to “Teddy 5”, which represented greatest imaginable fullness. There was no significance between the groups (p > .05).
Disclaimer/Publisher’s Note: The statements, opinions and data contained in all publications are solely those of the individual author(s) and contributor(s) and not of MDPI and/or the editor(s). MDPI and/or the editor(s) disclaim responsibility for any injury to people or property resulting from any ideas, methods, instructions or products referred to in the content. |
© 2023 by the authors. Licensee MDPI, Basel, Switzerland. This article is an open access article distributed under the terms and conditions of the Creative Commons Attribution (CC BY) license (http://creativecommons.org/licenses/by/4.0/).
Copyright: This open access article is published under a Creative Commons CC BY 4.0 license, which permit the free download, distribution, and reuse, provided that the author and preprint are cited in any reuse.


