
Submitted:
05 May 2023
Posted:
06 May 2023
Read the latest preprint version here
Abstract
The naphtha cracking process results in the production of ethylene, propylene, mixed C4, and pygas, which are all olefins. Distillation columns and cracking furnaces are the primary units of operation. The price of raw materials accounts for 80% of production costs. There is also the pos-sibility of using LPG, a less expensive raw material, in place of some of the naphtha. A change in the raw material will affect the operability of the distillation columns and influence the yield on the cracking side. To determine the best naphtha substitution for LPG without creating a hydraulic problem (Jet Flooding) in distillation columns, analysis utilizing simulation tools must be done. To simulate the substitution of naphtha for other feedstocks, a reliability model is being built by comparing simulation results with data from the actual plant. LPG flow is a free variable that is being used to substitute naphtha. The effects of economically advantageous naphtha substitution for LPG can be assessed with the use of simulation tools without impairing plant operability. Optimum naphtha substitution rate is 21.14% from base case which resulting jet flooding occurred at Propylene Fractionator No 2. By implementing this substitution case, benefit that can be driven $22,772.02/ hour.
Keywords:
Olefins
; Naphtha
; LPG
; Distillation
; Model
; Jet Flooding
1. Introduction
Ethylene, propylene, crude C4 (1,3-butadiene), and pygas (benzene, toluene, xylene) are the fundamental building blocks of the petrochemical industry. Naphtha cracking is the process that produces olefins most frequently (Kirk,1988) [1]. Up to 80% of the operational capacity of olefin plants is contributed by naphtha price. Olefins Plants around the world see potential to replace naphtha feed into LPG due to ample LPG due to shall oil production trend, LPG price decline, and LPG plenty. (Argus, 2018) [2,18].
It is risky to switch naphtha feed to LPG feed. The cracking furnace, where the steam cracking reaction of the feed by addition of steam happened, is a major unit activity in the olefins plant (Schaschke, 2014) [3]. Cracking gas is separated into ethylene, propylene, mixed C4 (butadiene, and other C4′s) and pygas (mixed benzene, toluene, and xylene stream), which are all pure olefins, in distillation column, process flow diagram shown as per Figure 1.
Propylene and propane production will increase at olefins plants using LPG feed (Argus, 2018) [2]. Since naphtha is assumed to be the primary feed for most olefin plants, including the plant under study in this article, it is important to consider the effects of LPG cracking on column hydraulics (Fakhroleslam, 2020) [5].
According to Kister (1992) [6], there are six key hydraulic parameters that affect the operability of distillation columns:
- Jet Flooding: When a distillation column is run with a lot of vapor load, jet flooding occurs because liquid is transported over.
- Down comer back flood: When a distillation column is operated with a lot of liquid and vapor load, liquid builds up in the top half of the column.
- Downcomer Choke Flood: Excessive vapor leads to liquid buildup in trays.
- Weeping: Low vapor load results in liquid draining from the tray channel.
- Excessive pressure drops: Each tray’s pressure drop shouldn’t be greater than the design.
- Turndown ratio: Feed the distillation column when it can still be operated with an acceptable level of efficiency.
The configuration of the nine columns of the Olefins Plant distillation column under investigation (Lummus, 2012) [7]:
- Demethanizer: is a nine-bed distillation column that uses pressure of 5.8 kg/cm2 to extract heavier C2 from methane, which is the top product. gauge and bottom side temperatures of -53 oC and -131 oC, respectively.
- Deethanizer: 177 sieve trays are used in a distillation column with a pressure of 21.3 kg/cm2 and temperatures of -23 oC on the top side and 66 oC on the bottom side to separate C2′s (the top product) and C3′s to heavier substances (the bottom product).
- Ethylene Fractionator: 137 sieve trays are used in a distillation column to separate the products ethylene and ethane, which is operated at pressures of 16.48 kg/cm2 and temperatures of -35 oC on top side and -12 oC on bottom side.
- Depropanizer No. 1: This distillation column uses 48 sieve trays to separate C3′s (the top product) from C4′s, which are heavier (the bottom product). It operates at a pressure of 16.7 kg/cm2 at a temperature of 44 oC on the top side and 82 oC on the bottom side.
- Depropanizer No. 2: This distillation column uses 30 sieve trays to separate C3′s (the top product) from C4s, which are heavier (the bottom product). It operates at 6.1 kg/cm2 of pressure, with temperatures of 38.2 oC on the top side and 82 oC on the bottom side.
- Propylene Fractionator No.1: This distillation column, which has 55 valve trays to separate C3s from propane, operates at a pressure of 19.7 kg/cm2 at a temperature of 50 oC on the top side and 58 oC on the bottom.
- Propylene Fractionator No.2: Propylene and propane are separated using 149 sieve trays in a distillation column that is operated at pressures of 19.2 kg/cm2 and temperatures of 46 °C on top and 50 °C on bottom.
- Propylene Fractionator No.3: Propylene and propane are separated using 210 sieve trays in a distillation column that is operated at pressures of 18.3 kg/cm2 and temperatures of 46 oC on top and 58 oC on bottom. This column and the Propylene Fractionator No. 1 and 2 are interchangeable.
- Debutanizer: Distillation column with 34 valve trays to distinguish C4s (top product) from C5s to heavier (bottom product). Column is operated at pressure 4.34 kg/cm2 gauge and temperatures 47 oC on top side and 116 oC on bottom side.
A model will be built for each distillation column based on actual data and simulated effects on column hydraulic to determine the optimal manner naphtha may be substituted for LPG without negatively impacting the distillation column.
In evaluating distillation column performance, American Institute of Chemical Engineers (AIChE) Equipment Testing Procedures Committee considered the following parameters for the testing: whether column performance meets vendor guarantees; identify capacity bottlenecks; troubleshoot performance problems; determine operating range of the column; define optimum operating conditions; develop basic data and correlations for new designs; calibrate computer simulations for use in optimizing, bottlenecking, and design studies, (CEP AIChE, 2013) [8].
Kister (1992) [6,16,18], explained that flooding is caused by one of the following mechanisms: spray entrainment flooding; froth entrainment flooding; down -comer malfunctions and large diameter columns defects. Details of the mechanism can be obtained from the literature cited. For sieve trays, the entrainment flooding point can be predicted by using the method of Kister and Haas [6,16,18] shown in Equation (1). The method is said to reproduce to a large database of measured flood points to within 15 percent.
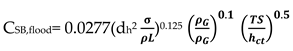 where, dh= hole diameter, mm; = surface tension, mN/m (dyn/cm); , = vapour and liquid densities, kg/m3;TS= tray spacing, mm; hct=clear liquid height at froth to spray transition, mm; hct is obtained from the Equation (2):
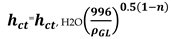 , H2O derived from Equation (3)
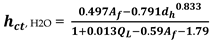
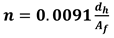
In Equation (4), =m3 liquid downflow/ (h,m weir length) and = fractional hole based on active bubbling area; For instance, derived from Equation (5)

Simulation tools that are being used in this study is ASPEN HYSYS V.12. ASPEN HYSYS V.12 is a simulation tool that can simulate the thermodynamic characteristics and equilibrium of distillation column separation (Hanley, 2016) [9]. To got reliable simulation result, properties selection for ASPEN HYSYS simulation is critical (Luyben, 2014) [10]. In this investigation, a fluid program was used to replicate the thermodynamic model, with advice from (Yadav, 2020) [11].
The dependent in the independent variable should be carefully chosen to produce a robust model (Shinskey, 1991) [12]. LPG feed flow is an independent variable in this study, while naphtha composition and LPG composition are dependent variables. By changing tray efficiency to achieve a minimum% error, the simulation model should be evaluated using plant data to match simulation with actual (Loshchev, 2010) [13].
2. Data Input and Methods
2.1. Data Input
The following data are being utilized for simulation:
- Distillation column data sheet including geometry.
- The actual operating conditions for each distillation column (pressure, temperature, flow, and composition) derived from plant actual data.
- Naphtha composition basis for study
Naphtha feed composition used in study shown in Table 1.
- d.
- Naphtha flowrate basis for study
Naphtha flowrate basis for study based on plant actual condition to produce 100 t/h ethylene product is 252 t/h with 7 furnaces run with naphtha feed.
- e.
- Feed composition of LPG feed for substitute naphtha using for study.
LPG feed composition used in study shown in Table 2.
- f.
- LPG flowrate basis for study
LPG flowrate basis for study based on number of furnaces run with LPG feed as naphtha feed substitution shown in Table 3.
2.2. Methods
2.2.1. Theory
The methods employed in predicting flooding capacity in this research project are the Kister and Haas method and the Fair’s correlation method. These methods are utilized to evaluate and compare the flooding capacity for a distillation column.
Kister and Haas gave a correlation which is said to reproduce a large data base of measured flood points to within + 15 percents. CSB, flood is based on the net area.
Here Equation (2) become relevant and hct was obtained subsequently from Equation (3). Hence, % flood for each distillation column can be calculated from Equation (6)
2.2.2. Model Development
Model development based on these following assumptions [19]:
- a)
- Both the vapor and the liquid phases are taken to be ideal solutions. Constant average relative volatilities have been considered.
- b)
- The column top temperature has been estimated from the assumed condenser operating pressure. The feed and the reflux are assumed to be at their dew point and bubble point respectively. The reflux condenser is assumed to be a total condenser.
- c)
- Constant molal overflow is assumed.
- d)
- The stages are assumed to be 100% efficient with respect to mass transfer. Then adjusted in order to match simulation result with actual plant condition.
- e)
- The pressure drop through the tower has been calculated based on the sieve tray characteristic. Based on the tower bottom pressure, the temperature of the reboiler has been estimated.
- f)
- The tower has only the feed, distillate and the bottoms streams and no other side streams.
- g)
- The liquid volume or hold up in the reboiler, reflux drum and on each of the hypothetical column plates are well mixed regions having uniform composition.
- h)
- The dynamics of the piping, reboiler and condenser are negligible, thus there are no time lag elements in the system. Vapor phase dynamics are neglected as it is much faster.
- i)
- The liquid hold-ups are constant on each tray and in the reboiler and reflux drums.
- j)
- The column is adiabatic and decay heat release from components is neglected.
- k)
- The feed composition to the column is obtained by actual data from plant operation.
The objective of the distillation cascade is to separate components in Olefins Plant to be pure products.
2.2.2. Model Validation
The simulation of distillation columns with the rate-based approach results in a large and highly non-linear algebraic equations [20]. In this work, the equations are implemented in the simulation software Aspen Hysys, an process simulator tools. An advantage of Aspen Hysys is that the ASPEN Properties Database can be used. The complex system of equations can be solved reliably, so that good starting values are available. In this work, these values are generated with the help of simulations using a model with a lower complexity. For this purpose, the equilibrium stage model is employed. In the applied simulator, it is possible to subdivide the column into alternating segments. In each segment, different correlations for the process hydraulics are implemented in line with the column internal modelling approach based on plant data sheet.
In order to match simulation result with actual plant result, then calculated parameters for actual composition of top components and bottom components being compared by using % Error calculation shown in Equation (7). To minimize Absolute Percent Error (AAPE, %) trial conducted by adjusting tray efficiency in ASPEN Hsysy simulator software.

2.2.3. Sensitivity Analysis Substitution of Naphtha to LPG into % Flooding
2.2.4. Economic Calculation
Benefit calculation of feed substitution of naphtha to LPG shall be calculated with Equation (8)
Benefit = (Product Flowrate x Product Price) – [(Naphtha Flowrate x Naphtha Price) + (LPG Flowrate x LPG Price)] – Utilities Cost
Cost reference for economic calculation shown in Table 4
3. Results and Discussion
3.1. Simulation Matching with Plant Actual Data
A summary of model parameters and goodness of plant actual data provided in Table 5 for the use of Equation (7) to evaluate matching between simulation result with plant actual data.
3.2. Sensitivity Anaysis
After reliable model being developed and tested, sensitifity analysis being conducted to determine correlation between % flooding based on Equations (1)–(6) with % naphtha substitution to LPG in Table 3.
Based on calculation result shown in Figure 2, Figure 3, Figure 4 and Figure 5 all graph have R squared value > 0.7 satisfictionally correlated [10,11]. ssessment result of limitation of % naphtha substitution limit in each distillation column under study presented in Table 6.
Based on summary in Table 6 jet flooding limitation in distillation columns under study occurred in Propylene Fractionator No.2 with maximum naphtha substitution 21.14%. This value correlated with theorm in craking of LPG will cause higher yield of propylene [2,3,5] which mainly add load in Propylene Fractionator No 2.
3.3. Economical Evaluation
4. Summary and Conclusions
In the present study, we demonstrated and assessed the ability of ASPEN Hysys to conduct sensitivity analysis based on validated model which already tested with actual plant condition using APEA method for assess flooding phenomenon in distillation column for case naphtha feed substitution into LPG. ASPEN Hysys is simulation-based tools that are equipped by thermodynamic properties package, which can be chosen based on physical condition of system under study. By implementing modeling, optimization and prediction on distillation column operating manner or limitation in term of Jet Flooding could be predicted without put plant condition in risk. Future efforts will be needed to improve model accuracy with actual plant condition and assess for modification effect in column internals.
Supplementary Materials
The following supporting information can be downloaded at the website of this paper posted on Preprints.org. Table: Recap Tower Loading 20 Aug 2020 vs simulation LPG.
Author Contributions
Conceptualization, A.W. and M.H.; data curation, M.H.; formal analysis, S.W.; funding acquisition, M.H.; methodology, A.W, M.H. and S.S.; project administration, A.W.; software, A.W.; supervision, M.H.; validation, M.H and S.S.; visualization, A.W.; writing—original draft, A.W.; writing—review and editing, A.W, M.H., and S.S. All authors have read and agreed to the published version of the manuscript.
Funding
This research received no external funding.
Data Availability Statement
The reference pure component properties were sourced from Yaws’ Handbook of Thermodynamic and Physical Properties of Chemical Compounds [21]. The compiled reference data and ASPEN Hysys parameters are provided in the Supporting Information accompanying the electronic version of this manuscript. We additionally provide Hysys simulation model.
Conflicts of Interest
The authors declare no conflict of interest.
References
- Kirk, and Othmer, Encyclopedia of Chemical Technology, 2007 4th Ed., pp.416-418, John Willey and Sons, New York.
- J. Duffy, Argus, UK and P. Morse, Argus, “Asia and Europe Join the Feedstock Evolution with Steam Crackers”, Hydrocarbon Processing, April 2018, Gulf Publishing Company Houston, Texas. Available online: Business Trends (hydrocarbonprocessing.com) (accessed on: 12 Maret 2021).
- Schaschke, C. , 2014, A Dictionary of Chemical Engineering, pp.816-819 Oxford University Press, England.
- PT Chandra Asri Petrochemical TbK, Production Flow PT Chandra Asri Petrochemical TbK; Available online: https://www.chandra-asri.com/our-business/production-flow (accessed on: 12 Maret 2021).
- Fakhroleslam, Mohammad, and Sadrameli, Seyed Mojtaba, 2020, “Thermal Cracking of Hydrocarbons for the Production of Light Olefins; A Review on Optimal Process Design, Operation, and Control”, Ind. Eng. Chem. Res., Vol 59, pp. 88−103.
- Kister, Henry Z., 1992, Distillation Design, Brown and Root Braun, California.
- Lummus Technology and CB&I Company, 2012, Basic Engineering Package for Chandra Asri Petrochemical ECC Expansion Project.
- CEP, AIChE Publication, June 2013, Evaluating Distillation Column Performance p 27.
- Hanley, Brian, et.all. , 2016, Column Analysis in Aspen Plus® and Aspen HYSYS®: Validation with Experimental and Plant Data, ASPEN Technology Inc., United States.
- W. L. Luyben, 2013, Distillation design and control using Aspen simulation John Wiley & Sons, New York.
- Yadav, Eadala Sarath, Indiran, Thirunavukkarasu, Nayak, Dayananda, and Kumar, CHVB Aditya, 2020, “Simulation Study of Distillation Column using Aspen plus”, Mat. Pr., Vol. 29, pp. 60-69. [CrossRef]
- F. G. Shinskey, 1991, Process Control Systems: Application, Design and Tuning, McGraw-Hill, Inc., New York.
- Loshchev, C. Cardona, and Y.A. Pisarenko, 2010, ”Degrees of freedom Analysis for a Distillation Column”, Theor. Found. Chem. Eng., Vol.44 (5), pp. 686–697. [CrossRef]
- H.J Qestha, S., Abuyahya, P. Pal and F., Banat, 2015, ”Sweetening Liquified Petroleum Gas (LPG): Sensitivity Analysis using ASPEN HYSYS ”, J. Nat. Gas. Sci. Eng., Vol. 25, pp. 1011−1017.
- Huang, D., and Luo, X.-L, 2018, ”Process Transition Based on Dynamic Optimization with the Case of a Throughput-Fluctuating Ethylene Column”, Ind. Eng. Chem. Res., Vol. 57, pp. 292−302. [CrossRef]
- Kessler, D.P. and Wankat, P.C., 1988 , “Correlations for Column Parameters”, Chem. Eng., vol. 71, pp.71-84.
- Wood MacKenzie, 2019, Ethylene Global Supply Demand Analytics Service, https://www.woodmac.com/news/editorial/ethylene-global-supply-demandanalytics-service/, (accessed on: 12 Maret 2021).
- Z.-Y. Liu, M. Jobson, 2004,“Retrofit Design for Increasing the Processing Capacity of Distillation Columns: 1. A Hydraulic Performance Indicator”, Chem. Eng. Res. Des., Vol.82, pp.3-9. [CrossRef]
- Miresmaeil, Masoumi., Mohammad, Shahrokhi., Mojtaba, Sadrameli., and Jafar, Towfighi, 2006, “Modeling and Control of a Naphtha Thermal Cracking Pilot Plant”, Ind. Eng. Chem. Res., Vol. 45, 3574-3582.
- E.Y. Kenig, A. Górak, A. Pyhälahti, K. Jakobsson, J.Aittamaa, K. Sundmacher, 2004, “Advanced Rate-based Simulation Tool for Reactive Distillation”, AIChE J., Vol.50, pp. 322-342 .
- Yaws, C.L. Yaws’ Handbook of Thermodynamic and Physical Properties of Chemical Compounds; Knovel: New York, NY, USA 2003; ISBN: 978-1-59124-444-8.
Figure 1.
Olefins Plant (PT Chandra Asri, 2021), as indicate block diagram product portofolio of Olefins Plant under study [4].
Figure 1.
Olefins Plant (PT Chandra Asri, 2021), as indicate block diagram product portofolio of Olefins Plant under study [4].
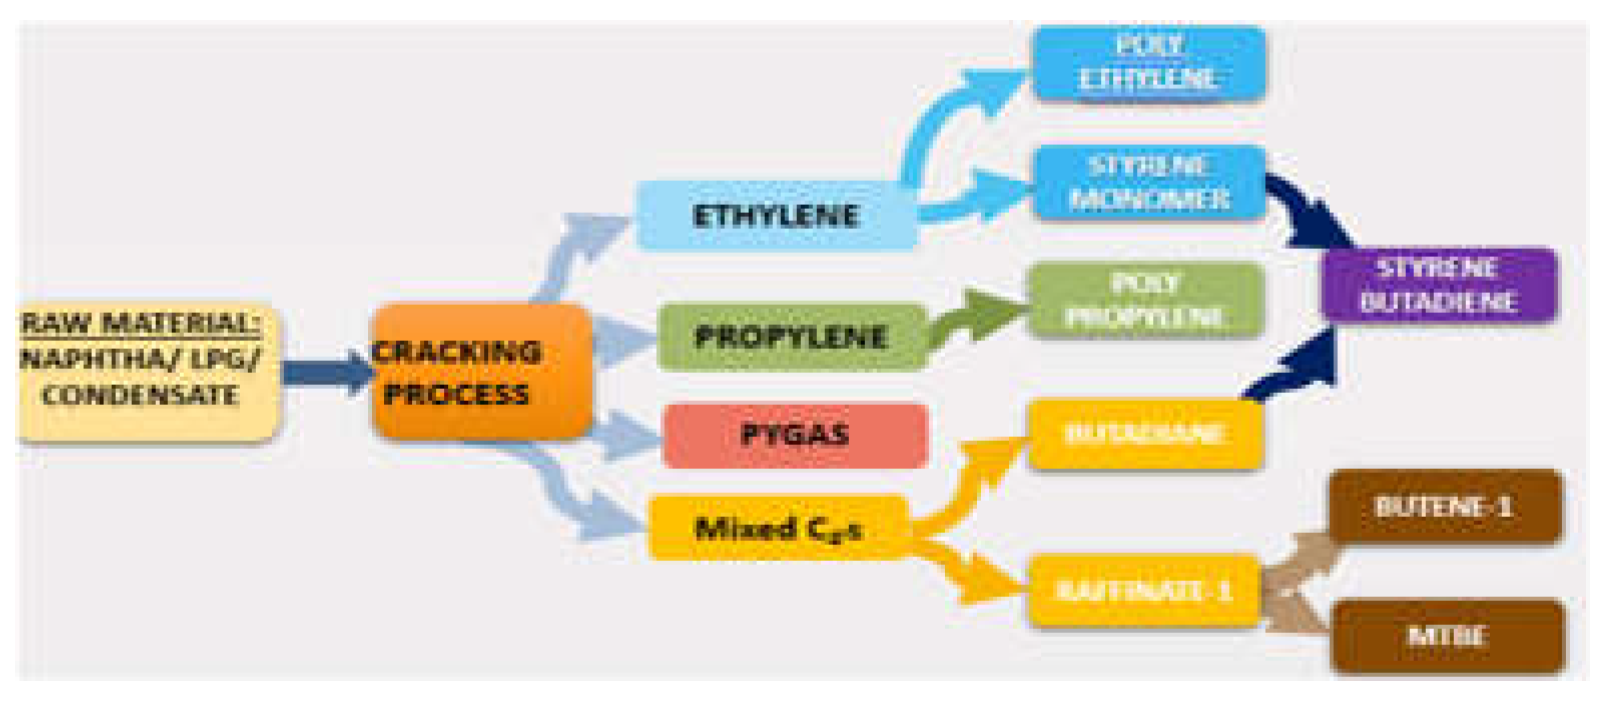
Figure 2.
Parity Plot of % flooding based on Equations (1)–(6) for (a) Demethanizer and (b) Deethanizer column with % naphtha substitution to LPG in Table 3. The solid line correspondence to regression result and R squared valued shown graph.
Figure 2.
Parity Plot of % flooding based on Equations (1)–(6) for (a) Demethanizer and (b) Deethanizer column with % naphtha substitution to LPG in Table 3. The solid line correspondence to regression result and R squared valued shown graph.
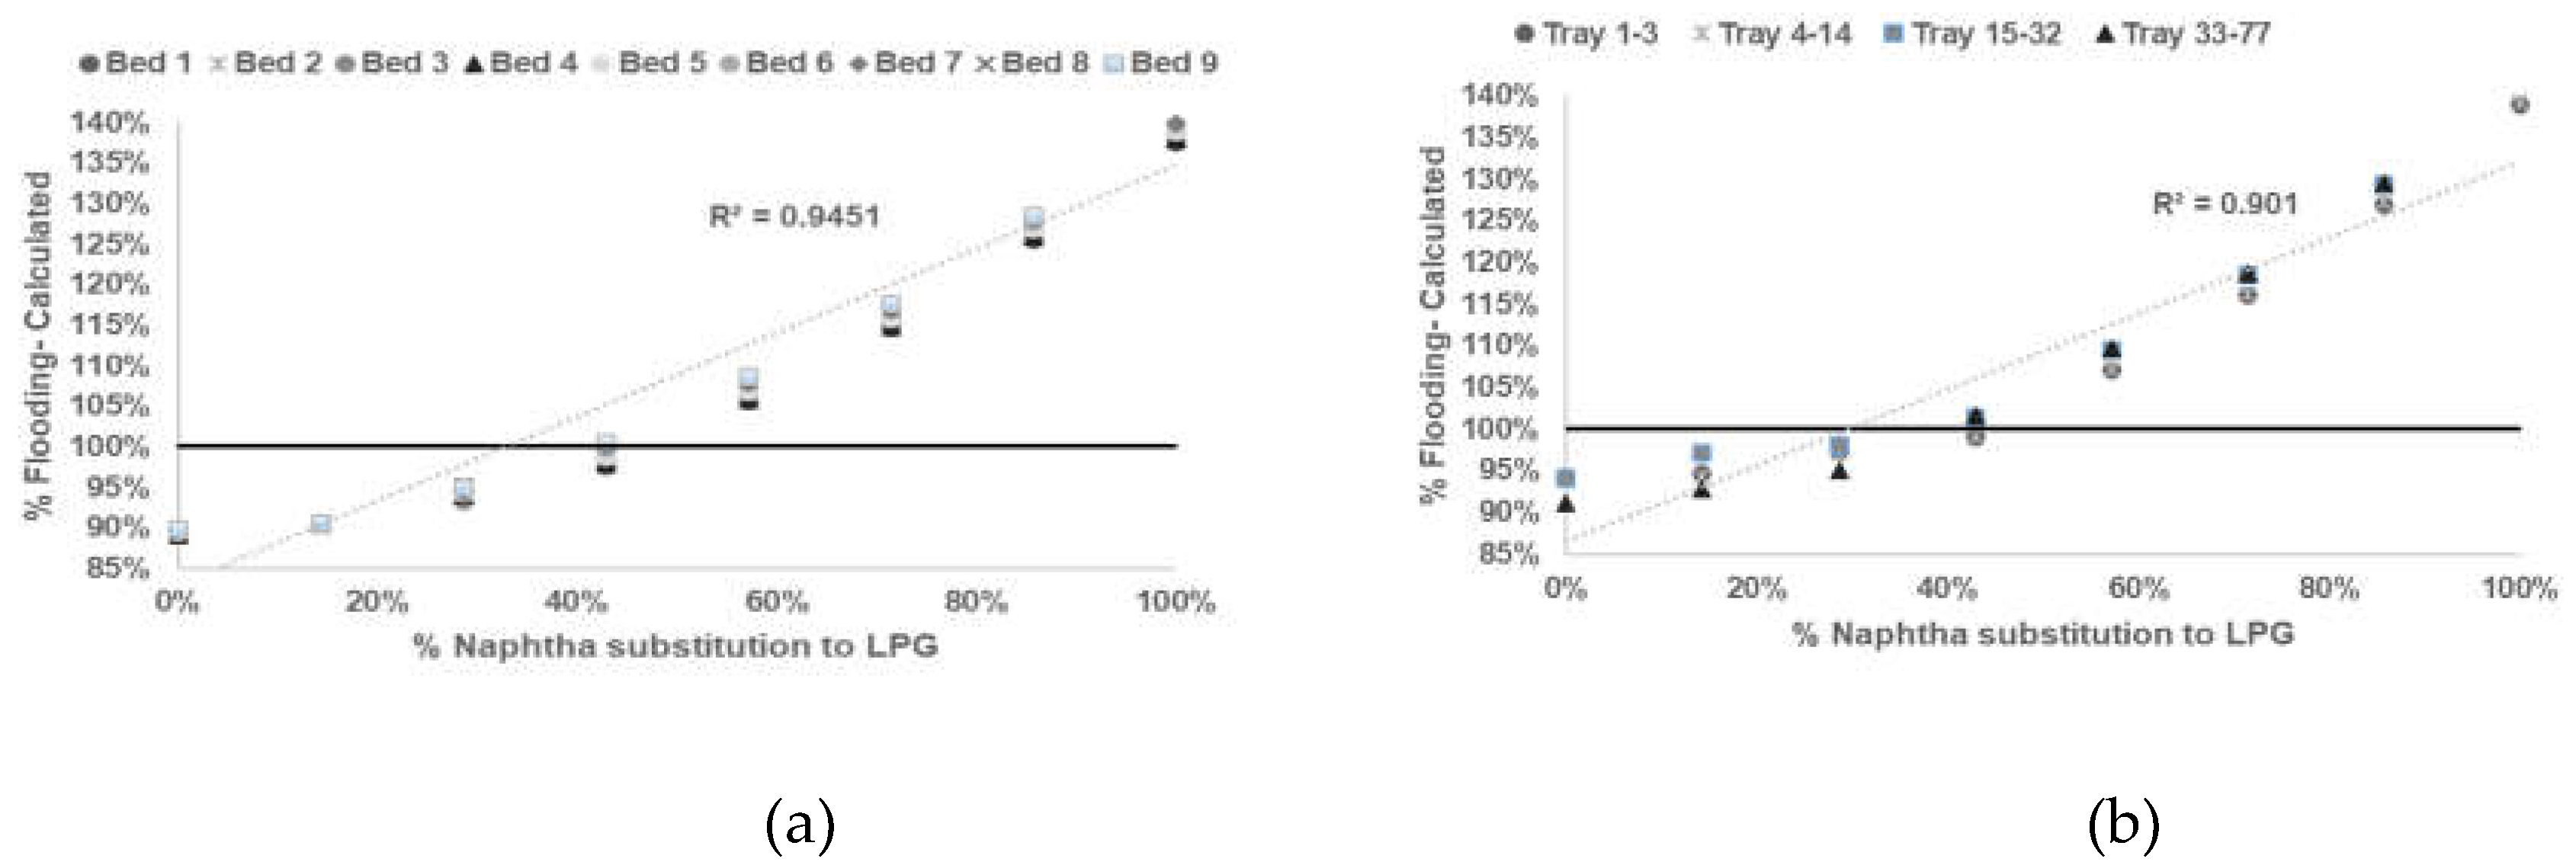
Figure 3.
Parity Plot of % flooding based on Equations (1)–(6) for (a) Ethylene Fractionator and (b) Depropanizer No 1 column with % naphtha substitution to LPG in Table 3. The solid line correspondence to regression result and R squared valued shown graph.
Figure 3.
Parity Plot of % flooding based on Equations (1)–(6) for (a) Ethylene Fractionator and (b) Depropanizer No 1 column with % naphtha substitution to LPG in Table 3. The solid line correspondence to regression result and R squared valued shown graph.
Figure 4.
Parity Plot of % flooding based on Equations (1)–(6) for (a) Depropanizer No 2 and (b) Propylene Fractionator No 1 column with % naphtha substitution to LPG in Table 3. The solid line correspondence to regression result and R squared valued shown graph.
Figure 4.
Parity Plot of % flooding based on Equations (1)–(6) for (a) Depropanizer No 2 and (b) Propylene Fractionator No 1 column with % naphtha substitution to LPG in Table 3. The solid line correspondence to regression result and R squared valued shown graph.
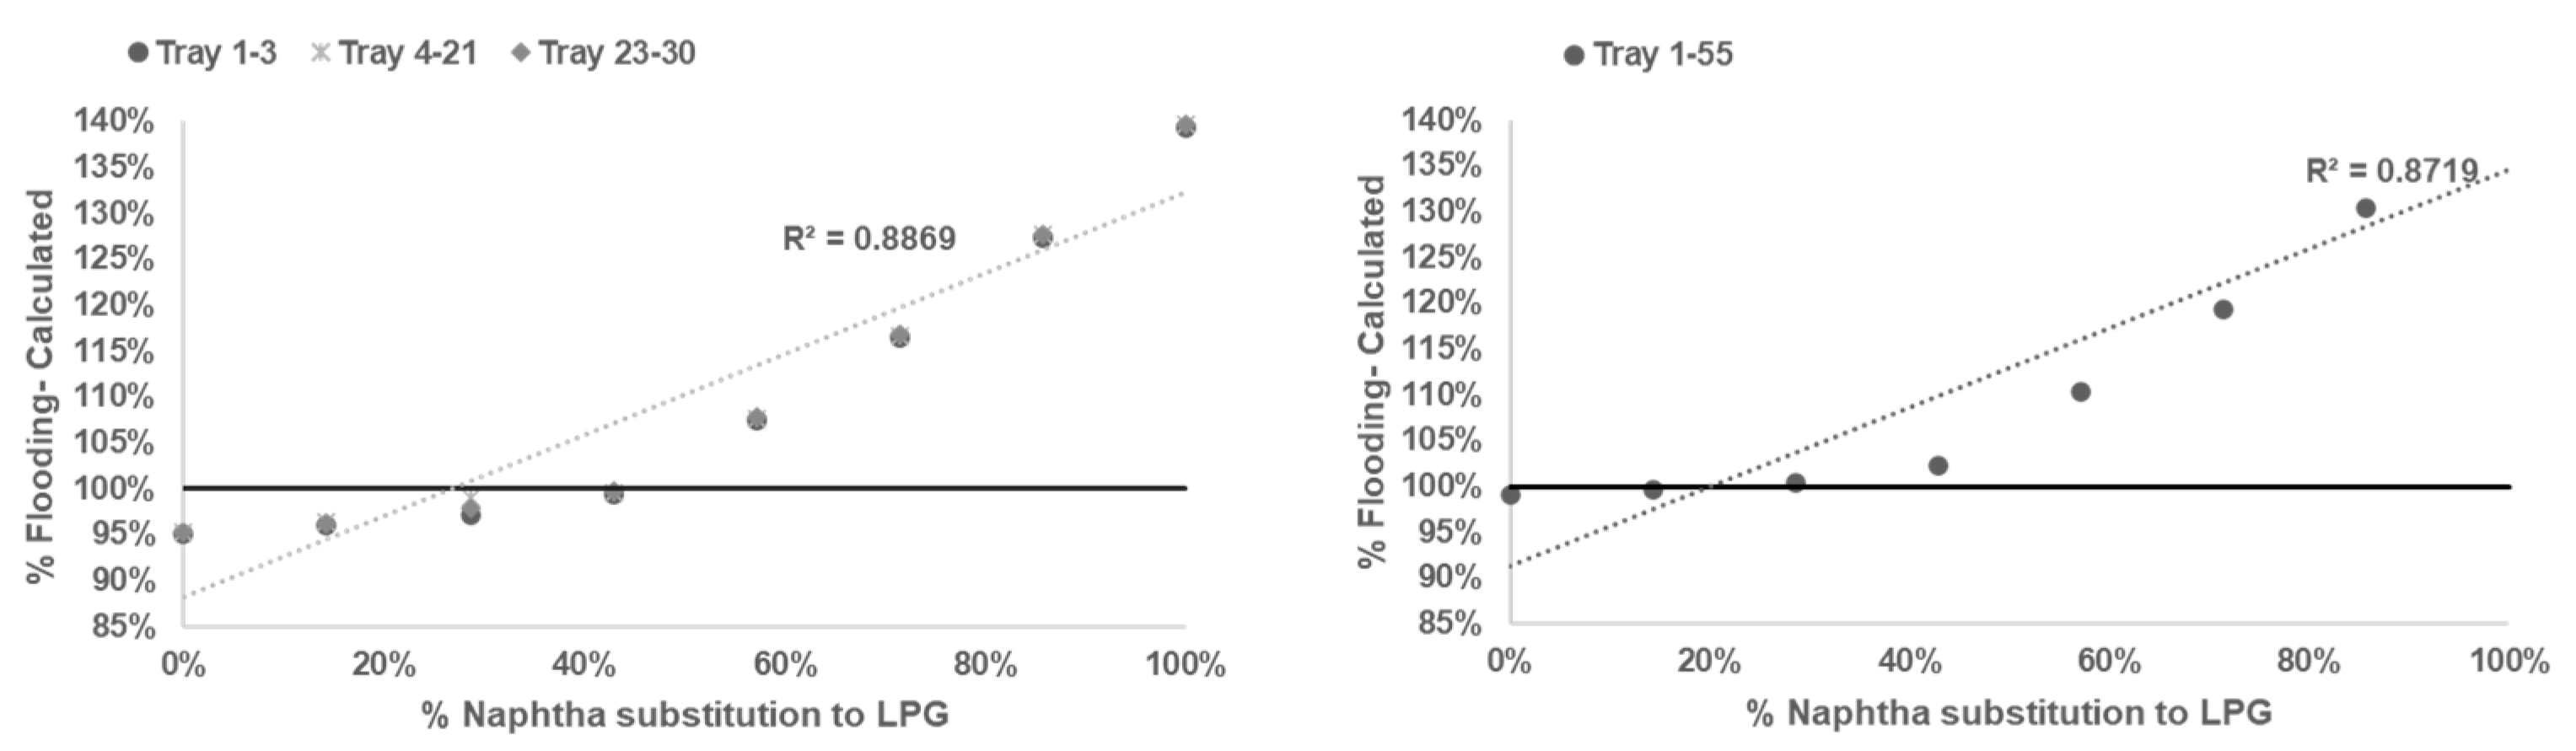
Figure 5.
Parity Plot of % flooding based on Equations (1)–(6) for (a) Propylene Fractionator No 2, (b) Propylene Fractionator No 3, and (c) Debutanizer column with % naphtha substitution to LPG in Table 3. The solid line correspondence to regression result and R squared valued shown graph.
Figure 5.
Parity Plot of % flooding based on Equations (1)–(6) for (a) Propylene Fractionator No 2, (b) Propylene Fractionator No 3, and (c) Debutanizer column with % naphtha substitution to LPG in Table 3. The solid line correspondence to regression result and R squared valued shown graph.
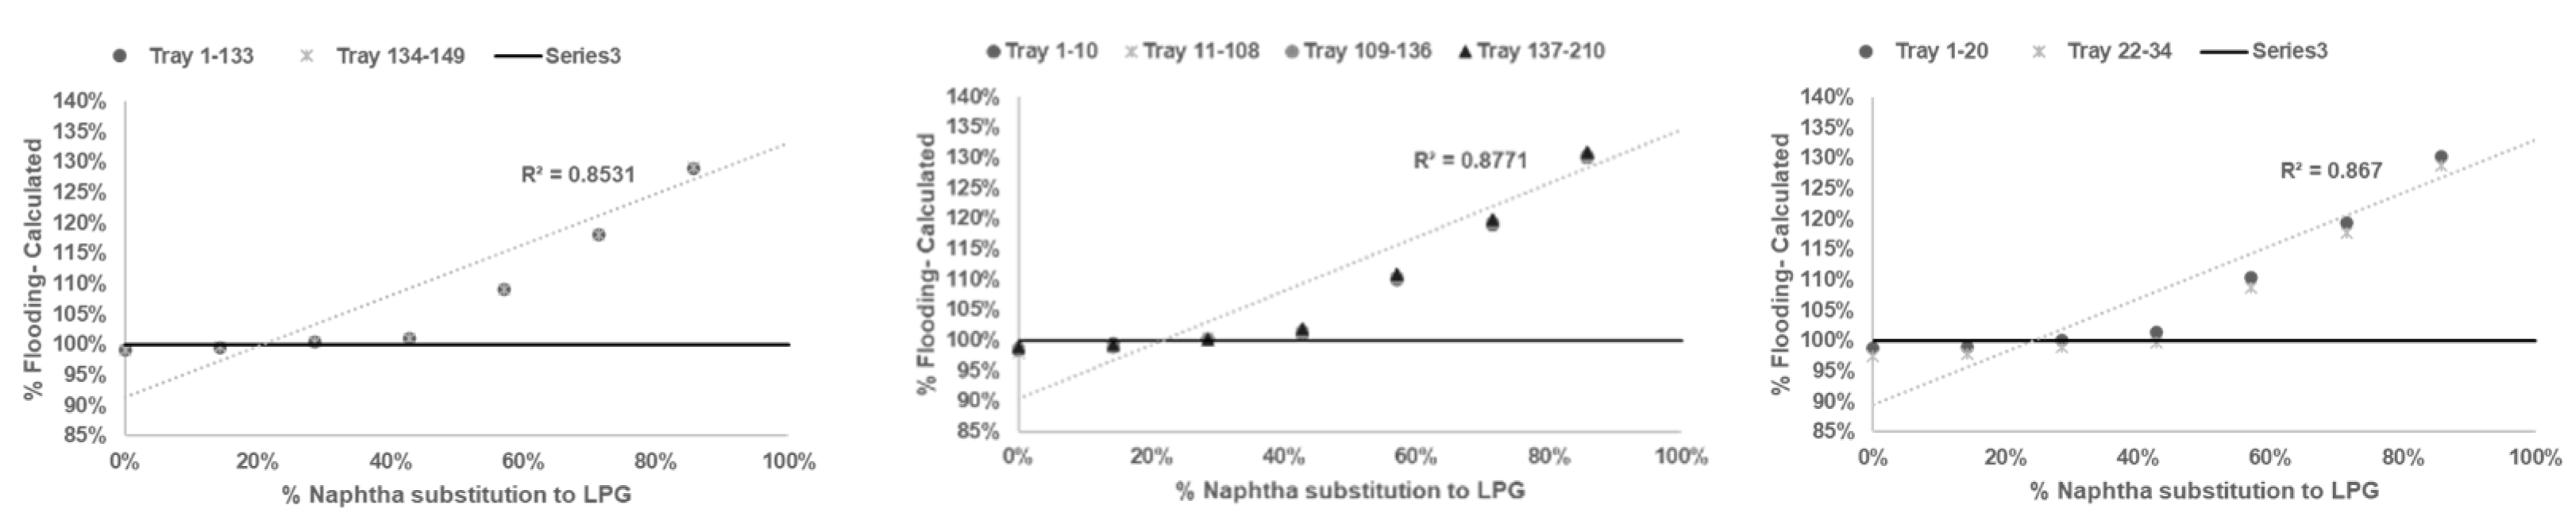

Table 1.
Feed Composition of LPG Feed component correspondence for chemical compound in Naphtha feed based on lab sampling result.
Table 1.
Feed Composition of LPG Feed component correspondence for chemical compound in Naphtha feed based on lab sampling result.
| Number of Carbons | Composition (% wt) | |||
|---|---|---|---|---|
| n- Paraffins | Iso-Paraffins | Naphthalene | Aromatics | |
| 4 | 0.22 | 2.64 | ||
| 5 | 25.22 | 17.94 | 4.19 | |
| 6 | 14.88 | 23.41 | 2.82 | 2.0 |
| 7 | 1.67 | 3.27 | 0.97 | |
| 8 | 0.57 | |||
| Total | 41.99 | 47.83 | 7.01 | 3.17 |
Table 2.
Feed Composition of LPG Feed component correspondence for chemical compound in LPG feed based on lab sampling result.
Table 2.
Feed Composition of LPG Feed component correspondence for chemical compound in LPG feed based on lab sampling result.
| Component | Unit | Specification |
|---|---|---|
| Propane | % w.t | < 1 |
| N-butane | % w.t | >73 |
| Iso-butane | % w.t | <23 |
Table 3.
Flowrate LPG feed as naphtha feed Substitution based on furnace arrangement.
| Number of Furnaces Run with Naphtha Feed | Number of Furnaces Run with LPG Feed | Flowrate of Naphtha (t/h) | Flowrate of LPG (t/h) | % Substitution of LPG to Naphtha |
|---|---|---|---|---|
| 7 | 0 | 252 | 0 | 0.00 |
| 6 | 1 | 216 | 36 | 14.28 |
| 5 | 2 | 180 | 72 | 28.57 |
| 4 | 3 | 144 | 108 | 42.84 |
| 3 | 4 | 108 | 144 | 57.12 |
| 2 | 5 | 72 | 180 | 71.40 |
| 1 | 6 | 36 | 216 | 85.68 |
| 0 | 7 | 0 | 252 | 100.00 |
Table 4.
Cost reference for economic calculation, data taken from plant data year 2022 [4].
Table 4.
Cost reference for economic calculation, data taken from plant data year 2022 [4].
| Description | Unit | Price |
|---|---|---|
| Naphtha | $/ton | 835 |
| LPG | $/ton | 750 |
| Ethylene | $/ton | 1230 |
| Propylene | $/ton | 1310 |
| Mixed C4 | $/ton | 560 |
| Pygas | $/ton | 621 |
| Utilities Cost | $/ton product | 8.9 |
Table 5.
Summary of assesment simulation result in ASPEN Hsys compare with actual plant data, Fluid Package in ASPEN Hsys selected based on guideline of properties in each column under study [10], column Efficiency as trial result by following rule of thumb in distillation column operating [18], and the average absolute percent error (AAPE) to asses the goodness of fit.
| Column | Fluid Package in ASPEN Hysys | Column Efficiency (%) | AAPE (%) |
|---|---|---|---|
| Demethanizer | UNIQUAQ | 72.87 | 0.81 |
| Deethanizer | Peng-Robinson | 74.31 | 0.92 |
| Ethylene Fractionator | Peng-Robinson | 71.92 | 0.77 |
| Depropanizer No.1 | Peng-Robinson | 73.14 | 0.84 |
| Depropanizer No.2 | Peng-Robinson | 73.19 | 0.95 |
| Propylene Fractionator No. 1 | SRK-Twu (Soave-Redlich-Kwong) | 74.15 | 0.88 |
| Propylene Fractionator No.2 | SRK-Twu (Soave-Redlich-Kwong) | 74.92 | 1.12 |
| Propylene Fractionator No.3 | SRK-Twu (Soave-Redlich-Kwong) | 74.08 | 1.13 |
| Debutanizer | Peng-Robinson | 73.12 | 1.15 |
Table 6.
Summary of the goodness of fit using the correlation (Equations (1)–(6)) for % flooding as compared to % naphtha substitution with LPG. The goodness of fit is quantified using root-mean-squared error (RMS). In each distillation column uder study maximum amount of % naphtha substitution with LPG when % flooding hit 100% also presented.
| Column | Maximum Percentage Naphtha Substitution to LPG (%) | RMS |
|---|---|---|
| Demethanizer | 38.47 | 0.94 |
| Deethanizer | 31.14 | 0.90 |
| Ethylene Fractionator | 29.73 | 0.84 |
| Depropanizer No.1 | 27.14 | 0.89 |
| Depropanizer No.2 | 31.25 | 0.89 |
| Propylene Fractionator No. 1 | 23.97 | 0.87 |
| Propylene Fractionator No.2 | 21.14 | 0.85 |
| Propylene Fractionator No.3 | 22.73 | 0.88 |
| Debutanizer | 26.87 | 0.87 |
Table 7.
Data input for economic evaluation as per required for calculating Equation (8), data calculated from validated model with limitation feed flowrate % LPG from Naphtha based on minimization result of Table 6.
Table 7.
Data input for economic evaluation as per required for calculating Equation (8), data calculated from validated model with limitation feed flowrate % LPG from Naphtha based on minimization result of Table 6.
| Data | Unit | Value |
|---|---|---|
| % LPG from Naphtha Max. for Substitution | % | 21.14 |
| Flowrate Naphtha | Ton/ hour | 198.07 |
| Flowrate LPG | Ton/ hour | 53.93 |
| Flowrate Ethylene Product | Ton/ hour | 100.03 |
| Flowrate Propylene Product | Ton/ hour | 55.18 |
| Flowrate Mixed C4′s Product | Ton/ hour | 34.98 |
| Flowrate Pygas Product | Ton/ hour | 25.14 |
Disclaimer/Publisher’s Note: The statements, opinions and data contained in all publications are solely those of the individual author(s) and contributor(s) and not of MDPI and/or the editor(s). MDPI and/or the editor(s) disclaim responsibility for any injury to people or property resulting from any ideas, methods, instructions or products referred to in the content. |
© 2023 by the authors. Licensee MDPI, Basel, Switzerland. This article is an open access article distributed under the terms and conditions of the Creative Commons Attribution (CC BY) license (http://creativecommons.org/licenses/by/4.0/).
Copyright: This open access article is published under a Creative Commons CC BY 4.0 license, which permit the free download, distribution, and reuse, provided that the author and preprint are cited in any reuse.


