
Submitted:
04 May 2023
Posted:
05 May 2023
You are already at the latest version
Abstract
This paper mainly used database technology, machine learning, thermodynamic calculation, experimental verification, etc., on integrated computational materials engineering. The interaction between different alloying elements and the strengthening effect of precipitated phases are investigated mainly for martensitic ageing steels. Modelling and parameter optimization were performed by machine learning, and the highest prediction accuracy was 98.58%. Investigated the influence of composition fluctuation on performance and correlation tests to analyze the influence of elements from multiple perspectives. Furthermore, screen out the three-component composition process parameters with composition and performance with high contrast. Thermodynamic calculations studied the effect of alloying element content on the nano-precipitation phase, Laves phase, and austenite in the material. The heat treatment process parameters of the new steel grade were also developed based on the phase diagram. A new type of martensitic ageing steel was prepared by selected vacuum arc melting. The sample with the highest overall mechanical properties had a yield strength of 1887 MPa, a tensile strength of 1907 MPa, and a hardness of 58 HRC. The sample with the highest plasticity had an elongation of 7.8%. The machine learning process for the accelerated design of new ultra-high tensile steels was found to be generalizable and reliable.
Keywords:
machine learning
; thermodynamic calculations
; martensitic aged steel
; mechanical properties
1. Introduction
Maraging steels are highly interesting due to their ultra-high strength [1,2,3,4,5,6,7], crucial in contemporary frontier technology fields such as aerospace, high-speed trains, deep-sea technology, advanced nuclear energy and clean energy [8,9,10,11,12]. However, the limitations of this material mainly lie in the conflict between strength and plasticity. The current primary ultra-high-strength steels, such as the 18Ni system, inevitably experience a decline in plasticity as strength increases [13,14,15]. Pursuing higher overall mechanical properties has been a forward-looking breakthrough direction for the future of ultra-high strength steels worldwide. With the increasing demand for lighter materials, designing and developing a new generation of ultra-high strength steels with good plasticity is urgent to achieve a breakthrough in comprehensive mechanical properties [16,17,18,19,20].
The traditional methods for strengthening martensitic steels mainly include process and composition optimization [21,22,23,24,25,26]. In process optimization, the diversity of ageing processes can significantly affect the material. For composition optimization, the influence of multiple elements on the organization and properties has been widely studied. For example, Liu et al. [27] introduced nanoscale precipitation phases (M2C, Laves phase, α’Cr) and ductile reverse-transformation austenite by double ageing treatment and ultra-high-strength stainless steels with good plasticity and toughness were obtained by this method. Lv et al. [28] significantly reduced the content of precious elements such as molybdenum and eliminated expensive alloying elements such as cobalt and titanium, replacing them with familiar and affordable elements such as aluminium and carbon to accomplish composition optimization. In the process optimization, martensitic ageing steels with tensile strengths exceeding 2000 MPa were obtained by hot stamping and forming. Wang et al. [29] used Al instead of Co and Ti to form reinforcing precipitates and optimized the ageing process scheme to obtain the nano-precipitation phase Ni(Fe, Al) and refine the NbC precipitation phase. This resulted in Ni(Fe, Al) martensitic aged steel with a tensile strength of 2100 MPa and maintained a fracture elongation of 9.31%. He et al. [30] obtained higher strengths by increasing the content of Co and Mo while keeping the Ti content extremely low to maintain the toughness. The tensile strength was 2800 MPa, and fracture toughness was 30 MPa·m1/2 after adjusting the alloying elements and the corresponding heat treatment.
Integrated computational materials engineering is a design development approach that integrates multi-scale computational simulations and key experiments [31,32,33]. Compared to traditional experimental investigations, this process is a significant step in developing new materials from a traditional empirical approach to a scientific design approach. As a result, the development of materials can be significantly accelerated, and the cost of development can be reduced. For example, G.B. Olson’s group at Northwestern University has developed a modelling technique to fabricate Ferrium S53 through integrated materials computational engineering design. The design threshold of tensile strength of this material has reached 280ksi and has been successfully applied to the landing gear of the US Air Force. This event demonstrated the feasibility of integrated materials computational engineering design [34]. Qiao et al. [35] constructed a combination-structure-property model containing physical features. A new Fe2.5Ni2.5CrAl MPEA was designed and synthesized using machine learning. Azimi et al. [36] proposed a deep learning method for microstructure classification in the example of specific microstructural compositions of mild steel. However, most current research on maraging steels has focused on a single variable for a particular grade [37]. Literature-based datasets and multi-algorithmic machine-learning modelling methods have yet to be devised. Therefore, accelerating the design of new grades of maraging steels from an integrated computational perspective is an urgent problem.
This study first established a quantitative prediction model for martensitic ultra-high-strength steels to solve the problem of designing martensitic steel composition-process properties. The effect of composition fluctuations on the performance of martensitic steels is investigated by machine learning. The screened compositions were also subjected to thermodynamic calculations, Analysis of elemental influences, and process parameters. After experimental preparation and characterization, the model’s accuracy was verified to provide a database for the design of new steel grades and subsequent studies.
2. Materials and Methods
In this paper, a primary database of martensitic ultra-high strength steels was developed and optimized by extracting experimental data from 586 papers. The database consists of 410 data sets and 20 dimensions and contains 16 sets of the component process independent variables and four sets of performance dependent variables. The programming language used is Python, and the compiler is Jupiter. Particle Swarm Optimization (PSO) was used for hyperparameter optimization. The four machine learning algorithms selected were Random Forest (RF), Support Vector Regression (SVR), Gradient Boosted Regression (GBR) and Bagging. Regression prediction and composition optimization of tensile strength, yield strength, elongation and hardness of martensitic aged steel were performed. Thermo-Calc software was used for phase diagramming and investigation of the influence of composition fluctuations for the screened components, and the database selected was TCFE10.
The experimental samples were prepared by vacuum arc melting in a water-cooled copper crucible under an argon atmosphere. To ensure elemental homogeneity, ingots weighing about 100 g were remelted in a vacuum electric arc furnace at least eight times. The ingots were also cast into 150 mm × 15 mm × 15 mm rectangles using the copper mould inverted casting technique. The tests were performed using an X-ray diffractometer (XRD; Rigaku D/max-2500 PC) with a scanning angle of 10° to 90° (monochromatic copper kα radiation, 2 Theta). Uniaxial tensile tests were performed using an electronic universal testing machine (Intaton 5582) with a strain rate of 1 × 10⁻³s−1. The microstructure and chemical composition of the polished and electrolytically etched samples were analyzed using a scanning electron microscope (SEM, Thermo Scientific Apreo 2).
3. Results
3.1. Machine learning
Figure 1 shows an overview of the spatial distribution of the data set in the composition of the three elements Ti, Ni, and Mo. The colour and size of each data point represent the tensile strength value corresponding to that composition. From this figure, it can be seen that the overall tensile strength shows an increasing trend with the increase of Ni content. In addition, the data set is somewhat poorly dispersed since most of the research has been focused on a few grades of steel. Therefore, the magnitude of compositional changes is limited, and the data points are concentrated. In this model, there are 12 groups of compositional independent variables. They are Ni, Co, Mo, Ti, Al, Cr, W, Cu, Nb, C, Si and Mn. There are four groups of process variables. They are solid solution temperature, solid solution time, ageing temperature and ageing time, respectively. The model is challenging to consider comprehensively because of the many factors affecting the properties in real situations. The prediction results are difficult to achieve complete accuracy.
Figure 2 shows the regression analysis of the training effects of the four algorithms, RF, SVR, GBR and BR. To quantitatively assess the accuracy of each model for the subsequent design of new steel types, R2 and RSME were calculated for each data point, as shown in the top left corner of each small plot in Figure 2. Generally speaking, the closer the R2 value is to 1, the better the fit is. Of the four algorithms, the GBR algorithm has the highest R2 of 98.58% for the hardness model. Its RSME is 0.78. Compared with the other algorithms, the GBR algorithm has the highest R2 for all of them, so the model has a significant advantage in designing new steel grades for maraging steel, with the best generalisation capability and the highest prediction accuracy. The model will also be used in subsequent predictions for the whole composition space and the effect of composition fluctuations on performance analysis.
Figure 3 shows the residual plots and regression fitting curves for the four algorithms for 16 models. Based on the regression fitting curves for the random errors, it can be seen that of the four algorithms, the GBR algorithm has residuals that are most normally distributed. Most of the sample data are concentrated around the mean and are in the overall majority. The distribution of the residuals of the other algorithms does not conform to a normal distribution enough, such as the SVR algorithm in Figure 3b and the RF and BR algorithms in Figure 3c. The residuals need to obey a normal distribution. Therefore, these three models are not ideal enough for fitting the mechanical properties of maraging steel. Compared to the other algorithms, the GBR algorithm, although more time-consuming, is more suitable for application to complex non-linear problems and can achieve optimum accuracy and generalisation capability.
Figure 4 shows the predicted trend of element-property effects. It mainly includes the predicted trends of the effects of Ni-Mo, Co-Cr, and Ti-Nb on tensile strength and elongation. From Figure 4a,d, it can be seen that with the increase of Ni content, there is a significant increase in tensile strength, but the change of elongation is not apparent; with the increase of Mo content, the rise of tensile strength is not high, but the elongation decreases significantly. The analysis of Figure 4b,e shows that the tensile strength decreases slightly with the increase of Co and Cr content, but generally, they are above 2100 MPa. The effect of Co content on the increase of elongation is less obvious, and the trend of elongation decreases and then increases with the increase of Cr content. The specific influence trend needs to be analyzed subsequently concerning the correlation coefficients. For Figure 4c,f, it can be seen that the tensile strength gradually increases, and the elongation decreases significantly with the increase of Ti content, while the Nb content is not sensitive to the elongation.
Table 1 shows the correlation test results for the four mechanical properties. The table selects the five factors with the highest absolute correlation value to the mechanical properties for display. In terms of yield strength and tensile strength combined, the elements positively correlated with the strength of the maraging steel are Ni, Mo, Co, and Ti, and negatively correlated with the strength are Cr, Cu, and Nb. The results of this correlation coefficient calculation are only affected by the maraging steel data set in this paper, and if the physical and process conditions change under other conditions, the role of the elements will also change. The correlation test results for hardness are similar to those for strength, and the elements with the highest correlations are Mo and Co elements, both of which have positive correlations. In contrast, Cr, Nb and Cu play a role in reducing hardness. Slightly different from hardness and strength, among the top five elements with absolute values of correlation coefficients, only the Cr element is positively correlated with elongation, while Mo, Co, Ni and Ti are all negatively correlated.
Table 2 shows the three sets of compositions with high-performance differences after being screened by machine learning modelling. The purpose of screening these three sets of compositions is mainly twofold. First, since there are 16 groups of independent variables in the original model, it is difficult to distinguish the specific factors causing the performance differences if all 16 variables are set to change simultaneously. In addition, since there are fewer studies on additional elements such as Cu and Nb in practical work, the collected data could be more reliable in the model. Therefore, in this paper, only five elements commonly found in martensitic ageing steels, Ni, Co, Mo, Ti and Al, were selected and screened for combinations with significantly different compositional and performance gradients. This aims to investigate better the effect of elements on properties and the accuracy of the machine learning model. The foundation for future model optimization and multi-element experimental investigations is laid.
3.2. Thermodynamic Calculations
Figure 5 analyzes the impacts of the changes in the content of Ni, Mo, and Ti on austenite, laves phase, and Ni3Ti. From Figure 5a, it can be seen that the austenite content tends to increase until 700 °C as the Ni content rises. It shows a decreasing trend after about 1350 °C, but the difference is less noticeable. For the analysis of the Laves phase and Ni3Ti phase content, as the Ni content gradually increases, the Laves phase and Ni3Ti phase appear at a lower temperature, and the content gradually decreases. From Figure 5b, it can be seen that the change of the austenite phase is not evident with the increase of Mo content; the Laves phase increases with the increase of Mo content and the appearance temperature increases; the appearance temperature of Ni3Ti phase decreases. From Figure 5c, it can be seen that the austenite amount decreases significantly as the Ti content increases; the Laves phase and Ni3Ti content increase significantly and the emergence temperature increases significantly.
In order to design process parameters for the screened three-component compositions, the Thermo-calc software was used in this paper to calculate the phase diagrams of samples 1-3 at 500-1500 °C, as shown in Figure 6. The composition in Figure 6b has the highest Ni3Ti precipitated phase content, about 10% at 500 °C. The lowest Ni3Ti content is in the composition corresponding to Figure 6c—all the precipitated phases dissolved above 800 °C. In order to dissolve the precipitated phases and keep the grains from growing drastically, the solid solution process was set to 820 °C for one h and oil cooling. The ageing process was set to 480 °C for three hours and air-cooled by combining the machine learning parameter prediction, phase diagram and reference to the conventional martensitic ageing process. In order to improve the strength of the material and inhibit grain growth, the material is deep cooled in the middle of the solid solution and ageing steps, which is -73 °C liquid nitrogen treatment for one hour + air cooling.
Figure 7 shows the tensile test graphs of the three sets of samples. From Figure 7a, it can be seen that the highest elongation of 7.82% was obtained for sample No. 1, 5.86% for sample No. 2, and 1.12% for sample No. 3. This coincides with the analysis from Figure 4 and Table 2. The elongation decreases significantly as the Mo content increases. The highest tensile strength among the three groups of samples was sample No. 3, which also had the highest Mo and Ni content. This coincides with the previous analysis of the effect of Mo and Ni elements.
Table 3 shows the list of actual compositions and actual values of mechanical properties. Among the three groups of samples, the highest hardness was found in sample No. 2, with a value of 58.7 HRC, which confirms the positive correlation between Mo and Co content and hardness in the correlation analysis. Comparing the predicted values with the actual values in Table 3 and Table 2, it can be seen that the errors in terms of tensile strength, yield strength and hardness are less than 10%. In terms of elongation, the error between the two is very high. This result is due to the addition of the deep cooling step compared to the solid solution + ageing process in the data set. This step leads to grain refinement, increases strength, and reduces the material’s plasticity. To conclude, the machine learning model in this paper is generally consistent with the actual situation and has some generalization capability and accuracy.
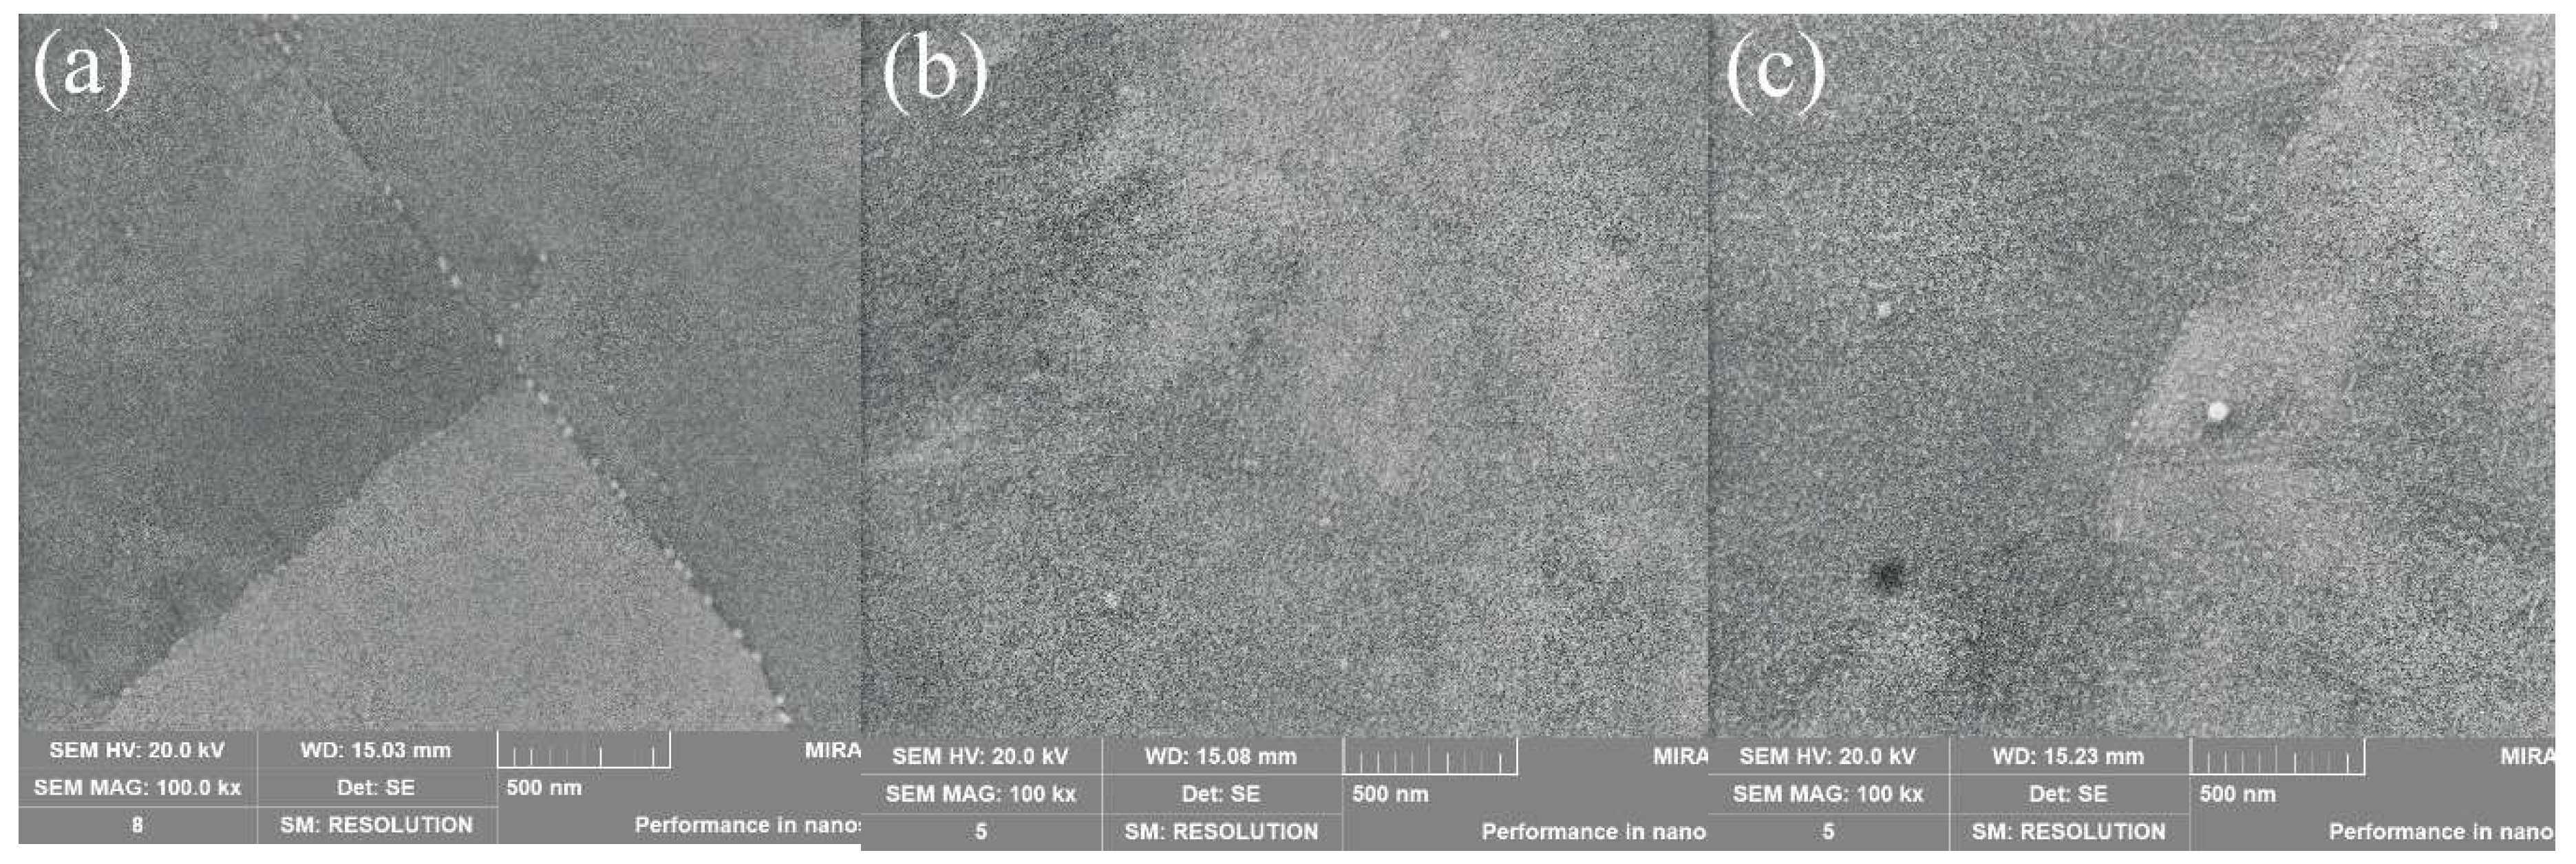
Figure 8 shows the surface SEM images of the samples. Overall the surface of these samples is almost free of defects. In Figure 8a, the dark grey matrix is the martensitic phase with fine white Ni3Ti nanophases uniformly distributed on the grain boundaries. Compared with Figure 8a, the nanoscale Ni3Ti particle phase in Figure 8b is distributed within the grain, whereas the nanophase in Figure 8c is distributed at the grain boundaries as well as within the grain. This phenomenon explains the reason why sample No. 3 possesses the highest hardness. When the nanophase is present at the grain boundary and inside the grain, the strengthening effect occurs in the grain itself, at the interface between the matrix phase and the precipitated phase, and between the matrix phases. So that Sample No. 3 is less prone to deformation and damage when subjected to the pressure of the indenter.
Figure 9 shows the fracture morphology of the prepared samples. Figure 9a,b show microporous aggregation-type fractures, and Figure 9c shows quasi-dissolution fractures or brittle fractures. In Figure 9a, the micropore size is more prominent and more profound, and the dimples pattern is evident. In contrast, Figure 9b also has a more apparent dimples pattern, but the micropore size is smaller and dense, and the micropores are shallow. Therefore, it can be presumed that the toughness of Figure 9b is less than that of the sample in Figure 9a. In Figure 9c, it can be seen that the fracture mode of this sample is a brittle fracture, and the primary fracture mechanism is a mixed fracture mode of transgranular fracture and intergranular fracture. The river-like pattern of transgranular fracture and the grain pull-out trace of along-crystal fracture can be seen in the figure. Therefore, it can be speculated that this sample has the highest strength and lowest plasticity among the three samples. Combined with Table 3, it can be seen that the speculation entirely agrees with reality.
In summary, the mechanical properties of the samples prepared in this paper are in substantial agreement with the results predicted by the machine learning model, while the analysis for this model also explains the effect of each element on the properties. This process of multi-algorithm modelling, composition screening, discussion of influencing factors, thermodynamic calculations, and experimental validation is accurate and repeatable. Additional elemental influences can be explored for maraging steels based on this study, and descriptors can be incorporated to improve the generalizability and accuracy of the models. It can even be used to develop other new steel grades with considerable development potential.
4. Discussion
(1) The GBR algorithm has the highest prediction accuracy, with R2 of 96.78%, 97.92%, 98.46% and 98.58% for yield strength, tensile strength, elongation and hardness, respectively. The correlation coefficients and three-dimensional prediction diagrams showed that Ni, Mo, Ti and Co elements were positively correlated with the strength and negatively correlated with the elongation of the maraging steel; among them, Mo and Co positively affected the hardness.
(2) Thermodynamic calculations show that with the increase of Ni and Mo content, the temperature of the Ni3Ti precipitation phase decreases, and the content gradually decreases; with the increase of Ti content, the equilibrium temperature and content of Ni3Ti precipitation phase show an increasing trend.
(3) The matrix organization of the samples after ageing is martensite. The martensitic grain boundaries and intercrystalline fine dispersed nanoscale particles precipitation phase are mainly composed of Ni3Ti. The fracture mechanism of the samples with higher plasticity is mainly microporous polymerization fracture, while the samples with lower plasticity are mainly composed of quasi-cleavage or brittle fracture.
(4) The experimentally prepared 17Ni-12.5Co-5Mo-0.1Ti new martensitic aged steel has a tensile strength of 1907MPa, an elongation of 1.12%, and a hardness of 58 HRC. The error between this and the predicted result is within 10%, which verifies the model’s accuracy and provides a research idea with high generalization capability and high efficiency for machine learning to accelerate the design of new ultra-high-strength steels.
Author Contributions
Conceptualization, J.Z. and G.L.; methodology, S.C.; software, Y.L.; validation, S.C., G.L. and Y.F.; formal analysis, T.S.; investigation, S.C.; resources, J.Z.; data curation, S.C.; writing—original draft preparation, S.X. Chen; writing—review and editing, J.Z. and G.L.; visualization, S.C.; supervision, Y.L. and Y.F.; project administration, J.Z.; funding acquisition, J.Z. and G.Q. Liu. All authors have read and agreed to the published version of the manuscript.
Funding
This research was funded by China Scholarship Council.
Data Availability Statement
Restrictions apply to the availability of these data. Data was obtained from Shixing Chen and are available with the permission of Shixing Chen.
Conflicts of Interest
The authors declare no conflict of interest.
References
- Zeisl, S.; Landefeld, A.; Steenberge, N.V.; Chang, Y.; et al. The role of alloying elements in NiAl and Ni3Ti strengthened Co-free maraging steels. Materials Science and Engineering: A 2022, 861, 144313. [Google Scholar] [CrossRef]
- Pinson, M.; Das, S.M.; Springer, H.; et al. The addition of aluminum to brittle martensitic steels in order to increase ductility by forming a grain boundary ferritic microfilm. Scripta Materialia 2022, 231, 114606–114606. [Google Scholar] [CrossRef]
- Ma, Y.X.; Gao, Y.F.; Zhao, L.; Li, D.L.; et al. Optimization of Process Parameters and Analysis of Microstructure and Properties of 18Ni300 by Selective Laser Melting. Materials 2022, 15, 4757. [Google Scholar] [CrossRef] [PubMed]
- Manigandan, K.; Srivatsan, T.S.; Tammana, D.; et al. Influence of microstructure on strain controlled fatigue and fracture behavior of ultra-high strength alloy steel AerMet100. Materials Science and Engineering A 2014, 601, 29–39. [Google Scholar] [CrossRef]
- He, Y.; Su, G.Y.; Qu, W.S.; et al. Grain size and its effect on tensile property of ultra-purified 18Ni maraging steel. Acta Metallurgica Sinica Chinese Edition 2002, 38, 53–57. [Google Scholar] [CrossRef]
- Ravitej, S.V.; Madhav, M.; MohanBabu, K. Review paper on optimization of process parameters in turning Custom 465® precipitation hardened stainless steel. Materials Today: Proceedings 5.1 2018, 2787–2794. [Google Scholar] [CrossRef]
- Jiang, S.; Wang, H.; Wu, Y.; et al. Ultrastrong steel via minimal lattice misfit and high density nanoprecipitation. Nature 2017, 544, 460–464. [Google Scholar] [CrossRef]
- Kumar, N.; Ramesha, C.M.; Anilkumar, T.; et al. Comparative Studies on Medium Carbon Low Alloy Steels and Maraging Steels. Applied Mechanics and Materials 2021, 903, 17–26. [Google Scholar] [CrossRef]
- Santos, P.; Avila, J.A.; Fonseca, E.; et al. Plane-strain fracture toughness of thin additively manufactured maraging steel samples. Additive Manufacturing 2022, 49, 102509. [Google Scholar] [CrossRef]
- Gope, D.K.; Kumar, P.; Chattopadhyaya, S.; Wuriti, G.; Thomas, T. An investigation into microstructure and mechanical properties of maraging steel weldment. IOP Conference Series: Materials Science and Engineering 2021, 1104, 012014. [Google Scholar] [CrossRef]
- Sinha, P.P.; Tharian, T.; Sivakumar, D.; et al. Effects of solution treatment temperatures on microstructure, tensile and fracture properties of Co-free 18Ni maraging steel. Steel Research 2016, 65, 494–499. [Google Scholar] [CrossRef]
- Kempen, K.; Yasa, E.; Thijs, L.; et al. Microstructure and mechanical properties of Selective Laser Melted 18Ni-300 steel. Physics Procedia 2011, 12, 255–263. [Google Scholar] [CrossRef]
- Gil, J.; Seca, R.; Amaral, R.; et al. 18Ni300 Maraging Steel Produced via Direct Energy Deposition on H13 Tool Steel and DIN CK45. Key Engineering Materials 2022, 926, 194–205. [Google Scholar] [CrossRef]
- Strakosova, A.; Pra, F.; Michalcová, A.; et al. Structure and Mechanical Properties of the 18Ni300 Maraging Steel Produced by Spark Plasma Sintering. Metals-Open Access Metallurgy Journal 2021, 11, 748. [Google Scholar] [CrossRef]
- Conde, F.F.; Avila, J.A.; Oliveira, J.P.; et al. Effect of the as-built microstructure on the martensite to austenite transformation in a 18Ni maraging steel after laser-based powder bed fusion. Additive Manufacturing 2021, 46, 102122. [Google Scholar] [CrossRef]
- Niu, M.C.; Yin, L.C.; Yang, K.; et al. Synergistic alloying effects on nanoscale precipitation and mechanical properties of ultrahigh-strength steels strengthened by Ni3Ti, Mo-enriched, and Cr-rich co-precipitates. Acta Materialia 2021, 209, 116788. [Google Scholar] [CrossRef]
- Riccardo, C.; Jannis, L.; Ausonio, T.; et al. Aging Behaviour and Mechanical Performance of 18-Ni 300 Steel Processed by Selective Laser Melting. Metals-Open Access Metallurgy Journal 2016, 6, 218. [Google Scholar] [CrossRef]
- Jiao, Z.B.; Luan, J.H.; Miller, M.K.; et al. Precipitation mechanism and mechanical properties of an ultra-high strength steel hardened by nanoscale Ni-Al and Cu particles. Acta Materialia 2015, 97, 58–67. [Google Scholar] [CrossRef]
- Sliva, A.K.; Filhol, I.R.; Lu, W.; et al. A sustainable ultra-high strength Fe18Mn3Ti maraging steel through controlled solute segregation and α-Mn nanoprecipitation. Nature Communications 2022, 13, 2330. [Google Scholar] [CrossRef]
- Zhang, F.C.; Wang, T.S.; Zhang, P.; et al. A novel method for the development of a low temperature bainitic microstructure in the surface layer of low carbon steel. Scripta Materialia 2008, 59, 294–296. [Google Scholar] [CrossRef]
- Chen, F.R.; Huo, L.X.; Zhang, Y.F.; et al. Effects of electron beam local post weld heat treatment on the microstructure and properties of 30CrMnSiNi2A steel welded joints. Journal of Materials Processing Technology 2002, 129, 412–417. [Google Scholar] [CrossRef]
- Luo, H.W.; Shen, G.H. Progress and perspective of ultra-high strength steels having high toughness. Acta Metall Sin 2019, 56.4, 494–512. [Google Scholar] [CrossRef]
- Raabe, D.; Ponge, D.; Dmitrieva, O.; et al. Nanoprecipitate hardened 1.5 GPa steels with unexpected high ductility. Scripta Materialia 2009, 60, 1141–1144. [Google Scholar] [CrossRef]
- Lee, H.; Jo, M.C.; Sohn, S.S.; et al. Novel medium-Mn (austenite + martensite) duplex hot-rolled steel achieving 1.6 GPa strength with 20 % ductility by Mn-segregation-induced TRIP mechanism. Acta Materialia 2018, 147, 247–260. [Google Scholar] [CrossRef]
- Grassel, O.; Krüger, L.; Frommeyer, G.; et al. High strength Fe-Mn-(Al, Si) TRIP/TWIP steels development properties application. International Journal of Plasticity 2000, 16, 1391–1409. [Google Scholar] [CrossRef]
- Liu, L.; Yu, Q.; Wang, Z.; et al. Making ultrastrong steel tough by grain boundary delamination. Science 2020, 368, 1347–1352. [Google Scholar] [CrossRef]
- Liu, Z.B.; Yang, Z.; Wang, X.H.; et al. Enhanced strength-ductility synergy in a new 2.2 GPa grade ultra-high strength stainless steel with balanced fracture toughness: elucidating the role of duplex aging treatment. Journal of Alloys and Compounds 2022, 928, 167135. [Google Scholar] [CrossRef]
- Jiang, S.; Wang, H.; Wu, Y.; et al. Ultrastrong steel via minimal lattice misfit and high-density nanoprecipitation. Nature 2017, 544, 460–464. [Google Scholar] [CrossRef]
- Wang, S.; Zhao, T.; Liu, Z.; et al. Exploration of the processing scheme of a novel Ni (Fe, Al) maraging steel. Journal of Materials Research and Technology 2020, 10, 225–239. [Google Scholar] [CrossRef]
- He, Y.; Yang, K.; Qu, W.; et al. Strengthening and toughening of a 2800 MPa grade maraging steel. Materials Letters 2002, 56, 763–769. [Google Scholar] [CrossRef]
- Vernerey, F.; Liu, W.K.; Moran, B.; et al. Multi-length scale micromorphic process zone model. Computational Mechanics 2009, 44, 433–445. [Google Scholar] [CrossRef]
- Wang, Z.L.; Adachi, Y. Property prediction and properties-to-microstructure inverse analysis of steels by a machine-learning approach. Materials Science and Engineering A 2019, 744, 661–670. [Google Scholar] [CrossRef]
- Liu, R.Q.; Kumar, K.; Cheng, Z.Z.; et al. A predictive machine learning approach for microstructure optimization and materials design. Scientific Report 2015, 5, 11551. [Google Scholar] [CrossRef]
- Kuehmann, C.J.; Olson, G.B. Computational materials design and engineering. Maney Publishing 2009, 25, 472–478. [Google Scholar] [CrossRef]
- Qiao, L.; Ramanujan, R.V.; Zhu, J.C. Machine learning discovery of a new cobalt free multi-principal-element alloy with excellent mechanical properties. Materials Science and Engineering: A 2022, 845, 143198. [Google Scholar] [CrossRef]
- Azimi, S.M.; Britz, D.; Engstler, M.; et al. Advanced Steel Microstructural Classification by Deep Learning Methods. Scientific Report 2018, 8, 2128. [Google Scholar] [CrossRef]
- Wang, J.; Di, X.; Li, C.; et al. The Influence of Ni on Bainite/Martensite Transformation and Mechanical Properties of Deposited Metals Obtained from Metal-Cored Wire. Metals 2021, 11, 1971. [Google Scholar] [CrossRef]
Figure 1.
Overview of the spatial distribution of the data set.
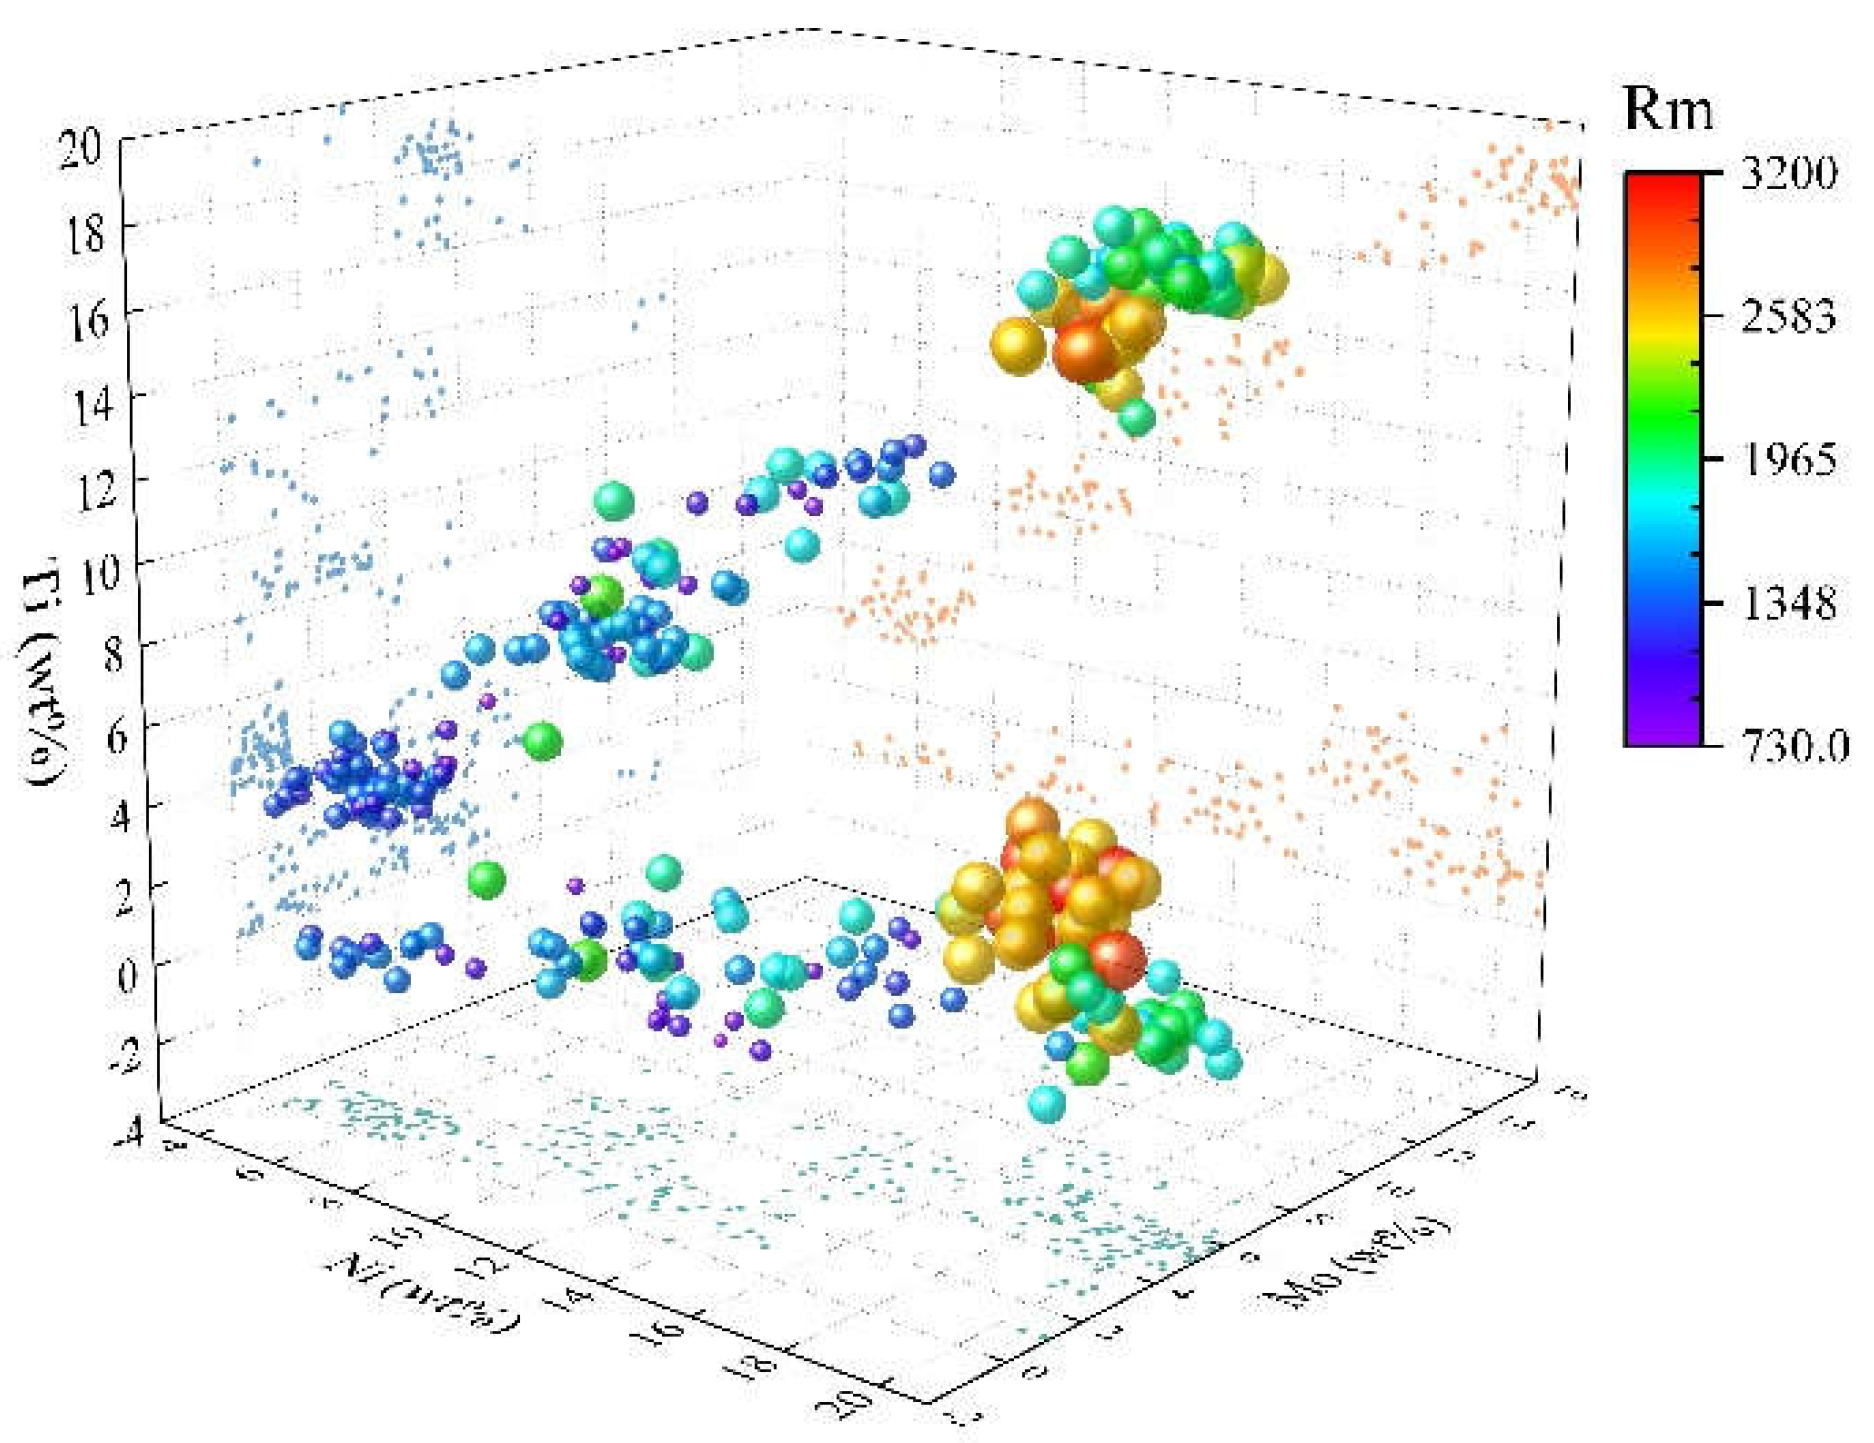
Figure 2.
The regression analysis of the four algorithms’ training effects, RF, SVR, GBR and BR. (a) Rp; (b) Rm; (c) A; (d) Hv.
Figure 2.
The regression analysis of the four algorithms’ training effects, RF, SVR, GBR and BR. (a) Rp; (b) Rm; (c) A; (d) Hv.
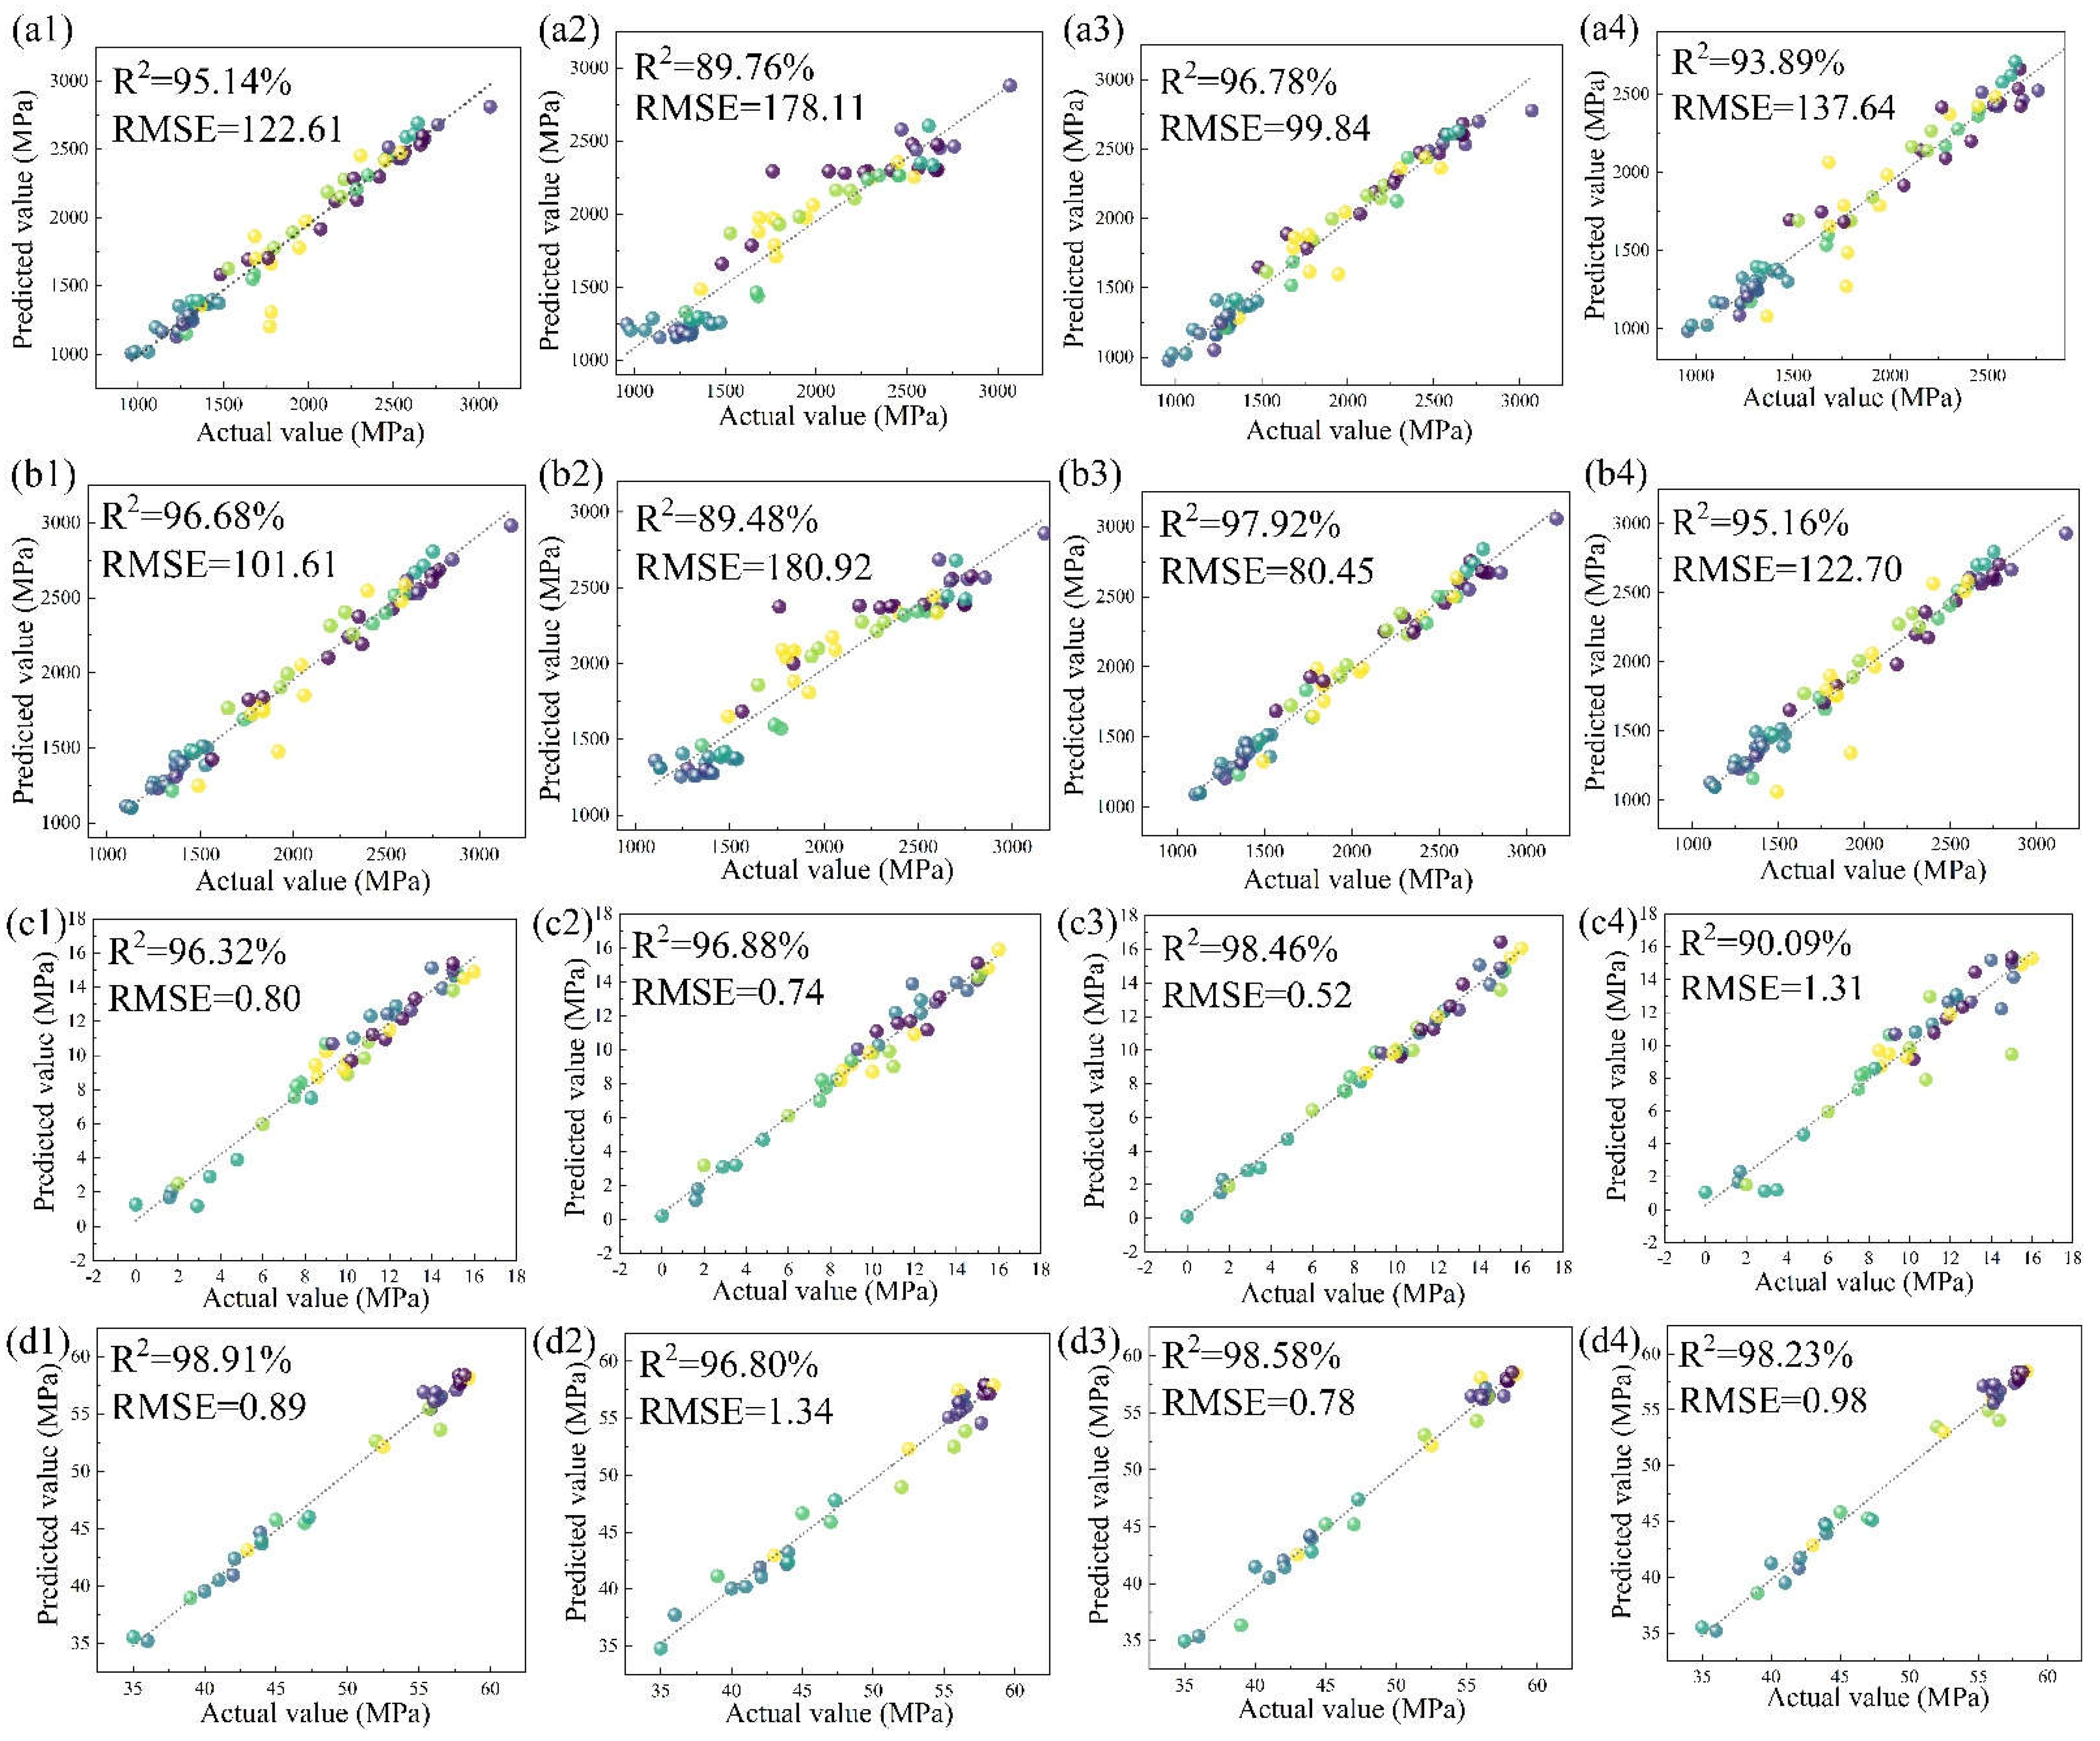
Figure 3.
Residual Regression Fitting of Four Algorithms. (a) Rp; (b) Rm; (c) A; (d) Hv.

Figure 4.
Element-performance impact trend Prediction Chart. (a) Ni-Mo-Rm; (b) Co-Cr-Rm; (c) Ti-Nb-Rm; (d) Ni-Mo-A; (e) Co-Cr-A; (f) Ti-Nb-A.
Figure 4.
Element-performance impact trend Prediction Chart. (a) Ni-Mo-Rm; (b) Co-Cr-Rm; (c) Ti-Nb-Rm; (d) Ni-Mo-A; (e) Co-Cr-A; (f) Ti-Nb-A.
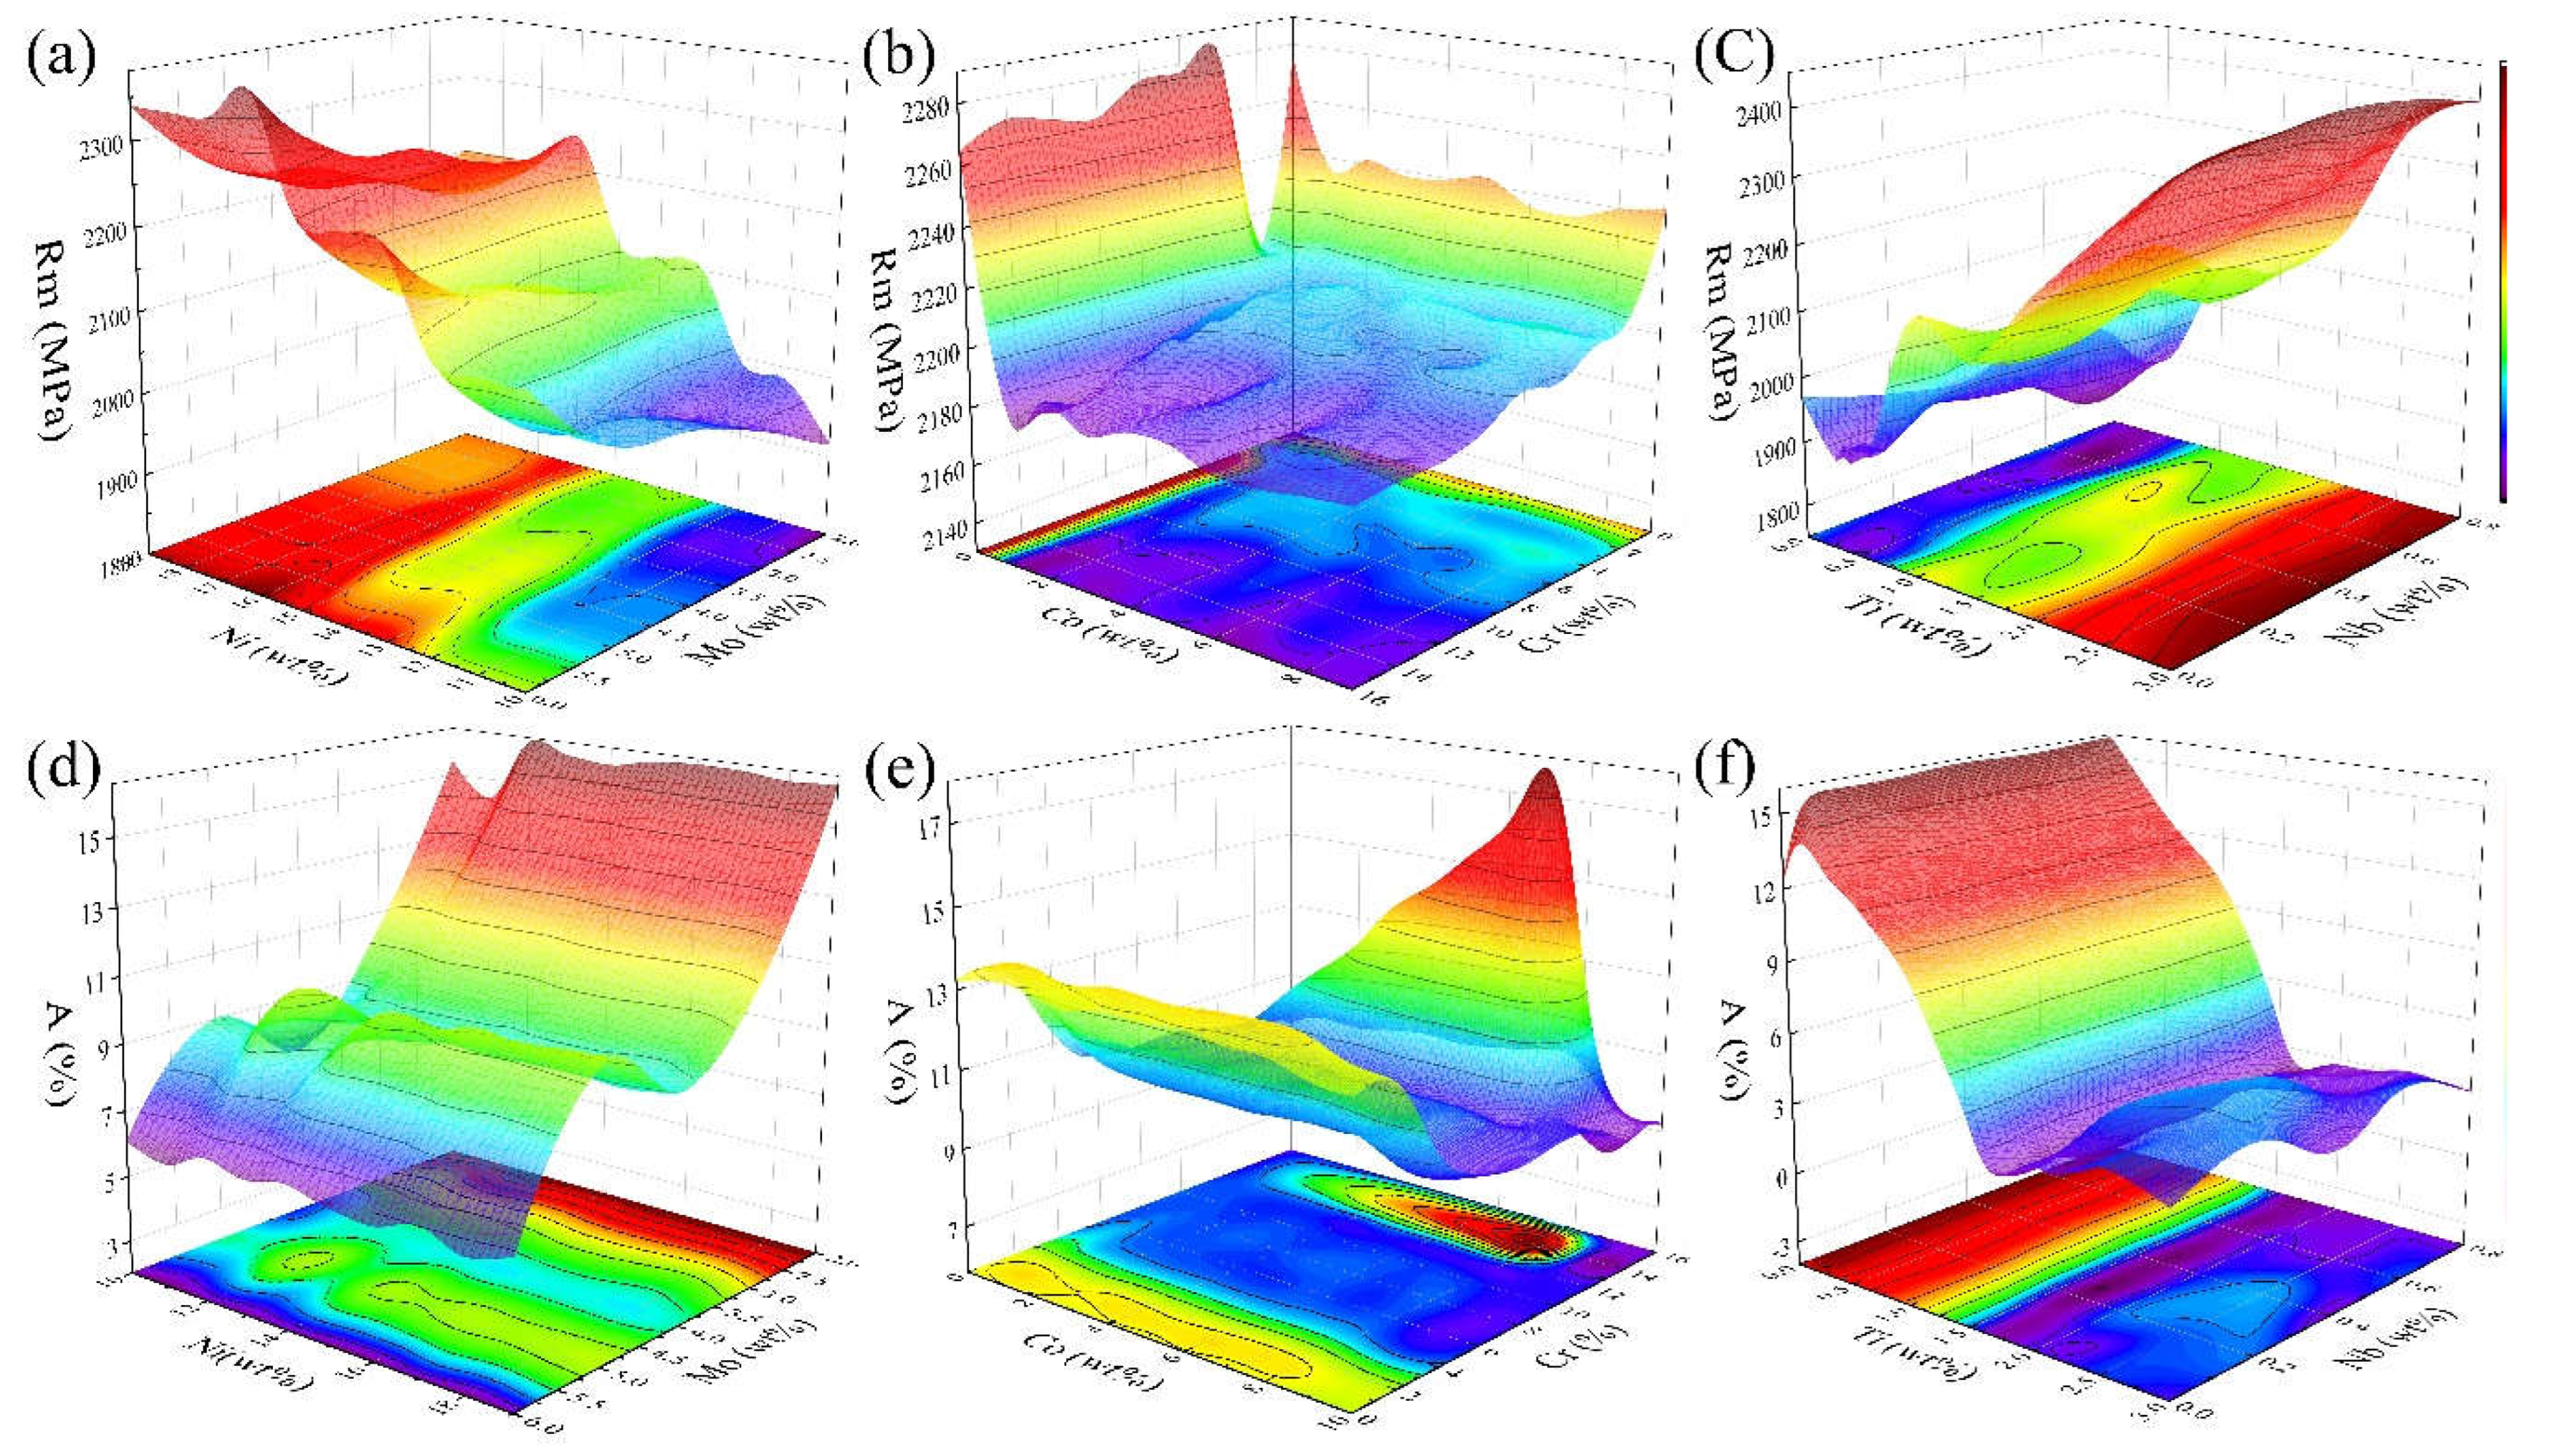
Figure 5.
Effect of Ni, Mo, Ti on austenite, Laves phase and Ni3Ti by thermodynamic calculation.
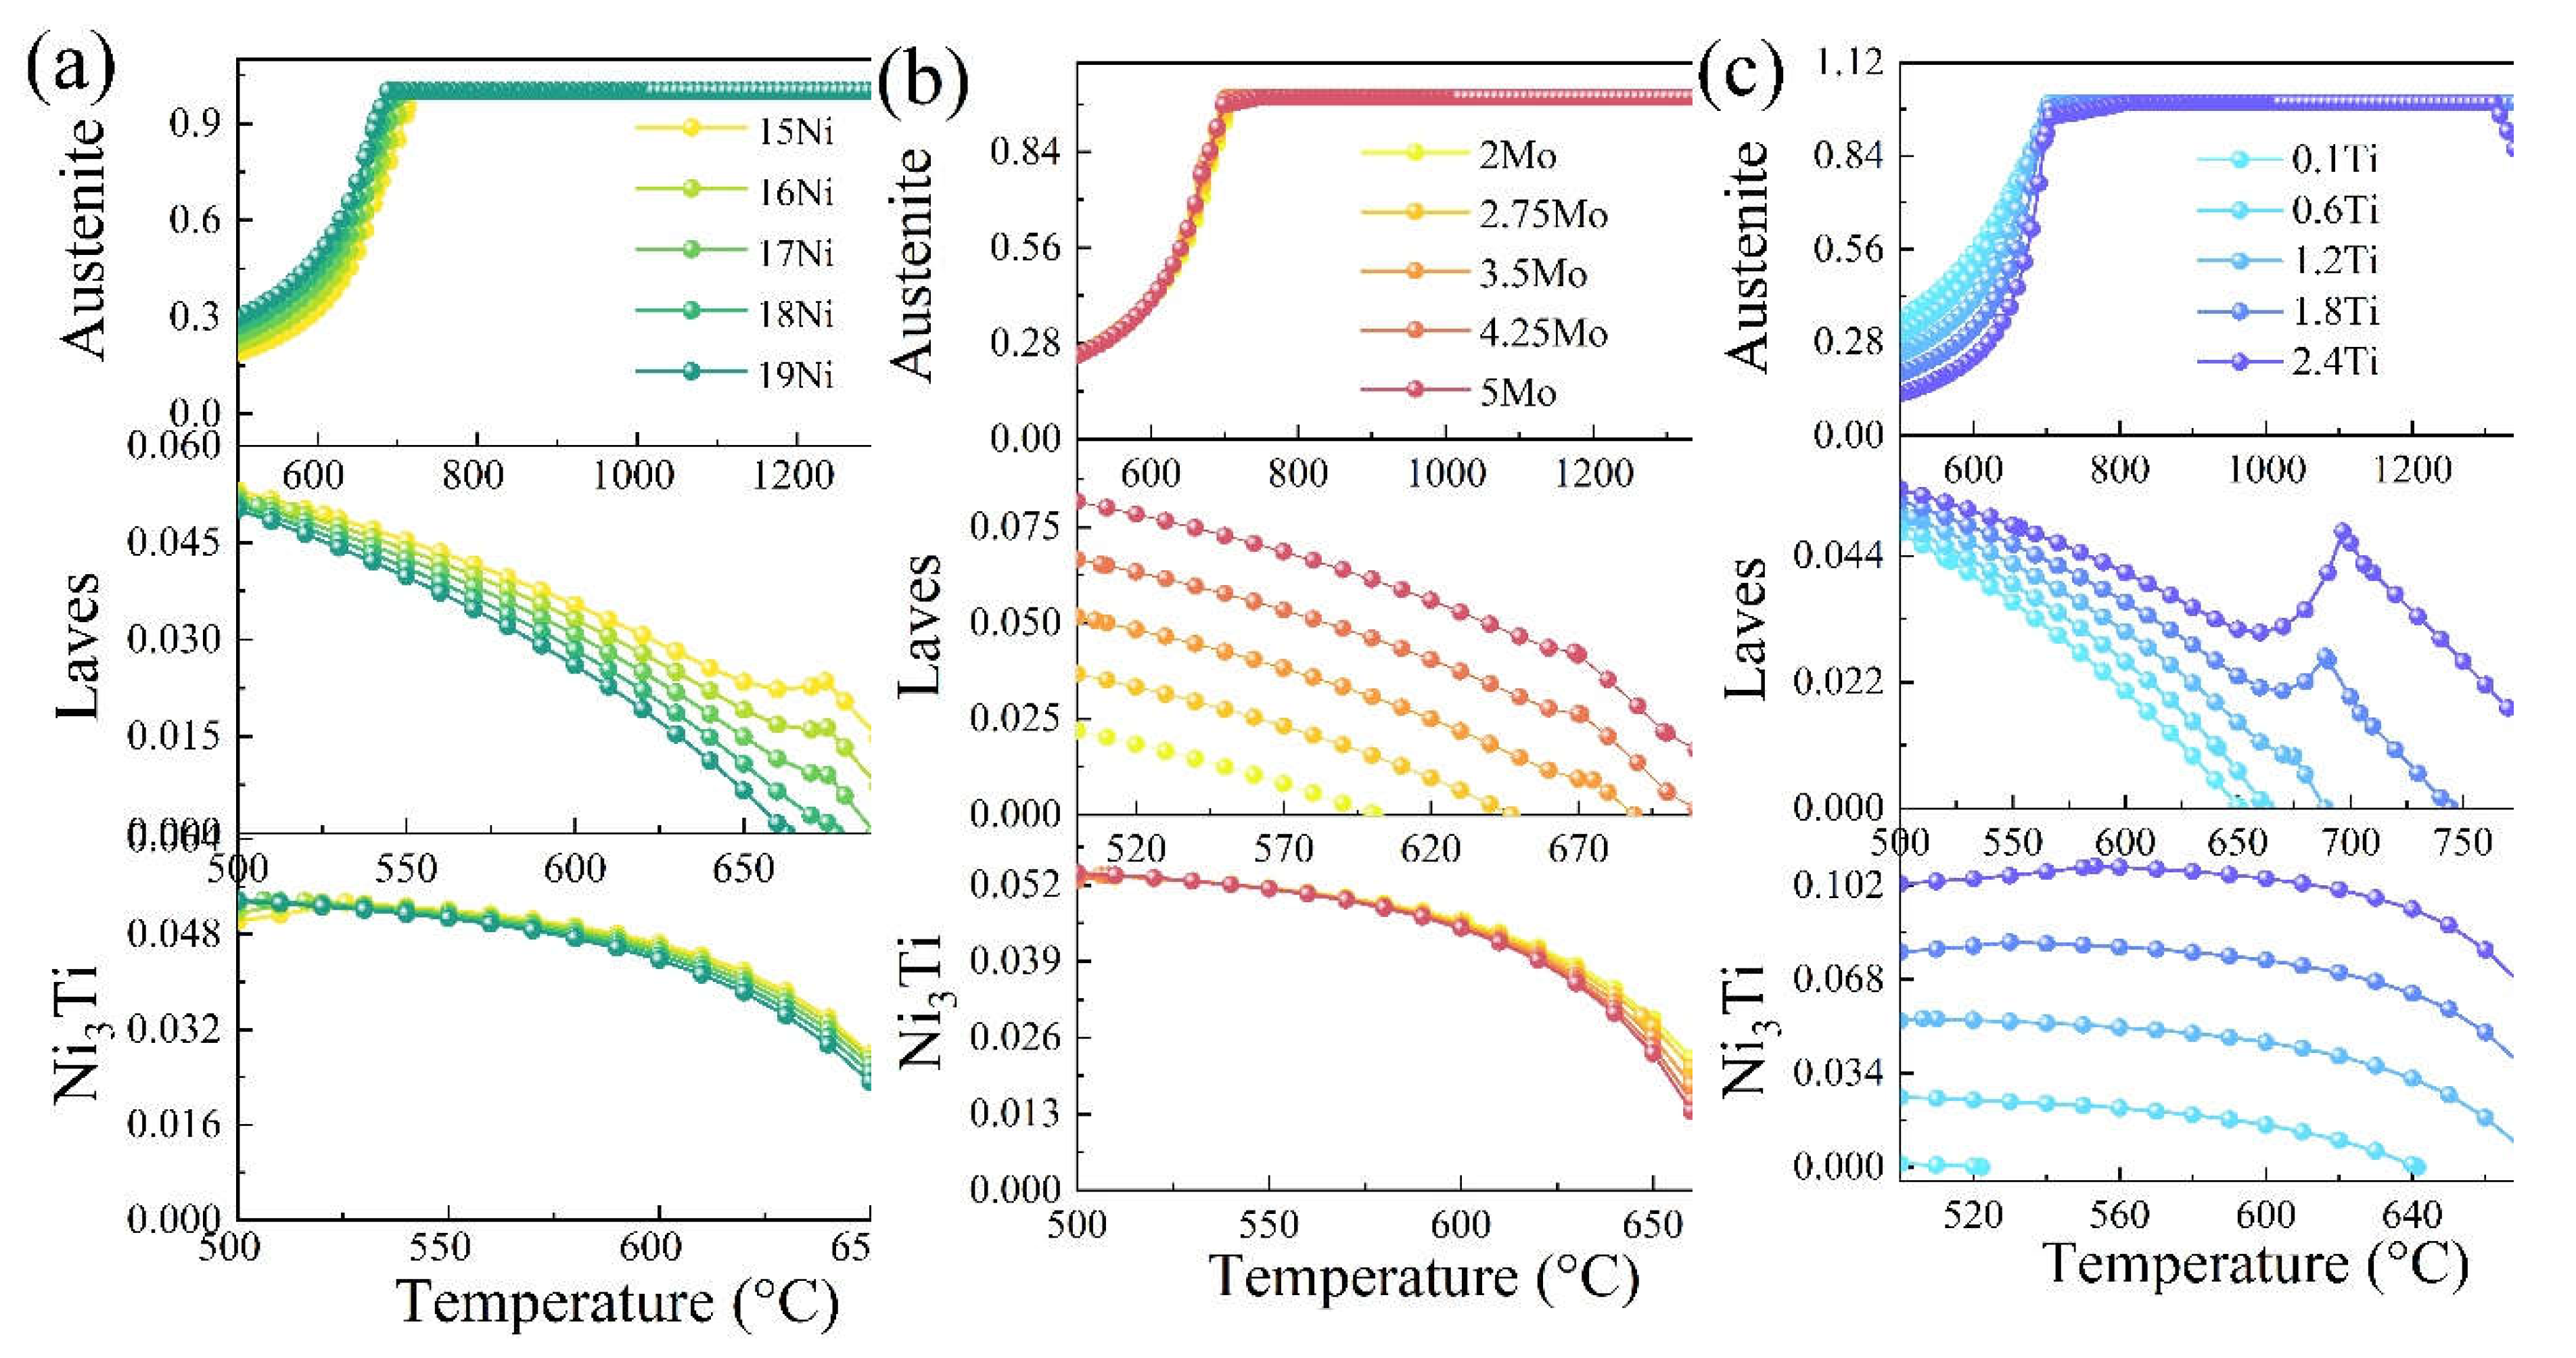
Figure 6.
Thermodynamic calculation of the phase diagram of samples No. 1-3.
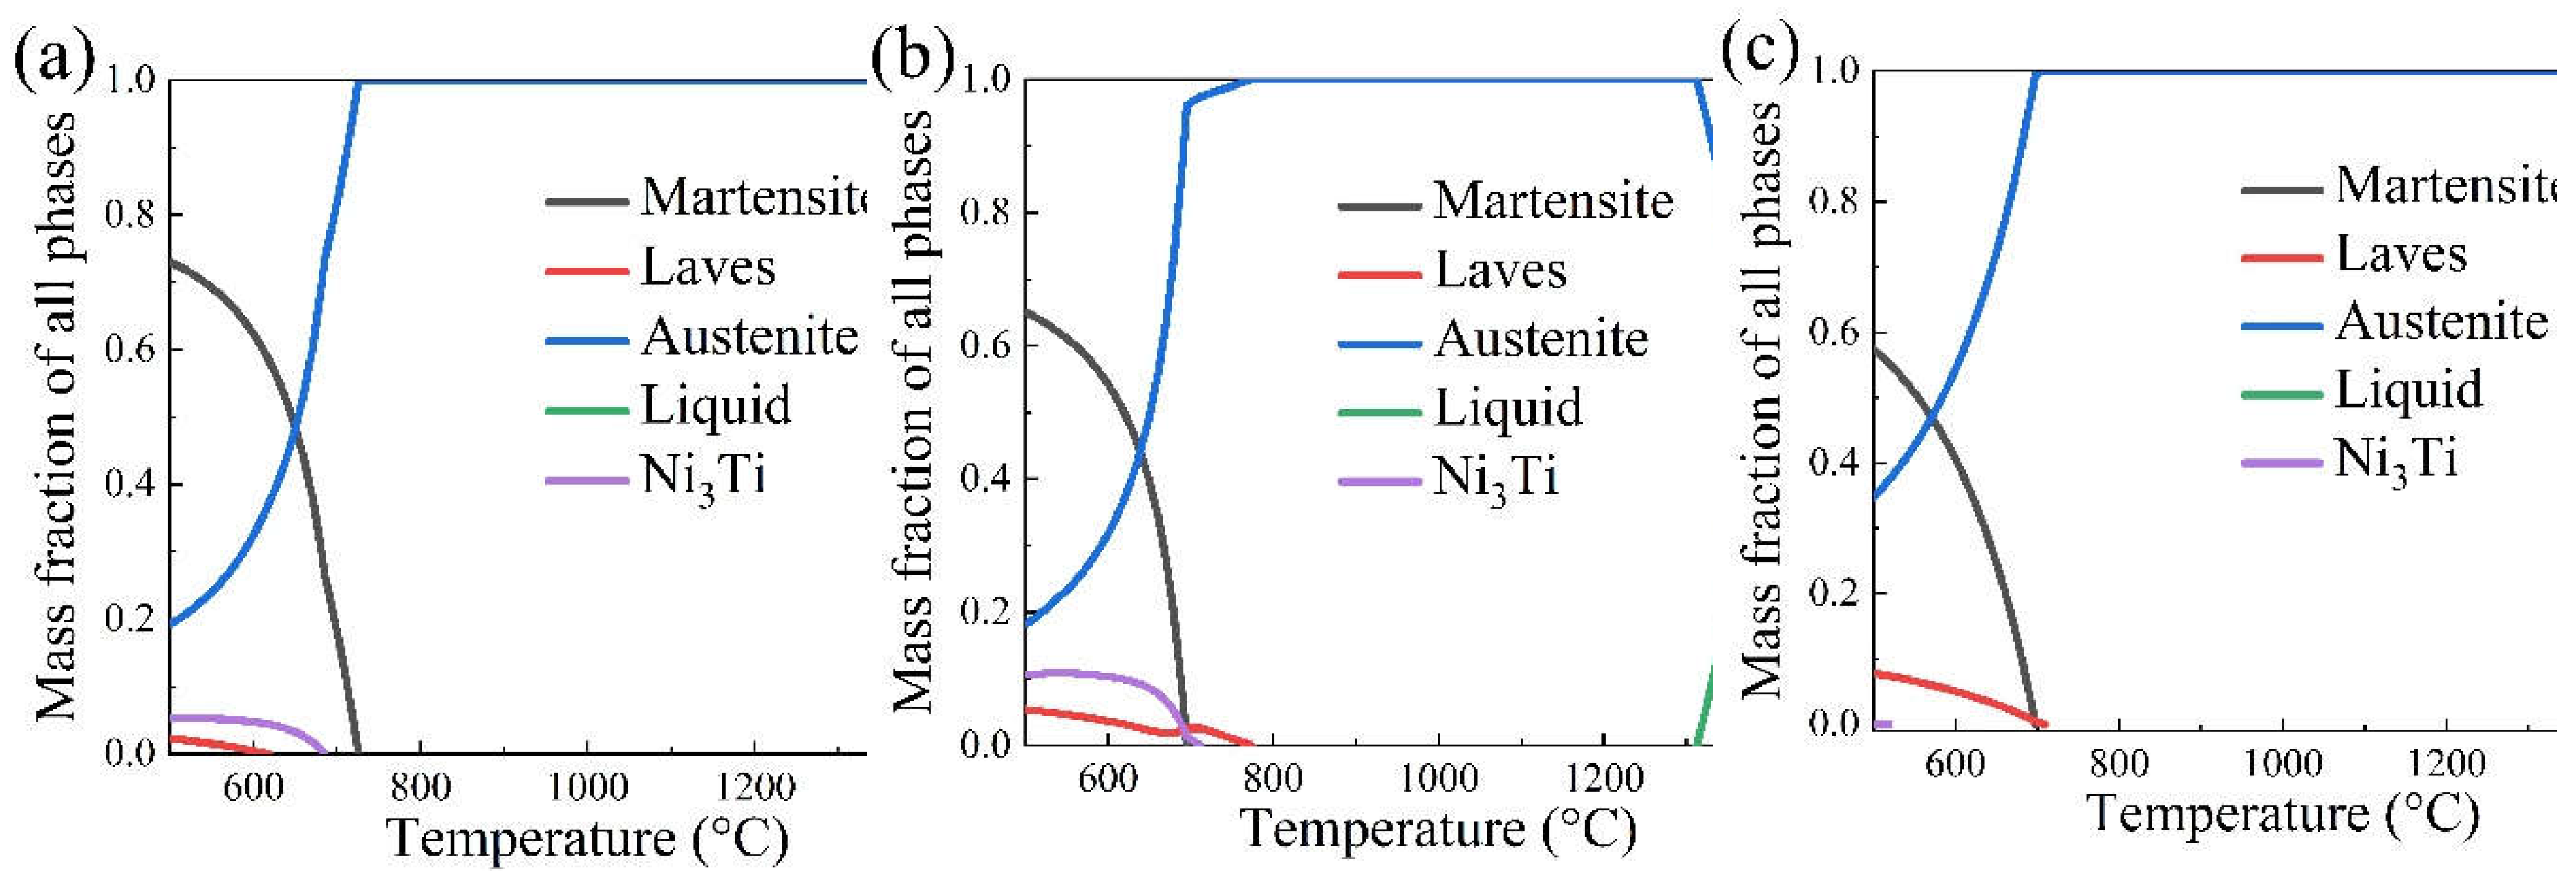
Figure 7.
The stress-strain tensile curves of 3 samples.
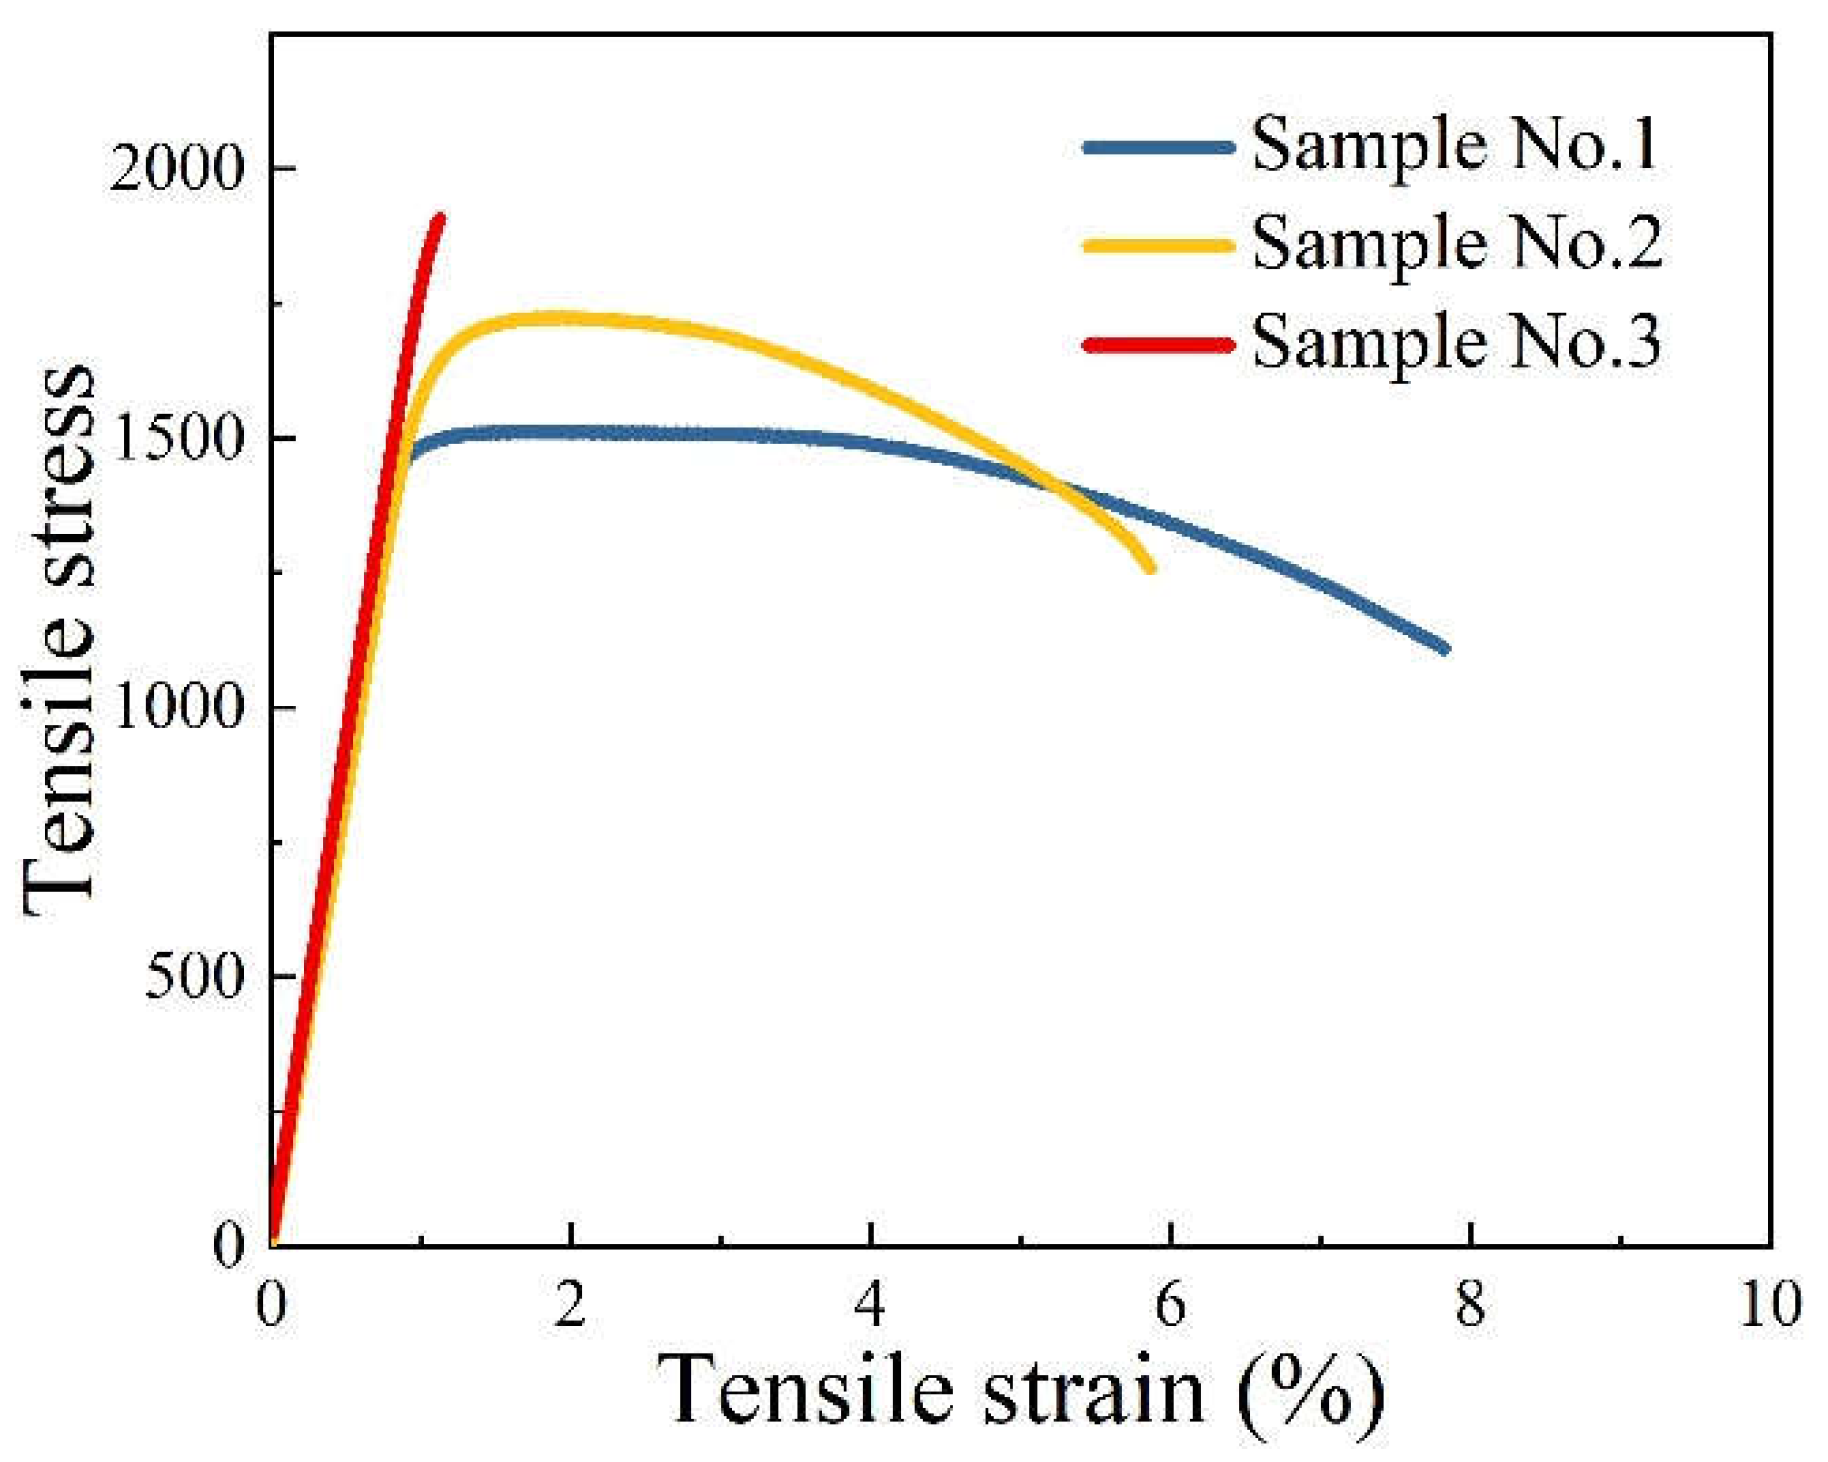
Figure 8.
Surface morphology SEM images of samples No. 1-3. (a) Sample No. 1; (b) Sample No. 2; (c) Sample No. 3.
Figure 8.
Surface morphology SEM images of samples No. 1-3. (a) Sample No. 1; (b) Sample No. 2; (c) Sample No. 3.
| No. | Ni | Co | Mo | Ti | Al | Fe | Rp-act | Rm-act | A-act | Hv-act |
| 1 | 14.89 | 12.45 | 2.11 | 1.21 | 0.09 | Bal. | 1487 | 1512 | 7.82 | 54.2 |
| 2 | 19.02 | 12.47 | 3.24 | 2.21 | 0.06 | Bal. | 1694 | 1724 | 5.86 | 51.5 |
| 3 | 16.87 | 12.43 | 4.96 | 0.13 | 0.08 | Bal. | 1887 | 1907 | 1.12 | 58.7 |
Figure 9.
Fracture morphology SEM images of samples No. 1-3 with 1000× and 5000×. (a,d) Sample No. 1; (b,e) Sample No. 2; (c,f) Sample No. 3.
Figure 9.
Fracture morphology SEM images of samples No. 1-3 with 1000× and 5000×. (a,d) Sample No. 1; (b,e) Sample No. 2; (c,f) Sample No. 3.
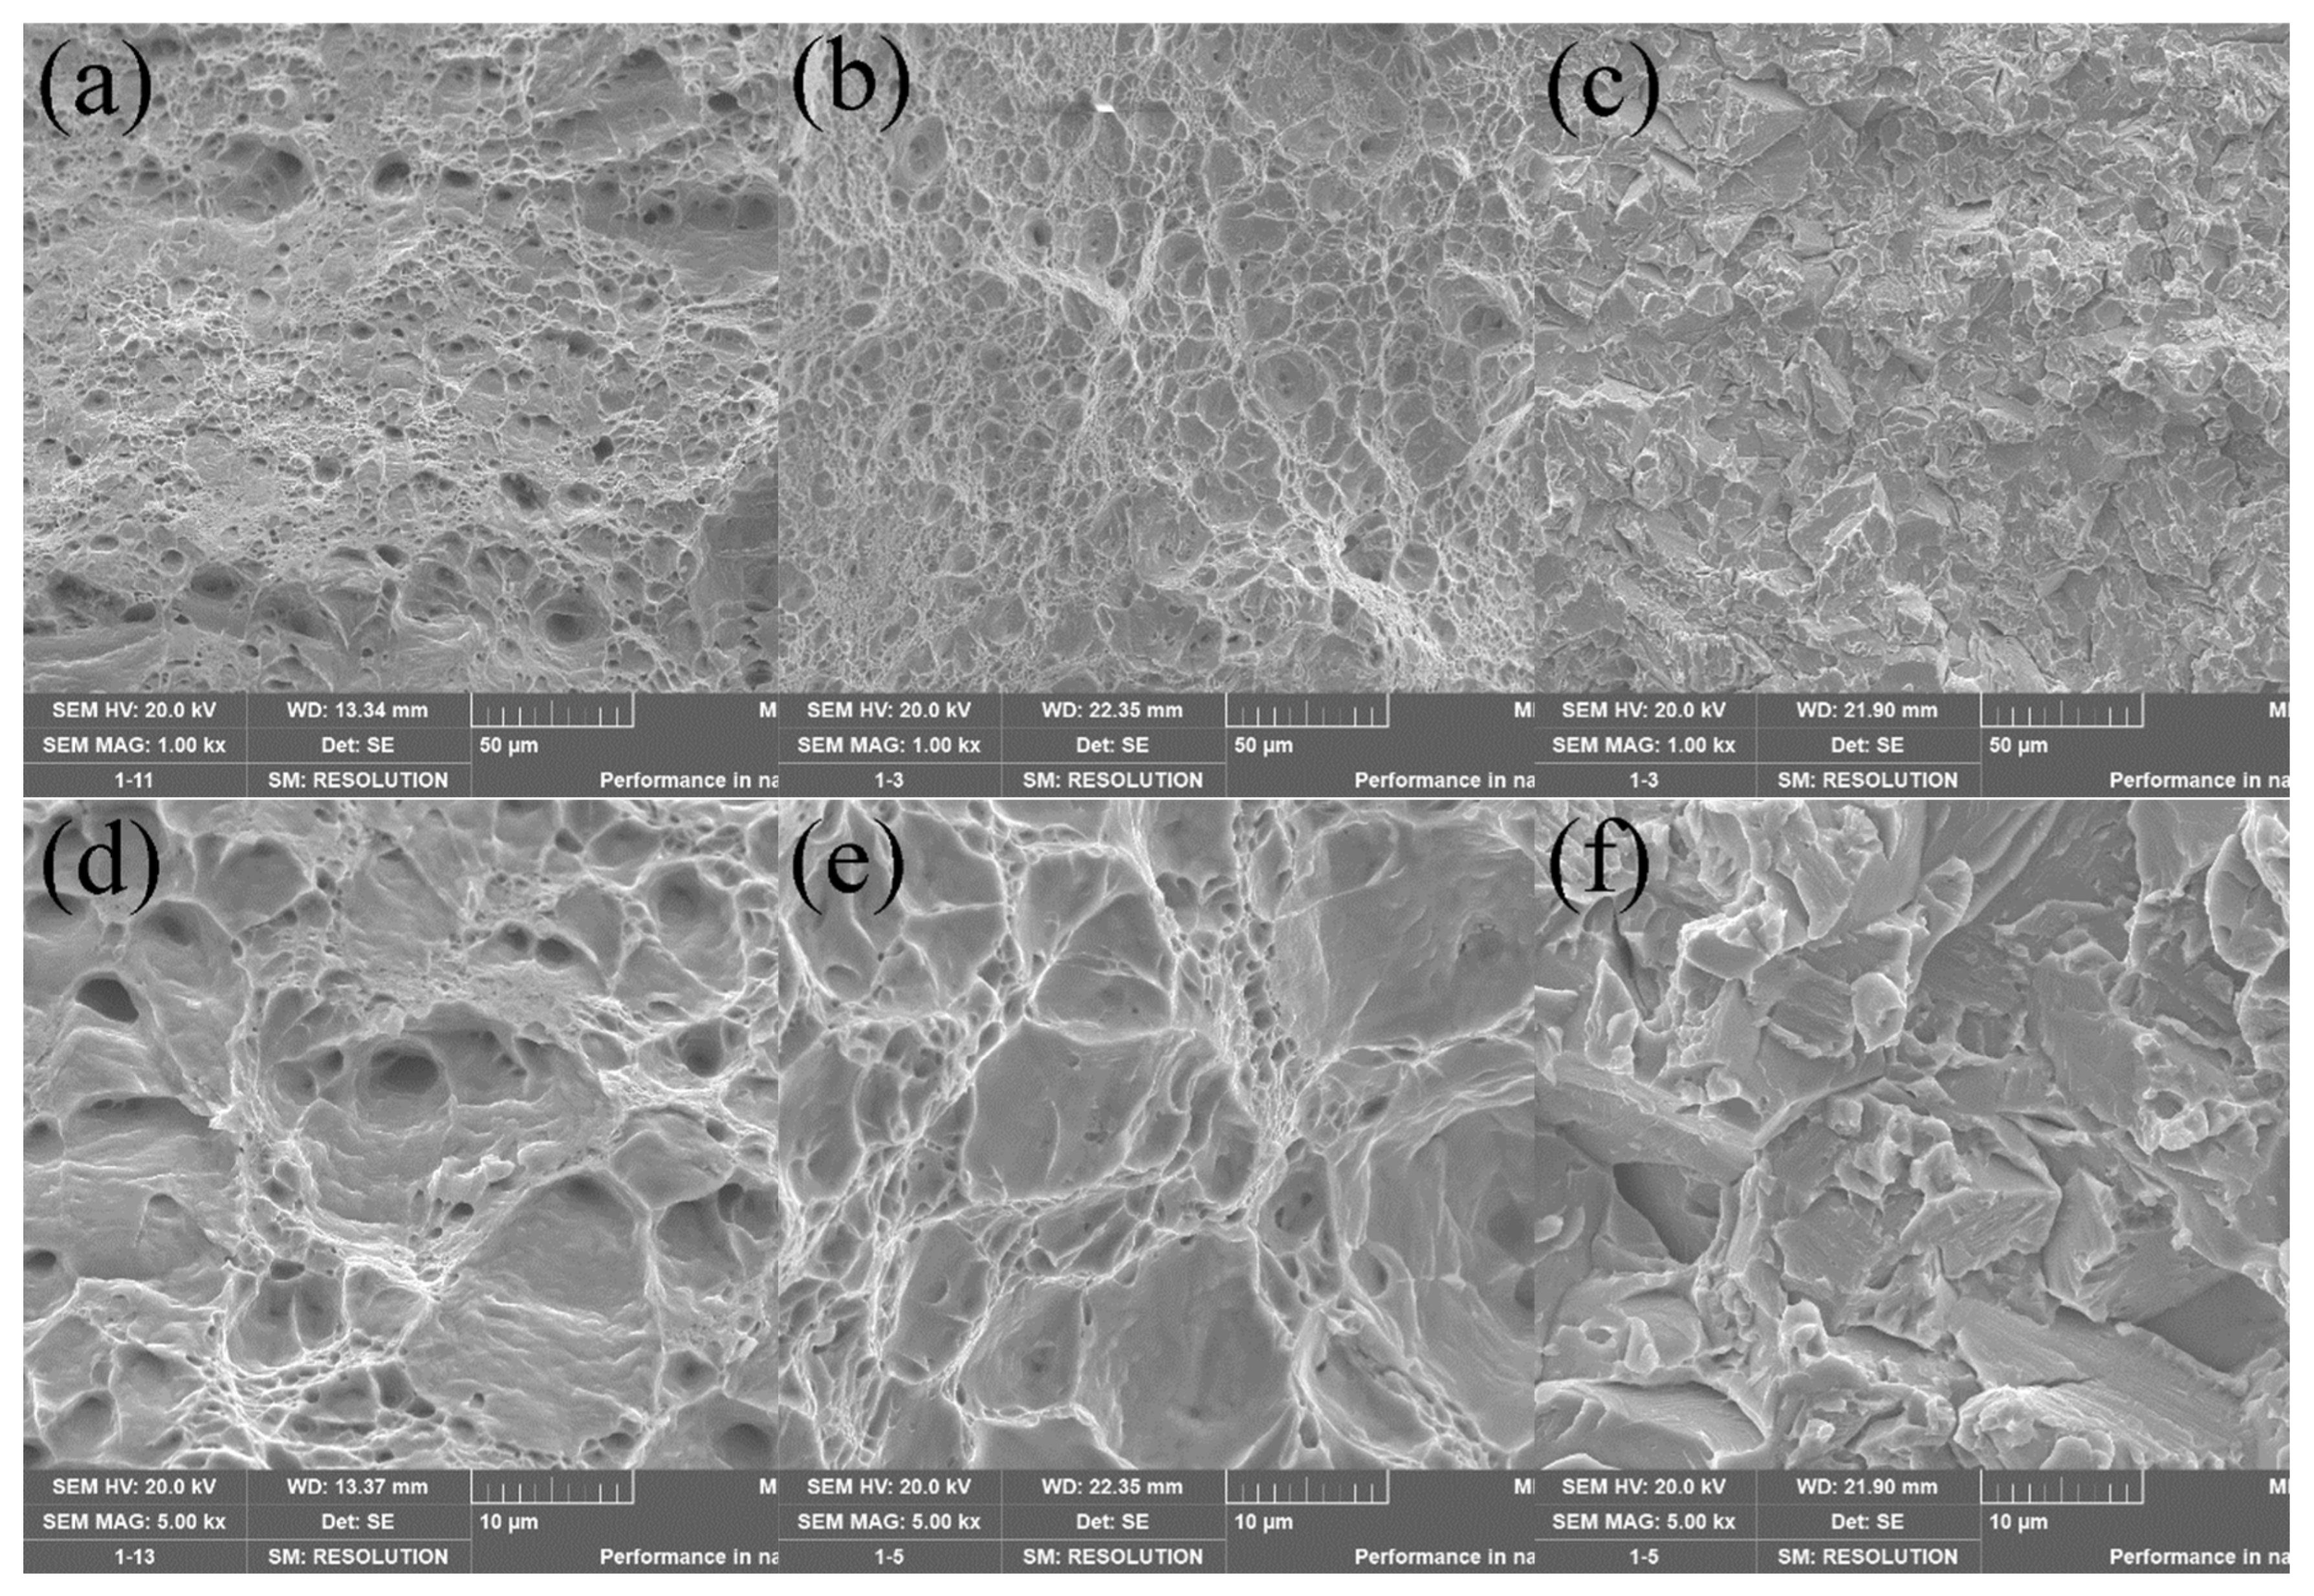

Table 1.
The top five absolute values of the independent variables in the correlation test.
| Rp0.2 | Rm | A | Hv | ||||
| Ni | 0.766 | Co | 0.857 | Mo | -0.742 | Mo | 0.936 |
| Mo | 0.700 | Mo | 0.770 | Co | -0.718 | Co | 0.933 |
| Cr | -0.699 | Cr | -0.717 | Cr | 0.601 | Cr | -0.852 |
| Co | 0.658 | Ni | 0.632 | Ni | -0.440 | Nb | -0.686 |
| Ti | 0.611 | Cu | -0.470 | Ti | -0.314 | Cu | -0.652 |
Table 2.
A list of the composition and process of the new maraging steel designed in this paper.
| No. | Ni | Co | Mo | Ti | Al | Fe | Rp-pre | Rm-pre | A-pre | Hv-pre |
| 1 | 15 | 12.5 | 2 | 1.2 | 0.1 | Bal. | 1442 | 1496 | 9.14 | 53.8 |
| 2 | 19 | 12.5 | 3.5 | 2.4 | 0.1 | Bal. | 1609 | 1672 | 6.56 | 52.7 |
| 3 | 17 | 12.5 | 5 | 0.1 | 0.1 | Bal. | 1754 | 1811 | 3.54 | 59.2 |
Table 3.
A list of the composition and process of the new maraging steel prepared in this paper.
| No. | Ni | Co | Mo | Ti | Al | Fe | Rp-act | Rm-act | A-act | Hv-act |
| 1 | 14.89 | 12.45 | 2.11 | 1.21 | 0.09 | Bal. | 1487 | 1512 | 7.82 | 54.2 |
| 2 | 19.02 | 12.47 | 3.24 | 2.21 | 0.06 | Bal. | 1694 | 1724 | 5.86 | 51.5 |
| 3 | 16.87 | 12.43 | 4.96 | 0.13 | 0.08 | Bal. | 1887 | 1907 | 1.12 | 58.7 |
Disclaimer/Publisher’s Note: The statements, opinions and data contained in all publications are solely those of the individual author(s) and contributor(s) and not of MDPI and/or the editor(s). MDPI and/or the editor(s) disclaim responsibility for any injury to people or property resulting from any ideas, methods, instructions or products referred to in the content. |
© 2023 by the authors. Licensee MDPI, Basel, Switzerland. This article is an open access article distributed under the terms and conditions of the Creative Commons Attribution (CC BY) license (http://creativecommons.org/licenses/by/4.0/).
Copyright: This open access article is published under a Creative Commons CC BY 4.0 license, which permit the free download, distribution, and reuse, provided that the author and preprint are cited in any reuse.


