
Submitted:
04 May 2023
Posted:
05 May 2023
You are already at the latest version
Abstract
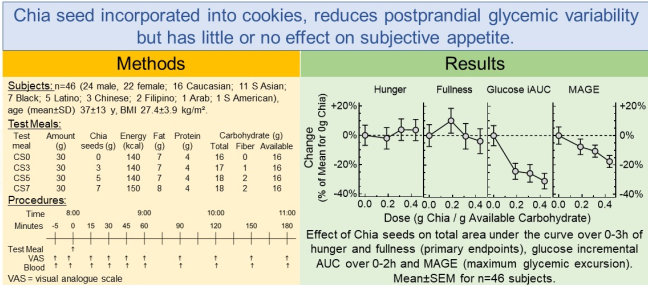
Chia seed, high in dietary-fiber and protein, may have potential to increase satiety. However, previous studies are confounded by differences in energy intake, and none investigated doses <7g. We compared the subjective appetite and glycaemic responses elicited by 30g cookies containing 0, 3, 5 or 7g chia seed (CS0, CS3, CS5 or CS7, respectively, 140-150kcal, 7-8g fat, 4g protein, 0-2g dietary-fiber, 16g available-carbohydrate) using a randomized, double-blind, cross-over design. Overnight-fasted heathy adults (24 males, 22 females; mean±SD age 37±13y; BMI 27.4±3.9kg/m²) consumed test-cookies and had appetite and plasma-glucose measured before and intermittently for 3h after eating. Data were analyzed by ANOVA with Tukey’s test to adjust for multiple comparisons; the criterion for significance was 2-tailed p<0.025 for the primary endpoints of total area under the curve (tAUC0-3h) for hunger and fullness. Hunger tAUC0-3h was similar among treatments (p=0.49) but fullness differed (p=0.019) with tAUC0-3h after CS3>CS7 (mean±SEM) (140±9 vs 122±10mm×h, p<0.025). Mean incremental glucose AUC0-2h after CS3, CS5 and CS7, respectively, were 22%, 23% and 30% less than CS0 (p<0.05). Thus, although chia reduced glycemic responses, we were unable to demonstrate a significant effect of ≤7g chia seed on the primary endpoints of hunger or fullness tAUC0-3h versus control.
Keywords:
randomized clinical trial
; humans
; salba
; blood glucose
; hunger
; fullness
; MAGE.
1. Introduction
Current nutrition guidelines in the United States [1] and Canada [2] recommend helping to meet protein needs with nutrient-dense plant foods such as legumes, nuts, and seeds. The seed Salvia hispanica L., commonly known as chia seed, has been an important part of the diet in central America and Mexico for over 5000 years [3,4]. Chia seeds are very high in dietary fiber, low in available-carbohydrate (avCHO), and good sources of alpha-linoleic acid, protein, and micronutrients [5]. Thus, chia has attracted interest as a functional food with several potentially beneficial effects on health [6,7,8]. Amongst the effects attributed to chia seeds is their ability to increase satiety and/or reduce food intake [9,10,11], effects thought to be due to the high fiber content of chia. In two of these studies [9,10], chia seeds were added to a breakfast test-meal containing a fixed amount of avCHO. Chia seeds reduced postprandial glycemic responses (PPGR) and prolonged satiety in a dose-dependent fashion, but, since the chia-containing test meals contained up to 50% more energy than the control, it is not possible to determine whether the changes in PPGR and satiety observed were due to the dietary fiber in chia seeds, or to the increased energy intake. In the other study, Ayaz et al. [11] compared satiety and food intake after three different mid-morning snacks (180g yogurt, 140g yogurt plus 7g chia seed, or 100g yogurt plus 14g chia seed) that were equivalent in energy, protein and fat but differed in dietary fiber. Both chia snacks elicited significantly less subjective hunger, greater subjective satiety and less food intake compared to the chia-free control, but the effects after 14g chia were similar to those after 7g chia [11]. Not only do the results of this study need to be confirmed, but also the effect of <7g of chia seeds on subjective satiety and glycemic response is not known.
Therefore, we aimed to compare the postprandial subjective appetite ratings and glycemic responses elicited by energy- and avCHO-matched cookies containing 0, 3, 5 and 7g chia seeds. The a-priori primary endpoints were the total area under the curve from 0-3h (tAUC0-3h) for hunger and fullness ratings. The a-priori secondary endpoints were tAUC0-3h for desire to eat, prospective consumption and average appetite; tAUC0-2h and tAUC2-3h for the 5 domains of subjective appetite; the main effects of time and dose and time×dose interaction for plasma glucose concentrations and increments; incremental area under the curve (iAUC) from 0-2, 2-3 and 0-3h; and plasma glucose peak rise.
2. Materials and Methods
2.1. Recruitment
We recruited n=50 adults to participate in a randomized, double-blind, crossover study at INQUIS Clinical Research, Inc. (Toronto, Canada), a contract research organization. The procedures used were in accordance with the Code of Ethics of the World Medical Association (Declaration of Helsinki) and the protocol was approved by the Advarra IRB, on 25 February 2022 (number 00061477). Subjects were recruited from the pool of previous study participants at INQUIS who had given permission to be contacted for future studies. Eligible participants were healthy, non-pregnant and non-lactating individuals aged 18-65 years (≤5 could be 56-65 years of age) with no history of diabetes mellitus, blood pressure <160/<100 mmHg and BMI 18.5 to 34.9 kg/m², inclusive. All inclusion/exclusion criteria are listed in Supplementary Methods. The study was submitted to www.clinicaltrials.gov on 18 April and registered as NCT05345470 on 26 April 2022.
2.2. Informed Consent
Before being screened participants willing to be considered were invited to come to INQUIS to have the study procedures explained to them and be given a copy of the consent form to review. They could sign the consent form then, take it away to sign later, or decline to participate. Participants were encouraged to ask any questions they had and not to sign the consent form until all their questions had been answered to their satisfaction. Screening could occur on the same day as the informed consent procedure or later depending on participant preference. Participants were asked questions to assess medical history, use of medications and supplements, and have height, weight, pulse, and blood pressure measured. They were shown a list of the ingredients in the study products and asked if they have any intolerance, sensitivity, or allergy to any of them.
2.3. Test Meals
The test meals were cookies containing either 0, 3, 5 or 7g chia seeds (CS0, CS3, CS5 and CS7, respectively) that were provided by the sponsor in opaque coded sachets each containing 30g (3 cookies). The composition of the cookies is shown in Table 1.
2.4. Procedures
Eligible participants visited INQUIS on 4 mornings after a ≥10 h overnight fast (water allowed) over a period of 2-4 wk. Visits were separated by ≥2 days and ≤2 wk. Participants were asked to refrain from drinking alcohol and from unusual levels of food intake and physical activity for 24 h before each test and not to smoke for 12 h before and throughout each visit.

Table 1.
This is a table. Tables should be placed in the main text near to the first time they are cited.
Table 1.
This is a table. Tables should be placed in the main text near to the first time they are cited.
| Test-Meal | Amount (g) | Chia seeds (g) | Energy (kcal) | Fat (g) |
Protein (g) | Carbohydrate (g) | ||
|---|---|---|---|---|---|---|---|---|
| Total | Fiber | Available | ||||||
| CS0 | 30 | 0 | 140 | 7 | 4 | 16 | 0 | 16 |
| CS3 | 30 | 3 | 140 | 7 | 4 | 17 | 1 | 16 |
| CS5 | 30 | 5 | 140 | 7 | 4 | 18 | 2 | 16 |
| CS7 | 30 | 7 | 150 | 8 | 4 | 18 | 2 | 16 |
Data provided by the sponsor. Test-meals were cookies containing 0g (CS0), 3g (CS3), 5g (CS5) or 7g (CS7) of chia seeds. Cookie ingredients: Wheat flour, almond flour, chia seeds (not present in Control), coconut sugar, coco powder, agave syrup, fat, cocoa nibs, chocolate chips, sugar.
At each visit medical history and drug and supplement use were reviewed and adverse events assessed. If a participant had evidence of an active infection within 5 days the visit was rescheduled until either: 1) all signs and symptoms had resolved and any treatment (e.g., antibiotic therapy) completed for ≥5 days, or 2) Toronto Public Health recommendations for reducing the spread of COVID-19 had been followed (whichever was longer). If any subject was not feeling well or had not complied with the preceding experimental conditions, the test was not carried out and was rescheduled for another day.
Eligible participants were weighed, filled out the motivation to eat questionnaire (MEQ) and provided a fasting blood sample. Approximately 5 minutes later, a second MEQ and second fasting blood sample were obtained, and then a test-meal consisting of 30g of one of the study cookies and a drink of 250ml of water or coffee or tea (with 30ml 2% milk and/or non-caloric sweetener if desired; the drink chosen remained the same for all 4 treatments) was consumed as evenly as possible over 8-12 min. The MEQ was completed at 15, 30, 45, 60, 90, 120, 150 and 180 min after starting to eat. Blood samples were obtained after each MEQ had been completed. After the last blood sample, participants were offered a light snack and were free to leave. The procedures at each visit are summarized in Supplementary Figure 1.
2.5. Subjective Appetite
The MEQ consisted of 4 visual analogue scales (VAS) assessing desire to eat (D), hunger (H), fullness (F) and prospective consumption (P). Each VAS was a 100mm line anchored at each end with opposing statements (e.g., for fullness, “Not full at all” or “As full as I have ever felt”) [12]. Participants placed a vertical mark along the horizontal line at the point they felt represented their feelings at that moment. Subjects could not refer to their previous ratings when completing the VAS. Scores were assessed by measuring the distance in mm between the left end of the line and the vertical mark made by the subject. Data were entered into the database by 2 different individuals to check for accurate transcription. Average Appetite (A) was calculated as follows: A = (D + H + (100-F) + P)/4.
2.6. Blood Samples
Each blood sample consisted of 5-6 drops of blood collected by finger-stick into heparin:fluoride microvettes (Sarstedt AG, Numbrecht, Germany); the microvettes were mixed by inversion, centrifuged for 5 min, and stored at 4°C prior to plasma glucose analysis within 5 days using the Vitros 350 Chemistry System (Ortho Clinical Diagnostics, Raritan, NJ); results were transferred electronically to the database.
2.7. Randomization and Concealment
Subjects were randomly assigned to one of 4 balanced sequences (ABCD, BADC, CDAB, DCBA). Blocks of 2 or 3 sets of the 4 possible sequences were randomly ordered to create a balanced sequence for n=60 subjects (10 additional sequences were created if needed for dropouts) (Appendix 3). Sequences were assigned to subjects in the order they attended for the first study visit. Due to the similar appearance, smell, texture, and taste of the investigational products, those who prepared the test meals and served them to subjects were unaware of their identity. Participants were not informed as to which test meal was which. On sample tubes and case report forms, test meals were identified by code so those analyzing the samples and doing the statistical analysis were unaware of treatment assignments.
2.8. Calculations
The means of the 2 fasting VAS scores and fasting glucose concentrations were taken as the baseline values. Total area under the curves (tAUC) of VAS scores were calculated using the trapezoid rule. Changes from baseline in plasma glucose (glucose increments) were calculated by subtracting the baseline concentration from every glucose concentration. Incremental areas under the curve (iAUC) for glucose were calculated using the trapezoid rule ignoring area below the baseline. Glucose peak rise was the maximum plasma glucose concentration achieved during the test minus the baseline concentration.
The distributions of tAUC, iAUC and peak rise values were assessed for normality by comparing the observed distribution of the Z scores to that expected for a normal distribution using the chi-squared test. Values not normally distributed were normalized by log- or square root transformation. Missing values were imputed as described in [13] and Supplementary Information.
Glucose variability was assessed over the periods of 0-2h and 0-3h. For each subject SD(g) was the SD of all glucose concentrations within the respective time periods and MAGE (maximum amplitude of glycemic excursion) was the difference between the highest and lowest glucose concentrations within the respective time periods.
2.9. Statistical Analysis
All participants who completed the study were included in the primary analysis. Unblinding occurred after the statistical analysis of the primary and major secondary endpoints had been completed, a preliminary report submitted and unblinding approved by the sponsor.
Subjective appetite tAUC values were analyzed by repeated measures analysis of variance using the linear model (ANOVA) examining for the main effect of treatment. If neither square-root or log transformation normalized the distribution, treatments were compared using Friedman’s analysis of variance by ranks (GraphPad Prism 9, version 9.4.1). Plasma glucose concentrations and increments were analyzed by ANOVA examining for the main effects of time and treatment and the time×treatment interaction. If the interaction was significant, glucose iAUCs and concentrations and increments at each time point were assessed by ANOVA.
The significance of differences between means was assessed using Tukey’s test to adjust for multiple comparisons. For the 2 primary endpoints (tAUC0-3h for hunger and fullness), the criterion for significance was two-tailed p<0.025, for other endpoints it was two-tailed p<0.05.
2.10. Statistical Power
The effect size for power analysis was based on the only study comparing equicaloric test meals with or without chia seeds (11). It showed that 7g chia seeds reduced tAUC for hunger by 17% and increased tAUC for satiety by 16%. In a previous study of ours [14], the pooled error SD for the tAUCs for hunger and fullness, respectively, were 20.8% and 22.4% of the maximum mean value. Using these SDs with n=45 subjects, based on the t-distribution, there is 90% power to detect a 17% difference in hunger tAUC and 85% power to detect a 16% difference in fullness at the p<0.025 level (Bonferroni’s adjustment for 2 primary endpoints). To allow for 10% dropout, n=50 participants were recruited.
3. Results
A total of 52 volunteers were screened of whom 2 failed screening and 50 were randomized; 2 subjects withdrew visit 1 due to dislike of finger-pricks and 2 withdrew after visit 2 because they were unable to complete the study within 6 weeks. Subject visits occurred from 23 March to 24 June 2022. By 18 April 2022 (submission of study registration) 45% of 190 subject visits had been completed. The 46 subjects who completed the study and whose data were analyzed (Supplementary Figure 2) comprised 24 males and 22 females aged (mean±SD) 37±13 y (n=5 aged 56-65 y) with BMI 27.4±3.9 kg/m² of whom n=16 (35%) were Caucasian; n=11 (24%) South Asian; n=7 (15%) Black; n=5 (11%) Latin American; n=3 (7%) Chinese; 2 (4%) Filipino; n=1 (2%) South American; and 1 Arab. Nineteen (19) subjects used ≥1 allowed medications; n=1 received a COVID-19 booster vaccine, n=9 were taking ≥1 supplements or over-the-counter medications, n=7 were on ≥1 prescription drugs, and n=2 took both supplements and prescription drugs. Details of the medications used are shown in Supplementary Table 1.
Missing values were imputed for 8 of 7360 (0.1%) VAS scores and 1 of 1840 (0.05%) blood samples. There were no serious protocol violations, no serious adverse events and no adverse events related to the study products. See Supplementary Information for further details.
3.1. Subjective Appetite
The 2 a-priori primary endpoints were tAUC0-3h for hunger and tAUC0-3h for fullness. The distribution of the values for hunger and fullness did not depart significantly from normality (p=0.86 and p=0.66, respectively). There was no significant difference among treatments in tAUC0-3h for hunger (main effect of treatment, p=0.46). However, for fullness, there was a significant main effect (p=0.019) and Tukey’s test showed that the mean tAUC0-3h after treatment CS3 was 14% greater than that after CS7 (p<0.025) with the means for the other 2 treatments being intermediate (Figure 1, Table 2).
Figure 1.
Values are means±SEM (n=46 subjects) for postprandial Hunger (panel (A)) and Fullness (panel (B)) after consuming control cookies (black), or cookies containing 3g (red) 5g (blue) or 7g (green) chia seeds. Insets show the total areas under the curve over 0-2h, 2-3h and 0-3h. The vertical dashed line shows time 0min and the horizontal dashed line shows the mean fasting rating for all treatments. ab Means not sharing the same letter superscript differ significantly (p<0.05) by Tukey’s test. xy Means not sharing the same letter superscript differ significantly (p<0.05) by Friedmans ANOVA by ranks, but not by normal ANOVA.
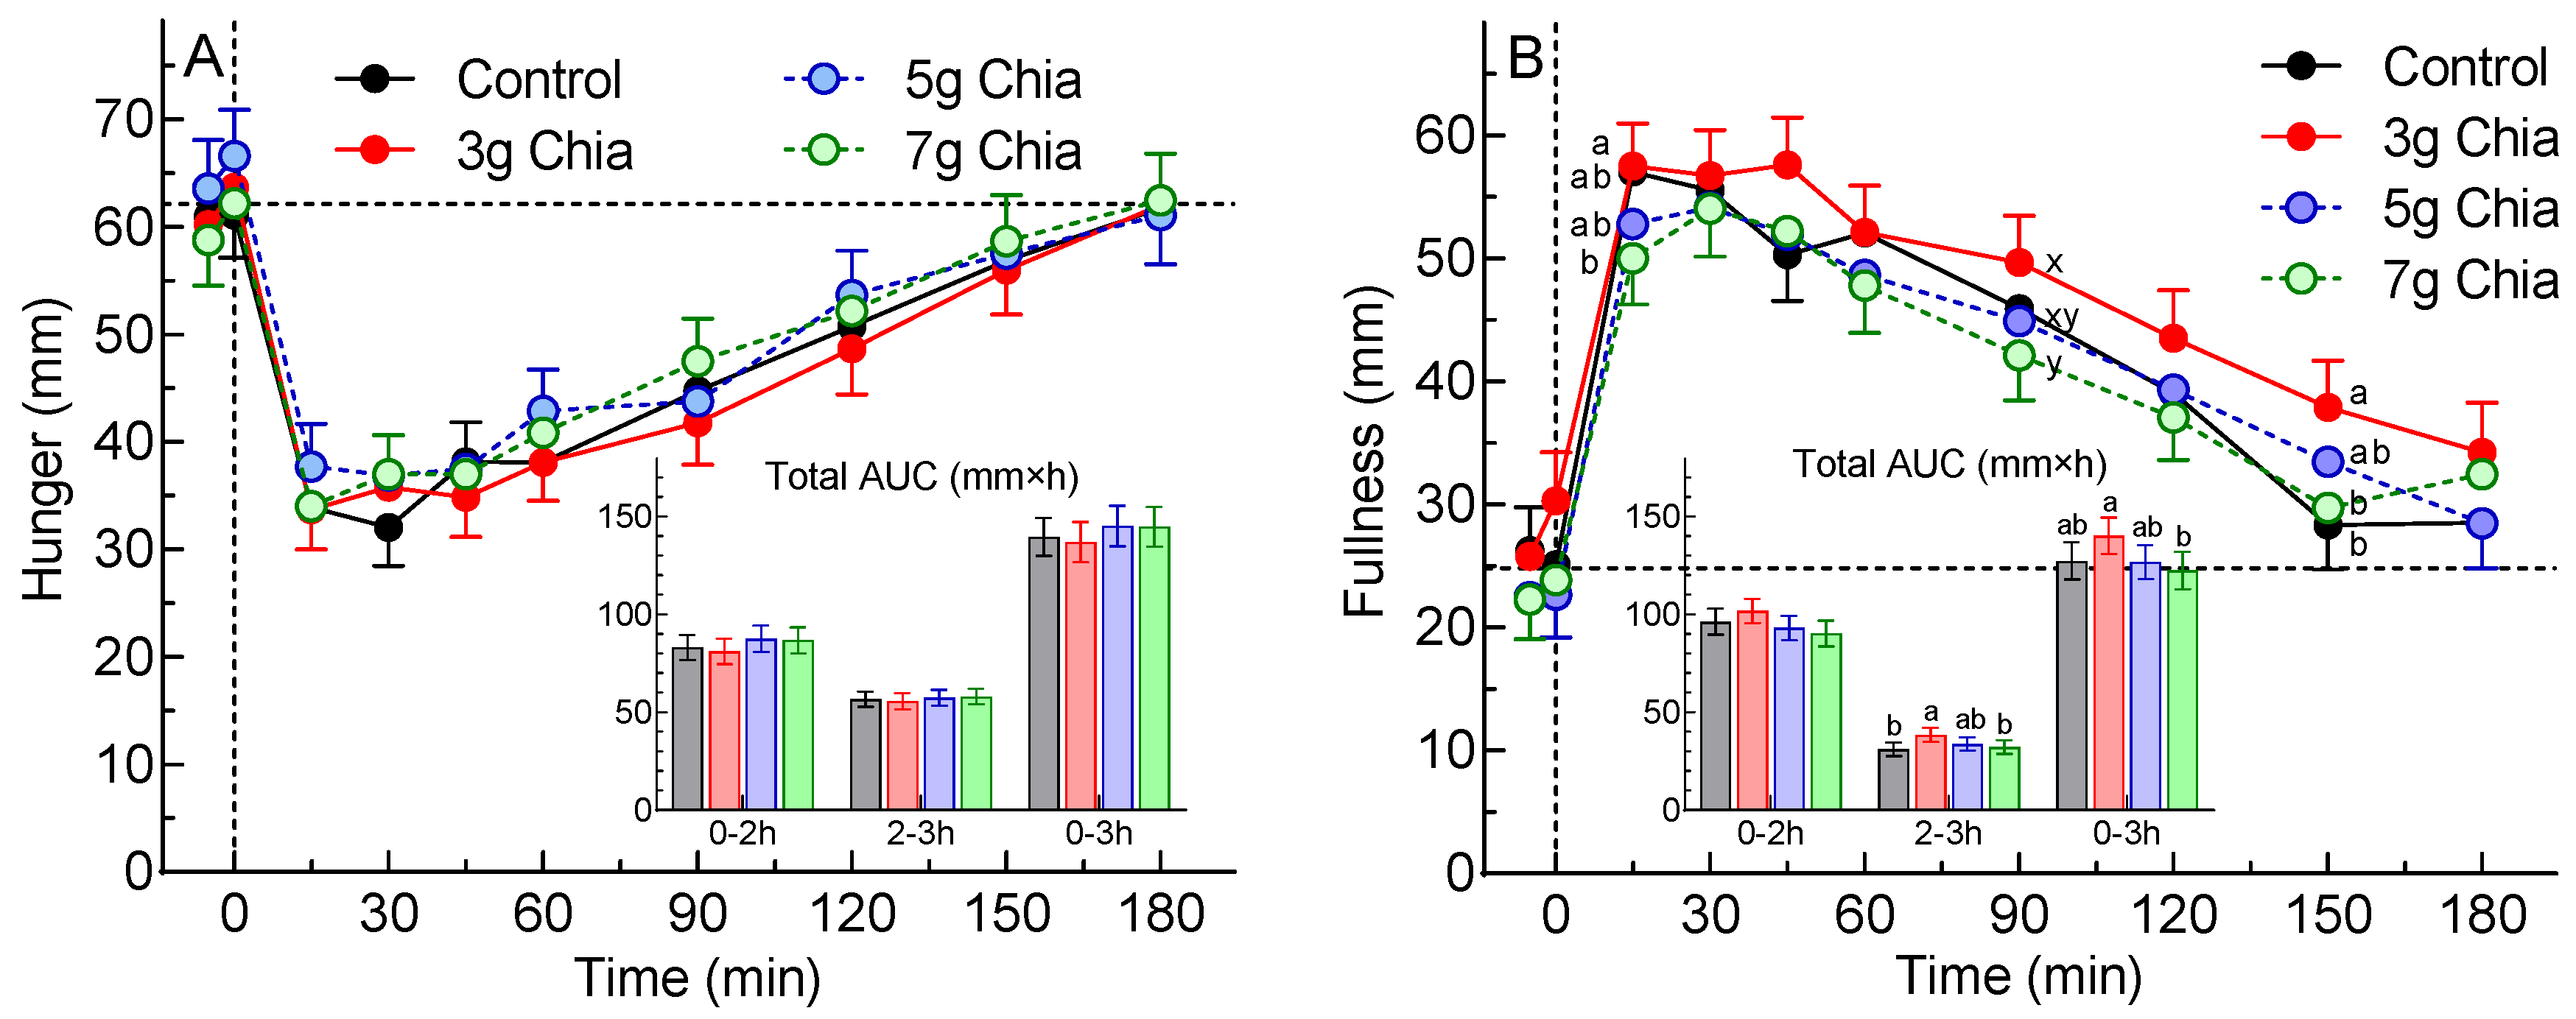
The secondary endpoints of hunger tAUC0-2h and tAUC2-3h did not differ significantly among treatments. However, tAUC2-3h for fullness differed significantly among treatments after square-root transformation (p=0.024) with CS3 being significantly greater than CS0 (Table 2). Mean fullness after CS3 was significantly greater than CS7 at 15 and 90 min, and greater than both CS0 and CS7 at 150 min (Figure 1).
There were no significant differences in tAUC0-2h, tAUC2-3h or tAUC0-3h among treatments for desire to eat, prospective consumption or average appetite (Table 2). The curves for these domains are shown in Supplementary Figure 3.
Table 2.
Total areas under the curve (tAUC) from 0-2, 2-3 and 0-3h of subjective appetite ratings.
| Appetite Domain |
tAUC (mm×h) |
Treatment | ANOVA | |||
|---|---|---|---|---|---|---|
| CS0 | CS3 | CS5 | CS7 | |||
| Hunger | 0-2 h | 83.0±6.4 | 81.1±6.6 | 87.5±6.7 | 86.7±6.6 | p=0.41 |
| 2-3 h | 64.3 [38.1, 78.6] |
60.5 [31.5, 79.9] |
66.6 [32.3, 81.6] |
65.5 [38.0, 80.1] |
p=0.95* | |
| 0-3 h | 139.6±9.7 | 136.8±10.3 | 145.0±10.3 | 144.7±10.1 | p=0.46 | |
| Fullness | 0-2 h | 96.2±6.6 | 101.7±6.2 | 93.0±6.2 | 90.2±6.6 | p=0.054 |
| 2-3 h | 26.4 [20.1, 33.4]y |
33.7 [26.6, 41.6]x |
29.7 [23.5, 36.6]xy |
27.9 [21.7, 34.9]xy |
p=0.024** | |
| 0-3 h | 127.2±9.5ab | 140.1±9.3a | 126.7±8.7ab | 122.4±9.6b | p=0.019 | |
| Desire to Eat | 0-2 h | 83.4±6.7 | 83.7±6.9 | 88.4±7.2 | 88.5±6.8 | p=0.45 |
| 2-3 h | 65.3 [35.1, 75.8] |
60.5 [24.9, 79.6] |
67.1 [27.9, 82.3] |
67.1 [35.9, 78.9] |
p=0.49* | |
| 0-3 h | 138.9±10.5 | 139.0±10.7 | 145.8±11.1 | 145.6±10.7 | p=0.48 | |
| Prospective Consumption | 0-2 h | 94.4±6.6 | 92.4±6.6 | 98.7±6.3 | 97.5±6.6 | p=0.37 |
| 2-3 h | 65.0 [45.0, 77.9] |
63.9 [34.3, 75.9] |
68.9 [43.9, 80.8] |
68.6 [41.7, 84.4] |
p=0.72* | |
| 0-3 h | 154.8±9.9 | 152.0±9.9 | 160.1±9.9 | 159.4±10.2 | p=0.44 | |
| Average Appetite |
0-2 h | 91.2±6.1 | 88.9±6.3 | 95.4±6.2 | 95.6±6.2 | p=0.22 |
| 2-3 h | 68.2 [43.9, 76.8] |
64.7 [34.3, 77.5] |
67.4 [37.7, 81.0] |
69.5 [44.5, 798.6] |
p=0.70** | |
| 0-3 h | 151.5±9.3 | 146.9±9.6 | 156.0±9.5 | 156.8±9.6 | p=0.24 | |
Values are means±SEM (or back-transformed means [95% confidence interval] if square-root transformed, or medians [interquartile range] if not normalized by square-root or log transformation) for n=46 subjects after consuming control cookies (CS0), or cookies containing 3g (CS3), 5g (CS5) or 7g (CS7) chia seeds. tAUC = total area under the curve; ANOVA shows the significance of the main effect of treatment by ANOVA. *Distribution not normalized by square-root or log transformation; p-values from Friedmans ANOVA by ranks. **Distribution normalized by square-root transformation; p-value for transformed values. abMeans not sharing the same letter superscript differ significantly (p<0.025) by Tukey’s test. xyMeans not sharing the same letter superscript differ significantly (p<0.05) by Tukey’s test.
3.2. Glycemic Response
There was a significant main effect of time (p<0.0001) for plasma glucose concentrations, no significant main effect of treatment (p=0.59), and a significant time×treatment interaction (p<0.0001). Fasting glucose was significantly lower before CS0 than CS5 by 0.12 mmol/L (2 mg/dL; Figure 2A). Postprandial plasma glucose differed significantly among treatments as follows: at 15 min CS5<CS0 and CS5<CS3; at 30 CS7<CS0; and at 90 min CS0<CS5 (Figure 2A).
There were significant main effects of time (p<0.0001) and treatment (p=0.0005) and a significant time×treatment interaction (p<0.0001) for glucose increments. Postprandial glucose increments differed significantly as follows: at 15 min CS7<CS0, CS5<CS0 and CS5<CS3; at 30 min CS3<CS0, CS7<CS0 and CS5<CS0; and at 45 min CS3<CS0 and CS7<CS0 (Figure 2B).
Figure 2.
Values are means±SEM (n=46 subjects) for glucose concentrations (panel (A)) and glucose increments (panel (B)) after consuming control cookies (black), or cookies containing 3g (red) 5g (blue) or 7g (green) chia seeds. The inset shows the incremental areas under the curve over 0-2h. abcd Significant difference (p<0.05) by Tukey’s test: a, CS0 vs CS3; b, CS0 vs CS5; c, CS0 vs CS7; d, CS3 vs CS5.
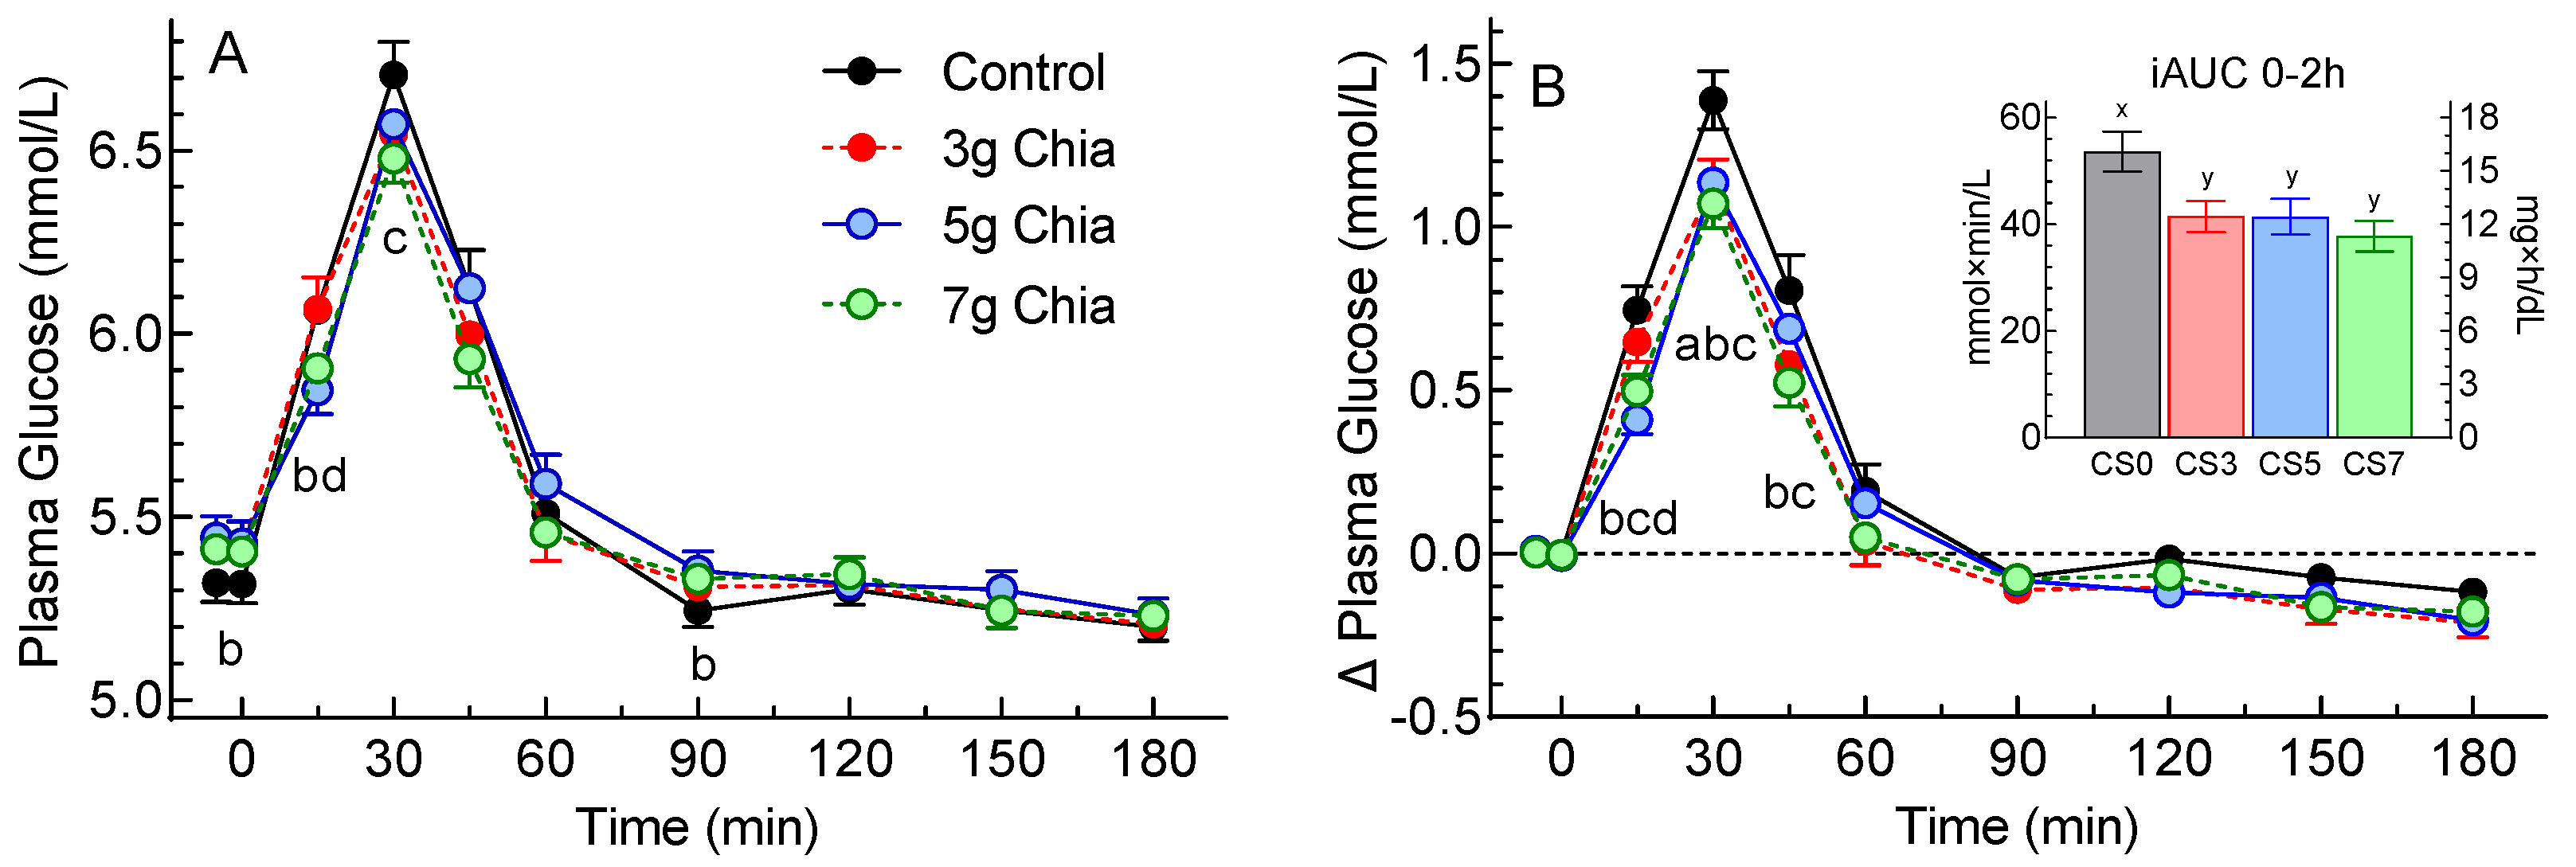
Glucose iAUC0-2h, iAUC2-3h, iAUC0-3h and peak rise after CS0 were significantly greater than the respective values for the other 3 treatments (Table 3). Both measures of glucose variability varied significantly among treatments and decreased in a step-wise fashion as the dose of chia seeds increased (Table 3).
Table 2.
Results for glycemic response.
| Endpoint | Treatment | ANOVA | ||||
|---|---|---|---|---|---|---|
| CS0 | CS3 | CS5 | CS7 | |||
| Glucose iAUC (mmol×min/L) |
0-2h | 53.6±3.7a | 41.5±3.0b | 41.4±3.4b | 37.7±2.9b | <0.0001 |
| 2-3h | 3.33±0.69a | 1.76±0.51b | 0.94±0.39b | 1.68±0.59b | 0.0012 | |
| 0-3h | 57.0±3.9a | 43.2±3.1b | 42.4±3.4b | 39.4±3.0b | <0.0001 | |
| Glucose Peak Rise (mmol/L) | 1.45±0.09a | 1.23±0.07b | 1.20±0.07b | 1.11±0.07b | <0.0001 | |
| Glucose Variability SD(g) (mmol/L) | 0-2h | 0.64±0.04a | 0.57±0.03b | 0.54±0.03b | 0.50±0.03b | <0.0001 |
| 0-3h | 0.61±0.04a | 0.55±0.03ab | 0.52±0.03b | 0.48±0.03b | 0.0001 | |
| Glucose Variability MAGE (mmol/L) | 0-2h | 1.65±0.10a | 1.50±0.09ab | 1.43±0.07ab | 1.32±0.07b | 0.0025 |
| 0-3h | 1.70±0.10a | 1.57±0.09ab | 1.52±0.07ab | 1.40±0.07b | 0.0052 | |
Values are means±SEM for n=46 subjects after consuming control cookies (CS0), or cookies containing 3g (CS3), 5g (CS5) or 7g (CS7) chia seeds. iAUC = incremental area under the curve, SD(g) = standard deviation of glucose concentrations; MAGE = maximum amplitude of glycemic excursion. ANOVA shows the significance of the main effect of treatment by ANOVA. abMeans not sharing the same letter superscript differ significantly (p<0.025) by Tukey’s test.
4. Discussion
4.1. Subjective Appetite
The results showed that, although there was no significant difference among treatments for the primary endpoint of hunger tAUC0-3h (p=0.46), there was for the primary endpoint of fullness tAUC0-3h (p=0.019). Curiously, however, fullness tAUC0-3h after CS3, 140±9 mm×h, was significantly greater than that after CS7, 122±10 mm×h, but did not differ significantly from that after CS0, 127±9, even if the criterion for significance was reduced to p<0.05. There were no significant differences in tAUC0-3 for desire to eat, prospective consumption or average appetite, or any other secondary endpoint related to subjective appetite.
Although the primary statistical analysis (ANOVA followed by Tukey’s test) did not show a significant difference in fullness between CS3 and CS0, a post-hoc analysis by paired t-test, uncorrected for multiple comparisons, showed that fullness tAUC0-3h after CS3 was significantly greater than that after CS0 (p=0.034); however, the use of multiple t-tests is associated with a high risk of making a type 1 error (i.e., declaring a significant difference when in fact it does not exist). Analyzing the data at each time point showed that fullness was significantly greater after CS3 than CS7 at 15 and 90 min, and significantly greater than both CS0 and CS7 at 150 min (Figure 2B). In addition, tAUC2-3h after CS3 was significantly greater than those after both CS0 and CS7. However, these effects may also be type 1 errors, since, although ANOVA showed there was a significant main effect of treatment on fullness ratings (p=0.014), there was no significant time×treatment interaction (p=0.38). It is difficult to find a physiological explanation for the greater fullness after CS3 compared to CS7, but the results for the other 4 domains of subjective appetite are consistent in showing that tAUC0-3h after CS3 was non-significantly lower than that for CS7 for desire to eat, hunger, prospective consumption, and average appetite.
We found significant differences among treatments for fullness, but not for any of the other domains of subjective appetite. This is consistent with the suggestion that increased fullness may be a more positive measure of satiety than hunger, desire to eat or prospective food intake, at least for studies of whole-grain oats and oat bran [15].
Fasting ratings for all 5 domains of subjective appetite did not differ significantly among the 4 treatments, however, the mean difference in fasting fullness between CS3 and CS7, 4.9mm, was greater than that for desire to eat (2.9mm), hunger (1.5mm), prospective consumption (1.1mm) and average appetite (0.1mm). There was no significant effect of treatment on iAUC0-2h, iAUC2-3h or iAUC0-3h for fullness or any other subjective appetite domain (Supplementary Table 2). This suggests that the incremental increase in subjective fullness after eating is not influenced by a small difference in fasting fullness. If this is true, then the fasting difference of 4.9mm would add 15 mm×h to the tAUC0-3h, an amount which is very similar to the difference in mean tAUC0-3h between CS3, 140 mm×h, and CS7, 122 mm×h, and suggest that the difference in fullness tAUC0-3h was an artefact due to the difference in fasting fullness. However, it is not clear whether the fasting level of subjective appetite influences the level attained after eating or not.
The study appears to have been adequately powered. At the time of writing the protocol, we expected to be able to demonstrate a significant 16-17% differences in hunger and fullness tAUC0-3h, but we observed least significant differences that were 13% of the mean of CS0 for both hunger and fullness.
The cookie test meals only contained 140-150 kcal; it is possible that differences in subjective appetite among treatments may have been larger if larger portion sizes had been provided.
3.2. Glycemic Response
We found that 3-7g chia reduced glucose iAUC0-2h by 22-30%, effects that are greater than the 11-24% reductions elicited by 7-24g chia in one study [8], similar to the 21-25% reductions elicited by 7-14g chia in another [9] and only exceeded by the 39 and 41% reductions elicited by 24-25g in 2 studies [9,10]. Although the doses of chia we tested, 3-7g, were much less than those in the other 3 studies we could find, 7-25g, the results of the 4 studies are likely not directly comparable because our test meals contained only 16g avCHO as compared to 50g avCHO in the other 3 studies [8,9,10]. However, when expressed as g chia per g avCHO (g/g), the range of chia doses we used, 0.19-0.44g/g, is within that for the other 3 studies, 0.14-0.50g/g, and the slope of our dose-response curve does not differ significantly from those of the other studies. (Supplementary Figure 4).
Another factor to consider when comparing the results of different studies is that chia seeds contain protein, fat, and dietary fiber. We tried to isolate the effect of the fiber by matching the fat and protein contents of the chia cookies with that of the control (matched F+P). Similarly, 1 previous study matched F+P [8] but the other 2 did not [9,10] (unmatched F+P). Simply adding chia to a carbohydrate food results in a test meal containing more fat and protein than the control [9,10]. Since adding protein and fat to avCHO reduces postprandial glucose iAUC in a dose-dependent fashion [16,17], not controlling for fat and protein would be expected to elicit a greater effect versus controlling for fat and protein. This is consistent with the fact that the slope of the dose-response curve for the 2 studies with unmatched F+P [9,10] was significantly greater than that for the study with matched F+P [8] (Supplementary Figure 4). Adjusting for the effects of the additional fat and protein (using the method described in [18]) reduced the slope for the unmatched F+P studies to be no longer significantly different from that for the matched F+P study [8] (Supplementary Figure 4). However, with only n=4 or 7 points on each dose-response curve, there are too few data to draw any firm conclusions in these respects.
Traditionally glycemic control has been assessed using HbA1c, which is a measure of the average plasma glucose concentration over the previous 2-3 months. However, it has been recognized that increased risk of diabetes complications is also associated with increased short-term [19] and long-term [20] glycemic variability. Because high plasma glucose variability is associated with increased oxidative stress, it has become an important measure of glycemic control in diabetes [21]. The results here showed significant, dose-dependent reductions in SD(g) and MAGE, common ways of assessing glycemic variability.
5. Conclusions
We were unable to demonstrate that cookies containing 3g, 5g or 7g chia seeds had any significant effect on the primary endpoints of tAUC0-3h for hunger and fullness, or on any secondary endpoint related to subjective appetite, compared to control cookies without chia. However, all 3 doses of chia seeds elicited a significantly lower glycemic response than control with the highest chia dose significantly reducing glycemic variability over the 0-3h period of the study.
Supplementary Materials
The following supporting information can be downloaded at: Preprints.org. A Supplementary Information file containing the following: Methods, inclusion/exclusion and withdrawal criteria, participant use of medications, a list of pre-defined serious protocol violations, how missing values were imputed, a figure showing the procedures at each visit and the study flow chart; Results, analytical precision, missing values, protocol violations, adverse events, ratings for desire to eat, prospective consumption and average appetite over 0-3h and incremental areas under the subjective appetite curves; Discussion, a figure comparing the present results with those in the literature.
Author Contributions
Conceptualization, Y.C., V.S., E.H.M.D. and T.M.S.W.; methodology, T.M.S.W. and J.E.C.; validation, T.M.S.W.; formal analysis, T.M.S.W.; investigation, J.E.C. and F.A.; resources, Y.C., V.S. and E.H.M.D.; writing—original draft preparation, T.M.S.W.; writing—review and editing, J.E.C., F.A., E.H.M.D. and Y.C.; visualization, T.M.S.W.; supervision, V.S., E.H.M.D. and J.E.C.; project administration, J.E.C.; funding acquisition, T.M.S.W. and Y.C. All authors have read and agreed to the published version of the manuscript.
Funding
This research was funded by PepsiCo., Inc.
Institutional Review Board Statement
The study was conducted in accordance with the Declaration of Helsinki and approved by the Advara Institutional Review (protocol code Pro00061477 approved on 23 February, 2022).
Informed Consent Statement
Informed consent was obtained from all subjects involved in the study.
Data Availability Statement
The data presented in this study are available on request from the corresponding author.
Acknowledgments
None.
Conflicts of Interest
T.M.S.W., J.E.C. and F.A. are employees of INQUIS Clinical Research, Inc. T.M.S.W., J.E.C., F.A. and INQUIS have no financial interest in PepsiCo and have no claim to any intellectual property which may arise from the results of this study. V.S., E.H.D.M. and C.Y. are employees of PepsiCo, Inc. The funders assisted in the design of the study and provided the interventional products, but had no role in the collection, analyses, or interpretation of the data. The funders asked for the results to be published but had no role in writing the first draft of the manuscript. The funders could suggest changes to the wording in the manuscript, but the content of the final manuscript was determined solely by T.M.S.W.
References
- United States Department of Agriculture. Dietary Guidelines for Americans 2020-2025. URL: https://www.dietaryguidelines.gov/sites/default/files/2021-03/Dietary_Guidelines_for_Americans-2020-2025.pdf, page ix. Accessed 31 December 2021.
- Health Canada. Canada’s Dietary Guidelines for Health Professionals and Policy Makers. URL: https://food-guide.canada.ca/sites/default/files/artifact-pdf/CDG-EN-2018.pdf, page 9. Accessed 31 December 2021.
- Ullah, R.; Nadeem, M.; Khalique, A.; Imran, M.; Mehmood, S.; Javid, A.; Hussain, J. Nutritional and therapeutic perspectives of chia (Salvia hispanica L.): A review. J. Food Sci. Technol. 2016, 53, 1750–1758. [CrossRef]
- Ayerza. R.; Coates, W. Composition of chia (Salvia hispanica) grown in six tropical and subtropical ecosystems of South America. Trop. Sci. 2004, 44, 131–135. [CrossRef]
- Government of Canada. Canadian Nutrient File; Seeds, chia seeds, dried. URL: https://food-nutrition.canada.ca/cnf-fce/serving-portion.do?id=2511. Accessed 31 December 2021.
- Vuksan, V.; Whitham, D.; Sievenpiper, JL.; Jenkins, AL.; Rogovik, AL.; Bazinet, RP.; Vidgen, E.; Hann,a A. Supplementation of conventional therapy with the novel grain Salba (Salvia hispanica L.) improves major and emerging cardiovascular risk factors in type 2 diabetes: Results of a randomized controlled trial. Diabetes Care 2007, 30, 2804–2810. [CrossRef]
- Toscano, L.T.; da Silva, C.S.; Toscano, L.T.; de Almeida, A.E.; Santos Ada, C.; Silva, A.S. Chia flour supplementation reduces blood pressure in hypertensive subjects. Plant Foods Hum. Nutr. 2014, 69, 392–398. [CrossRef]
- Ho, H.; Lee, A.S.; Jovanovski, E.; Jenkins, A.L.; Desouza, R.; Vuksan, V. Effect of whole and ground Salba seeds (Salvia Hispanica L.) on postprandial glycemia in healthy volunteers: A randomized controlled, dose-response trial. Eur. J. Clin. Nutr. 2013, 67, 786–788. [CrossRef]
- Vuksan, V.; Jenkins, A.L.; Dias, A.G.; Lee, A.S.; Javanovski, E.; Rogovik, A,L.; Hanna, A. Reduction in postprandial glucose excursion and prolongation of satiety: Possible explanation of the long-term effects of whole grain Salba (Salvia Hispanica L.). Eur. J. Clin. Nutr. 2010, 64, 436–438. [CrossRef]
- Vuksan, V.; Choleva, L.; Jovanovski, E.; Jenkins, A.L.; Au-Yeung, F.; Dias, A.G.; Ho, H.V.T.; Zurbau, A.; Duvnjak, L. Comparison of flax (Linum usitatissimum) and Salba-chia (Salvia hispanica L.) seeds on postprandial glycemia and satiety in healthy individuals: A randomized, controlled, crossover study. Eur. J. Clin. Nutr. 2017, 71, 234–238. [CrossRef]
- Ayaz, A.; Akyol, A.; Inan-Eroglu, E.; Cetin, A.K.; Samur, G.; Akbiyik, F. Chia seed (Salvia hispanica L.) added yogurt reduces short-term food intake and increases satiety: Randomized controlled trial. Nutr. Res. Pract. 2017, 11, 412-418. [CrossRef]
- Rogers, P.J.; Blundell, J.E. Effect of anorexic drugs on food intake and the micro-structure of eating in human subjects. Psychopharmacology 1979, 66, 159–165.
- Snedecor, G.W.; Cochran, W.G. Statistical Methods, 7th ed. Iowa State University Press, Ames, IA, 1980.
- Wolever, T.M.S.; Tosh, S.M.; Spruill, S.E.; Jenkins, A.L.; Ezatagha, A.; Duss, R.; Johnson, J.; Chu, Y.; Steinert, R.E. Increasing oat β-glucan viscosity in a breakfast meal slows gastric emptying and reduces glycemic and insulinemic responses but has no effect on appetite, food intake, or plasma ghrelin and PYY responses in healthy humans: A randomized, placebo-controlled crossover trial. Am. J. Clin. Nutr. 2020, 111, 319–328. [CrossRef]
- Matthews, R.; Chu, Y. The effect of whole-grain oats, oat bran and isolated beta-glucan on indices of satiety and short-term energy intake. Submitted and being revised.
- Moghaddam, E.; Vogt, J.A.; Wolever, T.M.S. The effects of fat and protein on glycemic responses in nondiabetic humans vary with waist circumference, fasting plasma insulin and dietary fiber intake. J. Nutr. 2006, 136, 2506–2511. [CrossRef]
- Lan-Pidhainy, X.; Wolever, T.M.S. The hypoglycemic effect of fat and protein is not attenuated by insulin resistance. Am. J. Clin. Nutr. 2010, 91, 98–105.
- Wolever TMS. Is glycaemic index (GI) a valid measure of carbohydrate quality? Eur J Clin Nutr 2013;67:522-31.
- Mo, Y.; Wang, C.; Lu, J.; Shen, Y.; Chen, L.; Zhang, L.; Lu, W.; Zhu, W.; Xia, T.; Zhou, J. Impact of short-term glycemic variability on risk of all-cause mortality in type 2 diabetes patients with well-controlled glucose profile by continuous glucose monitoring: A prospective cohort study. Diabetes Res. Clin. Pract. 2022, 189, 109940. [CrossRef]
- Chen, J.; Yi, Q.; Want, Y.; Want, J.; Yu, H.; Zhang, J.; Hu, M.; Xu, J.; Wu, Z.; Hou, L.; Zhang, Z.; Yi, W.; Tu, Z.; Yang, K.; Guo, K.; Zhou, Y.; Geng, T.; Pan, X.; Liu, G.; Song, P.; Pan, A. Long-term glycemic variability and risk of adverse health outcomes in patients with diabetes: A systematic review and meta-analysis of cohort studies. Diabetes Res. Clin. Pract. 2022, 192, 110085. [CrossRef]
- Breyton, A.; Lambert-Porcheron, S.; Laville, M.; Vinoy, S.; Nazare, J. CGMS and glycemic variability, relevance in clinical research to evaluate interventions in T2D, a literature review. Front. Endocrinol. (Lausanne) 2021, 12, 666008. [CrossRef]
Disclaimer/Publisher’s Note: The statements, opinions and data contained in all publications are solely those of the individual author(s) and contributor(s) and not of MDPI and/or the editor(s). MDPI and/or the editor(s) disclaim responsibility for any injury to people or property resulting from any ideas, methods, instructions or products referred to in the content. |
© 2023 by the authors. Licensee MDPI, Basel, Switzerland. This article is an open access article distributed under the terms and conditions of the Creative Commons Attribution (CC BY) license (http://creativecommons.org/licenses/by/4.0/).
Copyright: This open access article is published under a Creative Commons CC BY 4.0 license, which permit the free download, distribution, and reuse, provided that the author and preprint are cited in any reuse.


