Submitted:
30 April 2023
Posted:
02 May 2023
You are already at the latest version
Abstract
Energy, with very low demand and replacement elasticity, is a key component of production as well as a good for consumption. Inflation as a whole is instantly impacted by rising energy prices. After lockdowns were lifted in 2020–2021 and the global economy started to recover, oil prices began to rise. This trend continued with escalating geopolitical tensions and the eventual crisis in Ukraine brought on by Russia's invasion in February 2022. The current paper examines how the tourism industry has been impacted by rising energy commodity prices from the perspectives of travelers and hotel managers. Hereby a qualitative and a quantitative process is being used for a thorough examination of the consequences of inflated prices. More specifically, the three methods which were used are: descriptive analysis, correlation matrices and regression analysis. For the latter, all models appear to explain well the variation of the variables and provide reliable results. This study concludes that, although the overall inflation caused by higher energy prices was impactful for the individuals as well as for the businesses, however the touristic season of 2023 is expected to be one of the most fruitful ones yet, especially for the Greek economy, since strong numbers are reported (in revenues, expenditure and percentage of expected guests), while tourists are seemingly not willing to sacrifice their holidays altogether, but make other modifications in their lifestyle and choices. Finally, it is important to stress that governments should start integrating sustainable energy as a key component.
Keywords:
energy prices
; hospitality
; risk
; survey
; tourism
1. Introduction
The tourism industry depends heavily on energy, as well as its byproducts and goods. Additionally, certain economies depend more than others on the tourism industry. To mention a few, these economies include Greece, Iceland, Cyprus, Spain, Mexico, Portugal, and Croatia. The GDP contribution of tourism provides a better reflection of this dependency rate. More specifically, the Greek economy's score for the year 2019 was around 20%, coming in second place to Iceland (22%) (Adamopoulou et al., 2022). Due to globalization and easier access vacation, the tourist industry may rebound from crises, shocks, and disasters today more quickly than it did in the past.
Energy crises and rising prices have historically had a wide range of consequences on the entire economy. The input costs for several goods that are part of the core consumption bundle have grown as a result of higher energy prices, which has raised the core consumer price index (CPI). (Huang and Huang, 2009) The causes and effects of oil prices will also be unequally distributed because the worldwide trading of oil is a geographic and political issue. Europe has historically seen some of the worst consequences of rising oil and energy costs due to its significant reliance on oil and gas for both production and consumption. 2022 (Bjørnland, 2022) Additionally, it is clear from the calculated welfare consequences that an increase in food and energy prices would either result in a significant rise in compensation costs or a decline in consumer welfare, both of which would be difficult for households with low incomes. (Huang and Huang, 2009)
Gas prices had been far more consistent than oil prices during the preceding 20 years, but this started to shift in the second half of 2021. (Gros and Shamsfakhr 2022). Inflation is rising as a direct result of the higher energy prices, which reduces consumer spending. This is a concern with the increase in energy prices in 2021–2022. (Hu, 2022)
The energy crisis, which began after the first COVID-19 lockdown and intensified when Russia invaded Ukraine, is severe and recent, and as a result, its results and outcomes are of great importance to the tourism industry, which was already negatively impacted by the aforementioned event. Therefore, the purpose of this paper is to examine the current and potential effects of rising energy prices on the tourism industry as perceived by hotel managers and travelers, while also conducting research using both qualitative and quantitative methods. This study is new since there has previously been little to no research on how energy prices affect the tourism industry from both the standpoint of customers and producers. The main goal of this research is to show how and to what extent the rising cost of energy has affected the lodging industry, as well as how consumers have responded to these changes. Since various factors have changed over time (such as technology, accessibility, disposable money, etc.), it would be good to examine how the tourism sector has evolved or adapted as well as how robust it appears today.
The remainder of the current paper is structured as follows. An overview of the existing literature is being reviewed and presented in Section 2. Section 3 demonstrates the methods and overall structure of the study followed, in order to examine the effects that the energy crisis had on individuals as well as the business managers. In Section 4, the analysis, graphs and tables are presented, alongside the results of the questionnaires. While last, in Section 5, the conclusions are presented as extracted from the aforementioned analysis.
2. Literature Review
Energy prices history
Increased energy prices instantly bestow to general inflation, and if wages continue to stagnate, they may further reduce the gross national product (GNP) and employment by increasing the marginal cost of production. (Pindyck, 1980) Oil and coal prices typically fell between 1870 and 1900, when both commodities started to be produced on a significant scale. (Pindyck, 1999) When oil prices were increased in 1973 by the Organization of Petroleum Exporting Countries (OPEC), the cost of oil quadrupled in a couple of months. (Bösch and Graf, 2014) Oil prices essentially quadrupled by 2008 from an average of $26.12 per barrel in 2002 to $99.57 per barrel, while the price of jet fuel more than quadrupled from $0.69 per gallon to $2.96 per gallon during the same time period. The price of oil and jet fuel in December 2019 was still more than three times higher than it was in 2002, despite having dropped from their 2008 highs. (Atems, 2021) Due to the efforts taken to contain the pandemic and the resulting decreased supply of energy products, COVID-19 resulted in lower energy consumption in the final year of the second decade of the 2000s. Due to the economies' recovery and a lack of action in 2021, energy demand increased once again but was only partially satisfied by supply. (Hu, 2022) In the European Union a year later, as of October 2022, the annual inflation rate was 11.5%. (europa.eu, 2022)
Origins of the rise in energy prices
Gas price increases are the primary factor driving energy price increases in 2021, but other secondary factors such as increasing coal and carbon costs, increased demand, weather conditions, modest renewable generation, dropping domestic gas production, and some natural gas supply constraints caused by maintenance and the absence of funding in new production also played a role in Europe. (ACER, 2021)
The eventual crisis in Ukraine brought on by Russia's invasion in February 2022 and the escalating global tensions. The latter resulted in severe penalties against Russian goods while also preventing Ukraine from supplying homegrown goods. 2022 (Bjørnland, 2022) Moreover, the largest gas supplier to the European market, i.e., Russian energy company Gazprom, with a 35% market share, makes gas increasingly harder to come by in Europe. (ACER, 2021) As a result of the high increase in the cost of imported fuels, which also contributed to a dramatic increase in overall consumer expenses, inflation rates in numerous European countries approached double digits. (Ari et al., 2022)
On the contrary, due to abundant shale gas production, the US is a net exporter, protecting US prices from negative effects; however, export capacities are limited, at least in the short to medium term. As a result, the US market is safeguarded, where current immediate costs are around ten times lower than in Europe. In addition, there is a lot of variation within the EU itself. Because some countries' consumer tariffs were based on wholesale prices, the cost of electricity for consumers varies widely across the EU. (Gros and Shamsfakhr, 2022)
Impact of the energy prices on economies
A number of goods that are included in the core consumption basket have greater input costs as a result of higher energy prices, which is why the core consumer price index (CPI) is increasing. (Gros and Shamsfakhr, 2022)
Because the global trading of oil is a geographic and a political issue, the causes and effects of oil costs will be unequally distributed. Oil-exporting countries, such as those in the Middle East, Australia, Canada, Norway, Russia, and, to a lesser extent, Brazil, are less susceptible to oil-related crises than oil-importing countries, which mostly include the Western countries that are the main sources of international tourism. But it was also found that, despite the short-term benefits of higher oil prices for oil-exporting countries, their economies would also suffer over the long run due to a weaker global economy. (Becken, 2011)
Increasing oil and fuel prices can have a substantial impact on the cost of living, not just for luxury items and services like cruise ship excursions and international travel, but also for essentials like fast day trips to nearby or state parks. (Oh and Hammitt, 2011)
The tourism sector
In 2020, the tourism sector employed more than 250 million people, or one in every twelve workers globally. It produces 5% of total tax revenue, 11% of global consumer spending, 7% of total investment, and 33% of the world's services trade. (Kyrylov et al., 2020)
As a result of the industry's globalization, tourism businesses have grown rapidly on a global scale in order to enhance their market share and profitability. Globalization has, however, also exposed organizations to a wider range of "global hazards" associated with running enterprises at such a size because it is generally seen as being confusing and chaotic. As a result, the tourism sector is quite susceptible to external forces and impacts in the broader operational environment. (Ritchie, 2004)
The accessibility of oil is crucial to the current tourism business model. Previous studies have demonstrated that the tourism sector is fuel-driven and extremely energy-intensive because of the inherent transport component. (Becken, 2008)
Increased oil prices can also hinder the anticipated growth of emerging markets like China and India. (Becken, 2011)
Hospitality sector
The accommodation service is elastic in terms of costs. It suggests that occasionally, lodging can qualify as a "luxury good". (Petricek et al., 2020)
In relation to energy, in all hotel categories, with the exception of upper-upscale and all urban regions, the demand for lodging declines as gas prices increase. Not only that, but the main utility expense for the hotel industry, accounting for around 60% of overall costs, is energy. (Usman et al., 2020) Hotels spend money on energy in the following categories, in that order: ventilation, air conditioning, lighting (with TV and radio), kitchen, laundry, and room heating and hot water. (Upadhyay and Vadam, 2015) Therefore, it becomes evident how energy-dependent the hospitality sector is and consequently energy-sensitive.
Transportation sector
The corrected cross-price elasticity of transportation services with respect to the price of automobiles is positive, but it also shows that there is a substitution relationship between them. (Huang and Huang, 2011) As a result, the accessibility of inexpensive transportation has an impact on global visitor flows. (Becken, 2011)
Moreover, hedging is a unique characteristic of the airline sector since it eliminates or considerably reduces the risk of unpredictably high price increases when at least some of their fuel purchases are made in advance. (Williams and Baláž, 2014)
The cost of jet fuel and crude oil substantially increased in 2021 and the beginning of 2022, putting more pressure on airline finances. (Walsh, 2022)
Food and Beverage sector
After lodging, tourists' second-highest outlay is food at restaurants and bars, which averages 16.88 euros per day or 17.24% of daily consumption. 37 respondents, or 86%, stated that the key reason for price rises in the Croatian restaurant study was the increase in the cost of raw items like food and beverages. (Miljak et al., 2022)
Food inflation affects lower-income households more than higher-income households because a bigger percentage of their total spending is spent on food, even though food only accounts for 14% of the overall Consumer Price Index. Along with alcohol and tobacco, food was the second-largest contributor to inflation in the Euro area in October 2022. (Glauber and Smith, 2022)
Recreation sector
The increase in energy (and particularly gasoline) prices had a greater influence on the demand for leisure travel by marginal passengers than it did on their demand for necessary travel, such as business visits. (Arbel and Abraham Ravid, 1983)
Consumers’ behavior
The frequency and length of leisure travel are strongly influenced by income. Therefore, it is projected that reduced income impacts caused by increased oil prices will reduce foreign travel and redistribute flows. Additionally, the cost of tourism not only influences income but also where customers travel and the type of holidays they take. Demand decreases as transportation costs rise, depending on how responsive a market is to price changes. (Becken, 2011)
Changes in energy prices may have a direct impact on consumer spending through one of four mechanisms. First, higher energy prices are anticipated to reduce customers' discretionary income because they will have less money to spend after paying their energy bills. By raising concerns about the direction that energy prices will go in the future, fluctuating energy prices may also discourage consumers from making long-term purchases of consumer durables. Thirdly, even if consumer decisions are reversible, consumption may decline as a result of energy price shocks as people build up their reserve funds for contingencies. Fourth, energy-intensive durables will see their usage fall significantly more than other durables. (Edelstein and Kilian, 2009) To put this in statistical context, households in Europe typically spend just over 10% of their total expenditure on energy-related goods. (Ari et al., 2022)
Producers’ behavior
It is prudent and pertinent for managers of tourist destinations to consider their current oil needs for tourism and plan for a future where oil is unavailable, prohibitively expensive, or unbearable owing to climate change constraints. In light of potential future oil supply reductions. One essential part of this is minimizing the usage of fossil fuels when traveling to and inside the destination. Numerous tactics can be used at the destination level to help achieve this goal, including encouraging the use of renewable energy sources, reducing the demand for energy inputs (e.g., passive building), improving the transportation and lodging sectors' energy efficiency, and more. (Becken, 2008)
Risks in tourism sector
Risk assessment is essential in the tourist sector because it is a particularly "sensitive" sector that is vulnerable to many negative influences from both economic and non-economic sources. (Štetić, 2012) Exogenous, non-systematic risks like sociopolitical upheavals and natural calamities pose a significant danger to the system. Furthermore, it is impossible to avoid unsystematic risks, which arise from market volatility brought on by exogenous dangers like economic recessions. (Williams and Baláž, 2014)
Renewable energy-future
Long-term, it is envisioned that the use of renewable energy sources will lead to a generation of energy that is both abundant and economical (due to the ultimately low marginal costs of renewable energies). We don't know for sure if or when we'll enter a new energy universe. Diversification of more conventional energy sources might, for the time being, help to lessen market imbalances. Russia currently supplies more than 50% of Germany's natural gas and more than a third of its mineral oil, making it the country's sole energy supplier. The amount of Russian gas imported by Germany has increased as a result of the depletion of North Sea gas supplies. (Heymann and Becker, 2022)
3. Methodology
Design of the research
Two unique survey questionnaires were created for the study's aims. The first questionnaire, which had 41 questions, was geared toward travelers in general. The second questionnaire, which had 23 questions, was geared toward hotel owners and/or other lodging establishments. The first questionnaire was completed by 182 people chosen at random, and the second one by the management of 13 different lodging establishments. The sampling's main goal was to find people who represented variety in terms of race and gender.
Questionnaires
25 multiple-choice questions and 16 open-ended questions make up the survey for tourists. There are five multiple-choice questions and eighteen open-ended ones in the survey of accommodation businesses. These questions are separated into two and three main categories, respectively. It is important to note that the two questionnaires share a number of items. By comparing the outcomes of the two studies, it will be possible to draw more accurate and secure conclusions.
Tourists’ questionnaire
For the tourists’ survey questionnaire, it was dived into two parts. The first part contained demographic enquiries, developed to ascertain the respondents' age, income, gender, and other demographic details. The second part, contained the main questionnaire enquiries, developed to ascertain the results, modifications, and generally more information about the participants' tourism activity during a three-year period, i.e., 2021, 2022 and 2023.
In reference to part A of the survey, typically, demographic inquiries assist in creating the profiles of tourists or customers, identifying their needs, habits, and approaches. Additionally, an analyst can gather more accurate data about a person's values, habits, and practices by understanding their background. Regarding part B of the questionnaire, most of the open-ended questions in this second section of the questionnaire were divided into three categories. The threefold more explicitly refers to the three time periods, or the years 2021, 2022, and 2023. In this manner, we would like to compare the consequences and effects of the greater inflated energy prices in the past (2021), the present (2022), and the future (2023).
Accomodations’ questionnaire
The accommodations’ survey was divided into three parts. The first past included demographic enquiries of the managers, once again, developed to ascertain the respondents' age, income, gender, and other demographic details. The second part included enquiries developed to ascertain some crucial business information of the lodging places. Last, the third part included enquiries in relation to the tourism-consumption, for which the inquiries were created to glean responses and results regarding the tourism activity from the managers' point of view.
In regard to part A of the survey, usually, demographic questions help in profile creation by revealing knowledge, habits, and methods. A person's background can also help an analyst acquire more specific information about their values, routines, and behaviors. Then, for part B, one can gain more inside into the lodging place, its unique properties and circumstances, while for part C, more operational-oriented as well as efficiency and effectiveness- related qualities come to light.
Procedure
Specifically, "Facebook" was used as the only social media platform to contact participants regarding the tourists' questionnaire. The recruitment cycle in 2023 lasted for two weeks, from January 25 to February 7. It should be mentioned that there are restrictions when using social media platforms for recruitment strategies.
The researcher privately contacted the lodging establishments regarding the questionnaire for accommodations, and used the platform provided by Google Forms to gather the responses.
A declaration of privacy and confidentiality, an overview of how the questionnaire was employed, and the average time it took to complete each survey were given to the participants. Furthermore, examples or additional instructions were provided when necessary to ensure complete understanding of the questions.
Data
Using the Microsoft Excel application, a data cleanup was initially started. Some responses, in particular, were improved. These revisions address grammatical errors, the English translation, numerical errors, and structural corrections.
In order to describe the data in the beginning of the data analysis, descriptive statistics were first used. A correlation analysis was then carried out on a secondary level to look for any correlation patterns in the dataset. The data has to be coded in binary/dummy form in order to do the correlation analysis. In order to better understand the data, their correlation patterns, and their reliance, a regression analysis was lastly carried out.
Three models were tested in terms of regression analysis using the data from the tourists’ questionnaire. For the first model “expenditure 2023” was the dependent variable, while for the second and third models the dependent variables were “income range” and “days of summer vacation 2023”, correspondingly.
Furthermore, three models were conducted and examined in relation to the regression analysis for the accommodations’ questionnaire. For the first model “change in number of days spend by guests 2023” was the dependent variable, while for the second and third models the dependent variables were “change in number of guests 2023” and “change in expenditure of guests 2023” respectively.
Additionally, the principal hypotheses for the regression analysis and for all six models combined were:
- Null hypothesis: The factors are unrelated.
- Alternative hypothesis: The variables depend on each other.
Not to overlook the fact that the anticipated data for both phases of the analysis came in both qualitative and quantitative forms. Additionally, a qualitative analysis was more productive for the qualitative variables, since a large percentage of the open-ended questions offered.
4. Analysis and Discussion
By abbreviating the results, hereby only the most intriguing results are presented.
Accommodations Descriptive Statistics
Specialization of the managers’ studies
As evident from the percentages of the analysis , a staggering 46.15% of managers have studied specifically in the field of "Tourism/Hospitality," which requires knowledge and abilities learned via studies. 15% each was held by the "Law" and "Marketing" fields. The data then demonstrate 23% of other study areas, with "Accounting" and "Geotechnologist" as the other two categories. One study area was left out of the data.
Accommodation’s quality stars
The dataset has an average of 3 stars per star. When the sample is analyzed, it is clear that 38% of lodging establishments have 3 stars, whereas 30% have 4 stars. 15% of the sample's accommodations were 5 star lodgings. The two stars that make up 8% of the distribution, zero and two, respectively, are the outliers. There was no representation of the one-star qualification in this sample.
Change in number of guests 2023
An increase of 50% is determined by comparing the average change in the number of guests between 2022 (10%) and 2023 (15%). Additionally, all managers (i.e., 100%) have reported an increase in the number of guests ranging from 2% to 40% and as anticipated for the year 2023. The range between 1% and 24% of rise has the highest concentration (77%). The remaining 23% rises by between 25% and 60%. As a result, a steady rise is anticipated for the approaching season, which implies an expansion of the tourism industry as a whole.
Change in number of days spend by guests 2023
The average number of days spent by visitors during the forthcoming 2023 summer season was +13%. This proportion has grown by 225% when compared to the percentage from the prior year (2022). Additionally, 85% of hotel managers have reported an increase in days, while only 15% have indicated a 0% change for the same summer of 2023. To elaborate on the first point, 54% will see an increase between 1% and 10%, while 31% will see a jump between 11% and 50%.
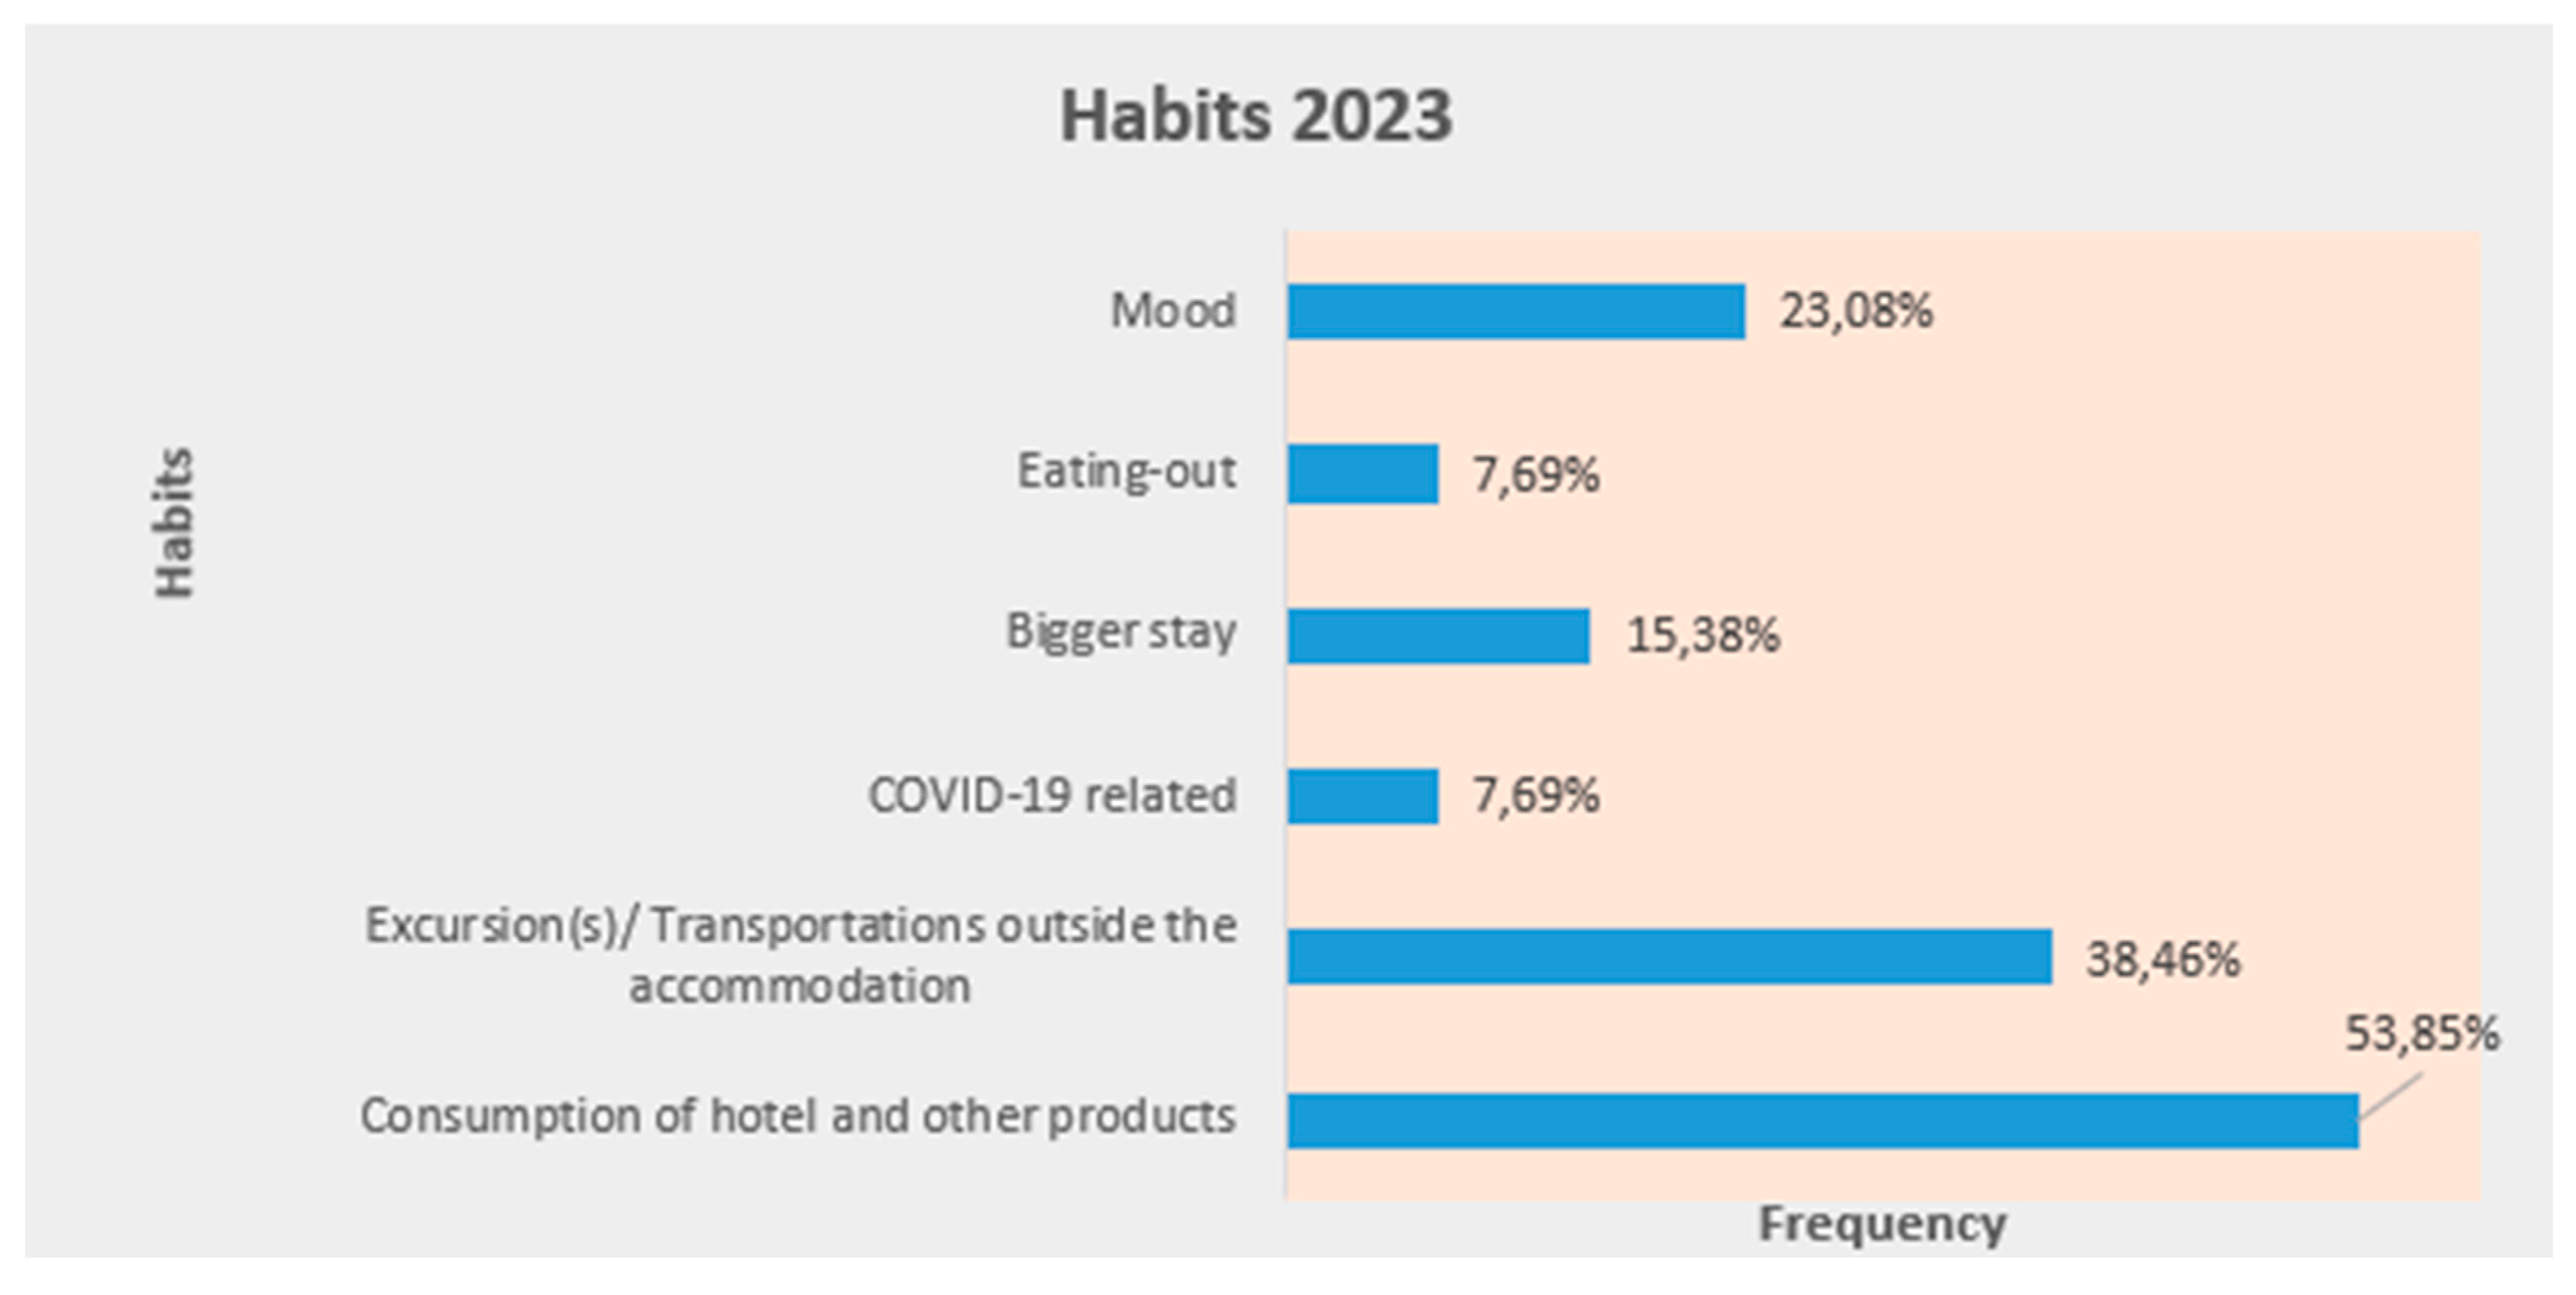
Guests’ habits 2023
Six primary categories were present when navigating the upcoming visitor behaviors for the summer of 2023; they are shown in graph 1 below as frequency percentages. Starting off, the majority of managers, namely 54% of them, have stated that they anticipate a rise in the demand for housing as well as other goods and services. Additionally, 39% anticipate more trips to nearby destinations, one manager expects things to return to normal completely, two expect an increase in the length of guests' stays, and one anticipates that tourists will demand more dining out. Last but not least, the last category—guests' mood—presented some fresh components. According to one manager, because costs are so high, they may expect their customers to "expect and demand a perfect service and facilities." According to another manager, visitors want to "live like a local," therefore they anticipate a more specialized experience and "greener practices" from the lodging. Finally, one manager anticipates that visitors will pay closer attention to the level of satisfaction they achieve while visiting.
Graph 1.
Change in guests’ expenditure 2023
Analysis and comparison show that there is a 120% increase between the average rate for the previous season (5%) and the average rate for 2023 (which is positive 11%). In addition, 85% of managers said they anticipate more guest spending in 2023, while only one manager anticipates a 0% change, as shown in graph 6 below. Last but not least, a manager of a lodging facility described their anticipated decline in spending for the same year. The precise predicted decline is -4%. On the other hand, 38% and 46% of managers respectively indicate increases of 20% and 30%.
Impacts of energy crisis
Only one manager from the entire sample stated that the energy crisis had no impact at all on their lodging business. Every other manager spoke of a detrimental effect. More precisely (in frequency terms) 92% of managers have noticed rising energy costs. Additionally, 15% of managers indicated price increases for lodging goods and services, while 15% also mentioned service time restrictions brought on by higher energy costs.
Energy-saving practices 2022
The proportion of lodgings utilizing energy-saving technology and those avoiding them changed in 2022. The proportion of lodging establishments that do not conserve energy has reduced. The percentage was 15% in 2022 as opposed to 23% in the prior year. As a result, the percentage of lodgings using energy-saving techniques increased to 85%. This change can be attributed to the sharp rise in energy product costs in 2022. In actuality, the energy crisis had a negative effect on the accommodation that made the changeover possible. The percentage for "solar panels," "LED lights," and "undisclosed practices" was the same as in 2021. In 2022, the category "time limitation of appliances and electricity" rose to 46%, while the category "other (techniques)" also increased to 23%. The "other" techniques include the use of awnings, motion sensors, gas heating, and greater insulation.
Tourists Descriptive Statistics
Gender
Since roughly 58% of the sample were "female" participants, roughly 42% were "male," and one participant chose the option "other," a non-disclosed gender, the gender distribution in the current dataset was distributed fairly uniformly.
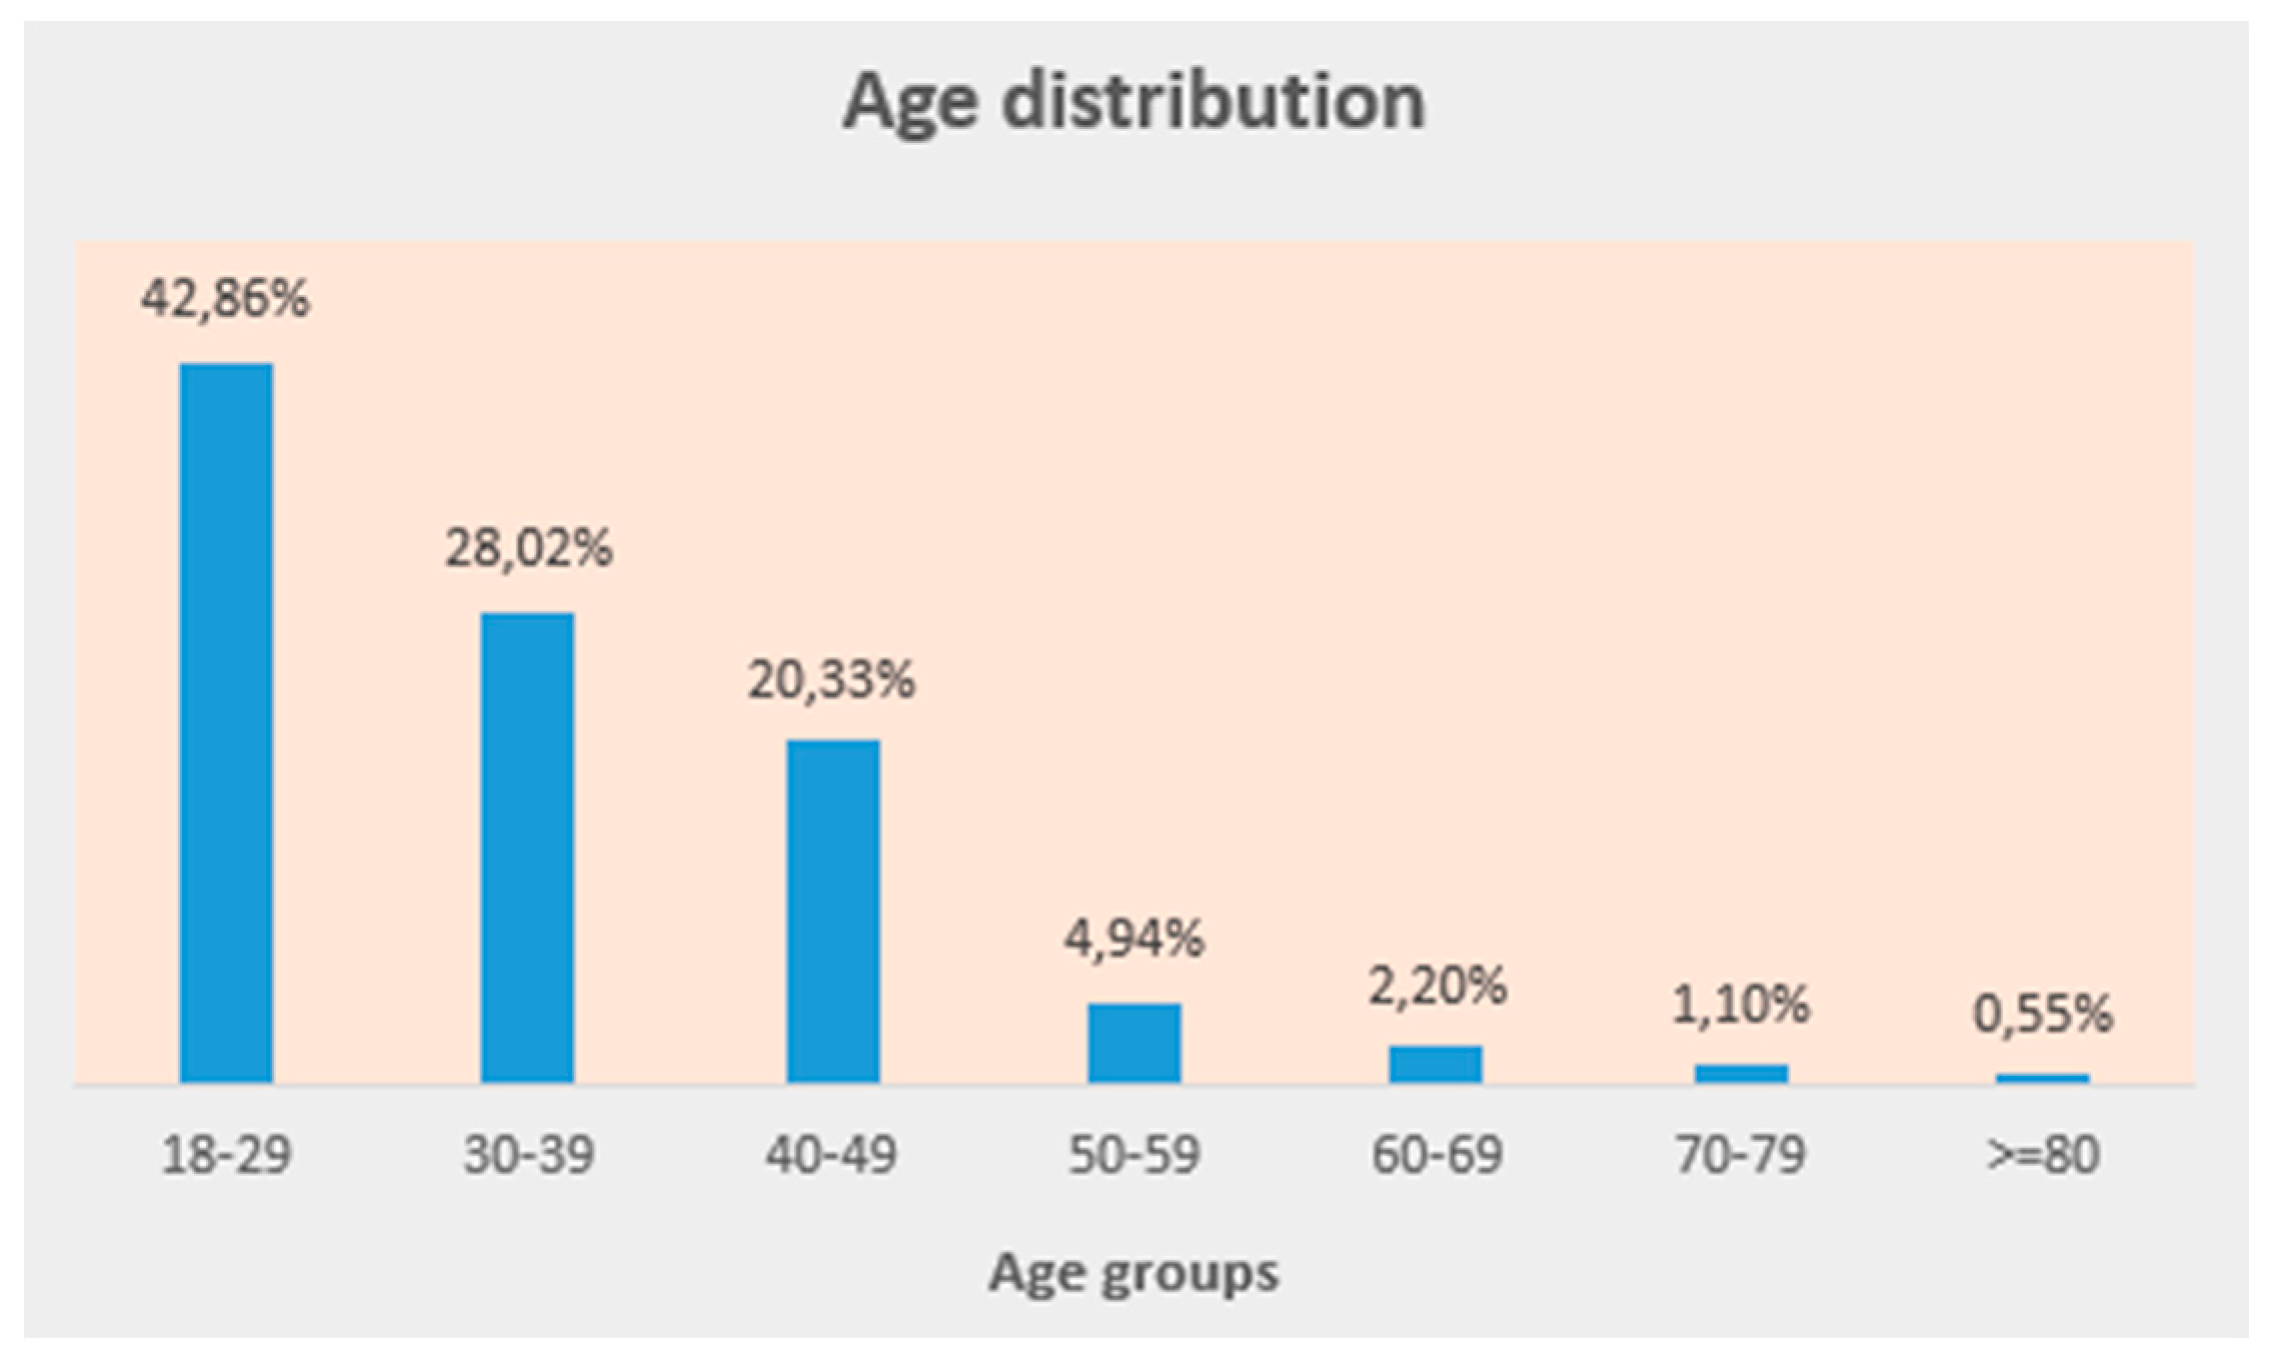
Age
It is evident that the sample comprised members of every age group by looking at graph number 2 below. The age groups "18-29" (43%), "30-39" (28%), "40-49" (20%), and "50-59" (%) made up the majority of the data. The final three categories together held about 4%. Due to the survey's distribution strategy, which involved Facebook, younger audiences were specifically targeted in terms of age demographic and concentration. But as can be seen from the results, the distribution accurately reflects the population.
Graph 2.
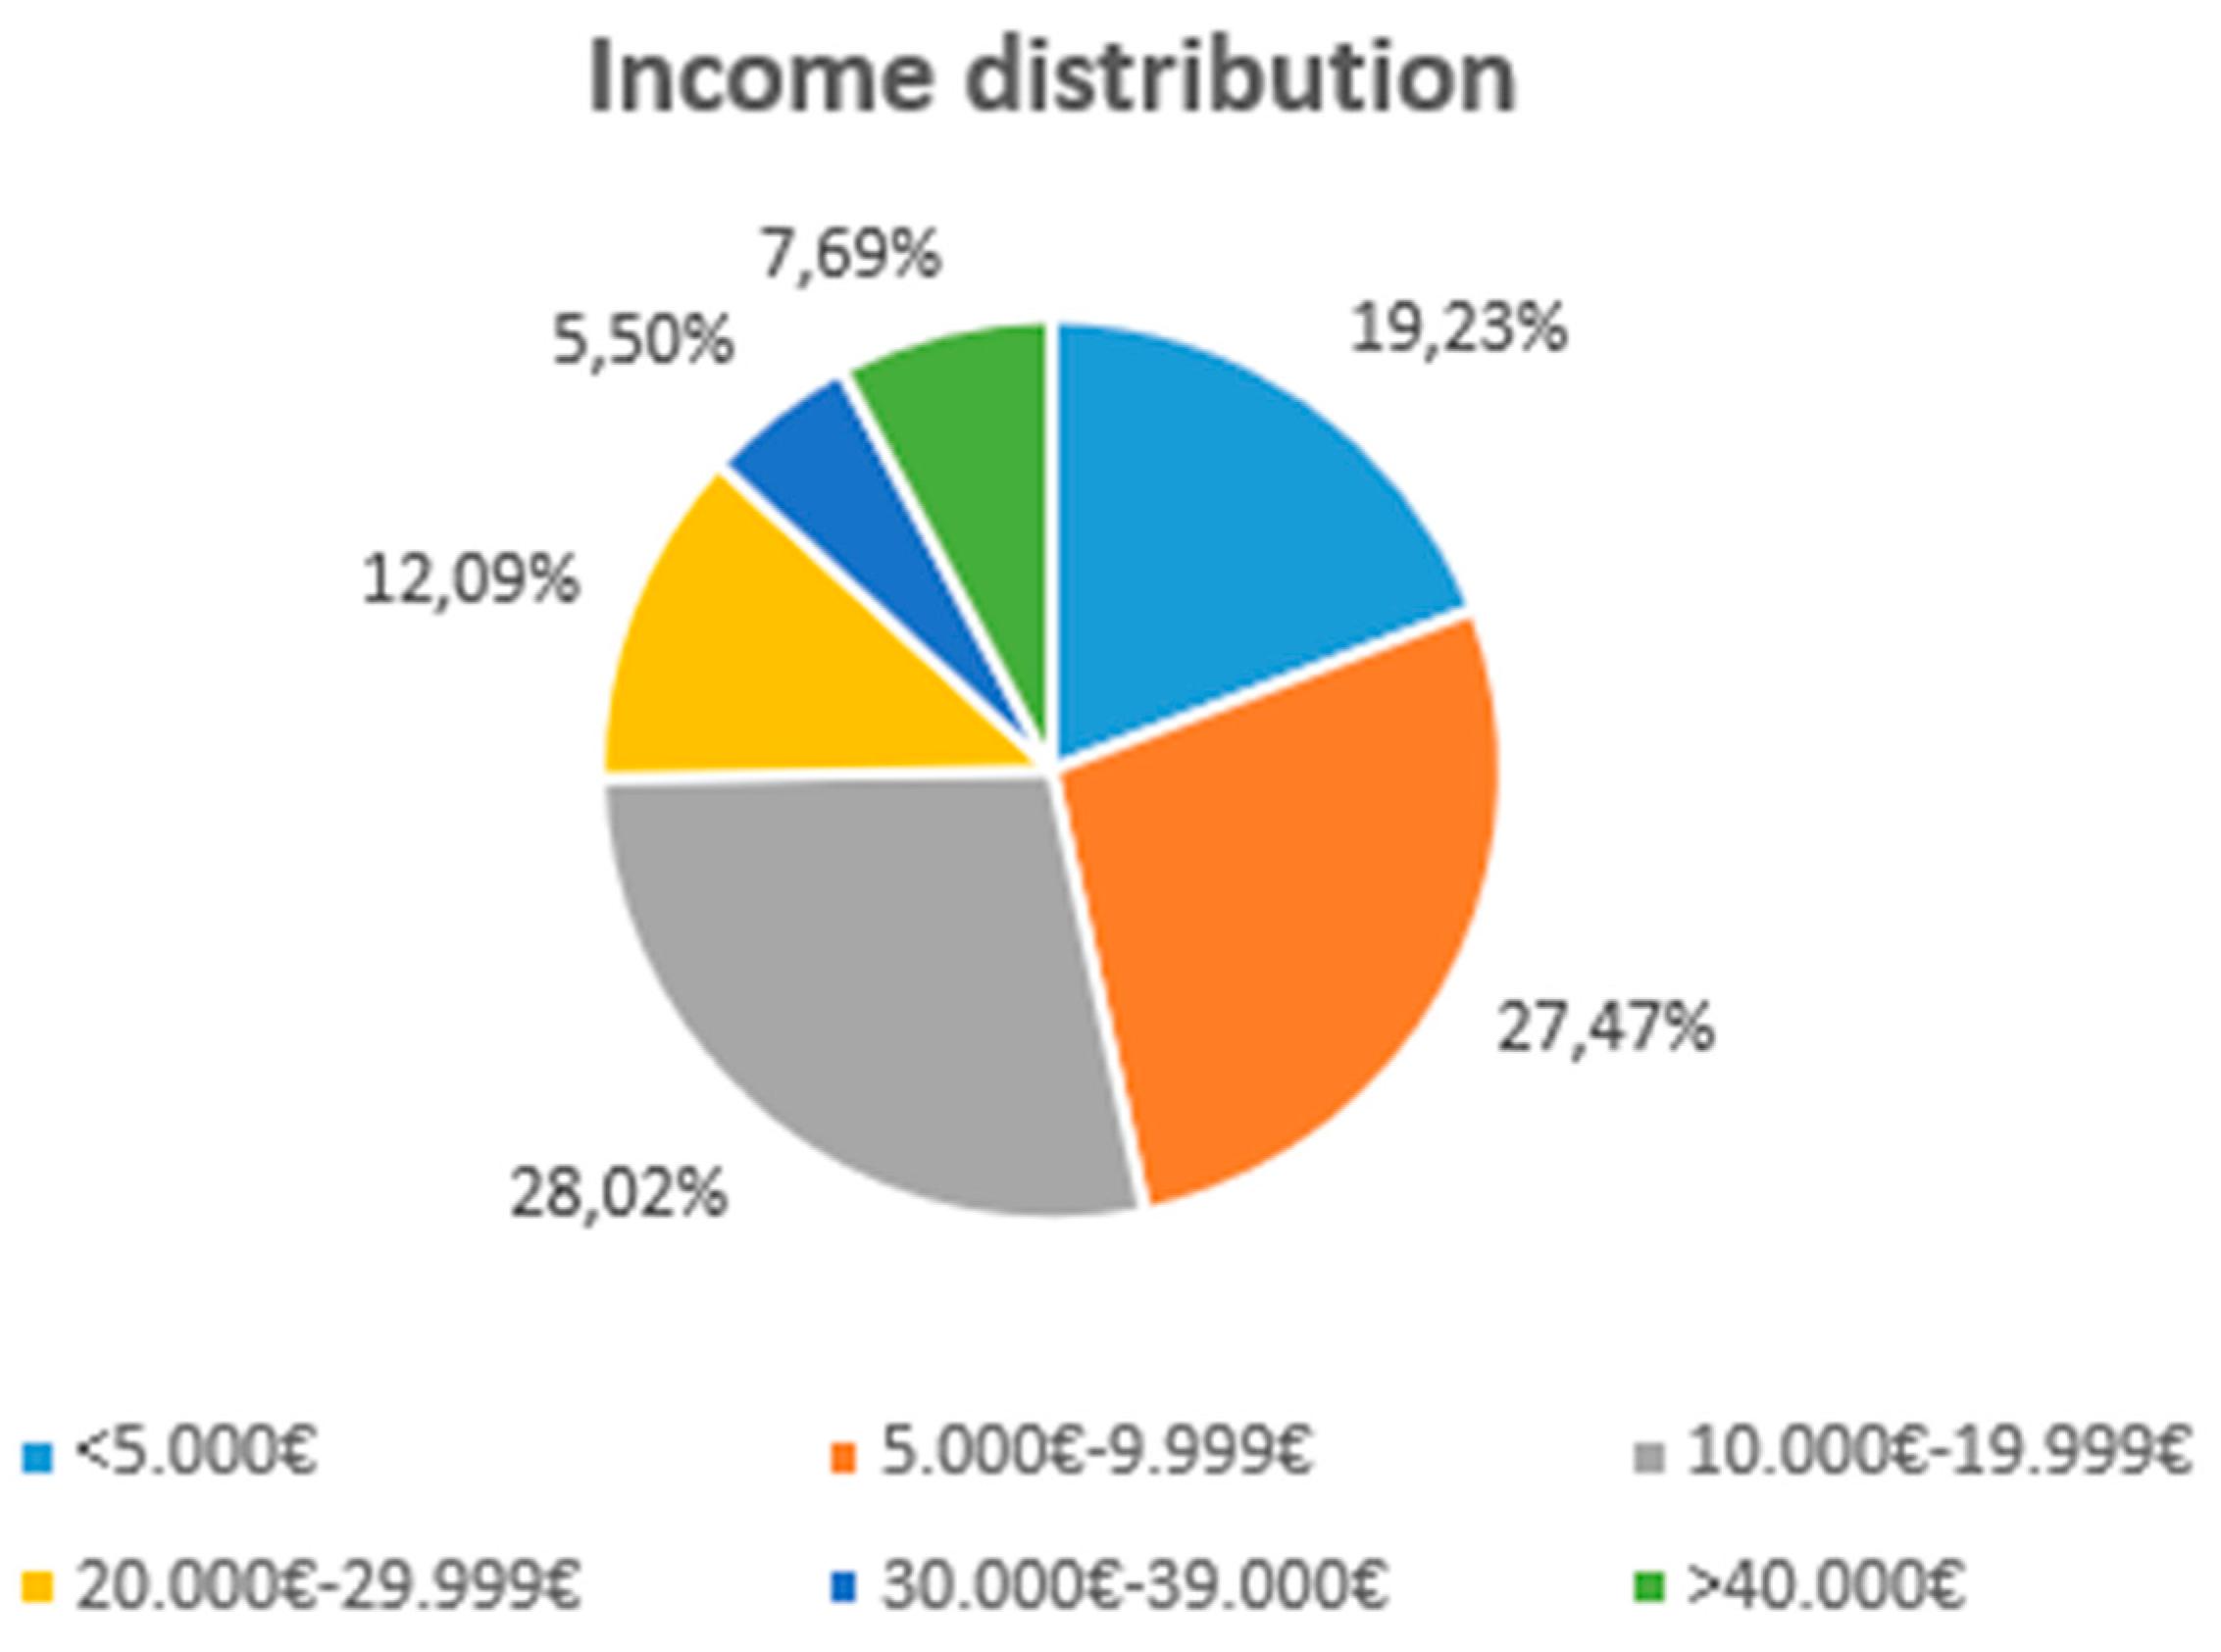
Income
"10.000€-19.999€" was the most often reported salary range each year (28%) followed by "5.000€-9.999€" (27,5%), and "below 5.000€" (19%). 25% of the sample is divided into three categories: "20.000€-29.999€" (12%), "40.000€ and above" (7,6%), and lastly, "30.000€-39.999€" (5,5%). As a result, the statistics included individuals from every income group, as seen in graph 3 below.
Graph 3.
Education level
When asked about their level of education at the time of the survey, more than 40% of the sample indicated that they had a "Bachelors' degree". Furthermore, 35% of the participants had a "Master's degree," 15% had graduated from high school, 6% had received a "Ph.D.," and 3% had indicated that they had graduated from "other" types of institutions, like technical colleges.
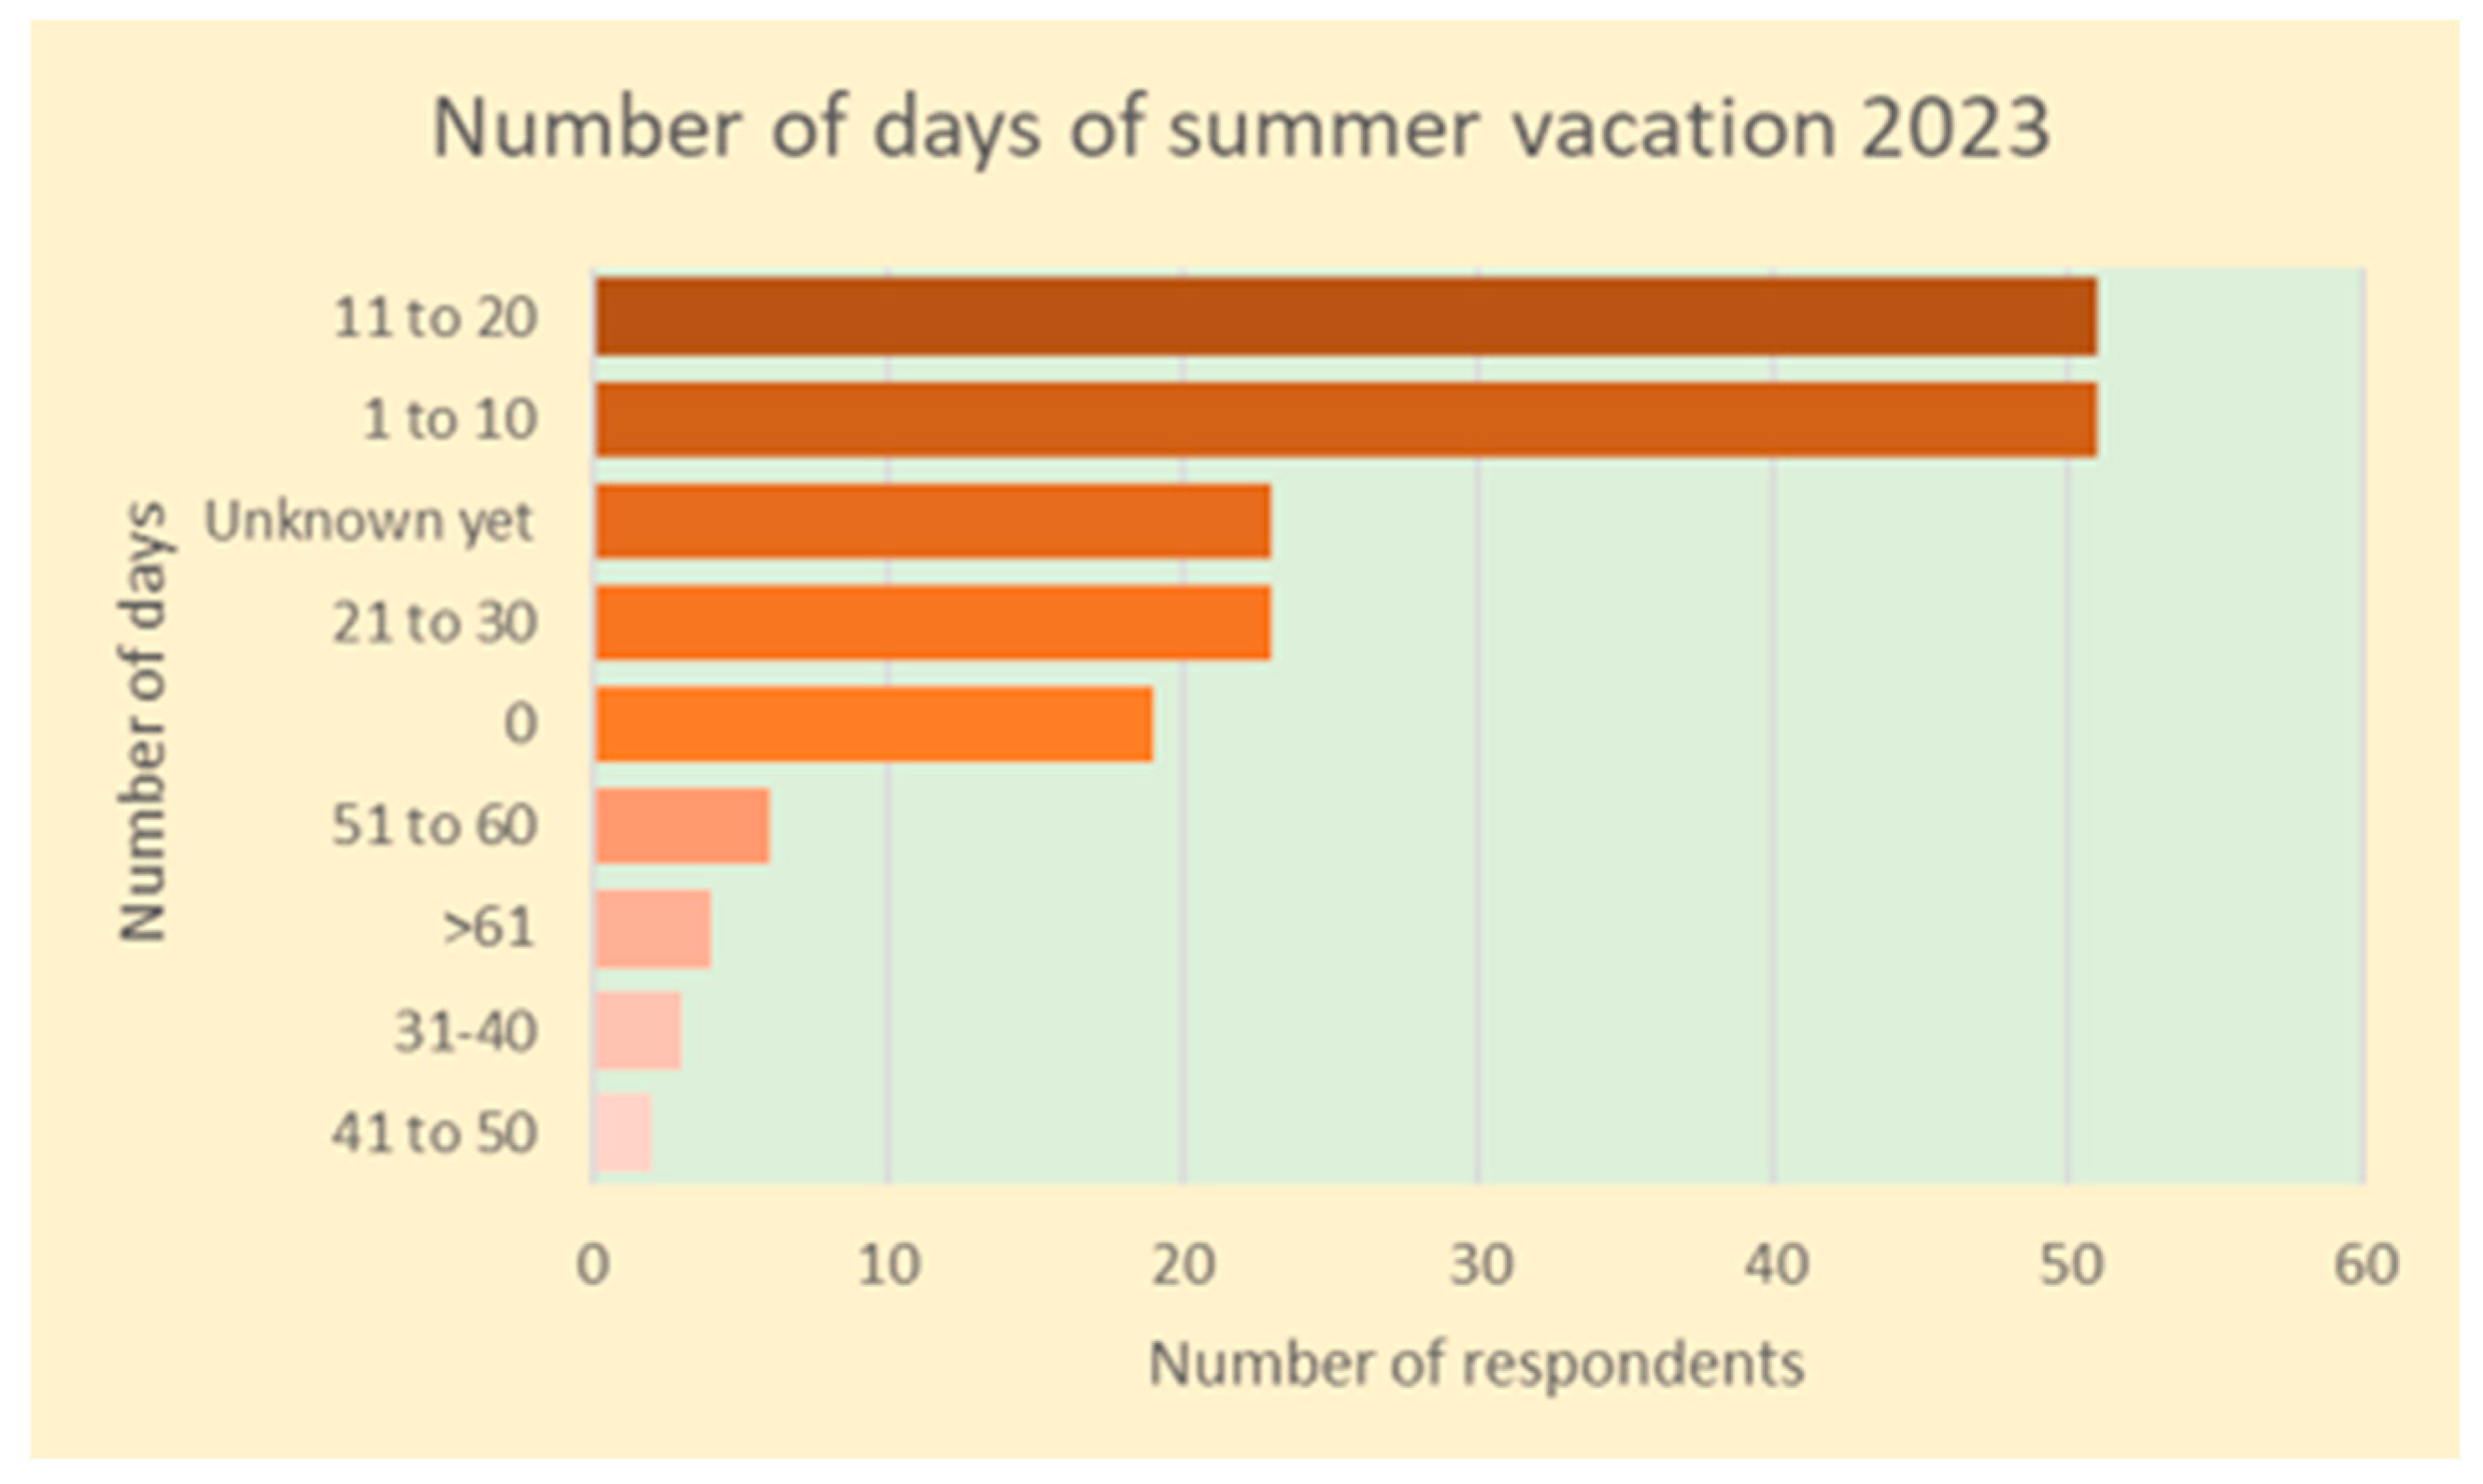
Days of summer vacation 2023
The mean expected vacation days for the forthcoming season of 2023 were 17 days, ranging from 0 days to 90 days after the "unknown" responses were removed from the dataset. Nine categories were made for the analysis of 2023, including the group "unknown yet" (see graph 4 below). The most common answers were "1 to 10" days (28%) and "11 to 20" days (28% as well), followed by "21 to 30" days (13%), "unknown yet" (13%) and "0" days (10%). Four groups then each had less than 4% of the total. In particular, "51 to 60" days (3%), "more than 61" days (2%), "31 to 40" days (2%), and "41 to 50" days (1%), in that sequence.
Graph 4.
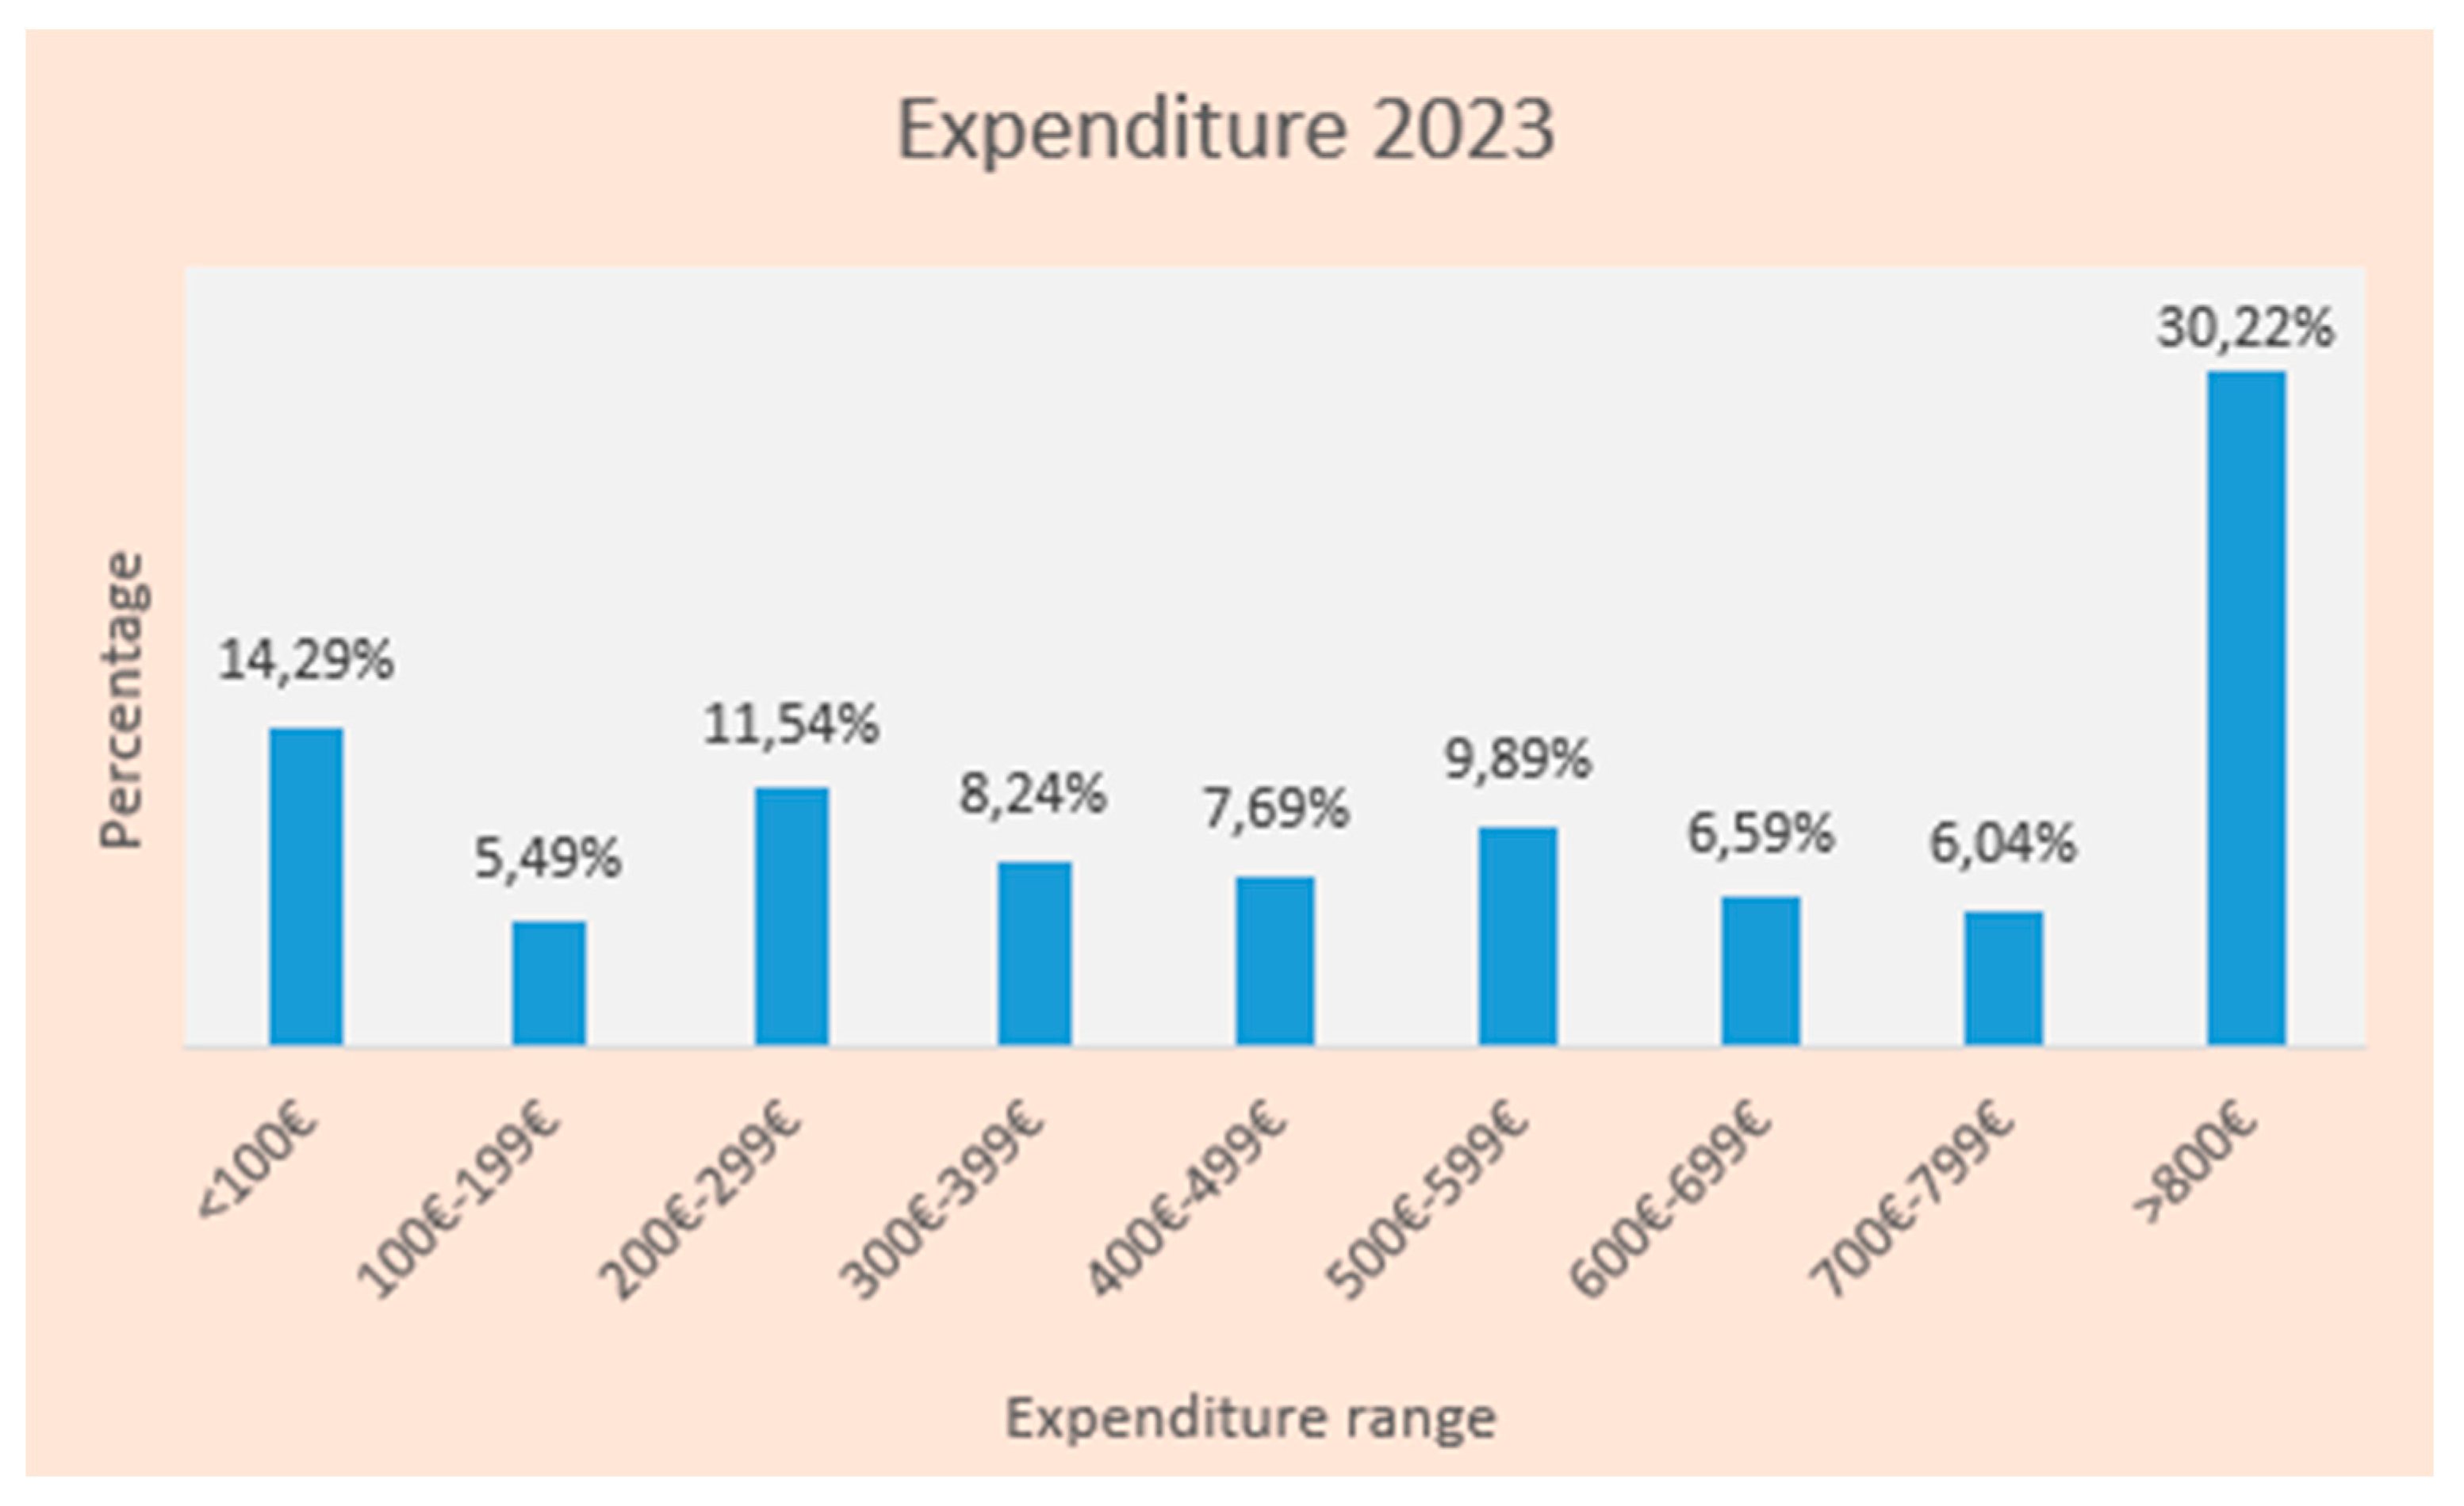
Expenditure 2023
The highest quoted figure for the approaching summer of 2023, as seen in graph 5 below, was "more than 800€" (30%). This entails a 31% change from the 2021 year and a change of 4% from the 2022 year. "Less than 100€" came in second place with 14% of respondents (including those who did not plan a holiday), then came "200€-299€" (12%), "500€-599€" (10%), "300€-399€" and "400€-499€" (both at 8%), "600€-699€" (7%), "700€-799€" (6%), and finally "100€-199€" (5%). The results don't significantly change over time and remain consistent.
Graph 5.
Change in habits 2022-2023
When asked whether they expected any change, the response “no change at all” for the summer of 2023 compared to the summer of 2022, a significant portion of tourists (41%), indicated that they did. The remaining categories were arranged in descending order and they were as follows: "change in number of days" (15%), "change in expenses" (11%) (as a result, some people expect higher prices and reduced budgets, while others have stated that they are in a position to dispose of a higher budget for their 2023 vacation), "change in destination" (10%), "change in activities and/or night life" (8%), "change in COVID-related habits" (6%), “change in vacation status” (5%), “unknown changes yet” (4%) (no prediction), “change in accommodation type” (3%), “change in family members” (2%), “change in eating-out preferences” (2%), and “change in transportation mode” (2%).
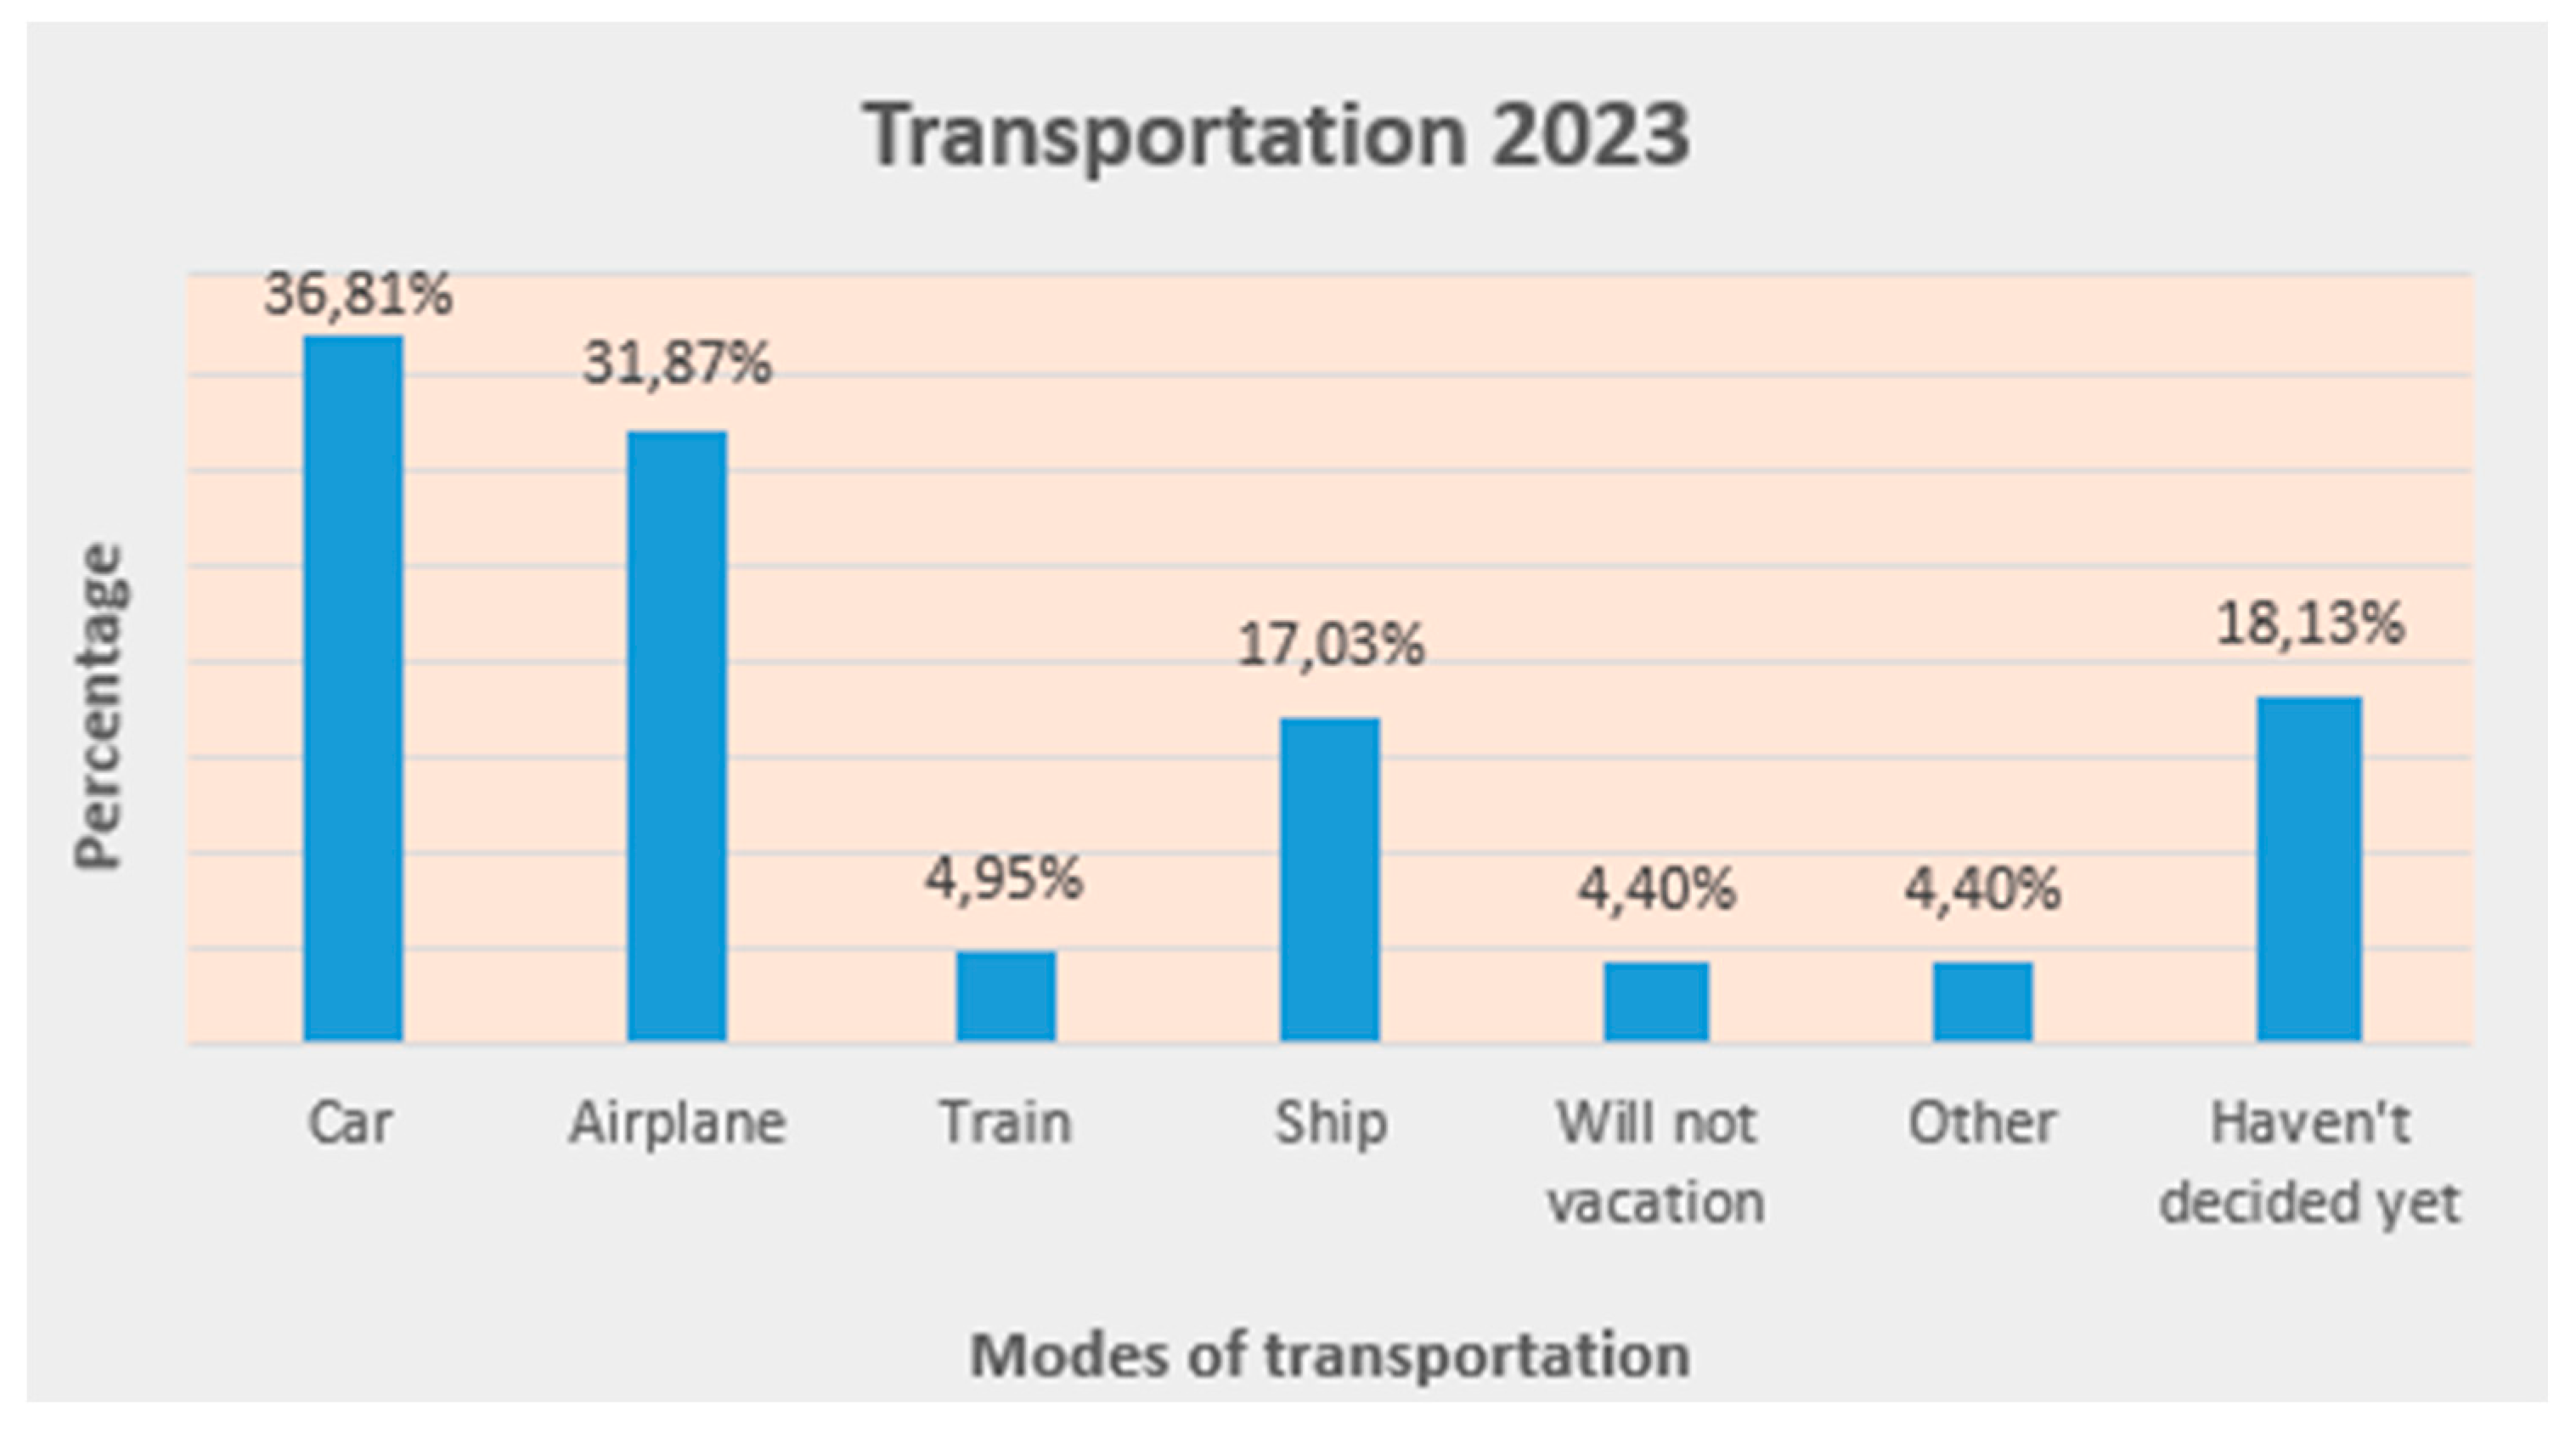
Transportation 2023
18% of respondents said they "haven't decided yet" about their summer travel plans for 2023, while 4% said they "will not take a vacation" this year (see graph 6 below). Additionally, 11% of the participants have indicated that they will frequently use multiple modes of transportation. Additionally, 37% will select "car," 32% "airplane," 17% "ship," 5% "train," and 4% will select an alternative mode of transportation, like a motorcycle or bus.
Graph 6.
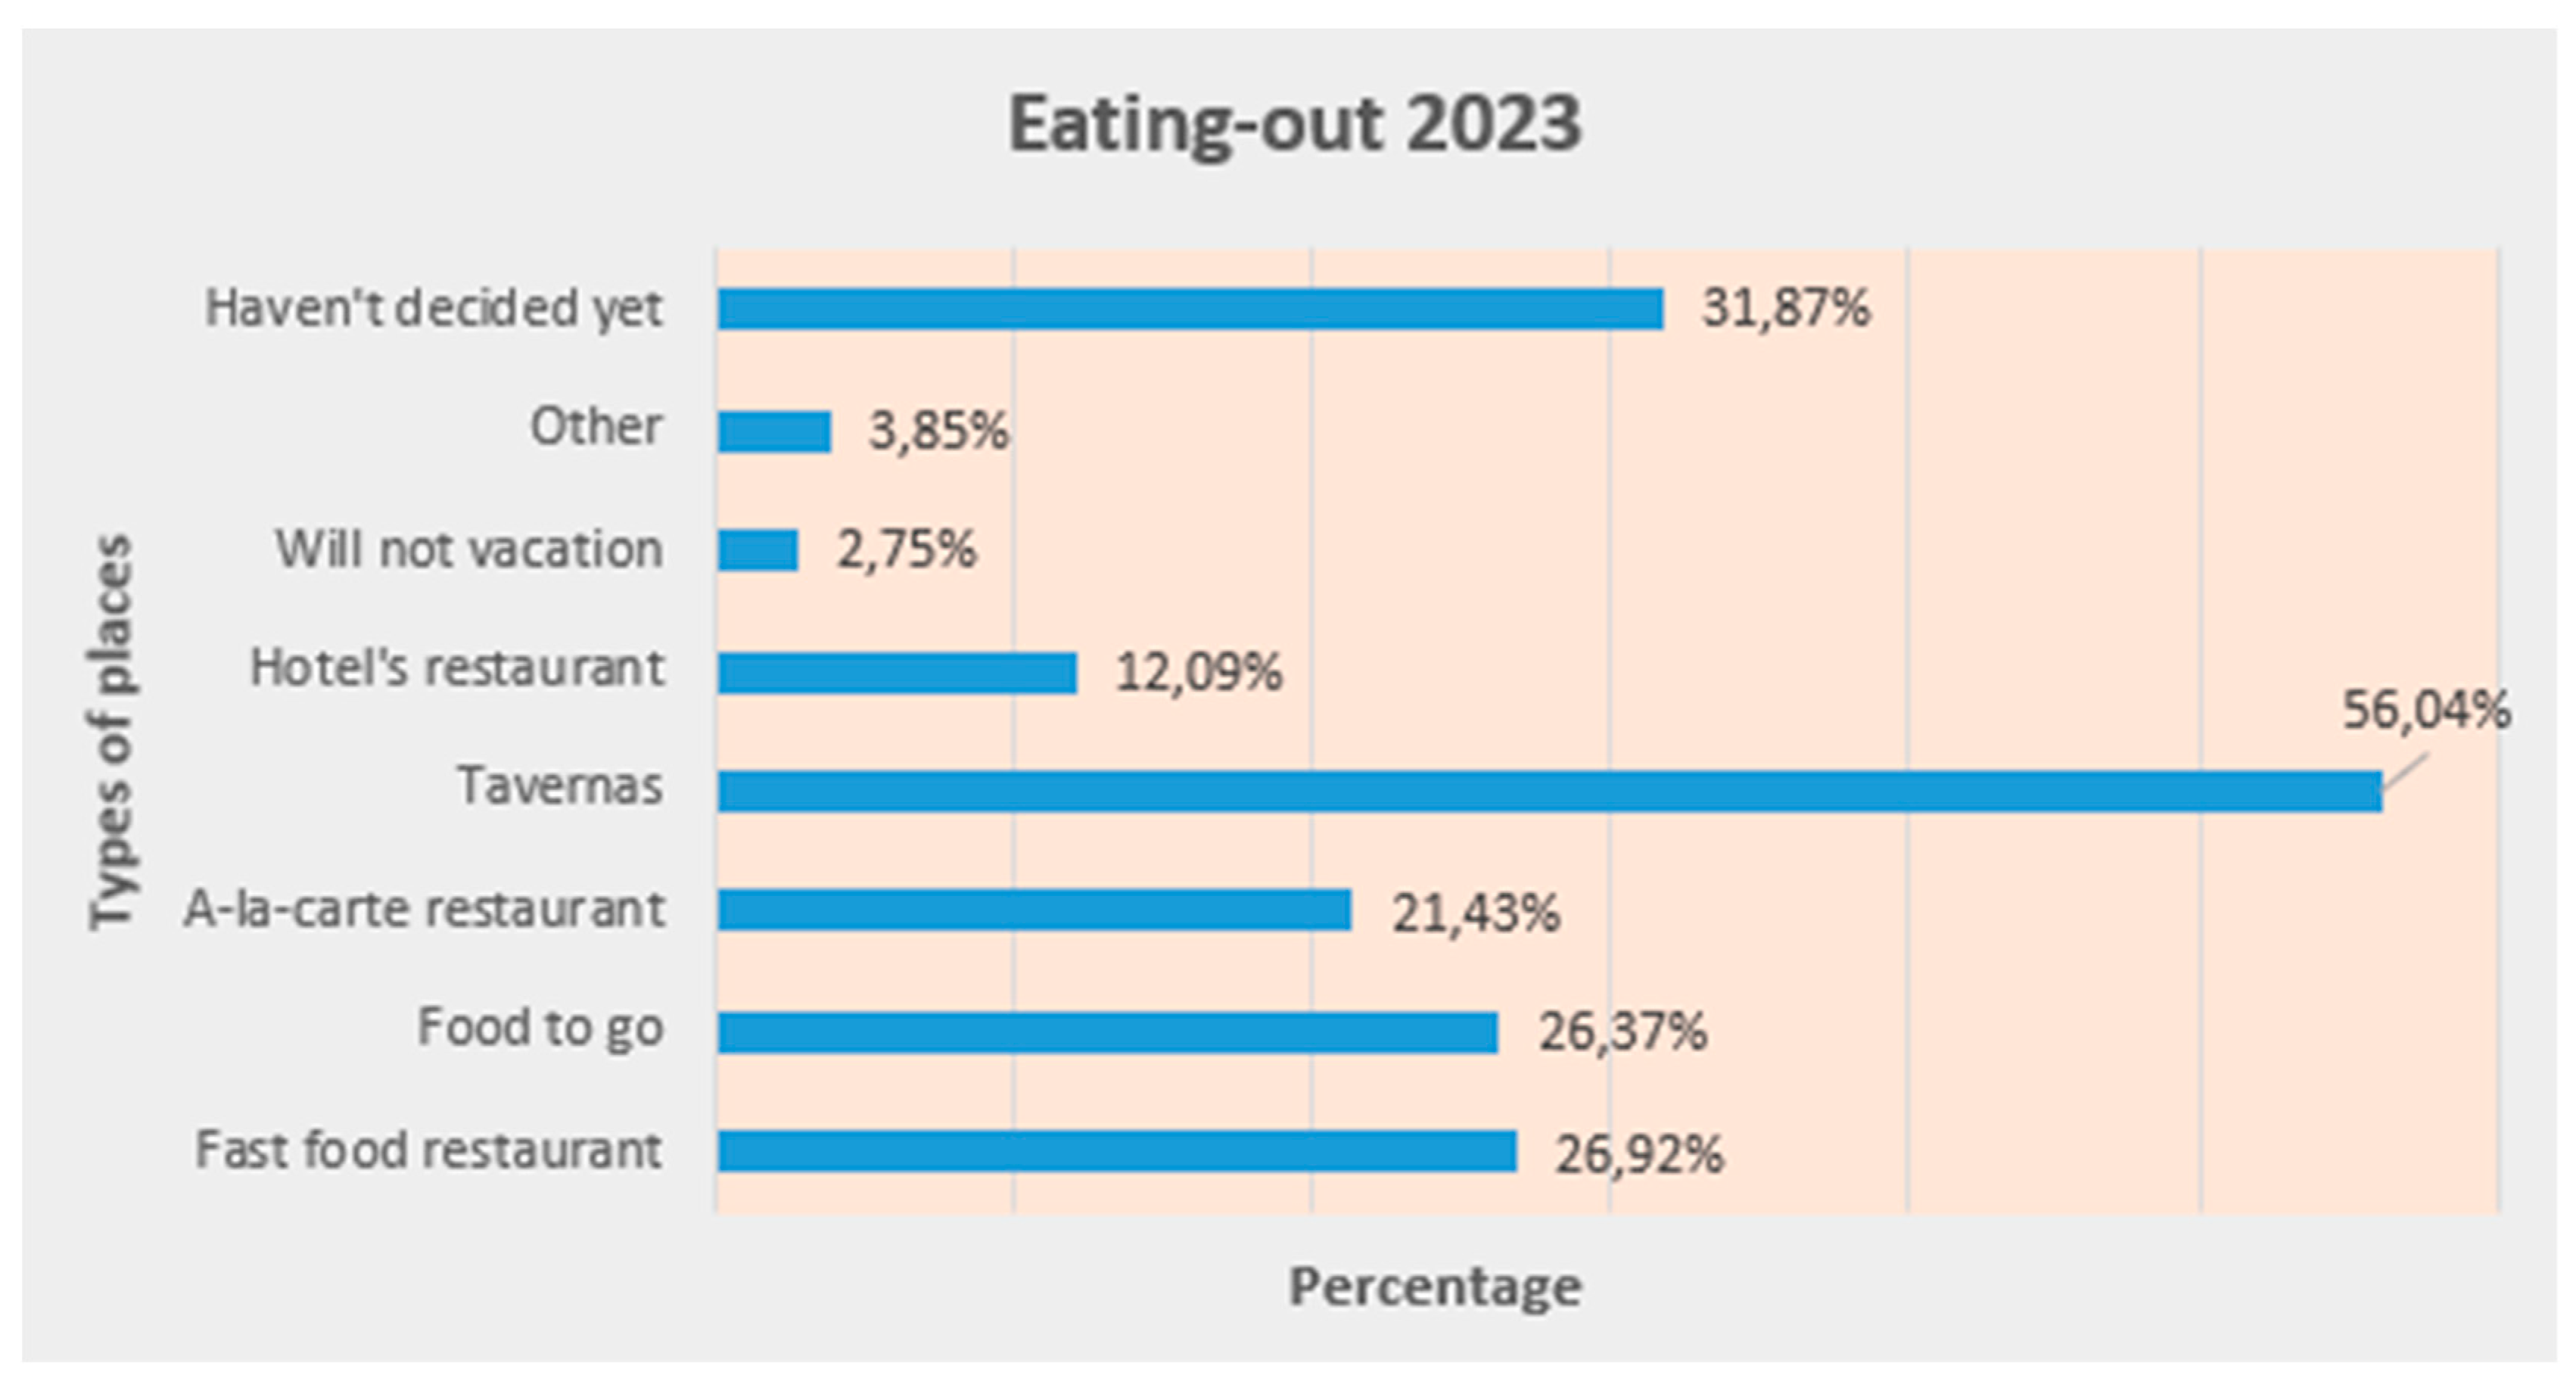
Eating-out 2023
According to graph 7 below, 3% of the sample's members will not go on vacation in the forthcoming summer of 2023, while 32% "haven't decided yet" and it seems that 37% would select more than one of the various dine-out possibilities. When the results are examined, a recurring trend shows up: 56% of people prefer "tavernas" for eating out, followed by 26% for fast food, 26% for takeout (such as cantinas), 21% for a la carte restaurants, 12% for hotel restaurants, and 4% for "other." As a result, although the frequency percentages for eating out are undoubtedly lower than they were in the previous two years, participants also indicated that there is a high level of uncertainty.
Graph 7.
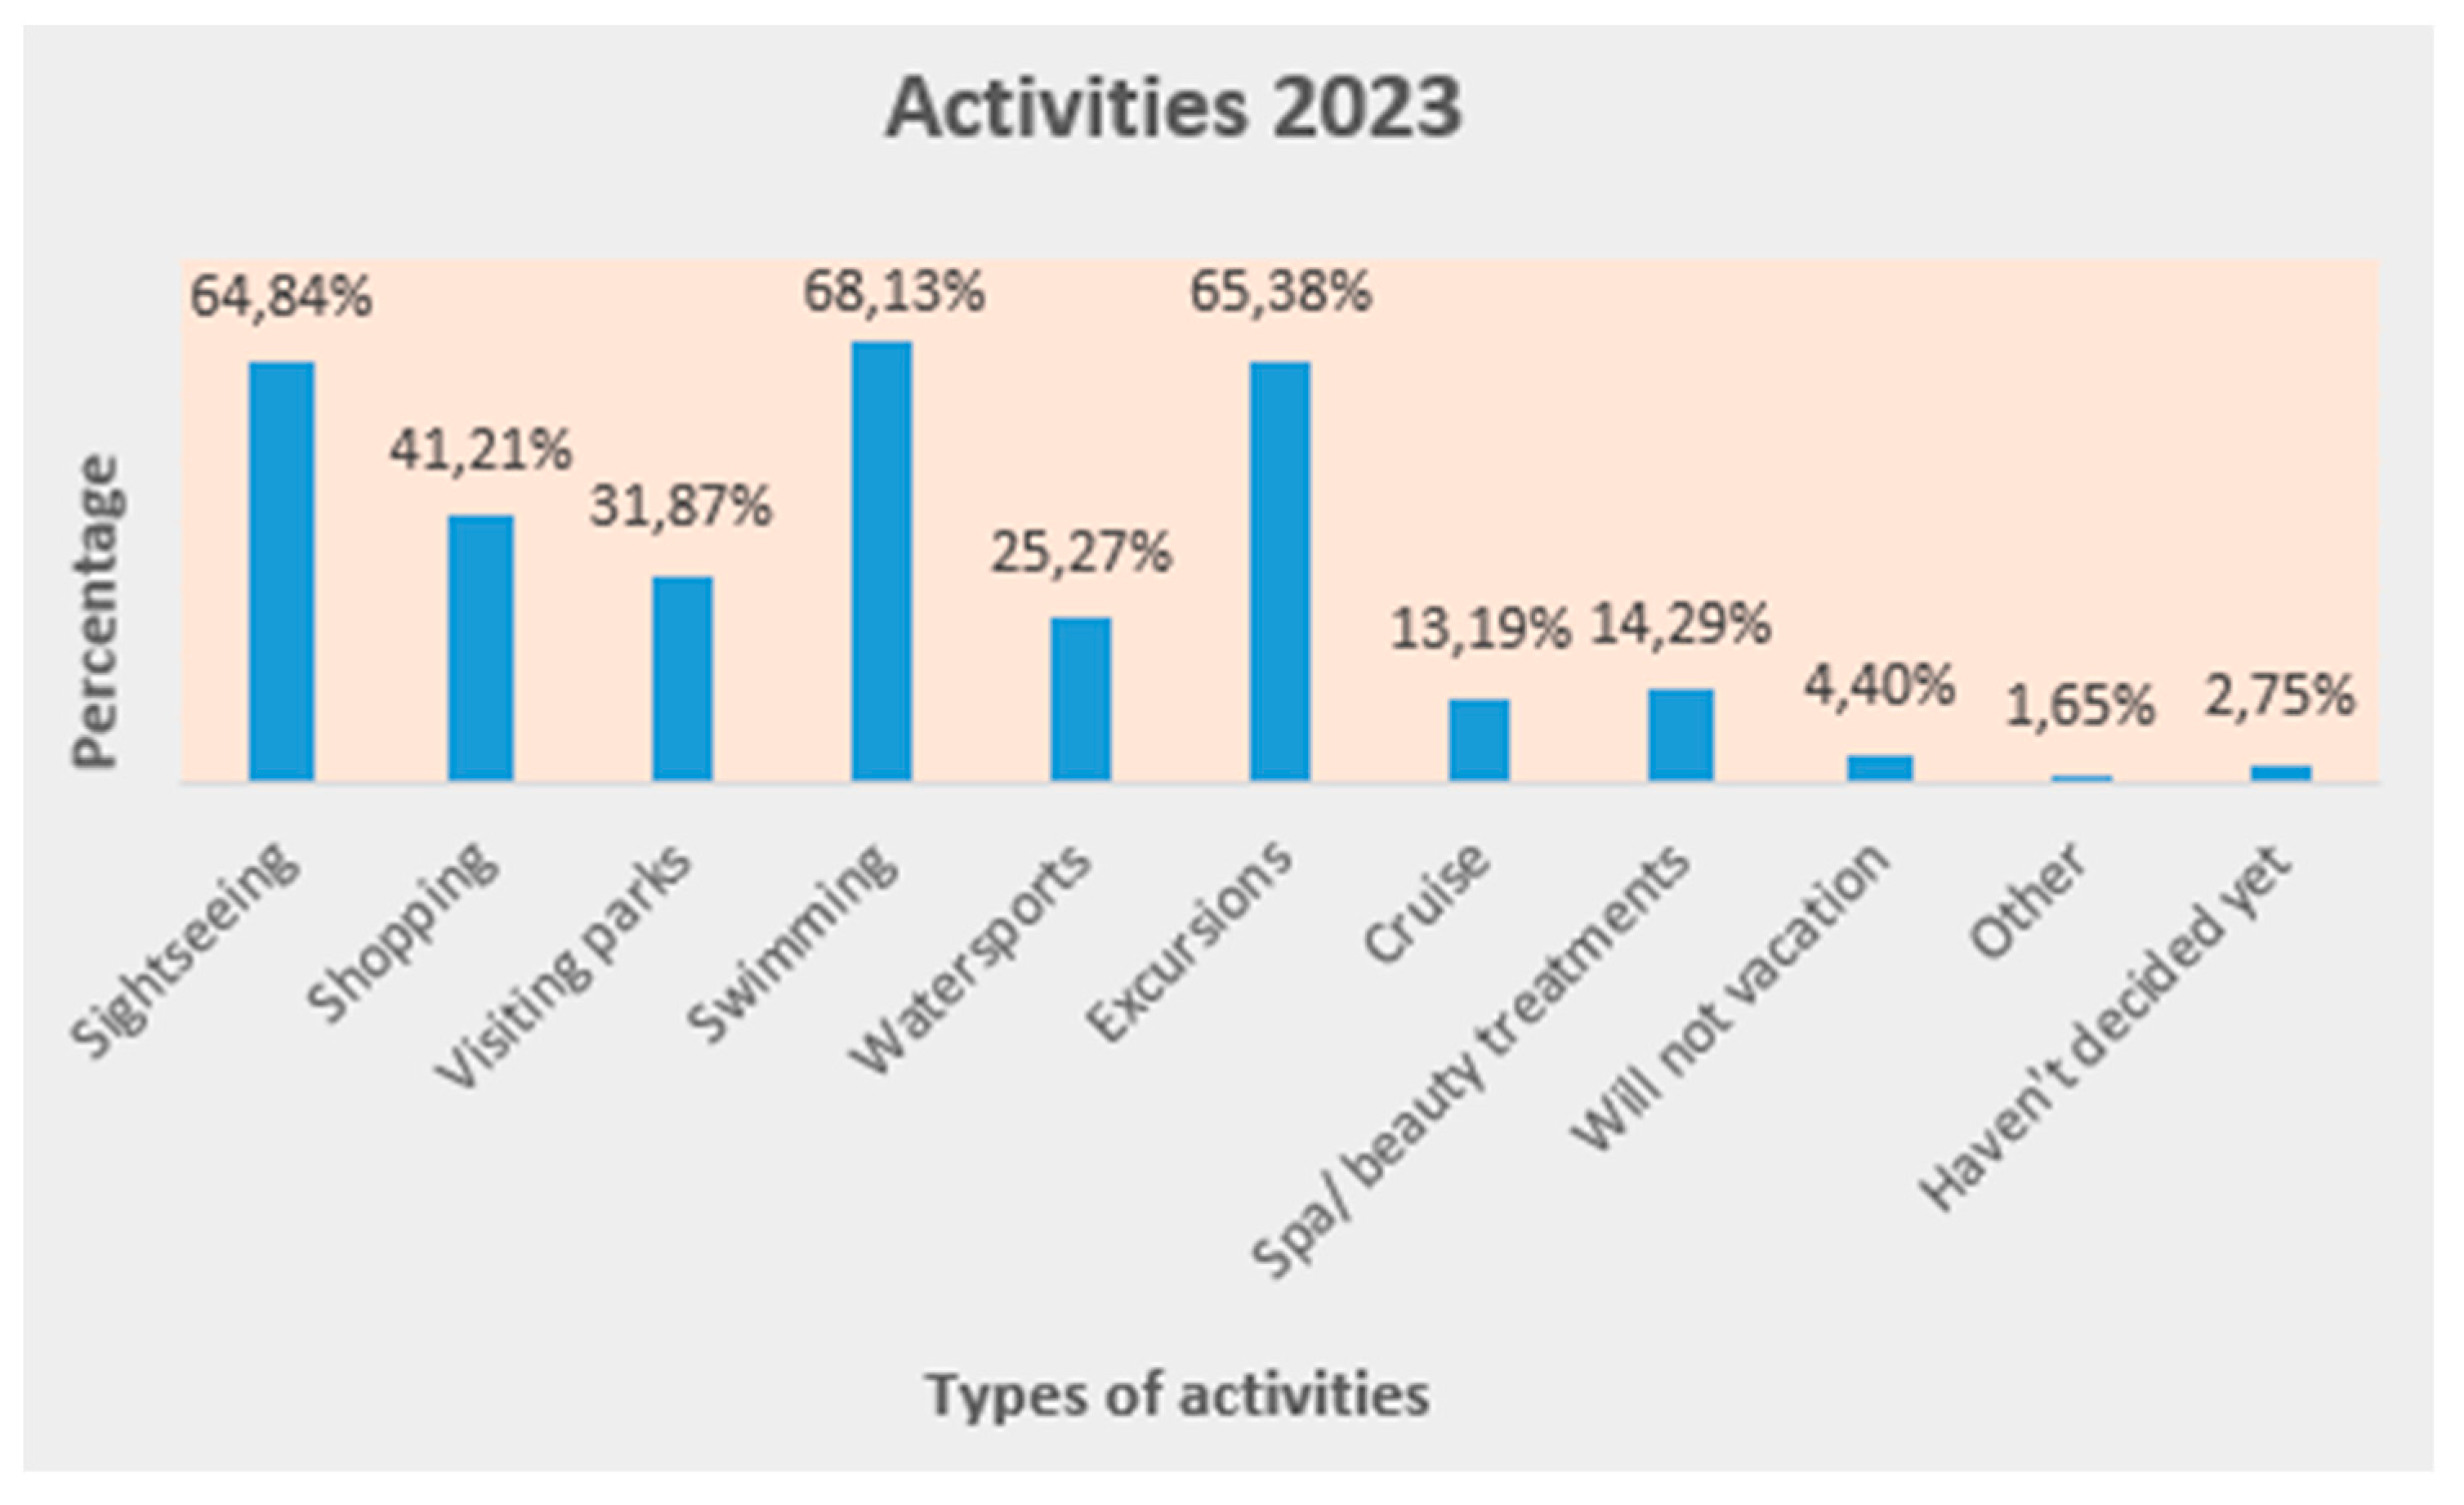
Activities 2023
A strikingly similar pattern to the two previous years also emerges here with relation to the next summer of 2023, as seen in graph 8. No discernible change is visible. About 3% of the sample members said they "haven't made up their minds," while 4% said they "will not take a vacation." With the exception of "shopping" (44% compared 41% from last season) and "swimming" (70% in 2023 versus 68% in 2022) all frequency percentages seem to be slightly lower, which is to be expected given the hesitant responses.
Graph 8.
Financial impacts of energy crisis
People expressed a more negative response to the energy crisis than was seen in the COVID-19 region in terms of how it affected their financial situation. It is clear from the study that 20% of people had "minimal to no financial" impact, while the remaining 80% had a variety of consequences ranging in severity. More specifically, 3% reported being "unable to save money," 3% had a "loss of income," 31% said their "expenses increased," 20% were "negatively" impacted, and 21% had a "excessive or severe" financial impact. Therefore, it follows from the foregoing that a sizable majority of people were indeed financially impacted by the energy crisis.
Goods to save money from
According to an analysis of the responses (in frequency percentages), two bundles of items were the primary source of responses. "New clothing, shoes, and accessories" (64%) and "furniture, appliances, and decoration" (70%) made up these bundles. In addition, the following categories were created: "personal care products" represented 25%, "entertainment" represented 35%, "dining out/takeout coffees" represented 38%, "streaming services subscriptions" represented 32%, "gym or sports memberships" represented 41%, "vacation and trips" represented 20%, and "other" represented 1%.
Energy-saving practices at home
92% of respondents said they do, in fact, actively utilize some type of energy-saving activity, while 8% said they do not. 96% (of the 92%) of the former group exposes the practice(s), while 4% preferred to affirm their use rather than reveal the technique(s). Seven categories were made in order to group the activities or procedures and their frequency rates. More precisely, 35% of respondents said they use "energy-saving or A+ appliances," while 64% said they use "energy-saving light bulbs/LED lamps”, 20 percent "limit the consumption of electricity and gas," 13 percent "limit the consumption of energy-consuming appliances," 10 percent "use solar panels (for heating water or electricity)," 9 percent use "other" techniques (like cooking methods for reduced electricity consumption, smart plugs, motion sensor lights, etc.), and 6 percent "use home insulation." Therefore, the vast majority of people (92% as disclosed) are concerned about their energy consumption and are aware of this problem for either environmental or financial reasons.
Correlation Analysis
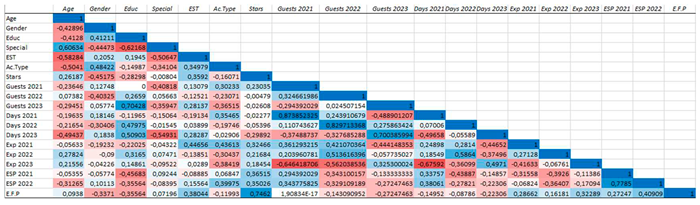
Accommodations
To start with, a strong (positive) linear association is indicated by the values between 0.7 and 1 (Ratner, 2009). The following values were correlated, as seen from the matrix below: "Change in number of guests in 2023" with "education level" of the managers (0,7), "Environmentally friendly practices" with "accommodation quality stars" (0,74), "Change in number of guests in 2021" with "Change in days spent by guests in 2021" (0,87), "Change in number of guests in 2022" with "Change in days spend by guests in 2022" (0,82), "Change in number of guests in 2023” with “Change in days spend by guests in 2023” (0,7), and last “Energy-saving practices in 2021” with “Energy-saving practices in 2022” (0,77).
There are four correlation relationships that are of particular importance for this analysis. The first is the relationship between the managers' educational attainment and the change in the number of visitors in 2023, which implies that the greater the managers' educational attainment (i.e., their proximity to a Ph.D.) is, the higher (and hence more favorable) the proportion of guests who will be arriving in the forthcoming 2023 season will be. Then, the relationship between quality stars and eco-friendly practices shows that the more eco-friendly practices a lodging facility employs, the more quality stars it holds. Additionally, the relationship between the number of guest days spent and the total number of guests in 2023 suggests that as the number of guests increases, so do the guest days spent.

 |
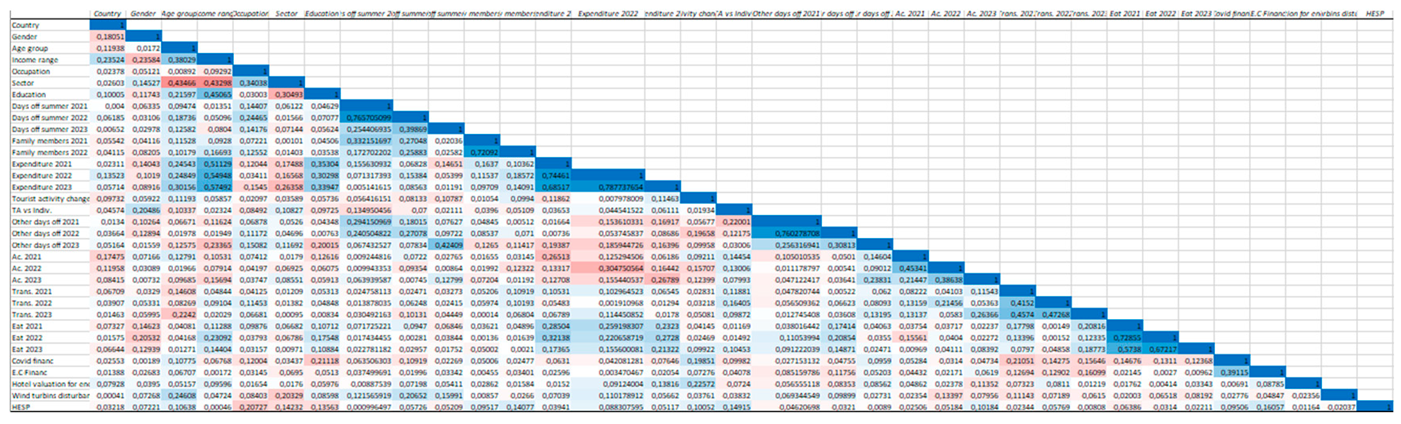
Tourists
As seen in the Table 2 below, the strongest correlation pairs were: “Average expenditure in 2022” with “Average expenditure in 2023” (0,79), “Days of summer vacation in 2021” with “Days of summer vacation in 2022” (0,76), “Other days of days off in 2021” with “other days off in 2022” (0,76), “Average expenditure in 2021” with “Average expenditure in 2022” (0,74), “Eating-out in 2021” with “Eating-out in 2022” (0,73), “Family members in 2021” with “Family members in 2022” (0,72).
The aforementioned correlation pairings contain two pairs that are of particular interest for this analysis, both of which relate to the tourists' income range. First, consider how income levels and education levels are positively correlated. As a result, as education level increases (towards a Ph.D.), so does the income (generally toward the income range "more than 40.000€"). The second set of data is the revenue and expense range (for the three years that are relevant here, i.e., 2021, 2022, and 2023). This indicates that as income increases, so do tourist expenditures (upwards of the greatest value "more than 800€").
 |
Regression Analysis
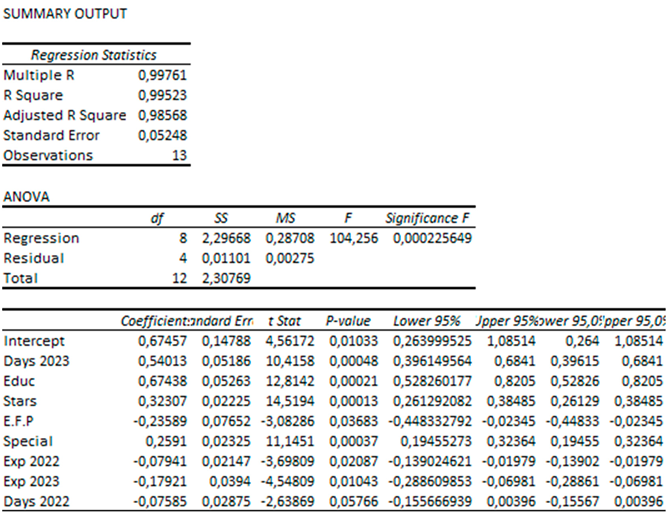
Accommodations
"Change in the number of guests in 2023" was the model's dependent variable. This model's R-squared was a solid 99.5%, which means it can explain 99.5% of the dependent data. This shows that the model is reliable, as does the fact that the Significance F (=0.002) is less than a. Environmentally friendly behaviors, spending in 2021, spending in 2023, and days in 2022 are the four coefficients that show a negative link to the dependent variable, whereas the other three suggest a positive association. All variables, with the exception of one (the "days spent by guests in 2022"), had values less than 0,05, rejecting the null hypothesis and showing that all other independent factors are directly related to the independent variable, according to an analysis of the p-values.
 |
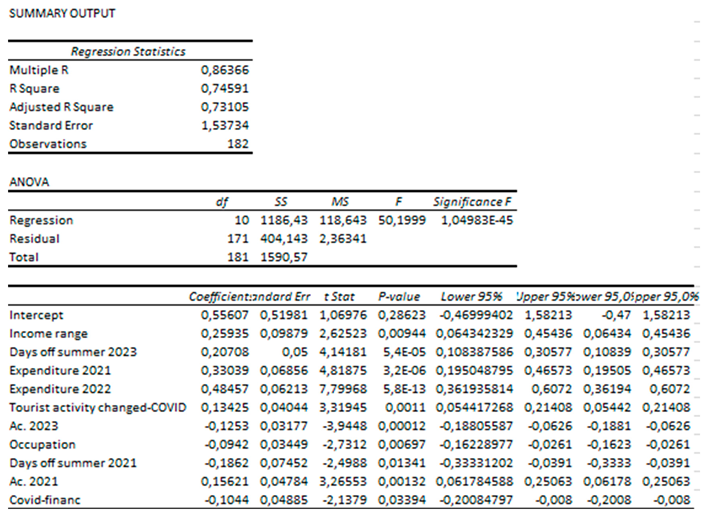
Tourists
The dependent variable for the model was "Expenditure of Guests in 2023," as shown by the data below. The Significance F (=0.0002) is smaller than a, showing that the model is credible, and the R-squared value suggests that this model can explain 74% of the dependent variables. The dependent variable is implied to have a negative association with four of the coefficients (accommodation type in 2023, occupation of participants, days of summer vacation in 2021, and financial impact of covid), while a positive relationship is implied by the remaining coefficients. The p-values were examined, and it was discovered that every variable had values lower than 0,05, rejecting the null hypothesis and demonstrating that all independent factors are related to the independent variable directly.
 |
Discussion
The current investigation's goal was to ascertain whether and how the energy crisis had an effect on the tourism industry, with a particular emphasis on visitors and the lodging sector. When looking at the answers to the direct questions that were asked of both groups in the survey questionnaires, it was initially clear that both parties had been impacted by the higher energy prices. More particular, more than 90% of hotel managers reported negative effects on their companies, while 80% of people reported a variety of repercussions on their financial situation. Additionally, it is anticipated and already observed that, with regard to the lodging industry, the average guest expenditure per stay in 2023 will be higher than it was in 2022, the year the energy crisis began. This price increase can be attributed to either a shift in the number of summer vacation days or to general inflation and inflationary pressures on commodity prices. For tourists, however, there was little to no change in spending for summer vacation between the two aforementioned years because the percentages (shown in the graph above in this section) stayed quite close. Additionally, these inflationary pressures are a result of the energy crisis in the tourism industry, which also started globally (around April 2020), during the first COVID-19 lockdown, when energy prices were noticeably higher.
Another point worth mentioning for accommodations is the fact that, given how heavily the Greek tourism industry depends on foreign visitors, variations in budget, consumption elasticity, preferences, and patterns of consumption can have an impact on crucial elements like the duration of summer vacation, spending, etc. When it comes to the profitability of the tourism industry, these factors are quite important.
For the upcoming season of 2023, lodging managers anticipate an increase in the number of guests (a 50% growth in average, compared to the 2022 season), an increase in the number of days spent by guests in 2023 (a 225% growth from 2022), and an increase in the amount of money spent by guests in 2023 (a 120% growth). These projections are incredibly encouraging for Greek tourism because the indices indicated have a significant impact on the industry's future growth and recovery.
A staggering 90% of travelers anticipate taking vacations in 2023, according to statistics. In addition, 13% of the participants in the group who said they would take a holiday did not know how many days they would be away. The expenditure of visitors in 2023 remained at the same levels, indicating that the budget (for the majority of people) was not dead but rather stayed the same, even though 80% experienced a variety of financial impacts because of the energy crisis and the higher prices. This is one of the most important indicators suggesting growth for the tourism sector. Additionally, 80% of the participants said they wouldn't give up their vacation.
Last but not least, 92% of respondents indicated that they utilize some sort of energy-saving strategy or practice at home in order to lower their expenses and/or for other environmental reasons, in response to the impact that the energy crisis has on individuals (among other things).
Common enquiries between the questionnaires and results
"Days of summer vacation" was the first common question in both questionnaires. Comparing the change between the two groups (individuals and managers) it is evident that the change appears less sharp for the former. As a result, a distinction may be seen in the findings of the two questionnaires. However, it should be noted that some lodging establishments—if not all—also host foreign visitors/tourists, in contrast to the participants in the tourists' questionnaire, who were overwhelmingly Greek (more than 80%).
The second popular set of questions focused on "guests' habits". Four categories appeared to be the same for both groups. In reference to the first one, i.e., “eating out 2023”, the second one, “excursions to nearby places”, and “COVID-19”, both groups responded an increase in the first two sets, while they reported a further relaxation of prospective measures against the COVID-19. Regarding the fourth category, which was “days of summer vacation 2023”, a differentiation is observed. Managers reported more days, while tourists reported fewer. The final category can be clarified through the fact that lodgings frequently hosted international visitors whereas the majority of tourists who answered the questionnaire were Greek.
Finally, "expenditure" is the subject of the third common bundle of inquiries. The average increase in guest spending per stay was anticipated to increase by 120% in 2022 and 2023. Regarding the responses from the tourists, the change for the two years in question (2022 and 2023) for the budget range that was "more than 800€" was an increase of 4%.
5. Conclusion
The current study focused on the tourism business, which is one of the most important and lucrative industries for economies around the world. In addition to being a direct result of the Russian invasion of Ukraine and the ensuing war, the energy crisis examined here was also an indirect result of an earlier incident, namely the COVID-19 pandemic, which occurred in early 2022. This last point is crucial to the examination of the tourism industry because, unlike previous energy crises, the pandemic affected economies both directly (because of the lockdowns) and indirectly (because vacations, trips, and travel were temporarily halted and the summer seasons of 2020 and 2021 were significantly negatively impacted in terms of net income).
According to the present research, no significant decline will occur in the amount of people who express interest in and/or actively plan their vacation as well as the number of reservations already made as well as predictions and forecasts regarding the preferences and behaviors of tourists in the upcoming summer of 2023 when looking at things from the perspective of both tourists and lodging managers. Even with the generally higher expenditures and whether they are viewed in this way, the former group was less inclined to give up their trips. Furthermore, the results presented in both regression models for the lodging industry as well as for the tourists were accurate and statistically significant. The data on the latter were only marginally less explained, but the variables were statistically significant to the extent necessary to best characterize the intercept.
Previous works and research either concentrated primarily on hotels when examining the lodging industry or neglected to consider other lodging options, which in the study at hand were quite well-liked by travelers. In this study, both groups were investigated in order to draw a reliable and comprehensive conclusion for the tourism industry from both angles.
Therefore, major risks like decreased sector revenue, fewer visitors, and decreased consumption of tourism products (whether or not caused by energy) are not anticipated. As opposed to 2020 and 2021 (summer seasons under COVID-19 and the effects on the prices of energy goods), as well as 2022 (the summer season where the primary outbreak of the energy crisis actualized), these indices are predicted to rise.
According to the analysis, it was found that while the energy crisis had an impact on both the public and businesses, the tourism industry recovered most significantly from COVID-19 and secondarily from the financial effects of the inflationary energy crisis, demonstrating resilience. Furthermore, it is also important to note that sustainable energy is a crucial element that governments should start implementing. This is so that the environment will benefit as well as governments and businesses generally from a more varied portfolio of energy supply based on green energy.
Future research
It would be beneficial to include a larger, more diverse group of participants in future studies, especially in terms of nationality. The literature and overall research of this topic might have benefited from a comparison between these various groups and backgrounds. The impact of supply chain disruptions brought on by the energy crisis and its direct or indirect effects on tourism enterprises, such as lodging, food and beverage businesses, and other sorts of facilities, would also be a significant subject of research.
References
- ACER (2021) High Energy Prices- October 2021. [online] Available at: https://acer.europa.eu/en/The_agency/Organisation/Documents/Energy%20Prices_Final.pdf [Accessed 8 Dec. 2022].
- Adamopoulou, E., Kapopoulos, P. and Marinopoulou, E. (2022). Greek Tourism Industry Reloaded: Post-pandemic Rebound and Travel Megatrends. [online] Athens, Greece: Alpha Bank, pp.1–31. Available at: https://www.alpha.gr/-/media/alphagr/files/group/agores/insights/2022/insights_tourism_052022.pdf [Accessed 22 Apr. 2023].
- Arbel, A. and Ravid, S.A. (1983). An industry energy price impact model: The case of the hotel industry. Applied Economics, 15(6), pp.705–714.
- Ari, A., Arregui, N., Black, S., Celasun, O., Iakova, D., Mineshima, A., Mylonas, V., Parry, I., Teodoru, I., & Zhunussova, K. (2022). Surging Energy Prices in Europe in the Aftermath of the War: How to Support the Vulnerable and Speed up the Transition Away from Fossil Fuels. IMF Working Papers, 2022/152.
- Atems, B. (2021). The response of the U.S. aviation industry to demand and supply shocks in the oil and jet fuel markets. Transportation Research Interdisciplinary Perspectives, 11, p.100452. [CrossRef]
- Becken, S. (2008). Developing indicators for managing tourism in the face of peak oil. Tourism Management, 29(4), pp.695–705. [CrossRef]
- Becken, S. (2011). A critical review of tourism and oil. Annals of Tourism Research, 38(2), pp.359–379. [CrossRef]
- Bjørnland, H.C. (2022). The effect of rising energy prices amid geopolitical developments and supply disruptions. European Central Bank. [online] Available at: https://www.ecb.europa.eu/pub/conferences/ecbforum/shared/pdf/2022/Bjornland_paper.pdf [Accessed 6 Dec. 2022].
- Bösch, F. and Graf, R. (2014). Reacting to Anticipations: Energy Crisis and Energy Policy in the 1970s. An Introduction.. Historical Social Research / Historische Sozialforschung. 39. 7-22.
- Council of the European Union, consilium.europa.eu. (2022). Energy price rise since 2021. [online] Available at: https://www.consilium.europa.eu/en/infographics/energy-prices-2021/.
- Edelstein, P. and Kilian, L. (2009). How sensitive are consumer expenditures to retail energy prices? Journal of Monetary Economics, 56(6), pp.766–779. [CrossRef]
- Glauber, Joseph W.; and Smith, Vincent H. (2022). Food price spikes temporary, inflation likely to fall in 2022. American Enterprise Institute for Public Policy Research. https://www.aei.org/research-products/report/food-price-spikes-temporary-inflation-likely-to-fall-in-2022/.
- Gros, D. and Shamsfakhr, F, (2022). Global energy price inflation with a European twist. Luxembourg: European Parliament’s Committee, pp.1–23.
- Heymann, E. and Becker, S. (2022). Energy price inflation – this time is different. Frankfurt, Germany: Deutsche Bank, pp.1–12.
- Hu, Z. (2022). A Study of How Soaring Energy Prices Affect the Economy. [online] www.atlantis-press.com. https://doi.org/10.2991/aebmr.k.220306.012.
- Huang, K. S. and Huang, S. W., (2009). "How Increased Food and Energy Prices Affect Consumer Welfare," 2009 Annual Meeting, July 26-28, 2009, Milwaukee, Wisconsin 49199, Agricultural and Applied Economics Association.
- Huang, K.S. and Huang, S.W. (2011). Consumer welfare effects of increased food and energy prices. Applied Economics, 44(19), pp.2527–2536. [CrossRef]
- Kyrylov, Y., Hranovska, V., Boiko, V., Kwilinski, A. and Boiko, L. (2020). International Tourism Development in the Context of Increasing Globalization Risks: On the Example of Ukraine’s Integration into the Global Tourism Industry. Journal of Risk and Financial Management, 13(12), p.303. [CrossRef]
- Miljak, T., Perman, L., & Lozic, I. (2022). THE IMPACT OF INFLATION ON RESTAURANT PRICES IN CROATIA IN THE TOURIST SEASON 2022. Economic and Social Development: Book of Proceedings, 61-68.
- Oh, C.-O. and Hammitt, W.E. (2011). Impact of Increasing Gasoline Prices on Tourism Travel Patterns to a State Park. Tourism Economics, 17(6), pp.1311–1324. [CrossRef]
- Petricek, M., Chalupa, S. and Chadt, K. (2020). Identification of Consumer Behavior Based on Price Elasticity: A Case Study of the Prague Market of Accommodation Services. Sustainability, 12(22), p.9452. [CrossRef]
- Pindyck, R. S. (1999). The Long-Run Evolution of Energy Prices. The Energy Journal, 20(2), 1–27. http://www.jstor.org/stable/41322828.
- Pindyck, R.S., (1980). "Energy Price Increases and Macroeconomic Policy," The Energy Journal, International Association for Energy Economics, vol. 0(Number 4), pages 1-20.
- Ratner, B. (2009). The correlation coefficient: Its values range between +1/−1, or do they? Journal of Targeting, Measurement and Analysis for Marketing, [online] 17(2), pp.139–142. [CrossRef]
- Ritchie, B.W. (2004). Chaos, crises and disasters: a strategic approach to crisis management in the tourism industry. Tourism Management, [online] 25(6), pp.669–683. [CrossRef]
- Štetić, S., 2012. Risks in Tourism (On the Example of Events). Quaestus Multidisciplinary Research Journal, 3, pp.68-78.
- Upadhyay, A and Vadam, C 2015, The role of energy consumption in Hotel Operations. in 22nd International Annual EurOMA Conference. 22nd International Annual EurOMA Conference, European Operations Management Conference (EurOMA), Neuchâtel, Switzerland, pp. 1-10, 22nd International Annual EurOMA Conference, 2/03/15.
- Usman, O., Iorember, P.T. and Jelilov, G. (2020). Exchange rate pass-through to restaurant and hotel prices in the United States: The role of energy prices and tourism development. Journal of Public Affairs. [CrossRef]
- Walsh, W. (2022). Annual Review 2022. [online] iata.org, Canada: International Air Transport Association, pp.1–46. Available at: https://www.iata.org/contentassets/c81222d96c9a4e0bb4ff6ced0126f0bb/annual-review-2022.pdf [Accessed 13 Dec. 2022].
- Williams, A.M. and Baláž, V. (2014). Tourism Risk and Uncertainty. Journal of Travel Research, 54(3), pp.271–287. [Original source: https://studycrumb.com/alphabetizer]. [CrossRef]
Disclaimer/Publisher’s Note: The statements, opinions and data contained in all publications are solely those of the individual author(s) and contributor(s) and not of MDPI and/or the editor(s). MDPI and/or the editor(s) disclaim responsibility for any injury to people or property resulting from any ideas, methods, instructions or products referred to in the content. |
© 2023 by the authors. Licensee MDPI, Basel, Switzerland. This article is an open access article distributed under the terms and conditions of the Creative Commons Attribution (CC BY) license (http://creativecommons.org/licenses/by/4.0/).
Copyright: This open access article is published under a Creative Commons CC BY 4.0 license, which permit the free download, distribution, and reuse, provided that the author and preprint are cited in any reuse.


