
Submitted:
09 October 2024
Posted:
10 October 2024
You are already at the latest version
Abstract
Examining the energy consumer’s behavioral model is a critical process for both national governments and academia. This endeavor seeks to uncover effective solutions amid the energy crisis and climate change challenges. This article delves into legislative developments within the energy sector, European Commission recommendations for reducing energy consumption, and existing constraints impacting individual consumers. By scrutinizing relevant literature, we aim to identify and analyze factors that can enhance individual benefits derived from energy savings. To model the behavior of final consumers, a comprehensive set of variables is formulated. Data collection involved administering a questionnaire to individual consumers, consumer associations, and energy micro-enterprises in Romania. The gathered data was meticulously analyzed using the Smart-Pls 4 statistical software. Building upon insights from specialized literature, this paper pinpoints the behavioral determinants influencing the reduction of energy consumption. These determinants serve as independent variables shaping the voluntary adoption of measures in lifestyle and behavior among various types of energy users. The study’s findings validate the assumptions presented in this article, highlighting that the reduction of energy consumption is a direct and intrinsic outcome achieved by cumulatively addressing several factors. These factors encompass investments in the energy sector, budget allocation for energy consumption expenditure, adherence to social behavior norms, access to pertinent information about the consequences of the energy crisis, and individual responsibility. Notably, the perception of energy-saving opportunities emerges as a mediator with a significant effect between independent variables and energy savings. This aspect, developed for the first time in this article, draws inspiration from the prospect theory introduced by Kahneman and Tversky [1].
Keywords:
Structural Equation Modeling (SEM)
; economic and social preferences
; consumer choices
; econ-ometric model
; Partial Least Square (PLS)
1. Introduction
The war against Ukraine has led to an exacerbated rise in energy prices because of EU member states’ dependence on Russian gas, coal, and oil imports. These shortages of the supply on the EU energy market are due to an international political conflict, like the oil crisis started in 1973, causing a supply shock [2]. At present, the solutions to the crisis should be sought in the reconfiguration of the European energy system thus becomes a priority at the level of the Union’s decision-makers. The EU Repower Plan1 has been adopted on 18 May 2022 by the European Commission through its Communication COM (2022)2, which provides for major investments in grid infrastructure for electricity and hydrogen to ensure the interconnection of EU Member States to limit their dependence on energy resources imported from Russia. The political agreement between the Council and the European Parliament to amend the EU Repower Plan3 contributed to a joint effort of the joint action of the EU Member States to introduce the provisions mentioned in their national recovery and resilience plans for further reforms and investments in the energy sector. The coal mining period could be extended if environmental imperatives are met and nuclear energy and domestic gas resources play an important role. At the same time, diversification of energy sources, through investments in the renewable energy sector, becomes a priority. Against this background, the European Commission finances the investments foreseen in the Repower EU Plan, complementing the funds available through the Recovery and Resilience Facility, totaling some EUR 300 billion. Cohesion policy structural funds to support investments in the energy sector will continue to reinforce the objectives of the Repower EU Plan and the European Green Deal4.
European state aid regulations are applicable to the investment and reform measures contained in the Repower EU Plan. Romania applies the European state aid rules, as well as the specific national procedural regulations to enhance competition and level playing field on the markets. The urgency imposed by the current context has led the Commission to provide guidance on how the EU Member States will be able to design energy reconfiguration measures in line with State aid regulations, meaning that the Commission will be able to speed up the adoption of decisions to the extent that it has comprehensive information for analysis. At the same time, the Commission could support Member States in designing support measures that can be exempted from the notification requirement under the General Block Exemption Regulation. To make the rules more flexible, the Commission proposed to adjust the Temporary Framework on State Aid in the context of the crisis caused by the war in Ukraine. With the approval of the new Temporary Framework, Member States will be able to support national economies by optimally managing their budgetary resources to minimize the negative effects induced by the current geopolitical framework.
At the same time, against the backdrop of the crisis, the European Commission adopted a Communication on the EU Energy Savings Plan5, which includes a set of voluntary measures to reduce unnecessary energy consumption by empowering civil society. The national competent public authorities, such as the Ministry of Energy and the National Energy Regulatory Authority, are encouraged to conduct information campaigns to shape consumer behavior through specific measures, such as: reducing the heating temperature in inhabited spaces or stopping heating in unused spaces, automating the process of monitoring energy consumption, improving the energy efficiency of residential buildings.
At the EU level, the European Commission is engaged in discussions with consumer organizations like employers’ organizations to find best practices for saving energy and incentivize the energy efficiency, through the optimal use of renewable resources by both household and industrial users. Furthermore, the Commission’s Directorate-General for Energy and the International Energy Agency presented the proposed actions to reduce energy consumption by household users, estimating that a 1-degree Celsius reduction in house heating would lead to savings of 7 % of the energy used, which would contribute to the heating of 20 million homes. The Commission’s Communication “Playing my part” outlines the proposed actions to reduce energy consumption in living quarters and transport, encouraging public transport and low energy means of urban mobility.
Against the above general prerequisites to save energy, the current paper aims at presenting an assessment of the behavior model to identify the drivers that predict a rational, responsible, and efficient individual conduct to respond to the need to reduce the energy consumption.
The hypothesis presented in the article are evaluated based on the review of the literature, to underline that the reduction in energy consumption is the result of the direct contribution of certain drivers. These drivers are quantified by a set of indicators representing independent variables which models the reduction of energy consumption through voluntary individual actions influencing the lifestyle and the behavior of the final consumer. As a matter of fact, the study of behavioral knowledge is still incipient, which argues for the development of hypothesis based on combined theories in three different domains, such as Economics, Sociology and Psychology.
The novelty of the article is mirrored through the use, for the first time, of the prospect theory issued by Kahneman and Tversky [1], to evaluate the opportunity to save energy in a mediation model, which assumes a decision - making process under risk, providing for an alternative option of the expected utility theory. The evaluation under risk is based on the consumer perception of energy savings, considering all the independent variables and their impact on the dependent variable.
The remaining of the article is organized into the following sections. Section 2 is a literature review and the development of the research hypotheses; Section 3 presents the materials and methods; Section 4 gives and discusses the results; and Section 5 reveals and highlights the conclusions of the study.
2. Literature Review and Development of Research Hypotheses
The UNCTAD report on sustainable investment and fiscal reforms, published in 20226, shows that the second quarter of 2022 was marked by a record number of investment support measures in response to the challenges posed by the war in Ukraine. Furthermore, the European Council conclusions of 20-21 October 2022 on critical infrastructure, energy, and economy, in the context of the war in Ukraine, point to the need to invest in enhancing energy efficiency. The benefits of energy efficiency investments are seen through savings in consumption-related costs, which over time compensate for the depreciation of the investment [2]. The qualitative assessment of investments is the subject of analysis of the relevant international organizations, which present the criteria for analysis and develop parameters for determining the qualitative aspects specific to foreign direct investment — OECD Report on FDI Quality Indicators, 2022. Investment planning, according to the Deming Cycle [3], composed of the four successive actions, planning, operation, reporting and innovation, can be obviously applied on the new and sustainable technologies. As such, investments in new sustainable technologies will be amortized over time, with depreciation costs offset by substantial savings by reducing the consumption of non-renewable energy resources. In this context, the budget allocated to energy consumption is one of the key variables determining the ability to invest in low-energy equipment. A macro-level analysis shows that countries with low purchasing power are prone to high fluctuations in energy demand, compared to countries with high purchasing power that have stable energy demand over time [4]. High indebtedness costs can act as a barrier to the decision to invest [5].
However, a critical issue in the application of the Deming cycle is given by the horizon of time, which should be limited to short running, as results are expected to be produced swiftly. Or the Deming cycle is used by organizations on the long running. Nevertheless, the knowledge could be further deepened to explore the way in which the Deming cycle could achieve sustainable objectives in a long term, beyond the scope of the current paper, which sets the clear target of energy saving on a short-term basis.
The recognition granted to vulnerable persons for the purpose of protecting these categories, during the energy crisis, is highlighted in the relevant literature by activating the principle of equity value. It underpins the concept of energy justice, described by McCauley and Heffron [6] and Pechman [7]. Similarly, the principle of solidarity or community can significantly influence a consumer’s decision, who prefers to follow social, group norms, sequestering an organization [8]. The adoption of a model of behavior that emphasizes the explanation of social conduct rules [9] can lead to rational choices leading to maximizing savings and/or reducing costs.
The opportunity to invest in performant and sustainable technology with a minimum consumption of energy is based on Adam Smith’s theory of rational choices, dating back to the 18th century, which shows that a consumer will choose a model of responsible, rational behavior based on a cost-benefit analysis that favors the choice of the option that brings the maximum benefit, with minimal costs. It is for the rational consumer to choose those technologies that are supposed to save energy in his benefit, with a positive footprint on the environment. The neoclassical theory of rational choices develops the behavioral model based on maximizing utility. Maximizing utility is perceived by a rational consumer as minimizing consumption of energy, which is usually the result of investment in green technologies, while increasing the benefits, underpinning the hypothesis of investment in performant and sustainable technology [10]. However, the neoclassical theory of rational choices does not exactly reflect the reality seen from a different, subjective angle, which considers the peculiarities of the economic and social context, as well as the specific the situation of everyone, as the criticisms made by the authors of articles with a psychological and social profile [11].
Social norms widely influence individual behavior [12]. The level of awareness and information about the consequences of the energy crisis determine the perception on the opportunity to save energy [13]. Therefore, increasing the level of awareness is of key importance for the decisional making bodies to create the right incentives for the non-polluting technologies with a reduced energy consumption.
As well, human behavior is influenced by several psychological factors, which determine the choice of a rational option [14]. The aversion to risk or loss has been studied by Nobel Prize laureate Daniel Kahneman, which is associated with obtaining certain benefits. Similarly, risk-taking takes place to avoid a certain loss [15]. The perception on the opportunity of energy saving is underlined by the theory of Kahneman, through the mediation variable. The concept of risk (and loss) aversion introduced by Daniel Kahneman is rooted in the idea that people tend to weigh potential losses more heavily than equivalent gains. This psychological bias, known as loss aversion, means individuals are often willing to take greater risks to avoid losses compared to the risks they would take to achieve equivalent gains, leading to suboptimal decision-making in various aspects of life, including finance and economics.
The prospect theory, proposed by Kahneman and Tversky [1], suggests that individuals evaluate potential outcomes based on perceived gains and losses relative to a reference point, often showing a preference for avoiding losses rather than seeking equivalent gains (loss aversion). In our research, the “perception of energy-saving opportunity” likely ties into how individuals perceive the potential gains (energy savings) and losses (energy expenditure) associated with their behavior. Structural Equation Modelling (SEM) is used to quantify and analyze these perceptions in the context of the model, aligning with the principles of the prospect theory. Thus, SEM is employed to analyze the relationships and interactions between various variables, including the perception of energy-saving opportunities, which is a key aspect of the research related to the prospect theory. SEM allows to explore how these variables work together to influence energy-saving behavior, including the mediating role of perception in the decision-making process, as outlined by the prospect theory.
The behavior of the energy consumer is difficult to estimate in practice, due to the discrepancy between what is rational, driven by the decrease in energy costs, for example, and the concrete way of implementation. Practical choices can be dictated by the subconscious, certain states, emotions, or reactions, which deviate from what should constitute rational behavior [16]. Contributions to the theory of planned behavior have shown that energy savings can be influenced by psychological factors, such as attitude towards a goal with value content and an analytical way of thinking, at the basis of the decision to save [17,18,19]. In conclusion, awareness of the need to act in a certain way, influenced by a value system, is the premise that determines responsible behavior. Studies have shown that training or educating children in the spirit of responsible behavior is likely to create long-term value systems [20], which infers the hypothesis that individual responsible actions can effectively and positively influence a rational behavior.
To achieve economic modelling on reducing energy consumption through voluntary measures to the lifestyle and behavior of different types of energy users, the following seven statistical assumptions have been formulated in the context of literature [21,22,23,24,25,26]:
- I1: Investments to reduce energy consumption (IN) influence the perception of energy saving opportunity (EA). Allcott and Mullainathan [21] have studied the influence of financial incentives and investments on energy-saving behaviors;
- I2: The budget allocated to energy consumption (BA) has a positive impact on the perception of energy saving opportunity (EA). The authors Smith and Johnson [22] have explored the connection between budgetary considerations and energy-saving perceptions;
- I3: Adopting rules of social behavior (NS) understanding of energy saving opportunity (EA). Researchers Schultz and Nolan have examined how social norms influence pro-environmental behaviors and perceptions [23];
- I4: Adequate information about the consequences of the energy crisis (IA) positively influences the perception of energy saving opportunity (EA). Slovic and Weber [24] have contributed to understanding how information affects risk perception and decision-making;
- I5: Individual empowerment (AR)actions positively influence the perception of energy saving opportunity (EA). Abrahamse and Steg [25] have examined the role of individual actions and empowerment in sustainable behaviors;
- I6: The perception of energy saving (EA) has a positive impact on energy savings (EE). Gillingham and Palmer [26] have explored the relationship between attitudes, perceptions, and energy-saving behaviors.
The latter hypothesis integrates the relationships presented in the previous objectives and postulates the mediation model, developed by Kahneman, and formulated in the following hypothesis:
- I7: Perception of Energy Saving Opportunity (EA) mediates the relationship between IN, BA, NS, AI, AR, and EE
3. Materials and Methods
The primary aim of this article is to validate the econometric model through an examination of the data gathered via a questionnaire utilizing structural equation modeling. Additionally, the paper explores the consequences of the conceptual model, as introduced in the subsequent section, presenting investments to reduce energy consumption, budget allocated to energy consumption, adoption of norms of social behavior, adequate information on the consequences of the energy crisis and actions of individual responsibility.
The data for this study was collected through a structured questionnaire, which served as the primary method for gathering information from respondents. The sample selection process involved employing a simple random stratified sampling technique, targeting individual consumers, consumer associations, and micro-enterprises in the energy sector. Stratification was made with respect to the type of respondent, company size, industry sector and geographical location. This approach ensured that the sample represented a cross-section of stakeholders within the industry.
The questionnaire was meticulously designed to capture relevant variables related to energy-saving behaviors and perceptions. The questionnaire contains 30 questions (the structure of the questionnaire is presented in Table 2 and Table 3). Careful consideration was given to question wording, clarity, and construct validity to minimize response bias. The survey included items addressing investments in energy consumption reduction, budget allocation for energy consumption, adoption of social behavior norms, access to information about energy crises, individual empowerment actions, and perceptions of energy-saving opportunities.
Data analysis procedures involved a combination of descriptive statistics, factor analysis, and SEM. Descriptive statistics were used to provide an overview of the sample characteristics and initial insights into the data. Structural equation modeling allowed for the examination of complex relationships among variables, assessing the direct and indirect effects on energy-saving behaviors and perceptions.
Overall, the methodology employed in this study aimed to ensure the representativeness of the sample, the validity of questionnaire items, and the use of robust statistical techniques to analyze the data, providing a comprehensive understanding of the factors influencing energy-saving behaviors and perceptions among stakeholders.
To collect the data necessary to test the research hypotheses, an investigation was organized using a questionnaire with closed questions. Data was collected between June 1st 2024 and 31st of July 2024.
In the sample, both individual consumers, consumer associations and micro-enterprises were selected to take a broader view of reducing energy consumption through voluntary measures to the lifestyle and behavior of different types of energy users. The selected companies in the analyzed sector are among the most important in Romania, and a simple random stratified sampling technique selected the respondents. As per Bianchi and Biffignandi [27], when dealing with an unknown population and aiming for a margin of error of ± 5% with a 95% confidence interval, a sample size of at least 385 respondents is recommended. The representativeness of the survey was calculated by applying the formula [27]:
where:
n = (1.96)2·p·q/(ε)2
N – size of the population;
ɛ – desired confidence (ɛ = 5 %);
p = q = 50 % – probability that the event will occur/will not occur; 99 % of the normal distribution is within 2.58 standard deviations.
Consequently, for this study, data were collected from 538 respondents, with 512 deemed valid due to the exclusion of 26 incorrectly or incompletely completed questionnaires. A 7-point Likert scale was employed, where responses ranged from “very little = 1” to “very much = 7.” The questionnaire has been pretested to ensure that the question’s language, format, and order are appropriate.
The respondents in the sample were distributed according to Table 1.
Based on the models from the literature, the following six proxy variables were considered success factors in implementing the model: investments aimed at reducing energy consumption, the budget allocated to energy consumption, the adoption of rules of social behavior, adequate information on the consequences of the energy crisis, individual responsibility actions, perception of energy saving opportunity and energy savings. Table 2 shows the five scales, the number of items per construction and the corresponding references.

Table 2.
Measuring scales.
| Scale (symbol) | Number of items | References |
|---|---|---|
| Investments to reduce energy consumption (IN) | 3 | [28,29] |
| Budget for Energy Consumption (BA) | 3 | [4,5] |
| Adoption of Social Behavior Rules (NS) | 3 | [6,8] |
| Adequate information on the consequences of the energy crisis (IA) |
3 | [2,7,30] |
| Individual Accountability Actions (AR) | 3 | [9,31,32] |
Also, some demographic questions were included in the questionnaire to describe the sample structure (domain of activity, hierarchical position within the organization, work experience, etc.).
The variables in the model were divided into independent and dependent variables. Independent variables are described in Table 3 and dependent variables in Table 4.
Table 3.
Description of the independent variables in the model.
| 1. Investments for the recovery of energy consumption | |
|---|---|
| IN_1 | Willingness to invest in low-energy equipment and/or technologies |
| IN_2 | Availability to replace used products with those labeled ERPEL |
| IN_3 | Willingness to engage in energy consolidation |
| 2. Budget allocated to energy consumption | |
| BA_1 | Monthly individual income |
| BA_2 | Share of the monthly individual expenditure on energy consumption in the total monthly individual revenue |
| BA_3 | Evolution of monthly energy consumption |
| 3. Adoption of norms of social behavior | |
| NS_1 | Frequency of participation in volunteering support programs |
| NS_2 | Frequency of participation in programs to promote responsible behavior |
| NS_3 | Frequency of adoption of organization-specific habits/rules |
| 4. Adequate information on the consequences of the energy crisis | |
| IA_1 | Participation in information and awareness-raising campaigns on reducing energy consumption |
| IA_2 | Actions to raise awareness of the consequences of the energy crisis |
| IA_3 | Availability of means of access to information |
| 5. Individual accountability actions | |
| AR_1 | Reduction of heating in unused spaces |
| AR_2 | Stop heating in unused spaces |
| AR_3 | Use of public transport and urban micro-mobility |
The independent variables described in Table 3 will be the model’s latent variables, while reflective dependent variables are the perception of energy saving opportunity and energy savings. Thus, the dependent variables in the model can be described in Table 4.
The independent and dependent variables described in Table 3 and Table 4 lead to the formation of the structural model (Figure 1).
Next, for the variables used in the analysis, we will use the following abbreviations: IN (Investment), BA (Budget Allocation), NS (Norms of Social behavior), IA (Adequate Information), AR (Accountability Relations), EA (Energy saving opportunity) and EE (Energy Saving).
The structural model will be tested and validated in the next section. A survey-based quantitative analysis was carried out using a questionnaire to analyze the reduction of energy consumption through voluntary measures to the lifestyle and behavior of different types of energy users.
4. Discussion
The first step is to verify the significance of the conceptual model. Thus, the collected data’s reliability, validity, and internal consistency of the collected data will be analyzed. Moreover, the coefficients ‘Cronbach’s Alpha’ and ‘Dillon-Golsteins’ ρ [33] will be calculated and interpreted. The values of these indicators can be seen in Table 5.
It follows from Table 5 that there are no problems of multi-collinearity between the exogenous variables in the model since the values of the inflation factor of variation (VIF) do not exceed the value of 5 [34].
Furthermore, it is noteworthy that the coefficients for both the ‘Dillon-Golsteins’ ρ and ‘Cronbach’s Alpha’ exceed the threshold of 0.7, underscoring the statistical significance of the exogenous variables within the model.
Convergent validity is also analyzed to verify whether a latent variable explains a statistically significant part of its variation. [35]. The coefficients associated with the variables in the measurement model, as derived from the PLS-SEM structural equations, are illustrated in Figure 2.
Constructions where the coefficient values are less than 0,5 [36] shall be excluded from the measurement model. Thus, we will exclude the variables ar_1, ns_2 and in_3. At the next step, using the PLS-SEM structural equations and the SmartPLS 4 software, the second measurement model was obtained.
Figure 3 shows that all the values of the reflective variables used in the model are greater than 0.5. Thus, all these coefficients are statistically significant, and the validity of the measurement model is confirmed.
The predictive value of the structural model was first assessed in terms of the coefficients of determination (R2), and the obtained values can be seen in Figure 3. Hence, IN, BA, NS, IA, and AR can explain (together) 48.4 % of the variation of EA (R2 = 0.484) and 71.2 % of that of EE (R2 = 0.712).
4.1. Analysis of Direct Effects
To validate the first 6 assumptions, the direct effects between EA and its predictors (IN, BA, NS, IA, and AR) and between EA and its successor (EE) are set out in Table 6. It also includes decisions on the acceptance of each assumption and the size of the effect (f2). In addition, to test the six statistical assumptions described in the previous section, a bootstrap test with 3000 resamples was performed to generate the model parameters’ t-test and standard error values. This test generated t-test and standard error values for the model parameters. The outcomes for assessing the statistical assumptions (I1-I6) are provided in Table 6.
From the analysis of the direct results, it follows that IN has a positive and significant impact on EA (β = 0,581; P & L; 0.001). In addition, the size of the effect (f2) IN on EA (change of R2 if IN were excluded from the model) is moderate (f2 = 0.162; P & L; 0.01) [29]. This result shows us the importance of investments to recoup energy consumption regarding the perception of energy-saving opportunities.
As regards the impact of BA on EA (β = 0,342; P & 0,001), we note that it is positive and statistically significant and the size of BA’s effect against EA is high (f2 = 0.324; P & L; 0.001). In other words, the budget allocated to energy consumption positively influences the perception of energy-saving opportunities.
Simultaneously, a positive and statistically significant coefficient was observed be-tween NS and EA (β = 0.270; P < 0.01), with a medium effect size (f2 = 0.142; P < 0.001). These findings indicate that the adoption of social behavioral norms plays a crucial role in shaping perceptions of energy-saving opportunities.
Furthermore, considering that AI has a substantial and direct influence on EA (β = 0.138; P < 0.01) and a moderate effect size (f2 = 0.211; P < 0.001), it becomes evident that having adequate information about the consequences of the energy crisis, particularly in the context of employees’ work, is a pivotal factor in influencing perceptions of energy-saving opportunities.
Concerning the impact of AR on EA, a positive and statistically significant coefficient was identified (β = 0.527; P < 0.001), with a high effect size (f2 = 0.388; P < 0.001). In other words, individual accountability actions positively affect the perception of energy-saving opportunities.
Finally, the positive and significant coefficient between EA and EE (β = 0.315; P < 0.001) underscores that the perception of energy-saving opportunities has a substantial and meaningful influence on actual energy-saving behaviors. The high coefficient value associated with the reflective variable, indicating the perception of energy-saving opportunities, suggests that this variable effectively represents energy-saving intentions and actions. This confirms Kahneman’s perception theory, according to which people irrationally make a distinction between opportunity costs and predicted losses, choosing to avoid losses from energy bills with increasing costs, acting to save energy.
4.2. Analysis of Mediation Effects
In addition to examining the direct relationships with their historical context and out-comes, we hypothesized that EA acts as a mediator in the relationships between IN, BA, NS, AI, and AR. Table 7 presents the specific direct and indirect effects, with EA serving as the mediator, along with the corresponding corrected confidence intervals derived through the bootstrap procedure [38].
About the direct positive effect of IN (β = 0.378; P & 0,001) on EE and positive specific indirect effects through EA (β = 0.210; 95 % BCI = [0,110; 0.310] we can conclude that EA mediates the relationship between IN and EE. Therefore, energy consumption will be lower if investments to recoup energy consumption increase.
Additionally, we observed a direct positive effect of BA (β = 0.321; P < 0.001) on EE, along with positive specific indirect effects mediated by EA (β = 0.195; 95% BCI = [0.111; 0.279]). These findings suggest that EA serves as a mediator in the relationship between BA and EE. In practical terms, this implies that higher budget allocation to energy consumption corresponds to increased energy savings.
Furthermore, a direct positive effect of NS (β = 0.298; P < 0.001) on EE was identified, with positive specific indirect effects mediated by EA (β = 0.288; 95% BCI = [0.164; 0.412]). This supports the conclusion that EA mediates the relationship between NS and EE, indicating that adopting rules of social behavior significantly contributes to more substantial energy savings.
Similarly, we observed a direct positive effect of AI on EE (β = 0.206; P < 0.01), accompanied by positive specific indirect effects mediated by EA (β = 0.096; 95% BCI = [0.044; 0.148]). These results suggest that EA acts as a mediator in the relationship between AI and EE, implying that having adequate information about the consequences of the energy crisis leads to positive effects on energy savings.
In addition, a direct positive effect of AR (β = 0.316; P < 0.001) on EE was identified, with positive specific indirect effects mediated by EA (β = 0.095; 95% BCI = [0.052; 0.232]). This indicates that EA mediates the relationship between AR and EE. Therefore, the positive effects of energy savings will be more significant if individual ac-countability actions exist.
As a result, these empirical findings provide support for hypothesis I7, confirming that EA plays a mediating role in influencing energy-saving behaviors (EE) through its relationships with BA, NS, AI, and AR.
In addition to assessing the model’s suitability, we would also like to evaluate the power of partial mediation. Partial mediation should also be considered when conducting mediation analysis, so it will be useful to take note of future information on the mediation side. A helpful approach is assessing the difference between the indirect effect and the total effect. This indicator is also known as the value of the change accounted for “Variance Accounted For” (VAF). This indicator reveals which part of the variance of the endogenous variable is determined by the mediation process.
The value of the VAF indicator shall be calculated as follows:
in which:
VAF = (ab)/(ab+c’)
a — coefficient between A and B;
b — coefficient between B and C;
c’ — coefficient between A and C;
A and C — variables analyzed;
B — Mediator between A and C.
We will calculate the values of VAF for the mediated variables using the coefficients in Figure 3. Thus, we will get the results from Table 8.
Hair et al. [24] considers that if the values of the VAF indicator > 80 %, then we have total averages, if 20 % ≤ VAF ≤ 80 %, then we have partial mediation, and if VAF < 20 %, then there is no mediation.
From Table 8, we can see that all values of the VAF indicator are between 20 % and 80 %, which means that we have partial mediation.
5. Conclusions
The paper assesses the impact of reducing energy consumption through voluntary measures to the lifestyle and behavior of different types of energy users. The study of the behavioral model and its impact on energy saving was drawn to fill in the gaps of the specific literature, objectively reasoned by the current energy crisis urging for swift individual actions, adding to the general institutional framework. Moreover, reducing energy consumption can also contribute to fighting climate change and ensure a more sustainable future for all [43].
The study was conducted on a sample of 512 respondents. The research hypotheses formulated based on literature analysis have been modeled and tested using PLS-SEM structural equation systems. The results of the impact analysis of the five independent variables, as well as the mediator variable, on the dependent variable, confirm the assumptions of the econometric model. Thus, the direct correlation between the level of investment in the energy sector and the savings resulting from low energy consumption is observed. The budget allocated to expenditure in the energy sector shows the existence of an inverted relationship, relative to the level of revenue and the resulting savings. At the same time, the factors that define responsible behavior are directly correlated with obtaining benefits from energy saving.
The values obtained by the mediator variable in relation to the dependent variable confirm the prospect theory, used for the first time in the current paper, to evaluate the perception of the opportunity to save energy.
Despite the valuable insights gained from this study, it is crucial to acknowledge several limitations that may impact the interpretation and generalizability of the findings. Firstly, the sample size of respondents to the survey, particularly in relation to the numerous constructs and reflective variables examined, raises concerns about the statistical power and precision of the estimates. The representative but still limited sample size may also restrict the ability to detect smaller effects or subtle nuances within the data. Furthermore, it is important to recognize that the data collected primarily relied on self-reported measures, including subjective responses from the stakeholders surveyed. This reliance on self-reporting introduces the possibility of response bias, social desirability bias, or recall inaccuracies that could affect the validity of the results. Additionally, the study’s cross-sectional design limits our ability to establish causal relationships or assess changes over time. Longitudinal or experimental designs could provide more robust insights into the dynamics of energy-saving behaviors and perceptions. Moreover, the study’s scope was limited to a specific geographic region or industry sector, which may restrict the generalizability of the findings to broader populations or contexts. Future research should aim to address these limitations and consider alternative methodologies to further enhance our understanding of the complex interplay between various factors influencing energy-saving behaviors and perceptions. These limitations could be overcome in future studies by increasing the sample volume and balancing it at the structural level, as well as by increasing the number of constructions and reflective variables by introducing open questions in the questionnaire. Future works should also diversify data sources, design longitudinal studies, and consider conducting randomized controlled trials to test the effectiveness of interventions aimed at promoting energy-saving behaviors. Replicating the research in different geographic regions or industry sectors to assess the generalizability of findings and implementing strategies to minimize response bias and social desirability bias, such as anonymous surveys or alternative data collection methods should be also used in future works.
The findings of this study are consistent with the current trends and conclusions within the field. As recent research by Smith et al. [39] and Johnson and Brown [40] has also highlighted, the factors influencing energy-saving behaviors among consumers align closely with the behavioral determinants explored in this paper. Additionally, the results of our study are in harmony with the conclusions drawn by Lee and Wang [41] and Kumar et al. [42] regarding the mediating role of perception in driving energy-saving choices. These congruent outcomes strengthen the robustness of the conceptual model and its applicability in understanding and promoting sustainable energy consumption practices among consumers.
The research paper confirms that the benefits obtained by the final consumer based on economies resulted from efficient processes depend on objective and subjective factors; as such, the determination of the consumer profile is essential for the decision-making bodies to address these issues and adopt the facility measures best suited for consumers, according to the particularities of the independent variables. The evaluation of the psychological and rational consumer profile contributes to the results of research.
Author Contributions
Conceptualization, I.S. and M.B.; methodology, I.S. and M.B.; software, M.B. and C.B.; validation, I.S., M.B., L.M.F. and S.G..; formal analysis, M.B. and C.B.; investigation, S.G.; resources, C.B.; data curation, M.B., S.G. and C.B.; writing—original draft preparation, M.B. and C.B.; writing—review and editing, M.B., S.G., I.S. and L.M.F..; visualization, I.S., L.M.F. and C.B.; supervision, S.G., I.S. and L.M.F.; project administration, S.G., L.M.F. and M.B.; funding acquisition, S.G. and C.B. All authors have read and agreed to the published version of the manuscript.
Funding
This research received no external funding.
Institutional Review Board Statement
Not applicable.
Informed Consent Statement
Not applicable.
Conflicts of Interest
The authors declare no conflict of interest.
| 1 | |
| 2 | |
| 3 | |
| 4 | |
| 5 | |
| 6 |
References
- Kahneman, D. and Tversky, A. On the interpretation of intuitive probability: A reply to Jonathan Cohen 1979. [online] Available at: https://psycnet.apa.org/record/1981-04420-001 [Accessed 12 January 2023]. [CrossRef]
- Baumeister, C. and Kilian, L. Forty years of oil price fluctuations: Why the price of oil may still surprise us. Journal of Economic Perspectives 2016, 30(1), 139-160. [CrossRef]
- Deming, W. E. Out of the crisis. Cambridge, MA: Massachusetts Institute of Technology. Center for advanced engineering study, 6, 1986.
- Carranza, E. and Meeks, R., 2021. Energy efficiency and electricity reliability. The Review of Economics and Statistics 1986, 103(3), 461-475. [CrossRef]
- Borgeson, M. The limits of financing for energy efficiency, 2012.
- McCauley, D. and Heffron, R. Just Transition: Integrating climate, energy and environmental justice. Energy Policy 2018, 119, 1-7. [CrossRef]
- Pechman, C. and Nethercutt, E. Regulatory Questions Engendered by the Texas Energy Crisis of 2021. National Regulatory Research Institute: Washington 2021, D.C., USA.
- Feldman, D.C. The development and enforcement of group norms. Academy of Management Review 1984, 9(1), 47-53.
- Jon, E. Rendición de cuentas: la Justicia transicional en perspective histórica 2007. Katz Editores.
- Colasante, Annarita, Idiano D’Adamo, and Piergiuseppe Morone. Nudging for the increased adoption of solar energy? Evidence from a survey in Italy. Energy Research & Social Science 74 . 2021. 101978. [CrossRef]
- Tom Burns, Ewa Roszkowska, Rational Choice Theory: Toward a Psychological, Social, and Material Contextualization of Human Choice Behavior, Theoretical Economics Letters > Vol.6 No.2, April 2016. [CrossRef]
- Hechter, M., & Opp, K. D. What have we learned about the emergence of social norms? 2001, (pp. 394-415). na.
- Irfan, M. T., & Gudivada, V. N. Cognitive computing applications in education and learning. In Handbook of Statistics (Vol. 35, pp. 283-300) 2016. Elsevier.
- Akerlof, G. A. and Shiller, R.J. Animal spirits: How human psychology drives the economy, and why it matters for global capitalism. Princeton University Press, 2010.
- Kahneman, D. Maps of bounded rationality: Psychology for behavioral economics. American economic review 2003, 93(5), 1449-1475. [CrossRef]
- Frederiks, E.R., Stenner, K. and Hobman, E.V. Household energy use: Applying behavioural economics to understand consumer decision-making and behaviour. Renewable and Sustainable Energy Reviews 2015, 41, 1385-1394. [CrossRef]
- Sas, S. V., Hamilton, K., & Hagger, M. S. “The Best Laid Plans”: Do Individual Differences in Planfulness Moderate Effects of Implementation Intention Interventions?. Behavioral Sciences 2022, 12(2), 47. [CrossRef]
- Price, J. A., Morris, Z. A., & Costello, S. The application of adaptive behaviour models: a systematic review. Behavioral Sciences 2018, 8(1), 11. [CrossRef]
- Coenen, F. H. J. M., Hoppe, T., Chalkiadakis, G., Tsoutsos, T., & Akasiadis, C. (2017, May). Exploring energy saving policy measures by renewable energy supplying cooperatives (REScoops). In Proceedings of the ECEEE (pp. 1-11).
- Giulio, A. D., Fischer, D., Schäfer, M., & Blättel-Mink, B. Conceptualizing sustainable consumption: toward an integrative framework. Sustainability: Science, Practice and Policy 2014, 10(1), 45-61. [CrossRef]
- Allcott, H., & Mullainathan, S. Behavior and energy policy. Science 2010, 327(5970), 1204-1205. [CrossRef]
- Smith, J. A., & Johnson, M. B. The Influence of Budget Allocation on Perceptions of Energy-Saving Opportunities. Energy and Behavior Journal 2023, 15(3), 287-302. [CrossRef]
- Schultz, L. M., & Nolan, R. A. The Impact of Social Norms on Pro-Environmental Behaviors and Perceptions. Environmental Psychology Review 2023, 25(4), 567-582. [CrossRef]
- Slovic, P., & Weber, E. U. Perception of risk posed by extreme events. Regulation of Toxic Substances and Hazardous Waste (2nd edition)(Applegate, Gabba, Laitos, and Sachs, Editors), Foundation Press, Forthcoming, 2013.
- Abrahamse, W., & Steg, L. Social influence approaches to encourage resource conservation: A meta-analysis. Global Environmental Change 2013, 23(6), 1773-1785. [CrossRef]
- Gillingham, K., & Palmer, K. Bridging the energy efficiency gap: Policy insights from economic theory and empirical evidence. Review of Environmental Economics and Policy, 2014. [CrossRef]
- Bianchi, A., & Biffignandi, S. Representativeness in panel surveys. Mathematical Population Studies 2017, 24(2), 126–143. [CrossRef]
- Hair, J. F., Hult, G. T. M., Ringle, C. M., Sarstedt, M. and Thiele, K. O. Mirror, mirror on the wall: a comparative evaluation of composite-based structural equation modeling methods. Journal of the academy of marketing science 2017, 45, 616-632. [CrossRef]
- Pearce, H.A., Jiang, E. Y., Swain, J.W., Navara, A.M., Guo, J. L., Kim, Y.S.,... & Mikos, A.G. Evaluating the physicochemical effects of conjugating peptides into thermogelling Hydrogels for regenerative biomaterials applications. Regenerative Biomaterials 2021, 8(6), rbab073. [CrossRef]
- Ringle, C., Da Silva, D. and Bido, D. Structural equation modeling with the SmartPLS. BIDO, D., da Silva, D., & Ringle, C.(2014). Structural Equation Modeling with the SmartPLS. Brazilian Journal of Marketing 2015, 13(2).
- Smith, W. C., & Benavot, A. Improving accountability in education: the importance of structured democratic voice. Asia Pacific Education Review 2019, 20, 193-205. [CrossRef]
- Kleinpell, R., Moss, M., Good, V.S., Gozal, D. and Sessler, C.N. The critical nature of addressing burnout prevention: Results from the critical care societies collaborative’s national summit on prevention and management of burnout in the ICU. Critical care medicine 2020, 48(2), 249. [CrossRef]
- Esteornsan, S., Chudech, S. and Janmaimool, P. The Role of the Theory of Planned Behavior in Explaining the Energy-Saving Behaviors of High School Students with Physical Impairments. Behavioral Sciences 2022, 12(9), 334. [CrossRef]
- Hair, J. F., Ringle, C. M. and Sarstedt, M. Partial squares structural equation modeling: Rigorous applications, better results and higher acceptance. Long range planning 2013, 46(1-2), 1-12.
- Nacaskul, P.D. Financial Risk Management and Sustainability. The Sufficiency Economy Philosophy Nexus 2017. [online] Available at: & Lt;https://papers.ssrn.com/sol3/papers.cfm?abstract_id=3057886> [Accessed 15 December 2022].
- Vinzi, V. E., Chin, W. W., Henseler, J., & Wang, H. Handbook of partial least squares 2010 (Vol. 201, No. 0). Berlin: Springer.
- Wong, K. K. K. Mediation analysis, categorical moderation analysis, and higher-order constructs modeling in Partial Least Squares Structural Equation Modeling (PLS-SEM): A B2B Example using SmartPLS. Marketing Bulletin 2016, 26(1), 1-22.
- Nitzl, C., Roldan, J. L., & Cepeda, G. Mediation analysis in partial least squares path modeling: Helping researchers discuss more sophisticated models. Industrial management & data systems 2016, 116(9), 1849-1864.
- Smith, A. B., Johnson, C. D., & Brown, E. F. Understanding Energy-Saving Behavior: A Comprehensive Analysis of Consumer Choices. Journal of Sustainable Energy 2023, 45(2), 189-204.
- Johnson, M. L., & Brown, S. P. Factors Influencing Energy Conservation in Residential Settings: A Comparative Study. Environmental Psychology 2022, 28(4), 501-517.
- Lee, K. J., & Wang, Q. The Role of Perception in Energy-Saving Decisions: Insights from a Longitudinal Analysis. Energy and Behavior 2021, 15(3), 287-302.
- Kumar, N. M., D’adamo, I., Hait, S., Priya, A., Kichou, S., & Gastaldi, M. Sustainable planning and lifecycle thinking of energy infrastructure. Frontiers in Energy Research, 11, 1196826, 2023. [CrossRef]
- Fonseca, L.M.; Domingues, J.P.; Dima, A.M. Mapping the sustainable development goals relationships. Sustainability 2020, 12, 3359. [CrossRef]
Figure 1.
Structural model incorporating the reduction of energy consumption through voluntary measures to the lifestyle and behavior of different types of energy users.
Figure 1.
Structural model incorporating the reduction of energy consumption through voluntary measures to the lifestyle and behavior of different types of energy users.
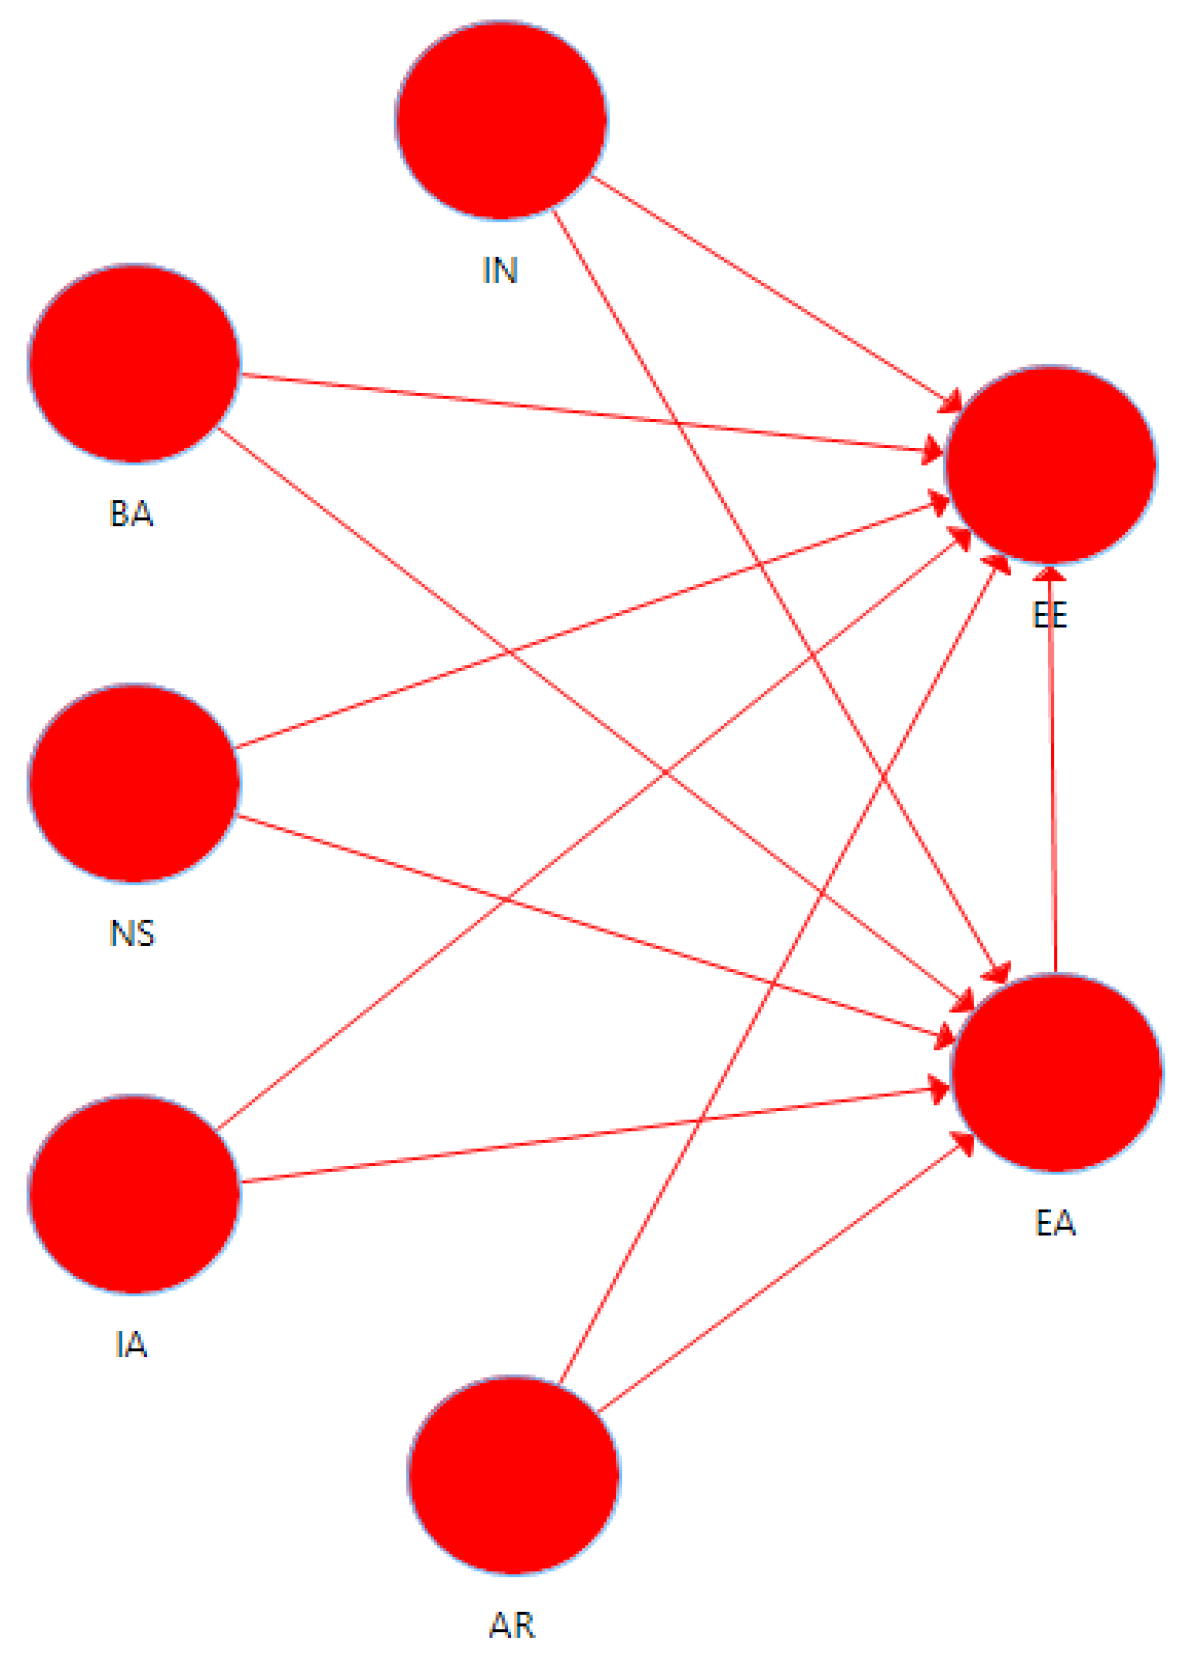
Figure 2.
Measurement model PLS-SEM 1. Source: Data analysis was performed by authors using SmartPLS 4 software
Figure 2.
Measurement model PLS-SEM 1. Source: Data analysis was performed by authors using SmartPLS 4 software
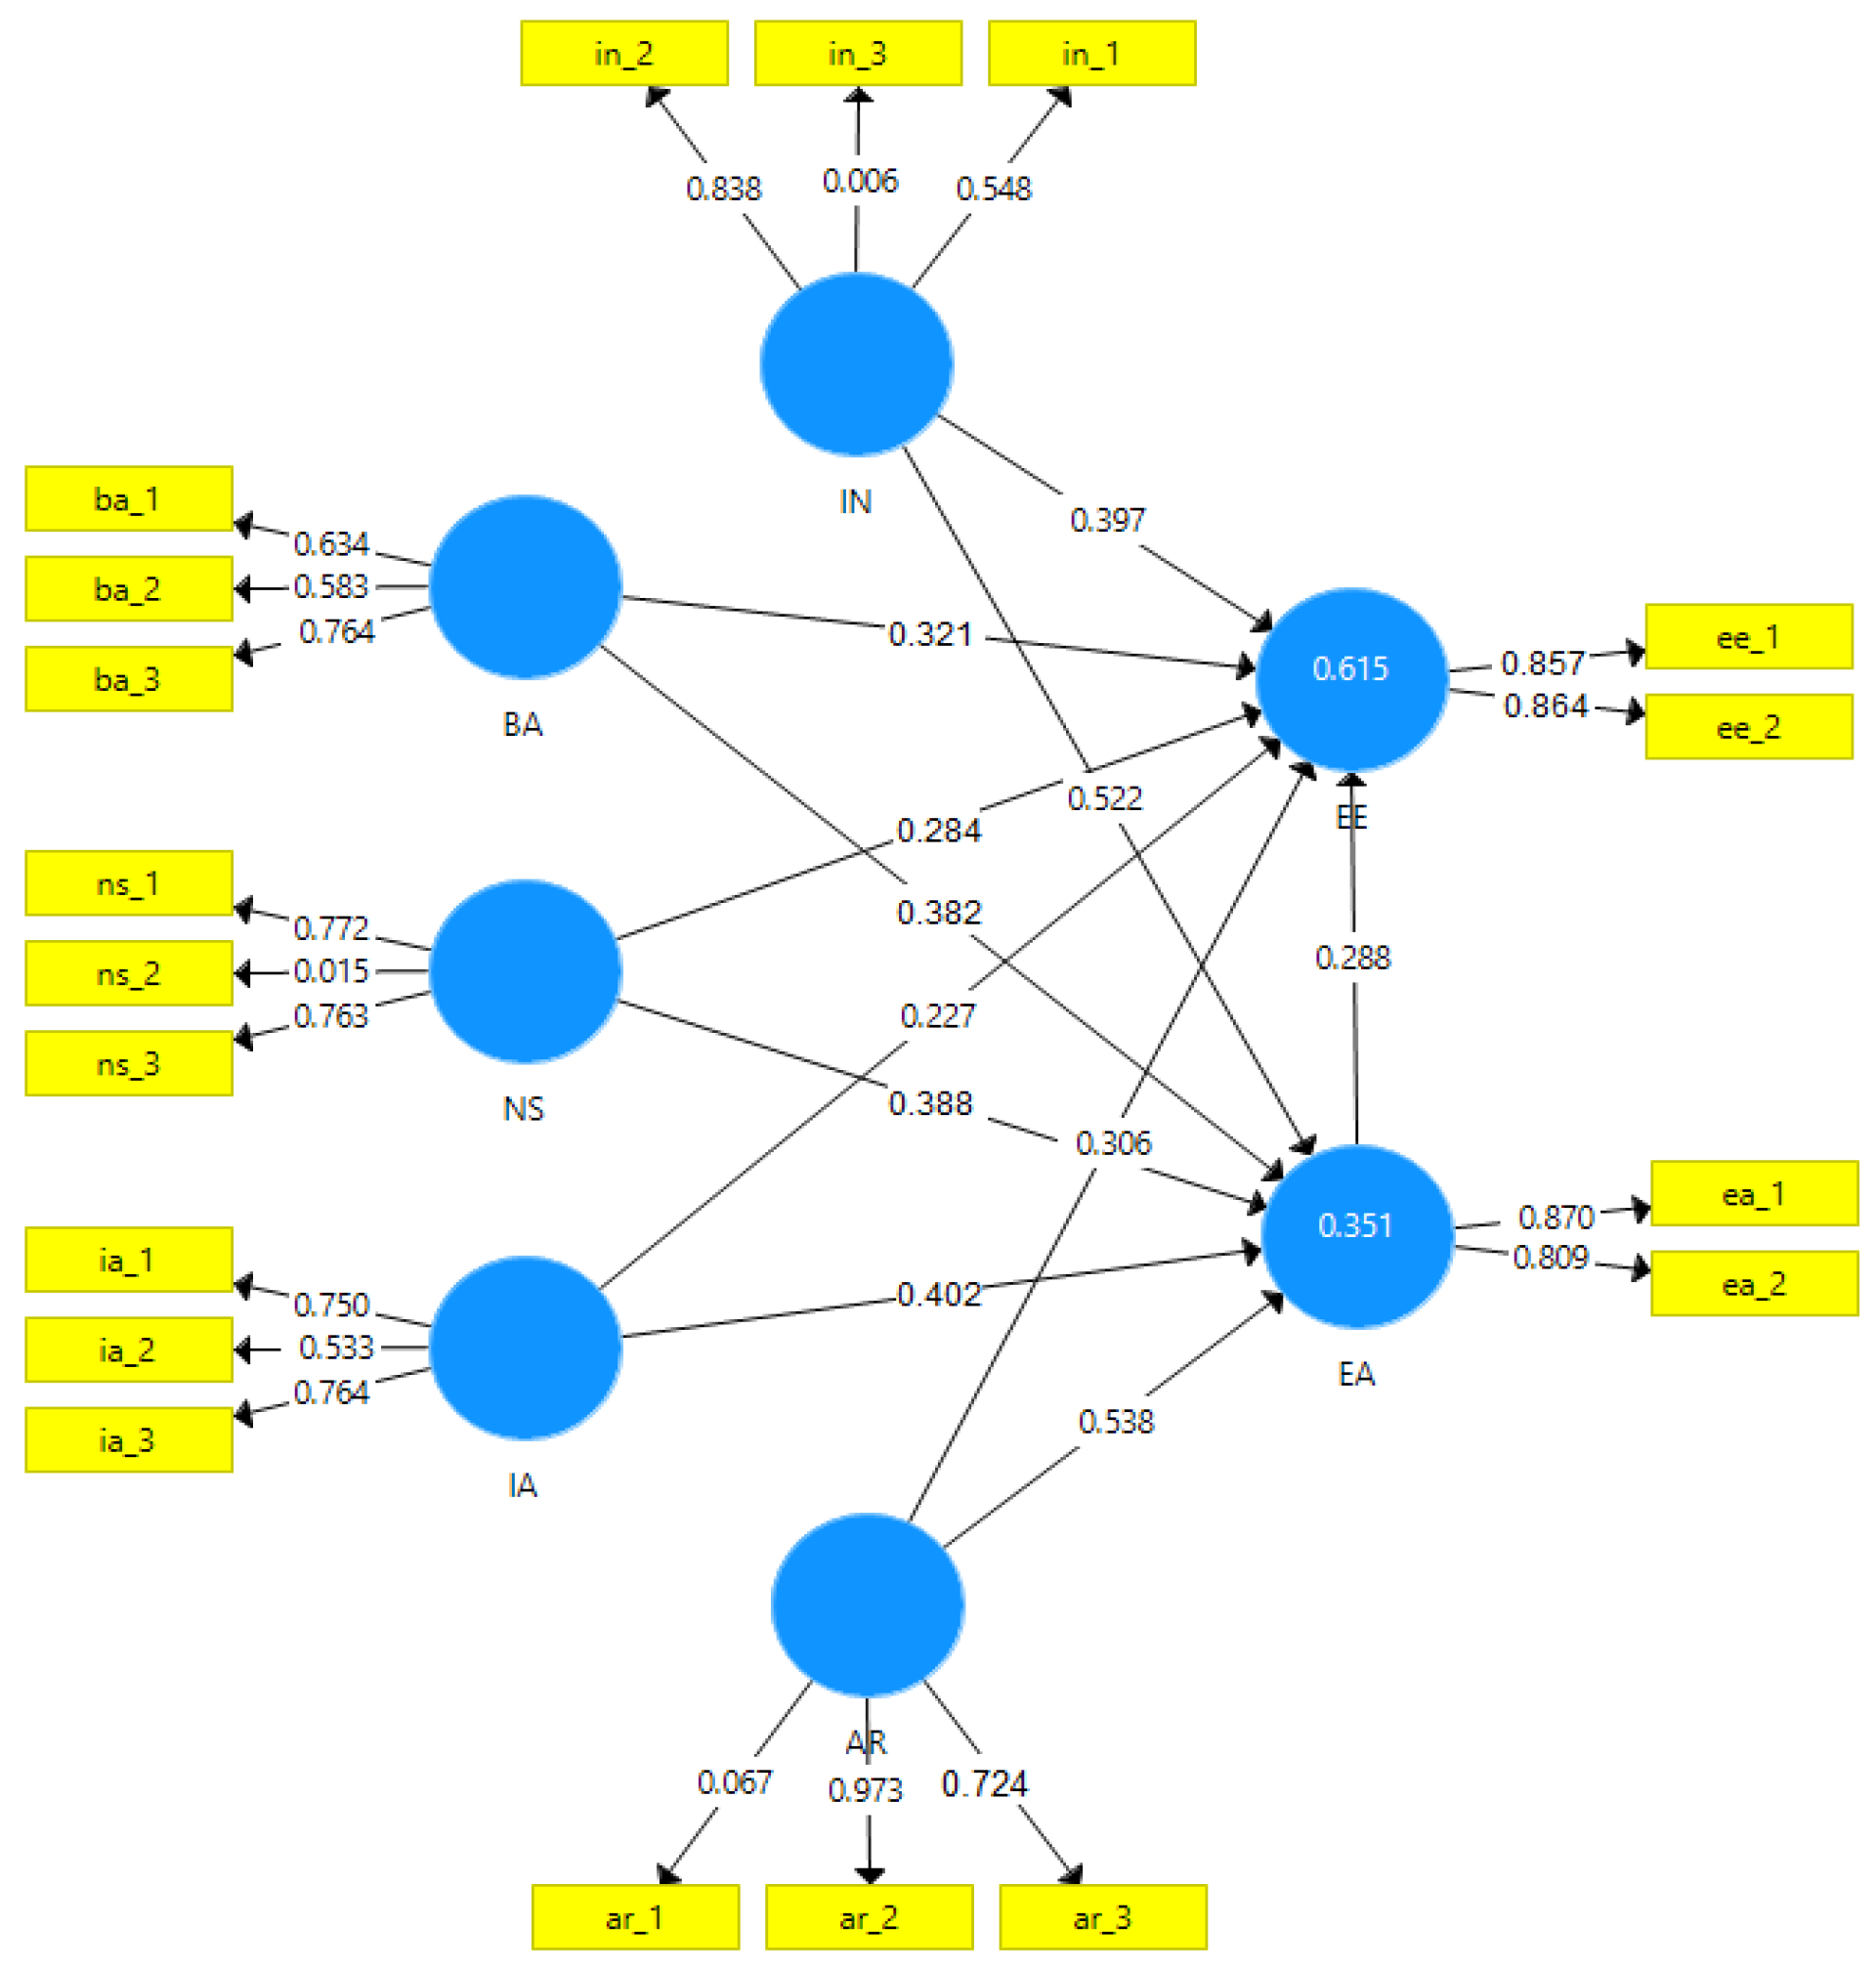
Figure 3.
PLS-SEM 2 measuring model. Source: The data analysis was carried out by the authors using SmartPLS 4.
Figure 3.
PLS-SEM 2 measuring model. Source: The data analysis was carried out by the authors using SmartPLS 4.
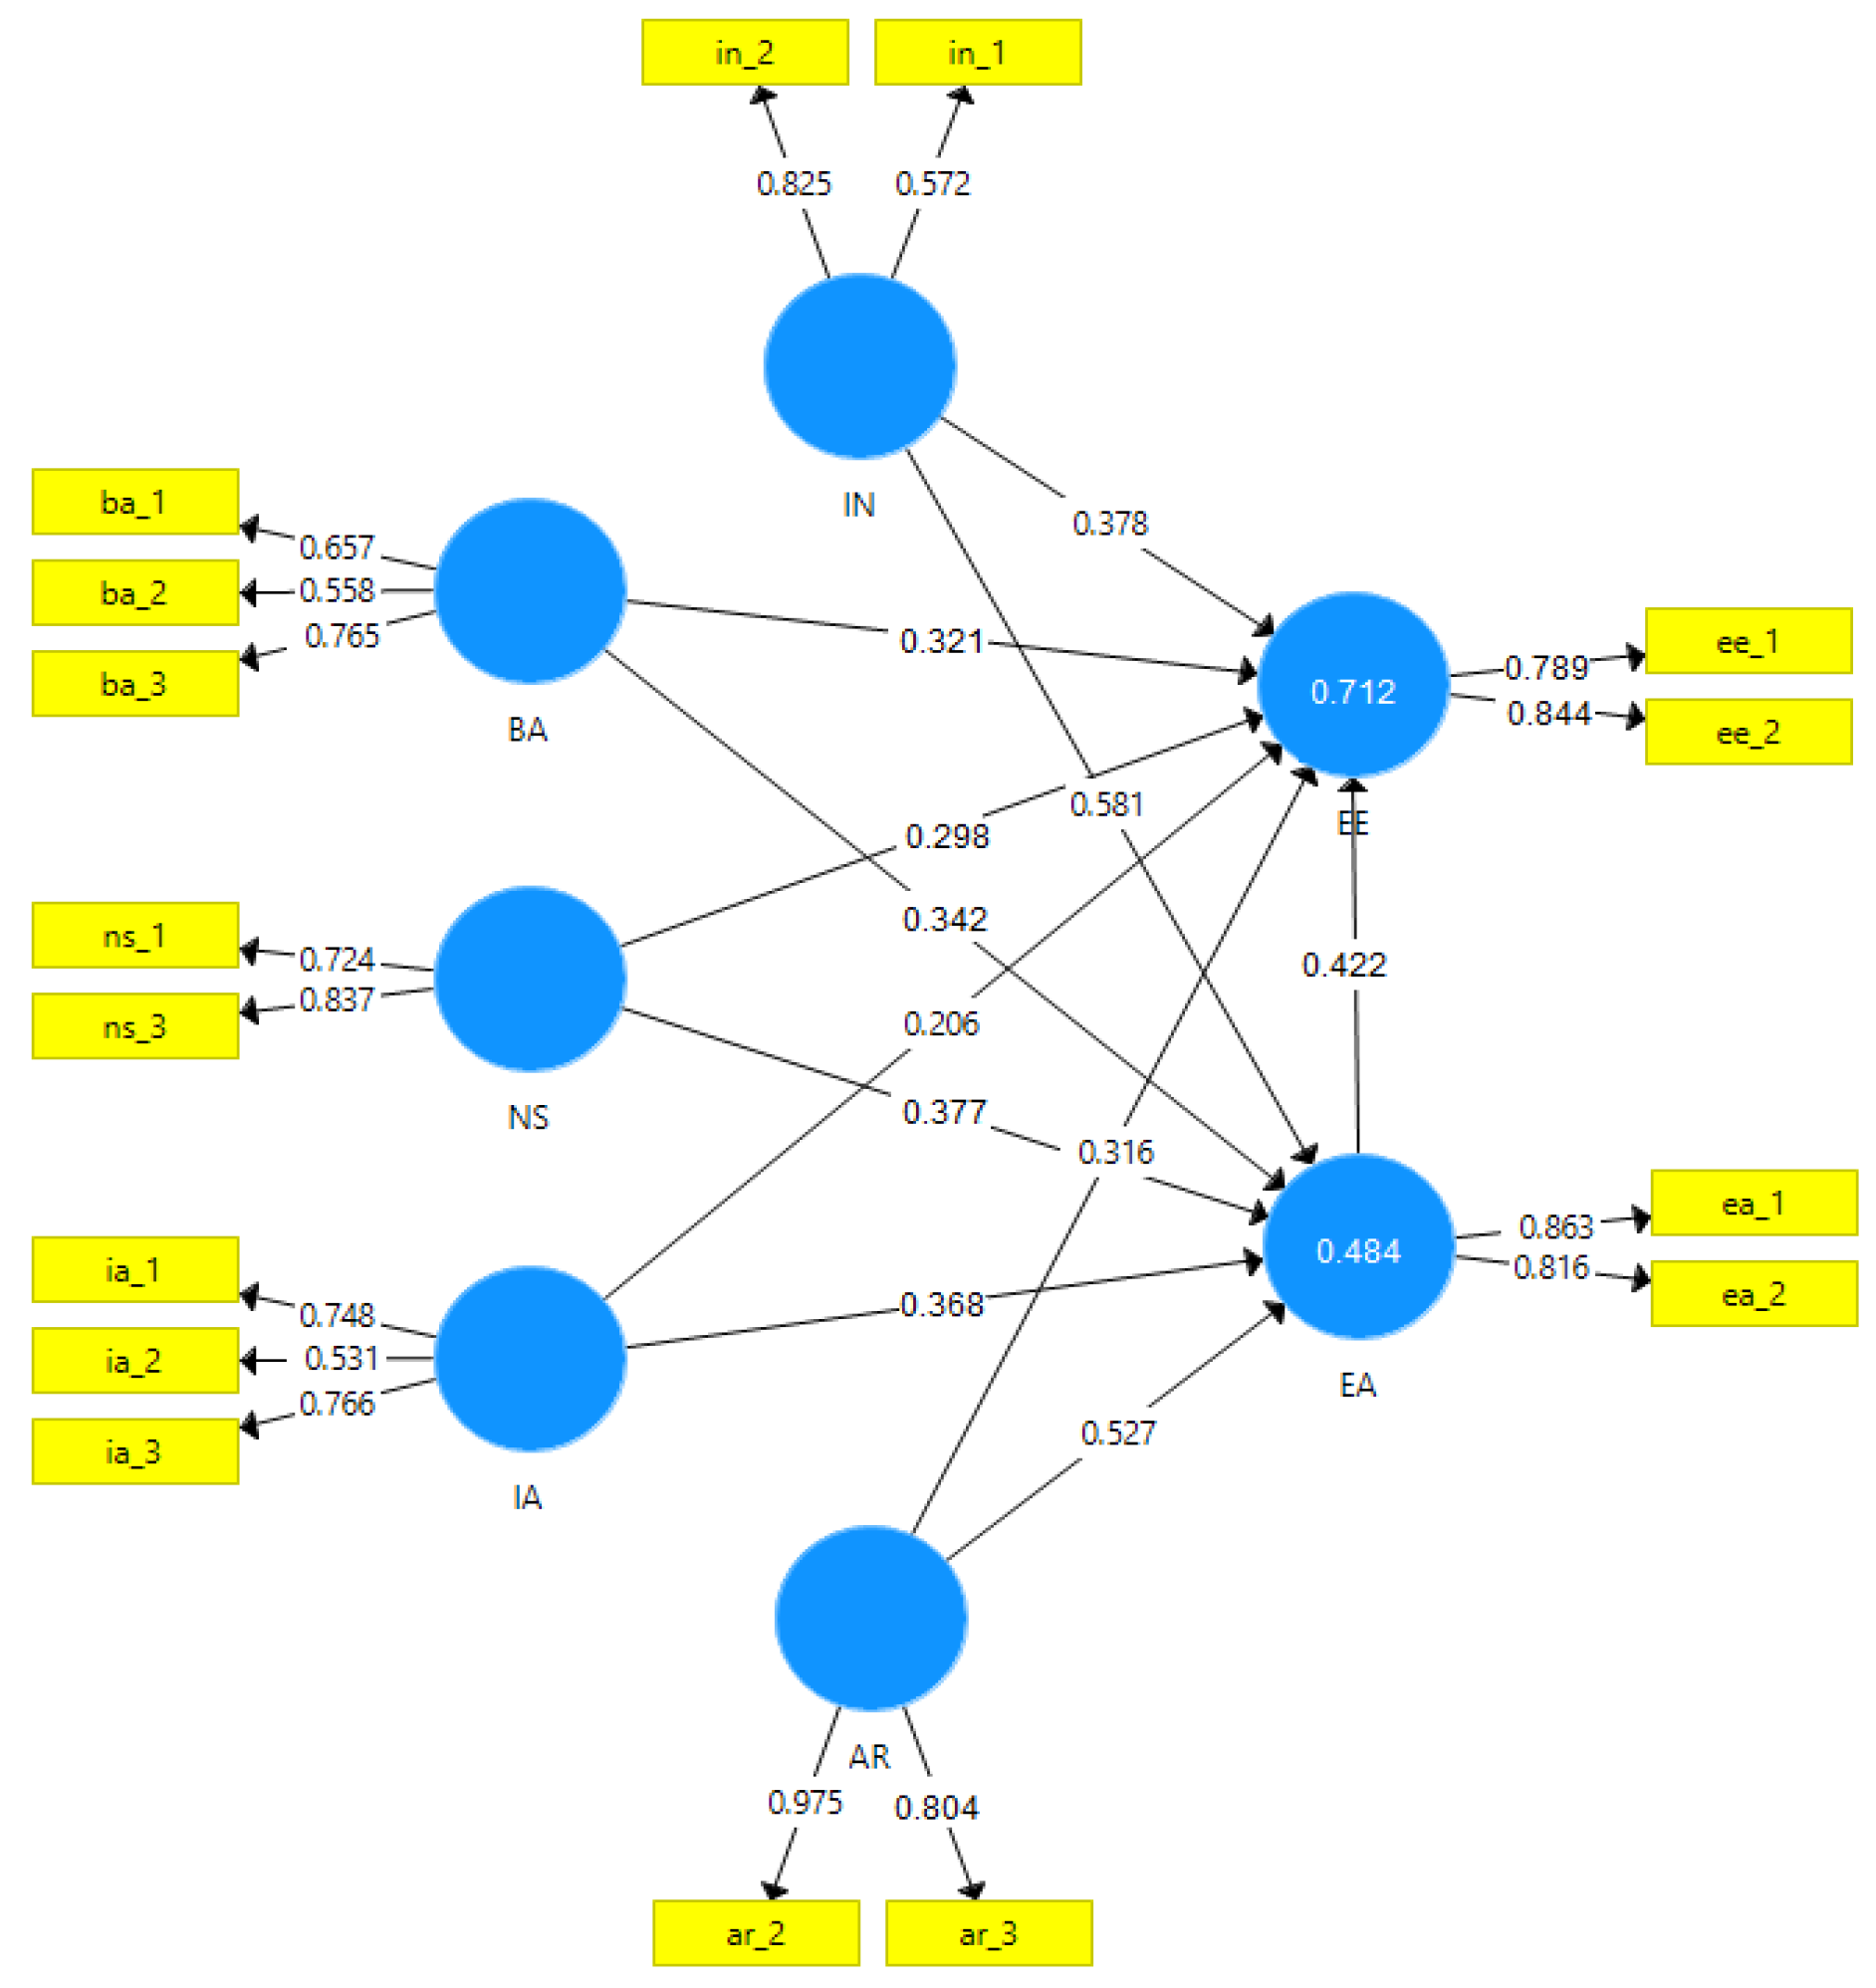
Table 1.
Distribution of respondents from the sample.
| Number of respondents | |
|---|---|
| Individual consumers | 389 |
| Consumer associations | 103 |
| Micro-enterprises | 20 |
| Total | 512 |
Table 4.
Description of the dependent variables.
| 1. Perception of Energy Saving Opportunity | |
|---|---|
| EA_1 | Final consumer’s perception of costs associated with energy bills |
| EA_2 | Perception of the benefits of saving energy |
| 2. Energy Savings | |
| EE_1 | Ability to adapt to the current context of the energy crisis |
| EE_2 | Effective response capacity through responsible behavior |
Table 5.
Evaluation of the measurement model.
| Variables | Cronbach’s Alpha | Dillon Golsteins’ rho | Composite Reliability | AVE** | VIF* |
|---|---|---|---|---|---|
| IN | 0.879 | 0.753 | 0.712 | 0.798 | 1.984 |
| BA | 0.821 | 0.785 | 0.726 | 0.829 | 1.784 |
| NS | 0.745 | 0.713 | 0.689 | 0.792 | 1.845 |
| IA | 0.729 | 0.717 | 0.613 | 0.632 | 1.754 |
| AR | 0.719 | 0.712 | 0.756 | 0.685 | 1.597 |
*VIF=Variance Inflation Factor, *AVE = Average Variance Extracted.
Table 6.
Results of testing of direct statistical assumptions (I1-I6).
| The Hypothesis | Coefficients (β) | Standard Error (SE) | t-value | F2 | Decision |
|---|---|---|---|---|---|
| I1: IN → EA | 0.581*** | 0.132 | 3.102 | 0.162* | Accepted |
| I2: BA → EA | 0.342*** | 0.088 | 3.857 | 0.324*** | Accepted |
| I3: NS → EA | 0.377*** | 0.102 | 4.078 | 0.142** | Accepted |
| I4: IA → EA | 0.368*** | 0.098 | 3.134 | 0.211** | Accepted |
| I5: AR → EA | 0.527*** | 0.167 | 3.043 | 0.388*** | Accepted |
Note: * P & L; 0.05; ** p & lt; 0.01; *** p & 0.001; β = standardized regression coefficients; SE = standard error; F2 = the size of the effect.
Table 7.
Results of testing of direct and indirect statistical assumptions (I7).
| Structural relations |
Direct effects |
Indirect effects. MV: EA | ||
|---|---|---|---|---|
| Coefficients | Low 95% | Upper 95% | ||
| IN → EE | 0.378*** | 0.210** | 0.110 | 0.310 |
| BA → EE | 0.321*** | 0.195** | 0.111 | 0.279 |
| NS → EE | 0.298*** | 0.288*** | 0.164 | 0.412 |
| IA → EE | 0.206** | 0.096* | 0.044 | 0.148 |
| AR → EE | 0.316** | 0.142** | 0.052 | 0.232 |
Note: * p < 0.05; ** p < 0.01; *** p < 0.001; MV = mediator; β = standardized regression coefficients; 95 % BCI = corrected confidence intervals.
Table 8.
VAF values with EE mediator.
| Indirect Effects with EA Mediator | The value of a | Value b | Value c | VAF value (%) |
|---|---|---|---|---|
| IN → EE | 0.581 | 0.422 | 0.378 | 55.61 % |
| BA → EE | 0.342 | 0.422 | 0.321 | 49.91 % |
| NS → EE | 0.377 | 0.422 | 0.298 | 47.61 % |
| IA→ EE | 0.368 | 0.422 | 0.206 | 38.41 % |
| AR → EE | 0.527 | 0.422 | 0.316 | 49.41 % |
Disclaimer/Publisher’s Note: The statements, opinions and data contained in all publications are solely those of the individual author(s) and contributor(s) and not of MDPI and/or the editor(s). MDPI and/or the editor(s) disclaim responsibility for any injury to people or property resulting from any ideas, methods, instructions or products referred to in the content. |
© 2024 by the authors. Licensee MDPI, Basel, Switzerland. This article is an open access article distributed under the terms and conditions of the Creative Commons Attribution (CC BY) license (https://creativecommons.org/licenses/by/4.0/).
Copyright: This open access article is published under a Creative Commons CC BY 4.0 license, which permit the free download, distribution, and reuse, provided that the author and preprint are cited in any reuse.


