
Submitted:
29 April 2023
Posted:
29 April 2023
You are already at the latest version
Abstract
A twelve-week feeding trial was conducted to investigate the effect of dietary supplementation of a functional immunostimulant mixture (FIM; nucleotides, β-glucan and vitamins C and E) on growth, feed utilization, innate immunity, digestive enzyme activity, hematological parameters, intestinal morphology and inflammatory gene expression of olive flounder, Paralichthys olivaceus. A fish meal-based basal diet (control) was formulated and three other diets were prepared by incorporating 0.5, 1.0 and 1.5% FIM into the basal diet (HB0.5, HB1.0 and HB1.5, respectively). Five replicate groups of fish (26.3 ± 0.1 g) were fed one of the experimental diets. Inclusion of 1.5% FIM in the diet significantly enhanced growth and feed utilization. Significantly higher plasma hemoglobin, hematocrit, total protein levels and lower plasma glucose level were observed in HB1.5 group. Total immunoglobulin content, lysozyme, nitroblue tetrazolium, myeloperoxidase, superoxide dismutase, glutathione peroxidase and catalase activities and immune-related gene expressions of toll-like receptor and perforin were significantly increased at highest inclusion level. FIM supplementation significantly increased villus height and goblet cell counts. Anti-inflammatory gene expression was significantly upregulated at a 1.5% level. Dietary supplementation of 1.5% of FIM could improve growth and feed utilization, immune, hematological and histomorphological parameters of olive flounder.
Keywords:
Nucleotides
; Saccharomyces cerevisiae derived β-glucan
; Vitamins C and E
; Innate-immunity
; Olive flounder
1. Introduction
Nutrition is the critical aspect that influences the productivity and profitability of the aquaculture industry. Commercial diets are formulated with the most available and cost-effective raw materials, considering their nutritional value, nutrient balance and bioavailability. The main challenge in feed formulation is fulfilling the gap between the nutrient requirement of animals and the available nutrient content in the feed. Fortification or enrichment of the diet with specific individual nutrients or blends of nutrients can fulfill the nutrient deficits while improving the growth and health performance of farm animals [1]. Moreover, when raised in high-density culture conditions, fish are highly susceptible to infectious diseases, which can cause significant economic losses for the farm. Strengthening fish immunity can reduce the risk of emerging and spreading sudden disease outbreaks during immune-deprived conditions. Dietary immunostimulants supplementation is beneficial in improving fish immune responses by enhancing the activity of immune cells such as phagocytes and lymphocytes and the production of cytokines and antibodies [2]. Naturally originated substances such as plant extracts, prebiotics and probiotics have been shown to convey promising outcomes as immunostimulants [3,4]. Numerous studies have shown that specific nutrients including amino acids, fatty acids, nucleotides, vitamins and minerals significantly boost animal immune functions [5,6].
Nucleotides are a conditionally essential nutrient in diets for fishes since they are vital in energy metabolism, DNA and RNA synthesis, encoding genetic information, physiological mediators in signal transduction and being a component of coenzymes, cellular agonists and allosteric effectors [7,8,9]. Nucleotides are synthesized in the cell using amino acids, folic acid and CO2, but this process is metabolically costly [10]. Previous studies showed that dietary supplementation of nucleotides improved the feed acceptance, growth performance, intestinal structure and immune responses in numerous fish species including olive flounder, Paralichthys olivaceus [11], Nile tilapia, Oreochromis niloticus [12], Atlantic salmon, Salmo salar [13] and common carp, Cyprinus carpio [14]. Burrells et al. [15] showed that the inclusion of nucleotide with β-glucan in the diet for rainbow trout, Oncorhynchus mykiss, reduced the cumulative mortality by approximately 18% during the bacterial challenge against Vibrio anguillarum. Therefore, exogenous nucleotide supplementation is essential when aquatic animals are in fast-growing stages or under tissue injuries and stress conditions [16].
Vitamins and provitamin sources have been studied for fish species since the early twentieth century, and they are required in trace amounts to maintain the growth and health of animals [17,18,19]. Vitamin C (L-ascorbic acid) is an essential micronutrient required for antioxidant activities, immune competence and disease resistance, stress tolerance, steroidogenesis in ovarian follicle cells, connective tissue formation, wound healing and normal physiological functions in fish [9,20]. However, external vitamin C sources are essential for teleost fish since they are unable to de novo synthesize vitamin C owing to the lack of L-gulonolactone oxidase in the vitamin C biosynthesis pathway [21]. Insufficient levels of dietary vitamin C were reported to cause deficiency symptoms in fish, such as poor growth, reduced immunity, skin hemorrhage, exophthalmia, anorexia, anemia, scoliosis, lordosis, shortened operculum and increased mortality [22,23]. In addition, vitamins C and E are hydrophilic and lipophilic antioxidants that scavenge ROS in aqueous and lipidic environments, respectively [19]. Vitamin E, α-tocopherol, is an important cell membrane component in preventing the oxidation of polyunsaturated membrane phospholipids [24]. Through the antioxidant activity of vitamin E, vitamin C reduces tocopheroxyl radical back to α-tocopherol, which is known as the synergistic effect between vitamins C and E [9,25]. Lee et al. [26] observed significantly increased weight gain (WG), health improvement and reduced liver mercury deposition with dietary selenomethionine, vitamins C and E. Vitamin E is an essential nutrient for cell membrane formation, maintaining the functional and structural integrity of cells, growth, immunity, reproduction and preventing muscle degeneration [24,27]. Vitamin E deficiency in fish can cause white muscle fiber necrosis, anemia, depigmentation, erythropoiesis and ceroid pigmentation in the liver [9].
Glucans are a group of polysaccharides derived from the cell wall materials of plants, fungi, algae and bacteria [28]. Furthermore, they are branched or unbranched polymers comprised of β (1,4) and/or β (1,3) linked glucose-monomer units [29]. Rodrigues et al. [30] reported that β-glucan administration through different routes, such as dietary supplementation, immersion in baths and injections, improved fish immune responses and stress tolerance. β-glucan triggers host immunity against several pathogen infections since it can act as a pathogen-associated molecular pattern (PAMP) [31]. The interaction between PAMP and pattern recognition receptors of monomorphonuclear phagocytes and neutrophils of the host can activate phagocytosis, microbial killing, cytokinin production and innate immune memory [32,33]. Dietary supplementation of β-glucan is known to significantly alter the gut bacterial populations and reduce the pathogen infections of Streptococcus iniae, Aeromonas salmonicida, and A. hydrophila [34,35]. Previous studies have shown that β-glucan improved feed utilization and growth in red seabream (Pagrus major) and Pacific white shrimp (Litopenaeus vannamei) [97,98]. Especially, β-gluten plays a vital role in improving innate immunity, including lysozyme, ACH50, respiratory burst activity and immune- and cytokine production-related gene expressions in fishes [35,36,37,38].
Olive flounder is the most important mariculture species in South Korea, representing approximately 50% of the country's production [39]. However, due to disease outbreaks, a wide range of antibiotics has been used to control infectious diseases, leading to drug-resistant bacteria and remnants of antibiotics in fish products and water contamination [40]. Dietary immunostimulants supplementation can be a promising strategy to minimize antibiotic usage in the industry. Further, new approaches are required to improve nutritional formulations that aim to simultaneously promote growth and health for the progress of the aquaculture industry. Therefore, the objective of this study was to evaluate the effect of dietary supplementation of a functional immunostimulant mixture (FIM), including nucleotide, β-glucan and vitamins C and E, on growth performance, feed utilization, morphometric indices, intestinal histology, hematological parameters, digestive enzyme activity, innate immunity, antioxidant capacity and inflammation-related gene expressions of olive flounder.
2. Materials and Methods
2.1. Experimental diets
The basal diet (control) was formulated with 62% sardine fish meal and 4.5% fish oil (Table 1). Another three diets were formulated by incorporating 0.5, 1.0 and 1.5% of FIM (ROVIMAX® HB Ultra; a mixture of 1.5% nucleotides, 15.5% Saccharomyces cerevisiae derived β-glucan, 10.0% vitamin C and 2.5% vitamin E) into the basal diet at the expense of wheat flour (designated as HB0.5, HB1.0 and HB1.5, respectively). All the ingredients were measured according to the formulations and thoroughly mixed after adding fish oil and 10% distilled water. Then the dough was pelleted using a pellet machine (SP-50, Kumkang Engineering, Daegu, Korea) and air-dried at 25 °C for 8 h in an electric drier (SI-2400, Shinil General Drier Co., Ltd, Daegu, Korea). Diets were kept at -20 °C until they were used. Moisture and ash contents of the diet were determined according to AOAC [41]. Crude protein was analyzed by a Kjeltec Analyzer Unit 2300 (FOSS, Hillerød, Denmark) and crude lipid was determined according to Folch et al. [42]. The experimental diets were isonitrogenous and isolipidic (56.38% crude protein and 11.70% crude lipid). The amino acid levels were analyzed by reversed-phase high-performance liquid chromatography (HPLC) according to the method described by Henderson et al. [43]. Amino acid compositions of the experimental diets are presented in Table 2. Briefly, diet samples were hydrolyzed with 6 N hydrochloric acid at 112 ºC for 24 h and derivatized. Then, separation was done using the Waters HPLC system (binary pump model 1525, autosampler model 717 Plus and UV/Vis absorbance detector model 2489, CA, USA) and amino acid levels were quantified by analyzing chromatography peaks and compared to known amino acid standards. Vitamins C and E levels of diets were analyzed by the HPLC method at Pacific Lab Service (5 Woodlands Terrace, Singapore, 738430) and the levels for control, HB0.5, HB1.0 and HB1.5 diets were 0.24, 0.40, 0.80 and 1.27 g/kg, respectively, and 0.11, 0.20, 0.30 and 0.41 g/kg, respectively.
2.2. Fish and feeding trial
The feeding trial was conducted at the Marine Science Institute of Jeju National University (Jeju, South Korea). The authors followed all applicable international, national and institutional guidelines for the care and use of animals (approval no: 2022-0028). Juvenile olive flounder were purchased from a private hatchery and transported to the institute. Experimental fish were fed a commercial diet (Suhyup feed, South Korea; crude protein, 55%; crude lipid, 12%) and acclimated to the experimental conditions and facilities for two weeks. Six hundred fish (initial mean body weight, 26.3 ± 0.1 g) were randomly stocked in 20 polyethylene cylindrical tanks (240 L), each with 30 fish. Five replicate groups (tanks) of fish were allocated to each dietary treatment and tanks were randomly assigned. All the tanks were supplied with continuously filtered seawater at a flow rate of 3 L/min in a flow-through tank system and continuously aerated with an air stone. Water temperature, pH, salinity, ammonia and dissolved oxygen levels were 21.4 ± 2.4 ºC, 8.09 ± 0.2, 31 ± 1 ppt, 0.063 ± 0.007 mg/L and 9.67±0.61 ppm, respectively. At the fourth week of the feeding trial, fish were moved to 300 L tanks under the same conditions. Fish were hand-fed one of the experimental diets twice daily (08:00 and 17:00 h) until they were apparently satiated (3-5% body weight) for 12 weeks. Uneaten feeds were collected 20 minutes after each feeding, air-dried and weighed to assess feed intake (FI). The total biomass of each tank was measured every four weeks and the feeding was terminated 24 hours before weighing.
2.3. Sample collection and analysis
Fish were counted and weighed and lengths were measured individually after the 12-week feeding trial to determine the growth performance, feed utilization, morphometric parameters and survival percentage. Before sampling, fourteen fish were randomly selected from each tank and anesthetized with 200 mg/L 2-phenoxyethanol (77699, Sigma-Aldrich. St. Louis, MO, USA). Blood samples were drawn from three fish, allowed to clot at room temperature for 30 minutes, centrifuged at 5000 ×g for 10 minutes at 4 °C in a high-speed refrigerated micro-centrifuge (Micro 17 TR: HanilBio Med Inc., Gwangju, Korea) and separated serum was stored at -80 °C. Another three blood samples were collected from three fish with heparinized syringes, centrifuged (5000 ×g, 30 min, 4 °C) to separate plasma samples and stored at -80 °C for further analysis. Five fish from each tank were kept at -20 °C for whole-body proximate composition analysis. Following blood sampling, stomach and intestine samples were collected from five remaining fish for digestive enzyme assay and samples were stored at -20 °C. Three fish were dissected under sterile conditions to collect liver samples for gene expression analysis and samples were frozen immediately in liquid nitrogen and stored in a -80 °C refrigerator. Another two intestine samples were fixed in 10% formalin fixative for histological observations.
The oxidative radical generation in phagocytes during oxidative burst was measured by the nitro-blue tetrazolium (NBT) assay following Anderson and Siwicki [44] method and myeloperoxidase (MPO) activity was evaluated following the method proposed by Quade and Roth [45]. Superoxide dismutase (SOD), catalase and glutathione peroxidase (GPx) activities were assayed using colorimetric test kits (Biovision Inc. California, USA) following the instructions supplied by the manufacturer. Plasma total immunoglobulin level and lysozyme activity were determined following Siwicki et al. [46] and Sankaran and Gurnani [47] methods, respectively. Antiprotease activity was determined following Ellis [48], with slight modifications suggested by Magnadóttir et al. [49]. An automated blood analyzer (SLIM, SEAC Inc, Florence, Italy) was used to analyze blood biochemical parameters, including hemoglobin and plasma levels of glucose, total protein, triglyceride and cholesterol.
2.4. Intestinal digestive enzyme analysis
For the digestive enzyme analysis, intestine samples were weighted and homogenized separately in distilled water (1 g of tissue in 1 mL of distilled water) using a homogenizer (Daihan Scientific Co, Ltd. Wonju, Korea). The homogenate was centrifuged at 10,000 ×g for 15 minutes at 4 °C and the supernatant was collected. Then the crude enzyme extract was stored at -20 °C until used. The BioRad assay kit (Bio-Rad Laboratories, Inc., Korea) was used to assess the total protein level of the supernatant and standard solutions were prepared using bovine serum [50]. Worthington [51] digestive enzyme analysis method was used to determine pepsin activity and 2% hemoglobin in 0.06 N HCl was reacted with crude enzyme extract as the substrate. The specific activity of pepsin was expressed as U = (Absorbance at 280 nm (supernatant)-Absorbance at 280 nm (blank) )×1000/10 min×mg protein in the assay. Trypsin activity was measured according to Erlanger et al. [52] and the used substrate was benzoyl-DL-arginine-p-nitroanilide (BAPNA, 911-77-3, Sigma -Aldrich, St. Louis, MO, USA). The absorbance at 410 nm was measured and trypsin amidase activity was presented as BAPNA unit/mg protein. Chymotrypsin activity was measured following the Erlanger et al. [52] method with slight modifications proposed by Falcón-Hidalgo et al. [53] and using 1 μM N-Succinyl-L-Ala-L-Ala-L-Pro-L-Phe-p-nitroanilide (SAPNA. 70967-97-4. Sigma-Aldrich, St. Louis, MO, USA) in 20 mM CaCl2 and 50 mM Tris-HCl buffer (pH 8.0) as the substrate. Chymotrypsin activity was expressed as SAPNA units/mg protein. Lipase activity was determined following the Borlongan [54] method, as explained in Medagoda et al. [55] and values were expressed as 0.01 N NaOH volume required to neutralize the fatty acid released due to the hydrolysis of triglycerides in the stabilized standard olive oil emulsion (1.5 mL) by 1 mL of crude enzyme extract. Amylase activity was measured following the method proposed by Worthington [51]. Briefly, 0.5 ml of enzyme extract was mixed with 0.5 ml of 1% starch solution in 20 nM sodium phosphate buffer (pH 6.9) containing 6.0 nM NaCl and the mixture was incubated at 37 °C for 3 minutes. The released maltose was reacted with 0.5 mL dinitro salicylic acid (609-99-4. Sigma-Aldrch, St. Louis, MO, USA) and incubated for 5 minutes in a boiling water bath. The absorbance was measured at 540 nm and the amount of maltose released during 3 min incubation was evaluated using a standard. Amylase activity was estimated as: μmol maltose released/mg enzyme in reaction mixture × 3 min.
2.5. Quantitative real-time PCR (qRT-PCR) for relative gene expression analysis
Approximately 80 mg (50-100 mg) of liver tissue samples were used to extract total RNA. The tissue samples were homogenized in Trizol reagent (T9424. Sigma-Aldrich, St. Louis, MO, USA) and total RNA was isolated. RNA purity and concentration were measured at 260 nm using a NanoDrop spectrophotometer (Thermo Scientific, USA). For the complementary DNA synthesis, a 2.5 μg RNA was reverse transcribed using a Prime Script first-strand cDNA synthesis kit (Takara Shiga, Japan). Quantitative real-time PCR (RT-qPCR) (Takara, Shiga, Japan) was used to analyze gene expression and the 18S rRNA gene was used as the housekeeping gene. The primer sequence for the growth, innate immune and inflammation-related genes (insulin-like growth factor-1, IGF-1; insulin-like growth factor-binding protein, IGF-BP; toll-like receptor-3, TLR-3; Perforin; interleukin-6, IL-6; tumor necrosis factor- α, TNF-α; and transforming growth factor- β, TGF-β) were designed based on the published olive flounder cDNA sequences in the GenBank genetic sequence database (Table 9). The real-time PCR program was performed one cycle at 95 °C for 10 min, followed by 40 cycles at 95 °C for 15 s (denaturation), at 60 °C for 30 s (annealing), and at 72 °C for 20 s (extension). The relative expression ratios of immune-related genes were calculated according to Pfaffl [56].
Ratio = [(ESample)ΔCt(control-sample)]/[(E18S)ΔCt(control-sample)]
2.6. Histological observations
The intestinal sections were dehydrated in graduated ethanol concentrations and embedded in paraffin. Then, the embedded intestine fractions were sectioned with a rotary microtome (Leica RM2235, Leica Biosystems, USA) at 5 μm thickness and microscopic slides were prepared. Slides were stained with Alcian blue (AB, pH 2.5), periodic acid and Schiff reagents (PAS). Then, they were examined under a light microscope (Leica DM750. Leica microsystems, Switzerland) containing a digital camera (Leica ICC50 E. Leica microsystems, Korea). Villus heights were measured using an image analyzing software (×10, Leica Application Suite, version 4.13.0, Switzerland) and the mucus-secreting goblet cells were counted under the ×40 magnification of the microscope.
2.7. Statistical analysis
All the experimental groups were subjected to a complete randomized design. The data were analyzed using one-way ANOVA in SPSS (version 24.0, International Business Machines Co., Armonk, NY, USA ) statistical program. When ANOVA detected differences between groups, the differences in mean values were compared using Tukey’s HSD multiple comparison test (P < 0.05). Data were presented as mean ± standard deviation.
3. Results
During the 12-week feeding trial, fish readily accepted all the experimental diets. Fish fed HB1.5 diet showed significantly higher (P < 0.05) final body weight (FBW), WG and specific growth rate (SGR) than fish fed the control and HB0.5 diets (Table 3). Growth-related gene expressions of the fish were significantly upregulated (P < 0.05) with dietary supplementation of FIM. Compared to the fish fed the control and HB0.5 diets, the relative expression of IGF-1 was significantly upregulated (P < 0.05) in fish fed HB1.0 and HB1.5 diets. Moreover, significantly upregulated (P < 0.05) IGF-BP gene expressions were observed in HB1.0 and HB1.5 groups than in the control group. Feed conversion ratio (FCR) was significantly lower (P < 0.05) in HB1.5 group compared to the control group, but other feed utilization parameters, FI, and protein efficiency ratio (PER) were not significantly affected (P > 0.05) by FIM. Survival and morphometric parameters including condition factor (CF), hepatosomatic index (HSI) and viscerosomatic index (VSI) showed no significant differences (P > 0.05) among the dietary treatments.
Blood hemoglobin hematocrit and plasma total protein levels were significantly increased (P < 0.05) in the fish fed HB1.5 diet than in those fed the control diet (Table 4). Blood glucose level was significantly reduced (P < 0.05) in HB1.5 group compared to the control and HB0.5 groups. Plasma triglyceride and cholesterol levels were not affected (P > 0.05) by FIM. The dietary supplementation of the FIM significantly improved (P < 0.05) almost all the immune parameters and antioxidant enzyme activities (Table 5). Fish fed HB1.0 and HB1.5 showed significantly higher (P < 0.05) lysozyme activity than the control diet. Total immunoglobulin level of the fish was significantly higher (P < 0.05) in HB1.5 group than in the control and HB0.5 groups. However, antiprotease activity showed no significant differences (P > 0.05) among dietary groups. HB1.5 group showed a significantly higher (P < 0.05) NBT activity than the control. MPO activity was significantly improved (P < 0.05) in the fish of HB groups. SOD and catalase activities were significantly increased (P < 0.05) with 1.5% FIM inclusion into the control diet. The fish fed HB1.0 and HB1.5 diets showed significantly higher (P < 0.05) GPx activity than those fed the control and HB0.5 diets and HB0.5 group showed significantly increased GPx activity compared to the control group. Moreover, the dietary supplementation of the FIM at 1.5% in the control diet significantly upregulated (P < 0.05) TLR-3 and perforin gene expressions.
The anti-inflammatory gene expression of TGF-β was significantly increased (P < 0.05) with FIM supplementation at 1.5% (Figure 1). Pro-inflammatory gene expressions of IL-6 and TNF-α were not significantly affected (P > 0.05) but tended to be down-regulated with increasing dietary FIM supplementation levels.
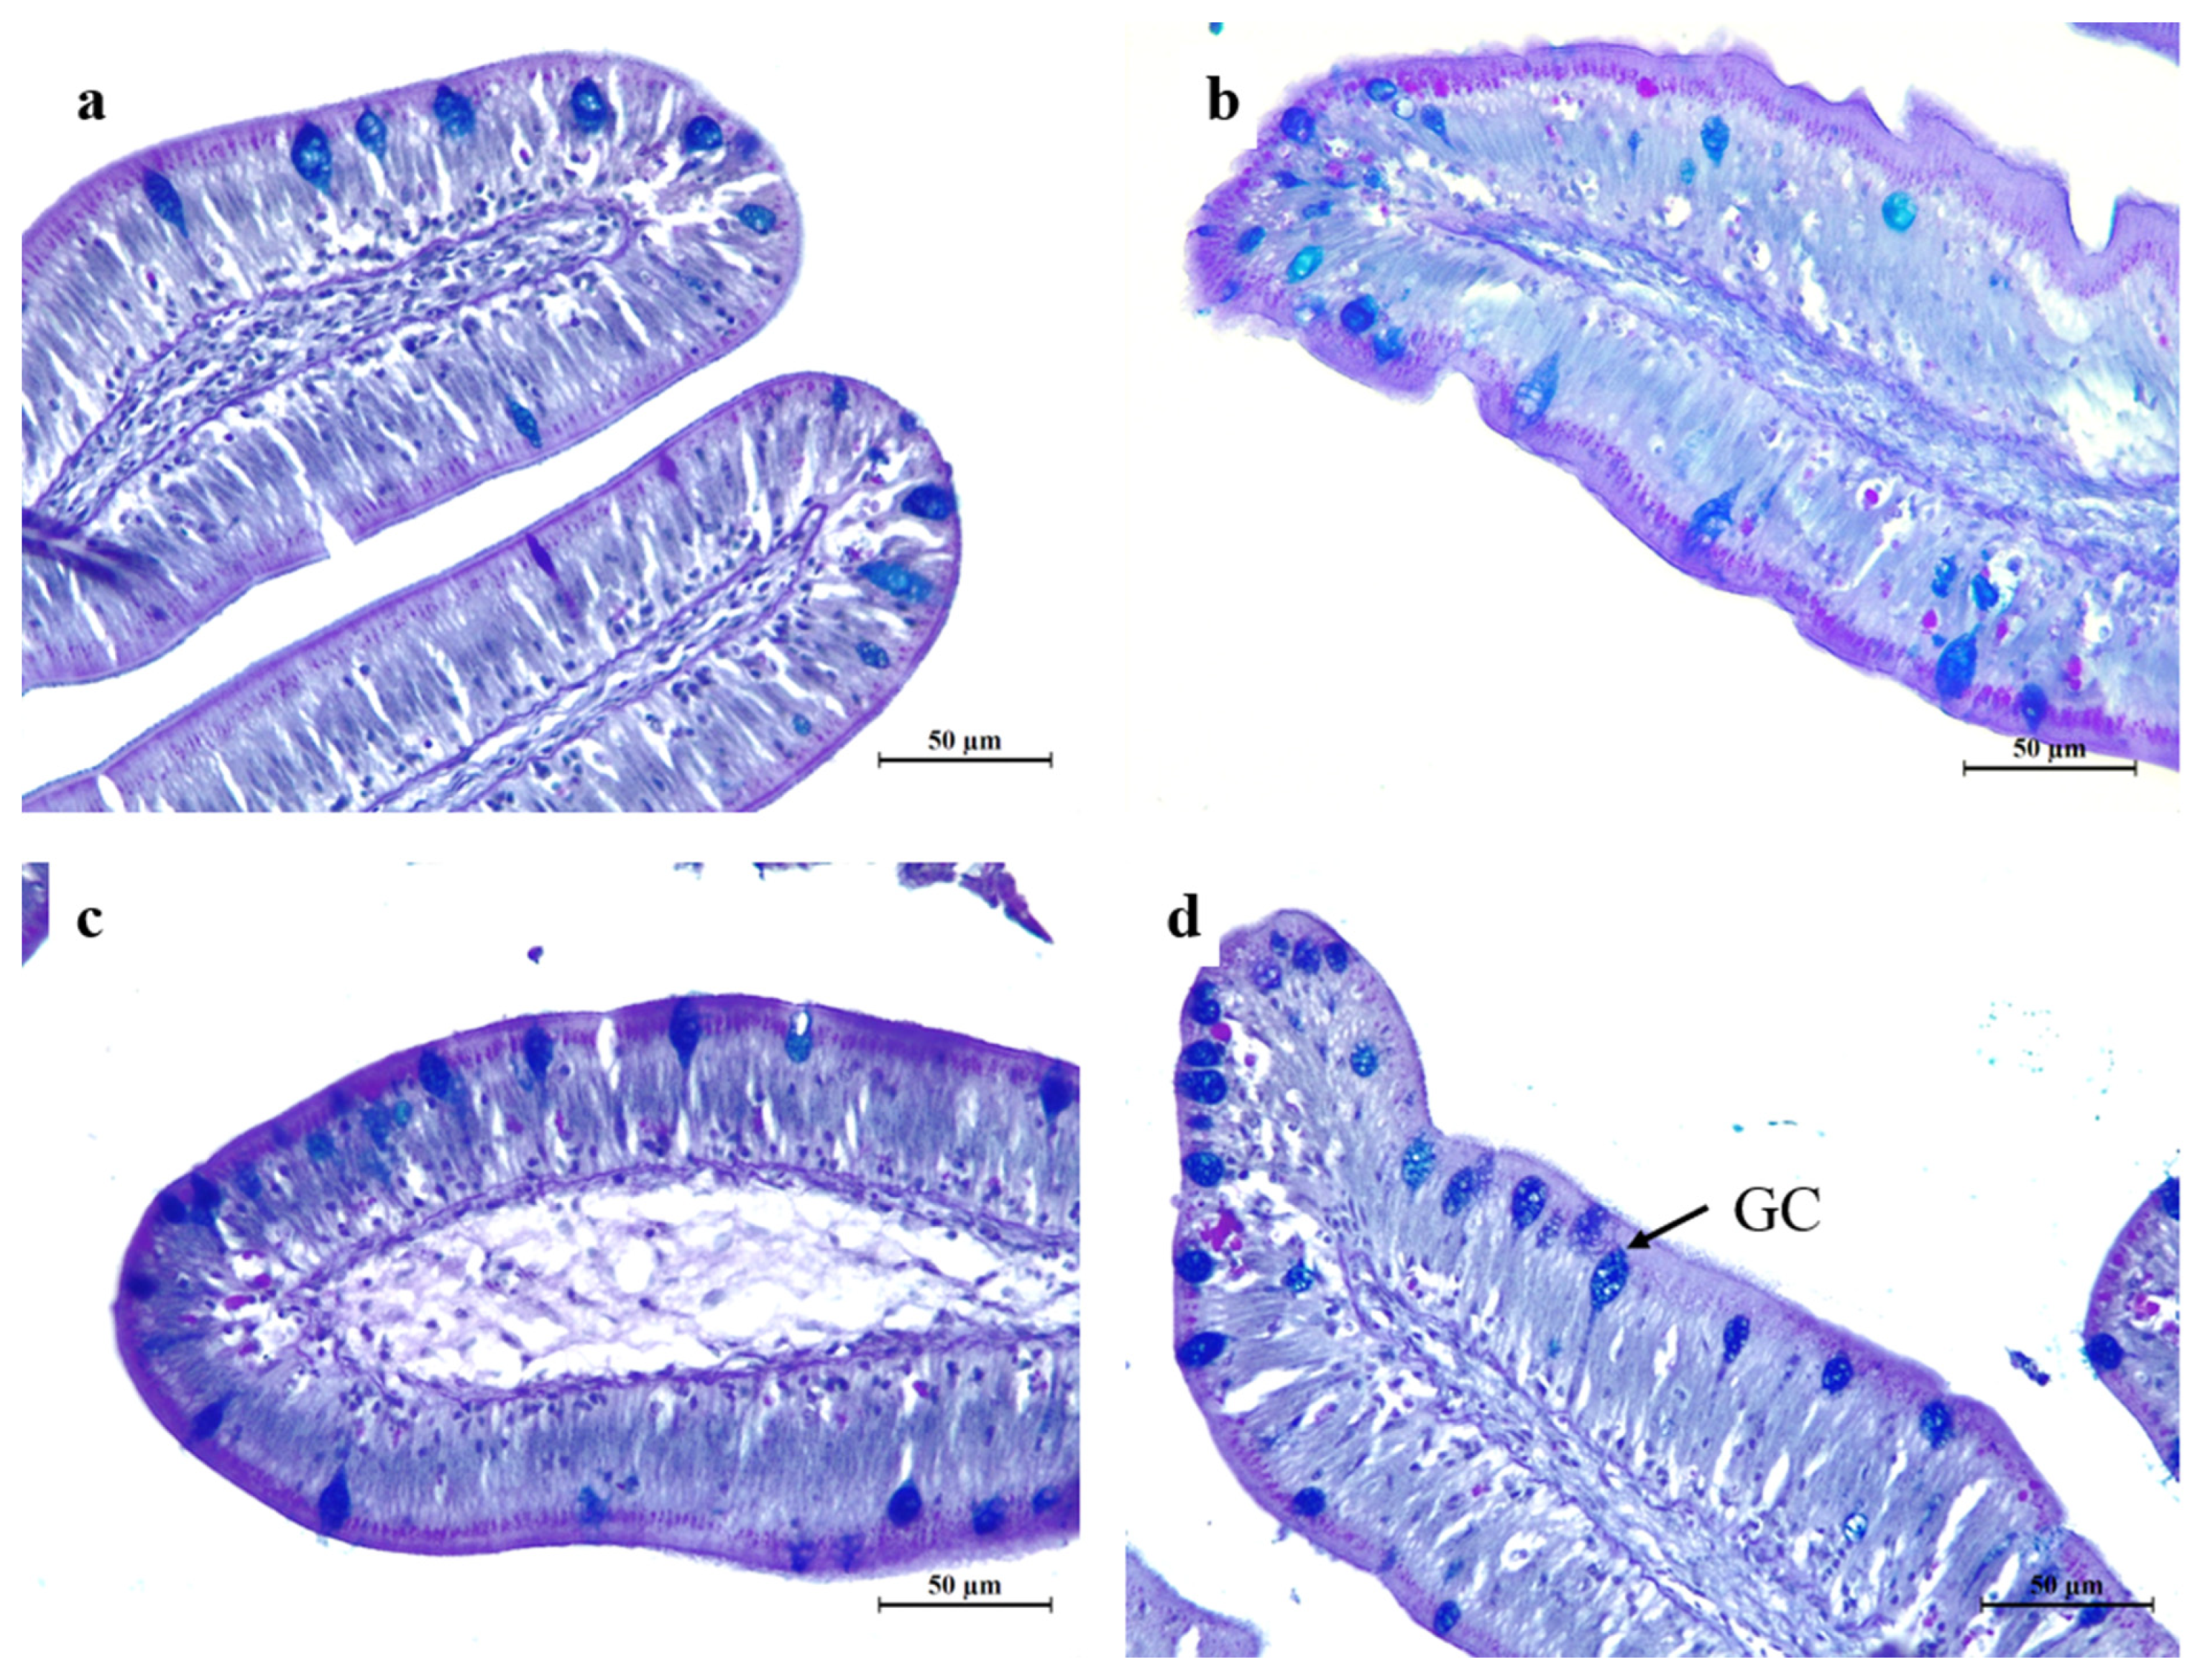
Digestive enzyme activities are presented in Table 6. Amylase activity was significantly enhanced (P < 0.05) at 1.0 or 1.5% of FIM inclusion levels. However, lipase, pepsin, trypsin and chymotrypsin activities were not significantly affected (P > 0.05). Whole-body compositions of moisture, crude protein, crude lipid and ash were not significantly affected (P > 0.05) with dietary FIM supplementation (Table 7). Fish fed HB1.0 and HB1.5 diets showed significantly increased (P < 0.05) villus height compared to fish fed the control and HB0.5 diets (Table 8). The goblet cell counts were significantly higher (P < 0.05) in fish fed HB1.0 and HB1.5 diets than those fed the control diet. Representative histology images of intestinal villus heights and goblet cell distribution are shown in Figure 2 and Figure 3.
4. Discussion
The dietary FIM for juvenile olive flounder showed increased growth, feed utilization and growth-related gene expression. Chuchird et al. [6] observed increased growth and feed efficiency in Pacific white shrimp fed the same FIM mixture-containing diet. Hossain et al. [57] reported that exogenous nucleotide supplementation promoted the growth of red seabream and Borda et al. [58] suggested that increased growth could be attributed to cell proliferation stimulating ability of nucleotides. In our previous study, the inclusion of 0.1-0.4% inosine monophosphate in a fish meal-based diet enhanced the growth and health of olive flounder [11]. Dietary nucleotide supplementation has shown enhanced growth in turbot (Scophthalmus maximus), Nile tilapia, and rainbow trout [59,60,61]. Metailler et al. [59] reported that the growth performances of turbot larvae were significantly increased with 0.77% nucleotide supplementation in diet assuming that this could be attributed to improved FI with increased diet palatability. Moreover, exogenous nucleotide supplementation can save metabolic energy costs, which could beneficially affect fish growth and health [10]. However, Li et al. [62] showed that the effect of dietary nucleotide supplementation on the growth of sub-adult or adult fish was limited compared to larval stages. Corresponding to the present study, Asaduzzaman et al. [12] found that dietary supplementation of 0.2-0.4% inosine monophosphate significantly upregulated the IGF-1 and IGF-2 gene expressions in Nile tilapia. IGF-1 and IGF-BP genes play a vital role in cell growth by enhancing glucose and alanine uptake, myoblast proliferation and DNA, protein, and glycogen synthesis [63,64]. Therefore, enhanced growth-related gene expressions with dietary FIM supplementation might have influenced the growth performance in this study. Dietary FIM improved feed conversion, which might correlate with improved intestinal morphology. Previous studies demonstrated that dietary nucleotides and β-glucan increased villus heights and absorptive surface area, suppressed intestinal damage and promoted beneficial bifidobacterial colonization in many fishes including Atlantic salmon [13], European sea bass (Dicentrarchus labrax L) [65], turbot [66] and red seabream [58]. Bueno et al. [67] showed that exogenous nucleotide supplementation improved intestinal ultrastructure compared to natural nucleotide synthesis. Therefore, improved intestinal morphology of olive flounder may have beneficially affected the feed utilization and nutrient uptake.
The FIM supplementation in the diet significantly affected hematological parameters including hemoglobin, hematocrit, total protein and glucose level of the fish. Cao et al. [68] observed that dietary β-glucan incorporation significantly reduces the blood glucose level by downregulating the gene expression of sodium-glucose transporter-1 in the intestinal mucosa. Hematocrit and hemoglobin concentrations were significantly increased with the increasing FIM level. Tahmasebi-Kohyani et al. [61] observed that dietary nucleotide supplementation increased hemoglobin, hematocrit and red and white blood cell counts. They suggested this may be due to an increased iron absorption with nucleotide supplementation. Further, they observed increased blood albumin and globulin levels with dietary nucleotide supplementation. Garcia et al. [69] observed an erythrocyte-protecting effect through dietary vitamins C and E supplementations. Vitamins C and E contained in FIM might have increased the erythrocyte proliferation to obtain the above observations. Thereby it could promote efficient oxygen transportation in the body.
Lysozyme and antiprotease activities are vital in destroying bacteria by cell wall lysis and inhibiting bacterial proteases by trapping the enzymes or attaching to their binding sites. Notably, these enzyme activities were increased with dietary FIM supplementation in this study. Carver et al. [70] and Gil [71] showed that dietary nucleotide supplementation influences macrophage and natural killer cell activation, enhancing lysozyme activity. Song et al. [11] observed that 0.2-0.4% inosine monophosphate supplementation significantly improved the lysozyme activity and disease resistance of olive flounder against S. iniae. Moreover, dietary nucleotide supplementation significantly affected immunoglobulin production by increasing lymphocyte production in fish [72,73]. Supporting the above findings, Leonardi et al. [74] observed that supplementation of nucleotides in Atlantic salmon diet showed significantly improved antibody production. An oral administration of β-glucan dramatically increased immunoglobulin in fish by binding to the β-glucan receptors of macrophages, leukocytes, neutrophils and NK cells [75,76]. Rodrigues et al. [30] reported that the binding of β-glucan to relevant receptors acting as a PAMP stimulates all the immune activities including phagocytosis and the production of interferon, cytokine and immunoglobulin. Therefore, the increased immunoglobulin content in the present study might be partially attributed to the β-glucan contained in the FIM mixture.
Respiratory burst activity, antioxidative activity and immune parameters were significantly improved with the graded levels of FIM supplementation. Nitroblue tetrazolium activity measures the intercellular superoxide concentration and the MPO enzyme converts hydrogen peroxide into hypochlorous acid in phagocytes during phagocytosis [77,78]. Dietary nucleotide supplementation improved phagocytic activities in fishes, including olive flounder and rainbow trout [11,71,79]. Carver et al. [70] reported that nucleotide supplementation in rats significantly increased the natural killer cell activation and macrophage activity. In a systematic review, Dawood and Kohio [23] stated that vitamins C and E supplementation in the fish diet has beneficial effects on respiratory burst, phagocytic, lysozyme, and complement activities. However, the underlying mechanism for increasing respiratory burst activity by dietary supplementation of nucleotides, β-glucan and vitamins C and E, or combined effect, remains to be revealed.
In this study, the antioxidant activity in olive flounder was significantly increased. Similarly, Tie et al. [80] observed upregulated Nrf2 gene expression, which is crucial in initiating the antioxidant enzyme gene expression in grass carp, Ctenopharyngodon Idella. They suggested that an increased nutrient availability with dietary nucleotide supplementation might have upregulated those gene expressions. Increased serum SOD, GPx and catalase activities were reported in red seabream, turbot and Nile tilapia when fed diets enriched with nucleotide over 0.15% [57,67,81]. Supplementation of β-glucan in the diet also improved antioxidant enzyme activities in immune-suppressed tilapia exposed to atrazine herbicides [82].
TLR is a PAMP-recognizing protein encoded by the TLR-3 gene, and it mediates cytokine production and activates inflammatory responses [83]. Several studies have found that dietary supplementation of β-glucan or bacterial cell wall components (peptidoglycan and lipopolysaccharides) increases TLR-3 gene expression, emphasizing the importance of incorporating these compounds in fish feeds as a prophylactic method [84,85]. Therefore, dietary β-glucan supplementation might have significantly increased the TLR-3 gene expression in this study. Perforin is a cytosolic protein present in T-lymphocytes and natural killer cells and it involves membrane pore-formation triggering calcium influx and initiating the cell death of targeted infected or damaged cells [86]. Therefore, upregulation of perforin gene expression may be beneficial to renew the intestinal epithelium and protect olive flounder from pathogenic or parasitic infections.
According to Table 6, digestibility enzyme activities in the gut were increased with dietary FIM supplementation for olive flounder, even so, only the amylase activity showed a significant improvement. Hunt et al. [87] observed significantly increased digestive enzyme activities in rainbow trout fed with a yeast-based nucleotide-incorporated diet, including pepsin, trypsin and lipase activities. They suggested that improved intestinal structure and increased surface area and villi density might have increased the digestive enzyme activities through dietary nucleotide supplementations. Bueno et al. [67] showed that 0.25% dietary nucleotide supplementation significantly developed cellular ultrastructure and intestinal morphological characteristics in weaned rats. A similar mechanism might have led to enhancing the digestive enzyme activities in this study, but the exact influence of nucleotides, β-glucan and vitamins C and E supplementation on the digestive enzyme activity is yet to be revealed. Dietary β-glucan supplementation increases the gut digestive enzyme-secreting bacterial population by regulating the chyme viscosity [88]. However, information on the digestive enzyme production of bacteria in the intestine and their biological significance is limited.
Previous studies have shown that dietary β-glucan increases short-chain fatty acid assimilation by increasing bifidobacterial populations, Lactobacilli and Akkermansia spp and alleviating colonization of detrimental bacterial species in the intestine. Furthermore, these beneficial bacteria species increase acetate, propionate and butyrate fatty acid production by the fermentation of non-digestible oligosaccharides including β-glucans [89,90]. However, Medagoda and Lee [91] showed body fatty acid profile correlate with the dietary fatty acid profile. Thus, the increased whole-body lipid content might have been due to the β-glucan contained in the FIM in the present study.
Nucleotide supplementation was reported to improve the intestinal structure including increased villus height, lateral branching of the villus, mucosal height, gut wall thickness and enterocyte and microvillus height in fishes [12,66,92,93]. Bueno et al. [67] revealed that nucleotides develop and recover the intestinal structure after the lactose-induced chronic diarrhea condition in rats suggesting that exogenous nucleotide supplementation spares the cost of metabolic energy in DNA and RNA synthesis in regenerating tissues. Hess and Greenberg [94] reported that exogenous nucleotide supplementation is essential for intestinal tissue development since nucleotide demand is high in rapidly regenerating tissues. In addition, previous studies have shown that dietary nucleotide and β-glucan supplementation significantly increased the growth of gut health improving beneficial microflora and stimulating mucus secretion from goblet cells [58,95,96]. Accordingly, the enrichment of nucleotide in the diet might have improved intestinal morphology.
In conclusion, the enrichment of nucleotides, Saccharomyces cerevisiae derived β-glucan and vitamins C and E as an FIM in the diet for olive flounder significantly increased the growth by improving feed efficiency, intestinal morphology and growth-related gene expression. Additionally, fish health was promoted by increasing the innate immune parameters, phagocytic activity and antioxidant capacity and upregulating anti-inflammation and immune-related gene expressions. In the present study, the highest two inclusion levels (1-1.5%) showed significantly higher growth and health performance. However, further investigations should design to determine the effect of even higher levels of the FIM (> 1.5%) in the diet of olive flounder and the interactive effect of different nutrient combinations focusing on disease resistance and diet digestibility.

Table 1.
Formulation and proximate compositions of the experimental diets for juvenile olive flounder, Paralichthys olivaceus.
Table 1.
Formulation and proximate compositions of the experimental diets for juvenile olive flounder, Paralichthys olivaceus.
| Ingredients (%, DM basis) | control | HB0.5 | HB1.0 | HB1.5 |
| Fish meal, Sardine1 | 62.00 | 62.00 | 62.00 | 62.00 |
| Functional immunostimulant mixture2 | - | 0.50 | 1.00 | 1.50 |
| Wheat flour3 | 11.90 | 11.40 | 10.90 | 10.40 |
| Starch | 6.00 | 6.00 | 6.00 | 6.00 |
| Tankage meal | 3.50 | 3.50 | 3.50 | 3.50 |
| Soybean meal | 5.00 | 5.00 | 5.00 | 5.00 |
| Corn gluten | 3.00 | 3.00 | 3.00 | 3.00 |
| Wheat gluten | 2.00 | 2.00 | 2.00 | 2.00 |
| Fish oil4 | 4.50 | 4.50 | 4.50 | 4.50 |
| Monocalcium phosphate | 0.50 | 0.50 | 0.50 | 0.50 |
| Lecithin5 | 0.50 | 0.50 | 0.50 | 0.50 |
| Choline chloride | 0.10 | 0.10 | 0.10 | 0.10 |
| Mineral Mix6 | 0.50 | 0.50 | 0.50 | 0.50 |
| Vitamin Mix7 | 0.50 | 0.50 | 0.50 | 0.50 |
| Proximate composition (%) | ||||
| Crude protein | 55.79 | 56.20 | 56.65 | 56.90 |
| Crude lipid | 11.36 | 11.86 | 11.61 | 11.99 |
| Ash | 11.76 | 11.78 | 11.92 | 12.04 |
| L-ascorbic acid (g/kg) | 0.24 | 0.40 | 0.80 | 1.27 |
| DL- tocopheryl acetate (g/kg) | 0.11 | 0.20 | 0.30 | 0.41 |
1Orizon S.A., Corp., Santiago, Chile. 2Rovimax® HB Ultra- (1.5% nucleotides, 15.5% Saccharomyces cerevisiae derived β-glucan, 10.0% vitamin C and 2.5% vitamin E); DSM Nutritional Products Ltd., Bangkok 10310, Thailand. 3 Deahan Flour Co. Ltd., Incheon, Korea. 4E-wha oil & fat Industry Corp., Busan, Korea. 5LysoforteTM Dry, Kemin Korea Co. Ltd., Seongnam, Korea. 6Mineral premix (g/kg mixture) C4H2FeO4,12.5; MnSO4.H2O, 11.25; FeSO4, 20; CuSO4, 1.25; CoSO4,0.75; ZnSO4.7H2O, 13.75; Ca(IO3)2, 0.75; MgSO4.7H2O, 80.2; Al(OH)3, 0.75. 7Vitamin premix (g/kg of mixture) Retinyl acetate, 1.5; Cholecalciferol, 0.025; DL- tocopheryl acetate, 37.5; Menadione sodium bisulfite, 2.5; Thiamine nitrate, 5; Riboflavin, 10; Pyridoxine hydrochloride, 5; Cyanocobalamin, 0.025; Nicotinic acid, 37.5; Ca-D-pantothenate, 17.5; Folic acid, 2.5; D-biotin, 0.05; L-ascorbic acid, 6.4; Myo-inositol, 75.
Table 2.
Amino acid compositions (%AA/CP) of the experimental diets formulated to contain graded levels of functional immunostimulant mixture.
Table 2.
Amino acid compositions (%AA/CP) of the experimental diets formulated to contain graded levels of functional immunostimulant mixture.
| %Amino acid/Crude protein | control | HB0.5 | HB1.0 | HB1.5 |
| Essential amino acids | ||||
| Arginine | 5.65 | 5.05 | 5.92 | 5.51 |
| Histidine | 2.15 | 2.11 | 2.35 | 2.39 |
| Isoleucine | 3.46 | 3.36 | 4.02 | 3.54 |
| Leucine | 6.89 | 6.38 | 7.15 | 6.99 |
| Lysine | 5.00 | 5.28 | 5.96 | 6.21 |
| Methionine | 2.48 | 2.26 | 2.54 | 2.48 |
| Phenylalanine | 3.82 | 3.57 | 4.01 | 3.86 |
| Threonine | 3.98 | 3.63 | 3.99 | 3.97 |
| Valine | 4.14 | 3.93 | 4.67 | 4.18 |
| Non-essential amino acids | ||||
| Alanine | 5.87 | 5.38 | 6.01 | 5.90 |
| Aspartic acid | 7.70 | 7.39 | 8.23 | 7.99 |
| GABA | 0.02 | 0.02 | 0.02 | 0.02 |
| Glutamic acid | 15.50 | 14.34 | 16.02 | 15.54 |
| Glycine | 5.72 | 5.36 | 5.85 | 5.92 |
| Proline | 5.07 | 4.00 | 4.15 | 2.89 |
| Serine | 3.97 | 3.65 | 3.97 | 4.02 |
| Taurine | 1.06 | 0.97 | 0.92 | 1.09 |
| Tyrosine | 2.62 | 2.38 | 2.69 | 2.59 |
Abbreviations: control, a basal diet; HB0.5, HB1.0 and HB1.5 are 0.5, 1.0 and 1.5% functional immunostimulant mixture (Rovimax® HB Ultra) supplemented diets.
Table 3.
Growth performance, feed utilization, growth-related gene expression and biometric indices of olive flounder, Paralichthys olivaceus, fed graded levels of functional immunostimulant mixture-included diets for 12 weeks.
Table 3.
Growth performance, feed utilization, growth-related gene expression and biometric indices of olive flounder, Paralichthys olivaceus, fed graded levels of functional immunostimulant mixture-included diets for 12 weeks.
| Treatment | control | HB0.5 | HB1.0 | HB1.5 |
| FBW1 | 177±6b | 180±1b | 182±2ab | 188±2a |
| WG2 | 571±24b | 584±5b | 592±8ab | 613±7a |
| SGR3 | 2.12±0.04b | 2.14±0.01b | 2.15±0.01ab | 2.18±0.01a |
| IGF-14 | 1.00±0.00b | 1.20±0.48b | 1.97±0.38a | 2.09±0.36a |
| IGF-BP5 | 1.00±0.00b | 1.71±0.49ab | 2.38±0.95a | 2.14±0.72a |
| FI6 | 137±2 | 137±1 | 138±4 | 139±1 |
| FCR7 | 0.91±0.04a | 0.89±0.01ab | 0.88±0.02ab | 0.86±0.01b |
| PER8 | 1.99±0.09 | 2.00±0.02 | 2.02±0.05 | 2.04±0.03 |
| Survival | 97.0±3.6 | 99.0±1.5 | 99.0±1.5 | 100±0 |
| CF9 | 1.03±0.02 | 1.03±0.01 | 1.04±0.01 | 1.07±0.01 |
| HSI10 | 1.56±0.12 | 1.57±0.16 | 1.58±0.10 | 1.61±0.08 |
| VSI11 | 4.27±0.10 | 4.28±0.27 | 4.29±0.20 | 4.29±0.23 |
Abbreviations: control, a basal diet; HB0.5, HB1.0 and HB1.5 are 0.5, 1.0 and 1.5% functional immunostimulant mixture (Rovimax® HB Ultra) supplemented diets. Values are means from quintuplicate groups of fish where the values in each row with the different superscripts are significantly different (P < 0.05). 1Final body weight (g). 2Weight gain (%) = [(Final body weight - initial body weight)/initial body weight] × 100. 3Specific growth rate (%) = {[ln (Final body weight) – ln (initial body weight)]/days of feeding} × 100. 4Insulin Like growth factor-1 (relative expression). 5Insulin like growth factor-binding protein-1 (relative expression). 6Feed intake (g/fish) = Dry feed consumed/fish number. 7Feed conversion ratio = Dry feed intake/Wet weight gain. 8Protein efficiency ratio = Wet weight gain/protein intake. 9Condition factor = (Fish weight/Fish length3) × 100. 10Hepatosomatic index (%) = (Liver weight/Fish weight) × 100. 11Viscerosomatic index (%) = (Visceral weight / Fish weight) × 100.
Table 4.
Hematological parameters of olive flounder, Paralichthys olivaceus, fed graded levels of functional immunostimulant mixture-included diets for 12 weeks.
Table 4.
Hematological parameters of olive flounder, Paralichthys olivaceus, fed graded levels of functional immunostimulant mixture-included diets for 12 weeks.
| Treatment | Hb1 | Ht2 | Tg3 | Chol4 | TP5 | Glucose6 |
| control | 4.20±0.24b | 29.2±2.2b | 528±62 | 242±29 | 3.61±0.43b | 75.6±0.6a |
| HB0.5 | 4.65±0.30ab | 32.8±1.9ab | 527±54 | 246±20 | 3.88±0.25ab | 76.0±3.3a |
| HB1.0 | 4.58±0.31ab | 33.2±2.1ab | 524±54 | 245±25 | 3.98±0.33ab | 72.9±2.4ab |
| HB1.5 | 4.96±0.35a | 34.8±2.1a | 523±56 | 269±19 | 4.26±0.30a | 70.5±1.8b |
Abbreviations: control, a basal diet; control, a basal diet; HB0.5, HB1.0 and HB1.5 are 0.5, 1.0 and 1.5% functional immunostimulant mixture (Rovimax® HB Ultra) supplemented diets. Values are means from quintuplicate groups of fish where the values in each column with the different superscripts are significantly different (P < 0.05). 1Hemoglobin (g/dL). 2Hematocrit (%). 3Triglyceride (mg/L). 4Cholesterol (mg/L). 5Total protein (mg/L). 6Glucose (mg/L).
Table 5.
Non-specific immune responses, immune-related gene expressions and antioxidant enzyme capacity of olive flounder, Paralichthys olivaceus, fed graded levels of functional immunostimulant mixture-included diets for 12 weeks.
Table 5.
Non-specific immune responses, immune-related gene expressions and antioxidant enzyme capacity of olive flounder, Paralichthys olivaceus, fed graded levels of functional immunostimulant mixture-included diets for 12 weeks.
| Treatment | Lysozyme1 | Antiprotease2 | Ig3 | NBT4 | MPO5 | SOD6 | Catalase7 | GPx8 | TLR-39 | Perforin10 |
| control | 92.6±1.0b | 24.4±2.5 | 14.7±3.5c | 0.845±0.07b | 0.99±0.12b | 61.2±3.1b | 15.2±2.6b | 51.7±4.8c | 1.00±0.00b | 1.00±0.00b |
| HB0.5 | 95.4±4.2ab | 25.2±5.0 | 16.0±6.2bc | 0.943±0.14ab | 1.25±0.13a | 68.5±7.4ab | 17.2±2.2ab | 66.9±5.9b | 1.72±0.90ab | 1.50±0.60ab |
| HB1.0 | 97.3±2.3a | 27.2±3.9 | 23.3±4.2ab | 0.964±0.14ab | 1.27±0.15a | 70.2±6.0ab | 18.9±2.4ab | 81.9±9.7a | 1.52±0.75ab | 1.94±0.94ab |
| HB1.5 | 98.5±0.8a | 27.0±1.0 | 25.6±3.5a | 1.022±0.12a | 1.48±0.14a | 77.6±7.0a | 21.1±1.8a | 92.1±5.4a | 2.15±0.67a | 2.23±0.69a |
Abbreviations: control, a basal diet; HB0.5, HB1.0 and HB1.5 are 0.5, 1.0 and 1.5% functional immunostimulant mixture (Rovimax® HB Ultra) supplemented diets. Values are means from quintuplicate groups of fish where the values in each column with the different superscripts are significantly different (P < 0.05). 1Lysozyme (μg/mL). 2Antiprotease activity (% Inhibition). 3Total immunoglobulin (mg/ml). 4Nitroblue tetrazolium activity (absorbance at 540 nm). 5Myeloperoxidase activity (absorbance at 450nm). 6Superoxide dismutase activity (% inhibition). 7Catalase activity (U/L). 8Glutathione peroxidase (nmol min-1ml-1). 9Toll-like receptor-3 (relative gene expression). 10Perforin (relative gene expression).
Table 6.
Digestive enzyme activity of olive flounder, Paralichthys olivaceus, fed graded levels of functional immunostimulant mixture-included diets for 12 weeks.
Table 6.
Digestive enzyme activity of olive flounder, Paralichthys olivaceus, fed graded levels of functional immunostimulant mixture-included diets for 12 weeks.
| Treatment | Lipase1 | Pepsin2 | Trypsin3 | Chymotrypsin4 | Amylase5 |
| control | 11.0±0.6 | 6.11±0.71 | 0.028±0.004 | 0.0050±0.0009 | 18.6±2.6b |
| HB0.5 | 11.7±1.2 | 5.59±0.76 | 0.028±0.005 | 0.0052±0.0006 | 21.0±1.9ab |
| HB1.0 | 12.4±0.8 | 6.73±0.73 | 0.029±0.007 | 0.0053±0.0005 | 23.9±2.0a |
| HB1.5 | 12.5±1.6 | 6.77±0.51 | 0.029±0.007 | 0.0060±0.0002 | 24.4±1.8a |
Abbreviations: control, a basal diet; HB0.5, HB1.0 and HB1.5 are 0.5, 1.0 and 1.5% functional immunostimulant mixture (Rovimax® HB Ultra) supplemented diets. Values are means from quintuplicate groups of fish where the values in each column with the different superscripts are significantly different (P < 0.05). 1Lipase activity (units/mg protein). 2Pepsin activity (U/mg protein). 3Trypsin activity (BAPNA units/mg protein). 4Chymotrypsin (SAPNA units/mg protein). 5Amylase activity (U).
Table 7.
Whole-body composition (% wet basis) of olive flounder, Paralichthys olivaceus, fed graded levels of functional immunostimulant mixture-included diets for 12 weeks.
Table 7.
Whole-body composition (% wet basis) of olive flounder, Paralichthys olivaceus, fed graded levels of functional immunostimulant mixture-included diets for 12 weeks.
| Treatment | Moisture | Crude protein | Crude lipid | Crude ash |
| control | 71.8±0.8 | 19.4±0.8 | 4.39±0.87 | 3.57±0.47 |
| HB0.5 | 71.8±1.0 | 20.1±1.3 | 4.40±0.77 | 3.31±0.47 |
| HB1.0 | 71.8±0.6 | 19.3±1.0 | 5.03±0.84 | 3.16±0.55 |
| HB1.5 | 71.0±1.0 | 19.9±2.0 | 6.06±1.49 | 3.20±0.57 |
Abbreviations: control, a basal diet; HB0.5, HB1.0 and HB1.5 are 0.5, 1.0 and 1.5% functional immunostimulant mixture (Rovimax® HB Ultra) supplemented diets. Values are means from quintuplicate groups of fish where the values in each column with the different superscripts are significantly different (P < 0.05).
Table 8.
Villus height and goblet cell count of the intestine of olive flounder, Paralichthys olivaceus, fed graded levels of functional immunostimulant mixture-included diets for 12 weeks.
Table 8.
Villus height and goblet cell count of the intestine of olive flounder, Paralichthys olivaceus, fed graded levels of functional immunostimulant mixture-included diets for 12 weeks.
| Treatment | Villus height (nm) | Goblet cell count |
| control | 1027±59c | 833±10c |
| HB0.5 | 1201±88b | 926±137ab |
| HB1.0 | 1362±62a | 1052±130a |
| HB1.5 | 1369±72a | 1068±62a |
Abbreviations: control, a basal diet; HB0.5, HB1.0 and HB1.5 are 0.5, 1.0 and 1.5% functional immunostimulant mixture (Rovimax® HB Ultra) supplemented diets. Values are means from triplicate groups of fish where the values in each column with the different superscripts are significantly different (P < 0.05).
Table 9.
Sequences of primer pairs used for RT-qPCR in this study.
| Target Gene | Forward primer sequences (5’ to 3’) | Reverse primer sequences (5’ to 3’) | Accession number |
| IGF-I1 | GCCACACCCTCTCACTACTGCT | GCCTCTCTCTCCACACACAAAC | AF061278.1 |
| IGF-BP2 | GGGACCCTGTCATGTTGAACTCC | CAGAGACGAATCGCACTGCTTGG | XM_020105928.1 |
| TLR-33 | AACGCCTGGTTCATCAAGTG | CGAATGTCGAAGTGCAAGAG | AB109394 |
| Perforin | AGCATGTGAGCAAGTTCTGTCT | GGC ATGACGGGACACATAC | AB084905.1 |
| IL-64 | CTCTATCACAGATGCCGACTTGTCCT | ACCTCCTGCTCCTCACCTGAAA | DQ884914.3 |
| TNF-α5 | ACCCTTGCACAATCACACACTCAC | AAAGTGGTTGGCGGTGCAGA | AB040449.1 |
| TGF-β6 | GGGAGTGGATAAGTGGGAGGTTGT | AGCTCCTCTTTGCTCCCAGTTTCA | XM_020113775.1 |
| 18S rRNA | GACTCAACACGGGAAACCTCA | CAGACAAATCGCTCCACCAA | EF126037 |
1Insulin Like growth factor-1. 2Insulin-like growth factor-binding protein-1. 3Toll-like receptor-3. 4Interleukine-6. 5Tumor necrosis factor-α. 6Transforming growth factor-β.
Figure 1.
Inflammatory gene expressions of interleukine-6 (IL-6), tumor necrosis factor-α (TNF-α) and transforming growth factor-β (TGF-β) in the liver of olive flounder (Paralichthys olivaceus) fed graded levels of functional immunostimulant mixture included diets for 12 weeks. Data represent the means of relative gene expression values of five biological replicates in each dietary treatment; error bars indicate the standard deviation. Bars with different letters indicate significant differences (P < 0.05). Abbreviations: control, a basal diet; HB0.5, HB1.0 and HB1.5 are 0.5, 1.0 and 1.5% functional immunostimulant mixture (Rovimax® HB Ultra) supplemented diets.
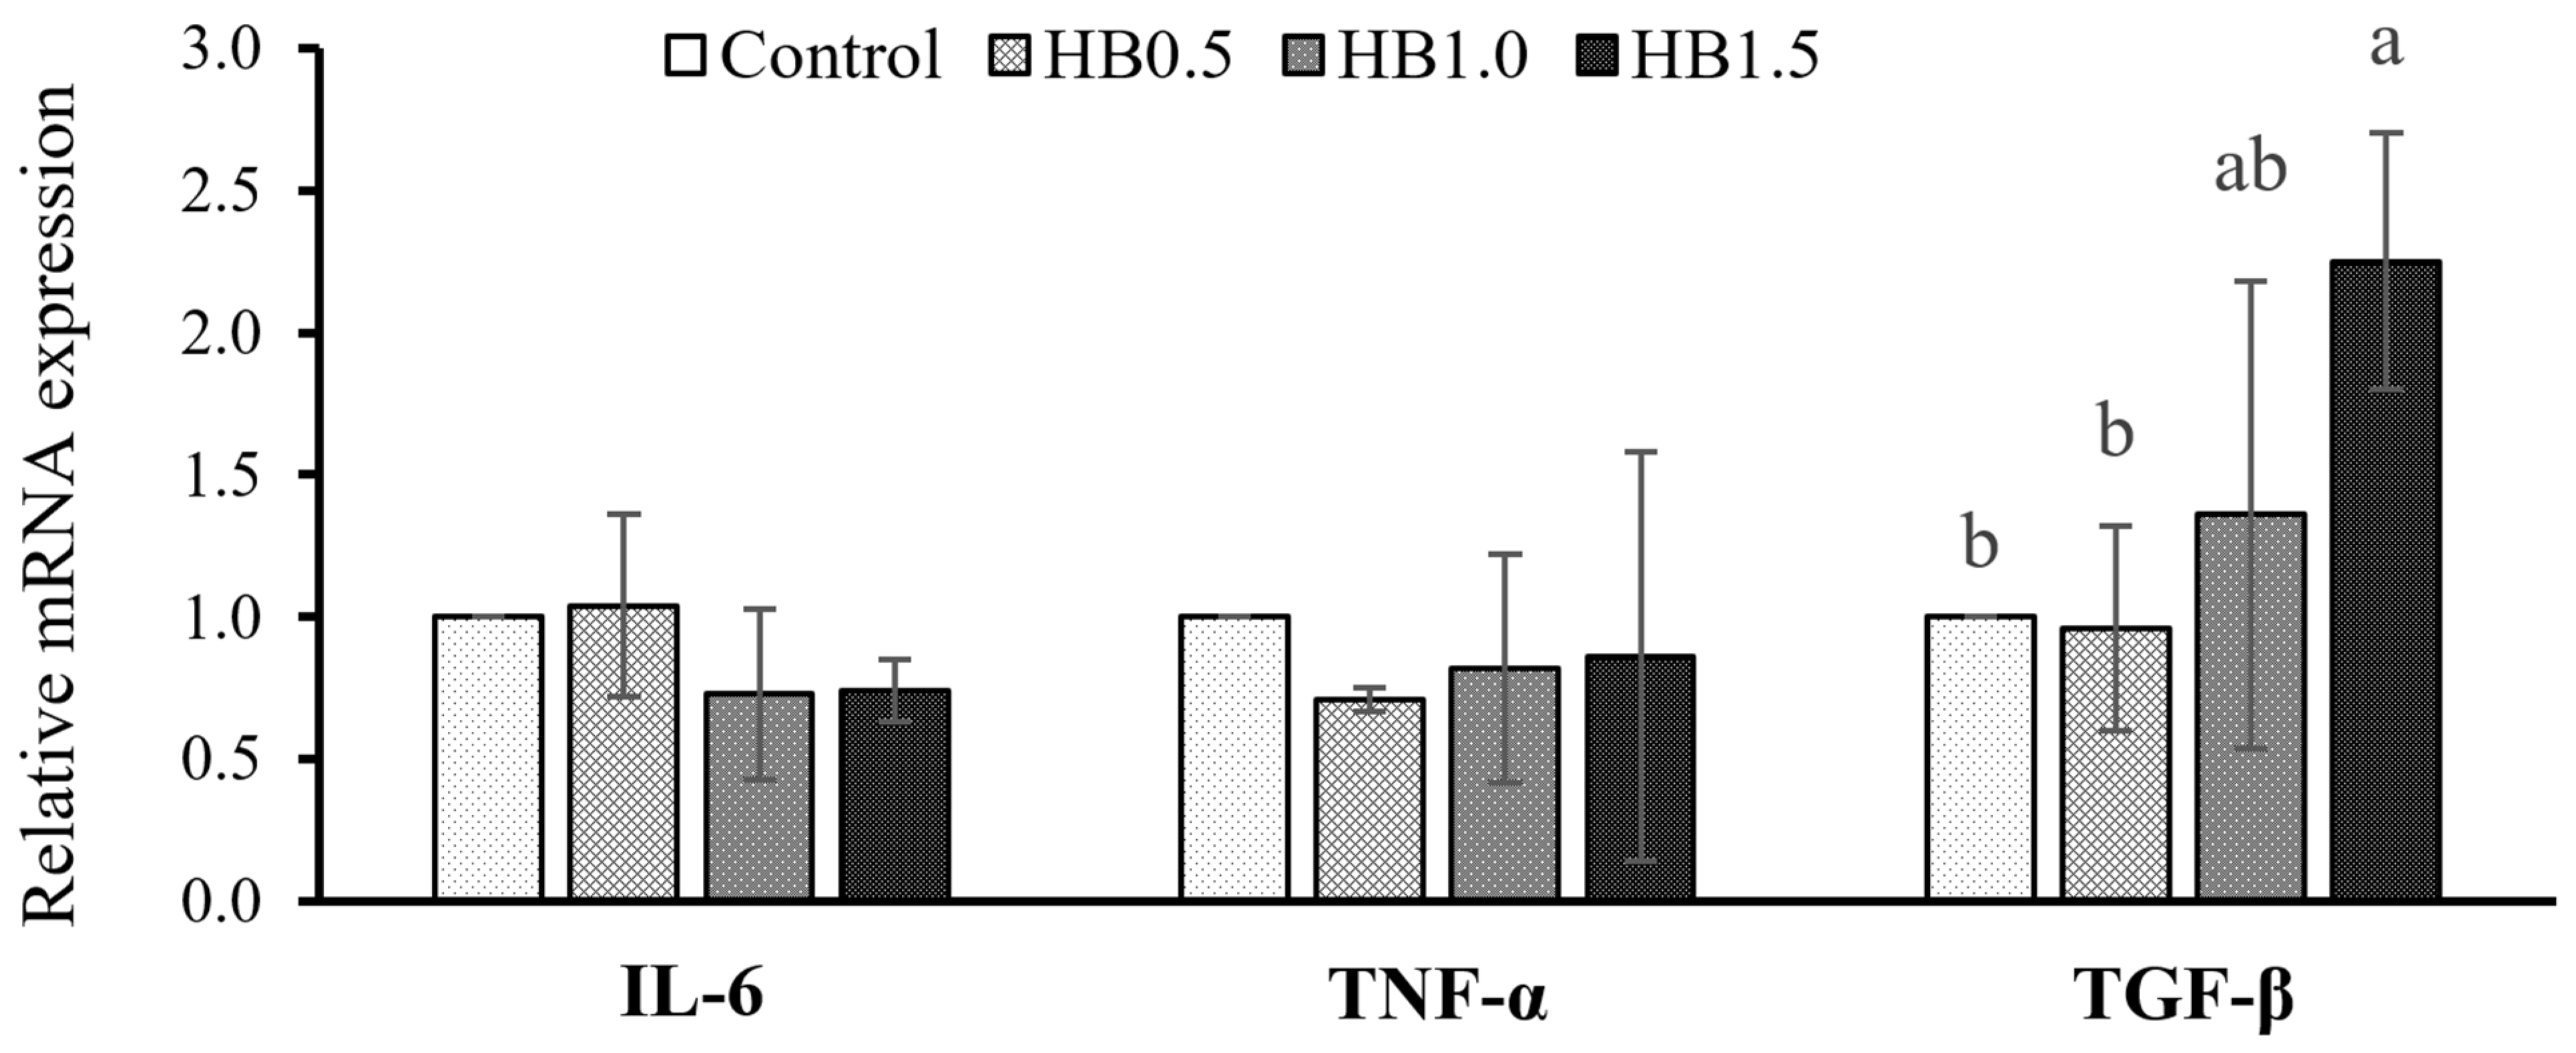
Figure 2.
Representative histological images of Alcian blue (pH 2.5), periodic acid, and Schiff reagent stained cross-sections of proximal intestine tissue depicting the micro-morphological characteristics of the intestine (×10) of olive flounder, Paralichthys olivaceus, fed the graded levels of functional immunostimulant mixture included diets for 12 weeks. a - control; b - HB0.5; c - HB1.0, 1; d - HB1.5; and VL - Villus length. Abbreviations: control, a basal diet; HB0.5, HB1.0 and HB1.5 are 0.5, 1.0 and 1.5% functional immunostimulant mixture (Rovimax® HB Ultra) supplemented diets.
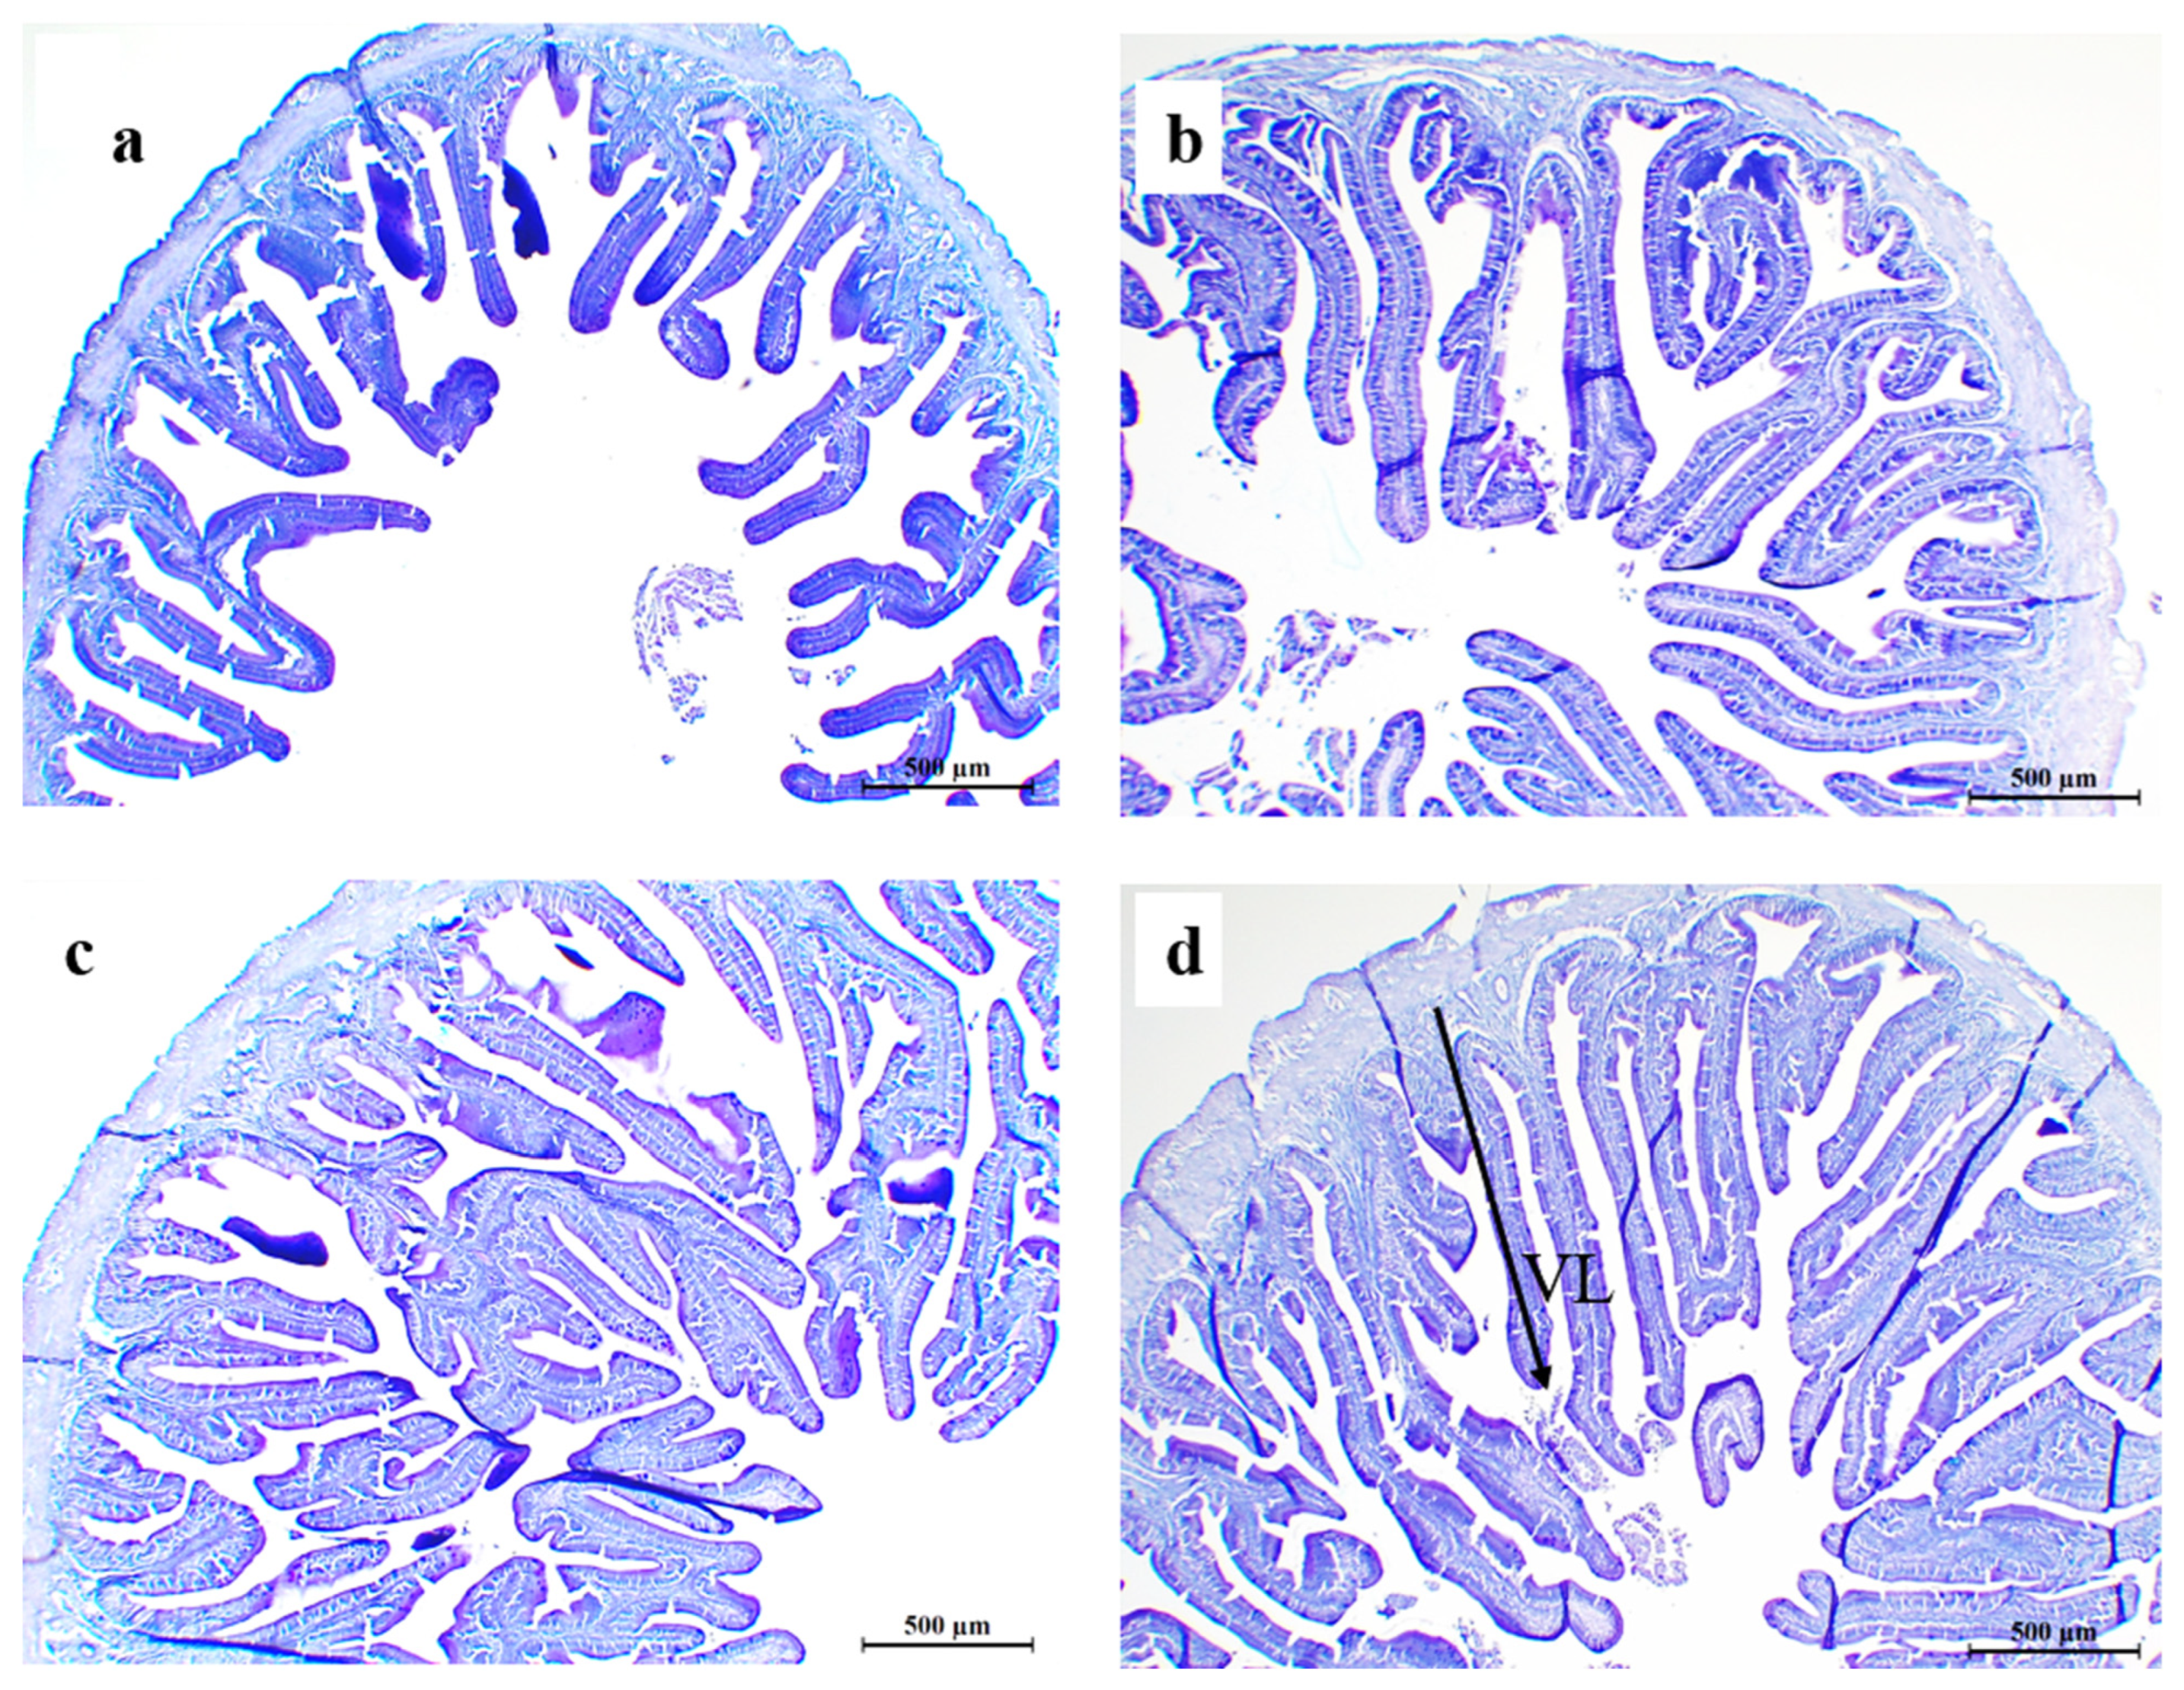
Figure 3.
Representative histological images of Alcian blue, periodic acid, and Schiff reagent stained cross-sections of proximal intestine tissue depicting the goblet cell distribution of the intestine cross-sections (×40) of olive flounder, Paralichthys olivaceus, fed the graded levels of functional immunostimulant mixture included diets for 12 weeks. a - control; b - HB0.5; c - HB1.0, 1.0%; d - HB1.5; and GC – Goblet cell. Abbreviations: control, a basal diet; HB0.5, HB1.0 and HB1.5 are 0.5, 1.0 and 1.5% functional immunostimulant mixture (Rovimax® HB Ultra) supplemented diets.
Author Contributions
N.M. and M.H.; Investigation, Formal Analysis, Data curation and Writing – original draft. R.C.; Conceptualization, Methodology, Resources and Writing – review & editing. K.J.L.; Conceptualization, Methodology, Supervision and Writing – review & editing.
Institutional Review Board Statement
All animal-related protocols were approved by the Animal Welfare and Research Ethics Committee of Jeju national university (approval no: 2022-0028) and authors followed all applicable international, national and institutional guidelines for the care and use of animals.
Data availability statement
All datasets analyzed in this study are available from the corresponding author upon reasonable request.
Acknowledgments
This study was supported and additives were supplied by DSM Nutritional Products Ltd., Bangkok 10310, Thailand and National Research Foundation of Korea (NRF) (2019R1A6A1A03033553), Ministry of Education.
Conflicts of Interest
The authors declare that they have no conflict of interest.
References
- Liu, A.; Santigosa, E.; Dumas, A.; Hernandez, J. M. ; Vitamin nutrition in salmonid aquaculture: From avoiding deficiencies to enhancing functionalities. Aquaculture 2022, 738654. [Google Scholar] [CrossRef]
- Kum, C.; Sekkin, S. ; The immune system drugs in fish: immune function, immunoassay, drugs. Recent advances in fish farms 2011, 169–210. [Google Scholar]
- Dawood, M. A.; Koshio, S.; Esteban, M. Á. ; Beneficial roles of feed additives as immunostimulants in aquaculture: a review. Rev. Aquac. 2018, 10, 950–974. [Google Scholar] [CrossRef]
- Lieke, T.; Meinelt, T.; Hoseinifar, S. H.; Pan, B.; Straus, D. L.; Steinberg, C. E. ; Sustainable aquaculture requires environmental-friendly treatment strategies for fish diseases. Rev. Aquac. 2020, 12, 943–965. [Google Scholar] [CrossRef]
- Oliva-Teles, A. ; Nutrition and health of aquaculture fish. J. fish dis. 2012, 35, 83–108. [Google Scholar] [CrossRef] [PubMed]
- Chuchird, N.; Rairat, T.; Keetanon, A.; Seguin, D.; Chotikachinda, R.; Manomaitis, L.; Kanjanamayoon, C. ; Effect of feed enzymes and functional immunostimulants supplementation on growth performance and overall health of postlarvae and juvenile Pacific white shrimp, Penaeus vannamei, fed soybean-based diets. J. World Aquacult. Soc. 2023. [Google Scholar] [CrossRef]
- Carver, J. D.; Walker, W. A; The role of nucleotides in human nutrition. J. Nutr. Biochem. 1995, 6, 58–72. [Google Scholar] [CrossRef]
- Li, P.; Gatlin III, D. M. ; Nucleotide nutrition in fish: current knowledge and future applications. Aquaculture 2006, 251, 141–152. [Google Scholar] [CrossRef]
- National Research Council. Nutrient requirements of fish, National Academies Press, 2011.
- Rudolph, F. B. ; The biochemistry and physiology of nucleotides. J. Nutr 1994, 124 (suppl_1), 124S–127S. [Google Scholar] [CrossRef]
- Song, J. W.; Lim, S. J.; Lee, K. J. ; Effects of dietary supplementation of inosine monophosphate on growth performance, innate immunity and disease resistance of olive flounder (Paralichthys olivaceus). Fish Shellfish Immunol. 2012, 33, 1050–1054. [Google Scholar] [CrossRef]
- Asaduzzaman, M.; Ikeda, D.; Abol-Munafi, A. B.; Bulbul, M.; Ali, M. E.; Kinoshita, S.; Watabe, S.; Kader, M. A. ; Dietary supplementation of inosine monophosphate promotes cellular growth of muscle and upregulates growth-related gene expression in Nile tilapia Oreochromis niloticus. Aquaculture 2017, 468, 297–306. [Google Scholar] [CrossRef]
- Burrells, C.; Williams, P. D.; Southgate, P. J.; Wadsworth, S. L. ; Dietary nucleotides: a novel supplement in fish feeds: 2. Effects on vaccination, saltwater transfer, growth rates and physiology of Atlantic salmon (Salmo salar L.). Aquaculture 2001b, 199, 171–184. [Google Scholar] [CrossRef]
- Sakai, M.; Taniguchi, K.; Mamoto, K.; Ogawa, H.; Tabata, M. ; Immunostimulant effects of nucleotide isolated from yeast RNA on carp, Cyprinus carpio L. J. Fish Dis. 2001, 24, 433–438. [Google Scholar] [CrossRef]
- Burrells, C.; Williams, P. D.; Forno, P. F. ; Dietary nucleotides: a novel supplement in fish feeds: 1. Effects on resistance to disease in salmonids. Aquaculture 2001a, 199, 159–169. [Google Scholar] [CrossRef]
- Shiau, S. Y.; Gabaudan, J.; Lin, Y. H. ; Dietary nucleotide supplementation enhances immune responses and survival to Streptococcus iniae in hybrid tilapia fed diet containing low fish meal. Aquac. Rep. 2015, 2, 77–81. [Google Scholar] [CrossRef]
- Coward, K. H.; Drummond, J. C. ; On the Significance of Vitamin A in the Nutrition of Fish. Biochem. J. 1922, 16, 631. [Google Scholar] [CrossRef]
- Hara, H. J. ; Cardiospasm. Cal. West. Med. 1929, 30, 390, https://www.ncbi.nlm.nih.gov/pmc/articles/PMC1656216/. [Google Scholar]
- Moreau, R.; Dabrowski, K.; Czesny, S.; Cihla, F. Vitamin C-vitamin E interaction in juvenile lake sturgeon (Acipenser fulvescens R.), a fish able to synthesize ascorbic acid. J. Appl. Ichthyol. 1999, 15, 250–257. [Google Scholar] [CrossRef]
- Hernandez, L. H.; Hardy, R. W. ; Vitamin A functions and requirements in fish. Aquac. Res. 2020, 51, 3061–3071. [Google Scholar] [CrossRef]
- Dabrowski, K. ; Gulonolactone oxidase is missing in teleost fish. The direct spectrophotometric assay. 1990. [Google Scholar] [CrossRef]
- Lee, K. J.; Dabrowski, K.; Blom, J. H.; Bai, S. C.; Stromberg, P. C. ; A mixture of cottonseed meal, soybean meal, and animal byproduct mixture as a fish meal substitute: growth and tissue gossypol enantiomer in juvenile rainbow trout (Oncorhynchus mykiss). J. Anim. Physiol. Anim Nutr. 2002, 86, 201–213. [Google Scholar] [CrossRef]
- Dawood, M. A.; Koshio, S. ; Recent advances in the role of probiotics and prebiotics in carp aquaculture: a review. Aquaculture 2016, 454, 243–251. [Google Scholar] [CrossRef]
- El-Sayed, A. F. M.; Izquierdo, M. ; The importance of vitamin E for farmed fish—A review. Rev. Aquac. 2022, 14, 688–703. [Google Scholar] [CrossRef]
- Jiménez-Fernández, S.; Gurpegui, M.; Diaz-Atienza, F.; Pérez-Costillas, L.; Gerstenberg, M.; Correll, C. U. ; Oxidative stress and antioxidant parameters in patients with major depressive disorder compared to healthy controls before and after antidepressant treatment: results from a meta-analysis. J. Clin. Psychiatry. 2015, 76, 13705. [Google Scholar] [CrossRef]
- Lee, S.; Park, G.; Moniruzzaman, M.; Bae, J.; Song, Y.; Kim, K. W.; Bai, S. C. ; Synergistic effects of dietary vitamin C and selenium on induced methylmercury toxicity in juvenile olive flounder Paralichthys olivaceus. Turkish J. Fish. Aquat. Sci. 2017, 17, 527–533. [Google Scholar]
- Hamre, K. ; Metabolism, interactions, requirements, and functions of vitamin E in fish. Aquac. Nutr. 2011, 17, 98–115. [Google Scholar] [CrossRef]
- Novak, M.; Vetvicka, V. ; β-glucans, history, and the present: immunomodulatory aspects and mechanisms of action. J. immunotoxicol. 2008, 5, 47–57. [Google Scholar] [CrossRef] [PubMed]
- Kaur, R.; Sharma, M.; Ji, D.; Xu, M.; Agyei, D. ; Structural features, modification, and functionalities of beta-glucan. Fibers 2019, 8, 1. [Google Scholar] [CrossRef]
- Rodrigues, M. V.; Zanuzzo, F. S.; Koch, J. F. A.; de Oliveira, C. A. F.; Sima, P.; Vetvicka, V. ; Development of fish immunity and the role of β-glucan in immune responses. Molecules 2020, 25, 5378. [Google Scholar] [CrossRef]
- Han, B.; Baruah, K.; Cox, E.; Vanrompay, D.; Bossier, P. ; Structure-functional activity relationship of β-glucans from the perspective of immunomodulation: a mini-review. Front. Immunol. 2020, 11, 658. [Google Scholar] [CrossRef]
- Rice, P. J.; Kelley, J. L.; Kogan, G.; Ensley, H. E.; Kalbfleisch, J. H.; Browder, I. W.; Williams, D. L. ; Human monocyte scavenger receptors are pattern recognition receptors for (1→ 3)-β-D-glucans. J. Leukoc. Biol. 2002, 72, 140–146. [Google Scholar] [CrossRef]
- Sato, T.; Iwabuchi, K.; Nagaoka, I.; Adachi, Y.; Ohno, N.; Tamura, H.; Yoshizaki, F.; Ogawa, H. ; Induction of human neutrophil chemotaxis by Candida albicans-derived β-1, 6-long glycoside side-chain-branched β-glucan. J leukoc biol, 2006, 80, 204–211. [Google Scholar] [CrossRef] [PubMed]
- de Mello, M. M. M.; de Faria, C. D. F. P.; Zanuzzo, F. S.; Urbinati, E. C. ; β-glucan modulates cortisol levels in stressed pacu (Piaractus mesopotamicus) inoculated with heat-killed Aeromonas hydrophila. Fish Shellfish Immunol. 2019, 93, 1076–1083. [Google Scholar] [CrossRef] [PubMed]
- Do-Huu, H.; Nguyen, T. N. H.; Tran, V. H. ; Effects of dietary β-glucan supplementation on growth, innate immune, and capacity against pathogen Streptococcus iniae of juvenile pompano (Trachinotus ovatus). Isr. J. Aquac. -Bamidgeh 2019, 71. [Google Scholar] [CrossRef]
- Pietretti, D.; Vera-Jimenez, N. I.; Hoole, D.; Wiegertjes, G. F; Oxidative burst and nitric oxide responses in carp macrophages induced by zymosan, MacroGard® and selective dectin-1 agonists suggest recognition by multiple pattern recognition receptors. Fish Shellfish Immunol. 2013, 35, 847–857. [Google Scholar] [CrossRef] [PubMed]
- Barros, M. M.; Falcon, D. R.; Orsi, R. O.; Pezzato, L. E.; Fernandes Junior, A. C.; Fernandes Junior, A.; de Carvalho, P.L.; Padovani, C.R.; Guimarães, I.G.; Sartori, M. M. Immunomodulatory effects of dietary β-glucan and vitamin C in Nile tilapia, Oreochromis niloticus L., subjected to cold-induced stress or bacterial challenge. J. World Aquacult. Soc. 2015, 46, 363–380. [Google Scholar] [CrossRef]
- Salah, A. S.; El Nahas, A. F.; Mahmoud, S. ; Modulatory effect of different doses of β-1, 3/1, 6-glucan on the expression of antioxidant, inflammatory, stress and immune-related genes of Oreochromis niloticus challenged with Streptococcus iniae. Fish Shellfish Immunol. 2017, 70, 204–213. [Google Scholar] [CrossRef] [PubMed]
- Jang, W. J.; Lee, J. M.; Hasan, M. T.; Lee, B. J.; Lim, S. G.; Kong, I. S. ; Effects of probiotic supplementation of a plant-based protein diet on intestinal microbial diversity, digestive enzyme activity, intestinal structure, and immunity in olive flounder (Paralichthys olivaceus). Fish Shellfish Immunol. 2019, 92, 719–727. [Google Scholar] [CrossRef]
- KOSTAT; Statistics Korea, Daejeon, Republic of Korea, Fishery Production Survey. 2017.
- AOAC; Official Methods of Analysis, 18th ed.; Association of Official Analytical, Chemists International, Maryland, USA, 2005.
- Folch, J.; Lees, M.; Sloane Stanley, G. H. ; A simple method for the isolation and purification of total lipids from animal tissues. J. Biol. Chem. 1957, 226, 497–509. [Google Scholar] [CrossRef]
- Henderson, J.W.; Ricker, R.D.; Bidlingmeyer, B.A.; Woodward, C. ; Agilent Technical Note 1999; 5980–1193E.
- Anderson, D. P.; Siwicki, A. K. Basic hematology and serology for fish health programs. In Diseases in Asian aquaculture II; Shariff, M., Arthur, J. R., Subasinghe, R. P., Eds.; Fish Health Section, Asian Fisheries Society: Manila, Philippines, 1995; pp. 185–202. [Google Scholar]
- Quade, M. J.; Roth, J. A. ; A rapid, direct assay to measure degranulation of bovine neutrophil primary granules. Vet. Immunol. Immunopathol. 1997, 58, 239–248. [Google Scholar] [CrossRef]
- Siwicki, A. K.; Anderson, D. P.; Rumsey, G. L. ; Dietary intake of immunostimulants by rainbow trout affects non-specific immunity and protection against furunculosis. Vet. Immunol. Immunopathol. 1994, 41, 125–139. [Google Scholar] [CrossRef]
- Sankaran, K.; Gurnani, S. ; On the variation in the catalytic activity of lysozyme in fishes. Indian J. Biochem. Biophy. 1972, 9, 162–165, PMID: 4661756. [Google Scholar]
- Ellis, A. E.; Serum antiproteases in fish. In Techniques in Fish Immunology; Stolen, J. S., Fletcher, T. C., Anderson, D. P., Roberson B., S., van Muiswinkel W., B., Eds.; Fair Haven. SOS Publications: N.J, 1990; pp. 95–99. [Google Scholar]
- Magnadóttir, B.; Jónsdóttir, H.; Helgason, S.; Björnsson, B.; Jørgensen, T. Ø.; Pilström, L.; Humoral immune parameters in Atlantic cod (Gadus morhua L. ): I. The effects of environmental temperature. Comp. Biochem. Physiol. B, Biochem. Mol. Biol., 1999, 122, 173–180. [Google Scholar] [CrossRef]
- Bradford, M. M. ; A rapid and sensitive method for the quantitation of microgram quantities of protein utilizing the principle of protein-dye binding. Anal. Biochem. 1976, 72, 248–254. [Google Scholar] [CrossRef]
- Worthington, V. ; Worthington Enzyme Manual. Enzymes and Related Biochemicals Worthington Chemical, New Jersey, US. 1993; 399 pp.
- Erlanger, B. F.; Kokowsky, N.; Cohen, W. ; The preparation and properties of two new chromogenic substrates of trypsin. Arch. Biochem. Biophys. 1961, 95, 271–278. [Google Scholar] [CrossRef] [PubMed]
- Falcón-Hidalgo, B.; Forrellat-Barrios, A.; Farnés, O. C.; Hernández, K. U. ; Digestive enzymes of two freshwater fishes (Limia vittata and Gambusia punctata) with different dietary preferences at three developmental stages. Comp. Biochem. Physiol.- B Biochem Mol. Biol. 2011, 158, 136–141. [Google Scholar] [CrossRef] [PubMed]
- Borlongan, I. G. ; Studies on the digestive lipases of milkfish, Chanos chanos. Aquaculture 1990, 89, 315–325. [Google Scholar] [CrossRef]
- Medagoda, N.; Kim, M. G.; Gunathilaka, B. E.; Park, S. H.; Lee, K. J. ; Effect of total replacement of fish oil with tallow and emulsifier in diet on growth, feed utilization, and immunity of olive flounder (Paralichthys olivaceus). J. World Aquacult. Soc. 2022, 53, 558–571. [Google Scholar] [CrossRef]
- Pfaffl, M. W. ; A new mathematical model for relative quantification in real-time RT–PCR. Nucleic Acids Res. 2001, 29, e45–e45. [Google Scholar] [CrossRef]
- Hossain, M. S.; Koshio, S.; Ishikawa, M.; Yokoyama, S.; Sony, N. M. ; Dietary nucleotide administration influences growth, immune responses and oxidative stress resistance of juvenile red sea bream (Pagrus major). Aquaculture 2016, 455, 41–49. [Google Scholar] [CrossRef]
- Borda, E.; Martinez-Puig, D.; Cordoba, X. ; Well-balanced nucleotide supply makes sense. Feed Mix 2003, 11, 24–26. [Google Scholar]
- Metailler, R.; Cadena-Roa, M.; Ruyet, J. P. L. ; Attractive chemical substances for the weaning of Dover sole (Solea vulgaris): qualitative and quantitative approach. J. World Maricult Soc. 1983, 14, 679–684. [Google Scholar] [CrossRef]
- Adamek, Z.; Hamačkova, J.; Kouril, J.; Vachta, R.; Stibranyiova, I. ; Effect of Ascogen probiotics supplementation on farming success in rainbow trout (Oncorhynchus mykiss) and wels (Silurus glanis) under conditions of intensive culture. Krmiva: Časopis o hranidbi životinja, proizvodnji i tehnologiji krme 1996, 38, 11–20. [Google Scholar]
- Tahmasebi-Kohyani, A.; Keyvanshokooh, S.; Nematollahi, A.; Mahmoudi, N.; Pasha-Zanoosi, H. ; Effects of dietary nucleotides supplementation on rainbow trout (Oncorhynchus mykiss) performance and acute stress response. Fish Physiol. Biochem. 2012, 38, 431–440. [Google Scholar] [CrossRef] [PubMed]
- Li, P.; Lewis, D. H.; Gatlin III, D. M. ; Dietary oligonucleotides from yeast RNA influence immune responses and resistance of hybrid striped bass (Morone chrysops × Morone saxatilis) to Streptococcus iniae infection. Fish Shellfish Immunol. 2004a, 16, 561–569. [Google Scholar] [CrossRef] [PubMed]
- Castillo, J.; Codina, M.; Martínez, M. L.; Navarro, I.; Gutiérrez, J. ; Metabolic and mitogenic effects of IGF-I and insulin on muscle cells of rainbow trout. Am. J. Physiol. – Regul. Integr. Comp. Physiol. 2004, 286, R935–R941. [Google Scholar] [CrossRef]
- Montserrat, N.; Capilla, E.; Navarro, I.; Gutiérrez, J. ; Metabolic effects of insulin and IGFs on gilthead sea bream (Sparus aurata) muscle cells. Front. Endocrinol. 2012, 3, 55. [Google Scholar] [CrossRef] [PubMed]
- Magouz, F. I.; Abdel-Rahim, M. M.; Lotfy, A. M.; Mosbah, A.; Alkafafy, M.; Sewilam, H.; Dawood, M. A. ; Dietary nucleotides enhanced growth performance, carcass composition, blood biochemical, and histology features of European sea bass, Dicentrarchus labrax L. Aquac. Rep. 2021, 20, 100738. [Google Scholar] [CrossRef]
- Meng, Y.; Ma, R.; Ma, J.; Han, D.; Xu, W.; Zhang, W.; Mai, K. ; Dietary nucleotides improve the growth performance, antioxidative capacity and intestinal morphology of turbot (Scophthalmus maximus). Aquac. Nutr. 2017, 23, 585–593. [Google Scholar] [CrossRef]
- Bueno, J.; Torres, M.; Almendros, A.; Carmona, R.; Nunez, M. C.; Rios, A.; Gil, A. Effect of dietary nucleotides on small intestinal repair after diarrhea. Histological and ultrastructural changes. Gut 1994, 35, 926–933. [Google Scholar] [CrossRef]
- Cao, Y.; Zou, S.; Xu, H.; Li, M.; Tong, Z.; Xu, M.; Xu, X. ; Hypoglycemic activity of the Baker's yeast β-glucan in obese/type 2 diabetic mice and the underlying mechanism. Mol. Nutr Food Res. 2016, 60, 2678–2690. [Google Scholar] [CrossRef]
- Garcia, F.; Pilarski, F.; Onaka, E. M.; de Moraes, F. R.; Martins, M. L. ; Hematology of Piaractus mesopotamicus fed diets supplemented with vitamins C and E, challenged by Aeromonas hydrophila. Aquaculture 2007, 271, 39–46. [Google Scholar] [CrossRef]
- Carver, J. D.; Cox, W. I.; Barness, L. A. ; Dietary nucleotide effects upon murine natural killer cell activity and macrophage activation. J. Parenter. Enteral. Nutr. 1990, 14, 18–22. [Google Scholar] [CrossRef] [PubMed]
- Gil, A. ; Modulation of the immune response mediated by dietary nucleotides. Eur. J. Clin. Nutr. 2002, 56 (Suppl. 3), S1–S4. [Google Scholar] [CrossRef] [PubMed]
- Ramadan, A.; Afifi, N. A.; Moustafa, M. M.; Samy, A. M. ; The effect of ascogen on the immune response of tilapia fish to Aeromonas hydrophila vaccine. Fish Shellfish Immunol. 1994, 4, 159–165. [Google Scholar] [CrossRef]
- Navarro, J.; Ruiz-Bravo, A.; Jiménez-Valera, M.; Gil, A. ; Modulation of antibody-forming cell and mitogen-driven lymphoproliferative responses by dietary nucleotides in mice. Immunol. Lett. 1996, 53, 141–145. [Google Scholar] [CrossRef] [PubMed]
- Leonardi, M.; Sandino, A. M.; Klempau, A. ; Effect of a nucleotide-enriched diet on the immune system, plasma cortisol levels and resistance to infectious pancreatic necrosis (IPN) in juvenile rainbow trout (Oncorhynchus mykiss). Bull. Eur. Assoc. Fish Pathol. 2003, 23, 52–59. [Google Scholar]
- Gantner, B. N.; Simmons, R. M.; Canavera, S. J.; Akira, S.; Underhill, D. M. ; Collaborative induction of inflammatory responses by dectin-1 and Toll-like receptor 2. J. Exp. Med. 2003, 197, 1107–1117. [Google Scholar] [CrossRef]
- Uribe, C.; Folch, H.; Enríquez, R.; Moran, G. J. V. M. ; Innate and adaptive immunity in teleost fish: a review. Vet. Med. 2011, 56, 486. [Google Scholar] [CrossRef]
- Klebanoff, S. J. ; Myeloperoxidase: friend and foe. J. Leukoc. Biol. 2005, 77, 598–625. [Google Scholar] [CrossRef]
- Sim Choi, H.; Woo Kim, J.; Cha, Y. N.; Kim, C. ; A quantitative nitroblue tetrazolium assay for determining intracellular superoxide anion production in phagocytic cells. J. Immunoass. Immunochem. 2006, 27, 31–44. [Google Scholar] [CrossRef]
- Özlüer-Hunt, A.; Özkan-Yılmaz, F.; Berköz, M.; Engin, K.; Gündüz, S. G.; Yalın, S. ; Effects of dietary nucleotide yeast on immune responses and antioxidant enzyme activities of rainbow trout juveniles (Oncorhynchus mykiss). Isr. J. Aquac. -Bamidgeh 2016. [Google Scholar]
- Tie, H. M.; Wu, P.; Jiang, W. D.; Liu, Y.; Kuang, S. Y.; Zeng, Y. Y. ; Feng, L; Dietary nucleotides supplementation affect the physicochemical properties, amino acid and fatty acid constituents, apoptosis and antioxidant mechanisms in grass carp (Ctenopharyngodon idellus) muscle. Aquaculture 2019, 502, 312–325. [Google Scholar] [CrossRef]
- Andriamialinirina, H. J. T.; Irm, M.; Taj, S.; Lou, J. H.; Jin, M.; Zhou, Q. ; The effects of dietary yeast hydrolysate on growth, hematology, antioxidant enzyme activities, and non-specific immunity of juvenile Nile tilapia, Oreochromis niloticus. Fish Shellfish Immunol. 2020, 101, 168–175. [Google Scholar] [CrossRef] [PubMed]
- Neamat-Allah, A. N.; Abd El Hakim, Y.; Mahmoud, E. A. ; Alleviating effects of β-glucan in Oreochromis niloticus on growth performance, immune reactions, antioxidant, transcriptomics disorders and resistance to Aeromonas sobria caused by atrazine. Aquac. Res. 2020, 51, 1801–1812. [Google Scholar] [CrossRef]
- Sang, Y.; Yang, J.; Ross, C. R.; Rowland, R. R.; Blecha, F. ; Molecular identification and functional expression of porcine Toll-like receptor (TLR) 3 and TLR7. Vet. Immunol. Immunopathol. 2008, 125, 162–167. [Google Scholar] [CrossRef] [PubMed]
- Mukhopadhyay, S.; Herre, J.; Brown, G. D.; Gordon, S. ; The potential for Toll-like receptors to collaborate with other innate immune receptors. Immunol. 2004, 112, 521–530. [Google Scholar] [CrossRef] [PubMed]
- Casadei, E. ; The effect of dietary immunostimulation on antimicrobial peptide expression in rainbow trout (Oncorhynchus mykiss) and their potential role in defence against pathogens, Doctoral dissertation, University of Aberdeen, 2011.
- Osińska, I.; Popko, K.; Demkow, U. ; Perforin: an important player in immune response. Cent.-Eur. J. Immunol. 2014, 39, 109–115. [Google Scholar] [CrossRef]
- Hunt, A. Ö.; Yılmaz, F. Ö.; Engin, K.; Berköz, M.; Gündüz, S. G.; Yalın, S.; Şahin, N. Ö. ; The effects of fish meal replacement by yeast-based nucleotides on growth, body composition, and digestive enzyme activity in rainbow trout juveniles (Oncorhynchus mykiss). Isr. J. Aquac. -Bamidgeh 2014. [Google Scholar] [CrossRef]
- Ganguly, S.; Paul, I.; Mukhopadhayay, S. K. ; Application and effectiveness of immunostimulants, probiotics, and prebiotics in aquaculture: a review. Isr. J. Aquac. -Bamidgeh 2010, 62. [Google Scholar] [CrossRef]
- Swennen, K.; Courtin, C. M.; Delcour, J. A. ; Non-digestible oligosaccharides with prebiotic properties. Crit. Rev. Food. Sci. Nutr. 2006, 46, 459–471. [Google Scholar] [CrossRef]
- Wang, M.; Wichienchot, S.; He, X.; Fu, X.; Huang, Q.; Zhang, B. ; In vitro colonic fermentation of dietary fibers: Fermentation rate, short-chain fatty acid production and changes in microbiota. Trends. Food Sci. Technol. 2019, 88, 1–9. [Google Scholar] [CrossRef]
- Medagoda, N.; Lee, K. J. ; Effects of dietary arachidonic acid supplementation in high plant protein diets on growth, feed utilization, and immunity of olive flounder, Paralichthys olivaceus. Aquaculture 2023, 739431. [Google Scholar] [CrossRef]
- Cheng, Z.; Buentello, A.; Gatlin III, D. M. ; Dietary nucleotides influence immune responses and intestinal morphology of red drum Sciaenops ocellatus. Fish Shellfish Immunol. 2011, 30, 143–147. [Google Scholar] [CrossRef]
- Peng, M.; Xu, W.; Ai, Q.; Mai, K.; Liufu, Z.; Zhang, K. Effects of nucleotide supplementation on growth, immune responses and intestinal morphology in juvenile turbot fed diets with graded levels of soybean meal (Scophthalmus maximus L.). Aquaculture 2013, 392, 51–58. [Google Scholar] [CrossRef]
- Hess, J. R.; Greenberg, N. A. ; The role of nucleotides in the immune and gastrointestinal systems: potential clinical applications. Nutr. Clin. Pract. 2012, 27, 281–294. [Google Scholar] [CrossRef]
- Song, S. K.; Beck, B. R.; Kim, D.; Park, J.; Kim, J.; Kim, H. D.; Ringø, E. ; Prebiotics as immunostimulants in aquaculture: a review. Fish Shellfish Immunol. 2014, 40, 40–48. [Google Scholar] [CrossRef]
- Vu, V.; Muthuramalingam, K.; Singh, V.; Choi, C.; Kim, Y. M.; Unno, T.; Cho, M. ; Schizophyllum commune-derived β-glucan improves intestinal health demonstrating protective effects against constipation and common metabolic disorders. Appl. Biol. Chem. 2022, 65, 1–11. [Google Scholar] [CrossRef]
- Li, H.; Xu, C.; Zhou, L.; Dong, Y.; Su, Y.; Wang, X.; Qin, J. G; Chen, L; Li, E.; Beneficial effects of dietary β-glucan on growth and health status of Pacific white shrimp Litopenaeus vannamei at low salinity. Fish Shellfish Immunol. 2019, 91, 315–324. [Google Scholar] [CrossRef]
- Dawood, M. A.; Koshio, S.; Ishikawa, M.; Yokoyama, S.; El Basuini, M. F.; Hossain, M. S.; Wei, H. ; Dietary supplementation of β-glucan improves growth performance, the innate immune response, and stress resistance of red sea bream, Pagrus major. Aquac. Nutr. 2017, 23, 148–159. [Google Scholar] [CrossRef]
Disclaimer/Publisher’s Note: The statements, opinions and data contained in all publications are solely those of the individual author(s) and contributor(s) and not of MDPI and/or the editor(s). MDPI and/or the editor(s) disclaim responsibility for any injury to people or property resulting from any ideas, methods, instructions or products referred to in the content. |
© 2023 by the authors. Licensee MDPI, Basel, Switzerland. This article is an open access article distributed under the terms and conditions of the Creative Commons Attribution (CC BY) license (http://creativecommons.org/licenses/by/4.0/).
Copyright: This open access article is published under a Creative Commons CC BY 4.0 license, which permit the free download, distribution, and reuse, provided that the author and preprint are cited in any reuse.


