Submitted:
28 April 2023
Posted:
28 April 2023
You are already at the latest version
Abstract
This paper presents a V2G strategy to flatten the daily load curve by considering the charging and discharging location of the electric vehicle to help understand the effect of the load generated by charging and discharging of the electric vehicle on the power grid. Based on the estimated share of electric vehicles, the assumption that electric vehicles go to work in the morning and leave in the afternoon was set, and the electric vehicle discharge power was calculated by reflecting both the characteristics of vehicles that go to work in the morning and the SMP1 and SMP2 plans. In addition, the electric vehicle charging power was calculated by reflecting the characteristics of vehicles returning home from work in the afternoon and the TOU rate system. In other words, in order to establish an efficient V2G strategy, a charging/discharging type-specific modeling was developed that considered all the characteristics of an electric vehicle commuting vehicle, and charging and discharging daily load using SMP1 and SMP2 rate plans for morning discharge and TOU1 and TOU2 rate plans for afternoon charging were applied. After calculating the curve, this value was compared and analyzed to evaluate the effect on grid leveling by adding the existing load. The analysis provides an accurate understanding of the impact of EV charging and discharging loads on the power grid according to V2G strategies. In this paper, it is helpful to apply EV charge and discharge management technology to avoid grid overload and minimize grid expansion by leveling the grid daily load curve by applying appropriate SMP and TOU rates through the establishment of an efficient V2G strategy by charge and discharge modeling.
Keywords:
V2G strategie
; daily load curve
; charging location
; discharging location
; time-of-use (TOU)
; system marginal price (SMP)
1. Introduction
Efforts to promote plug-in electric vehicles (EVs) are increasing worldwide as part of the fight against air pollution caused by CO2 from automobile exhaust. Therefore, it is expected that the number of electric vehicles connected to the distribution system will increase rapidly in the future. This expansion is expected to ultimately put potential strain on utilities.
Electric power companies and the government are collaborating to predict the electricity demand generated through the charging and discharging of electric vehicle batteries, support related technical standards and trade regulations, and prepare for the global spread of electric vehicles. Therefore, various studies are being conducted on whether the grid can meet the increasing charging and discharging power demand of electric vehicles. However, most studies are focused on evaluating the impact of EV charging on the grid, and studies reflecting the impact of EV charging and discharging on the grid and measures to reduce it are insufficient. Enough [1,2].
Looking at the existing studies, various studies on electric vehicle energy consumption (EV battery charging load) suggest that the large-scale deployment of electric vehicles can have a significant impact on the national power grid and residential distribution system. On the other hand, since there is also a result that electric vehicle charging does not have a significant impact on the national power grid, in countries where the number of electric vehicles is significantly increasing, accurate results of the power grid for charging and discharging of electric vehicles are required according to the circumstances of each country.[3,4,5,6,7].
And some research focuses on studying the optimal location of electric vehicle charging stations. [8]. In particular, in New York City, USA, a study was conducted to distribute grid load and reduce costs by applying an intelligent electric vehicle charging method to charge the electric vehicle load during Valley Fill time [9]. Research is ongoing in Ireland to optimize EV charging cycles using demand-side management (DSM) to reduce consumer costs and reduce peak load demand on the grid [10]. In another study [11], an electric vehicle scheduling algorithm was developed to meet the charging requirements of electric vehicle owners through the impact analysis of DRM (Demand Response Management). Another study conducted in Winnipeg, Canada [12] used vehicle usage data to predict and analyze electric vehicle charging through probabilistic methods.
There is also a study of electric vehicle timeout (TOU) charges required to minimize the impact of electric vehicle charging on the grid. However, there are not enough studies on how flat the daily load curve of the metropolitan power grid is for charging and discharging electric vehicles based on TOU and System Marginal Price (SMP) rates.
Namely, several studies have explored TOU tariff system models to minimize EV charging costs in regulated markets [13] and conducted studies to reduce the impact of EV charging on the grid. [14,15]. However, most studies focus on sequential charging proposals, reducing power loss, lowering charging rates for electric vehicle owners, TOU strategies for peak reduction, and implementing electric vehicle charging stations using energy storage devices (ESSs). In other words, there are few related studies that have analyzed the effect of flattening the daily load curve of the grid due to charging and discharging of electric vehicles through the establishment of an efficient V2G strategy based on both TOU and SMP rates targeting the metropolitan area.
To address these challenges, it is essential to evaluate the impact of EV charging and discharging on the wide-area grid and a V2G strategy to reduce the impact on the grid.
Typically, most EV owners in large cities use their cars for commuting. Therefore, they want to charge and discharge their electric vehicles at work or at home. Therefore, in order to minimize the impact of electric vehicle charging and discharging on the system, it is necessary to model and calculate the effect of electric vehicle charging and discharging on the system according to the charging and discharging location of the home and workplace.
Therefore, in this study, an efficient V2G strategy was established based on the TOU and SMP plans based on the location of electric vehicle charging and discharging in the metropolitan area, and a method for calculating the daily load curve for electric vehicle charging and discharging was presented. Specifically, assuming EV supply scenarios in 2030 and 2040, the results of V2G strategy research to flatten the daily load curve by applying a method of inducing electric vehicle discharge at work in the morning and electric vehicle charging at home in the afternoon are applied. presented.
2. Daily Load Curve’s Evaluation Method
In this chapter, a method for evaluating daily load curves for vehicle charging and discharging at various charging and discharging locations in large cities is proposed. The charge/discharge load estimation assumes that people start charging their EVs from the grid after they get home from work in the afternoon.
To mitigate grid peaks, it was also assumed that people would discharge electricity to the grid via their vehicles after going to work in the morning.
The share of electric vehicles was estimated based on the scenarios of the share of electric vehicles in Seoul, Korea in 2030 and 2040 through the long-term plan for electric vehicles in Seoul.
Then, by combining the KEPCO SMP and TOU rates with the discharge and charge rates, the charge and discharge daily load curves for Seoul in 2030 and 2040 were calculated.
The steps for this method are described below.
1) Calculation of electric vehicle discharge probability density function at work in the morning;
2) Calculate electric vehicle charging probability density function at home after work in the afternoon;
3) Calculate the initial state of charge (SOC) of EV batteries at work and at home;
4) Calculation of electric vehicle charging/discharging power per hour using the charge/discharge probability density function of the electric vehicle and the SOC state of the electric vehicle battery at work and home;
5) Calculate the daily load curve for charging and discharging electric vehicles in Seoul in 2030 and 2040 using the charging and discharging power of electric vehicles by charging and discharging time of electric vehicles at work or at home;
Through the proposed calculation method, accurate daily load curve data was provided based on the charging and discharging load of electric vehicles at work and at home in Seoul. In addition, it is expected to provide a basis for establishing a billing TOU, SMP rates, and load management plans to prevent overload of the grid system in Seoul.
2.1. Charging and discharging modeling of EVs by locations
For an analysis of grid impact based on EVs’ charging and discharging locations, the amount of traffic flowing in and out of downtown Seoul was analyzed based on data from the Seoul Metropolitan Police Agency’s Comprehensive Traffic Information Center (Seoul Metropolitan Police Agency) [16]. Figure 1 presents the analysis results.
As shown in Figure 1, traffic entering the city on the way to work peaks between 7:00 am and 9:00 am, but traffic flowing out of the city after work is evenly distributed from 5:00 pm to midnight. can be seen to be distributed.
In this paper, the following assumptions are made about the inflow and outflow of vehicles in the city to evaluate the impact of the grid on EV charging and discharging.
1) Coming to work (incoming vehicle - outgoing vehicle) → EV discharge (6:00 am - 3:00 pm)
2) Leaving work (outbound vehicle-inbound vehicle)→EV charging (16:00~5:00).
Based on these assumptions, the traffic data model was used as an uncontrolled mode due to the difference between EV inflow and outflow. In addition, for the control mode, a model that applies both the non-control mode traffic data model and the EV charging/discharging rate model was used.
Here, the SMP and TOU rate data presented in KEPCO [17] were used as the charge/discharge rate model applied to the control mode.
2.1.1. Probability density function of EVs discharging start time at the workplace
First, it was assumed that the discharge probability density function during EV work was an uncontrolled mode calculated by subtracting the difference between the hourly outflow traffic volume and the inflow traffic volume in downtown Seoul, considering the driving time of 1 hour in the morning (Equation 1).
Second, in the case of the control mode to minimize the effect on the system, it is calculated as in Equation (2) by considering the driving time of 1 hour and applying the difference between the hourly inflow and outflow traffic in the city center and the SMP rate system. Here, the probability density function of the discharge start time at the work place is calculated based on Equation (1) since it is assumed that the EV entering the city is used for driving to the work place.
Therefore, it was assumed that these EVs start discharging after a certain time (eg, 1 hour) after entering the city. The probability density function at the start time of attendance in the controlled charging mode was calculated based on Equation (2) because the higher the SMP rate, the higher the probability that the EV will be discharged after going to work.
Formula 1. Probability of discharging start time at work (uncontrolled mode)
Formula 2. Probability of discharging start time at work (controlled mode)
Table 1 shows the estimated emission probability density in the uncontrolled mode workplace considering the difference in traffic volume going to and from the city center. In addition, Table 1 shows the discharge probability density results including SMP rates for comparison with probability density using simple traffic modeling. On the other hand, unlike Table 1, Table 2 presents the discharge probability density in the control mode in which the SMP rate is greatly adjusted during peak times.
2.1.2. Probability density function of EVs charging start time at home
As assumed before, the hourly charging probability density function for electric vehicles at home is applied to the difference between hourly inflow and outflow traffic based on one-hour driving time to work in Seoul in the morning. calculated uncontrolled mode (formula 3). Control modes for minimizing grid effects were calculated as in equation (4) by applying the difference between inflow and outflow traffic and TOU charges over time.
The probability density function of the uncontrolled mode charging start time at home is calculated according to equation (3) for electric vehicles departing from the city center used by owners to drive from work to home outside the city. increase. Moreover, these electric vehicles are likely to be charged after a certain amount of time (say an hour) away from the city center.
The reason why the probability density function for the control mode charging start time at home is calculated according to equation (4) is that the electric vehicle is likely to be charged during the time period when the TOU charge is low after arriving at home.
Formula 3. Probability of charging start time at home (uncontrolled mode)
Formula 4. Probability of discharging start time at home (controlled mode)
Table 3 shows the expected charging probability density in the uncontrolled mode household considering the difference between incoming and outgoing traffic. In addition, Table 3 shows the charging probability density results including TOU rates for comparison with the charging probability density using only traffic modeling. Table 4 shows the charging probability densities in the control mode where TOU rates are tuned lower during the afternoon hours.
2.1.3. Analysis of the probability density function for EVs’ charging and discharging
As shown in the discharge probability density function of uncontrolled discharge and controlled discharge in the workplace shown in Table 1, in the case of uncontrolled mode, the probability density gradually increases from 6:00 am to 8:00 am, and then gradually decreases from 9:00 am. do. It can be seen that the rate of decrease increases in the afternoon. In particular, the discharge probability density is maximum at 8 AM.
In the case of control mode 1, the difference is small due to the influence of SMP deliberation, but the probability density is somewhat higher than that of non-control mode. However, for control mode 2 (Table 2), unlike control mode 1, the probability density increases from 6:00 AM to 7:00 AM, increases rapidly from 8:00 AM to 9:00 AM, stays almost the same until noon, and then changes slowly decreases. In particular, it reaches its maximum between 8:00 am and 9:00 am. The difference between control mode 1, control mode 2 and non-control mode is determined to be caused by the fact that SMP rates are relatively high from 8:00 am to 2:00 pm.
In addition, as shown in the charging probability density function of uncontrolled discharge and controlled discharge in the home shown in Table 3, it can be seen that the probability density gradually increases from 4:00 pm to 8:00 pm in the case of uncontrolled mode. there is. After that, it gradually decreases until 11:00 PM, and it can be seen that it decreases rapidly from midnight to around 5:00 AM. In particular, the charge probability density is maximum at 8 PM. On the other hand, the results of the control mode are not significantly different from those of the non-control mode. However, control mode 1 shows a relatively low afternoon charging probability density and a slightly higher charging probability density from midnight to 5:00 AM due to the influence of the TOU tariff. The reason is that TOU tariffs are very low from 11pm to dawn. However, as shown in Table 3, in the case of control mode 2, it can be seen that the probability density is slightly lower in the afternoon and slightly higher in the morning than in control mode 1.
2.1.4. Calculating the SOC Condition of the EV Battery
The battery’s SOC condition when going to and leaving work can be calculated according to the average mileage information predetermined for charging and discharging EVs. Thus, SOC0 is calculated by taking into account daily driving distance and maximum EVs driving distance. Then, The daily commuting distance of 46.2 km was applied by quoting the Vehicle Mileage Analysis Report of the Seoul Metropolitan Government Korea Transportation Safety Authority [18] to calculate the initial SOC0 for the workplace or home locations.
Hence, considering the 46.2 km of commuting distance in Seoul, the remaining battery’s SOC at work and home is 21.6 kWh considering BERR reports [19]. In other words, the battery’s initial SOC0 status for charging and discharging EVs after going to or leaving the workplace is as following formula (5)
46.2km × 0.16kWh/km = 7.4kWh
SOC0 = 29kWh – 7.4kWh = 21.6kWh
The electric vehicle's charging and discharging power consumption at work and home after work was calculated by assuming that 10% (2.9 kWh) of the battery capacity for emergency movement remains in the initial SOC0 of the battery. In addition, considering the hourly charging and discharging characteristic curve of a 29 kWh lithium-ion battery, the time required for charging and discharging of an electric vehicle for charging and discharging power at work and at home was calculated from Equations (6) to (9).
Discharging power consumption
SOC0(21.6kWh) - 2.9kWh = 18.7kWh
Charging power consumption
29kWh – 2.9kWh = 26.1kWh
Discharging time at work
18.7kWh / 6.5kW ≒ 2.75h
Charging time at home
26.1kWh / 6.5kW ≒ 4.00h
2.2. Grid impact analysis by EV charging and discharging modelling through V2G strategy
In Section 2.1, charge/discharge model algorithms for each location at home and work and charge/discharge probability density functions for controlled and uncontrolled modes were proposed. That is, the daily charge/discharge load curve of the electric vehicle battery was calculated considering the charge/discharge probability density function, the initial SOC state of the electric vehicle, the charge/discharge time, and the charge/discharge power per hour.
The number of electric vehicles was calculated by setting the share of electric vehicles to 10% and 30% of total vehicles in 2030 and 2040, respectively. Specifically, through the V2G charging and discharging strategy of non-control mode and control mode, the partial load for charging and discharging of one EV is first calculated, and this value is applied to the total number of electric vehicles for the year to calculate the EV charging and discharging load curve. .
In addition, the existing daily load curve in Seoul was calculated based on the results of the load pattern analysis of the acceptance standard of the Korea Energy Management Corporation in 2018 [20]. Figure 5 shows the result of calculating the conventional daily load curve.
Based on Figure 5, a regression analysis method was applied to calculate the existing load curves for Seoul in 2030 and 2040. In addition, considering the existing load curve and the V2G charge/discharge strategy curve that reflects the electricity rate system presented in Figure 2, Figure 3 and Figure 4, the entire partial subsurface curve for Seoul, Korea was calculated, and the detailed overall flow chart is shown in Figure 6 below.
According to the flowchart shown in Figure 6, the total load curve was calculated by adding the existing load in Seoul in 2030 and 2040 and the electric vehicle charging and discharging loads calculated through non-control mode, control mode 1, and control mode 2.
Figure 7, Figure 8, Figure 9, Figure 10, Figure 11 and Figure 12 shows the total load curve for Seoul by adding the V2G daily load curve and the existing daily load curve.
As shown in Figure 7, Figure 8, Figure 9 and Figure 10, the existing daily load curves in 2030 and 2040 increase until 1:00 PM, peak around 2:00 PM, and gradually decrease from 6:00 PM.
On the other hand, in the case of electric vehicle charge/discharge load, discharge starts at 6:00 am (workplace discharge time) in non-control mode, and from this point on, the discharge load gradually increases, becomes flat at 9:00 am, and then decreases. The discharge load curve of the control mode 1 shows a similar behavior to that of the non-control mode, but the discharge load is higher due to the SMP rate system. Control mode 2 differs from control mode 1 in that the discharge load remains much higher and continues until grid peak. Overall, the control modes related to SMP freight rates show a lower discharge rate in the morning and a higher discharge rate in the afternoon than the non-controlled mode, and it can be seen that control mode 2 is the most efficient for grid peak reduction.
In addition, looking at the household charging load curves in 2030 and 2040, in the case of the uncontrolled type, the charging load gradually increases from 6:00 pm (home charging time), peaks at 10:00 pm, and gradually decreases until late at night. Control mode 1 shows a similar pattern, but due to the TOU rate system, the charging power is relatively lower in the afternoon and higher in the middle of the night than in the non-controlled mode. Control mode 2 differs from control mode 1 in that the charging power is lower in the afternoon and higher at night. Overall, the control mode related to TOU rates shows higher charging power in the morning and late night than the uncontrolled mode.
Therefore, the following conclusions can be drawn by synthesizing the daily load curves of non-control mode, control mode 1, and control mode 2 in 2030 and 2040.
First, when the share of electric vehicles is 10% (as of 2030), both control mode 1 and non-control mode 2 do not show high charge and discharge loads at home and at work. Therefore, in uncontrolled mode, the total load increases by 1-2% from late at night to 10:00 am (off-peak hours). Between 11 am and 5 pm (peak time), it decreases by 1~4% in control mode 1 and non-control mode 2. Therefore, by applying the TOU and SMP rates, morning load can be increased and afternoon load can be reduced.
Second, when the share of electric vehicles is 30% (by 2040), control mode 1 and control mode 2 show high charging and discharging loads at home and at work. In the case of control mode 1, the total load increases by 2-3% from late at night to 10:00 am (off-peak time), and decreases by 3-9% between 11:00 am and 5:00 pm. (peak time). In the case of control mode 2, it increases by 3 to 5% from late at night to 10:00 am (free time), and decreases by 6 to 15% between 11:00 am and 5:00 pm. (peak time).
In conclusion, as part of a V2G strategy, TOU and SMP rates can significantly increase morning load and reduce afternoon load. In particular, control mode 2 can most effectively flatten the daily load curve in Seoul compared to other modes, confirming that the EV charging and discharging strategy, that is, the V2G rate system, is very appropriate.
3. Conclusion
According to the estimation of the share of electric vehicles in Seoul in 2030 and 2040, the amount of electric vehicle charge and discharge for the corresponding year was calculated based on the conditions of electric vehicle discharge in the morning and electric vehicle charging in the afternoon. More specifically, considering whether or not the charging and discharging rate system is reflected, the daily load curve for charging and discharging electric vehicles for the year is calculated by dividing it into non-controlled mode (based on vehicle operation time) and control mode (SMP and TOU rates + number of vehicle operations per hour) This value was added to the existing daily load curve to calculate the daily load curve for Seoul for that year.
The results of this paper provide an accurate picture of how much the V2G strategy contributes to daily load flattening by charging and discharging loads of electric vehicles at workplaces and homes in Seoul. In other words, this study proposes a strategy for establishing SMP rate and TOU rate management plan to flatten the daily load curve of the Seoul power system and prevent overload through V2G strategy.
Funding
This research was funded by the Korea Institute of Energy Technology Evaluation and Planning (Grant No. 20192010107050).
References
- “A Technical Overview of Transportation Electrifica -tion”, EPRI Technical Report, 2011.
- Qian, K.; Zhou, C.; Allan, M. Modeling of load demand due to EV battery charging in distribution systems. IEEE Transactions on Power Apparatus and Systems 2011, 26, 802–810. [Google Scholar] [CrossRef]
- K. Clements-Nyns; E. Haesen et al. The impact of charging plug-in-hybrid electric vehicles on a residential distribution grid. IEEE Transactions on Power Systems 2010, 25, 371–380. [CrossRef]
- L. Zhao, S; Prousch et al. Simulation methods for assessing electric vehicle impact on distribution grid. Simulation methods for assessing electric vehicle impact on distribution grid. IEEE PES Transmission and Distribution conference and exposition 2010.
- H. Son and K. Kook. Stochastic modeling of plug-in hybrid vehicle distribution in power systems. JEET 2013, 8, 1276–1282.
- S.B.Choi. Load variation analysis by bus of distribution systems based on EVs charging modeling. Electrical Engineering 2018, 100, 687–694. [CrossRef]
- J. T. Saliah. Energy requirements for electric cars and their impacts on electric generation and distribution systems. IEEE Trans. Ind. Appli. 1973, 1A-9, 516–531.
- Long JIA, Zechun HU, et al. Optimal siting and sizing of electric vehicle charging station. Automation of Electric Power Systems 2012, 3, 54–59. [Google Scholar]
- Valentine K, Temple W G, Zhang K M. Intelligent electric vehicle charging: Rethinking the valley-fill. Journal of Power Sources 2011, 196, 10717–10726. [Google Scholar] [CrossRef]
- Finn P, Fitzpatrick C, Connolly D. Demand side management of electric car charging: Benefits for consumer and grid. Energy 2012, 42, 358–363. [Google Scholar] [CrossRef]
- Kumar K N, Tseng K J. Impact of demand response management on chargeability of electric vehicles. Energy 2016, 111, 190–196. [Google Scholar] [CrossRef]
- Ashtari A, Bibeau E, Shahidinejad S, et al. EV charging profile prediction and analysis based on vehicle usage data. IEEE Transactions on Smart Grid 2011, 3, 341–350.
- Masoum A S, Deilami S. Smart load management of plug-in electric vehicles in distribution and residential networks with charging stations for peak shaving and loss minimization considering voltage regulation. IET Generation 2012, 8, 877–888. [Google Scholar]
- Yijia Cao, Shengwei Tang et al. An optimized EV charging model considering TOU price and SOC curve. IEEE Transactions on Smart Grid 2012, 3, 388–393. [Google Scholar] [CrossRef]
- Datchanamoorthy S, Kumar S. Optimal Time of use Pricing For Residential Load Control. Optimal Time of use Pricing For Residential Load Control. Smart Grid Communications 2012, 375–380. [Google Scholar]
- "2020 Seoul City Traffic Census", Seoul Metropolitan Police Agency, 2018 .
- "KEPCO Electric Vehicle Charging TOU/SMP Tariff", Cyber.kepco.co. 2018.
- "2020 Analysis for actual condition Survey of vehicle mileage", Seoul Traffic Safety Complex, 2018.
- "Investigation into the Scope for the Transport Sector to Switch to Electric Vehicles and Plug-in Hybrid Vehicles", Department for Transport, BERR, 2008.
- "2018 Analysis of Electric load pattern by customer in Korea", Korea Energy Management Corporation, 2019 .
Figure 1.
Inflow and Outflow Traffic Data for Downtown Seoul.
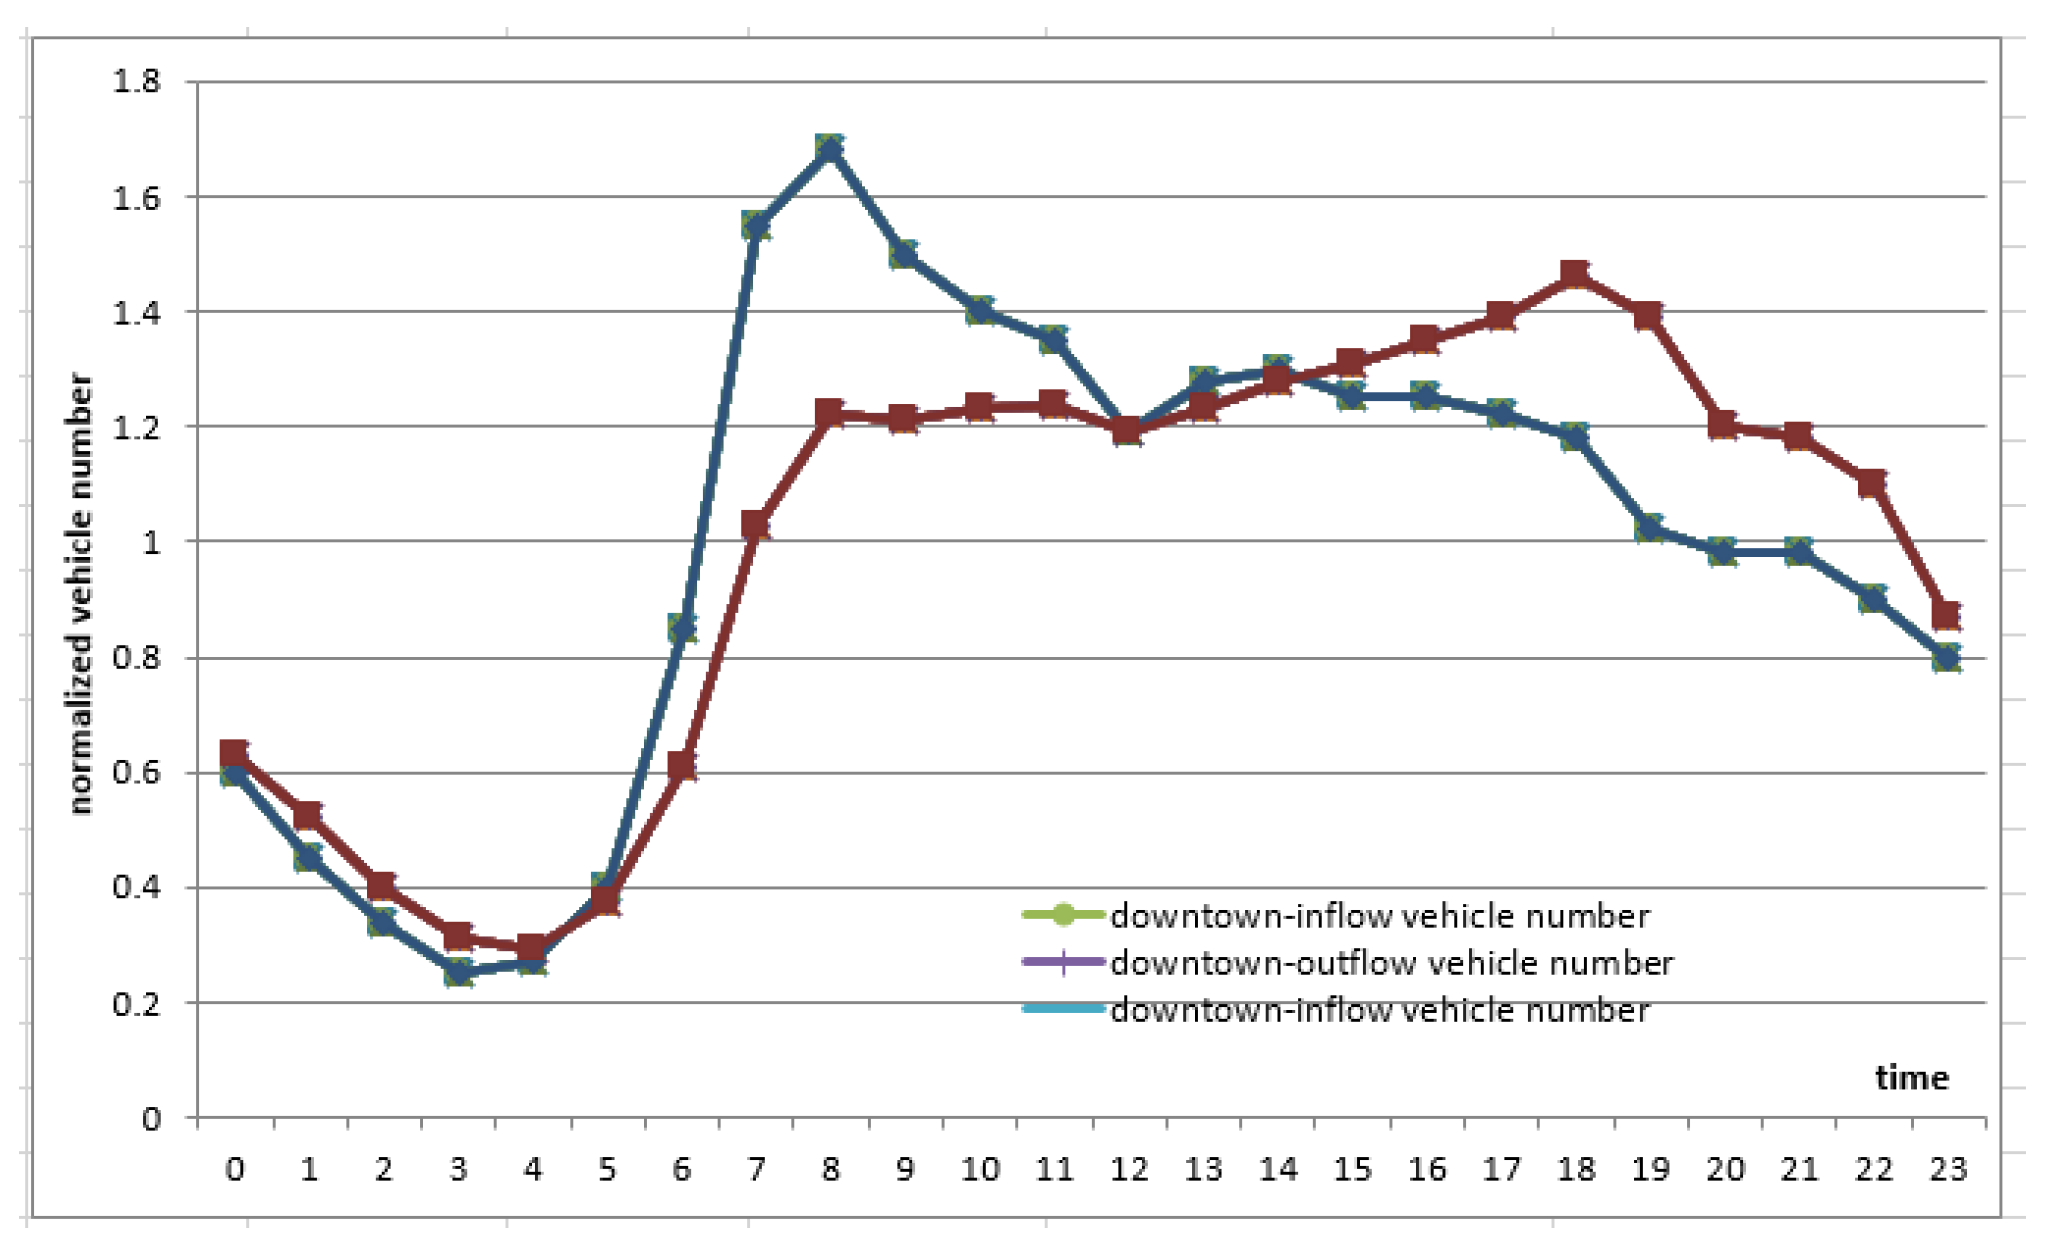
Figure 2.
Charging and Discharging Probability Density Function by Hour for the Uncontrolled Mode (vehicle operation).
Figure 2.
Charging and Discharging Probability Density Function by Hour for the Uncontrolled Mode (vehicle operation).
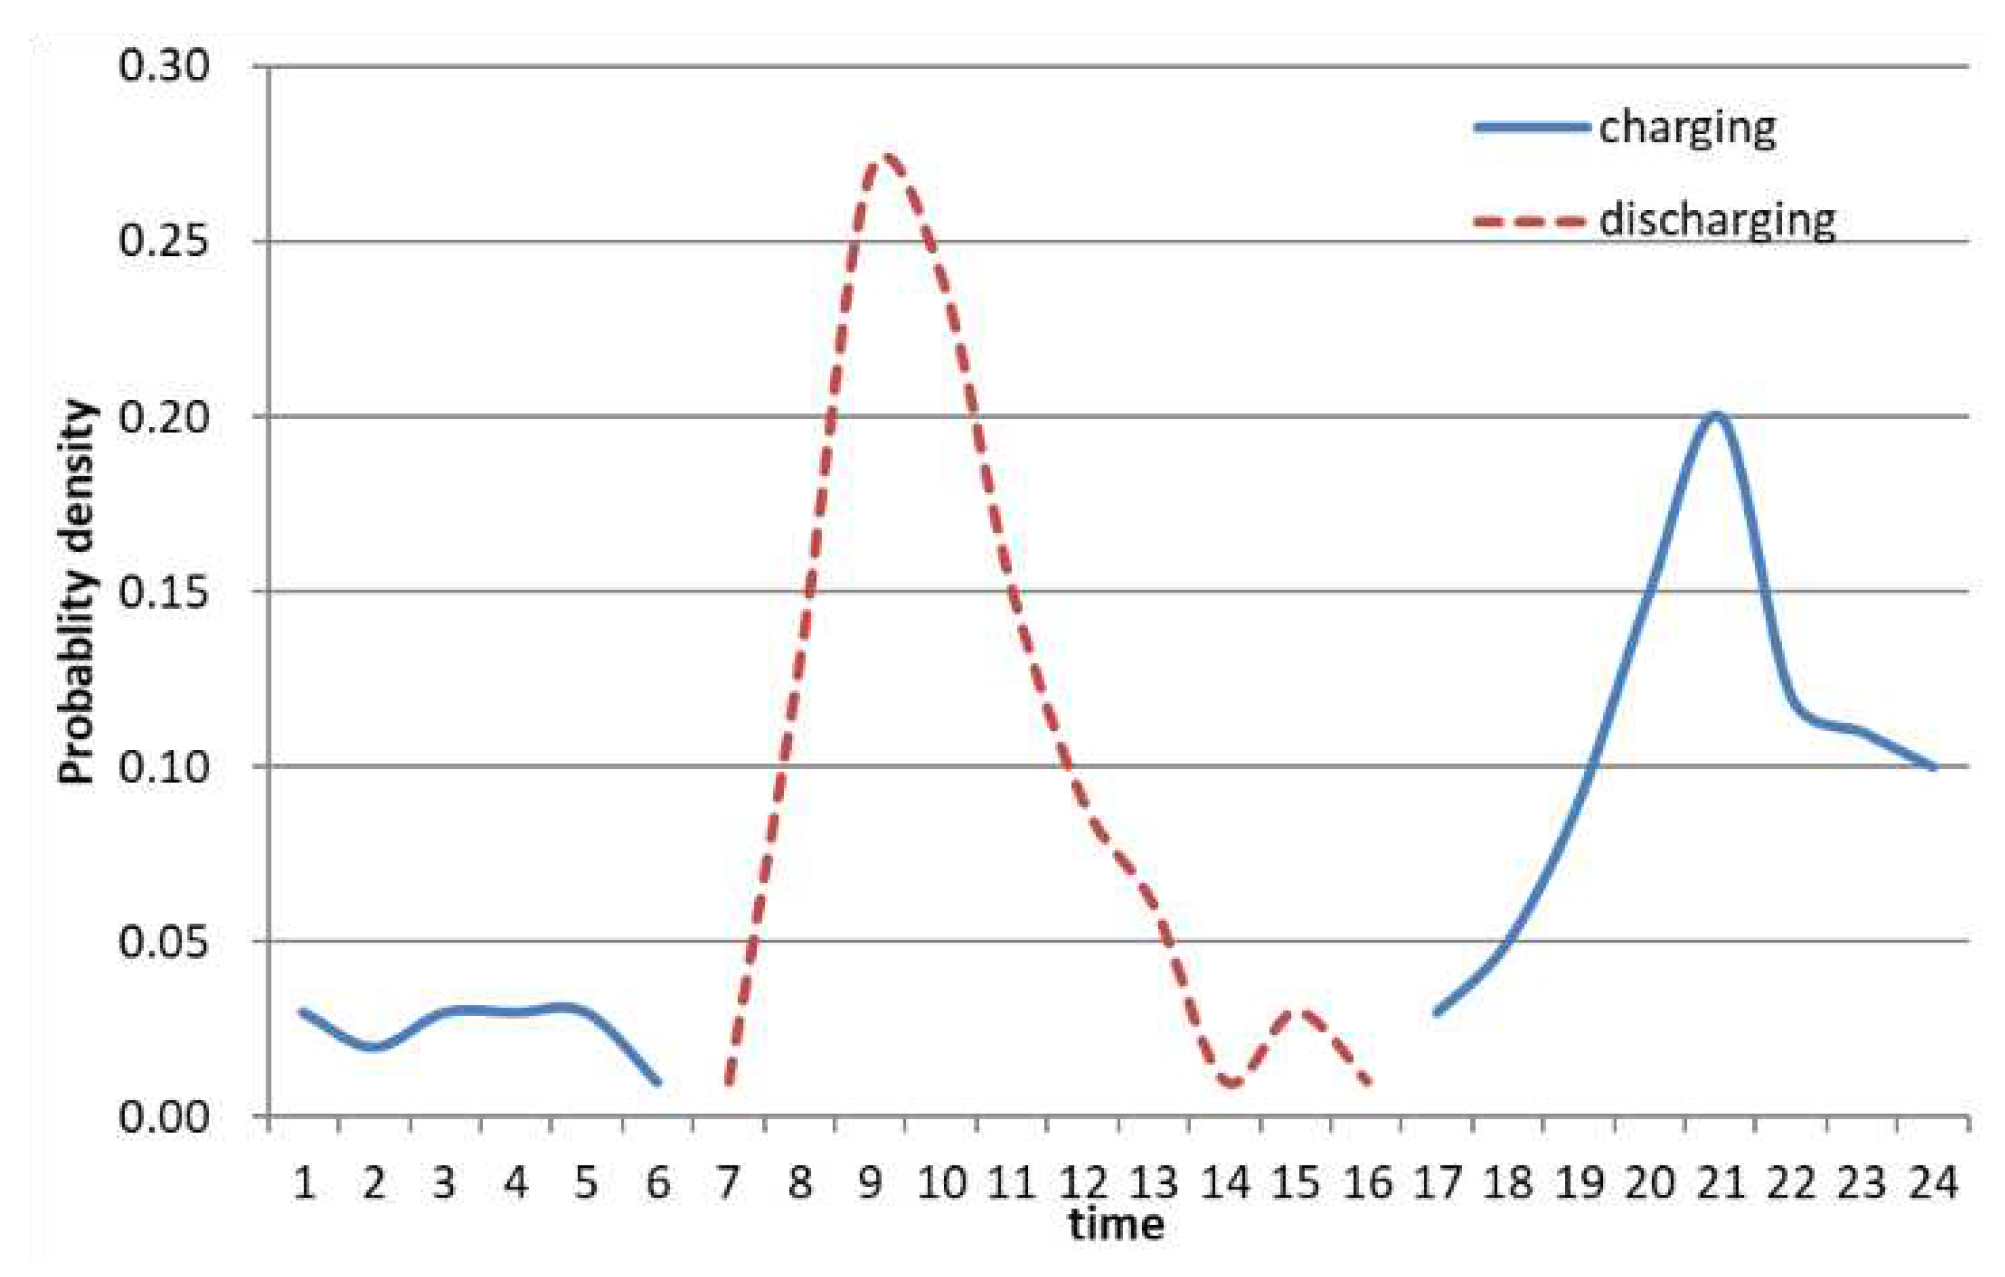
Figure 3.
Charging and Discharging Probability Density Function by hour for the Controlled Mode1 (vehicle operation + SMP1, TOU1 tariff).
Figure 3.
Charging and Discharging Probability Density Function by hour for the Controlled Mode1 (vehicle operation + SMP1, TOU1 tariff).
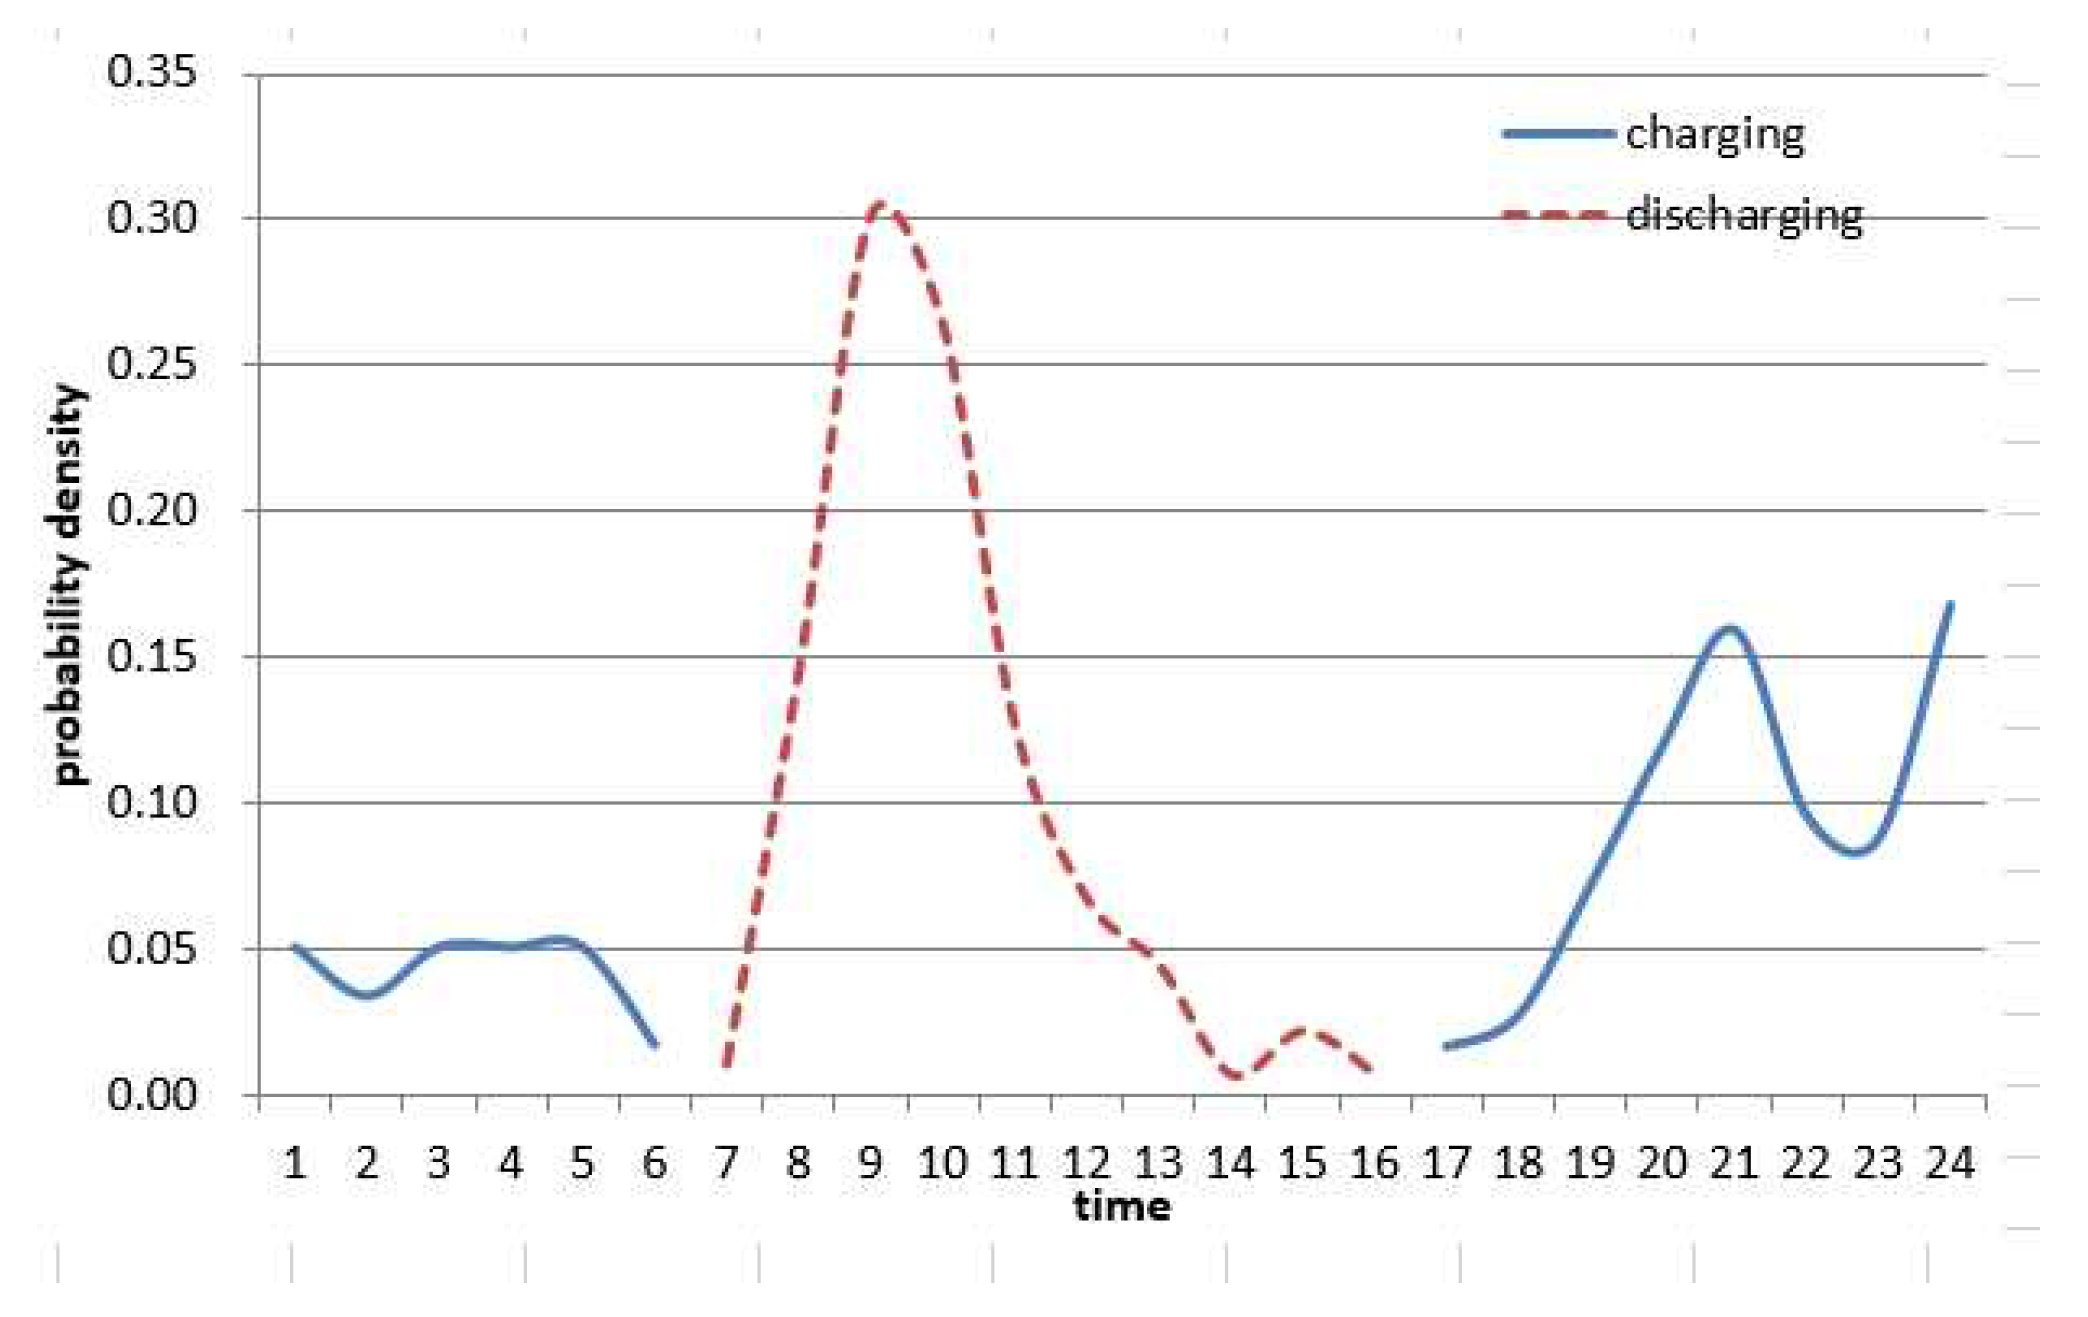
Figure 4.
Charging and Discharging Density Function by hour for the Controlled Mode2 (vehicle operation + SMP2, TOU 2 tariff).
Figure 4.
Charging and Discharging Density Function by hour for the Controlled Mode2 (vehicle operation + SMP2, TOU 2 tariff).
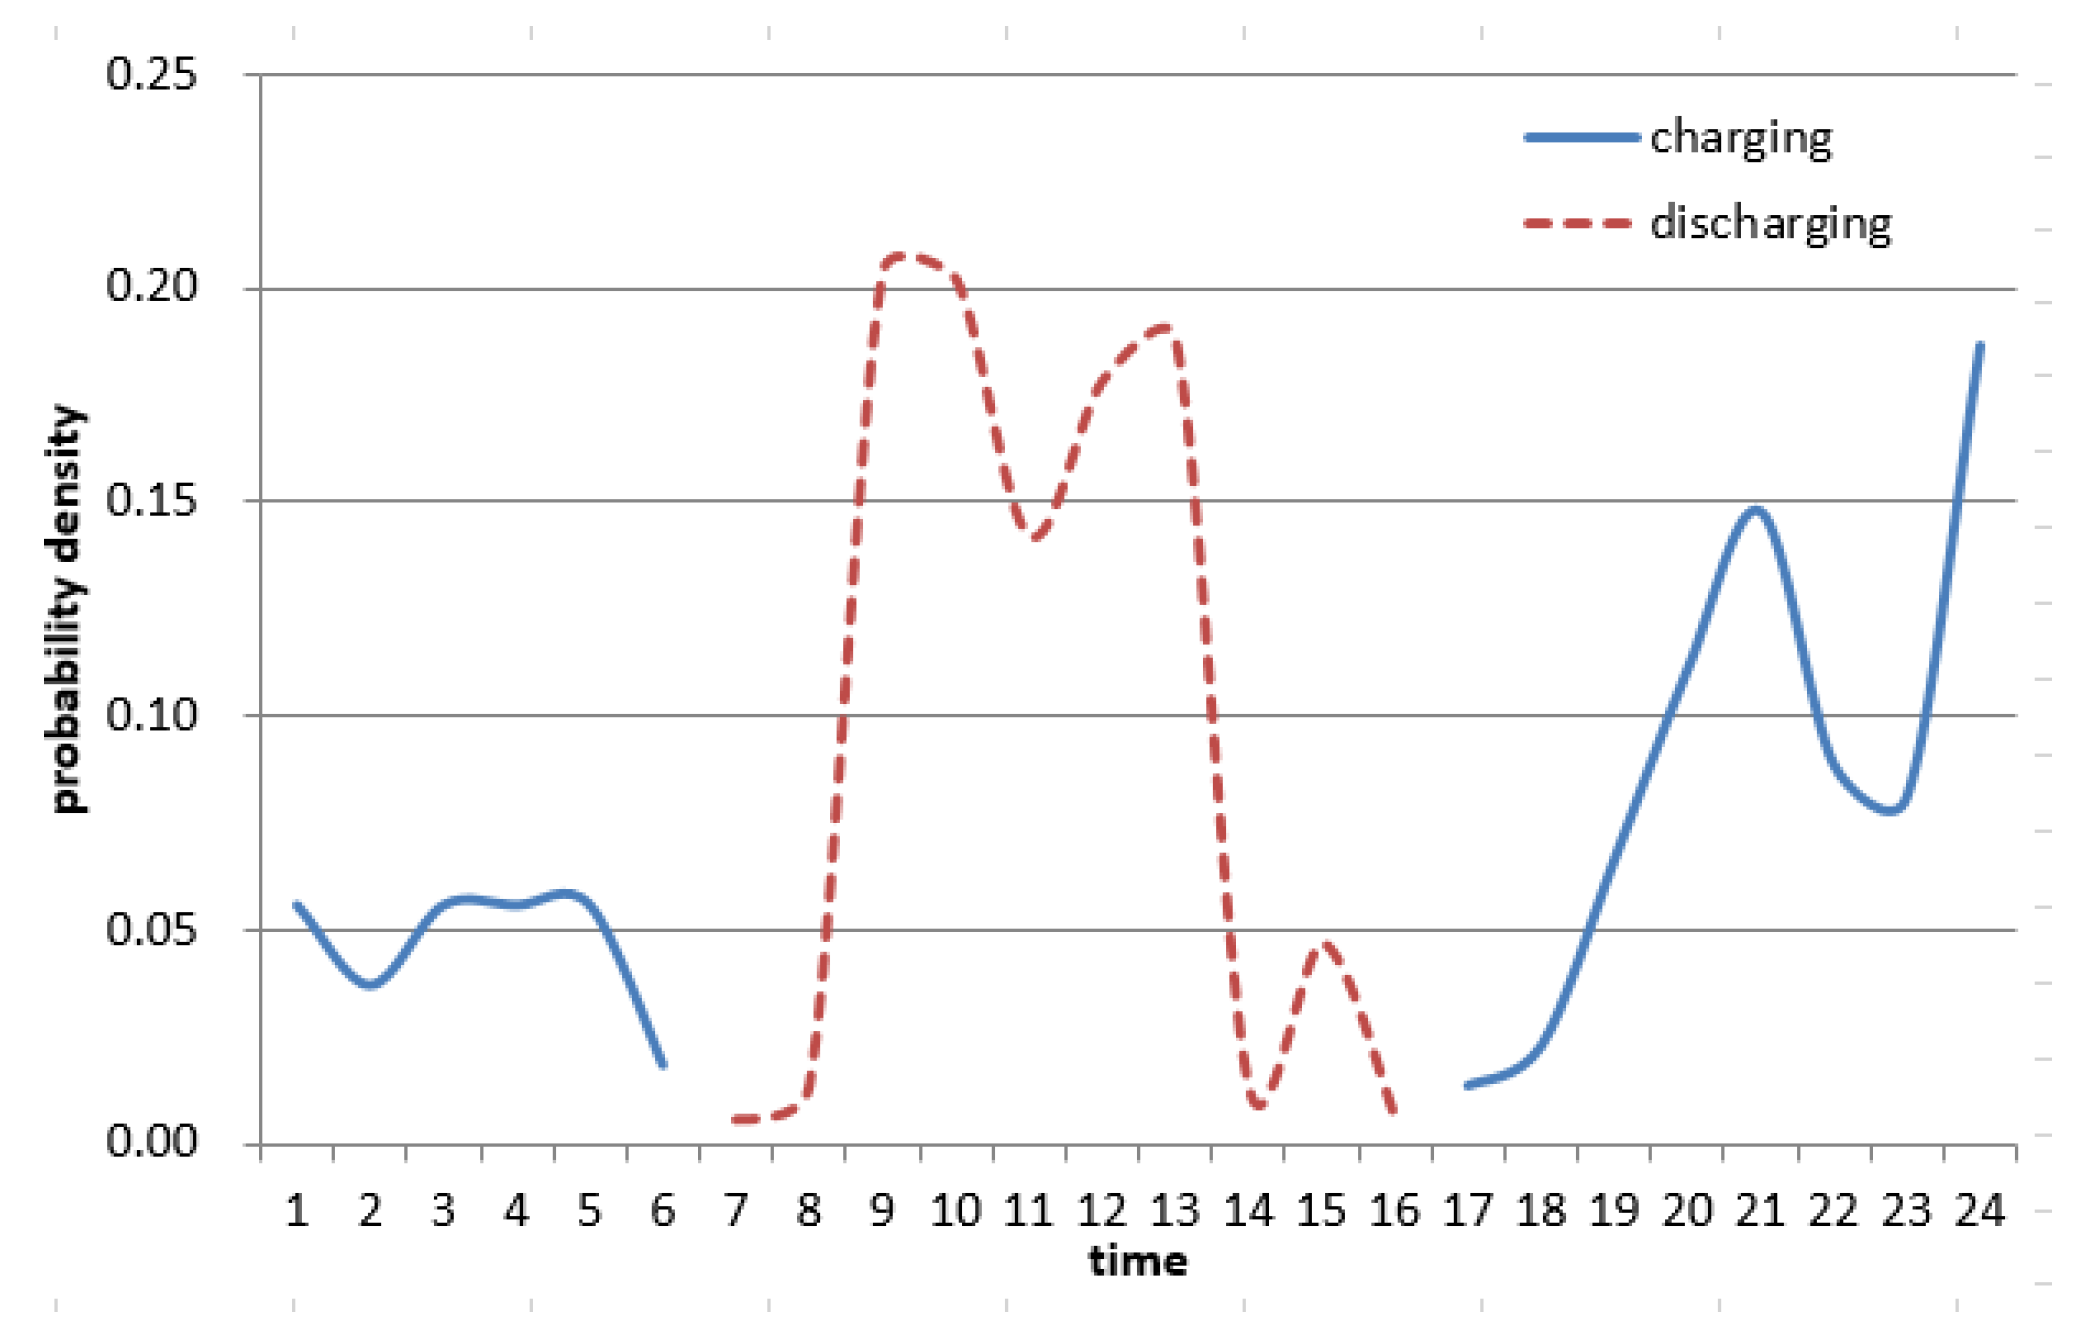
Figure 5.
Exising Daily Load Curve in Seoul, South Korea.
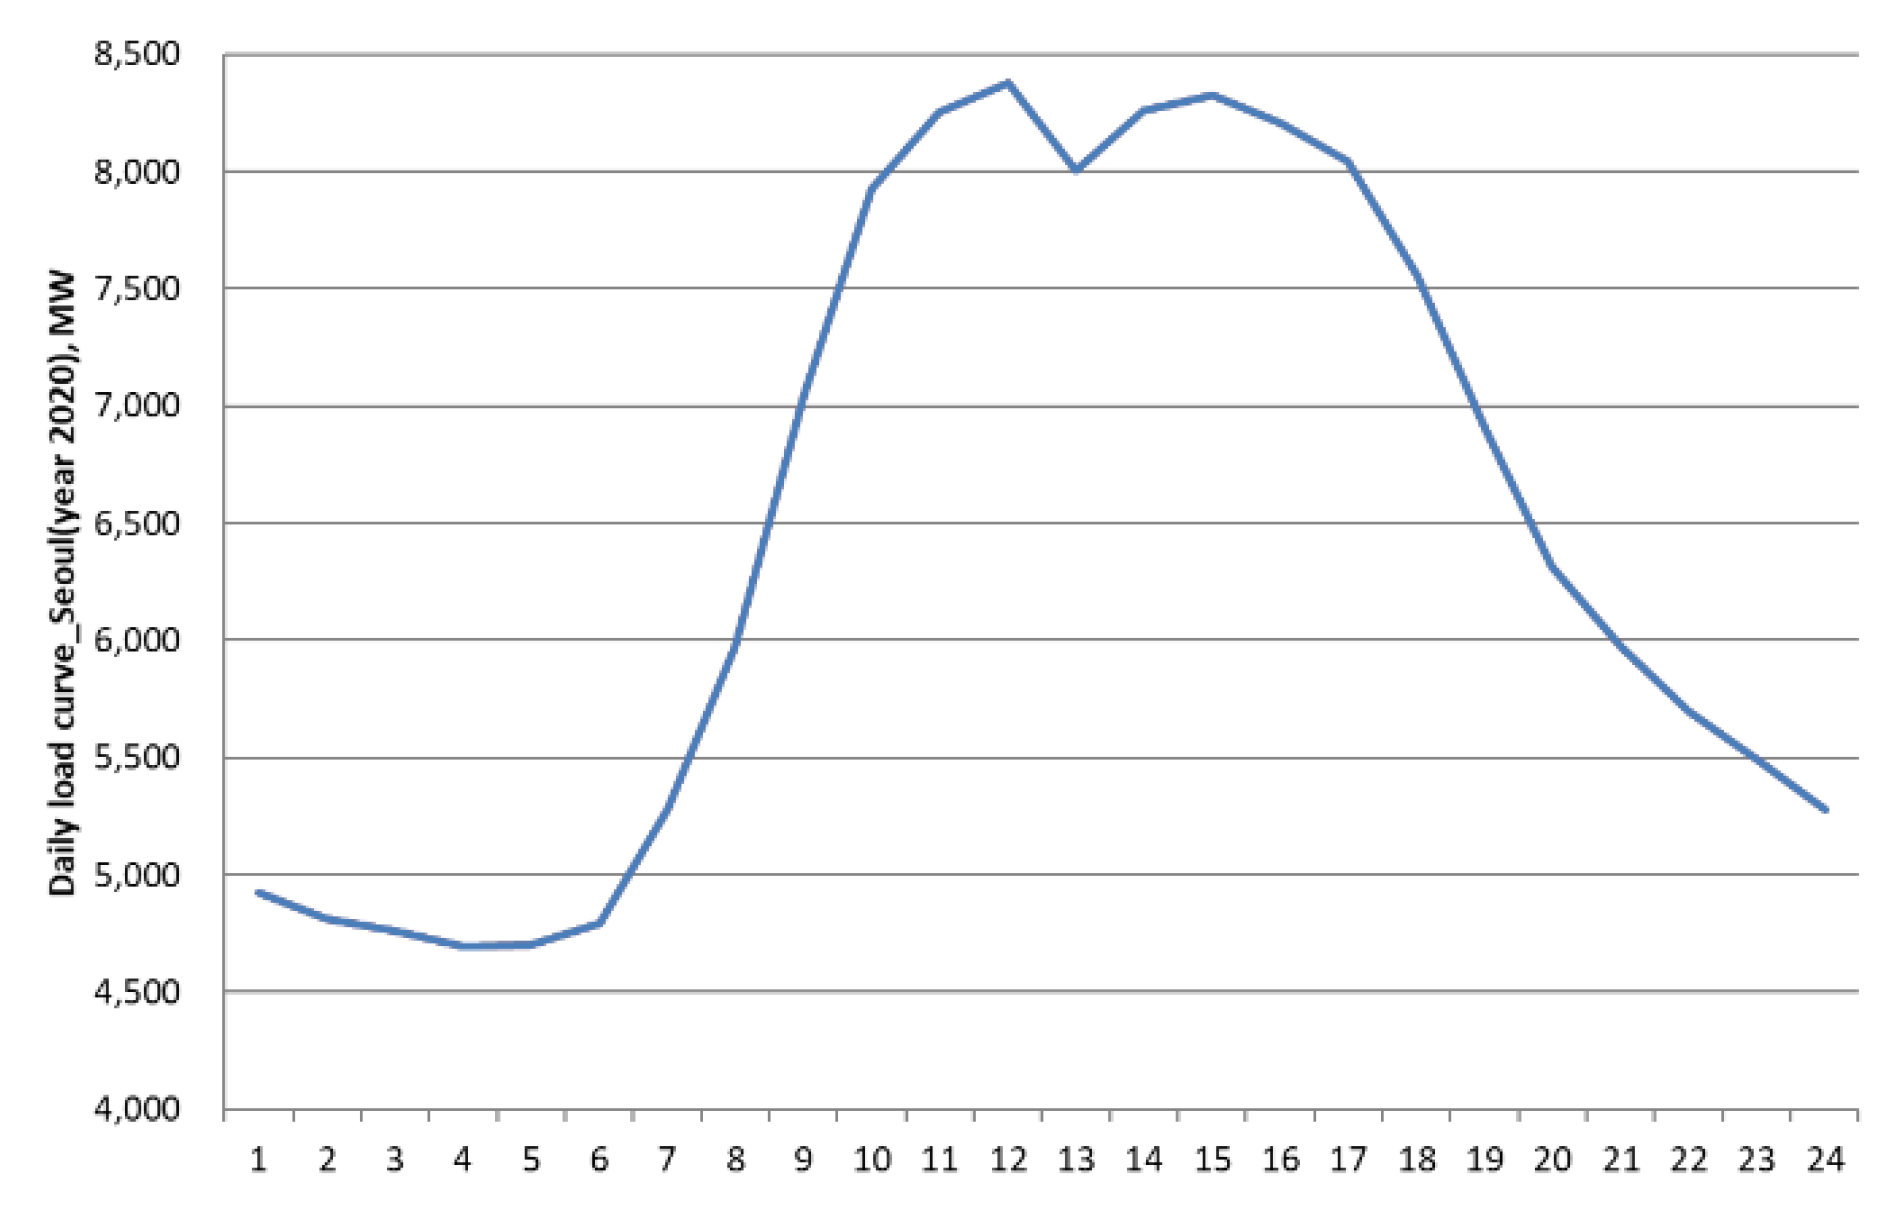
Figure 6.
Flow chart of daily load curve calculation through V2G strategy in Seoul, Korea.
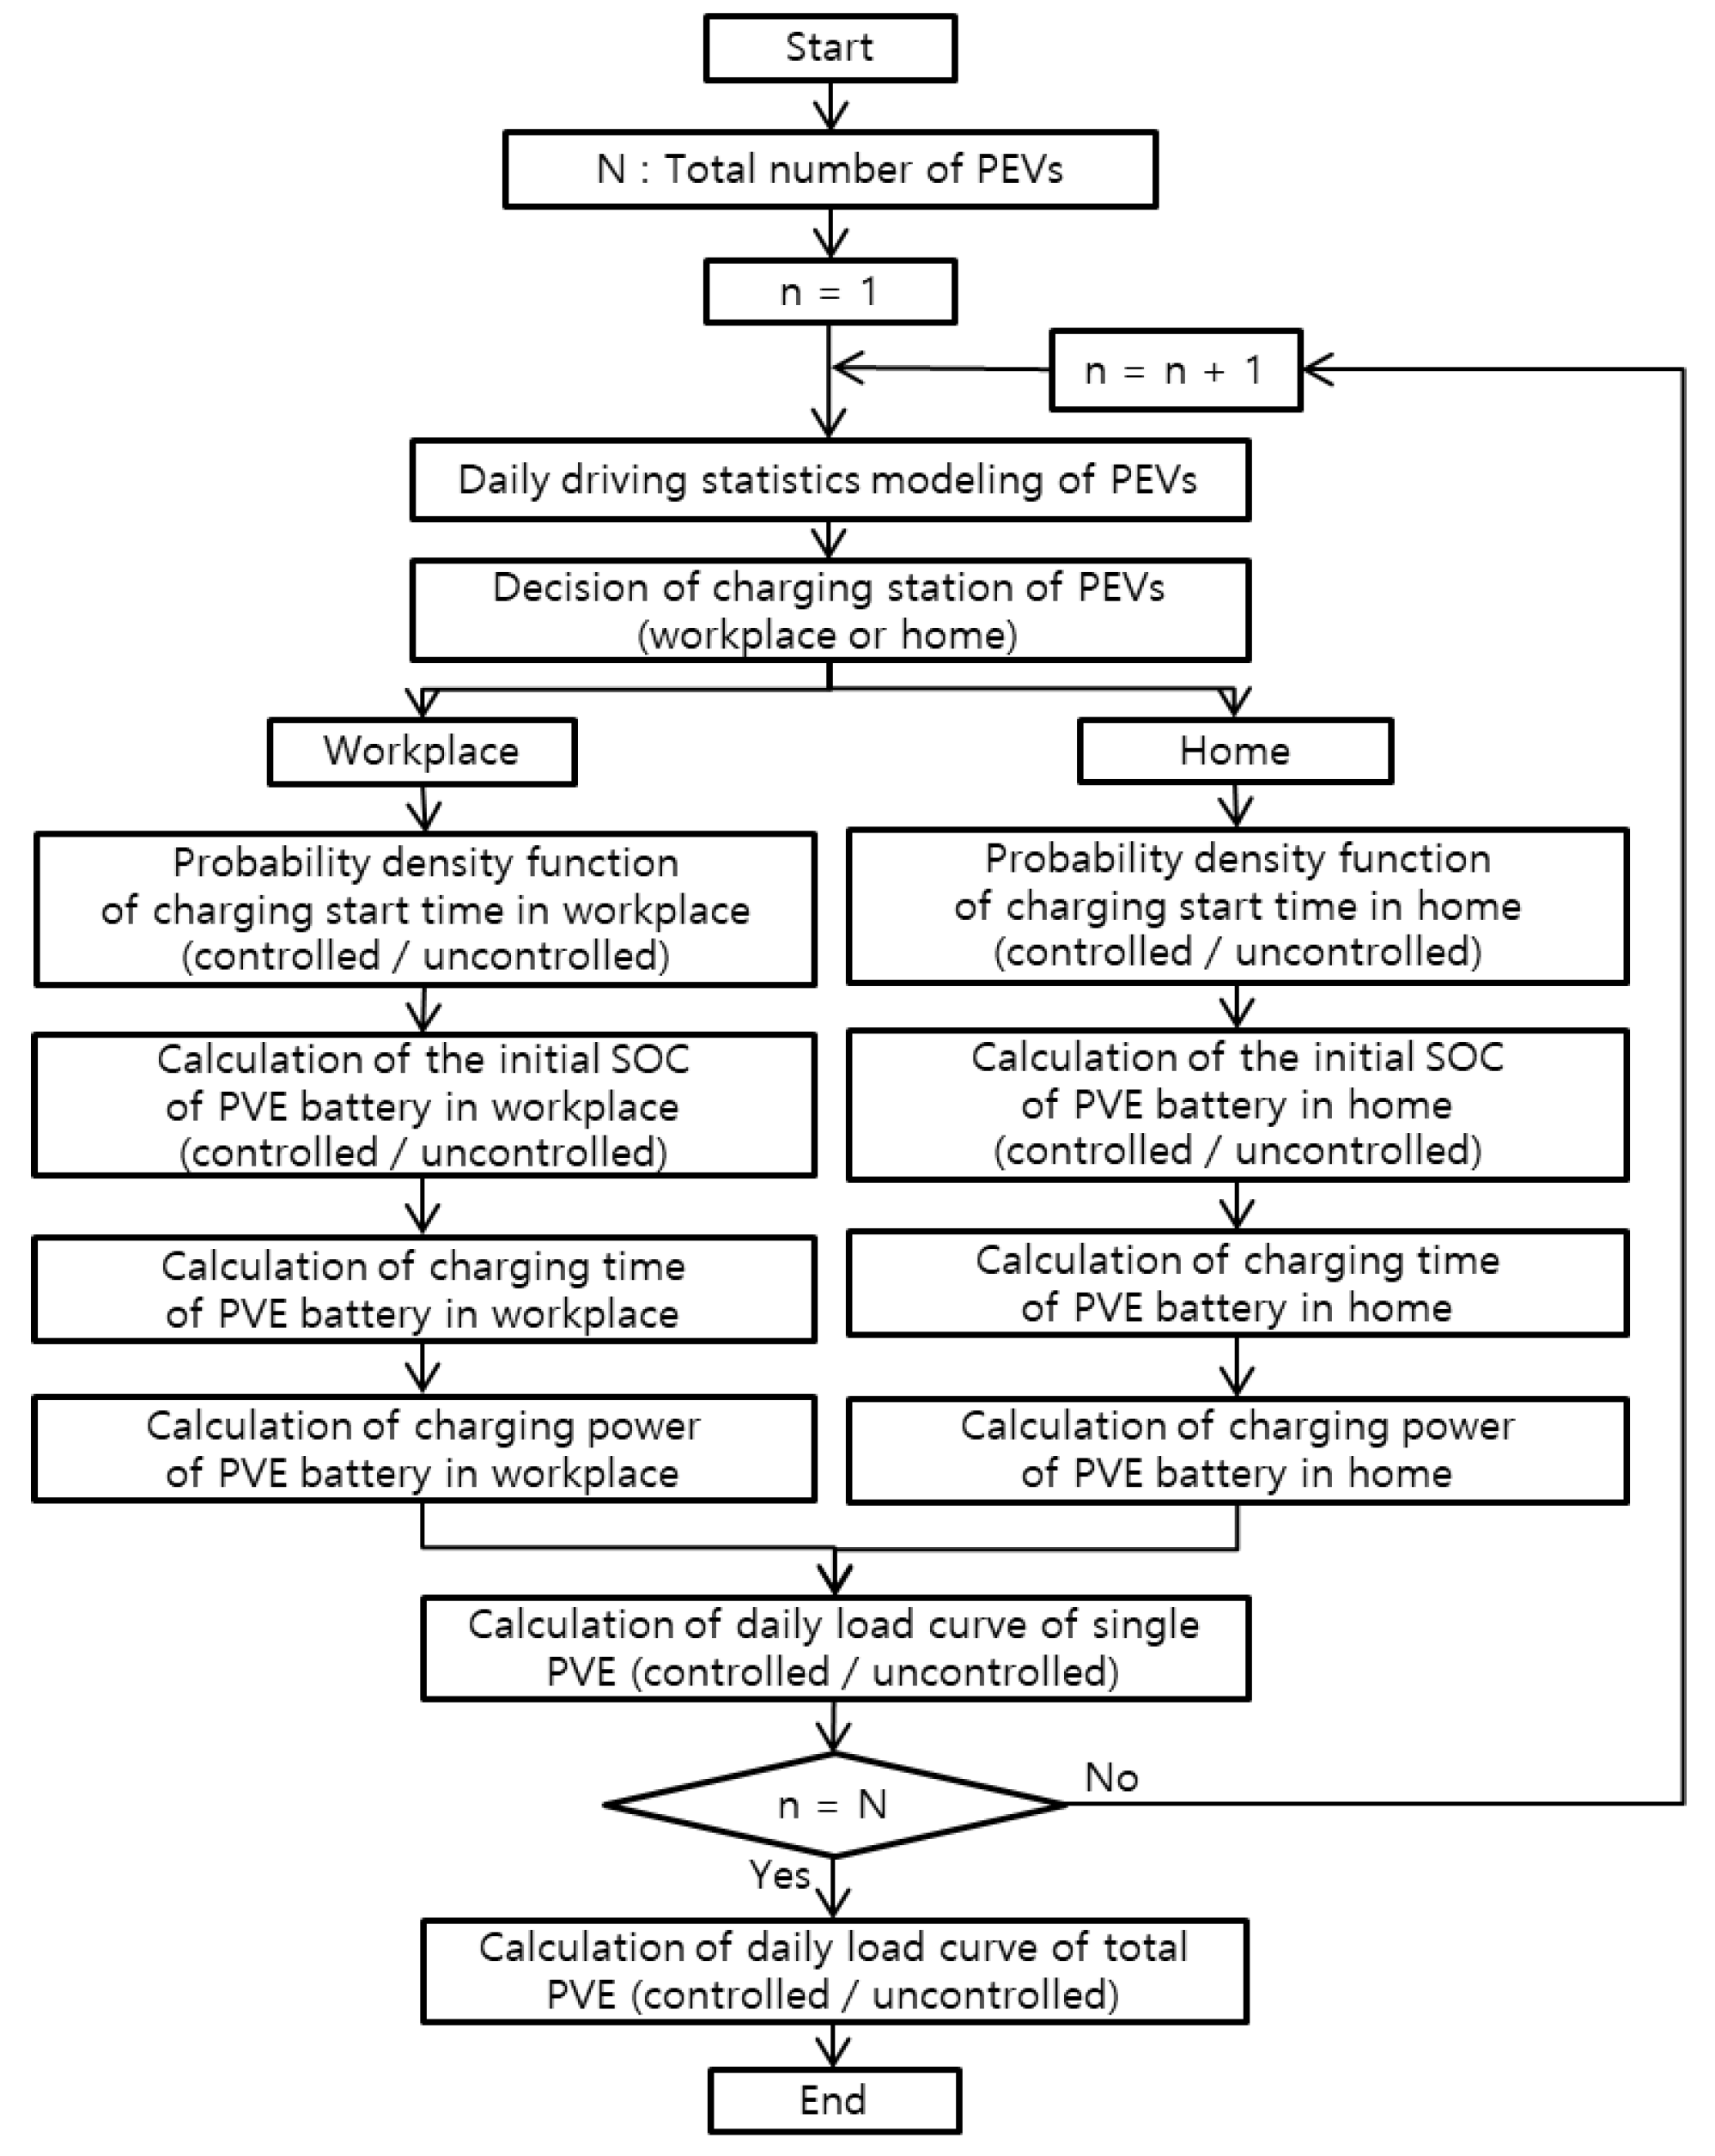
Figure 7.
Daily Load Curve in Seoul in 2030 (uncontrolled mode).
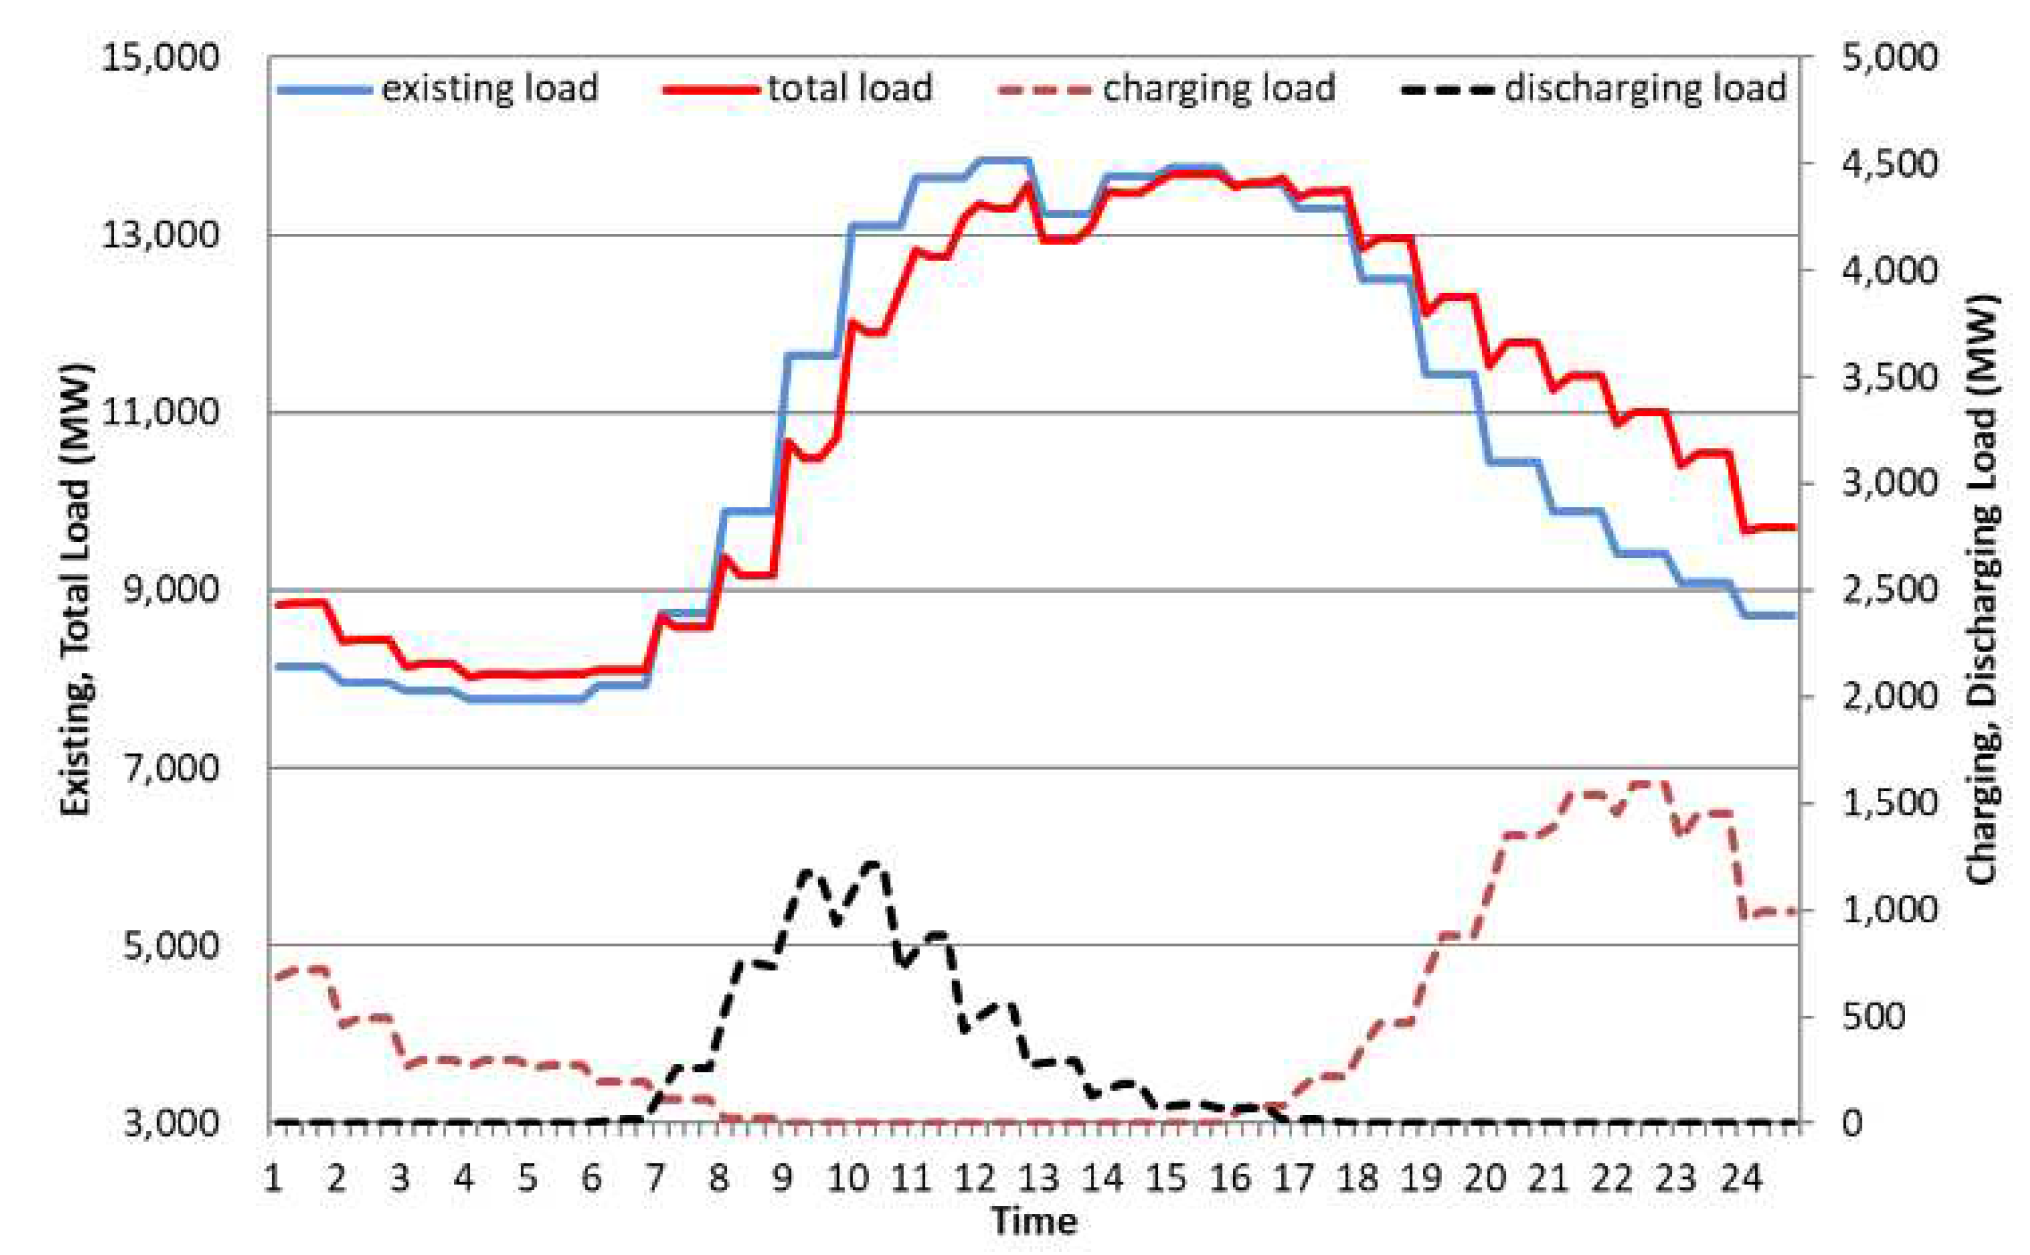
Figure 8.
Daily Load Curve in Seoul in 2030 (controlled mode1).
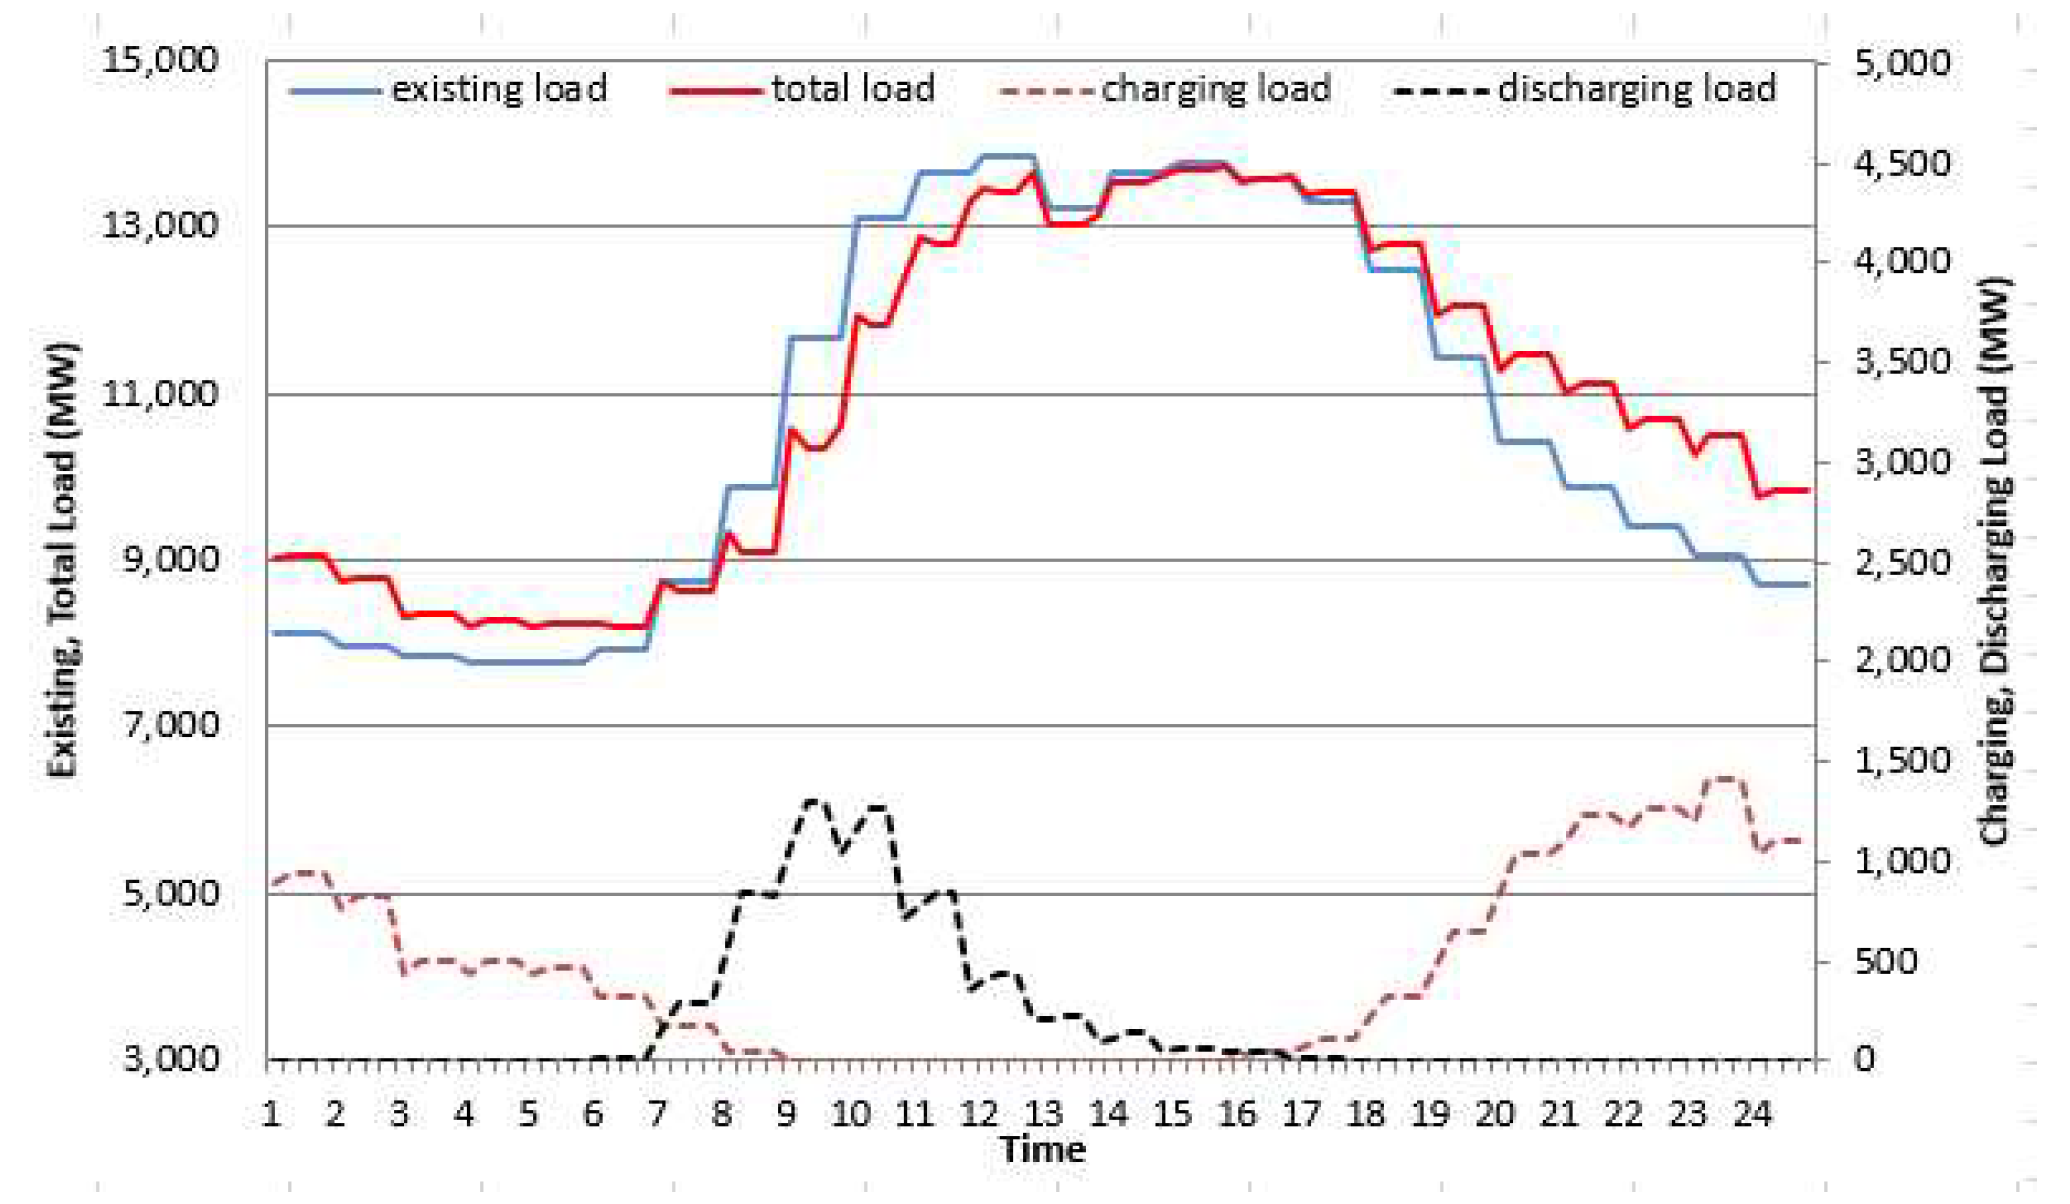
Figure 9.
Daily Load Curve in Seoul in 2030 (controlled mode2).
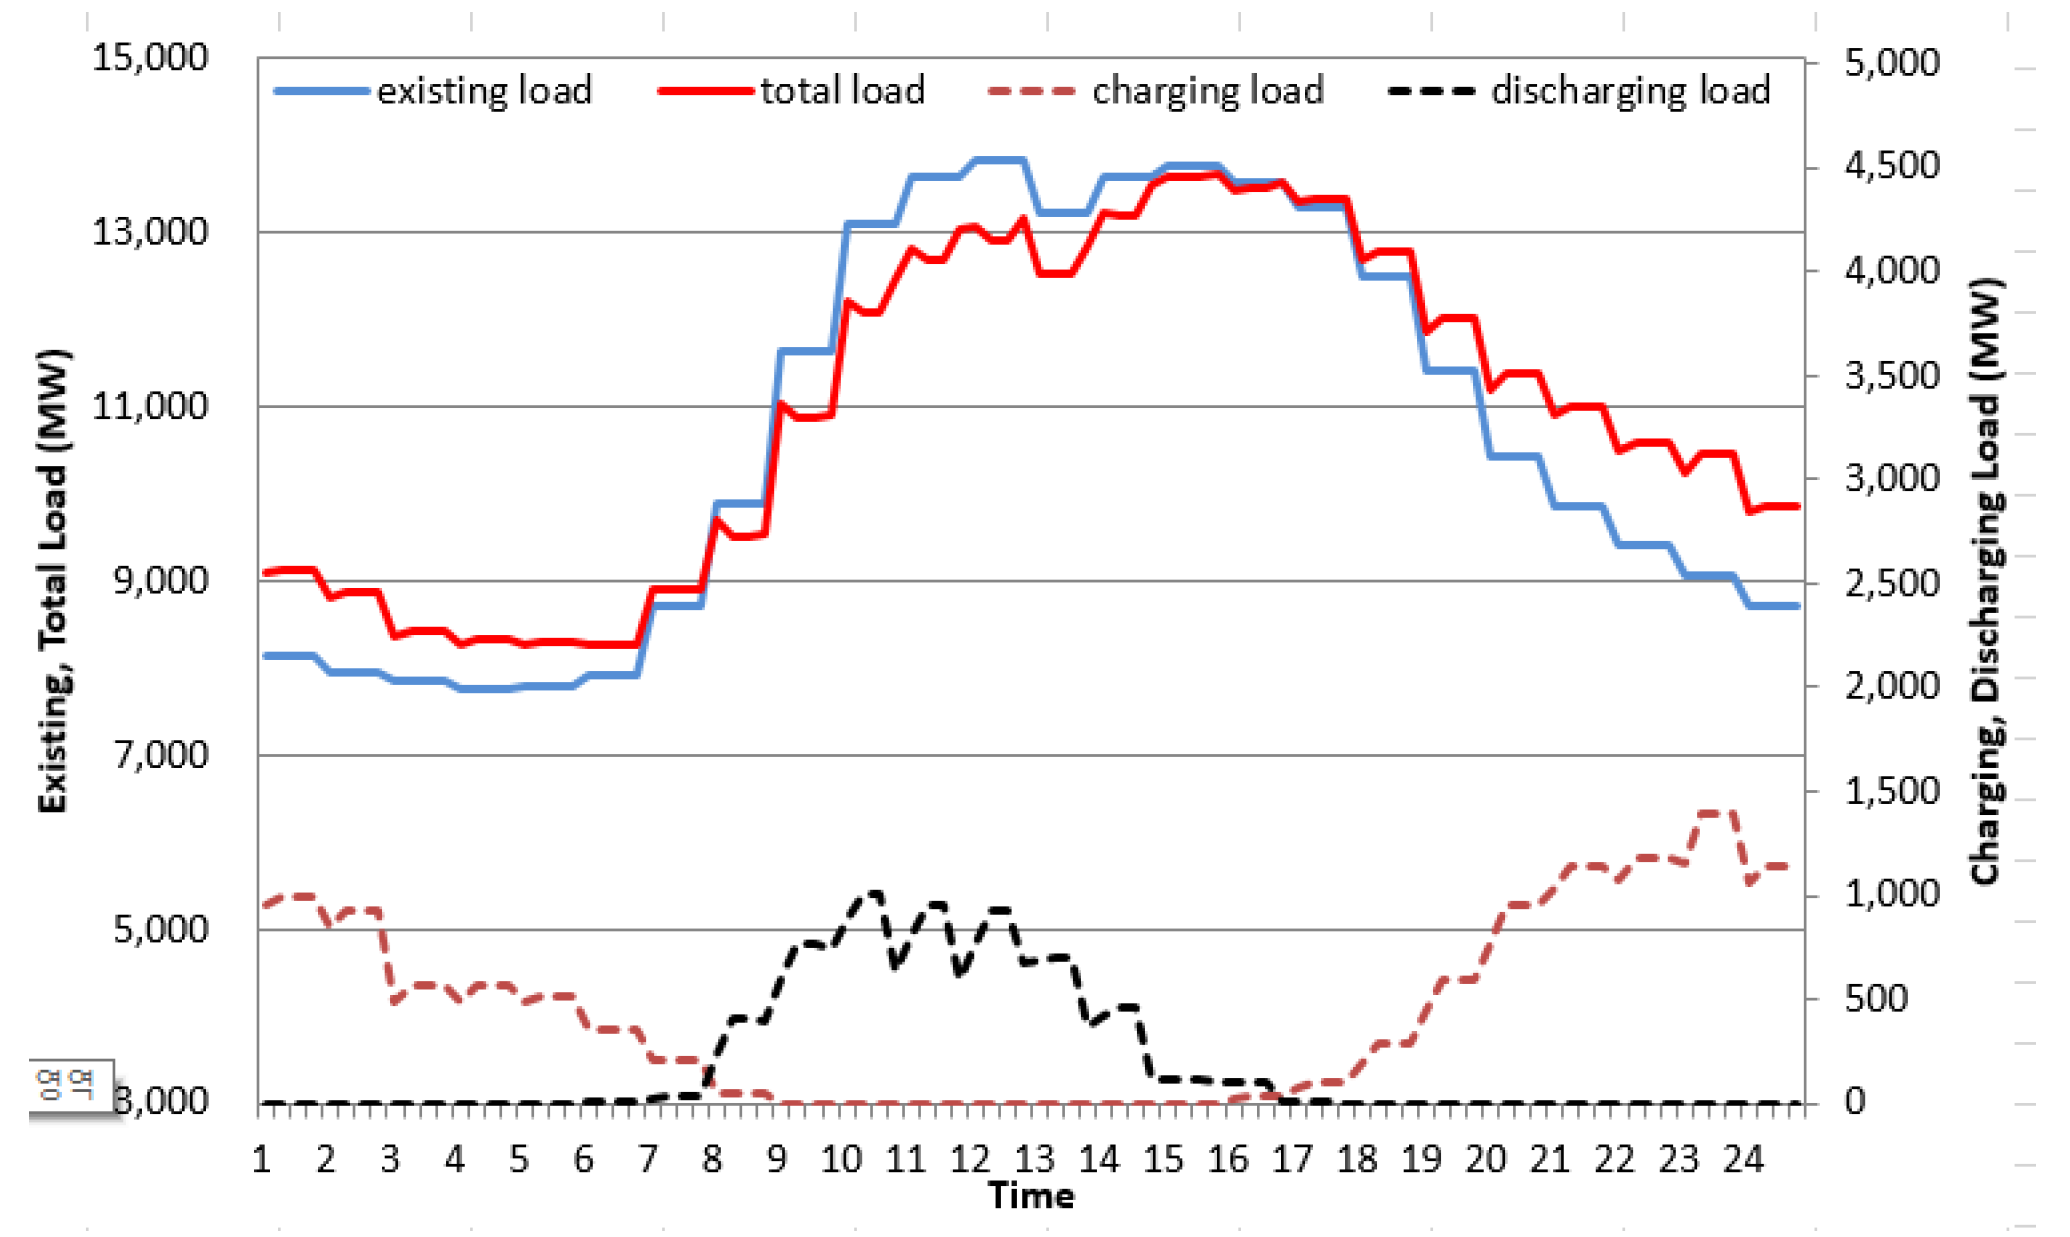
Figure 10.
Daily Load Curve in Seoul in 2040 (uncontrolled mode).
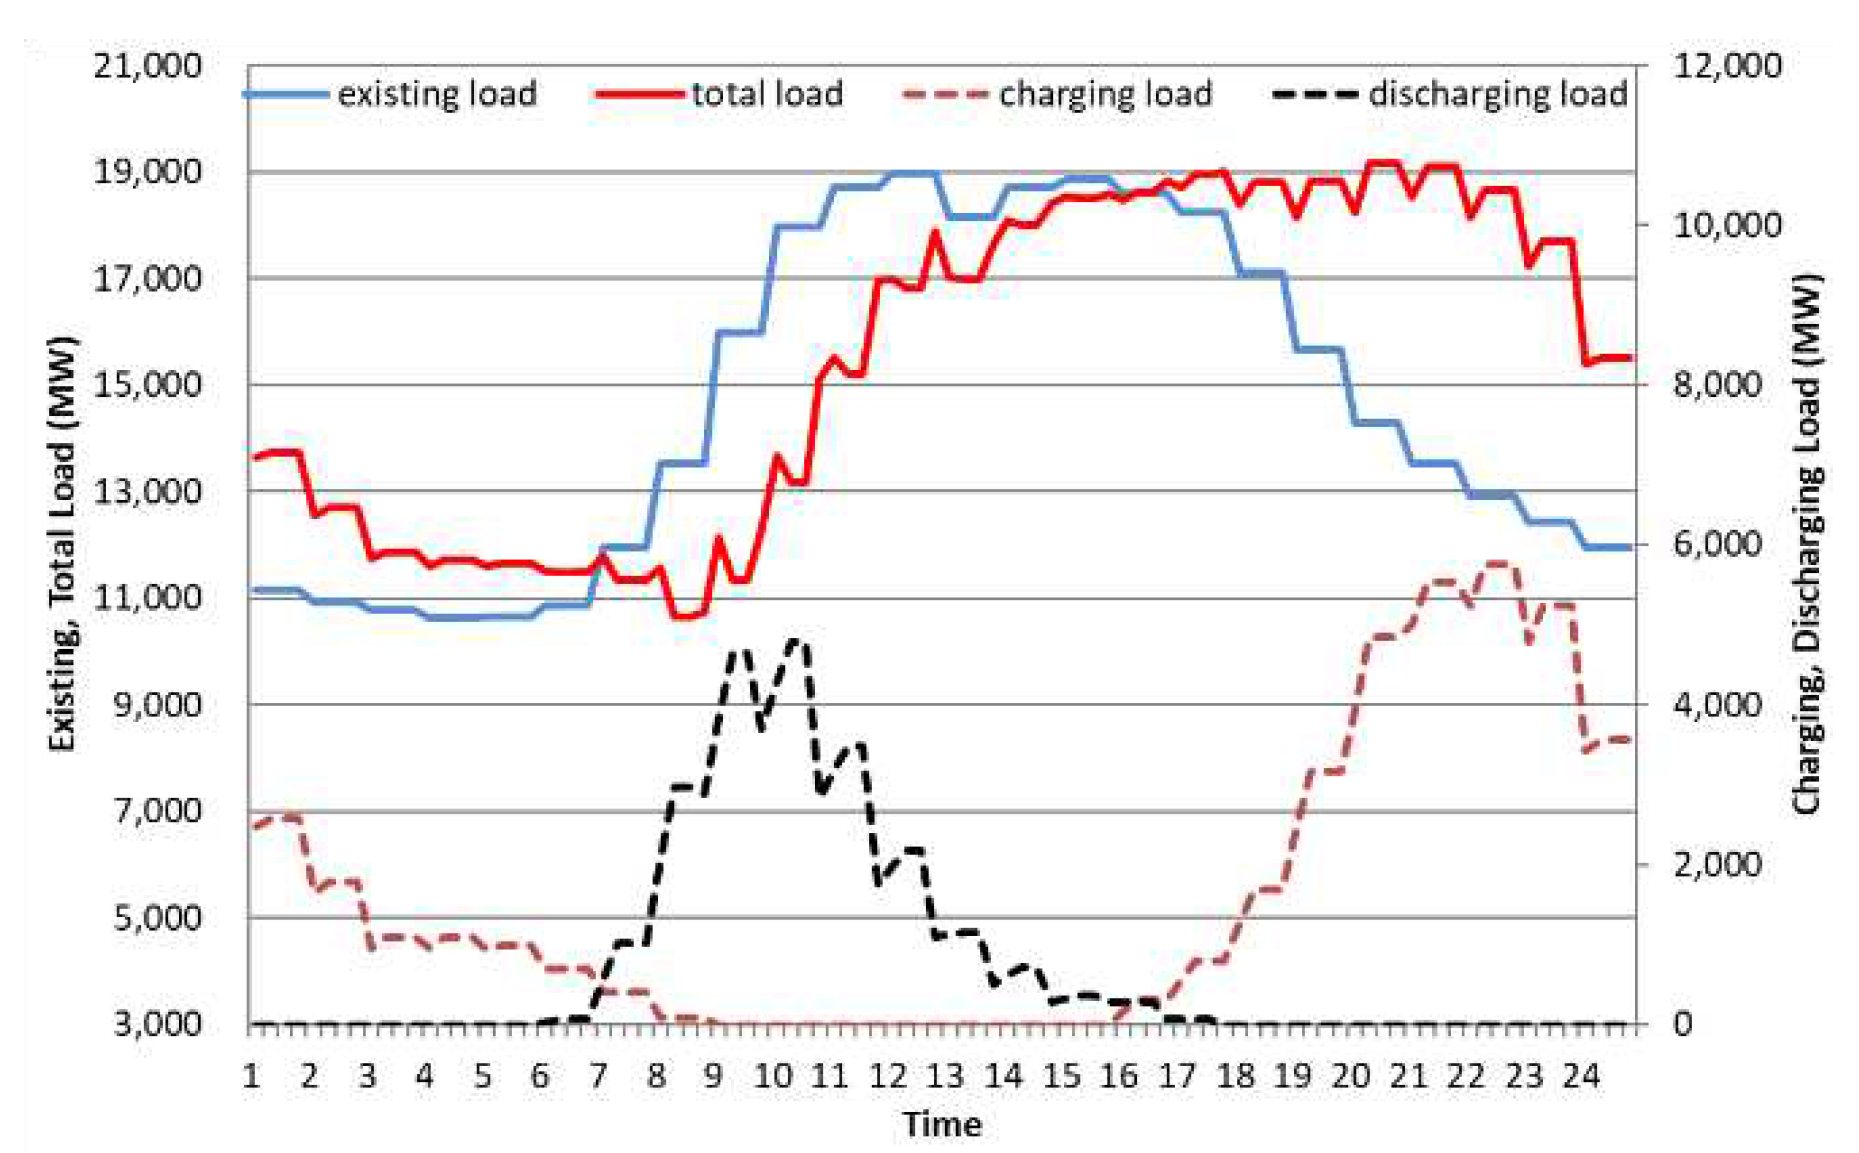
Figure 11.
Daily Load Curve in Seoul in 2040 (controlled mode1).
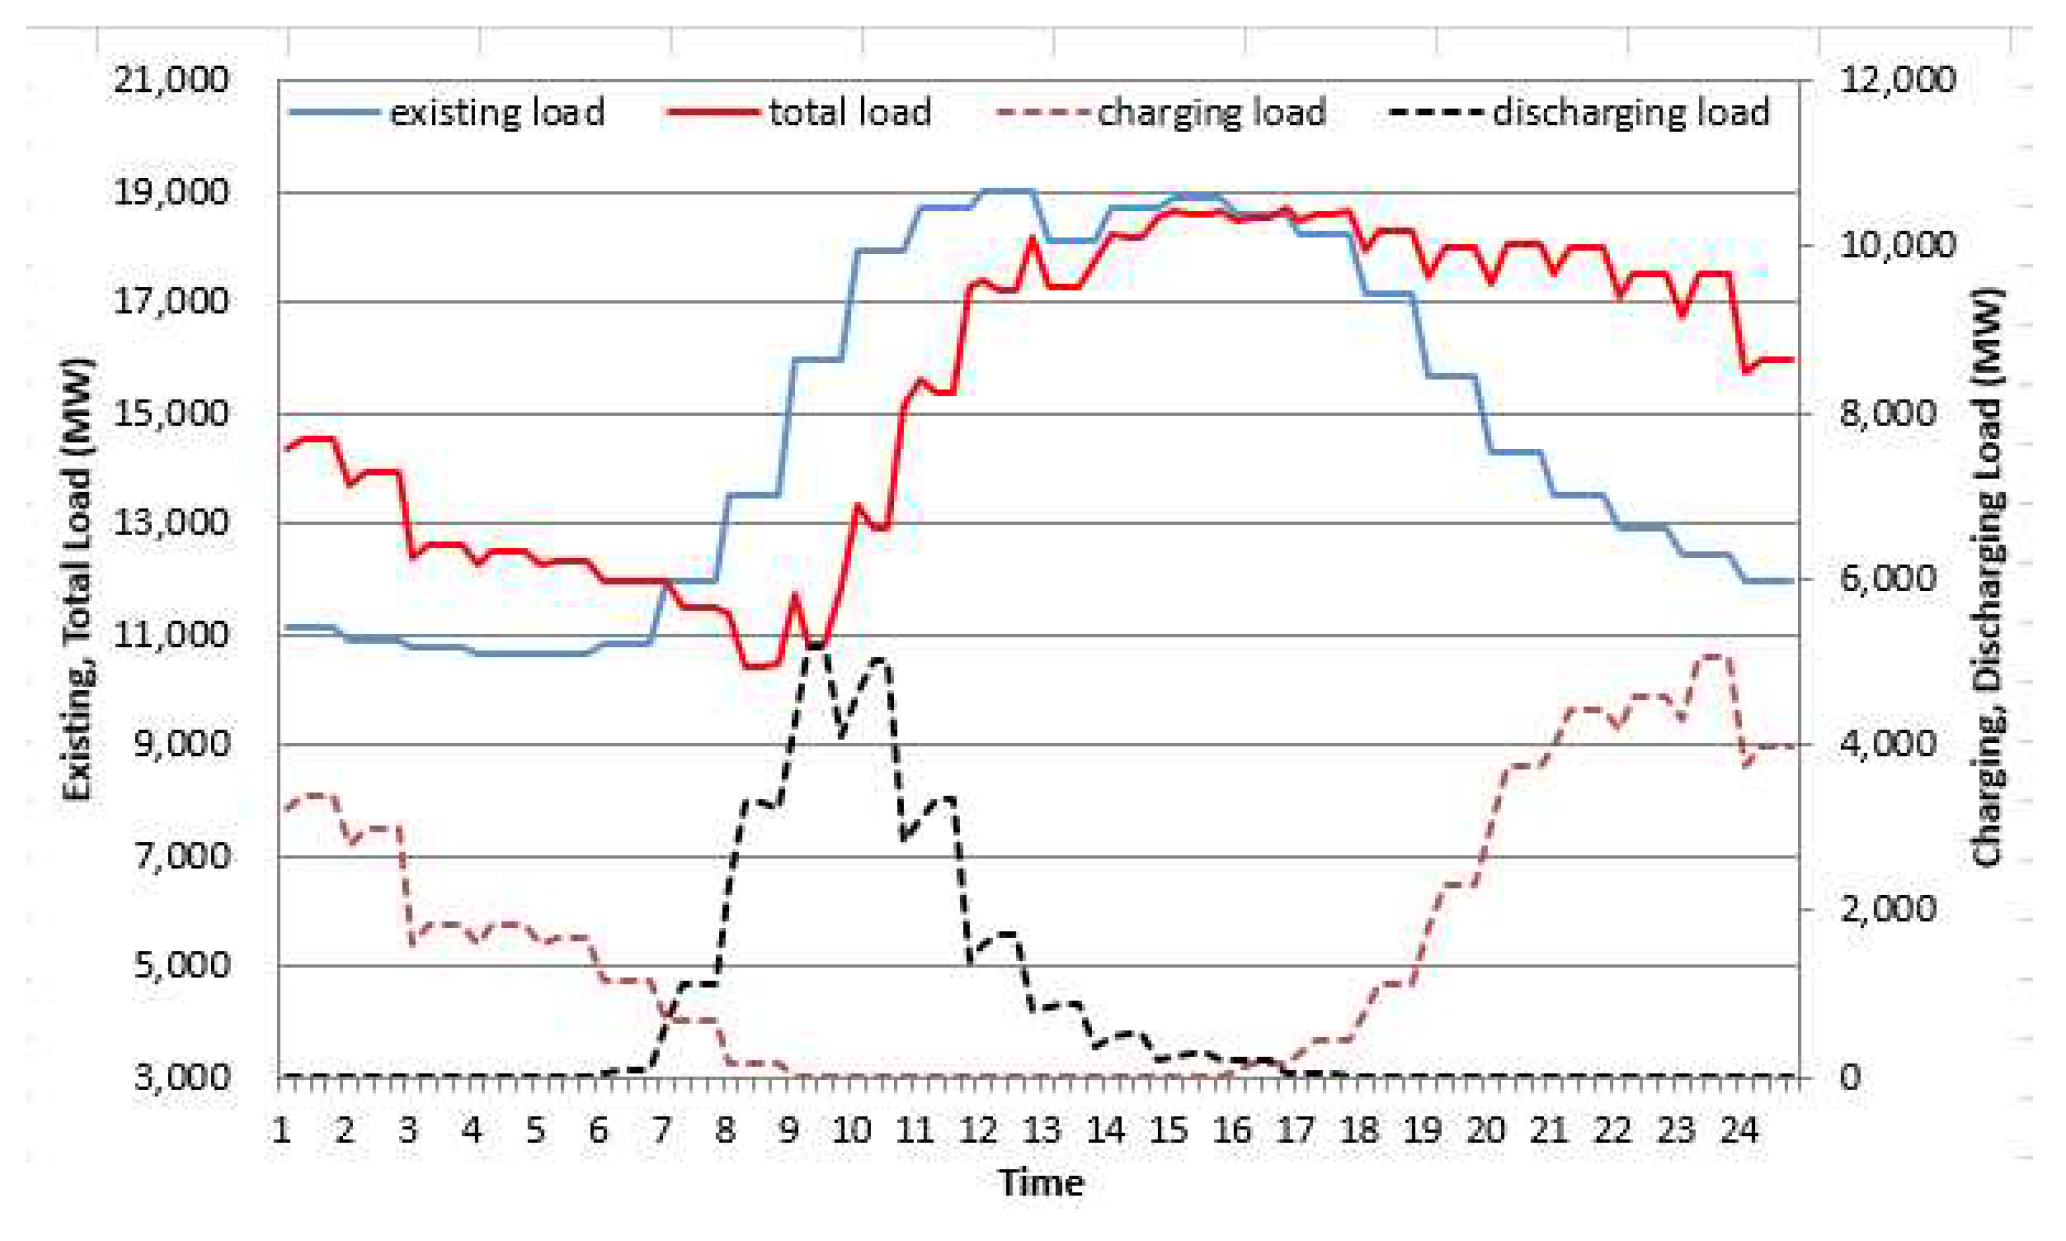
Figure 12.
Daily Load Curve in Seoul in 2040 (controlled mode2).
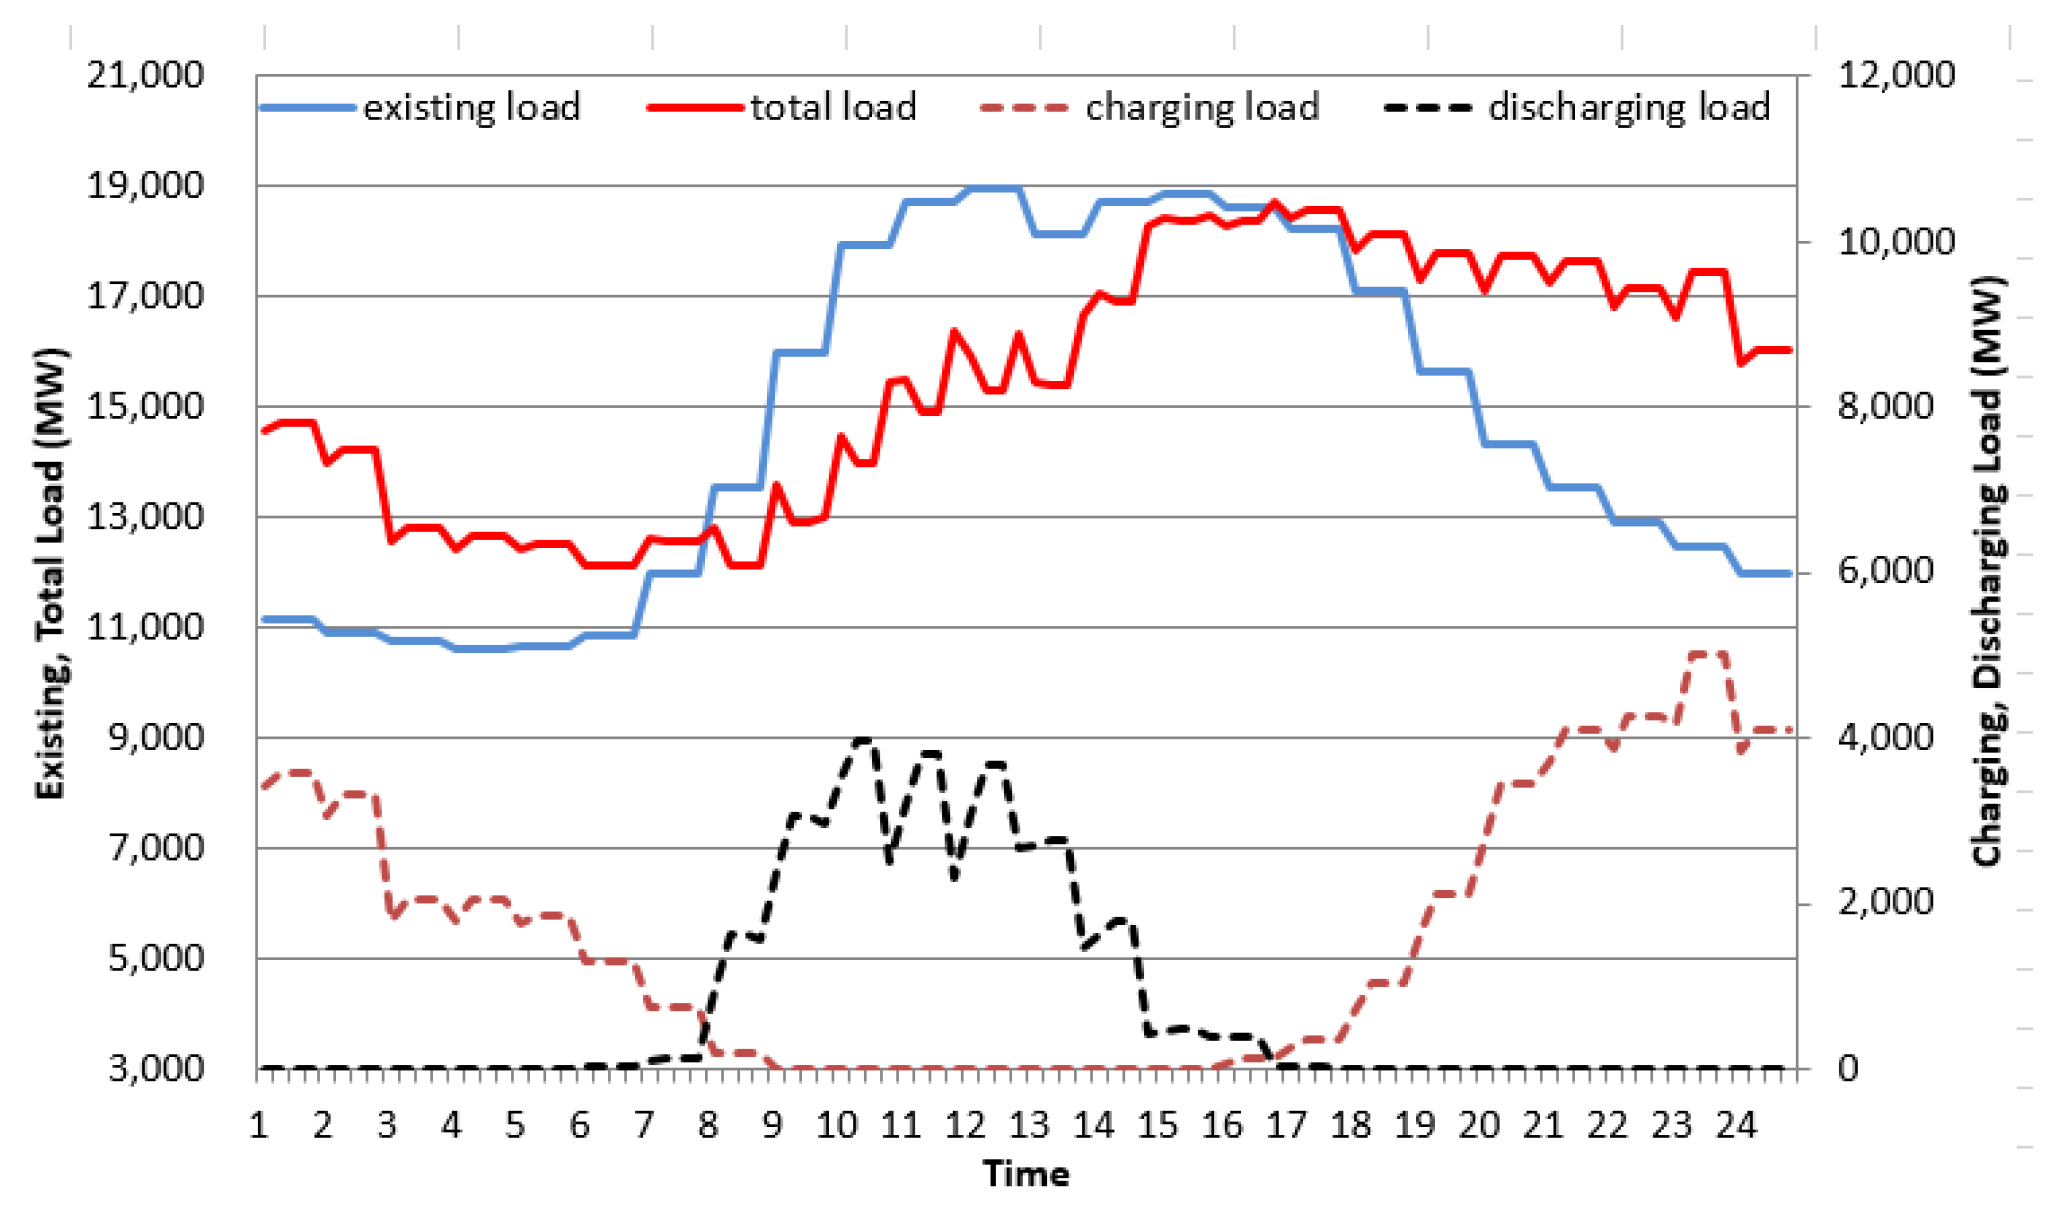

Table 1.
Discharge Probability Density in the Uncontrolled Mode at Workplace.
| Time | SMP1 | Discharge probability density | |
| (H) | (KRW /kWh) | Vehicle operation | Vehicle operation + SMP1 |
| 6 | 69 | 0.01 | 0.01 |
| 7 | 70 | 0.13 | 0.14 |
| 8 | 70 | 0.27 | 0.30 |
| 9 | 69 | 0.24 | 0.26 |
| 10 | 53 | 0.15 | 0.13 |
| 11 | 47 | 0.09 | 0.07 |
| 12 | 47 | 0.06 | 0.05 |
| 13 | 47 | 0.01 | 0.01 |
| 14 | 47 | 0.03 | 0.02 |
| 15 | 47 | 0.01 | 0.01 |
Table 2.
Discharge Probability Density in the Controlled Mode at Workplace.
| Time | SMP2 | Discharge probability density | |
| (H) | (KRW /kWh) | Vehicle operation | Vehicle operation + SMP2 |
| 6 | 70 | 0.01 | 0.01 |
| 7 | 13 | 0.13 | 0.01 |
| 8 | 94 | 0.27 | 0.20 |
| 9 | 105 | 0.24 | 0.20 |
| 10 | 118 | 0.15 | 0.14 |
| 11 | 247 | 0.09 | 0.18 |
| 12 | 390 | 0.06 | 0.19 |
| 13 | 160 | 0.01 | 0.01 |
| 14 | 195 | 0.03 | 0.05 |
| 15 | 70 | 0.01 | 0.01 |
Table 3.
Charging Probability Density in the Uncontrolled Mode at Home.
| Time | TOU1 | Charging probability density | |
| (H) | (KRW /kWh) | Vehicle operation | Vehicle operation +TOU1 |
| 0 | 50.9 | 0.03 | 0.05 |
| 1 | 50.9 | 0.02 | 0.03 |
| 2 | 50.9 | 0.03 | 0.05 |
| 3 | 50.9 | 0.03 | 0.05 |
| 4 | 50.9 | 0.03 | 0.05 |
| 5 | 50.9 | 0.01 | 0.02 |
| 16 | 158.6 | 0.03 | 0.01 |
| 17 | 158.6 | 0.05 | 0.03 |
| 18 | 107.3 | 0.09 | 0.07 |
| 19 | 107.3 | 0.15 | 0.12 |
| 20 | 107.3 | 0.20 | 0.16 |
| 21 | 107.3 | 0.12 | 0.10 |
| 22 | 107.3 | 0.11 | 0.09 |
| 23 | 50.9 | 0.10 | 0.17 |
Table 4.
Charging Probability Density in the Controlled Mode at Home.
| Time | TOU2 | Charging probability density | |
| (H) | (KRW /kWh) | Vehicle operation | Vehicle operation +TOU2 |
| 0 | 55.8 | 0.03 | 0.05 |
| 1 | 55.8 | 0.02 | 0.04 |
| 2 | 55.8 | 0.03 | 0.06 |
| 3 | 55.8 | 0.03 | 0.06 |
| 4 | 55.8 | 0.03 | 0.06 |
| 5 | 55.8 | 0.01 | 0.02 |
| 16 | 225.3 | 0.03 | 0.01 |
| 17 | 225.3 | 0.05 | 0.02 |
| 18 | 140.8 | 0.09 | 0.07 |
| 19 | 140.8 | 0.15 | 0.11 |
| 20 | 140.8 | 0.20 | 0.14 |
| 21 | 140.8 | 0.12 | 0.09 |
| 22 | 140.8 | 0.11 | 0.08 |
| 23 | 50.9 | 0.10 | 0.19 |
Disclaimer/Publisher’s Note: The statements, opinions and data contained in all publications are solely those of the individual author(s) and contributor(s) and not of MDPI and/or the editor(s). MDPI and/or the editor(s) disclaim responsibility for any injury to people or property resulting from any ideas, methods, instructions or products referred to in the content. |
© 2023 by the authors. Licensee MDPI, Basel, Switzerland. This article is an open access article distributed under the terms and conditions of the Creative Commons Attribution (CC BY) license (http://creativecommons.org/licenses/by/4.0/).
Copyright: This open access article is published under a Creative Commons CC BY 4.0 license, which permit the free download, distribution, and reuse, provided that the author and preprint are cited in any reuse.


