Submitted:
27 April 2023
Posted:
28 April 2023
You are already at the latest version
Abstract
This essay reexamines molecular evidence supporting the existence of the ‘preisthmus’, a caudal midbrain domain present in vertebrates (studied here in the mouse). It is held to derive from the embryonic m2 mesomere and appears intercalated between the isthmus (caudally) and the inferior colliculus (rostrally). Among a substantial list of gene expression mappings examined out of the Allen Developing and Adult Brain Atlases, a number of quite consistent selective positive markers, plus some neatly negative markers were followed across embryonic stages E11.5, E13.5, E15.5, E18.5, and several postnatal stages up to the adult brain. Both alar and basal subdomains of this transverse territory were explored and illustrated. It is argued that the peculiar molecular and structural profile of the preisthmus is due to its position adjacent rostrally to the isthmic organizer, where high levels of both FGF8 and WNT1 morphogens must exist at early embryonic stages. Isthmic patterning of the midbrain is discussed in this context. Studies of the effects of the isthmic morphogens usually do not attend to the largely unknown preisthmic complex. The adult alar derivatives of the preisthmus were confirmed to comprise a specific preisthmic sector of the periaqueductal gray, an intermediate stratum represented by the classic cuneiform nucleus, and a superficial stratum containing the subbrachial nucleus. The basal derivatives, occupying a narrow retrorubral domain intercalated between the oculomotor and trochlear motor nuclei, include dopaminergic and serotonergic neurons, as well as a variety of peptidergic neuron types.
Keywords:
Preisthmus
; isthmus
; midbrain
; isthmic organizer
; patterning
; FGF8
; WNT1
; Otx2
1. Introduction
The isthmic organizer and the preisthmus
The isthmic organizer was the first ‘secondary organizer’ discovered in the developing neural tube (Martínez and Alvarado-Mallart, 1990; Martínez et al. 1991). The secondary organizers are linear neuroepithelial areas that produce diffusible morphogen signals acting on regional patterning and differential specification of neighboring progenitors. The isthmic organizer is in a way complex, because it presents two different but adjacent morphogen sources -releasing FGF8 and WNT1, respectively- on its isthmic and midbrain sides.
After diffusion, these molecules show graded fields of concentration across a spatial range of the surrounding neuroepithelium; the isthmic organizer forms at the transverse isthmo-mesencephalic boundary and exerts anteroposterior effects on both caudal auditory midbrain and rostral isthmo-cerebellar hindbrain. The reaction-competent neuroepithelium is composed of progenitor cells that can assess and react to the amount of diffused morphogen detected. Morphogen molecules vary in their diffusion in the local environment (WNT1 is held to have a low diffusibility, because it rapidly attaches to the intercellular matrix, while FGF8 diffuses significantly, apparently reaching the interneuromeric limit r1/r2 caudalwards and advancing well into the midbrain rostralwards). The spread of such diffusing morphogens may be curtailed by the presence of inhibitors (e.g., Meinhardt 2009). However, an inhibitor surround has not been demonstrated yet for the isthmic organizer.
The gradient of isthmic morphogen provides non-instructive positional information to the progenitors by means of the diverse levels in morphogen concentration that are established. The competent cells respond to this variable by choosing among two or more differentiation options (activation potencies) provided by their partly prespecified genome (i.e., midbrain cells react differently as hindbrain ones). In the genome there supposedly are various cis-regulatory enhancers sensitive to larger or smaller amounts of the morphogen signal; once an enhancer is activated, it triggers a particular cascade of gene activations entailing differentiation effects. The overall result is that the affected neuroepithelial field results subdivided developmentally into as many subfields as differential reactions occur. As a consequence, each subfield will develop a distinct tissue fate, consequent to the particular gene cascade activated.
The isthmic organizer, first localized by its expression of the fibroblast growth factor 8 gene (Fgf8; Crossley et al. 1996), forms next to the transverse constriction that separates the midbrain vesicle (caudalmost part of the forebrain tagma) from the hindbrain tagma (Puelles 2018). The whole alar plate of the isthmic rhombomere (r0) initially expresses Fgf8 and thus represents a source of FGF8 protein (Aroca et al. 1995). However, the areal extent of the FGF8 source cells changes subsequently. Possibly by action of an unknown inhibitory surround effect (Meinhardt 2009) the organizer gets reduced in its caudal areal extent and is progressively restricted closer and closer to the rostrally limiting isthmo-mesencephalic boundary over time (Aroca et al. 1995; Puelles et al. 1996). The isthmus or rhombomere 0 represents the rostralmost prepontine hindbrain neuromeric unit (Watson et al. 2017; Puelles 2018). It was shown that transplanting pieces of the isthmic alar neuroepithelium ectopically anywhere in the competent diencephalo-mesencephalo-rhombencephalic domain (from the zona limitans intrathalamica to the rhombospinal boundary), generates ectopic copies of the cerebellum (Martínez et al. 1991, 1995, 1999; Grapin-Botton et al. 1999; review in Hidalgo-Sánchez et al. 2022).
Ulterior studies elaborated on the hypothesis that the observed isthmic induction effects were due to release of the FGF8 morphogen. Collagen microbeads impregnated with a solution of FGF8 protein were found to also induce cerebellar primordia at the competent sites cited above (Crossley et al. 1996; review in Hidalgo-Sánchez et al. 2022).
Accounts of isthmic organizer effects usually concentrate on the presence of cerebellar primordia. Less often midbrain auditory elements generated experimentally are examined. The isthmic region itself, which develops some structural complexity (various isthmic nuclei derive from a primary ‘isthmic cell plate’; Vaage 1973; Puelles and Martinez-de-la-Torre 1987), is not studied as a rule, though it is the area where the highest morphogen concentrations occur on the hindbrain side. Results affecting the nuclei of cranial nerves 3 and 4 located in the basal plate (sometimes duplicated) are rarely commented.
There is, moreover, a Cinderella-like subregion of the caudal midbrain –called preisthmus by Hidalgo-Sánchez et al. (2005) - that is completely disregarded in such experiments. It falls within the midbrain range of action of the isthmic organizer, caudally to the auditory midbrain and close to the WNT1-releasing caudal ring. Since it also lies very close to the isthmic FGF8 source, the preisthmus must be one of the differential fates patterned by concentrations of FGF8 rising beyond those that produce a cerebellum or an auditory caudal midbrain.
This caudal midbrain area was modernly redefined topographically and molecularly in the chick (Hidalgo-Sánchez et al. 2005) as a conceptually ‘new’ preisthmic alar midbrain region; it was indeed characterized as being strictly mesencephalic in molecular profile by its expression of the midbrain-selective marker Otx2. The avian preisthmus further expresses Pax2, absent in the rest of the midbrain. It was found later that the preisthmus also selectively expresses Six3 and lacks Tcf7l2 transcripts (Ayad 2014). The new anatomic name ‘preisthmus’ refers to its unique topography.
The existence of a thin caudal mesomere 2 at this locus had been proposed before after comparative embryonic studies by Palmgren (1921) and Vaage (1969, 1973). However, these authors added the questionable interpretation that m2 was an atrophic neuromere that did not produce any neuronal derivatives. They conceived it rather as a transverse neuron-free gap between the midbrain and the hindbrain. Since neuromeres are held to be serial transversal histogenetic units of the neural tube, showing proliferative bulging, internal regionalization, and differential areal production of characteristic neuronal populations (e.g., Puelles et al. 1987; Amat et al. 2022), the notion that one of them remained atrophic long caused private skepticism on its neuromeric nature (e.g., Puelles et al. 1987; Puelles and Martínez-de-la-Torre 1987). The results of Hidalgo-Sánchez et al. (2005) thus first showed that this m2 domain generates alar and basal preisthmic grisea distinct from the auditory midbrain, as expected of a true neuromere.
The anatomy of the adult mouse preisthmus was later covered (Puelles et al. 2012a; Puelles 2013; see also Puelles 2016, 2018, 2019). Mammalian preisthmic structures homologous to the chicken counterparts according to an identical topology in the brain Bauplan largely correspond with the classic ‘cuneiform nuclear complex’ (CnF in rodent atlases), found in coronal sections dorsally to the isthmic parabigeminal nucleus and under the inferior colliculus. This complex appears divided into superficial (subpial) and intermediate strata. These cover a particular preisthmic portion of deep periaqueductal gray, which lies ventral (topologically caudal) to that corresponding to the inferior colliculus. Due to the lack of neuromeric delimiting concepts, recent brain atlases tend to be imprecise in their employ of the CnF tag, mixing identification of some CnF elements in the correct preisthmic place jointly with false CnF elements identified within the isthmus. Alternatively, the CnF area may be wrongly extended caudalwards beyond the isthmic course of the trochlear nerve, or a separate precuneiform nucleus arbitrarily defined (e.g., Paxinos and Franklin 2013). Puelles et al. (2012a) tried to clarify this scenario by suggesting the convenience to reserve the cuneiform nucleus name and tag (CnF) to the intermediate stratum population of the true preisthmus. No ‘cuneiform’ entity should accordingly be identified within the isthmus proper. Puelles et al. (2012a) also proposed to rename the superficial population of the cuneiform complex as subbrachial nucleus (SubB), based on its topography directly under the interstitial nucleus of the brachium of the inferior colliculus (BIC) (Puelles 2022).
The basal preisthmus is less extensive rostrocaudally than the alar part. It forms a narrow wedge domain that can be described as retrorubral in topography, lying rostrocaudally between the mesencephalic dorsal and ventral tegmental decussations (and oculomotor nucleus) and the isthmic decussation of the brachium conjunctivum (superior cerebellar peduncle, and the trochlear nucleus). The retrorubral narrow space is occupied by dopaminergic neurons, including those of the interfascicular nucleus and the A8 cell group (Puelles et al. 2012a), plus some serotonergic neurons (Alonso et al. 2012) and peptidergic neurons (Puelles et al. 2012a).
The preisthmus domain can be explained as forming part of the immediate area of influence of the isthmic organizer in the midbrain. The differentiating m2 domain may be analogous to the neighboring isthmic r0 domain of the hindbrain in its requirement for relatively high concentrations of FGF8 and WNT1 morphogens, acting in this case inside the midbrain. The small anteroposterior dimension and retarded neurogenesis of m2 (Amat et al., 2022) may be due to singular regulation of proliferation and neurogenesis.
The aim of the present essay is to collect from the Allen Developing and Adult Mouse Brain Atlases novel genoarchitectonic data that illustrate the molecular singularity of the developing preisthmus in the context of the neighboring midbrain and isthmic regions, thus expanding the present concept of the diverse neural fates related to the activity of the isthmic organizer. This point will be re-examined here in the light of numerous gene markers.
2. Material and Methods
We centered all present descriptions on material from the Allen Institute for Brain Science Developing Mouse Brain Atlas [developingmouse.brain-map.org] (in general embryonic stages E11.5, E13.5, E15.5, E18.5, and postnatal stages P4, P14, P28, and P56, sometimes amplified to additional intermediate stages for some genes), with occasional reference to the Adult Mouse Brain Atlas [mouse.brain-map.org]. Various relevant markers mapped by immunoreaction or in situ hybridization from our own mouse brain collection at embryonic or postnatal stages were also available during this study, but were not described specifically.
An Excel sheet was prepared and annotated as Table 1, listing gene markers examined and their pattern of expression in the preisthmus. Photographic examples of the best Allen preparations were selected and composed into the Figure panels 1 to 12. These contain examples of sagittal and/or coronal sections of in situ reacted markers at different stages, counterstained with the yellow variant of the Nissl counterstain used at the Allen Institute.
3. Results
3.1. Midbrain and isthmic gene patterns in E11.5 mouse embryos.
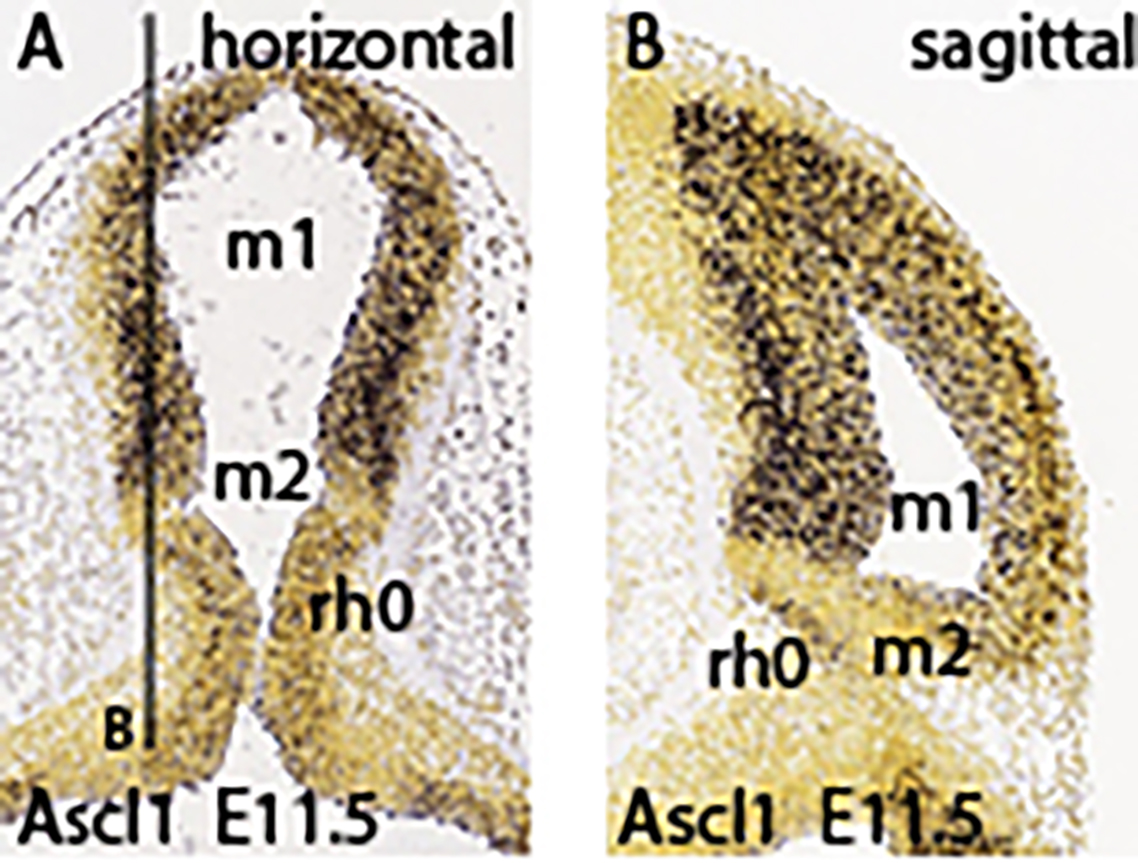
In the early stages cut horizontally, the axial dimension goes from the isthmus (bottom) up into the midbrain; in sagittal sections ventral lies to the left, and dorsal to the right.
The isthmo-mesencephalic boundary (IMB) appears clearly defined by the caudal limit of midbrain Otx2 expression in the largely undifferentiated neuroepithelium; the incipient mantle layer appears negative (Figure 1a-f). It is clearly observed that this molecular fate boundary does not coincide with the macroscopic isthmic constriction, so that the rostralmost isthmus (r0) participates of the mesencephalic caudal vesicular evagination (Figure 1a,b,d-f). Expression of Fgf15 is weak at the rostral half of the midbrain, but increases gradientally caudalwards to a maximum just in front of the IMB, at the expected locus of the m2 mesomere (Figure 1g). In contrast, Fgf8 signal is already restricted at this stage to the rostral evaginated part of the isthmus, behind the IMB, at the caudal pole of the midbrain vesicle (Figure 1h,i). The engrailed genes are held to be activated downstream of Fgf8. A double gradiental expression of En1 overlaps the isthmic organizer and characterizes the neighboring areas rostral and caudal to the IMB, penetrating maximally about one third into the caudal basal midbrain (Figure 1j) and less so dorsally (Figure 1j-l). There is a specular En1 gradient extending into the rostral hindbrain, possibly reaching the rh1 rhombomere (Figure 1j-l). The latter is labeled differentially by the Otp probe, contrasting with the Otp-negative isthmus domain (rh0, rh1; Figure 1m).
Ascl1 shows rather widespread expression in the E11.5 midbrain ventricular zone, with a decreasing dorsocaudal gradient and some positive mantle ventrally (Figure 1n,o). Remarkably, its signal is sharply absent at a slightly evaginated part of caudal midbrain neuroepithelium that covers the classic transverse ‘sulcus intraencephalicus posterior’ (Figure 1n,o). This sulcal area lies just rostral to the Fgf8-positive isthmic domain (compare Figure 1h,i), which shows itself weak Ascl1 signal in its ventricular zone (Figure 1o; this is a topological horizontal section). If we check again the Otx2 signal in similar horizontal sections (Figure 1d-f), it seems to occupy integrally the sulcal radial domain next to the IMB, thus making it a candidate for the postulated m2 unit at E11.5 (note Palmgren 1921 used this landmark to identify the atrophic outpouching of m2, all the rest being m1). Nevertheless, we will see below that at later stages Ascl1 comes to label positively the m2 domain.
A transverse negative gap apparently coinciding with the m2 locus and the associated sulcus at the caudal end of the midbrain vesicle is shown as well by Gfra1 and Id2 (Figure 1p,q). Other expression patterns such as those of Id4, Irx1 and Irx2 occupy the rostral midbrain and the rostral hindbrain (including the isthmus), but leave an interposed caudal midbrain gap devoid of signal which may correspond to the prospective m2 (Figure 1r-u). Several Lhx genes (e.g., Lhx1, Lhx2, Lhx5 in Figure 1v-z, aa) as well as the genes Nkx2.2, Sfrp1 and Rprm (Figure 1bb, cc, dd) label either large or limited parts of prospective m1 (in the mantle or ventricular zone) but leave out the caudal sulcal midbrain domain (Lhx1 and Lhx5 both label distinctly the isthmus; Figure 1v,y,z,aa). Interestingly, Lhx5 labels the midbrain mantle at an intermediate rostrocaudal level, leaving negative both the rostral pole and the caudal sulcal area (Figure 1y,z,aa). It is unclear whether this early labeling is restricted to the basal plate (tegmentum), as is suggested in Figure 1y. In any case, at later stages this marker also becomes a selective alar m2 marker. The Nkx2.2 gene, which otherwise is expressed along the whole forebrain (hypothalamus, diencephalon, and midbrain) as a thin longitudinal band approximating the alar-basal boundary (Puelles and Rubenstein 2015), ends its longitudinal route at the caudal midbrain, where the expression domain is deflected dorsalward into the illustrated area (Figure 1bb) just in front of the caudal sulcal domain. Derived cells will later appear in the inferior colliculus.
The caudal sulcal ventricular zone of the midbrain appears densely labeled by Sall3 signal at several lateromedial parasagittal section levels (Figure 2a-d); this marker is expressed also in more rostral basal mantle elements in m1, but not in the adjoining isthmus domain. The latter is strongly labeled by Sfrp1, clearly leaving negative the adjacent caudal sulcal midbrain area (Figure 2e,f).
Pax2 and Pax8 both seem weakly expressed in the isthmic domain, stopping rostrally at the IMB, just caudal to the negative sulcal area (Figure 2g,h). In contrast to findings in the chick, m2 seems devoid of Pax2 in the mouse, at least at this stage. In contrast, Pax5 signal extends rostralward from the positive isthmus, and penetrates the caudal part of the midbrain, analogously as observed above for En1 (Figure 2i-k; note the positive sulcal area). Pax3 shows alar expression in the midbrain and cerebellar hindbrain, but leaves an area devoid of expression coinciding with the caudal sulcal locus (Figure 2l).
Tal1 and Tal2 show at E11.5 strong expression in the midbrain basal domain (ventricular zone and mantle; Tal2 also has rather weak expression at the alar domain), but none of them is expressed at the caudal sulcal area (Figure 2m-p). Sst-positive postmitotic cells are observed rostrally in the basal midbrain, as well as in the basal isthmus, but are lacking at the caudal sulcal area (Figure 2q). Trh signal appears selectively in a semilunar postmitotic mantle area that might correspond to the caudal sulcal area (Figure 2r).
Ventricular zone expression of Wnt1 appears at E11.5 along a transverse line aligned precisely with the IMB, that is, in between the evaginated Fgf8-positive isthmus and the sulcal midbrain area (both being negative to Wnt1; Figure 2s,t). Wnt1 signal also extends rostralward along the midbrain roof plate, but not along the isthmic one (not shown). There is little Tcf7l2 signal at either isthmus or midbrain at E11.5 (Figure 2v), but at E12.5 positive mantle cells have started to aggregate subpially, particularly in an intermediate domain of the midbrain lying rostral to the sulcal area (Figure 2w); this primordium later seems to transform into the inferior colliculus (see below). Sema3f shows expression concentrated at the midbrain basal plate, but evading the caudal sulcal area (Figure 2x).
3.2. Midbrain and isthmic gene patterns in E13.5 mouse embryos.
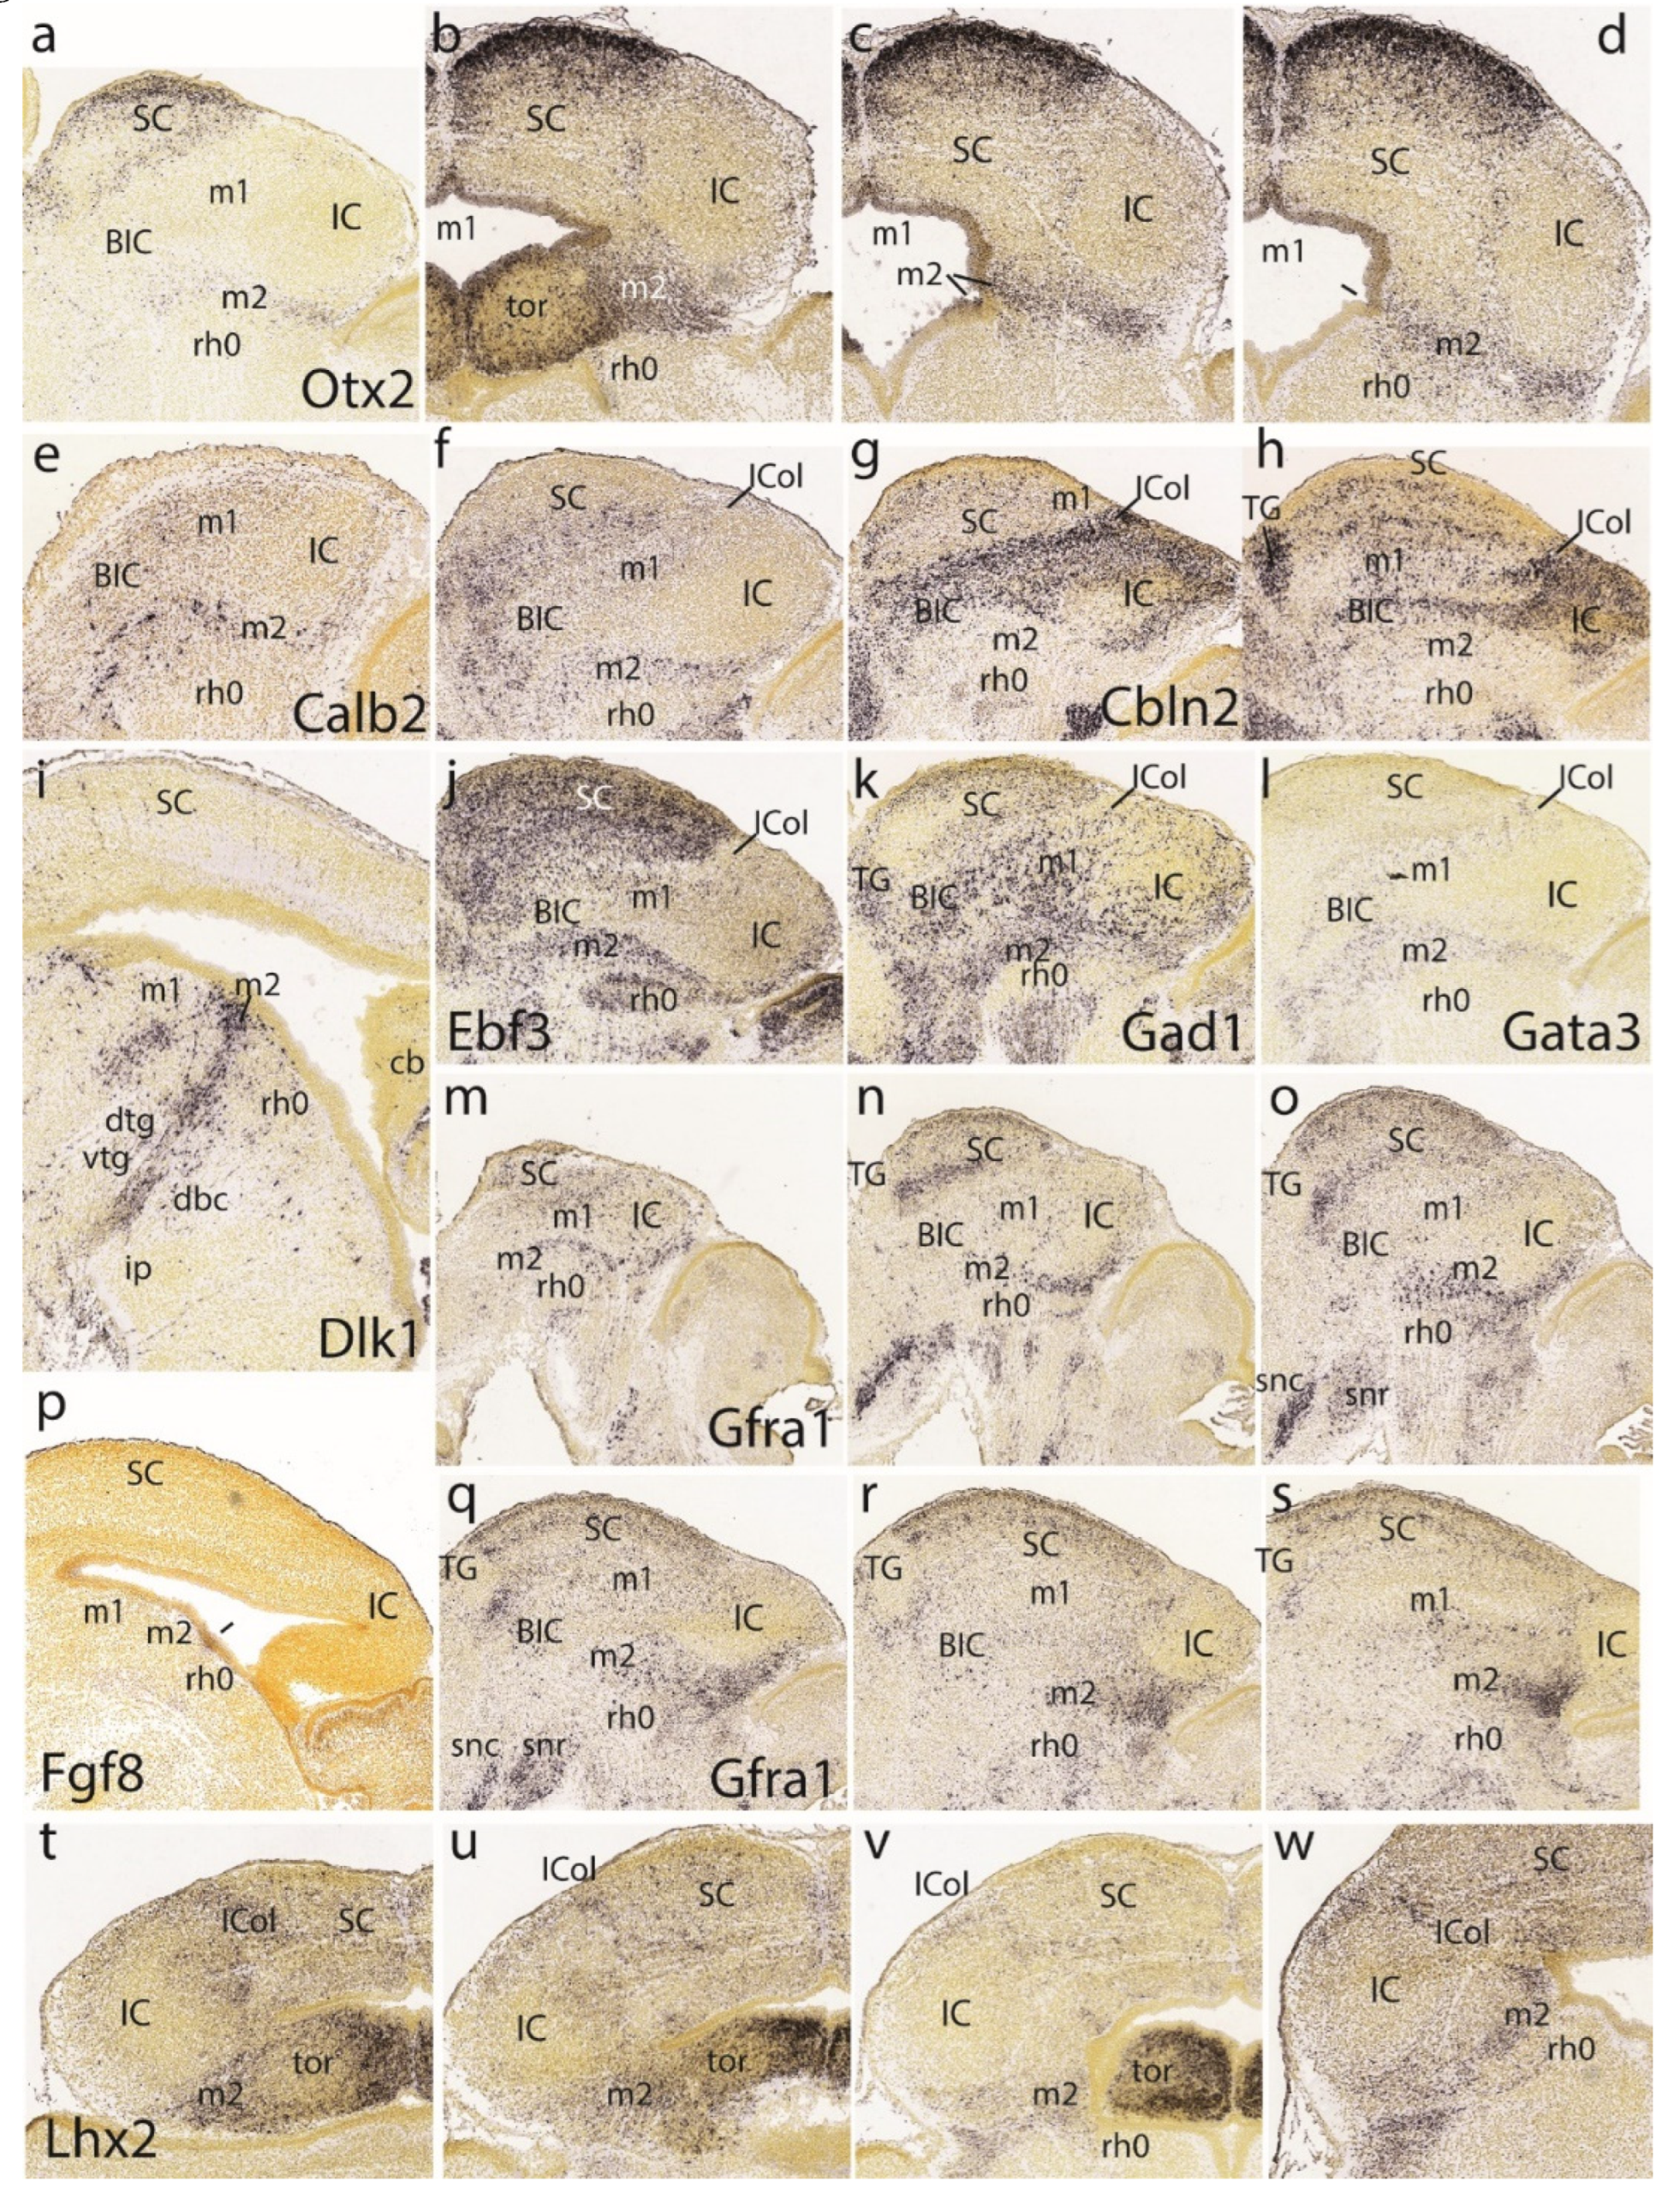
At E13.5 the major structural primordia of the alar midbrain mantle are clearly distinguishable. Sagittal sections reacted in situ for Otx2 show a positive and elongated dorsorostral area that corresponds to the superior colliculus (SC; this apparently includes the still more rostral ‘tectal gray’ formation -TG-, which we will point out only occasionally) (Figure 3a,b). The SC area limits ventrocaudally with a mantle domain devoid of Otx2 signal, which represents the inferior colliculus -IC- and its rostral continuation the interstitial bed nucleus of the brachium of the inferior colliculus -BIC (Figure 2a,b). Ventrocaudal to this band there appears again Otx2 expression in what we interpret as the preisthmus or m2 derivative (Figure 2a,b). This domain seems wider dorsally (i.e., label ‘tor’, close to the roof plate), where it seems to participate somehow in the toral area of the inferior colliculus (more on this below). As the domain thins out ventralwards (topologically) it displays a sharp boundary with the Otx2-negative isthmus domain (across the IMB).
Examination of a dorsoventral series of horizontal Otx2 sections (Figure 3c-g) identifies again these three alar midbrain territories (positive SC, negative IC, and positive preisthmus) and the molecular limit with the isthmic hindbrain, which partly evaginates into the midbrain vesicle (as seen in Figure 3d-g). We now notice that the IC is Otx2-negative only in its mantle zone, whereas its underlying ventricular zone is actually positive, thus establishing the validity of the marker for all the midbrain (the same pattern was discovered in the avian auditory midbrain; Hidalgo-Sánchez et al. 2005). These sections also show the sectioned caudal sulcal area. The posterior intraencephalic sulcus now forms dorsally a deep ventricular diverticulum that does not limit here with the isthmus domain (which lies more ventrally) and lies just caudal to the IC; it gradually flattens out ventralwards as the IC acquires a larger mass (Figure 3c-g). The sulcus is separated dorsally (sections in Figure 3c,d) from the median roof plate by an undifferentiated stretch of positive neuroepithelium that diminishes in surface extent ventralwards, finishing as a narrow radial interstice (the isthmus starts to appear at level of Figure 3d). This sequence corresponds to the change in dimensions of the alar preisthmus which we already observed in the sagittal sections. We will see at later stages that the preisthmus seems to contribute to inferior collicular structure via this as yet undifferentiated dorsomedial ‘toral’ domain (the name alludes to its subsequent intraventricular bulge).
At the magnification represented it is hardly possible to distinguish that a stream of Otx2-positive cells exits the caudalmost midbrain. These migrate tangentially caudalwards along a cell-poor intermediate stratum of the isthmus (tiny dark dots in Figure 3e,f; see the Allen Developing Mouse Brain Atlas). We believe this represents the caudal migration of cells of the mesencephalic nucleus of the trigeminal nerve (mes5) which target the isthmus and rh1 alar domains (Amat et al. 2022). Various other studied gene markers label these particular neurons. On the other hand, we cannot identify at this stage any of the diverse alar derivatives of the isthmic region, though their development seems quite advanced.
In the second and third rows of Figure 3 we show the En1 pattern at E13.5 (Figure 3h,I, l-s). We intersected two relatively equivalent horizontal sections labeled for Lhx5 and Ascl1 (Figure 3j,k respectively), because they are directly comparable to the overlying Otx2 sections in Figure 3d,e. Sagittal parasagittal sections at lateral, intermediate and medial section levels illustrate minimally the complex En1 pattern (Figure 3h,i, l). The labeled preisthmus shows strong subpial signal, moderate to weak signal at intermediate levels and strong signal medially, the latter in apparent relation to the generation and migration of dopaminergic neurons of the ventral tegmental area and substantia nigra (compare Figure 3r,s). The dorsoventral series of horizontal sections shown in Figure 3m-s illustrate other details. The En1 signal decreases gradientally across the preisthmus, barely reaching the caudal sulcal area (Figure 3m,n).
Turning now to Figure 3j,k it will be noted that at E13.5 Lhx5 distinguishes (similarly to Otx2) positive SC and preisthmic mantle domains (including the caudal sulcal area), whereas the IC mantle and ventricular zones are largely negative; the isthmus is also Lhx5-negative (Figure 3j). A similar pattern is shown by Ascl1, whose signal is restricted to the SC and preisthmic ventricular zones, including the sulcal area (Figure 3k). Much weaker signal labels slightly the IC and isthmic ventricular zone.
The fourth row in Figure 3 shows similar lateral parasagittal sections illustrating, first, restricted preisthmic expression of Lhx1 (Figure 3t). Secondly, two sections showing massive complementary labeling by Meis2 of the isthmus and neighboring hindbrain domains, as well as weaker labeling of the SC and IC/BIC midbrain domains, and a distinct basal patch of mantle cells in m1; the negative preisthmus stands out (Figure 3u,v). Finally, we see selective preisthmic labeling (with separate signal in basal m1) with the Pitx1 probe. Note the constancy and sharpness of the IMG boundary, irrespective of the side labeled.
Gad1, and Gad2, both markers of GABAergic neurons are strongly represented at preisthmic level (not so at this stage at the IC primordium; Figure 3x,bb). Gad1 signal also appears in the SC primordium. Dorsal and ventral intersections of the semicircular arch of Fgf8 expression along the rostralmost isthmus (= the isthmic organizer) are seen in Figure 3y. Note the implicit topographic obliquity of the transverse IMG boundary. The Fgf15 signal appears as a positive transverse line that by comparison of the Gad1 pattern seems to separate the negative preisthmic domain from the IC domain (Figure 3z,aa).
The preisthmic midbrain territory is clearly invaded by the expression of Pax5 (Figure 3cc,dd,ee). This pattern is also detailed in a series of horizontal sections (Figure 4a-g). Note both isthmus and preisthmus are variously labeled, but the IC area remains negative. A similar preisthmic Pax8 labeling was observed (Figure 4h). Comparable selective positive patterns are provided likewise by Penk, Sst, Pou6f2, Sox14 and Six3 (Figure 4i-n, respectively). Note in contrast the selective preisthmic negativity demonstrated by Pou3f3 (Figure 4o).
A series of parasagittal sections labeled with Tal1 illustrates its marked expression laterally at the alar preisthmus (Figure 4p), as well as more ventrally along the transition into the preisthmic basal domain, where it is separated distinctly from analogous isthmic basal signal by a negative narrow tissue gap associated to the posterior intraencephalic sulcus (Figure 4q-t). A parasagittal section (Figure 4u) and a dorsoventral set of 5 horizontal sections (Figure 4v-z) labeled with Tal2 illustrate major labeling at the preisthmus and SC, and minor periventricular signal at the IC primordium. There is only very weak ventricular expression at the isthmus.
The last row of Figure 4 shows the Tcf7l2 expression pattern in a parasagittal section (Figure 4aa) and 5 dorsoventral horizontal sections. This marker selectively characterizes the SC and IC mantle primordia, leaving negative the preisthmus and isthmus. Note lack of signal at the caudal sulcal area.
The Lhx2 pattern is shown in a set of 6 dorsoventral horizontal sections. It consists of labeled deep mantle cells at the SC, IC and preisthmus (not so the isthmus), with a substantial superficial mass of IC that remains devoid of expression, particularly in the more ventral sections (Figure 5a-f). Figure 5g illustrates a very lateral parasagittal section reacted for Npy. The signal is largely restricted to the preisthmus, though a number of positive cells seem to disperse tangentially across the BIC domain into the SC. The second row in Figure 5 displays a series of dorsoventral horizontal sections illustrating Lhx5 expression (Figure 5h-n). We distinguish the positive SC and preisthmic domains (including the caudal sulcal area) and the intercalated negative IC domain. Note a subpial positive cell stream seems to invade the superficial IC mantle out of the preisthmus (Figure 5i-k). There is also expression of this marker at the isthmus. The boundary across the IMB with the preisthmus is visible at the levels of Figure 5h-l), partly thanks to the flattened posterior intraencephalic sulcus.
Nkx2.2-positive cell patches characterize the dorsal IC mass (Figure 5o-q). More ventrally there is more compact signal associated to the caudal sulcal area along the dorsoventral dimension of the preisthmus (Figure 5r,s). Finally, the last sections illustrate the confluence of the preisthmic transverse pattern with the longitudinal band coursing long the alar-basal boundary (Figure 5t,u). These last sections are cut essentially transversal to the midbrain and typically show radial ventral distribution of Nkx2.2-positive cells in the laterorubral tegmental area and dorsalward migration of a clump of periaqueductal positive neurons.
The Wnt1 expression remains stable along the transverse IMB arch (two intersections are seen) and the midbrain roof plate (Figure 5v,w). Pou4f1, another marker of the migrated mes5 neurons, as well as a selective marker of the SC and IC mantle in m1 (not the preisthmus in m2) is shown in parasagittal and horizontal sections (Figure 5x,y). Some positive mes5 neurons remain fixed along the migration pathway targeting rh1 (the rh1/rh2 boundary is not violated).
3.3. Midbrain and isthmic gene patterns in E15.5 mouse embryos.
At E15.5 Ebf3 is a marker of the preisthmus and SC/TG, leaving the BIC/IC domain essentially negative, excepting few dispersed cells. There is also a negative boundary with the isthmus, where a patch of signal appears in the mantle (Figure 6a). In more medial parasagittal sections extensive labeling of the midbrain periaqueductal gray formation is observed (Figure 8b). Ascl1 signal appears only at the ventricular zone of the preisthmus and SC, leaving the IC and isthmus domains negative (Figure 6c,d).
The preisthmus (with or without the SC) appears selectively labeled by Nhlh2, Lhx5, Foxp4, and Gata2 (Figure 6e-h). Gata2 shows a linear pattern of expression at the boundary of preisthmus with the IC that recalls the pattern of Fgf15 at E13.5. These sites can be easily ascribed to the preisthmus (and SC) by comparison with Otx2 expression in three lateromedial parasagittal sections (Figure 6i-k). We confirmed that the IC keeps Otx2 expression in its ventricular zone (Figure 6k,l). A paramedian parasagittal section also illustrates the Otx2 signal in the basal preisthmus, representing a quite narrow transverse and radial interstice placed in retrorubral position (Figure 6l). Four dorsoventral horizontal sections (note there is left-right obliquity of these sections; both sides are of interest) labeled likewise for Otx2 illustrate the wide dorsal extent of the positive alar preisthmic domain (next to the negative IC) at the level where it contacts the local roof plate (Figure 6m). More ventrally the alar preisthmus gets reduced to a narrower Otx2-positive band that underlines the caudal aspect of the IC and limits caudally with the negative isthmus domain (Figure 6n-p). It is appreciated in these images (particularly on the left side) that at E15.5 the isthmus has penetrated significantly topographically into the midbrain vesicle (intussusception by morphogenetic deformation of the IMB). The four underlying patterns of the markers Gad2, Gata3, Id4 and Tal1 identify specifically the preisthmus and show a curved boundary with the isthmus, with development of a marked convexity towards the midbrain (Figure 6q-t).
A set of four parasagittal sections illustrate next the Meis2 pattern, which is negative in the preisthmus and most of the SC, but positive in the BIC/IC complex (Figure 6u-x). Note also that the dorsal rim of the latter domain shows stronger signal than its ventral rim, as is observed particularly in Figure 6w. This corresponds to the incipient differentiation along this more strongly labeled locus of the separate intercollicular domain (ICol), intercalated between the SC and IC. There appears also a separate patch of Meis2 expression in the basal m1 area. The isthmus and other hindbrain prepontine areas are also strongly positive.
The superficial preisthmic mantle stratum begins to differentiate into what we called the ‘subbrachial nucleus’ (SubB; Puelles et al. 2012a). This primordium adopts a characteristic curved shape above the isthmic superficial elements (due to the curving of the IMB). It shows a ventral head-like thickening (oriented topographically rostral) and a longer dorsal tail portion (oriented topographically caudal). We show this characteristic image displayed by four different gene markers (En1, Pax5, Pax8, Pou6f2) in Figure 6y,z,aa,bb.
The preisthmus is delineated perfectly in negative by the markers Irx1, Sst, Irx2, and Lhx9. All of them label distinctly parts of the isthmic mantle at rh0 (well delimited from rh1), as well as the BIC/IC complex (Figure 7a-d). In horizontal sections, Foxp2 shows deep to superficial gradiental labeling of the IC primordium plus weaker SC signal. There is also some separate weak signal at the intermediate stratum of the preisthmic mantle, caudal to the IC (Figure 7e-h). The positive patch at the left bottom corner of Figure 7h is an unidentified superficial isthmic mass. Note that at E15.5 the midbrain caudal sulcal area is hard to identify, due to its progressive flattening.
Another good marker for the IC is Tcf7l2 (Figure 7i-l). The collicular labeling occupies the whole mantle, while more rostrally, possibly at levels through the BIC nucleus, this mass appears separated by a negative periventricular stratum from the corresponding positive ventricular zone. The SC shows a wholly different pattern and the preisthmus is essentially negative, excepting a few periventricular cells. Similar sections labeled for Lhx2 illustrate in contrast a negative IC core nucleus, with an underlying positive periventricular stratum, which is continuous with the preisthmic mantle (Figure 7m-p; here the preisthmus reaches the roof plate in Figure 7m,n) as well as with the SC counterpart. The superficial mantle intercalated between the negative IC and SC domains shows increased signal of Lhx2 (ICol; Figure 7m-p); this transitional area corresponds to the incipient intercollicular area introduced above with Meis2. The IC domain appears fully and selectively negative with Lhx5, whereas the SC is weakly labelled in a diffuse pattern (Figure 7q-t). In contrast, the preisthmus shows selectively its characteristic mantle signal (the isthmus being wholly negative). The preisthmic domain dwindles in extent ventralwards.
The gene Six3 shows positive cells distributed through lateral parts of the BIC/IC complex, but is otherwise more strongly represented along the preisthmus, and absent from the isthmus and SC regions (Figure 7u-x).
The last row in the Figure 7 is dedicated to examples of markers labeling selectively the basal or tegmental preisthmus, namely Zfhx3, Sst, Pou6f2, and Nts (Figure 7y,z,aa,bb). The differential distributions of the labeled elements suggests that various neuronal types are more or less mixed within the narrow preisthmic tegmentum. We do not show the local dopaminergic or serotonergic neurons reported in Puelles et al. (2012a) and Alonso et al. (2012).
3.4. Midbrain and isthmic gene patterns in E18.5 mouse embryos.
The first row in Figure 8 presents the E18.5 Otx2 pattern. As before, the SC and preisthmus domains stand out, while the largely negative BIC/IC complex only appears labeled at its ventricular zone (Figure 8a-d).
Figure 8.
Plate illustrating diverse E18.5 mouse brain sagittal (a, e-s) or horizontal (t-w) sections reacted for the gene markers indicated at the bottom. The gene name is indicated only in the first image of a series. In sagittal sections rostral is to the left and dorsal upwards, whereas in horizontal sections rostral is up and caudal at the bottom. The magnification is the same in all cases.
The lateral parasagittal section in Figure 8a illustrates the characteristic headed worm shape of the subbrachial nucleus (the superficial stratum of the preisthmus), as described at E15.5. The three horizontal sections in Figure 8b-d show a sequence through the positive preisthmus, passing from its enlarged dorsal part to its much narrower ventral portion. Note the posterior intraencephalic sulcus is recognizable at levels of Figure 8c,d and only part of its ependymal ventricular zone expresses the Otx2 marker. This indicates that the bottom of the sulcus may represent the IMB, so that its rostral lip belongs to m2, while the caudal lip is isthmic (representing the organizer). A number of positive preisthmic cells seem to violate this boundary and disperse in the neighboring isthmic mantle (Figure 8c,d). The IC core is negative and appears surrounded deeply and superficially by a disperse shell of positive cells. The negative deep stratum lying under the deep IC shell corresponds to the local periaqueductal gray (PAG). Labeling in the SC is restricted to intermediate and superficial cell layers, plus the ventricular zone. Its own part of the PAG is also negative.
Interestingly, the dorsalmost Otx2 section shown (Figure 8b) illustrates dorsomedial continuity of the positive preisthmic mantle with symmetric bulges at the dorsocaudal midbrain midline. We interpret these bulges as derived from the dorsomedial toral undifferentiated domain distinguished at the same position at the preceding stages. These bulges emerge between E15.5 and E18.5, indicating late growth. Their significance will be considered in the Discussion. We will explore their genoarchitectonic profile and histogenetic evolution here and in the next section.
The second row in Figure 8 shows the Calb2 (calretinin) and Cbln2 patterns in parasagittal sections (Figure 8e,f and Figure 8g,h, respectively). Calb2 appears selectively in the subbrachial preisthmic nucleus (a subpial formation), showing its typical head-tail configuration (Figure 8e). A deeper section interests the intermediate preisthmic stratum, forming the incipient cuneiform nucleus (Figure 8f). The isthmus and BIC/IC domains are negative. In contrast, Cbln2 leaves unlabeled the preisthmus and marks selectively the BIC/IC/ICol complex. Note the ICol area appears more intensely labeled than the underlying BIC/IC. The SC appears labeled in several layers and can be perfectly distinguished in Figure 8h from the massively labeled rostral tectal gray (TG) formation (another midbrain retinorecipient locus; see Puelles 2022).
The basal or tegmental preisthmus appears distinctly labeled with Dlk1 (Figure 8i). The underlying Figure 8p shows a remnant of Fgf8 activity at a ventricular locus supposed to be just caudally adjacent to the ventricular projection of the basal preisthmus in Figure 8i.
We examine again the Ebf3 pattern at E18.5 (centered on the preisthmus and the SC, plus isolated isthmic cell masses; Figure 8j), as well as the Gad1 pattern (Figure 8k), which illustrates presence of GABAergic neurons in the preisthmus BIC nucleus and IC shell, and some layers of the SC. The isthmus proper remains unlabeled. Gata 3 (Figure 8l) labels weakly the preisthmus and faintly the ICol area.
The pattern of Gfra1 is shown in 6 lateromedial parasagittal section levels (Figure 8m-o, q-s). The major labeled domain is the preisthmus, always found under the negative BIC/IC complex. The three more lateral sections interest the subbrachial and cuneiform nuclei, whereas the medial sections illustrate the preisthmic PAG area and end at the dorsomedial toral region. The superficial and intermediate strata of the SC are positive, and it can be observed that the rostral tectal gray visual formation is wholly negative with Gfra1 (TG; Figure 8m-o, q-s).
The last row in Figure 8 displays 4 dorsoventral horizontal sections labeled with Lhx2 (Figure 8t-w). these sections illustrate the dorsomedial continuity of the positive preisthmic mantle with the symmetric toral bulges that have emerged out of the paramedian roof area, just in front of the isthmus. Lhx2 distinctly labels the ventricular zone and part of the mantle stratum of the toral bulges. Their protrusion into the midbrain ventricle causes the tip of the toral bulges to appear tangentially sectioned in Figure 8v. The last section in Figure 8w shows a standard view of a more ventral part of the IC and the caudally adjacent labeled preisthmic territory.
The described toral phenomenon was studied further by examining the Foxp2 marker, which does not label the preisthmus (and the ICol area) and strongly labels the IC core and the BIC nucleus, apart of multiple layers in the SC. A series of 8 dorsoventral horizontal sections (Figure 9a-h) show that the IC core extends in a hook pattern passing above the preisthmus into the dorsomedial toral area next to the roof plate. Moreover, Foxp2 also labels the mantle of the toral bulges, in continuity with the IC core (Figure 9a-d). There is, though, a sandclock-like shape with an interposed less labeled constriction corresponding to the IC-preisthmic boundary (Figure 9b-d). The toral mantle disappears progressively into Figure 9e,f, where mainly the ventricular lining is cut tangentially. The last section shows the positive BIC nucleus, which continues rostralward the IC core, limited dorsally by the negative ICol area. The last three sections show caudal to the IC some positive preisthmic patches occupying a superficial stratum (subbrachial nucleus), as well as the caudally adjoining positive parabigeminal isthmic nucleus (SubB; PBG; Figure 9f-h).
Indeed, the isthmic subpial PGB nucleus can be now recognized as a group of superficial patches. These patches are labeled distinctly with Enc1(Figure 9i) or with Meis2 (Figure 9j), apart of other deeper neurons (Figure 9k-n). This pattern clearly distinguishes the isthmic mantle from both preisthmus and rh1 (Figure 9i-l). Note the better developed higher Meis2 signal of the ICol contrasting with the BIC/IC complex (Figure 9k-o). The toral bulge seen in Figure 9p also expresses strongly Meis2.
In the last row of Figure 9 we show 4 similarly lateral parasagittal sections illustrating superficial preisthmic signal of Pax5, Penk, Npy, and Zeb2 (Figure 9q-t). Npy signal obviously is also present in the IC, though this may represent migrated cells.
Dorsoventral sections displaying Nrp1 expression reveal labeling of intermediate and superficial strata of the preisthmus, with less signal at the corresponding PAG portion (Figure 10a-d). On the other hand, the PAG under the SC seems specifically labeled, similarly as the IC shell.
We next present images of En1 signal to clarify sequential changes at the dorsomedial toral area. At E16.5 (Figure 10e) the toral area is positive jointly with the preisthmus (not so the IC), but remains undifferentiated, hardly starting to bulge into the ventricular space. At 17.5 (Figure 10f) the toral bulges are more evident and show En1 signal at their mantle layer. At E18.5 (Figure 10g,h) the dorsomedial toral bulges are fully formed, protruding strongly in the ventricle and maintaining En1 expression. Further evidence on these formations was found in the Tal2 expression pattern at E18.5, illustrated in one sagittal section (Figure 10i) and 3 horizontal sections (Figure 10j-l). This marker labels mainly the ventricular zone of the toral bulges, being absent from both the IC and the interposed preisthmic territory.
We also examined Tcf7l2 signal at E16.5 (Figure 10m-p), E17,5 (Figure 10q-s) and E18.5 (Figure 10v-y). At E16.5 and at section levels above the preisthmus, this marker is already continuously expressed from the IC core into the immature dorsomedial toral area, leaving the roof plate negative (Figure 10m,n). Once the series intersects the preisthmus more ventrally, this appears negative, though a remnant of the positive toral area is still present (Figure 10o,p). A similar pattern was observed at E17.5 (Figure 10q-s) as well as at E18.5 (Figure 10v-y). This pattern suggests that the toral area is a dorsocaudal prolongation of the IC domain, which ends near the dorsal part of the preisthmus. However, the selective labeling of the toral area by markers such as En1 and Tal2 suggest that there are aspects of its molecular profile comparable to the preisthmus that are absent at the IC, irrespective of shared Tcf7l2 expression.
The free space at the end of row 5 in Figure 10 was used to insert two views of selective labeling at the basal tegmental preisthmus with Slc6a3 and Sst (Figure 10t,u). A singular basal preisthmic dot-like area of expression seen periventricularly in sagittal sections labeled with Trh led to examine coronal sections, finding there is a Trh-positive distinct cell group in the ventral PAG associated to the preisthmus, out of which less numerous similar cells spread out laterally and ventrally (Figure 10z,aa). Finally, both Zfhx3 and Zfhx4 were found to label selectively isthmic superficial masses and other rh1 cell masses, as well as the BIC/IC complex, leaving the preisthmus domain devoid of significant expression (similar to Enc1 and Meis2 described above).
3.5. Midbrain and isthmic gene patterns in postnatal mice.
Figure 11 corresponding to postnatal results shows uniformly adult brain material. The first row of images is dedicated to the basal preisthmus, represented by an elongated and narrow tissue band at the caudal end of the basal midbrain where cells expressing selectively markers such as Calb1, Cck, and Sst are found, among other markers such as dopamine and serotonin (Figure 11a-c and not shown). The two first images show clearly the dorsal and ventral tegmental decussations, which characterize the m1 ventral midline or floor, placed just in front of the m2 floor. Behind m2 we see the IMB limit and at some distance the decussation of the brachium conjunctivum, known to decussate across the isthmic floor (Watson et al. 2017; this is irrespective that some outdated sources place it in the midbrain). Figure 11a,b also show distinctly the prepontine interpeduncular nucleus complex lying just caudal to the superficial end of the basal m2 at the apex of the cephalic flexure (see Lorente-Cánovas et al. 2012), as well as the major mass of the dorsal raphe nucleus periventricularly (dr; see Alonso et al. 2012).
The second and third rows show coronal sections representing actually horizontal sections across the IMB and the preisthmus, labeled respectively with Cbln2, Dach1, Gfra1, Kctd4, and Penk (Figure 11d-i). Cbln2 is a marker of the superficial isthmic and rh1 nuclei, which labels as well parts of the IC, but leaves the intercalated preisthmic domain wholly negative. This lack of signal can be followed from the PAG across the intermediate cuneiform area into the superficial derivative, the subbrachial nucleus (PAG, Cnf, SubB; Figure 11d). Dach1 labels weakly a few neurons distributed across the three strata of the preisthmic domain, and leaves unlabeled the IC and the isthmus (Figure 11e). Gfra1 is a preisthmus marker and the corresponding sector of the PAG appears densely labeled (note boundary with the IC PAG sector), as well as the adjacent Cnf nucleus (Figure 11f). There are also some weakly positive isthmic cells. Kctd4 labels selectively preisthmic elements and illustrates here mainly the preisthmic PAG and the adjacent Cnf nucleus (Figure 11g). The last two sections in Figure 11h,i show Penk signal at the preisthmic domain (again PAG and Cnf) as well as at the underlying superficial isthmus (the PBG nucleus).
Returning to the dorsomedial toral area, we first show it at P1 labeled selectively in connection with the preisthmus with En1 (Figure 12a-c). Labeling is massive at the toral region and decreases somewhat into the adjacent preisthmus. There is no signal in the IC core. Complex additional details characterize the isthmic derivatives that express En1, a marker that is also present at the diverse sectors of the PAG (Figure 12a-c). Next, we examined Tcf7l2 signal at the IC and the toral region at P1 (Figure 12d), P2 (Figure 12e) and P4 (Figure 12f). We observed over these stages that the toral bulges gradually become flattened. Sagittal sections at P4 labeled with Tcf7l2 or Six3 show the marked flattening of the former toral bulges (tor), practically changing into the thin roof-related membrane that separates the rostral cerebellar lobules from the midbrain ventricular cavity (Figure 12j,m).
The sagittal sections shown in Figure 12g-I correspond to selective labeling of preisthmic patches of PAG with the markers Slc17a8, Id4, and Rgs4, respectively. The sagittal images in Figure 12k,l illustrate superficial labeling of the subbrachial preisthmic nucleus (SubB) with Penk and Pitx1, respectively. Other markers also labeling selectively the SubB nucleus are Ebf3 and Nts (Figure 12n,o), whereas Irx1 labels the complementary isthmus and BIC/IC domains (Figure 12p).
4. Discussion
Our purpose was to clarify the delimitation, development, genoarchitectural differentiation, and final anatomy of the postulated preisthmic domain, which was originally related to the m2 prosomere of the caudal midbrain by Hidalgo-Sánchez et al. (2005). The specific historic antecedents of this notion were presented in the Introduction but a few general comments are nevertheless convenient.
4.1. The theoretical and technical background of present studies.
The anatomic transition between the midbrain and the pons, thought to be in direct contact in the nineteenth and twentieth centuries, became progressively a battleground between 1) the traditional premolecular ‘columnar’ studies, which were not interested in having a series of transverse neuromeric subdivisions (the ‘anatomically important’ aspects were held to be functional and contained under the concept of longitudinal sensory and motor neuronal ‘columns’; Herrick 1910), and 2) the soon heterodox neuromeric ideas represented initially by, e.g., Orr (1887) and von Kupffer (1906), and later by Palmgren (1921), Bergquist and Källén (1954), and Vaage (1969). These authors did not know about neuromeric functions (we are still learning about them), but they had seen that the early embryonic hindbrain of all vertebrates appears divided into a series of transverse neuromeric bulges called rhombomeres, and the midbrain shows one or two mesomeres. This scenario saw the midbrain-pons transition in a more elaborated manner, resolved nowadays in the concepts of a preisthmic m2 segment caudal to m1, followed by a hindbrain prepontine area divided into the isthmus (rh0) and rh1 neuromeres (Puelles 2013; Nieuwenhuys and Puelles 2016). The important boundary, in more ways than one, was not the imaginary midbrain-pons one, but the isthmo-mesencephalic or m2-rh0 one, to which secondary organizer properties and crucial evolutive intertagmatic roles were later attached (review in Hidalgo-Sánchez et al. 2022 and Albuixech-Crespo et al. 2017).
The neuromeres are not functional mechanisms, but generative units with repetitive modular dorsoventral organization (metamery), the site of distinct patterning, proliferative, migratory and differentiative phenomena. This morphologic insight could have been regarded as complementary to the columnar one, also in functional perspective (see discussion in Nieuwenhuys and Puelles 2016; Amat et al. 2022), but for some reason they were considered mutually incompatible, and the non-functional neuromeric phenomena were simply left aside for 100 years. Kuhlenbeck (1935, 1973) concluded that neuroepithelial neuromeres were early transverse embryonic subdivisions of the neural tube wall that disappeared without consequences as the really important postmitotic neuronal columns emerged in the brain wall. No one asked what mechanism patterns the columns along DV and AP dimensions; they notably produce different nuclei at different rostrocaudal levels at hindbrain levels, and considerable uncommented diversity in the postulated forebrain columns. This was the orthodox scenario in the field until developmental genes made their appearance and that issue was first addressed.
Once molecular biology progressed sufficiently, it was possible to map the expression domains of single genes in the developing brain. It was soon discovered that developmental genes admitted both longitudinal and transversal expression patterns, which indicated that the neural wall was exposed to overall dorsoventral and anteroposterior patterning and molecular regionalization mechanisms were studied in much detail thereafter, partly through the notion of secondary organizers. This opened the way to a synthesis of columnar and neuromeric causal mechanisms, and the forgotten neuromeres duly returned to the literature around the mid-eighties. Neuromeres do not need to disappear so that columns emerge. There are genes for neuromeric patterns and genes for columnar patterns (often downstream ones). The columnar neurons must be born out of neuroepithelial progenitors positioned within specific neuromeric molecular coordinates. Segmented progenitors surely have something to say about what becomes what in the brain. As a consequence, cryptic neuromeric molecular patterns and boundaries persist in the adult. Moreover, primary mantle columns absolutely need to subdivide into different parts, if we want to register and understand the real complexity of resultant adult structure. The whole hypothalamus and the whole dorsal thalamus were originally held to be uniform columns, but obviously cannot be understood functionally or explained causally without partitioning them. The issue is that neuromeric pattern and boundaries are needed for that (e.g., García-Guillén et al. 2021).
In any case, an early result of the molecular era was that some genes mark permanently the interneuromeric boundaries or are restricted to single neuromeres or neuromere parts (which accordingly do not disappear physically over development; they just become cryptic as differentiation and histogenesis advance). Nowadays we can label selectively the entire progeny of given neuromeres in the adult brain by means of selective transgenic design (e.g., Di Bonito et al. 2017; Watson et al. 2017). We also can see how many neuromeric units participate with specific dorsoventral modules in a functional column (Tomás-Roca et al. 2016). We have a clear idea of the neuromeres and columns we can find in the hypothalamus (Puelles et al. 2012b).
After some 40 years of progress into these aspects, it seems odd that there still exists a neuromeric unit -the m2 mesomere that occupies us here- that is largely unknown by embryologists and anatomists, even though it was first postulated 100 years ago (Palmgren 1921) and glimpsed even before (von Kupffer 1906). After studies of the midbrain in several vertebrates, Palmgren (1921) concluded that practically the whole midbrain originated from the rostral large m1 mesomere. Contrarily, he thought that the minor caudal embryonic unit (m2) remained atrophic, showed little growth in surface, and produced no neuronal derivatives. It was thus more a boundary of m1 with the isthmic hindbrain than a proper generative unit for a particular part of the brain. This strange concept was later assumed by Vaage (1969) in his general review of chicken neuromeres, as well as his first-rate descriptive work on the developing isthmic region (Vaage 1973). We also used this unsatisfactory notion in Puelles and Martinez-de-la-Torre (1987).
Eventually, Hidalgo-Sánchez et al. (2005) applied genoarchitectonic procedures to the analysis of the origin of chicken isthmic nuclei. Vaage (1973) had credibly concluded that one of them was mesencephalic, others were isthmic, and still another could be perhaps ascribed to rh1; these conclusions were supported by our autoradiographic neurogenetic data (Puelles and Martínez-de-la-Torre 1987). Having read about the role of Otx2 as defining the caudal boundary of the midbrain, we decided to map the position of the problematic ‘falsely isthmic’ midbrain nucleus relative to the Otx2 boundary, adding other local markers such as Fgf8, Gbx2, and Pax2. These data revealed that indeed the nucleus was molecularly mesencephalic, that is, Otx-positive. It lay rostral to the Otx2-negative isthmic derivatives, but, surprisingly, caudal to the structurally and molecularly distinct auditory structures (whose mantle uniquely downregulates Otx2; we found this feature reproduced in the mouse). We noticed that some other structures seemed in the same situation, and could be jointly labeled selectively with Pax2 (not so the auditory midbrain and the rest of m1).
These data connected with the classic m2 concept, allowing the novel conclusion that our Otx2/Pax2-positive domain caudal to the torus had to be the missing brain domain derived from the m2 mesomere (Hidalgo-Sánchez et al. 2005). It had been long misidentified as a part of the isthmus (which non-neuromeric authors believed a part of the midbrain). The m2 thus became a normal neuromere, a distinct generative unit, even if still surprisingly small when compared with m1.
4.2. The preisthmus or m2 mesomere
We built here upon the earlier work in the mouse of Puelles et al. (2012a; note the first author in this publication was E.Puelles, not LP). We basically expanded the developmental knowledge about the mouse preisthmus. As far as we are aware, nobody else has approached this subject in any detail with exception of Hidalgo-Sánchez et al. (2022).
Our present results in the mouse corroborated the old observations of Palmgren (1921) and Vaage (1969) on the early existence of a caudal small diverticule of the mesencephalic vesicle, already known to classic authors as the ‘posterior intraencephalic sulcus’ of von Kupffer (1906). Palmgren and Vaage thought it represented the small and supposedly atrophic cavity of the m2 mesomere. We showed that this diverticule is indeed included in the midbrain according to the Otx2 criterium, though its caudal lip seems to belong to the Fgf8-positive isthmus. The transverse Otx2/Fgf8 limit represents the modern molecular concept of the isthmo-mesencephalic boundary (IMB; Watson et al. 2017), which has been associated in much experimental work to the isthmic organizer. We have also confirmed previous results in the literature indicating that the isthmus does not stop rostrally at the early macroscopic constriction visible between the midbrain and the hindbrain, but penetrates slightly into the caudal aspect of the midbrain vesicle.
Another developmental gene thought to be relevant for the isthmic organizer -Wnt1- was found to be expressed precisely in a transverse ring configuration along the IMB limit (as well as longitudinally along the midbrain roof plate). The neurogenetic Ascl1 marker showed an interesting exclusion of the sulcal m2 area from its ample area of midbrain expression. Several other genes (Id2, Lhx2, Sfrp1, Pax3 or Irx1) respected specifically the m2 territory at E11.5. In contrast, Sall3 labelled nearly exclusively the m2. The Lhx5 gene respected the sulcal m2 area at E11.5, but showed selective m2 labeling at all later stages. It is plausible that the early pattern of this marker refers to basal plate levels (the alar components being perhaps still absent), whereas the later m2 positivity includes an alar pattern. We could not verify that Pax2 is expressed in the m2 domain, in apparent contradiction to our positive data in the chick (Hidalgo-Sánchez et al. 2005).
At E11.5 there are genes whose signal crosses the IMB and distributes gradientally in both the caudal midbrain and the rostral prepontine hindbrain (e.g., En1, Pax5). We noted at subsequent stages that the midbrain distribution of these markers remained largely restricted to m2 and did not penetrate significantly the auditory midbrain.
4.3. Anteroposterior versus dorsoventral dimensions and regionalization in the midbrain.
The m1/m2 subdivision is an AP pattern, and this topology is permanent, irrespective of later deformations in the shape and partitions of the alar midbrain due to differential growth. Indeed, as development proceeds three deforming phenomena occur in parallel.
On one hand, the midbrain alar and roof plates grow much more in surface than the basal plate and floor areas. Within the alar plate, neurogenesis occurs reportedly in a main rostrocaudal gradient, with a secondary basodorsal gradient (LaVail and Cowan 1971; but see Amat et al. 2022). On the other hand, the whole neural tube bends ventrally at the cephalic flexure, with an apex just under the midbrain, apparently due to the summed effect of all forebrain and hindbrain alar plate regions growing more that the basal ones. The third minor deformation reflects the partial sucking up of the isthmic hindbrain into the caudal aspect of the midbrain (a process that is already incipient at E11.5, as seen in the horizontal sections), and later causes a larger intussusception and mesencephalopetal arching of the IMB.
The combination of the first two processes of deformation generates the deformed wedge shape of the midbrain in its AP dimensions, with a very small floor area (practically restricted to the dimension of the root of the oculomotor nerve) which contrasts with extensive alar and roof plates (the degree of this deformation varies in different vertebrate species; Amat et al. 2022). Imaginary equidistant transverse lines traced from the floor to the roof would spread out dorsalward in a fan shape, representing in every case the transverse dimension. The rostrocaudal neurogenetic gradient explains that the caudal imaginary transverse lines spread out more caudalwards than rostralwards (proliferation persists longer at caudal levels).
The fact that as development proceeds the m1/m2 boundary (similarly as the IMB) increasingly bends backwards can thus be easily explained, because we deal here with one of the imaginary caudal transverse reference lines, which widely fans out caudalwards, while retaining its topologic transverse character. Topographically, the caudal preisthmus thus apparently comes to lie ‘under’ the auditory BIC/IC complex, though it really remains topologically caudal to it. These topologic considerations are somewhat banal, but need to be clear to evade pitfalls in developmental reasoning on gradients or on the interpretation of adult connectivity patterns, which usually are organized topologically, rather than topographically.
Our analysis suggests that the auditory IC and BIC formations, irrespective of their common functional specialty, molecular similarity, and probable mutual interconnections, possibly belong to different AP domains of the m1 alar plate. The BIC formation can be easily understood as a ventrolateral subdomain of the superior colliculus AP domain. The IC singly neighbors rostrally the preisthmus down to their parallel selective participation in the PAG.
The dorsocaudal tip of the SC is also much deformed caudalwards, following obviously the general fan-shaped alar deformation. If we add the rostral tectal gray (TG), also complemented ventrolaterally by the rostralmost BIC, we believe that alar AP regionalization in front of m2 may entail IC, SC/BIC and TG/BIC transverse sectors, making with the preisthmus a total of 4 distinct AP domains (the role of the IColl domain needs further study). This analysis of midbrain AP pattern also affects the theory of PAG structure, presently still largely driven by DV subdivisions and rather unitary anatomic assumptions on its AP pattern.
4.4. Development and fate of the preisthmic neuromere.
It may be wondered whether the preisthmus is a neuromere by itself, since it might be conceived simply as the caudalmost AP subdivision of m1 secondary to isthmic patterning. We know by now that neuromeres do not need to bulge out and be limited by constrictions to exist (the posterior intraencephalic sulcus thus is irrelevant). They can be cryptic from a macroscopic viewpoint (Cambronero and Puelles 2000), but real from a mechanistic molecular viewpoint (Puelles and Rubenstein 2003; Puelles 2018). The tectal gray, superior colliculus and inferior colliculus of the midbrain are not considered neuromeres because these partitions (also molecular) only exist in the alar plate; they lack corresponding distinct basal parts. What establishes the neuromeric nature of an AP molecular delimitation in the brain is that the interneuromeric limits are general ones dorsoventrally, separating whole transverse units of the neural tube (the criterium of completion; Puelles and Rubenstein 2003). While not always we know of genes that label a complete neuromere (both basal and alar parts; but see the case of rh4 in Di Bonito et al. 2017), in the case of m2 we have the Sall3 pattern (Figure 2a-d). Moreover, we found some shared markers in both alar and basal parts of the preisthmus, as well as a dorsoventral continuity of its general boundaries from roof to floor. We thus postulate that m2 fulfills the criterium for representing a neuromeric unit of the midbrain, distinguished in various molecular and structural aspects from the larger m1 unit (e.g., there is no motoneuronal population in m2).
Hidalgo-Sánchez et al. (2022) coherently inserted the preisthmus as the midbrain area closest to the isthmic organizer in their schema of territories affected by the signaling originated at the organizer (their Figure 10). This implies that the molecular peculiarities of this territory probably obey to their exposure to high levels of FGF8 and WNT1 in the context of Otx2 and relatively high levels of other determinants (e.g., Fgf15, En1, En2, Lhx5, Pax5, Pax8; see full review in Hidalgo-Sánchez et al. 2022).
It has been reported that neurogenesis is initially retarded selectively at m2, compared to m1 in general (Amat et al. 2022; data for rat, chick and lizard). This effect may be related to Her5 activity in this area (e.g., Tallafuβ and Bally-Cuif 2003; reviewed by Hidalgo-Sánchez et al. 2022), as well as by the observed selective lack of proneural Ascl1 expression at E11.5 (Figure 1n) and high levels of Fgf15 and Sall3 (Figure 1g; 2a-d).
Both prenatally and postnatally a significant set of positive and negative markers detect rather precisely the same boundaries of the preisthmus, either relative to the isthmus (marked by Fgf8 and Wnt1 signals) or to the auditory complex of m1 (IC; marked by its absence of mantle Otx2 signal and various specific positive markers, such as Meis2, Pou3f3, Pou4f1, and Tcf7l2). Lhx5 was peculiar in labeling strongly a thicker periventricular stratum, and weakly a thinner subpial stratum that seems to extend tangentially into the marginal stratum of the inferior colliculus (Figure 5h-n). This suggests a migration of preisthmic cells into the superficial IC (the ulterior IC shell?). Other suggestions of tangential migration are raised by the patterns of Npy-, Six3- and Nkx2.2-positive cells, which also seem to spread out of the preisthmus into the auditory complex.
At E15.5 we observed a more marked intussusception of the isthmic mantle into the mesencephalic lobe (Figure 6i-l). The two separate strata of Lhx5 signal are still present (Figure 7q-s). We noted labeling of the basal preisthmus with Nts, Pou6f2, Sst, and Zfhx3.
At E18.5 the morphology of the midbrain is nearly mature and many more details of final structure can be first observed (notably, the development of the PAG). The alar preisthmus thus starts to be differentiable into periaqueductal, intermediate and superficial strata. A distinct Trh-positive basal periaqueductal nucleus was observed. The main novelty was the bulging inwards of the dorsomedial toral region, which evolves since E16.5, to be discussed in the last section (T; Figure 8t-w; 9aa-h; 10e-y).
At postnatal stages and in topologically horizontal sections (insofar as they show parts of the hindbrain ‘ventrally’, and the actually rostral midbrain ‘dorsally’; see clarificatory schema in Alonso et al. 2012) the preisthmus appears at the back of the IC, as a concave radial arch that partially embraces the medial and ventral aspects of the IC, stretching from the caudal PAG (part of which is preisthmic) into the classic cuneiform area, which we divide into the intermediate cuneiform nucleus (CnF) and the superficial subbrachial nucleus (SubB) (Figure 11f-i). It limits ‘ventrally’ (in fact caudally) with the isthmic region, where the parabigeminal and microcellular tegmental nuclei plus the isthmic reticular formation can be identified as superficial and intermediate entities. The IC, divided into core and shell (cortical) formations, sits directly on top of (rostral to) the CnF and SubB, but reaches directly its own PAG sector above the preisthmic PAG (Figure 11f). The basal part of the preisthmus is a narrow transverse retrorubral band intercalated between the oculomotor (m1) and trochlear (rh0) nerve nuclei, and between the dorsal and ventral tegmental decussations (in m1) and the decussation of the brachium conjunctivum (rh0; Figs,11a,b). The basal domain is slightly more populated and less narrow at periventricular PAG level than elsewhere. The positive alar preisthmus markers we illustrated are Dach1, Ebf3, En1, Gfra1, Id4, Kctd4, Nts, Otx2, Penk, Pitx1, Rgs4, Six3, and Slc17a8 (some of these found only in the alar preisthmic PAG). Cbln2, Irx1, and Tcf7l2 were shown as negative markers at these stages. The basal preisthmus was identified with Calb1, Cck, and Sst. Note Puelles et al. (2012a) and Alonso et al. (2012) showed additional dopaminergic and serotonergic markers.
On the whole, the anatomic assessment of the preisthmus first reported by Hidalgo-Sánchez et al. (2005) in the chick and Puelles et al. (2012a) in the mouse was corroborated. The illustrated markers of this territory can help in experimental embryological studies of this territory, and may help as well with appropriate connectivity and functional studies on preisthmic populations. We think that the novel findings relative to the existence of particular topologically AP sectors of the PAG corresponding to the preisthmus and the IC are of interest for the workers in this field.
4.5. The issue of the dorsomedial toral bulges.
This is an issue that had not been detected before. While examining E13.5 specimens we wondered about the meaning and fate of the undifferentiated area dorsomedial to the preisthmus, which reaches the roof plate. This area expressed Otx2, En1 and Pax5 and resembled the preisthmic profile (Figure 3c,m; 4a,b). At E15.5 the aspect of this area was similar, as shown labeled with Otx2, Tcf7l2 and Lhx2 (e.g., Figure 6m,n; 7i,j,m,n). However, at E18.5 distinct development of the dorsomedial caudalmost area had occurred, producing massive rounded bulges that protruded toroidal-like into the ventricular cavity. Note adult mammals lack such midbrain ventricular bulges, but their reptilian ancestors probably did have them, as have all present-day amphibians, reptiles and birds (Puelles et al. 1994). The present late embryonic toral bulges in the mouse are in a way a reminiscence of ancestral conditions.
Analysis at postnatal stages illustrated the rapid morphogenetic disappearance of the toral bulges over the postnatal P1-P4 period. This morphogenetic effect may be due to stretching produced in the dorsomedial toral area by the massive growth of the inferior colliculus (and the latter being pushed back by the parallel massive caudal growth of the superior colliculus). The region first loses the intraventricular protrusions (Figure 12a-f,j) and then continues thinning progressively. It persists in the adult as a tenuous membrane usually ascribed to the roof plate, which is continuous with the similarly thinned isthmic roof plate (Figure 12m). Classical neuroanatomy called this thin membrane the ‘velum medullare superior’ of the cerebellum, though, as we see, it is properly not a part of the cerebellum.
It may be discussed whether the toral region should be ascribed to the dorsal end of the preisthmus within m2, or represents merely a molecularly peculiar extension of the inferior colliculus within the caudalmost dorsal m1. The early pattern of Otx2 at E13.5, when the IC domain has already reduced its earlier Otx2 signal to its ventricular zone (Figure 3a-g) suggests that the Otx2-positive toral region is attached to the positive preisthmus. However, the toral area is undifferentiated at this stage, and therefore it might represent an area of the IC that still has not lost its early Otx2 signal. Possibly for the same reason, the toral expression of Pax5 and En1 is continuous with that of the preisthmus and no such signal appears at the incipiently differentiated IC primordium (Figure 3i,l,m; 4a,b), while the selective IC labeling with Tcf7l2 does not extend initially into the toral area (Figure 4aa,bb). At E13.5 and E14.5, the selective IC markers Foxp2 and Tcf7l2 do not extend yet as far caudally as the toral area (see Allen data). However, at E15.5 the Tcf7l2-positive IC mantle starts to extend towards the toral area, finally occupying it fully over E16.5 and E17.5, thus creating the pattern shown at E18.5 (Allen data). We thus think that the most reasonable interpretation is that the toral area belongs to the IC within m1, being its caudalmost, dorsalmost and latest differentiated part. Possibly due to its closeness to the isthmic organizer it may be subjected at early stages to anti-neurogenic signaling, perhaps vehiculated by the En1 and Pax5 genes, if not by Wnt1, perhaps also making it susceptible to subsequent postnatal degeneration.
5. Conclusions
Our studies enrich available genoarchitectural knowledge on the developing preisthmic midbrain domain in the mouse, and establish on a strong basis its early developmental boundaries with regard to both the isthmic hindbrain and the rest of the midbrain, starting with the rostrally adjacent auditory midbrain and the rubral m1 tegmentum. The possibility that the preisthmus contains the progeny of the m2 mesomere postulated by von Kupffer (1906), Palmgren (1921) and Vaage (1969, 1973) is supported, thus falsating their hypothesis that this neuromere is atrophic and lacks a progeny (as was done previously in the chick by Hidalgo-Sánchez et al. 2005). Irrespective of its reduced overall size, the collective domain formed by demonstrable alar and basal subdomains of the molecularly defined preisthmus fulfills the completion criterium of Puelles and Rubenstein (2003), thus supporting its neuromeric nature (i.e., as a complete AP sector of the neural tube). The molecular distinctness and singular histic fate of the preisthmus is attributed to an early effect of high concentrations of the isthmic organizer morphogens FGF8 and WNT1 within competent midbrain-specified neuroepithelium. Our analysis suggests that the midbrain gets divided minimally into four distinct AP regions. The caudalmost one is represented singly by the preisthmus (m2), while the larger m1 unit gets divided into at least three AP regions identified by their alar components as inferior colliculus, superior colliculus, and tectal gray regions, whose full dorsoventral partition is not yet fully resolved.
References
- Albuixech-Crespo B, López-Blanch L, Burguera D, Maeso I, Sánchez-Arrones L, Moreno-Bravo JA, Somorjai I, Pascual-Anaya J, Puelles E, Bovolenta P, Garcia-Fernàndez J, Puelles L, Irimia M, Ferran JL. 2017. Molecular regionalization of the developing amphioxus neural tube challenges major partitions of the vertebrate brain. PLOS Biology 2017 Apr 19;15(4):e2001573. [CrossRef]
- Alonso A, Merchán P, Sandoval JE, Sánchez-Arrones L, Garcia-Cazorla A, Artuch R, Ferrán JL, Martínez-de-la-Torre M, Puelles L. 2012. Development of the serotonergic cells in murine raphe nuclei and their relations with rhombomeric domains. Brain Struct Funct 218:1229-1277.
- Amat JA, Martínez-de-la-Torre M, Trujillo CMª, Fernández B, Puelles L. 2022. Neurogenetic heterochrony in chick, lizard and rat mapped with wholemount AChE and the prosomeric model. Brain Behav Evol. [CrossRef]
- Ayad, A. 2014. Genoarquitectura comparada del mesencéfalo alar en el ratón y el pollo. Doctorado en Biología (Neurociencia). Universidad de Murcia.
- Bergquist, H. , Kallen, B. 1954. Notes on the early histogenesis and morphogenesis of the central nervous system in vertebrates. J Comp Neurol 100:627-659.
- Cambronero F, Puelles L. 2000. Rostrocaudal nuclear relationships in the avian medulla oblongata: fate-map with quail-chick chimeras. J Comp Neurol 427:522-545.
- Crossley PH, Martinez S, Martin GR. 1996. Midbrain development induced by FGF8 in the chick embryo. Nature 380:66-68. [CrossRef]
- Di Bonito, M.A. , Studer M., and Puelles L. 2017. Nuclear derivatives and axonal projections originating from rhombomere 4 in the mouse hindbrain. Brain Struct Funct 222:3509-3542. [CrossRef]
- Díaz C, Yanes C, Trujillo C-M, Puelles L. 2000. Cytoarchitectonic subdivisions in the subtectal midbrain of the lizard Gallotia galloti. J Neurocytol 29:569-593.
- García-Guillén IM, Martínez-de-la-Torre M, Puelles L, Aroca P, Marín F. 2021. Molecular segmentation of the sensory trigeminal column in the adult mouse brain. Front Neuroanat 2021 Dec 10;15:785840. [CrossRef]
- Grapin-Botton A, Cambronero F, Weiner HL, Bonnin M-A, Puelles L, Le Douarin NM. 1999. Patterning signals acting in the spinal cord override the organizing activity of the isthmus. Mech Devel 84:41-53.
- Hidalgo-Sánchez M, Martínez-de-la-Torre M, Alvarado-Mallart RM, Puelles L. 2005. Distinct pre-isthmic domain, defined by overlap of Otx2 and Pax2 expression domains in the chicken caudal midbrain. J Comp Neurol 483:17-29.
- Hidalgo-Sánchez M, Andreu-Cervera A, Villa-Carballar S, Echevarria D. 2022. An update on the molecular mechanism of the vertebrate isthmic organizer development in the context of the neuromeric model. Front. Neuroanat 16:2017-241. [CrossRef]
- Kuhlenbeck, H. 1935. Über die morphologische Bewertung der sekundären Neuromerie. Anat Anz 81:129-148.
- Kuhlenbeck, H. 1973. The central nervous system of vertebrates, Vol. 3, part II: Overall morphological pattern. Karger: Basel.
- LaVail, JH. Cowan WM. 1971. The development of the chick optic tectum. II. Autoradiographic studies. Brain res 28:421-441.
- Lorente-Cánovas B, Marín F, Corral-San-Miguel R, Hidalgo-Sánchez M, Ferran JL, Puelles L, Aroca P. 2012. Multiple origins, migratory paths and molecular profiles of cells populating the avian interpeduncular nucleus. Devel Biol 361:12-26.
- Martinez S, Alvarado-Mallart, R-M. 1990. Expression of the homeobox Chick-en gene in chick/quail chimeras with inverted mes-metencephalic grafts. Devel Biol 139:432–436. [CrossRef]
- Martinez S, Wassef M, Alvarado-Mallart R-M. 1991. Induction of a mesencephalic phenotype in the 2-day-old chick prosencephalon is preceded by the early expression of the homeobox gene en. Neuron 6:971–981. [CrossRef]
- Martínez S, Marín F, Nieto, MA, Puelles L. 1995. Induction of ectopic engrailed expression and fate change in avian rhombomeres: intersegmental boundaries as barriers. Mech Devel 51:289-303.
- Martinez S, Crossley PH, Cobos I, Rubenstein JL, Martin GR. 1999. FGF8 induces formation of an ectopic isthmic organizer and isthmocerebellar development via a repressive effect on Otx2 expression. Development 126:1189–1200. [CrossRef]
- Meinhardt, H. 2009. Models for the generation and interpretation of gradients. Cold Spring Harb Perspect Biol. Oct;1(4):a001362. [CrossRef]
- Nieuwenhuys R, Puelles L. 2016. Towards a New Neuromorphology. Berlin, Springer Verlag. ISBN 978-3-319-25692-4.
- Palmgren, A. 1921. Embryological and morphological studies on the midbrain and cerebellum of vertebrates. Acta Zool (Stockh.) 2:1-94.
- Paxinos G, Franklin KBJ. 2013. The Mouse Brain in Stereotectic Coordinates. 4th edit. London, Walthan, San Diego: Academic Press/Elsevier.
- Puelles, L. 2013. Plan of the developing vertebrate nervous system relating embryology to the adult nervous system (prosomere model, overview of brain organization), In: J.L.R. Rubenstein and P. Rakic editors: Comprehensive Developmental Neuroscience: Patterning and Cell Type Specification in the Developing CNS and PNS, Amsterdam: Academic Press, pp. 187-209.
- Puelles, L. 2016. Comments on the limits and internal structure of the mammalian midbrain. Anatomy [Intl.J.Exp.&Clin Anat] 10:60–70. [CrossRef]
- Puelles, L. 2018. Developmental studies of avian brain organization. Int J Dev Biol 62:207-224.
- Puelles, L. 2019. Survey of midbrain, diencephalon, and hypothalamus neuroanatomic terms whose prosomeric definition conflicts with columnar tradition. Front. Neuroanat. 13:20. [CrossRef]
- Puelles, L. 2022. Prosomeric classification of retinorecipient centers: a new causal scenario. Brain Struct Funct. [CrossRef]
- Puelles L, Martínez de la Torre M. 1987. Autoradiographic and Golgi study on the early development of n. isthmi principalis and adjacent grisea in the chick embryo: a tridimensional viewpoint. Anat Embryol 176:19-34.
- Puelles L, Rubenstein JLR. 2003. Forebrain gene expression domains and the evolving prosomeric model. Trends Neurosci 26:469-476.
- Puelles L, Rubenstein JL. 2015. A new scenario of hypothalamic organization: rationale of new hypotheses introduced in the updated prosomeric model. Front Neuroanat. Mar 19;9:27. [CrossRef]
- Puelles L, Amat JA, Martínez de la Torre M. 1987. Segment-related, mosaic neurogenetic pattern in the forebrain and mesencephalon of early chick embryos. I. Topography of AChE-positive neuroblasts up to stage HH18. J Comp Neurol 266:147-268.
- Puelles L, Robles C, Martinez de la Torre M, Martinez S. 1994. New subdivision schema for the avian torus semicircularis: neurochemical maps in the chick. J Comp Neurol 340:98-125.
- Puelles L, Marín F, Martínez S, Martínez-de-la-Torre M. 1996. The midbrain-hindbrain junction: A model system for brain regionalization through morphogenetic neuroepithelial interactions. In: "Mammalian Development ", P.Lonai (ed). Gordon & Breach/Harwood Academic Publishers, Amsterdam.
- Puelles L, Martínez-de-la-Torre M, Paxinos G, Watson C, Martínez S. 2007. The Chick Brain in Stereotaxic Coordinates: An Atlas featuring Neuromeric Subdivisions and Mammalian Homologies. San Diego: Elsevier/Academic Press.
- Puelles L, Martinez-de-la-Torre M, Martinez S, Watson C, Paxinos G. 2019. The Chick Brain in Stereotaxic Coordinates and Alternate Stains. 2nd.edit. New York: Academic Press.
- Puelles E, Martinez-de-la-Torre M, Watson C, Puelles L. 2012a. Midbrain. Chapter 10 in «The Mouse Nervous System ». Watson C, Paxinos G, Puelles L (eds). Academic Press/Elsevier; pp. 337-359.
- Puelles L, Martinez-de-la-Torre M, Bardet S, Rubenstein, JLR. 2012b. Hypothalamus. Chapter 8 in “The Mouse Nervous System”. Watson C, Paxinos G, Puelles L (eds). Academic Press/Elsevier; pp221-312.
- Tallafuß A, Bally-Cuif L. 2003. Tracing of her5 progeny in zebrafish transgenics reveals the dynamics of midbrain-hindbrain neurogenesis and maintenance. Development 130:4307–4323. [CrossRef]
- Timpe LC, Jin KL, Puelles L, Rubenstein JLR. 1999. Cyclic nucleotide-gated cation channel expression in chicken embryos. Mol Brain Res 66:175-178.
- Tomás-Roca L, Corral-San-Miguel R, Aroca P, Puelles L, Marín F. 2016. Crypto-rhombomeres of the mouse medulla oblongata, defined by molecular and morphological features. Brain Struct Funct 221:815-838.
- Vaage, S. 1969. The segmentation of the primitive neural tube in chick embryos (Gallus domesticus). Ergeb.Anat.Entwick. 41:1-88.
- Vaage, S. 1973 The histogenesis of the isthmic nuclei in chick embryos (Gallus domesticus).I. A morphological study. Z. Anat. Entwick. 142:283-314.
- Von Kupffer, K. (1906) Die Morphogenie des Centralnervensystems. In: Handbuch der Vergleichende und Experimentelle Entwicklungslehre der Wirbelthiere. Vol.2 (3):1-119. O.Hertwig (ed). Fischer: Jena.
- Watson C, Shimogori T, Puelles L. 2017. Mouse FGF8-Cre lineage analysis defines the territory of the postnatal mammalian isthmus. J Comp Neurol. 525:2782-2799.
Figure 1.
Plate illustrating diverse E11.5 mouse brain sagittal (a-c,g-j, m,n, p-w, y, cc-dd) or horizontal (k,l, o, x, z-bb) sections reacted for the gene markers indicated at the bottom. The gene name is indicated only in the first image of a series. In sagittal sections rostral is to the left and dorsal upwards, whereas in horizontal sections rostral is up and caudal at the bottom. The magnification is the same in all cases.
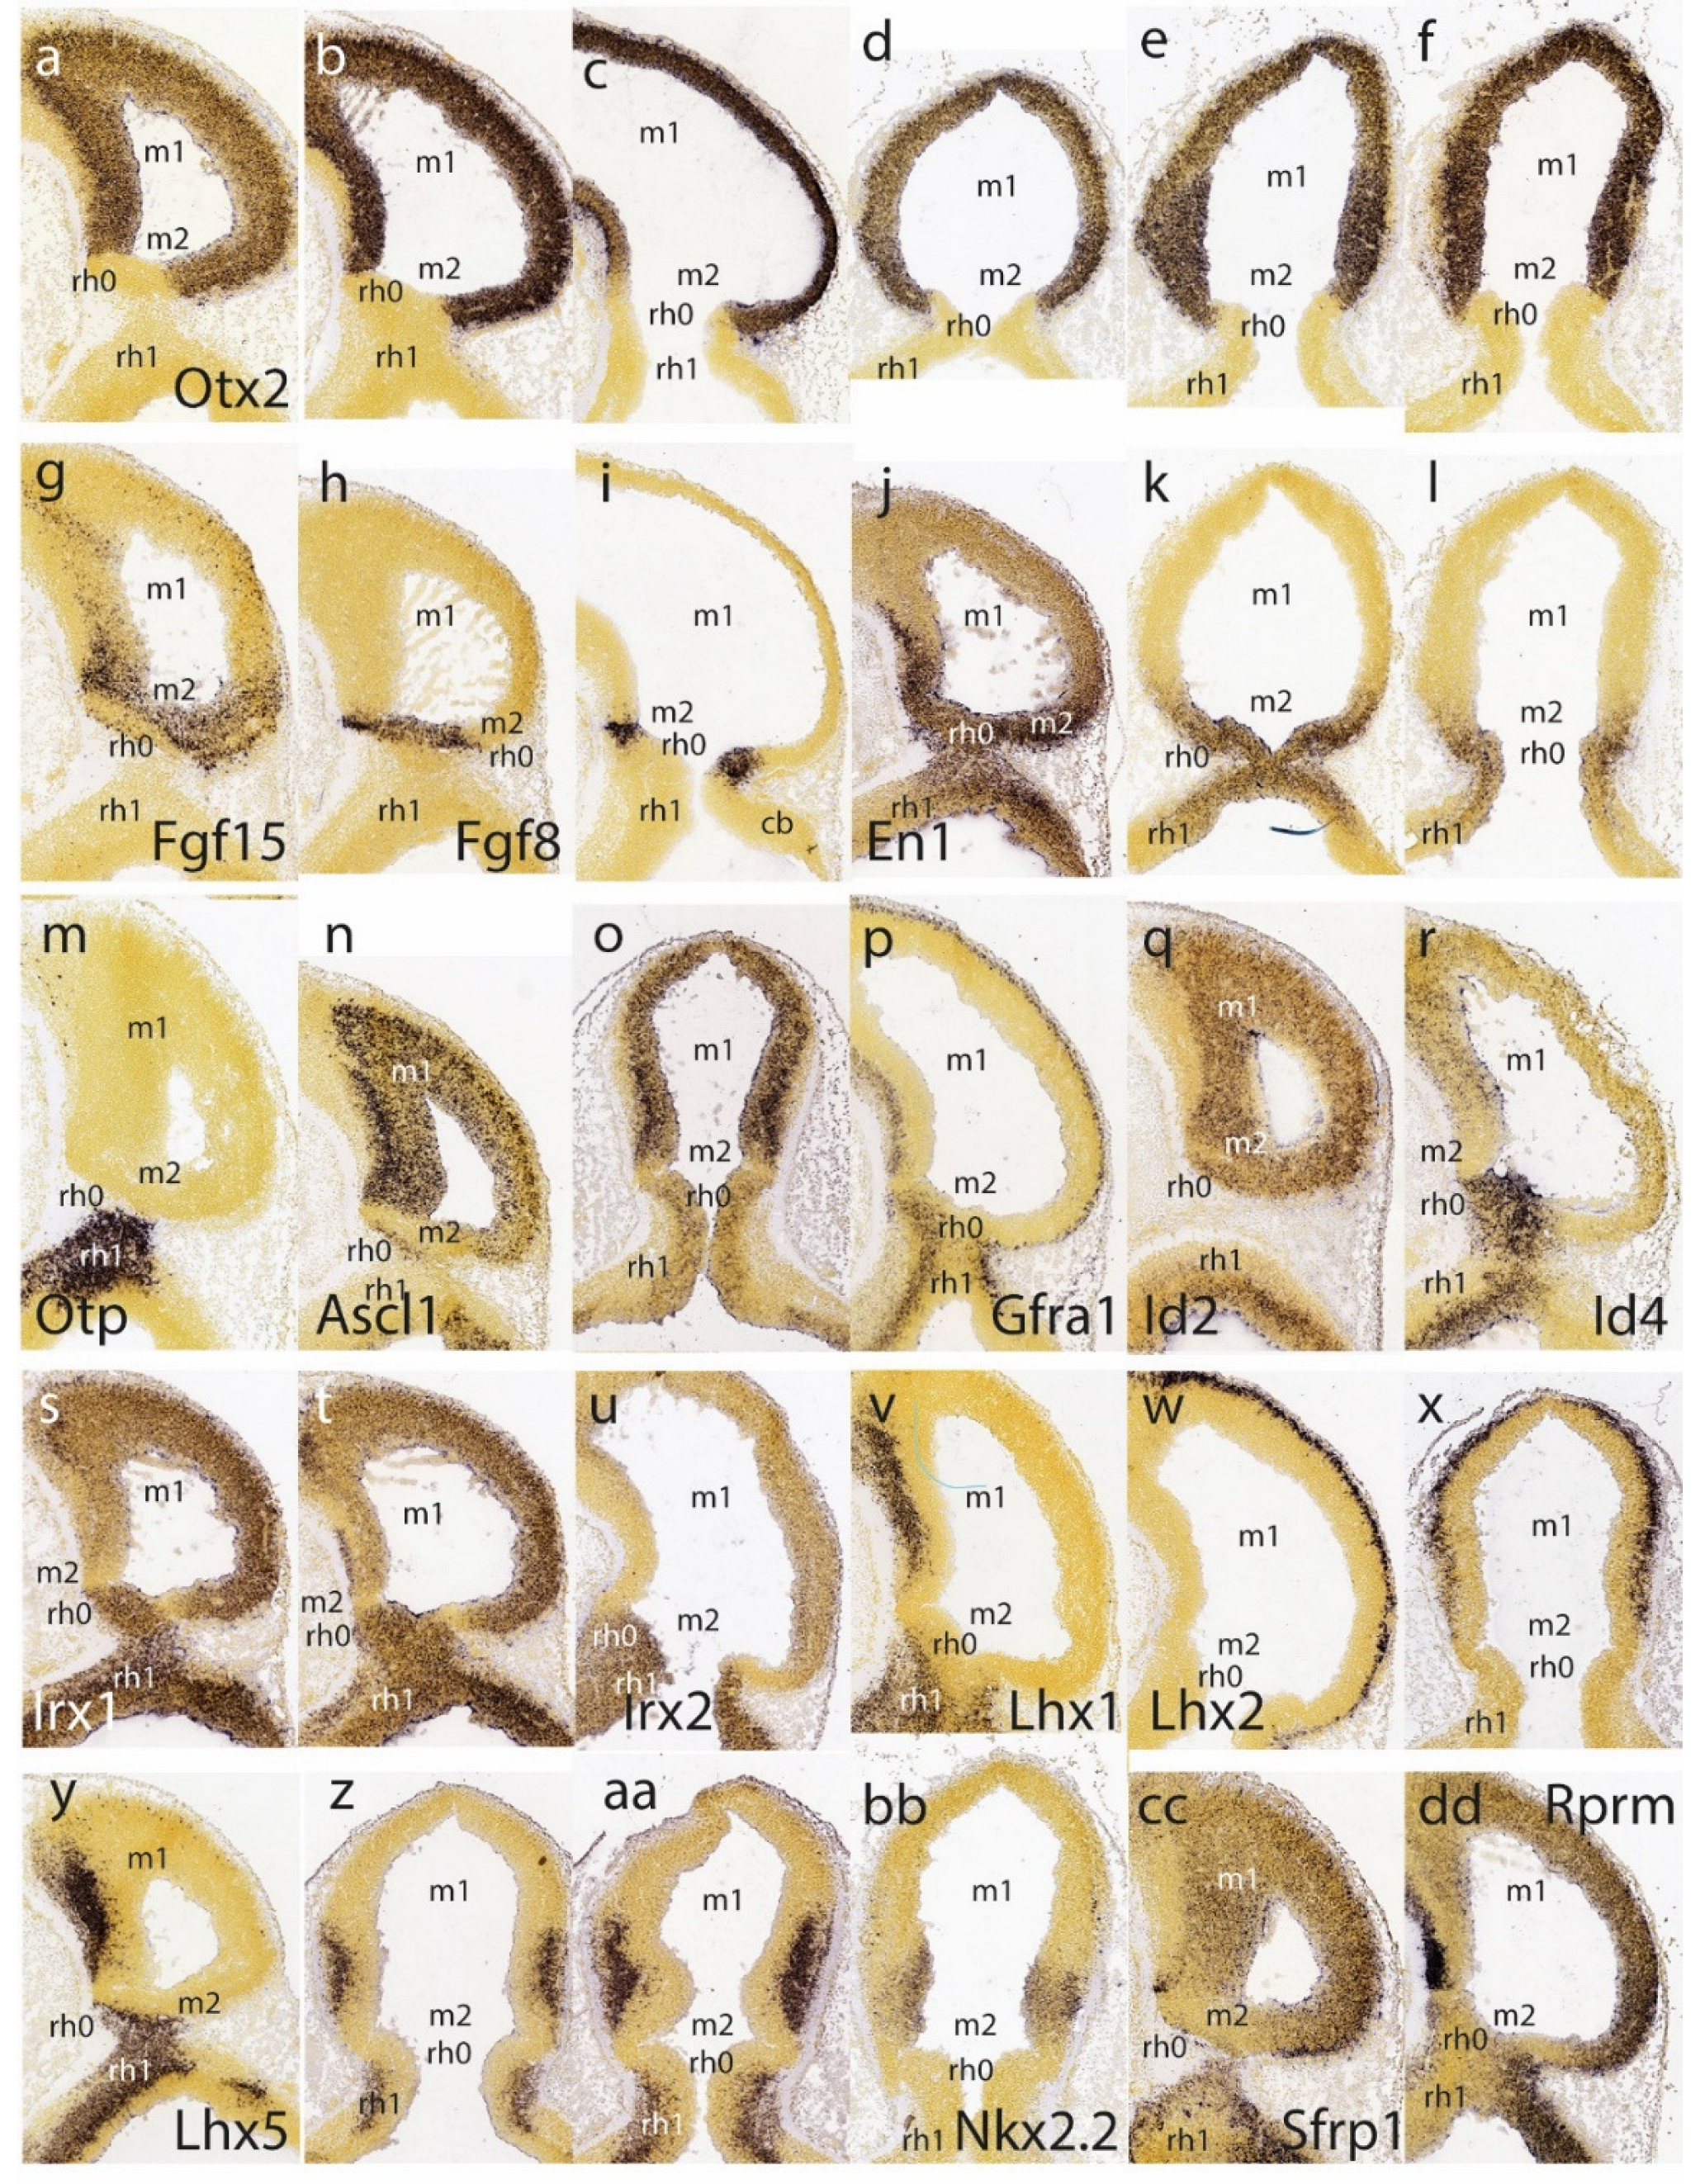
Figure 2.
Plate illustrating diverse E11.5 mouse brain sagittal (a-I, l-n. q-u, x) or horizontal (j,k, o,p, v,w) sections reacted for the gene markers indicated at the bottom. The gene name is indicated only in the first image of a series. In sagittal sections rostral is to the left and dorsal upwards, whereas in horizontal sections rostral is up and caudal at the bottom. The magnification is the same in all cases.
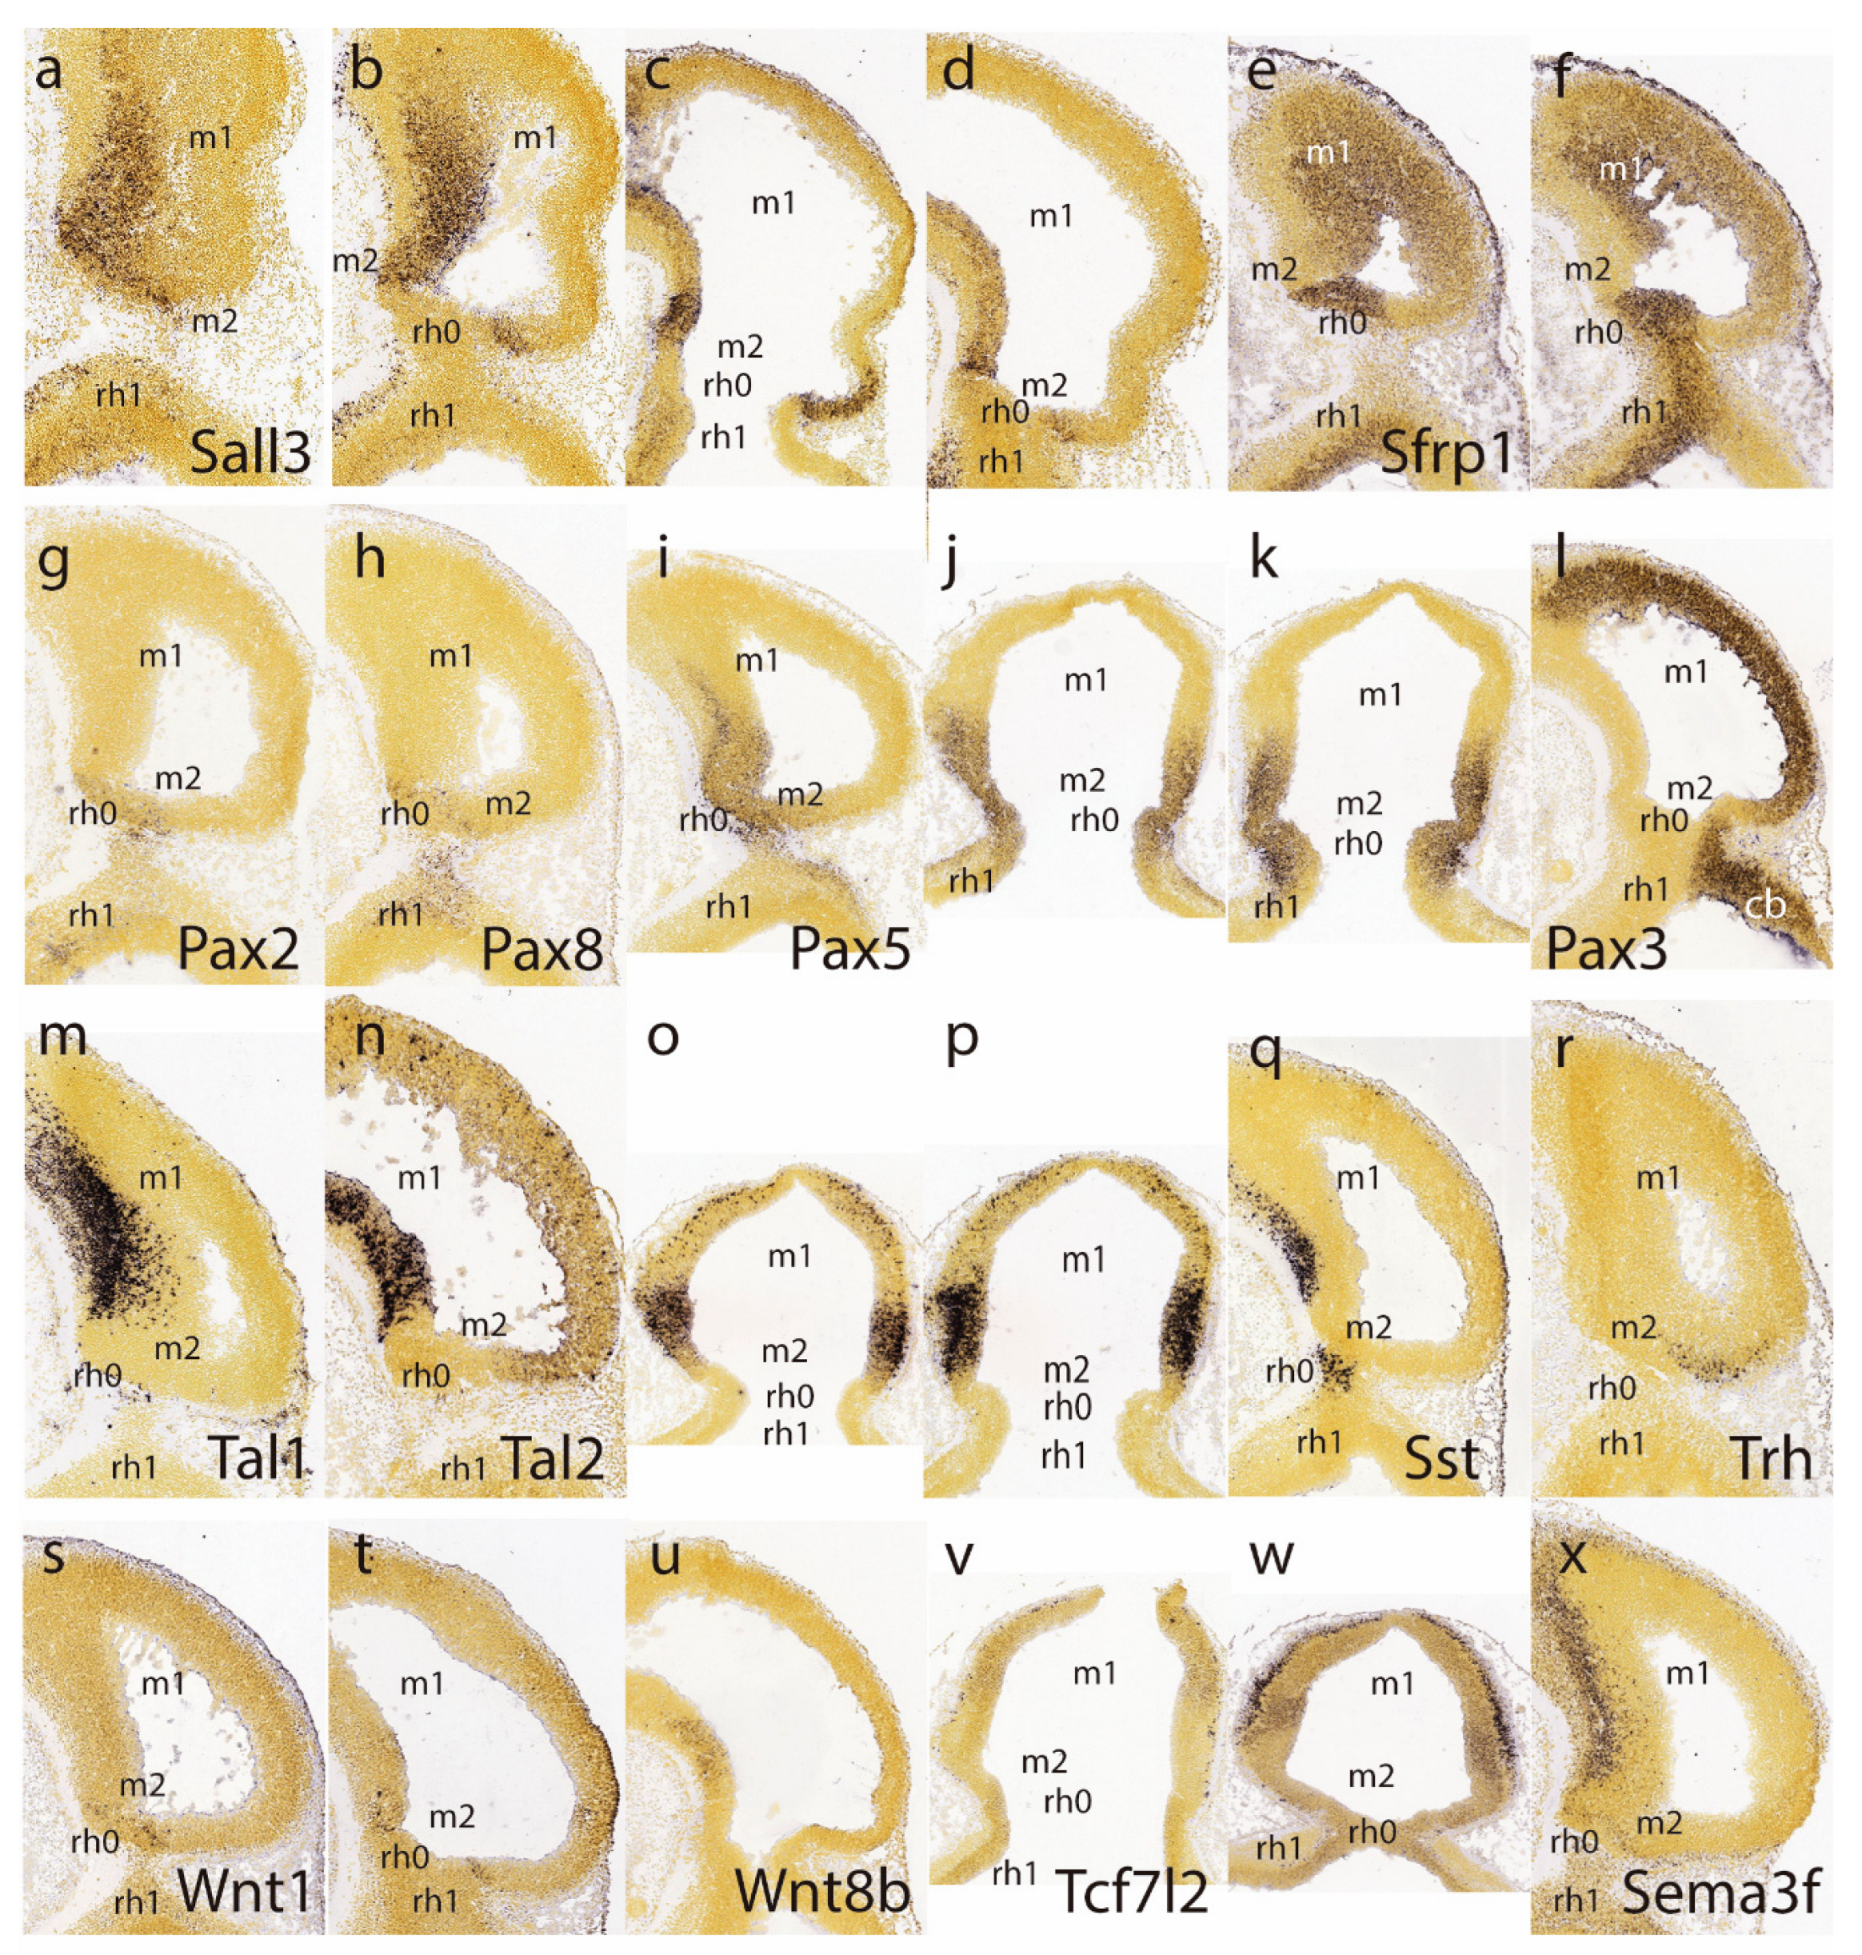
Figure 3.
Plate illustrating diverse E13.5 mouse brain sagittal (a,b, h,I, l, t-ee) or horizontal (c-g, j,k, m-s) sections reacted for the gene markers indicated at the bottom. The gene name is indicated only in the first image of a series. In sagittal sections rostral is to the left and dorsal upwards, whereas in horizontal sections rostral is up and caudal at the bottom. The magnification is the same in all cases.
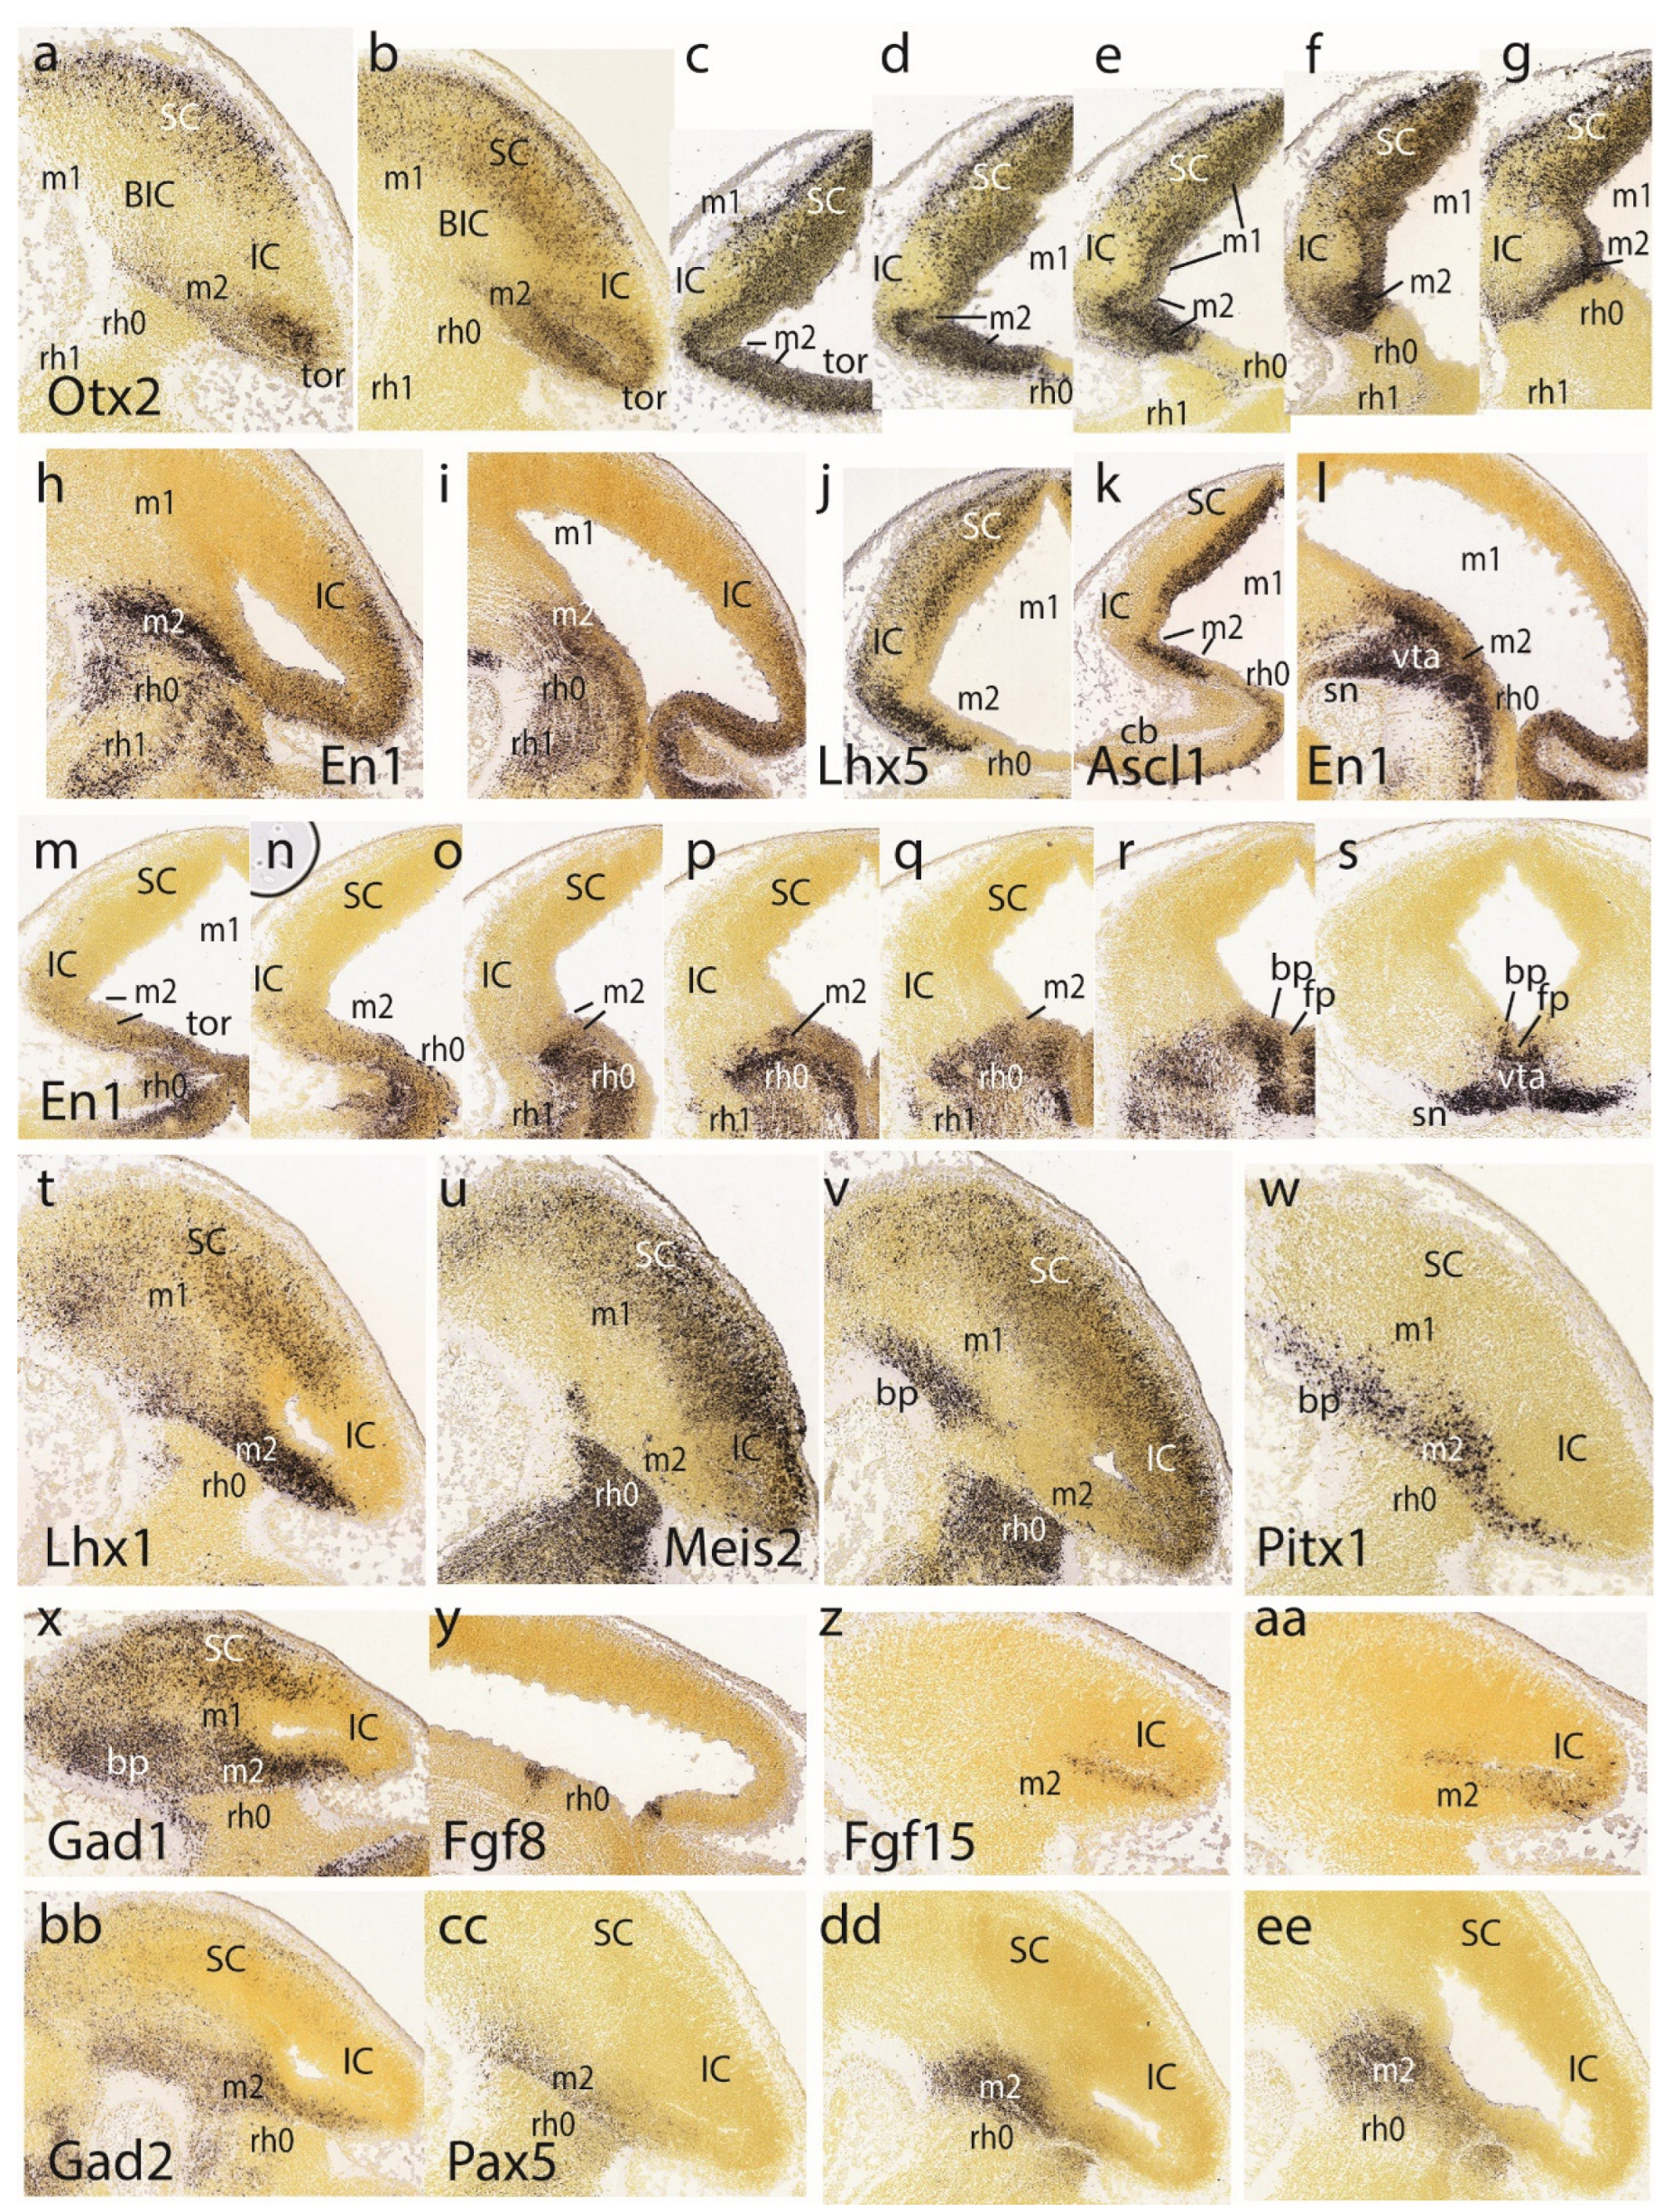
Figure 4.
Plate illustrating diverse E13.5 mouse brain sagittal (h-u, aa) or horizontal (a-g, v-z, bb-ff) sections reacted for the gene markers indicated at the bottom. The gene name is indicated only in the first image of a series. In sagittal sections rostral is to the left and dorsal upwards, whereas in horizontal sections rostral is up and caudal at the bottom. The magnification is the same in all cases.
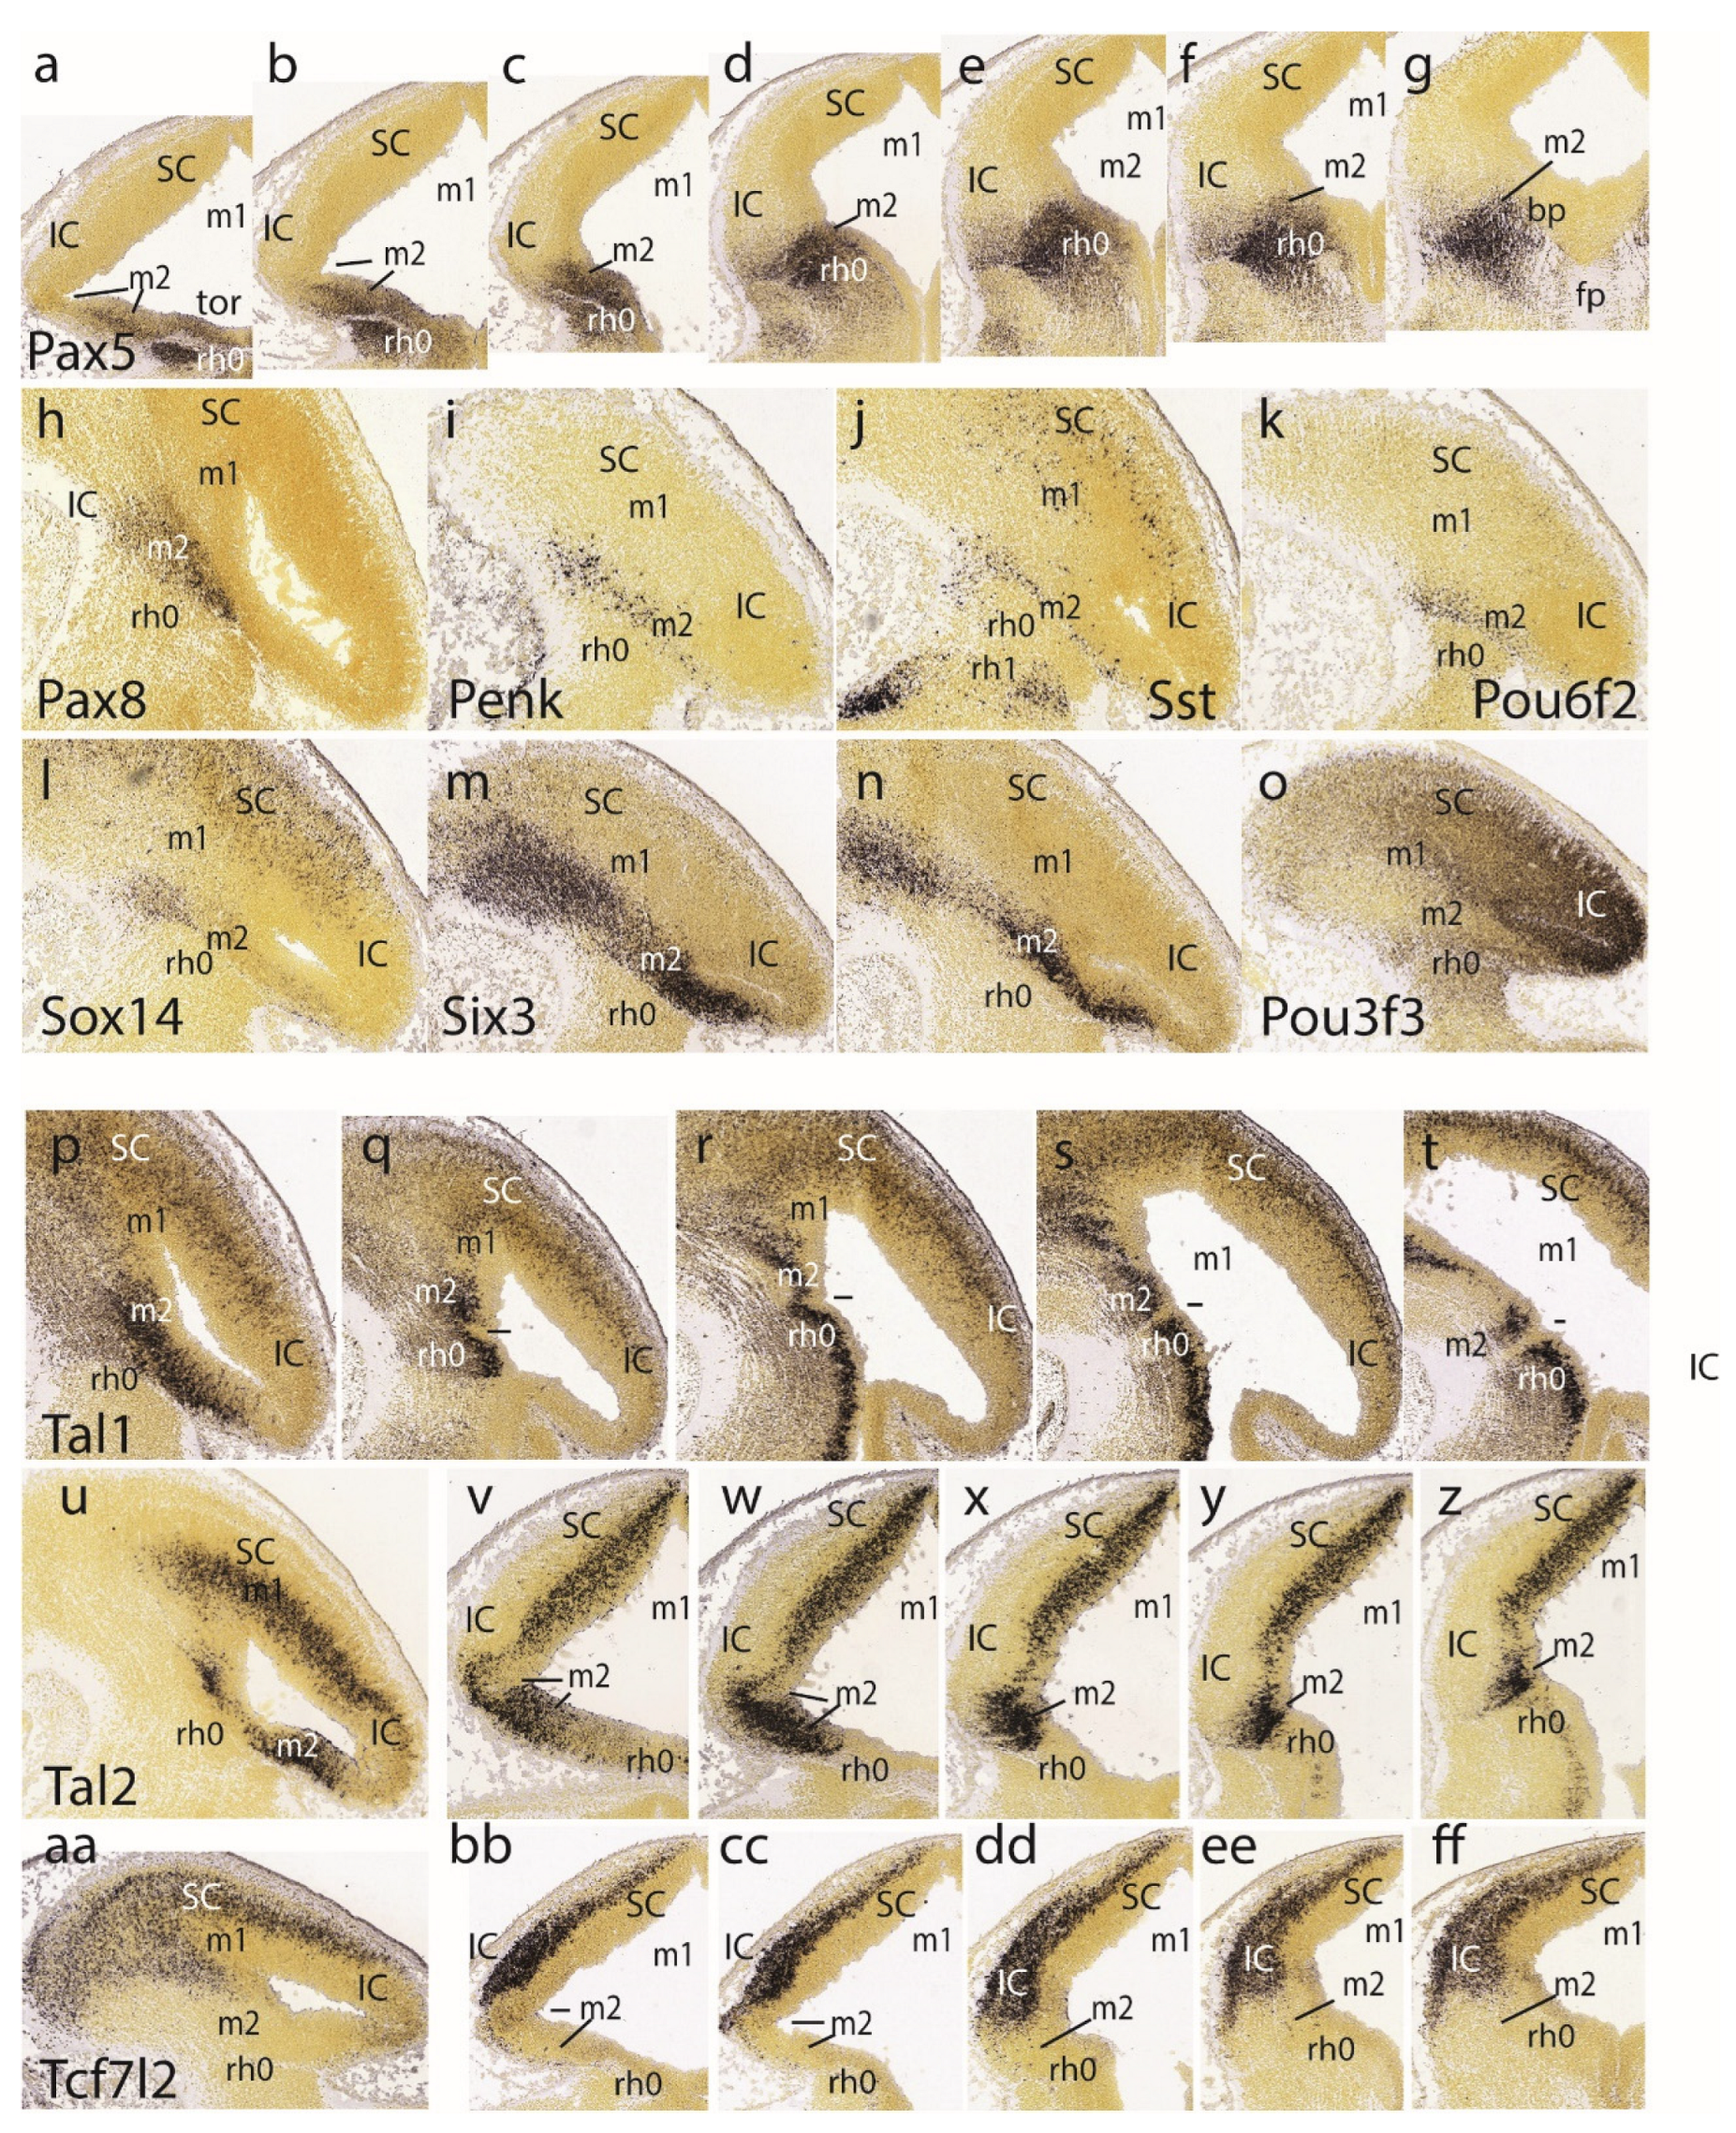
Figure 5.
Plate illustrating diverse E13.5 mouse brain sagittal (g, v-x) or horizontal (a-f, h-u, y) sections reacted for the gene markers indicated at the bottom. The gene name is indicated only in the first image of a series. In sagittal sections rostral is to the left and dorsal upwards, whereas in horizontal sections rostral is up and caudal at the bottom. The magnification is the same in all cases.
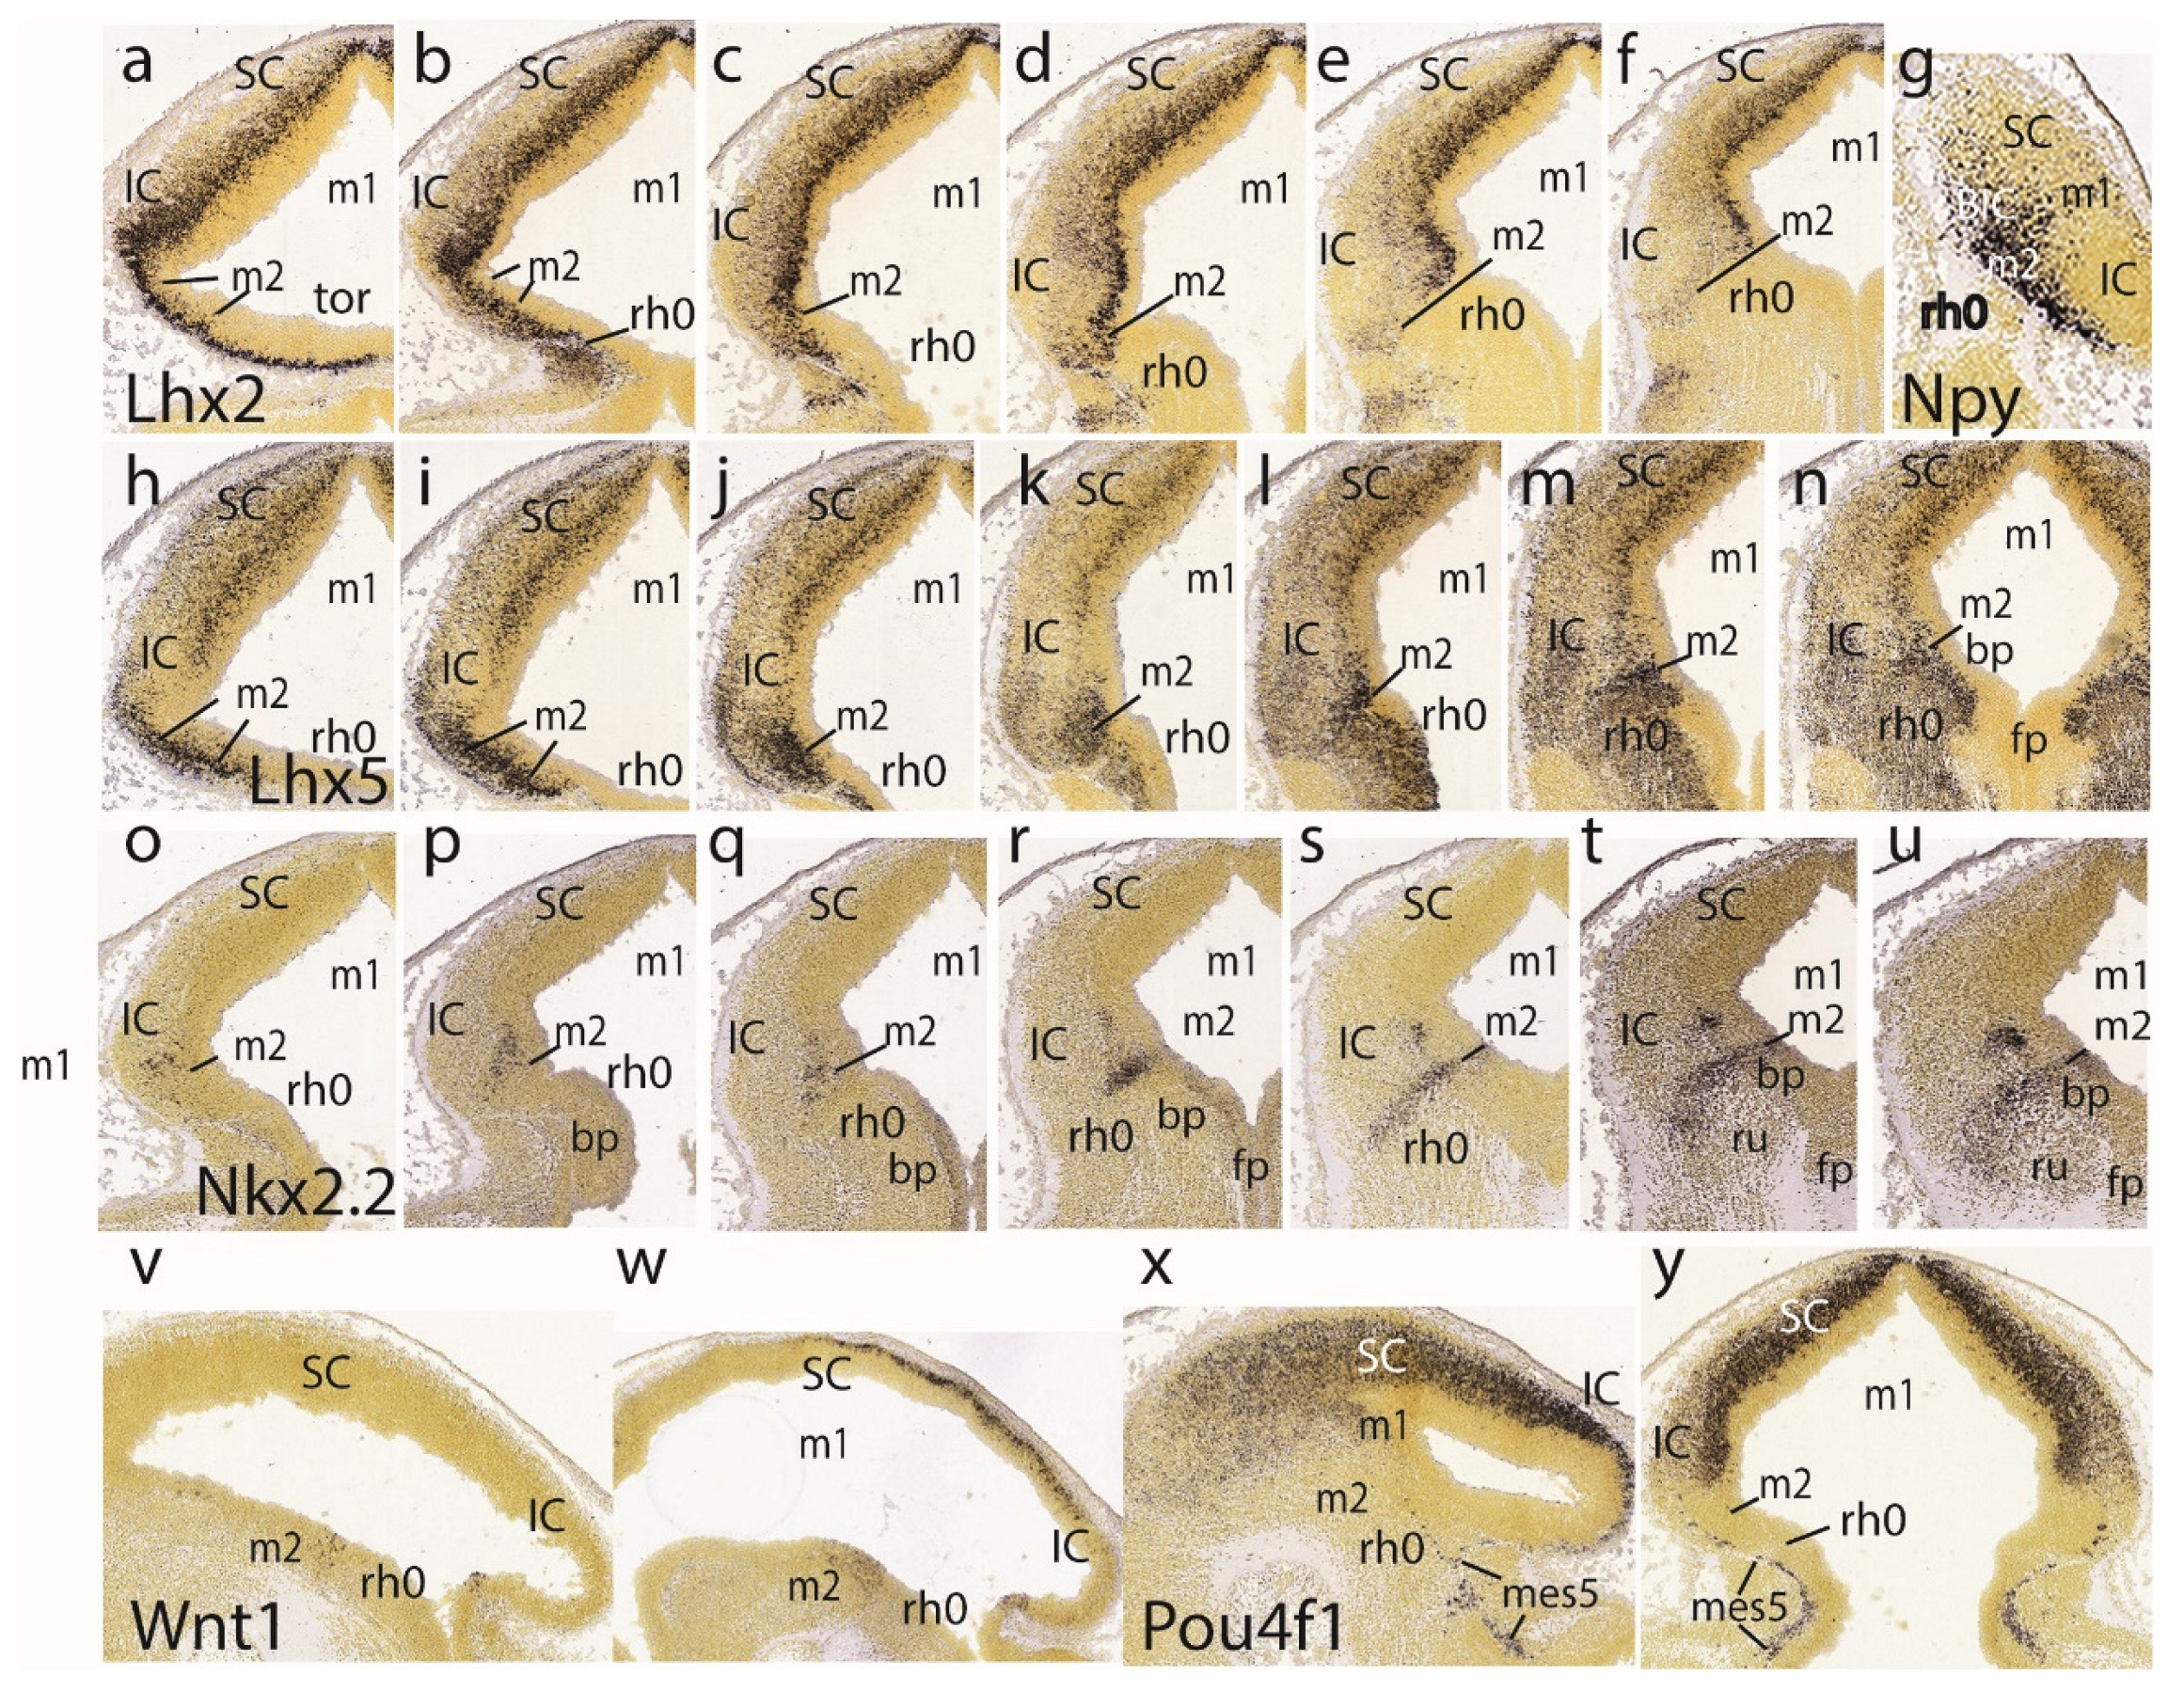
Figure 6.
Plate illustrating diverse E15.5 mouse brain sagittal (a-c, e-l, q-bb) or horizontal (d, m-p) sections reacted for the gene markers indicated at the bottom. The gene name is indicated only in the first image of a series. In sagittal sections rostral is to the left and dorsal upwards, whereas in horizontal sections rostral is up and caudal at the bottom. The magnification is the same in all cases.
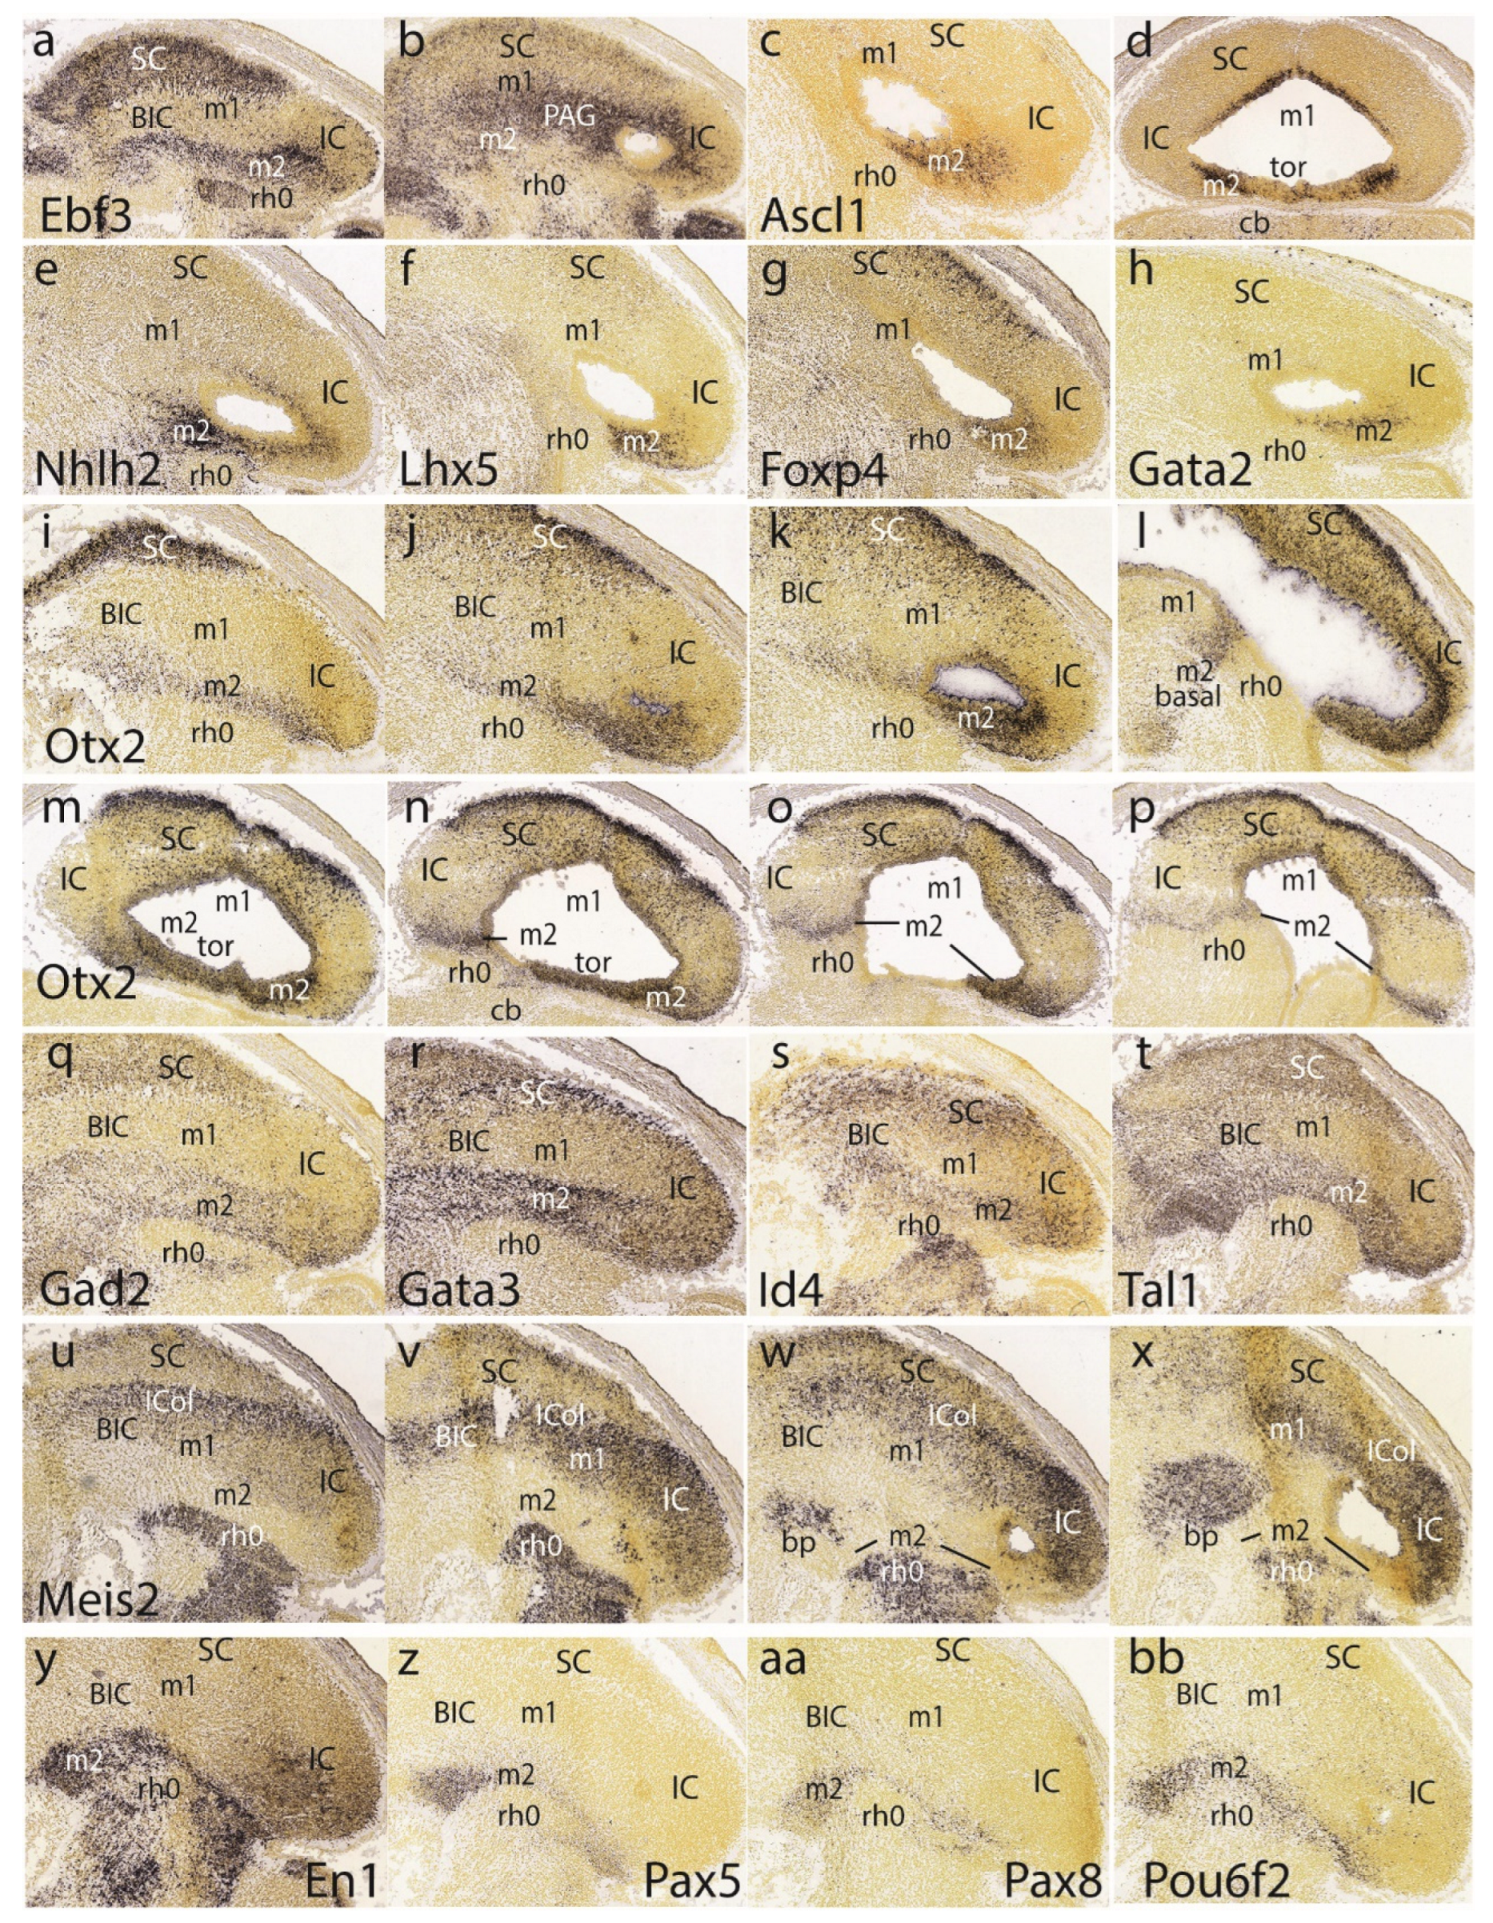
Figure 7.
Plate illustrating diverse E15.5 mouse brain sagittal (a-d, u-bb) or horizontal (e-t) sections reacted for the gene markers indicated at the bottom. The gene name is indicated only in the first image of a series. In sagittal sections rostral is to the left and dorsal upwards, whereas in horizontal sections rostral is up and caudal at the bottom. The magnification is the same in all cases.
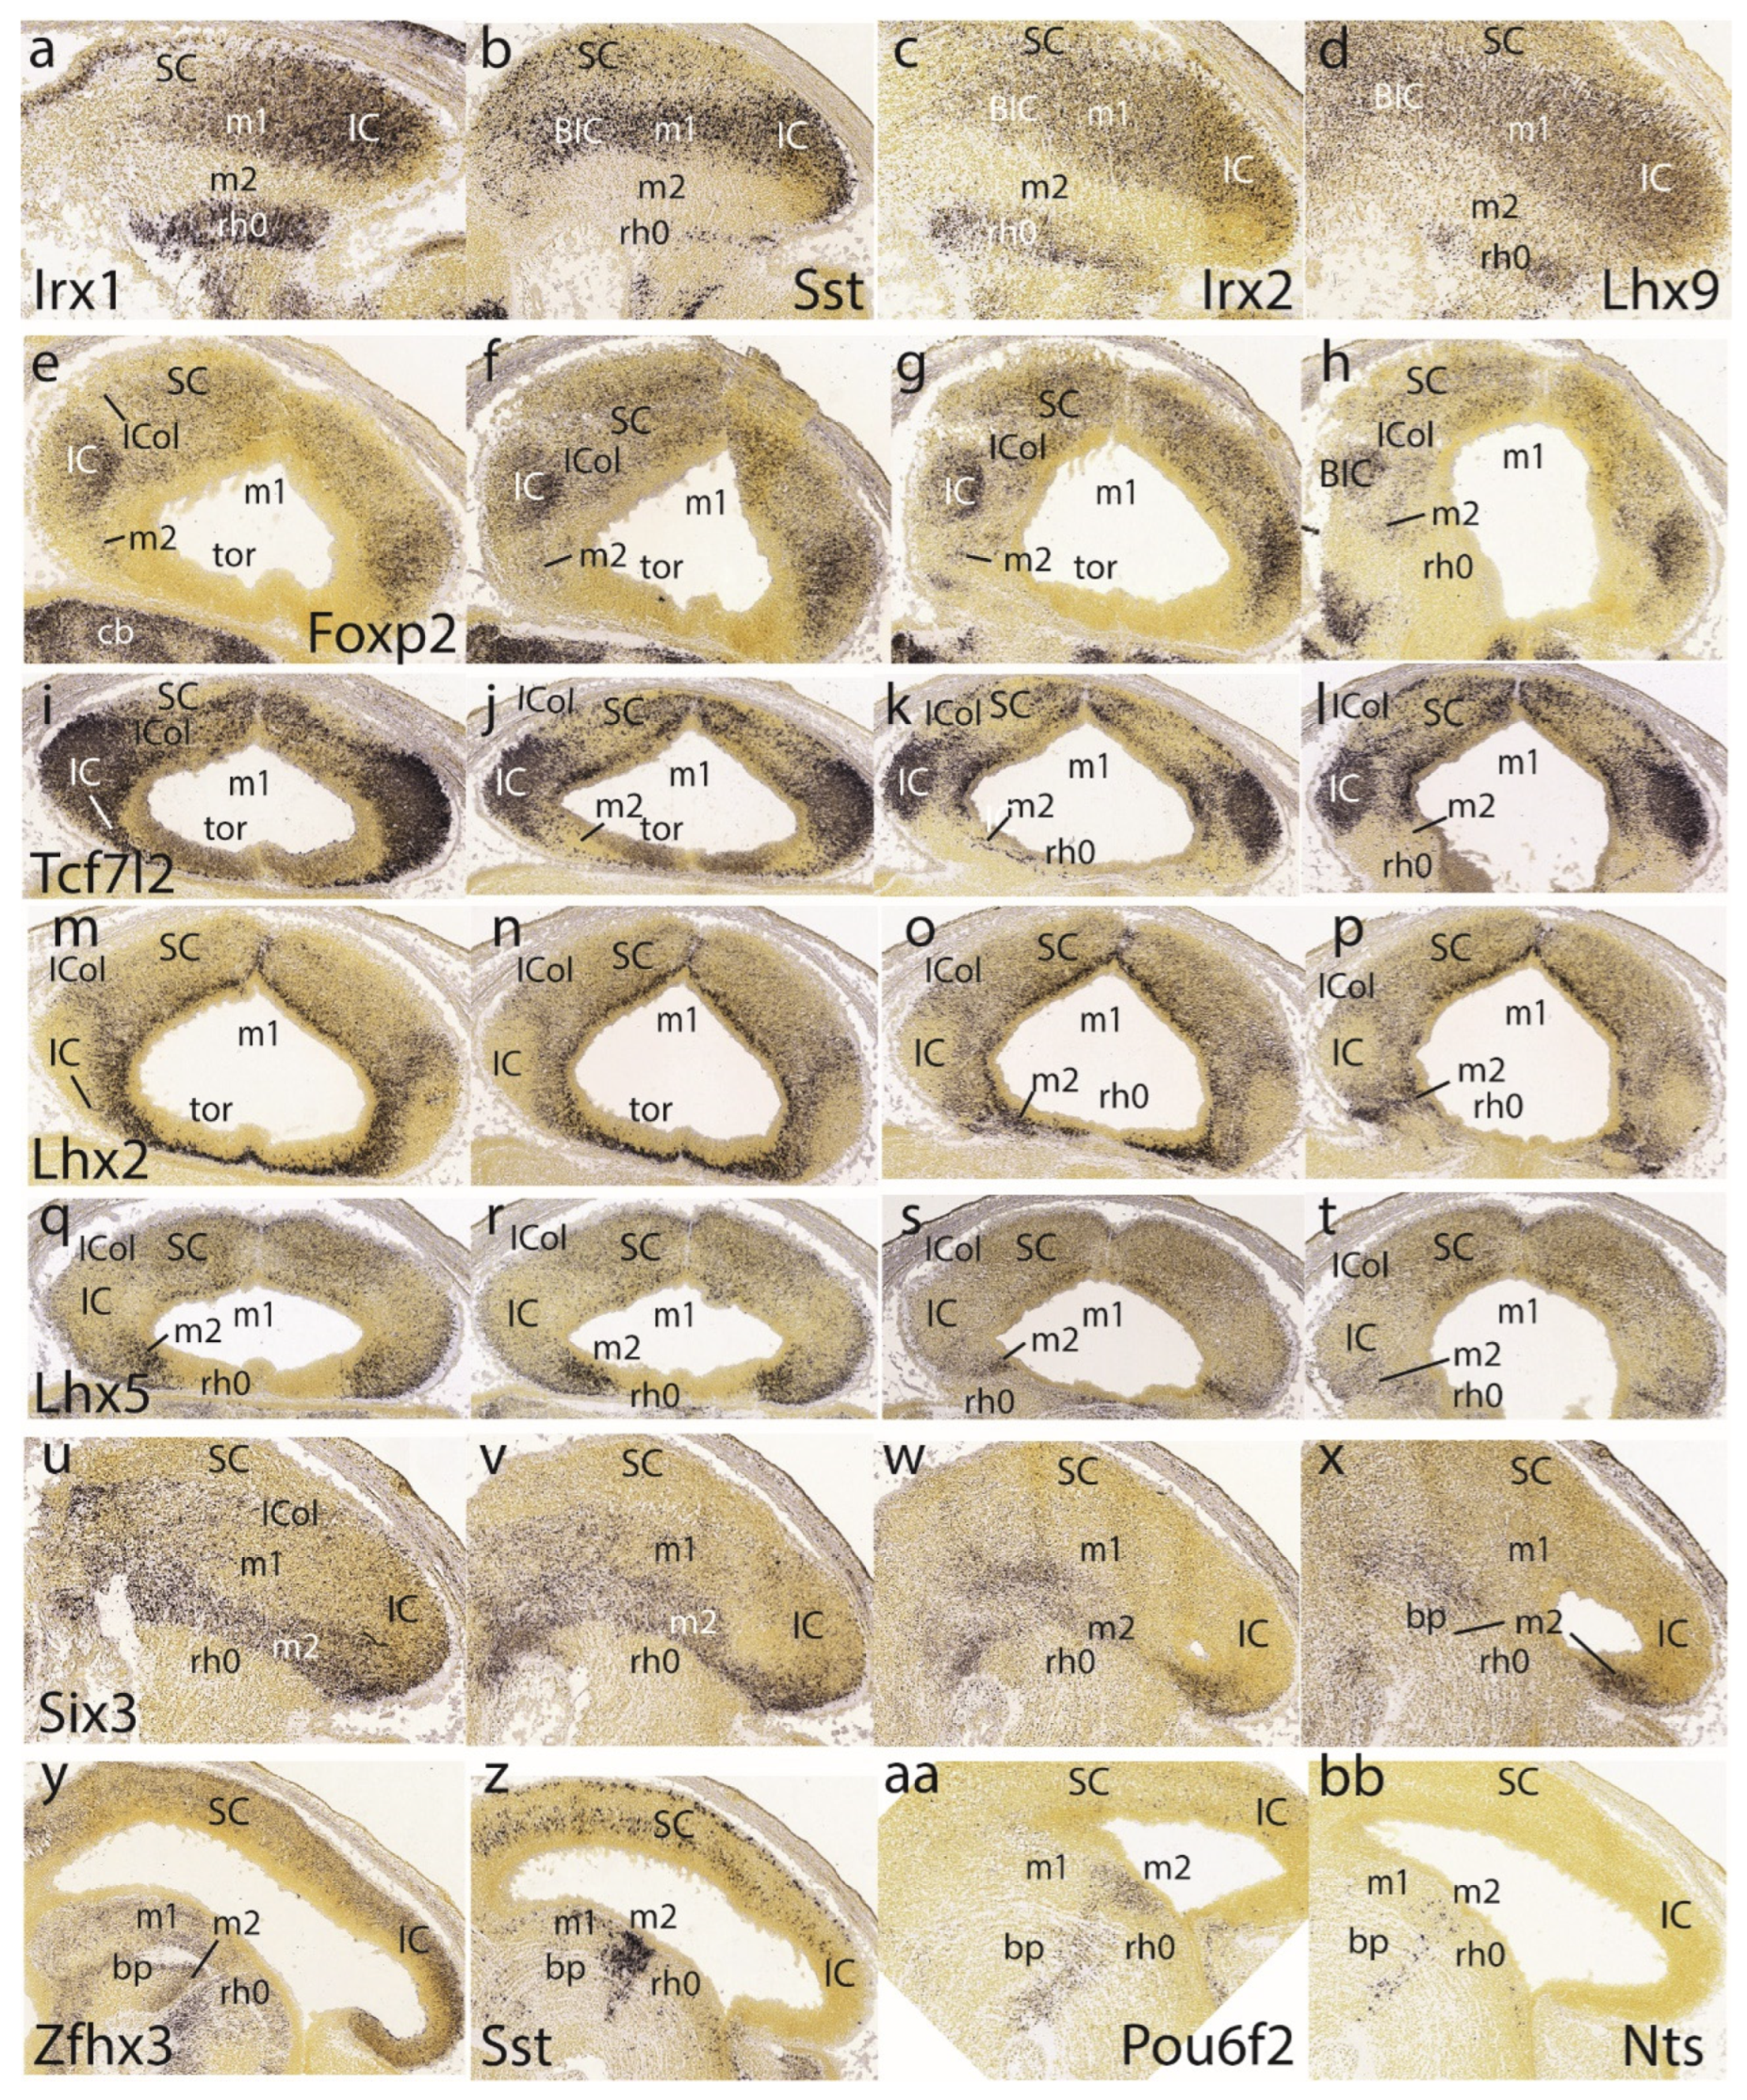
Figure 9.
Plate illustrating diverse E18.5 mouse brain sagittal (i-t) or horizontal (a-h) sections reacted for the gene markers indicated at the bottom. The gene name is indicated only in the first image of a series. In sagittal sections rostral is to the left and dorsal upwards, whereas in horizontal sections rostral is up and caudal at the bottom. The magnification is the same in all cases.
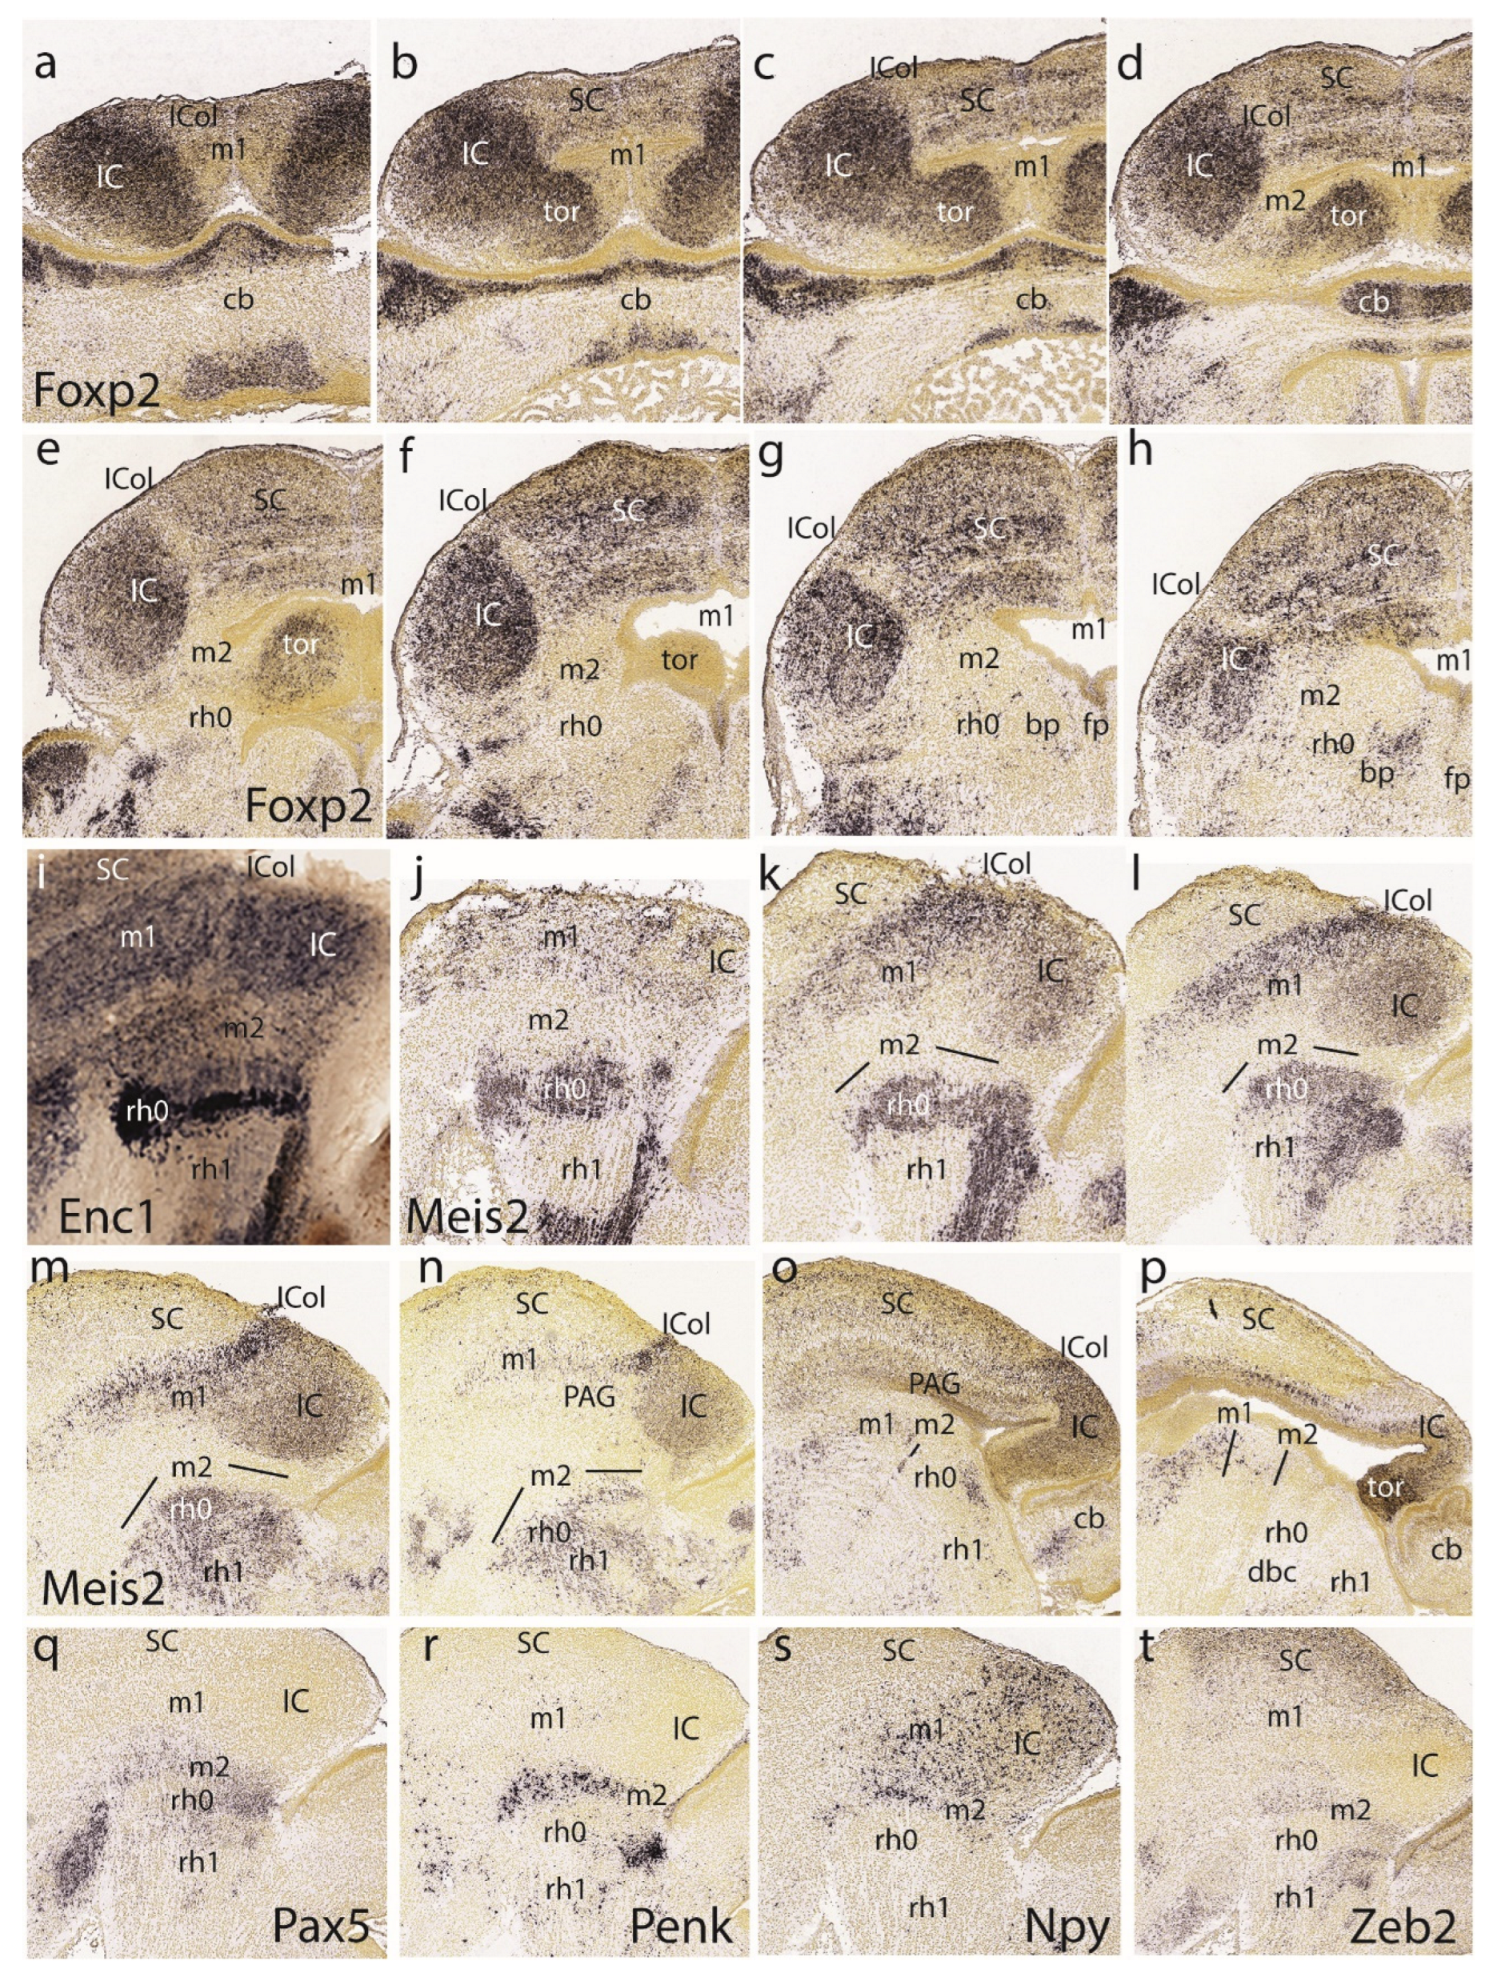
Figure 10.
Plate illustrating diverse E18.5 mouse brain sagittal (I, t,u, z, bb,cc) or horizontal (a-h, j-s, v-y, aa) sections reacted for the gene markers indicated at the bottom. The gene name is indicated only in the first image of a series. In sagittal sections rostral is to the left and dorsal upwards, whereas in horizontal sections rostral is up and caudal at the bottom. The magnification is the same in all cases.
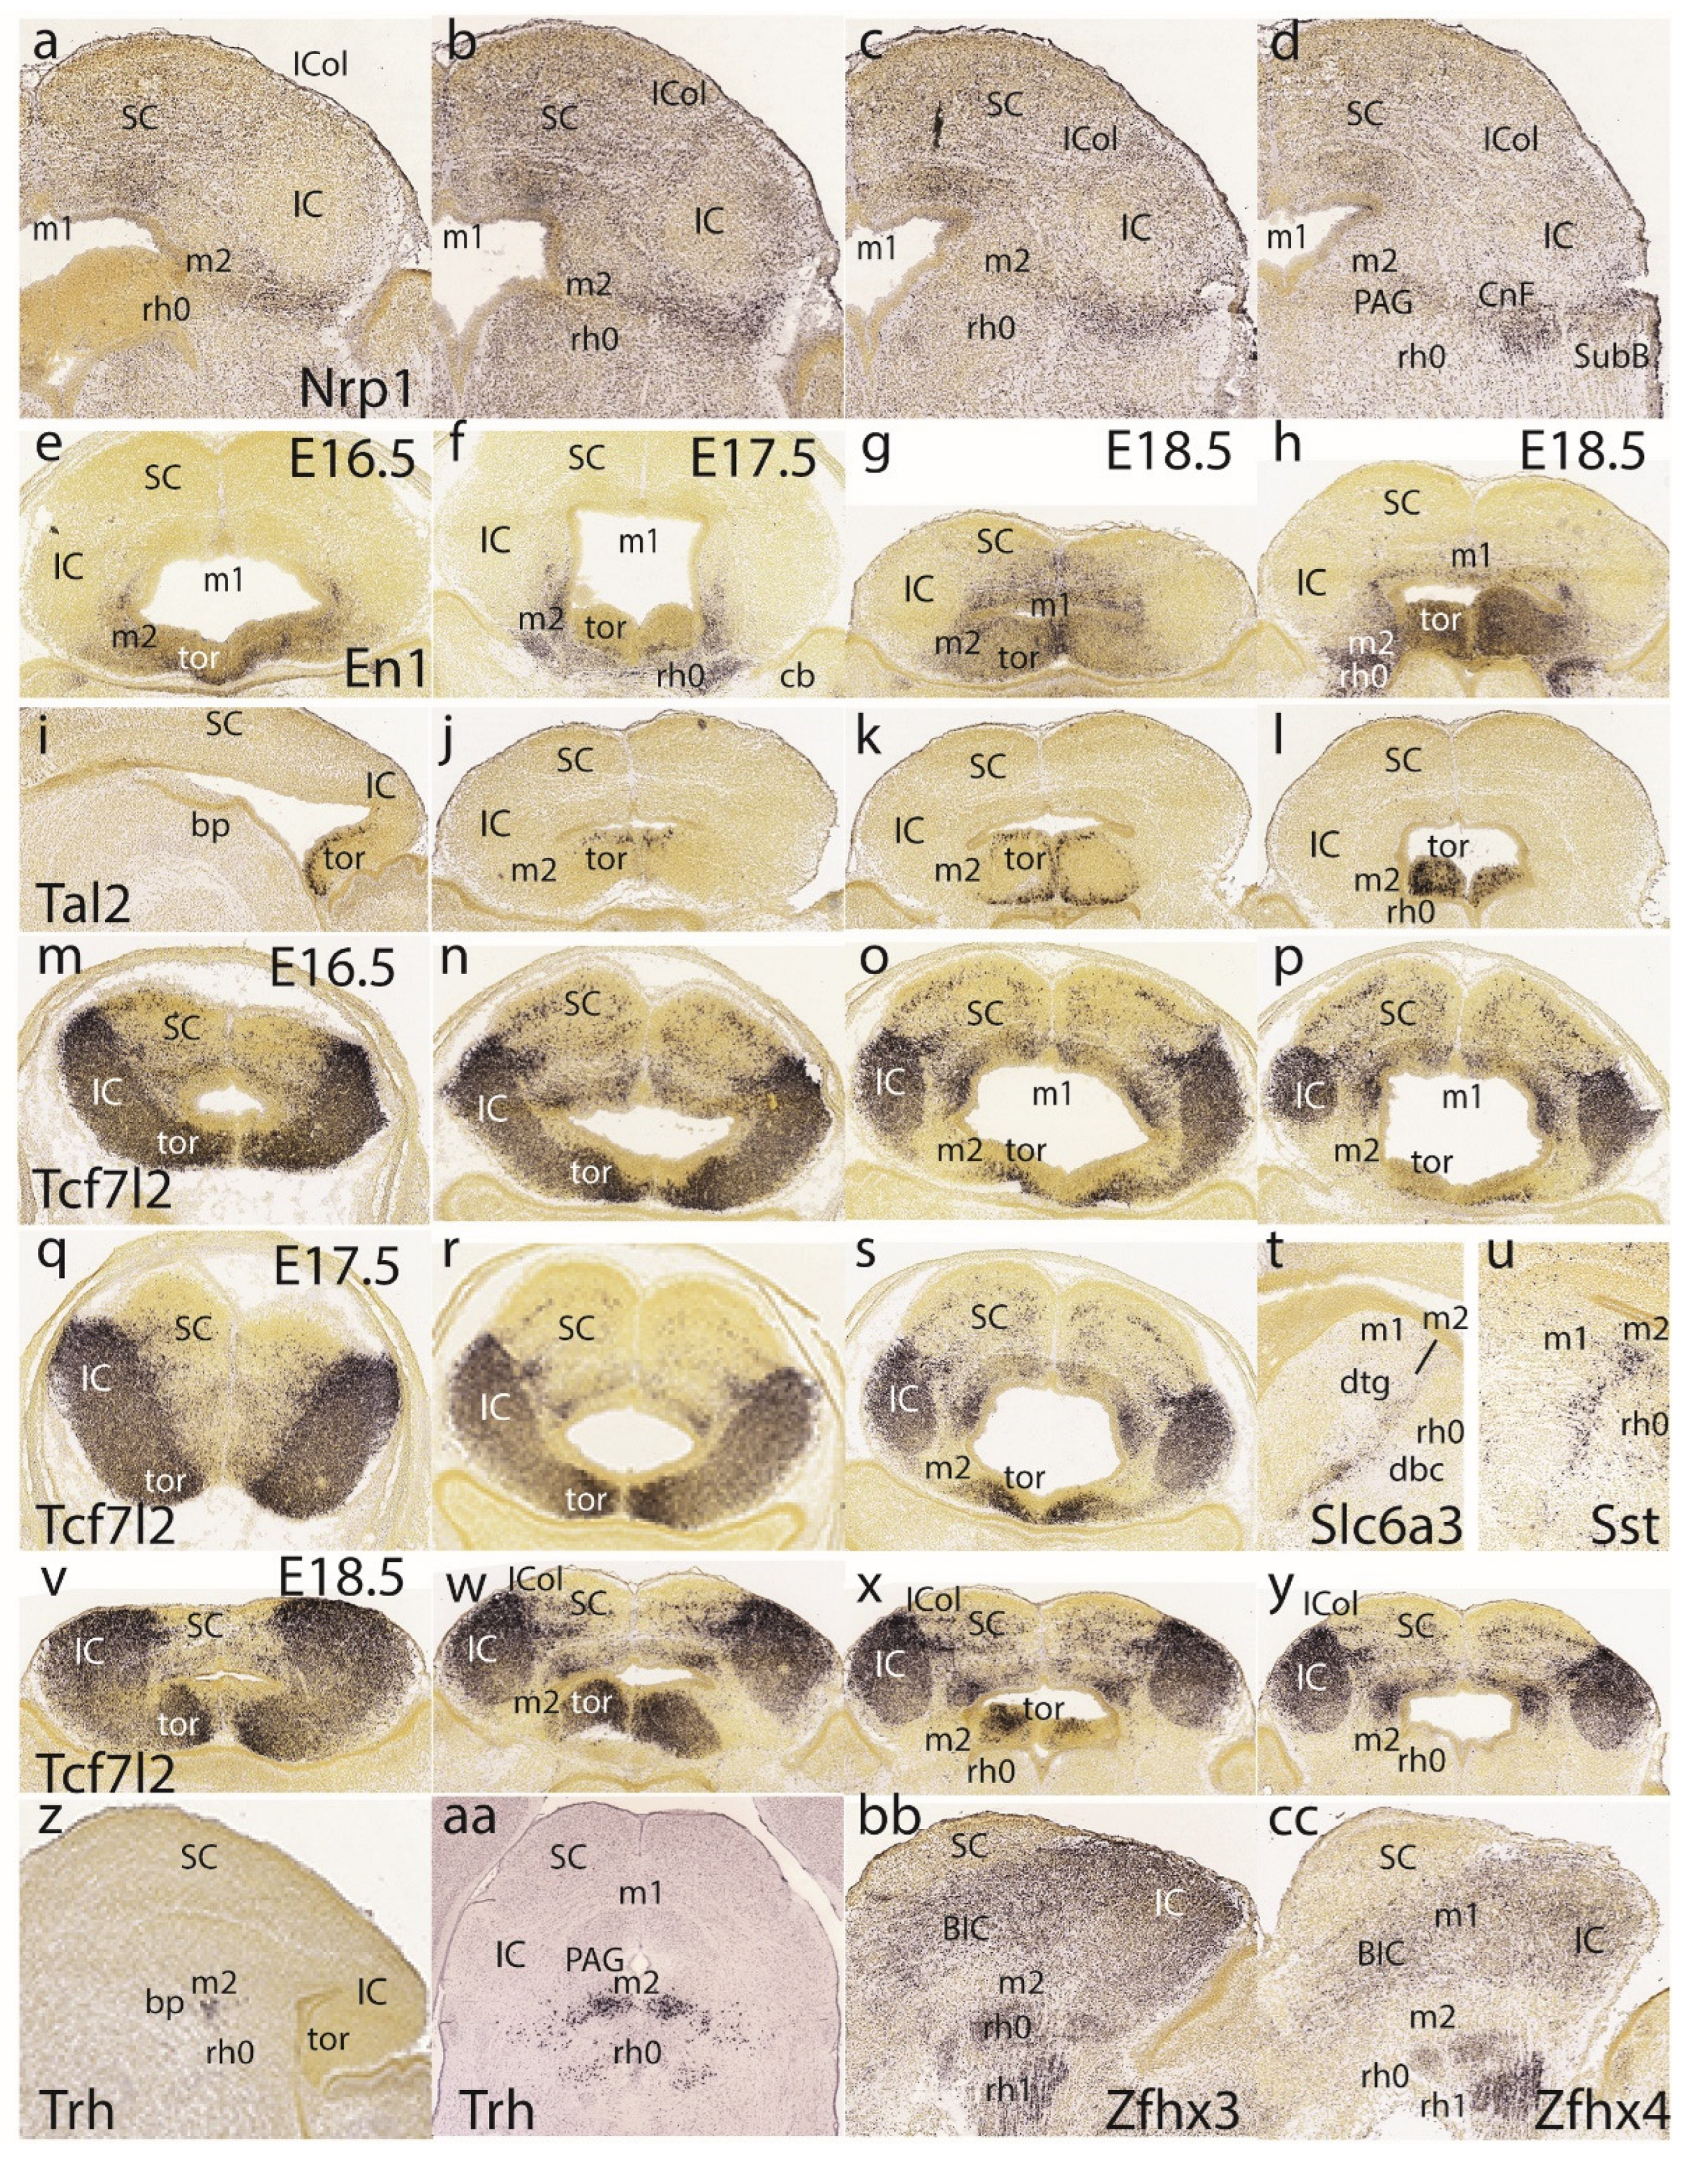
Figure 11.
Plate illustrating diverse postnatal mouse brain sagittal (a-c) or horizontal (d-i) sections reacted for the gene markers indicated at the bottom. The gene name is indicated only in the first image of a series. In sagittal sections rostral is to the left and dorsal upwards, whereas in horizontal sections rostral is up and caudal at the bottom. The magnification is the same in all cases.
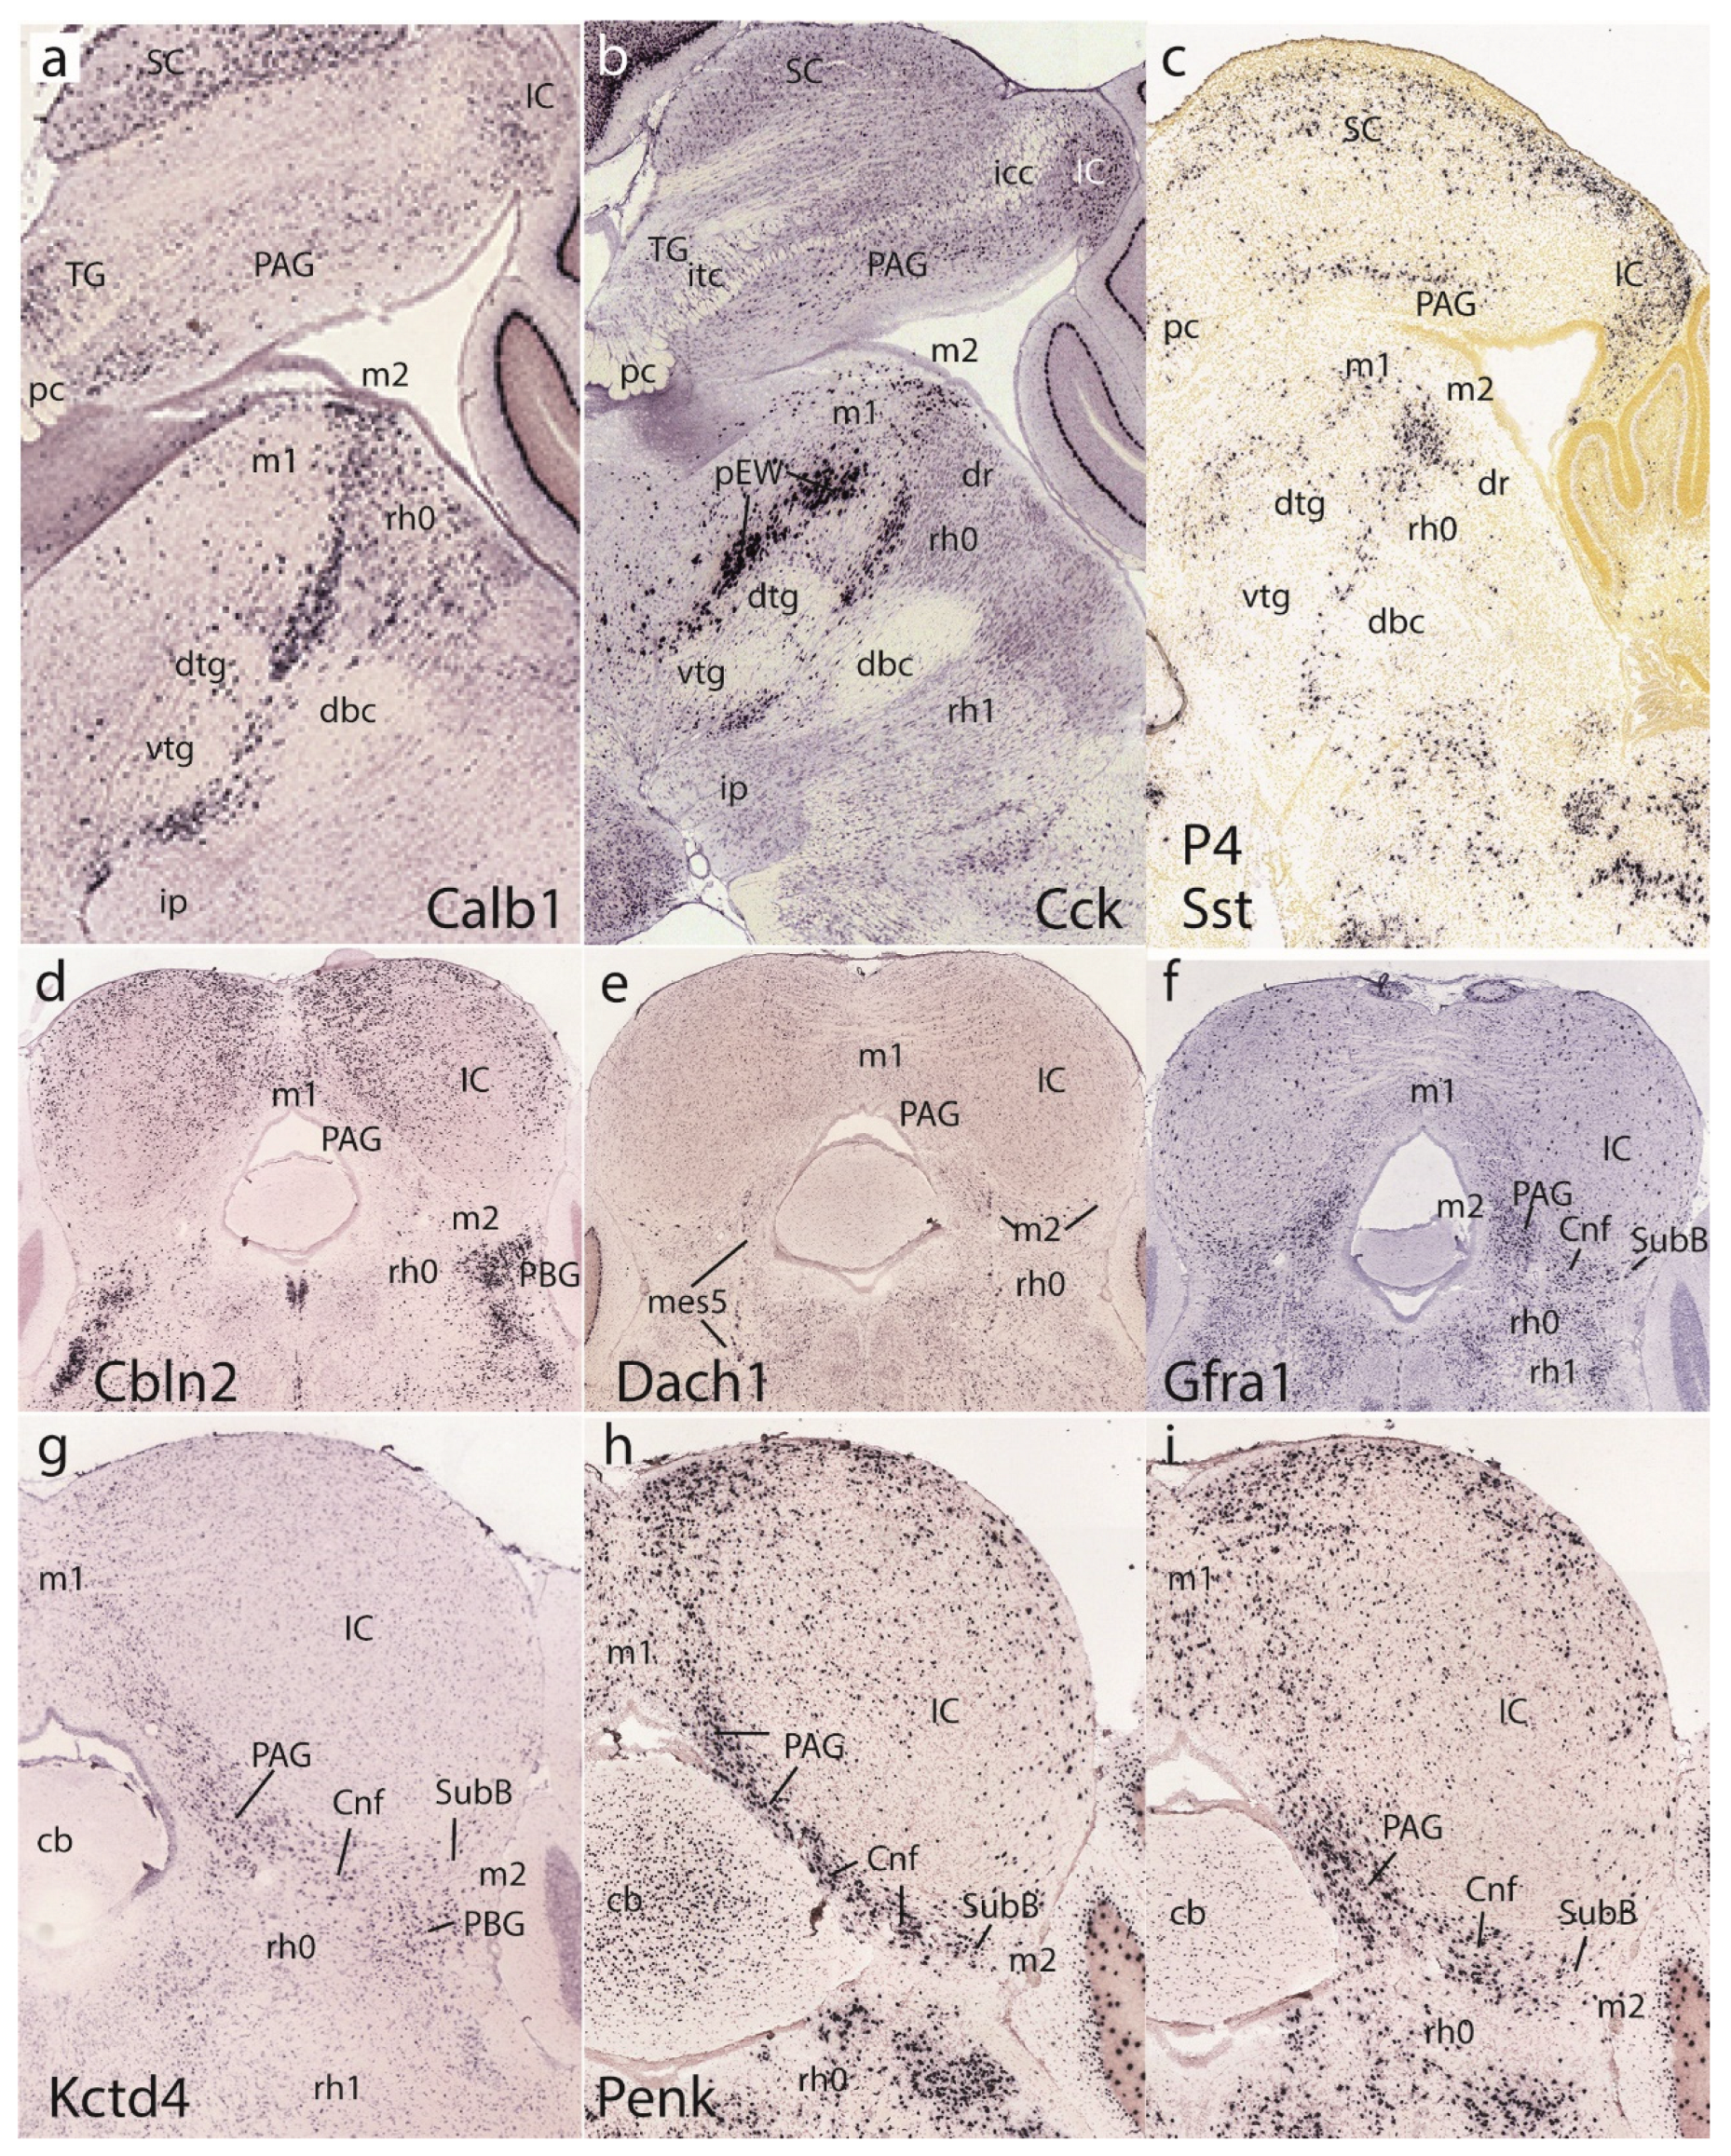
Figure 12.
Plate illustrating diverse postnatal mouse brain sagittal (g-p) or horizontal (a-f) sections reacted for the gene markers indicated at the bottom. The gene name is indicated only in the first image of a series. In sagittal sections rostral is to the left and dorsal upwards, whereas in horizontal sections rostral is up and caudal at the bottom. The magnification is the same in all cases.
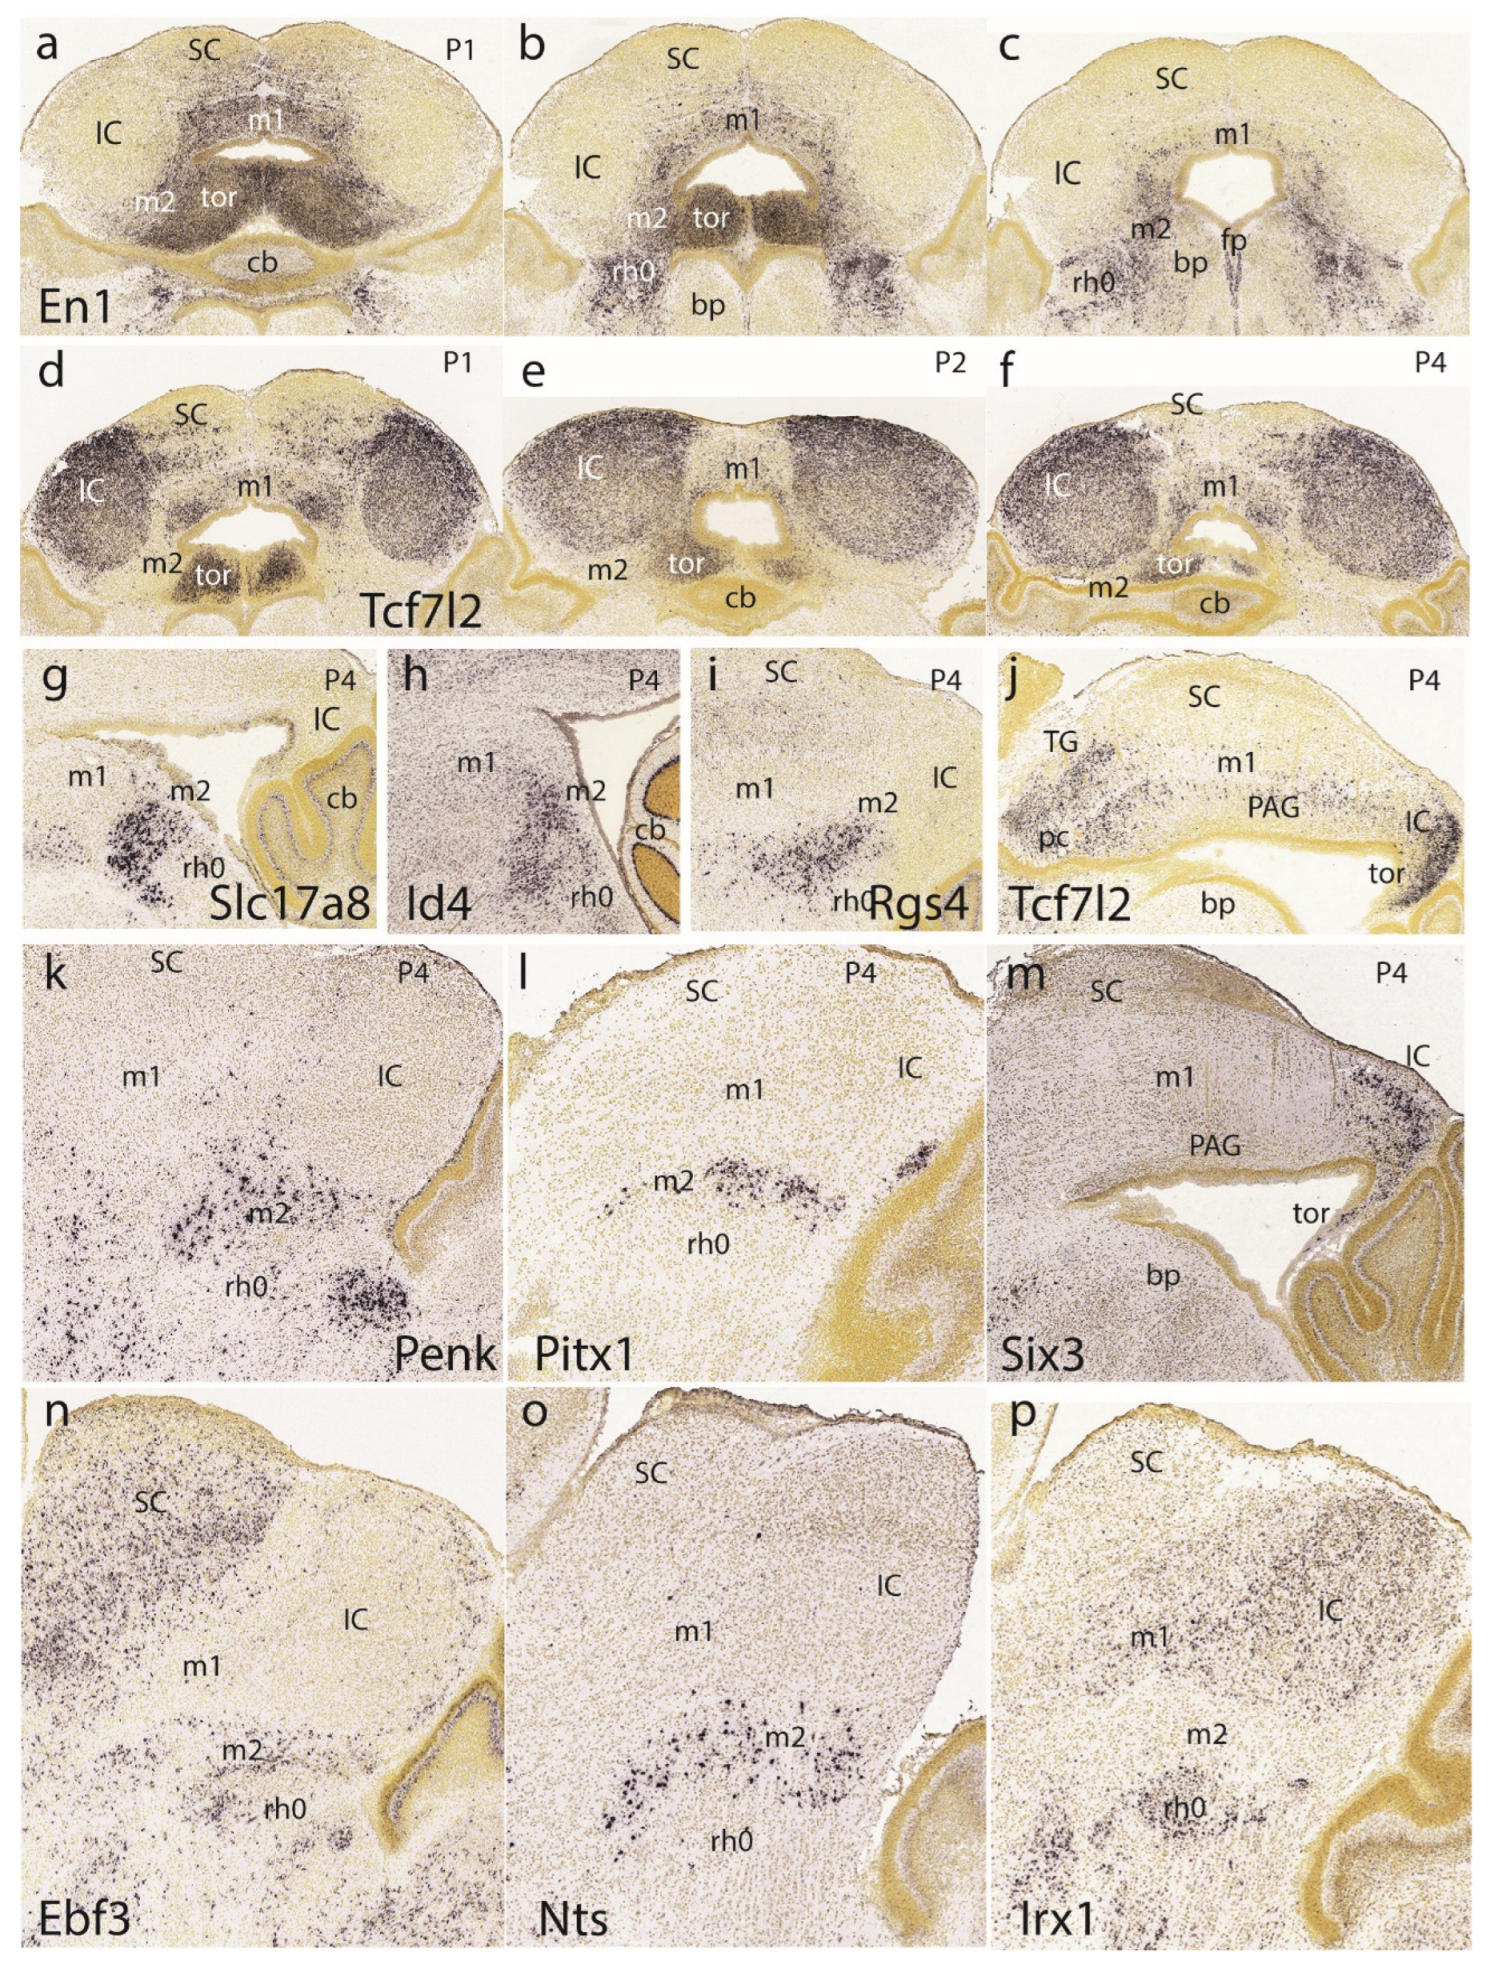
Disclaimer/Publisher’s Note: The statements, opinions and data contained in all publications are solely those of the individual author(s) and contributor(s) and not of MDPI and/or the editor(s). MDPI and/or the editor(s) disclaim responsibility for any injury to people or property resulting from any ideas, methods, instructions or products referred to in the content. |
© 2023 by the authors. Licensee MDPI, Basel, Switzerland. This article is an open access article distributed under the terms and conditions of the Creative Commons Attribution (CC BY) license (http://creativecommons.org/licenses/by/4.0/).
Copyright: This open access article is published under a Creative Commons CC BY 4.0 license, which permit the free download, distribution, and reuse, provided that the author and preprint are cited in any reuse.


