
Submitted:
27 April 2023
Posted:
27 April 2023
You are already at the latest version
Abstract
The rapid development of LiDAR technology has promoted great changes in forest resource surveys. The airborne LiDAR point cloud can provide precise tree height and detailed vertical structure of the tree stands. Coordinating some representative ground sample plots, LiDAR can be used to estimate key forest resource indicators such as forest stock volume, diameter at breast height, and forest biomass at a large scale. By establishing relationship models between the forest parameters of sample plots and the calculated parameters of LiDAR, these developments may eventually expand the models to large-scale forest resource surveys of entire areas. In this study, eight sample plots in northeast China are used to verify and update the information using point cloud obtained by the LiDAR scanner riegl-vq-1560i. Firstly, the tree crowns are segmented using the profile-rotating algorithm, and dominant trees height are used to check and rectify the tree locations. Secondly, considering the correlation between forestry parameters and tree species, we establish models to distinguish between species using geometric characteristics of tree crowns. Thirdly, when the tree species is known, parameters such as height, crown width, diameter at breast height, biomass and stock volume can be extracted from trees. The prediction models of forestry parameters can also be verified, which can be extended to accurate large-scale forestry surveys based on LiDAR data. Finally, experiment results demonstrate that the F-score of the eight plots in the tree segmentation exceed 0.95, the accuracy of tree species correction exceeds 90%, and the R2 of tree height, east-west canopy width, north-south canopy width, diameter at breast height, above-ground biomass and stock volume are 0.893, 0.757, 0.694, 0.840, 0.896 and 0.891, respectively. The above results indicate that the LiDAR-based estimation of forestry parameters is practical and that these forestry parameter prediction models can be widely applied in forest resource monitoring.
Keywords:
LiDAR
; Tree Segmentation
; Tree Species Identification
; DBN
; Forest Parameter
1. Introduction
Forests are the largest carbon reservoir and ecosystem on land, providing not only vital ecological services but also enormous economic benefits in the process of human development [1]. The acquisition of forestry parameters, such as tree height, crown width, species, and biomass, etc., is critical in the process of investigation and monitoring. The monitoring of forest resources is to provide an effective scientific methodology for off-ground density estimation, change trend analysis, forest growth detection, harvest prediction and so on [2-4]. Traditional forest resource monitoring is usually time-consuming and labor-intensive due to manual field collection, which is unsuitable for large-scale research. In addition, the information accuracy for parameters such as tree height and crown width collected by hand demonstrate a high margin of error; therefore, it is necessary to explore a new and reliable forest survey method to meet the current needs of forestry production and ecological construction [5]. Since the characteristics of remote sensing technology include wide monitoring range, quick data acquisition, and low cost, it is theoretical and practical to apply it to the extraction of forestry parameters in large areas.
Passive optical remote sensing such as multispectral remote sensing, hyperspectral remote sensing, and high-resolution remote sensing have been widely used for estimating forest parameters with notable progress and outcomes. The spectral information of passive optical remote sensing data from visible to near-infrared reflects the physical structure parameters of the forest, and the forestry parameters such as vegetation index and texture information can then be the derived. Ouma used semi-variance functions on QuickBird images to investigate the relationship between forest biomass and spectral variables in Kenya [6]. Marshall & Thenkabail compared the response of hyperspectral data EO-1 Hyperion and multispectral data on biomass generation, determining that hyperspectral data was superior [7]. Mohammadi et al. developed a model for forest stock estimation in northern Iraq using Landsat ETM+ data [8]. Franklin et al. estimated the depression of spruce using Thematic Mapper (TM) data with an accuracy of 80% [9]. According to the findings of the preceding studies, passive optical remote sensing data are mostly used to invert the horizontal structural parameters of forests and are rarely utilized to estimate the vertical structure (e.g., tree height) of forests. This is mainly attributed to the low signal penetration of optical remote sensing data, which makes obtaining information in the vertical direction challenging. However, some researchers, such as Brown et al. [10], have tried to use high resolution overlapping stereo images to achieve canopy height estimation, but the elevation accuracy of the under-tree surface still cannot meet sufficiency requirements.
Synthetic Aperture Radar (SAR) as the active remote sensing technology has the ability to penetrate forest vegetation canopies and observe the ground in all weather conditions. SAR can also interact with treetops and trunks to gather the vertical structure of forests. Cloude & Papathanassiou used polarization coherence tomography to reconstruct low-frequency three-dimensional (3D) images and provided a method for optimal interferometric baseline selection to estimate forest vertical structure [11]. Blomberg et al. used L-band SAR data from Argentina’s observation satellite SAOCOM to accurately invert forest biomass in northern Europe [12]. Matasci et al. approximated the above-ground biomass of forests with root-mean-square deviation (RMSD) error of less than 20% using European Space Agency (ESA) P-band radar data [13]. Although SAR is sensitive to forest vertical structure, backscatter signal saturation often occurs when the forest biomass is large. For example, Luckman et al. used JERS-1 SAR data to estimate tropical forest biomass and discovered that the backscatter coefficient saturated when the biomass reached 6 kg/m2, affecting the accuracy of forest biomass estimation [14].
Light Detection and Ranging (LiDAR) has advantages such as high angle resolution, distance resolution, and anti-interference ability, which make it possible to gather high precision 3D surface information while avoiding signal saturation in high biomass areas [15]. Particularly in the field of forestry survey application, LiDAR has significant advantages over other remote sensing technologies with respect to forest height measurement and vertical structure acquisition in forest stands. LiDAR can provide highly accurate horizontal and vertical information of forests depending on the sampling method and configuration, but the optical sensors can only be used to provide detailed information on the horizontal distribution of forests. Therefore, this study will use airborne LiDAR data to identify the critical indicators of the forest resources present in the sample area.
The basis for estimating forestry parameters is accurate segmentation of tree point clouds. Tree crown segmentation methods based on LiDAR data are mainly divided into the following two categories: raster-based tree segmentation and direct point cloud-based tree segmentation. By interpolating the 3D point cloud, the raster-based tree segmentation firstly develops a digital surface model (DSM) and a canopy height model (CHM) by normalizing the tree height. Then, based on the height undulations in the CHM, local maximum [16, 17] or variable windows [18, 19] are used to search for local maximum as initial treetop locations, and finally, edge detection or feature extraction methods are employed to identify tree canopies. Watershed segmentation algorithms [20, 21, 22] and flow tracking algorithms [23] are two examples of raster-based tree segmentation algorithms. The CHM-based segmentation method is quick and effective, but it can identify the wrong segment and omit details. Moreover, the segmentation accuracy is directly influenced by the CHM resolution, and CHM only represents canopy surface information without describing the canopy’s vertical structure. With the development of LiDAR technology, the density and accuracy of point clouds have rapidly developed, and many researchers directly use the point cloud data to segment the tree crowns [24, 25]. Wang et al. first proposed voxel segmentation of raw point cloud data with the vertical canopy structure of the forest, dividing the canopy areas of different heights based on the elevation distribution within the voxels and performing tree segmentation [26]. Morsdorf et al. used local maxima search as seed points for k-mean clustering of 3D point clouds [27]. Li et al. proposed a top-to-bottom area growth algorithm relying on the relative distance between trees, and this method achieved 90% segmentation accuracy for coniferous forests, but the applicability was not transferrable to dense forest areas with overlapping canopies [28]. Compared with the traditional raster-based tree segmentation method, the direct segment processing of point cloud data can more accurately reflect the 3D structure of trees. Unfortunately, the majority of segmentation studies on tree segmentation using LiDAR data prefer low-density stands, and most of them are not ideal for complex forest environments with overlapping canopies and a variety of tree species. Additionally, the single segmentation method is not universal and is challenging to apply to trees of different scales. To get good canopy segmentation for further tree species classification and parameter extraction, this paper adopts a rotating profile segmentation method to obtain all possible seed points as initial treetop and finds canopy edges by analyzing the trend of profile point clouds.
For the study of tree species classification and identification based on LiDAR data, Holmgren & Persson used a supervised classification method to distinguish Norway spruce and Scots pine with 95% accuracy [29]. Othmani et al. used terrestrial laser scanning (TLS) data to distinguish five tree species using wavelet transform with an overall accuracy of 88% [30]. Lin & Hyyppä used a support vector machine approach to classify the tree species by extracting point cloud distribution, crown-internal and tree-external features, and achieved an overall accuracy is 85% [31]. Kim et al. extracted canopy structure parameters for tree species classification using leaf-on and leaf-off LiDAR data in the growing and deciduous seasons; the results indicated that tree species identification from both data was superior to single season data [32]. In addition, some other scholars have made full use of point cloud intensity information and introduced it into tree species classification studies, such as Ørka et al. who combined structural and intensity features to classify Norway spruce and birch, and their results proved that the classification accuracy was better than using structural or intensity features alone [33]. The primary benefit of LiDAR intensity is related to the reflectance of surface features; there are several intensity-related confounding variables, such as parameters connected to the feature’s environment, the sensor hardware system, and the data gathering geometry [34]. As a result, algorithmic parametric models based on intensity information are usually limited to a single location. As demonstrated above, accurate canopy structure information is the most reliable feature for tree species classification. In this paper, a machine learning method is utilized to learn the shape of canopy profiles of known tree species in sample plots for learning, and finally to design the tree species identification model. The method is suitable for most tree species with different shapes and can be widely used in most forest survey situations.
LiDAR has been successfully applied in forestry parameter extraction for a long time. Solodukhin et al. used LiDAR point cloud data for tree height extraction, and the RMSE between their estimated tree height and photogrammetry results was 14 cm [35]. The parameters that can be directly obtained from the segmented tree crowns are generated from the LiDAR data. Information such as tree height and crown width or height can be easily obtained, but the crown width diameter at breast height (DBH) and tree species cannot be directly obtained. Although LiDAR data cannot directly estimate the diameter at breast height of forest trees, some existing studies use measured data to establish relationships and indirectly infer tree diameter at breast height parameters from LiDAR data. For example, Shrestha & Wynne estimated the diameter at breast height of trees in urban areas of central Oklahoma, USA, using the Optech ALTM 2050 system with an R2 of 0.89 [36]. As parameters derived from LiDAR coordinate information, canopy structure parameters are widely used in forest biomass inversion. They are usually calculated from the vegetation echoes after elevation normalization, including 25%, 50%, 75% percentile height, maximum tree height, mean tree height, and forest canopy height. Bortolot & Wynne established a regression analysis based on the 25%, 50% and 75% percentile height and biomass, and obtained correlation coefficients between predicted and actual measurements ranging from 0.59 to 0.82, with RMSE ranging from 13.6 to 140.4 t/ha [37]. Wang et al. estimated aboveground biomass based on an Unmanned Aerial Vehicle (UAV) LiDAR system and the results showed that the mean height of trees was the most reasonable parameter to predict aboveground biomass [38]. Several researchers have recognized the importance of LiDAR intensity data and applied it to biomass inversion, such as García et al. who estimated biomass in a Mediterranean forest in central Spain using height parameters derived from airborne LiDAR point cloud data and distance-corrected intensity parameters; consequently, their results showed that intensity correction could improve the accuracy of forest biomass estimation [39]. Numerous research studies have demonstrated that parameter estimation considering tree species classifications is more accurate. Donoghue et al. discovered that LiDAR-based tree height and biomass estimation algorithms for coniferous forests were not applicable to mixed forests [40]. Jin et al. introduced tree species as a dummy variable into the regression model when point cloud feature regression modeling was performed to estimate the stocking volume using the peak forest site in Guangxi, with an elevated coefficient of determination R² of the model estimation results [41]. Pang & Li divided temperate forests in the Xiaoxing’an Mountains into coniferous, broadleaf, and mixed forests for biomass inversion, and the findings revealed that differentiated biomass modeling can further improve biomass estimation accuracy [42]. Therefore, in this paper we will use existing tree species to verify and update the wrong tree species information in the sample plots, as well as correct the above-ground biomass at breast height, storage volume, and other parameters of trees in the sample plots based on the accurate tree species information.
In summary, this paper focuses on the urgent needs of the current forestry survey by using LiDAR point cloud data, which has high-precision horizontal and vertical structure information, to verify and update the error information of manually collected sample plots. The paper addresses the following issues: (1) To solve the segmentation problem of staggered canopies for the complex growing condition of the northeastern primeval forest, the rotating profile segmentation method is used to obtain the canopy edge points and obtain the segmentation point cloud. (2) Since the spectrum information of tree species varies with seasons and growth phases, it is difficult to obtain multi-hyperspectral remote sensing data with LiDAR in most circumstances. This paper will focus on the classification of tree species by using the geometric structure information of tree canopies based on the segmented point cloud. However, the structure of individual tree species is very different, so this paper attempts to use the segmentation of the shape of the canopy section; that is, the 3D information is converted into two-dimensional (2D) information, and then the intercepted line segments of the section are used to change the 2D shape into a one-dimensional (1D) interpolation vector by determining the change trend of the line segments. Based on the 1D vector, the deep belief network (DBN) method is used to establish the tree species recognition model and update the sample tree species error information by combining the sample tree species information. (3) Finally, forestry parameters (diameter at breast height, above-ground biomass and storage volume) are estimated and updated based on the updated tree species information by achieving the extraction of forestry survey parameters based on LiDAR point cloud data and validating the superiority of LiDAR data in forestry parameter extraction for its application in forest resource surveying.
This paper is organized as follows: Section 1 discusses the significance and advantages of LiDAR point cloud data in forestry resource surveying, as well as the current status and limitations of research on tree segmentation, tree species classification, and forestry parameter extraction based on LiDAR data, which leads to the method of checking and updating the incorrect information of manually collected sample plots based on LiDAR data proposed in this paper. Section 2 includes an overview of the study area’s location and characteristics, as well as an introduction to the experimental data gathering methods and characteristics (including measured sample data and LiDAR point cloud data). It also describes the paper’s research methods and processes, such as point cloud data pre-processing, the tree segmentation method for rotating profiles, tree species classification based on segmented point clouds, and estimation and update of forestry parameters. Section 3 contains the results of tree canopy segmentation, species identification, and parameter extraction, while Section 4 has a full analysis and explanation of the findings. Section 6 outlines the approach’s merits and drawbacks and provides an analysis and outlook on future research works.
2. Materials and Methods
2.1. Materials
2.1.1. Study Area
The Northeast China Hupao National Park is located in the northeastern region of China, along the border of Jilin Province and Heilongjiang Province, at 42°31′06″N-44°14′49″N, 129°5′0″E-131°18′48″E. The park is situated in the southern region of the Changbai Mountain Range’s Laoyeling branch, with the terrain mainly consisting of middle and low mountains, canyons and hills, reaching an elevation of 1477.4 meters at Laoyeling. The park’s soil is predominantly dark brown soil and marshy soil. The park is located at the heart of the temperate coniferous and broad-leaved mixed forest ecosystem in Asia, with a continental humid monsoon climate, boasting an extremely rich variety of temperate forest plant species. The forest coverage rate is 93.32%, with the main vegetation type being temperate coniferous and broad-leaved mixed forests.
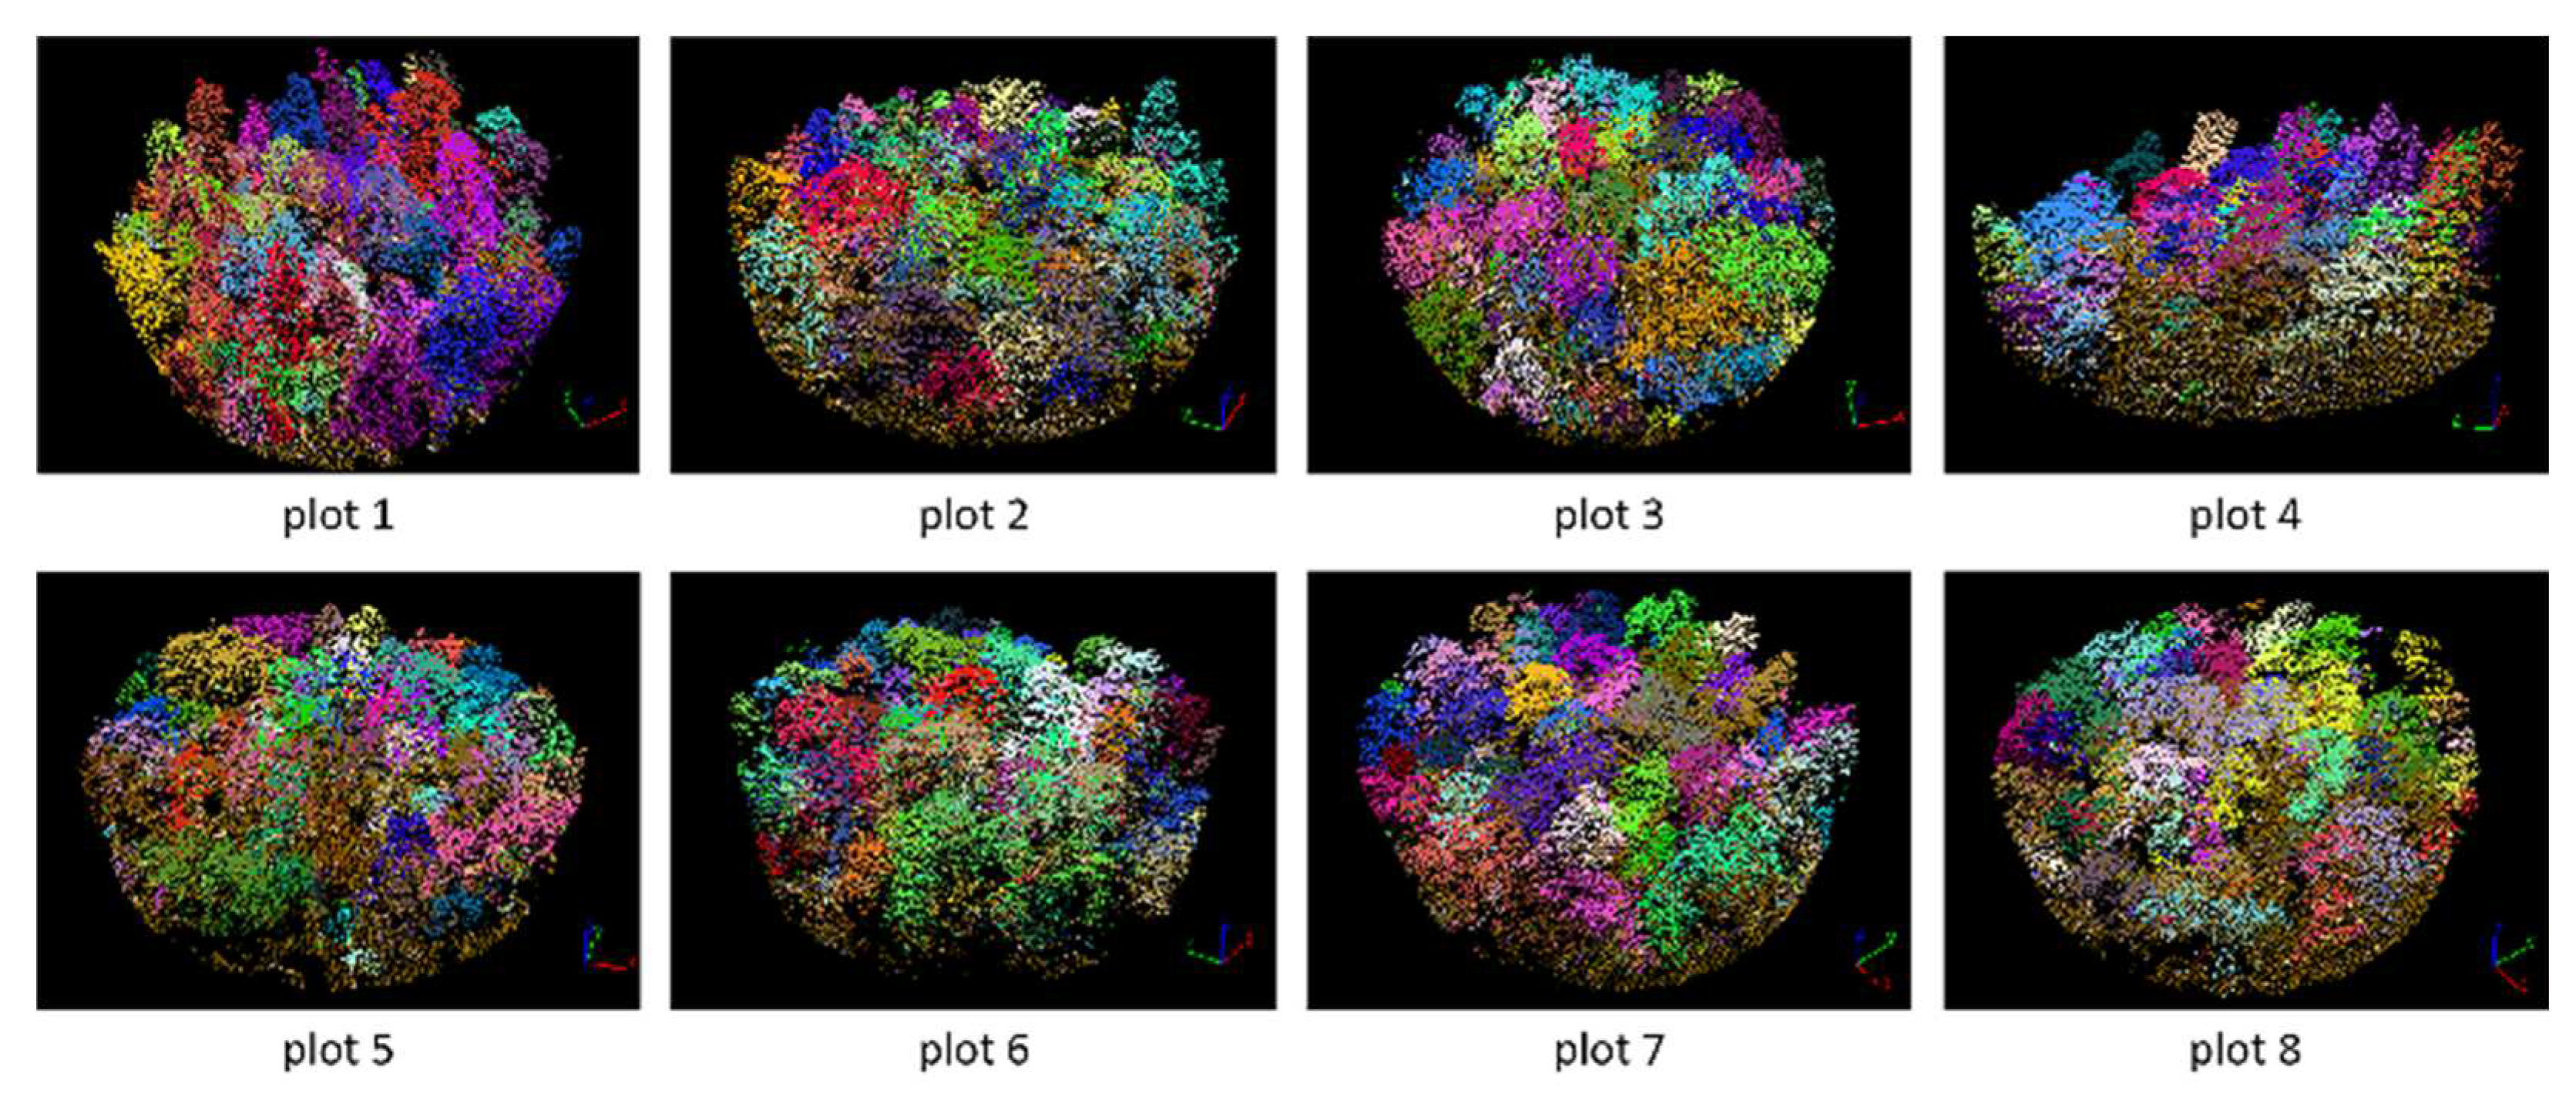
Figure 1.
Images and point cloud data of eight sample plots in Northeast China Hupao National Park. The red circles represent the plots areas.
Figure 1.
Images and point cloud data of eight sample plots in Northeast China Hupao National Park. The red circles represent the plots areas.
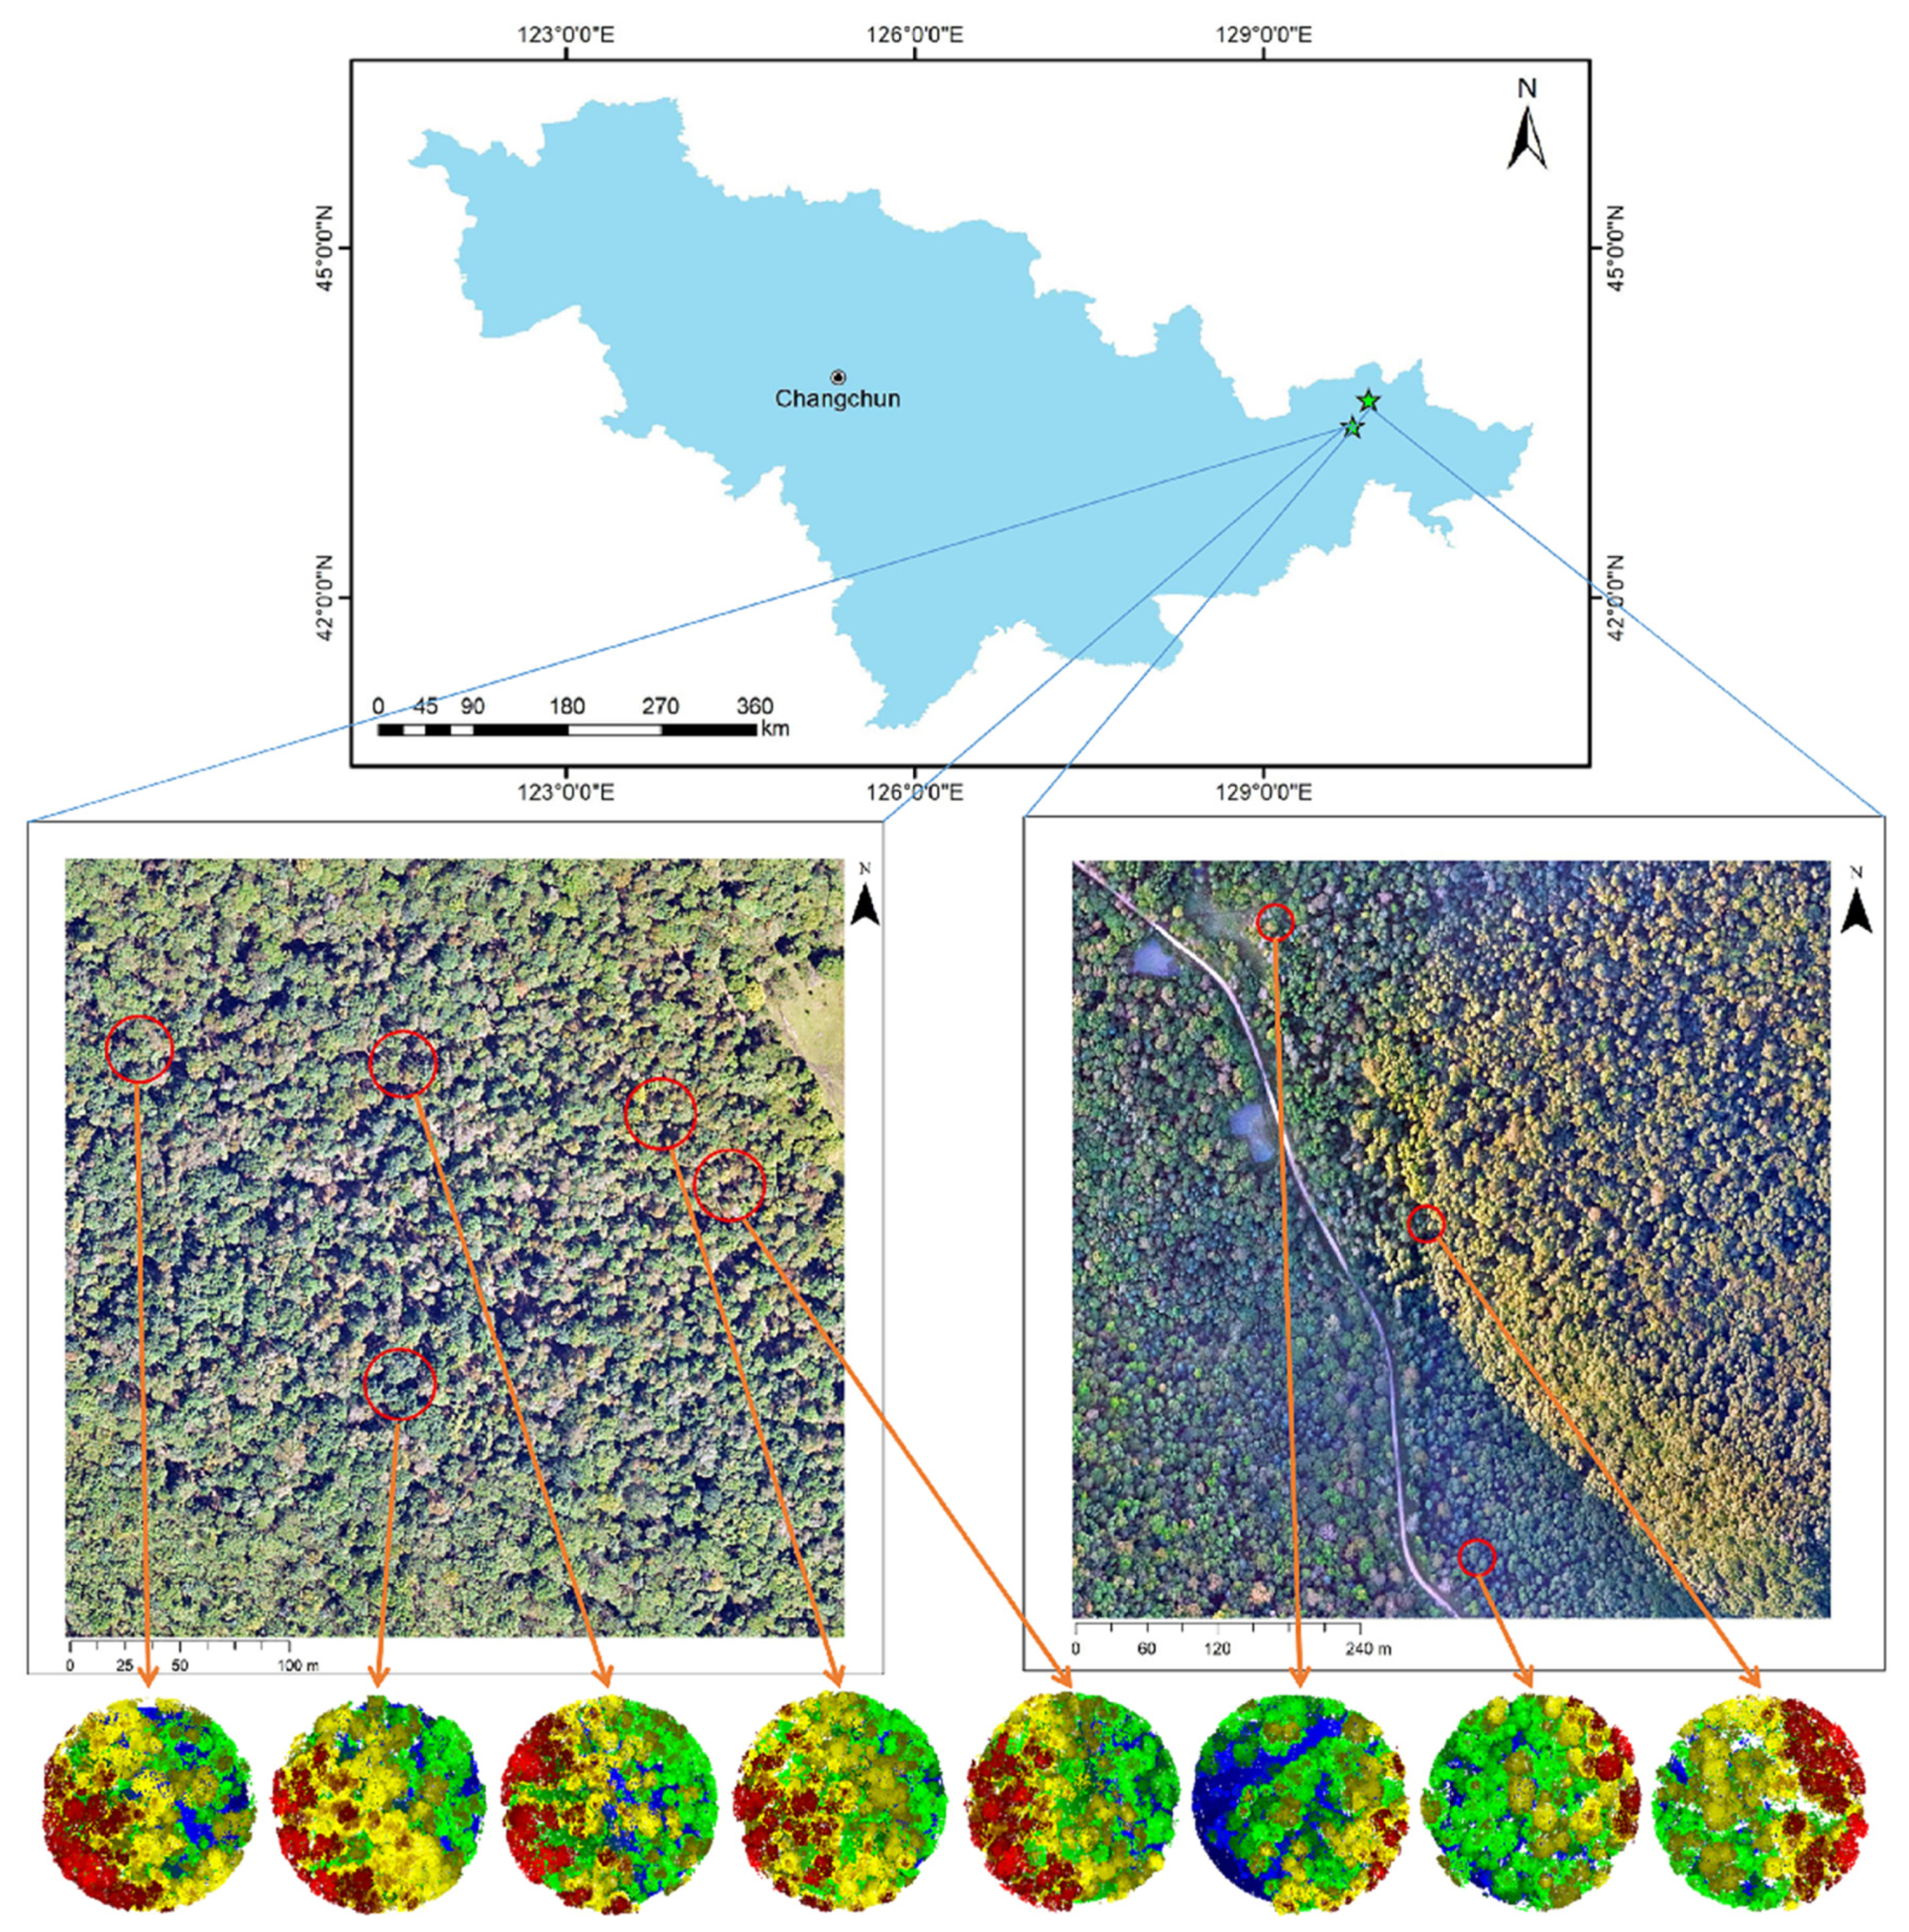
2.1.2. Sample Plots Data
In the study area, eight circular sample plots with a diameter of 30 meters are established, and various forest parameters for each tree are measured within the plots. These parameters include tree height, north-south canopy width, east-west canopy width, height under branches (HUB), DBH, tree species, tree location and three indirectly measured parameters: stock volume, above-ground biomass (AGB), and below-ground biomass (BGB). For each sample plot, the average value or the cumulative value of the measured parameters are recorded. As these are natural forests, the trees vary in height and canopies overlap. The terrain, tree species distribution, and tree growth conditions are all different for the eight sample plots, which meets the requirements for sample plots verification and updating tests.
Additionally, the manually obtained information from the sample plots is confirmed in the outfield, and the confirmed data is considered accurate, so it can be used to compare with the estimated results for accuracy.

Table 1.
Parameters for the eight sample plots.
| Plot ID | 1 | 2 | 3 | 4 | 5 | 6 | 7 | 8 | |
| Number of Trees | 50 | 42 | 45 | 41 | 29 | 41 | 31 | 39 | |
| Dominant Tree Species | pine | linden | linden | linden | linden | poplar | oak | linden | |
| Average Tree Height (m) | 14.5 | 13.5 | 16.9 | 8.2 | 14.3 | 16.4 | 13.8 | 14.3 | |
| Average DBH (cm) | 18.6 | 17.8 | 16.9 | 10.5 | 20.7 | 20.8 | 20.1 | 18.3 | |
| Average HUB (m) | 4.8 | 3.6 | 3.2 | 2.3 | 4.0 | 5.1 | 3.6 | 4.6 | |
| Average Canopy Width (m) | East-West | 2.72 | 2.49 | 2.61 | 2.27 | 2.60 | 2.83 | 2.82 | 2.27 |
| North-South | 2.72 | 2.10 | 2.31 | 2.16 | 1.82 | 2.97 | 2.20 | 1.98 | |
| Cumulative Stock Volume (m3) | 14.4 | 9.7 | 8.1 | 3.5 | 9.5 | 14.6 | 9.8 | 9.1 | |
| Cumulative AGB (t/ha) | 8390.7 | 7743.4 | 5879.0 | 2239.1 | 7158.5 | 8565.2 | 9342.1 | 7717.1 | |
2.1.3. LiDAR Data
The LiDAR data is acquired using an airborne LiDAR scanning system, combined with IMU/DGPS-assisted surveying technology. Specifically, a Cessna 208b aircraft is selected to carry the riegl-vq-1560i LiDAR payload (with seamless integration of an Inertial Measurement Unit (IMU) and global navigation satellite system (GNSS)). The Cessna 208b aircraft also jointly observes data with ground Cooperating Operating Reference Stations (CORS) and artificial base stations. The LiDAR data acquisition flight altitude is set to an average height above ground level (AGL) of 1000 meters, with the laser recorder capturing four echoes for each laser pulse. With a flight line overlap of 20%, the average laser point density is 20 points per square meter (ppm²). In accordance with the project’s task specifications, the reported horizontal accuracy is between 15 and 25 centimeters (cm), while the vertical accuracy is approximately 15 cm.
To conduct the experiment, the point cloud data is clipped using vectors of the sample plots boundaries, with an additional buffer zone of 30m radius reserved. The resulting point cloud data within the boundaries is used for the experiment.
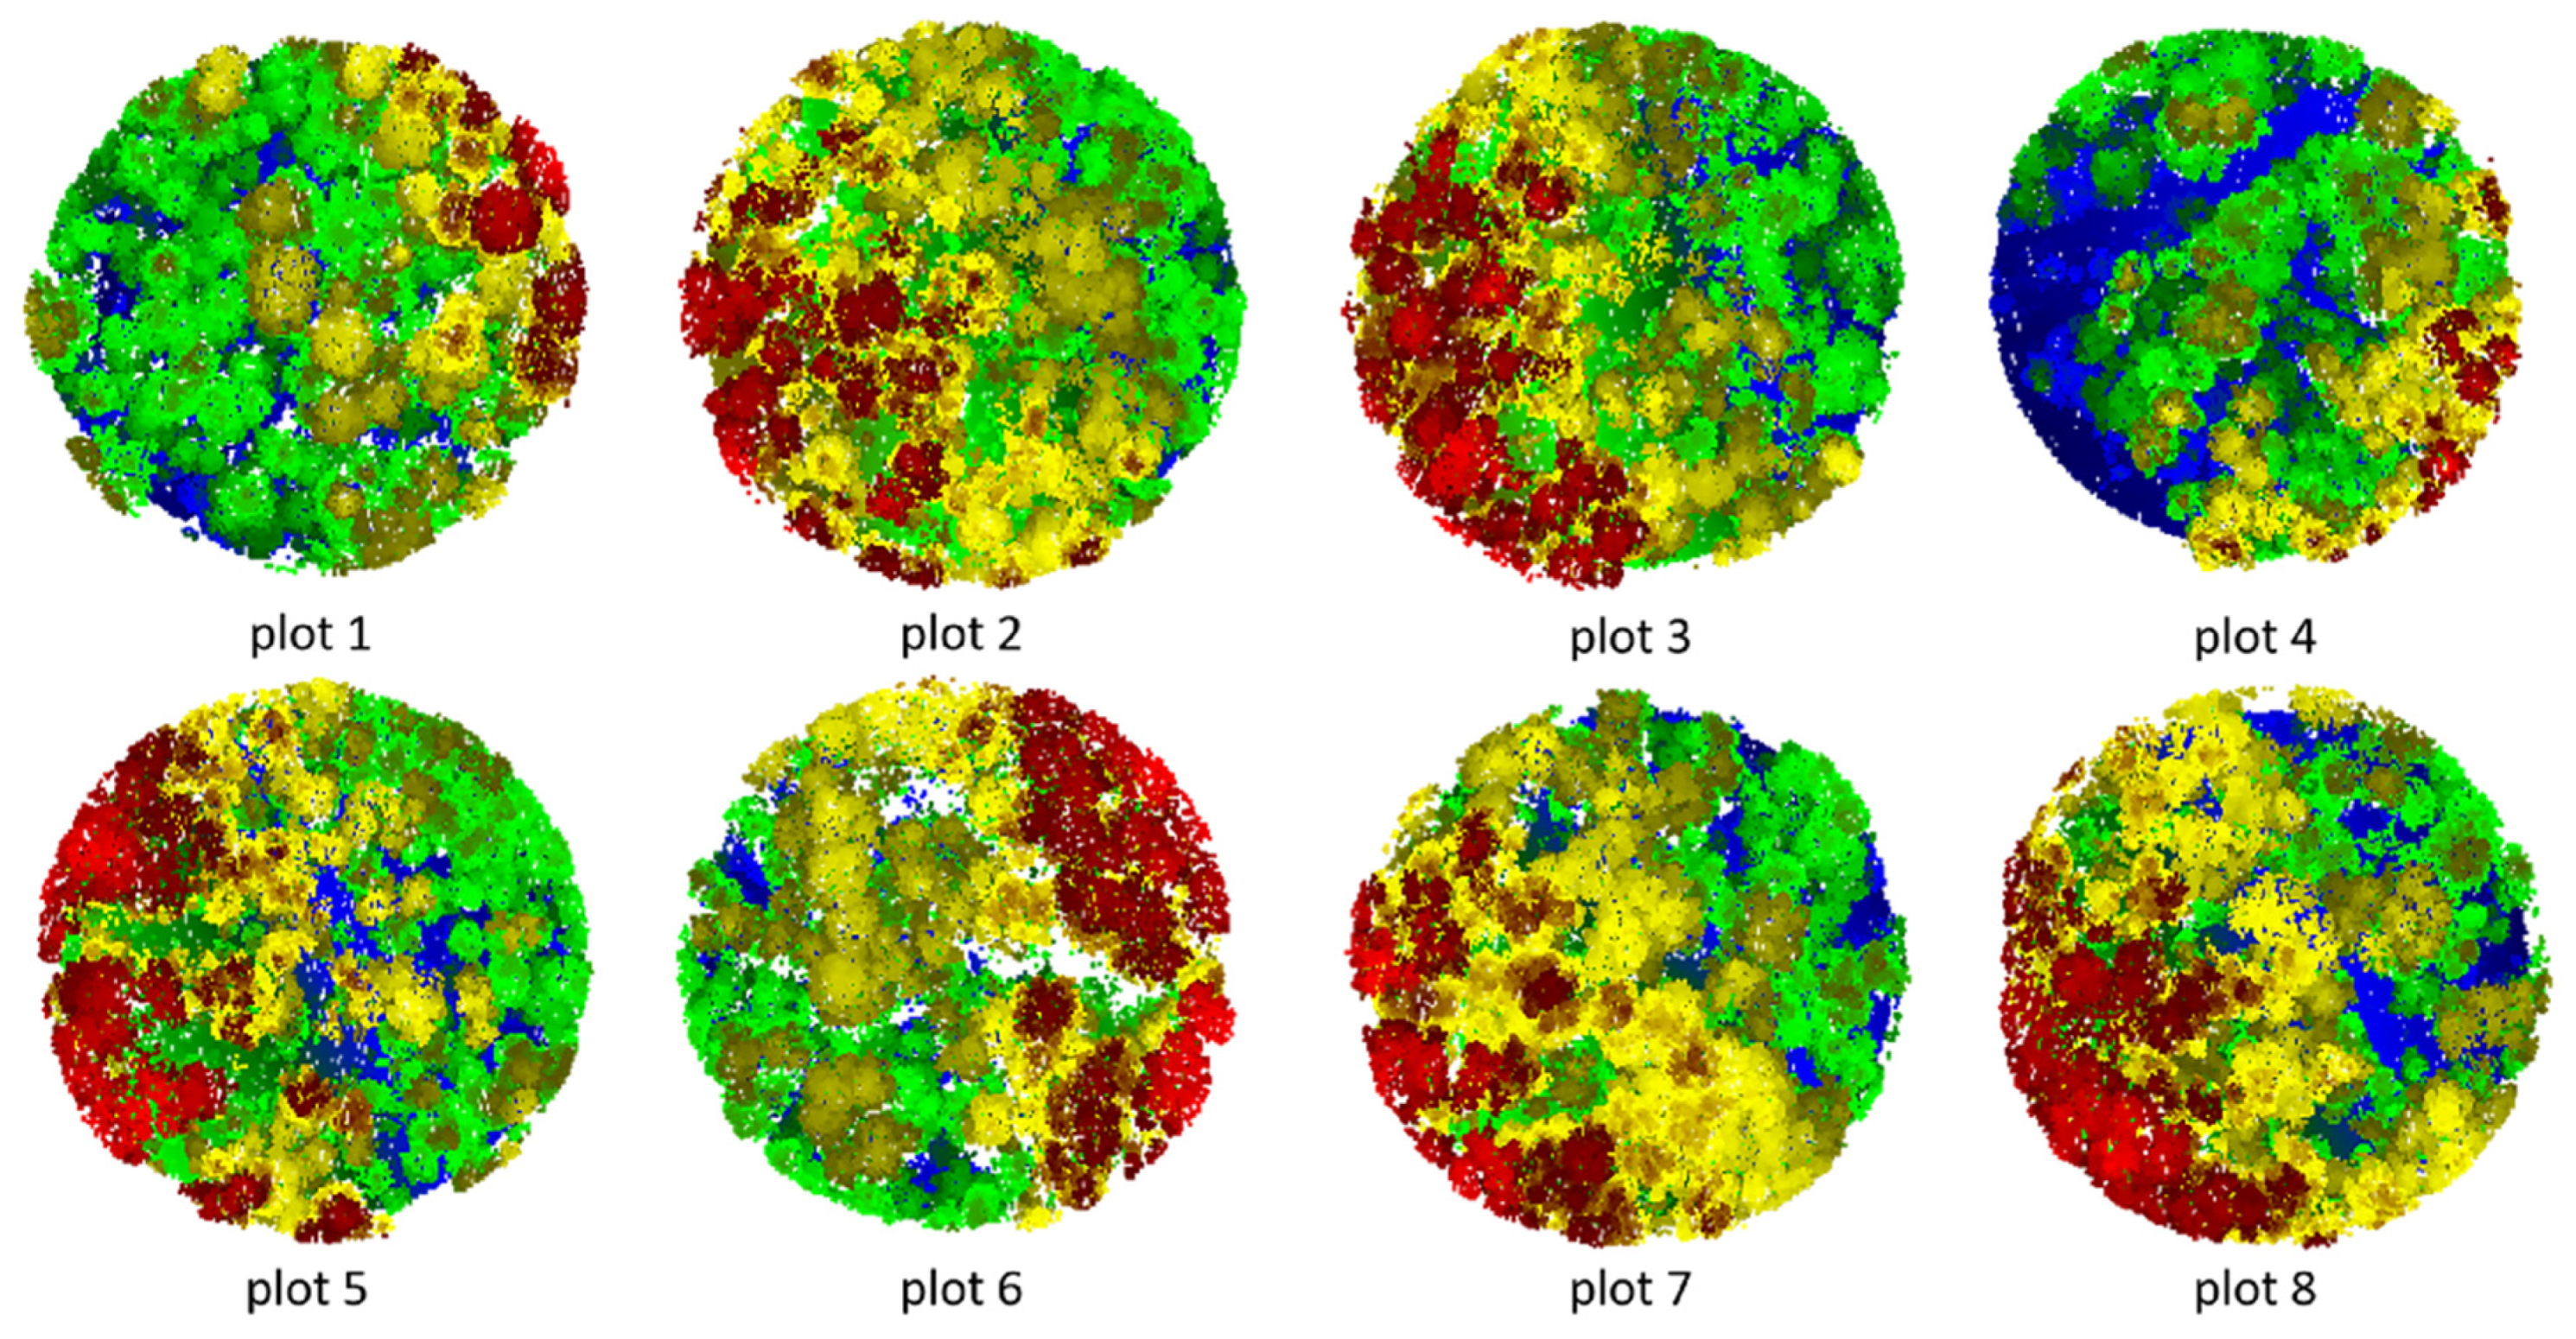
Figure 2.
Point cloud data of the eight sample plots after clipping.
2.2. Methods
Figure 3 illustrates the workflow of this experiment, which consists of two parts: data preparation and sample plot verification. The data preparation includes the pre-processing of the point cloud data and the segmentation of trees in the plots. The sample plot verification involves plots matching, tree species identification and extraction of forestry parameters.
2.2.1. Point Cloud Pre-processing
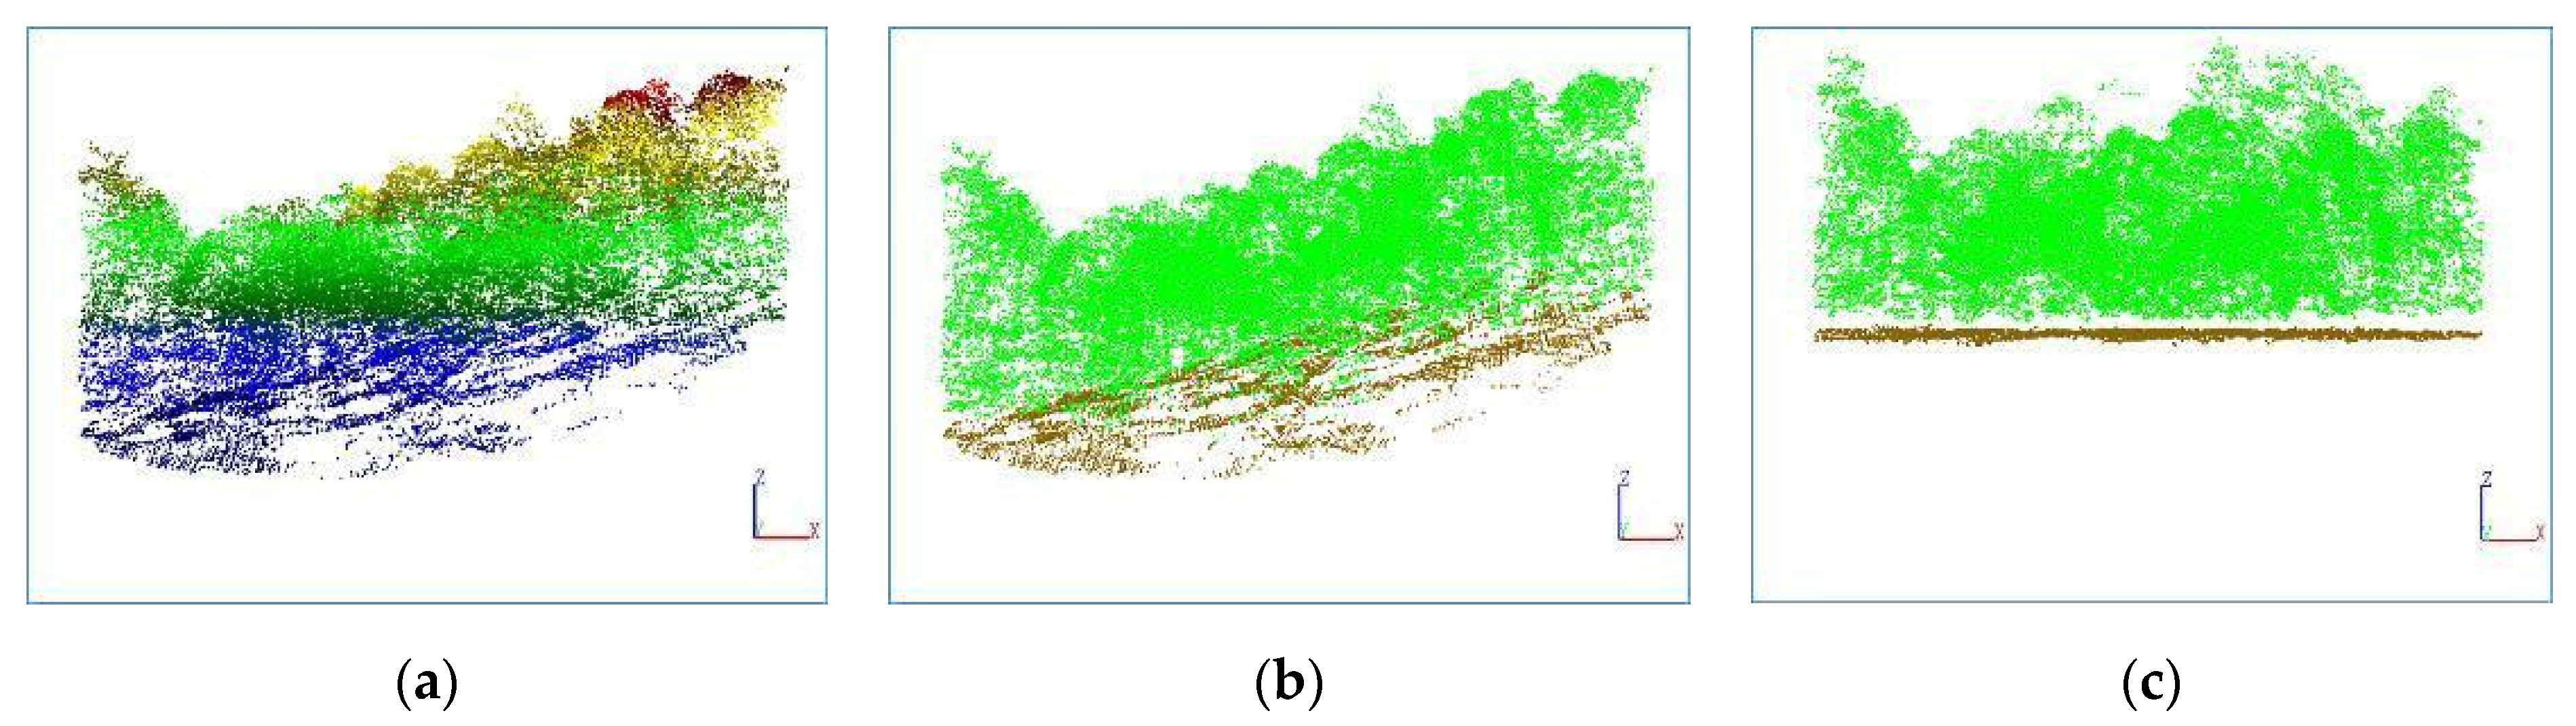
Pre-processing includes filtering and normalization of point cloud data, aiming to obtain a point cloud that eliminates terrain effects and reflects the real horizontal and vertical structure of the forest.
Point cloud filtering is the process of separating ground points and non-ground points (mainly tree points), and the obtained ground points can be used to generate a digital elevation model (DEM). Point cloud filtering is implemented using the LiDARForest software, which uses the progressive triangulated irregular network (TIN) densification algorithm (PTD) proposed by Axelsson [43]. The main idea of this algorithm is to select some low points as seed points to construct an initial TIN, and then gradually judge other points. If a point is a ground point, it is added to the TIN, otherwise it is filtered out. The point is classified as a ground point when its angle and vertical distance to the endpoints on the triangle plane are below the set thresholds. Repeat the above process until there are no more points that meet the threshold conditions. The experimental results show that point cloud filtering based on the PTD algorithm has fewer iterations and is suitable for most terrain conditions.
The elevation values of LiDAR point cloud are a combination of ground elevation and object elevation, which makes it difficult to reflect the actual vegetation height. Therefore, before conducting relevant research, it is common to normalize the point cloud. Point cloud normalization refers to the process of subtracting the elevation values of DEM from point cloud, which is generated by interpolating the ground points obtained from filtering. The normalized point cloud CNTP eliminates the influence of terrain and reflects the true horizontal and vertical distribution of trees. The highest point of the segmented individual tree can be used as the tree height.
Figure 4.
Point cloud pre-processing procedure. (a) Original point cloud; (b) Filtered point cloud; (c) Normalized point cloud. Ground points are shown in brown and tree points in green in (b) and (c).
Figure 4.
Point cloud pre-processing procedure. (a) Original point cloud; (b) Filtered point cloud; (c) Normalized point cloud. Ground points are shown in brown and tree points in green in (b) and (c).
2.2.2. Tree Segmentation
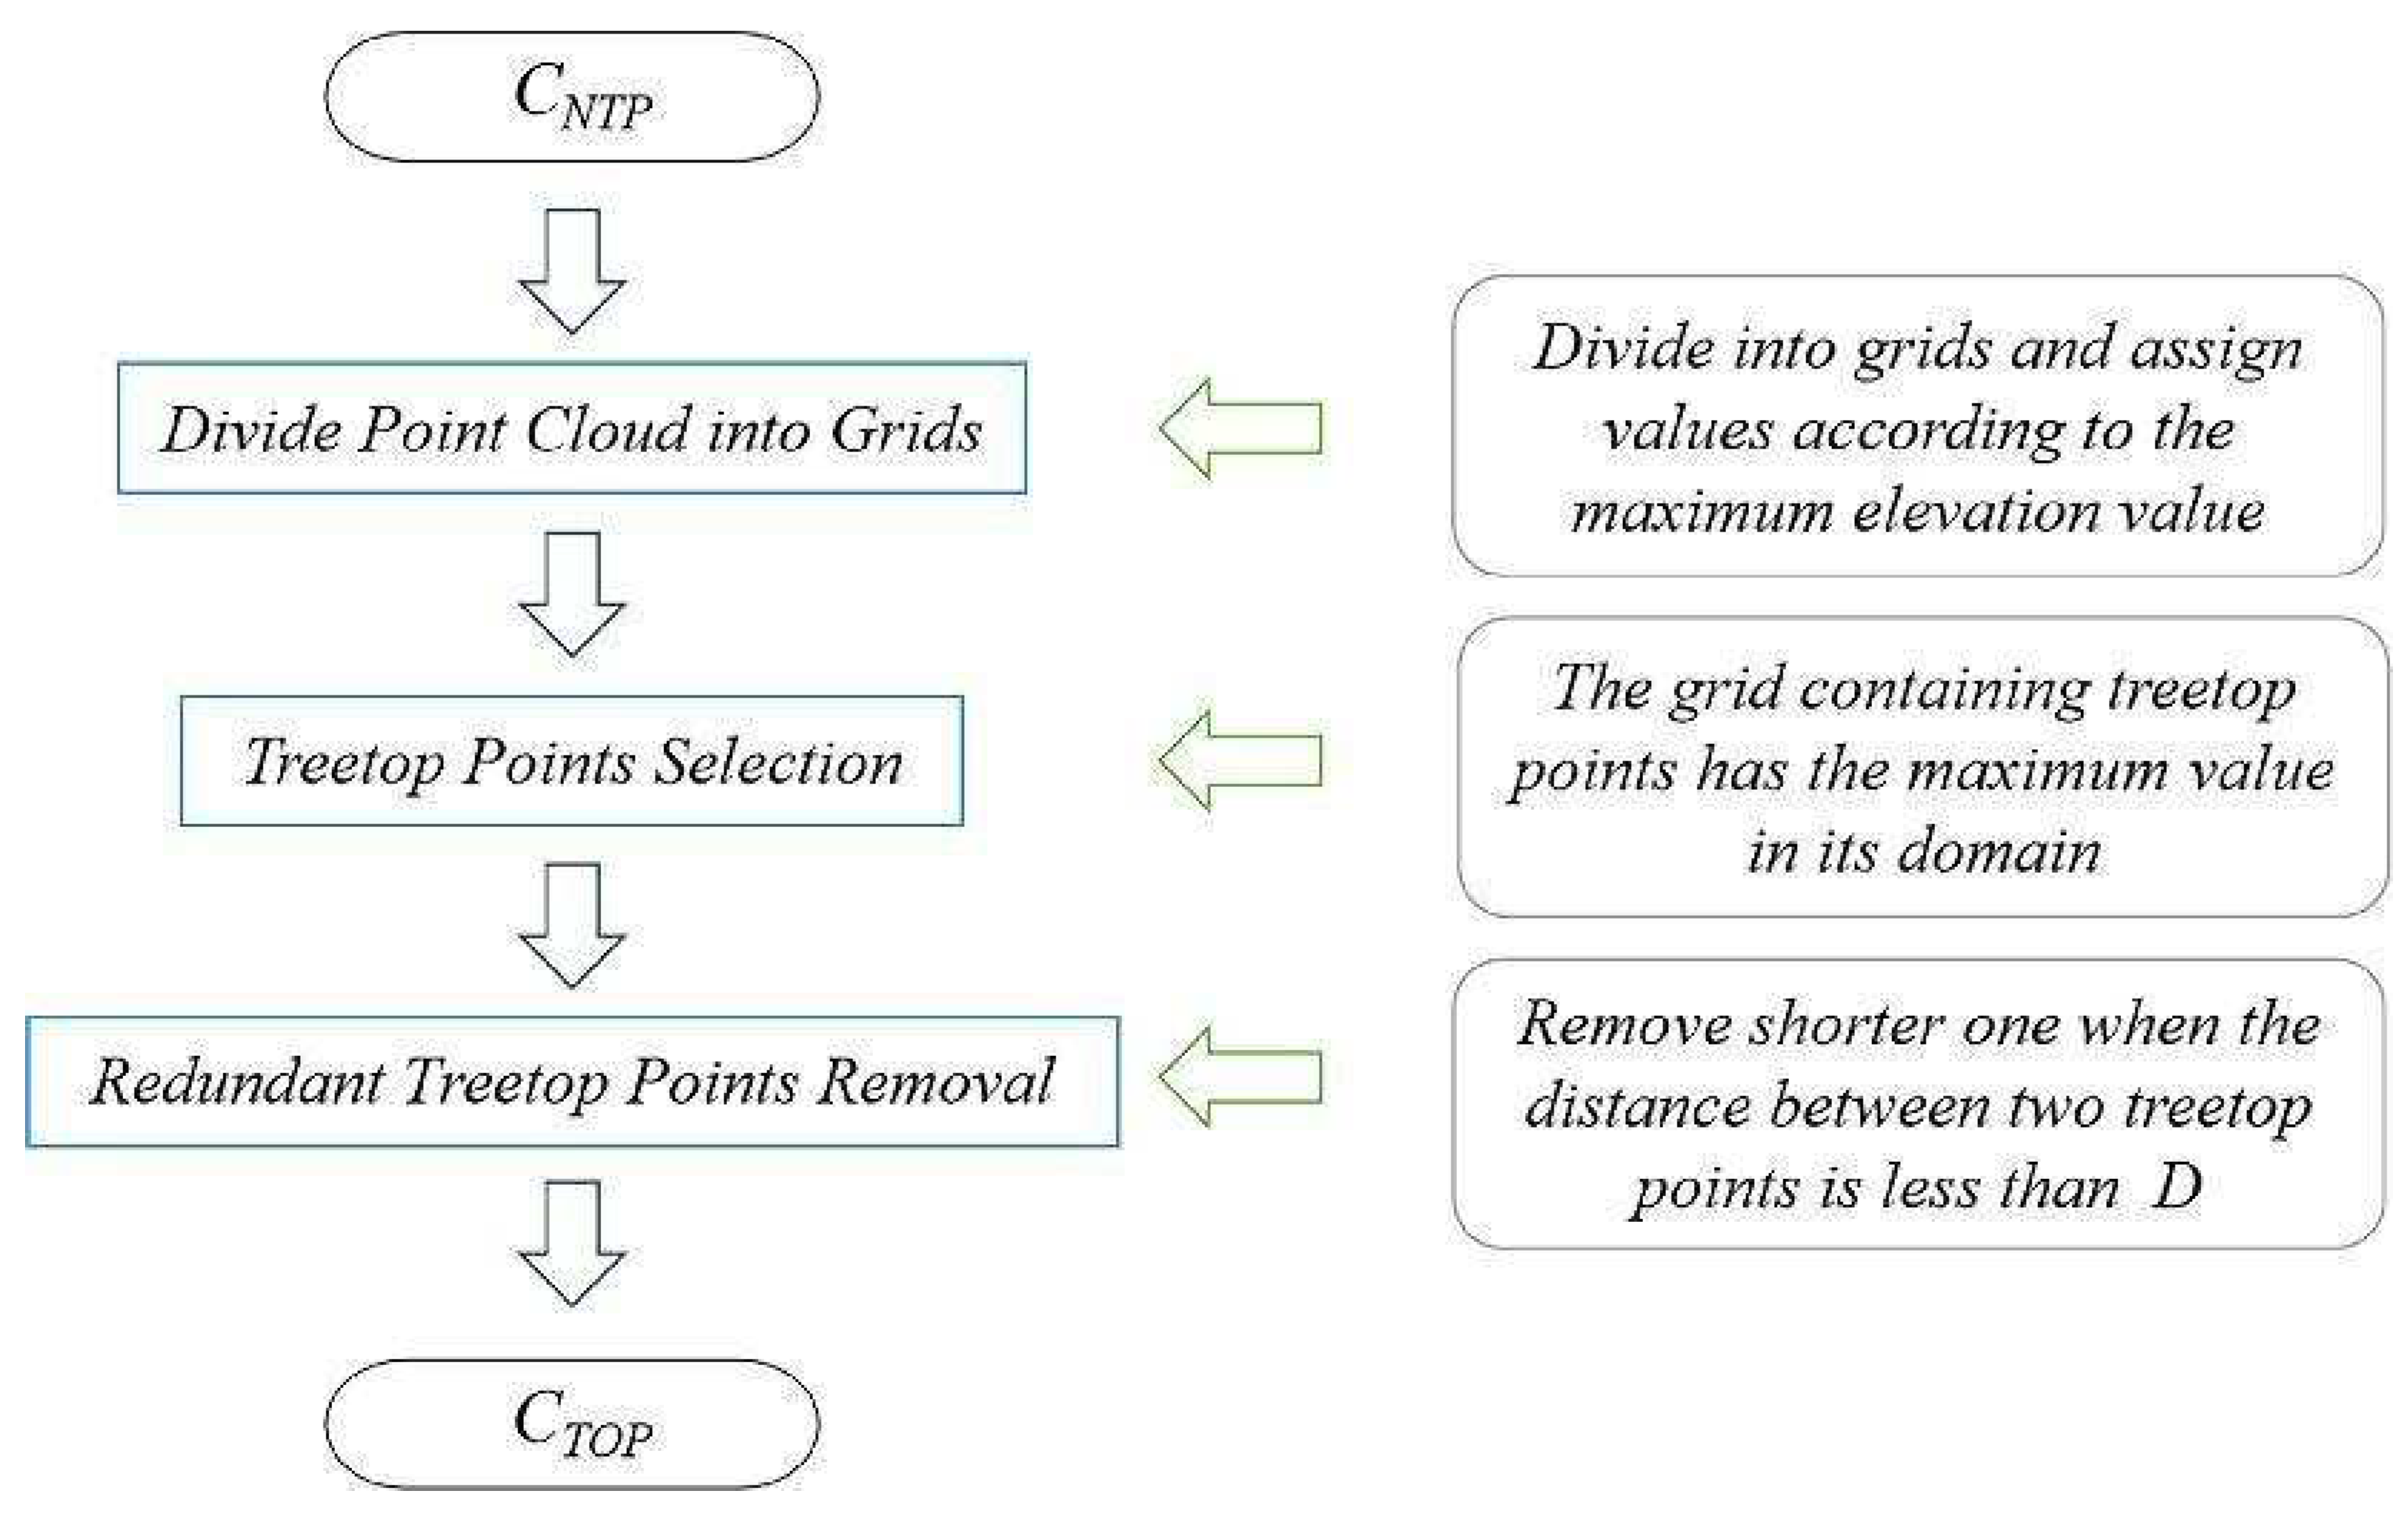
To implement the tree segmentation, the positions of the trees within the plots need to be determined. Based on the structure of the trees, the position of the highest point within individual tree range can be selected as the center of the tree. Therefore, the local highest points in CNTP are selected as the initial treetop points.
The CNTP is partitioned into grids, with the grid size, d, depending on the average distance between points. The elevation value Z of the highest tree point within each grid is assigned to the grid. If there are no tree points within the grid, it is assigned a value of 0. The treetop points are selected from the CNTP according to the following criteria: the grid containing the treetop point should have the maximum value within its neighborhood, and it should not be adjacent to any unit that does not contain any tree points. To prevent the loss of short treetop points, the grid size d is generally set to an acceptable small value, which results in some short treetop points actually being redundant parts of adjacent taller trees. To address this, a distance threshold D is defined, and the shorter treetop points are removed when the distance between two treetop points is less than D. Finally, the collection of all the selected treetop points forms the initial treetop point set CTOP.
Figure 5.
Workflow for obtaining initial treetop points.
After obtaining the initial treetop points, many studies use a clustering method to segment the canopies. This study focuses on the vertical profile structure of initial points and utilizes the rotational profiles to search for the edges of the individual tree canopy, thereby performing the tree segmentation and refining the positions of the trees [44].
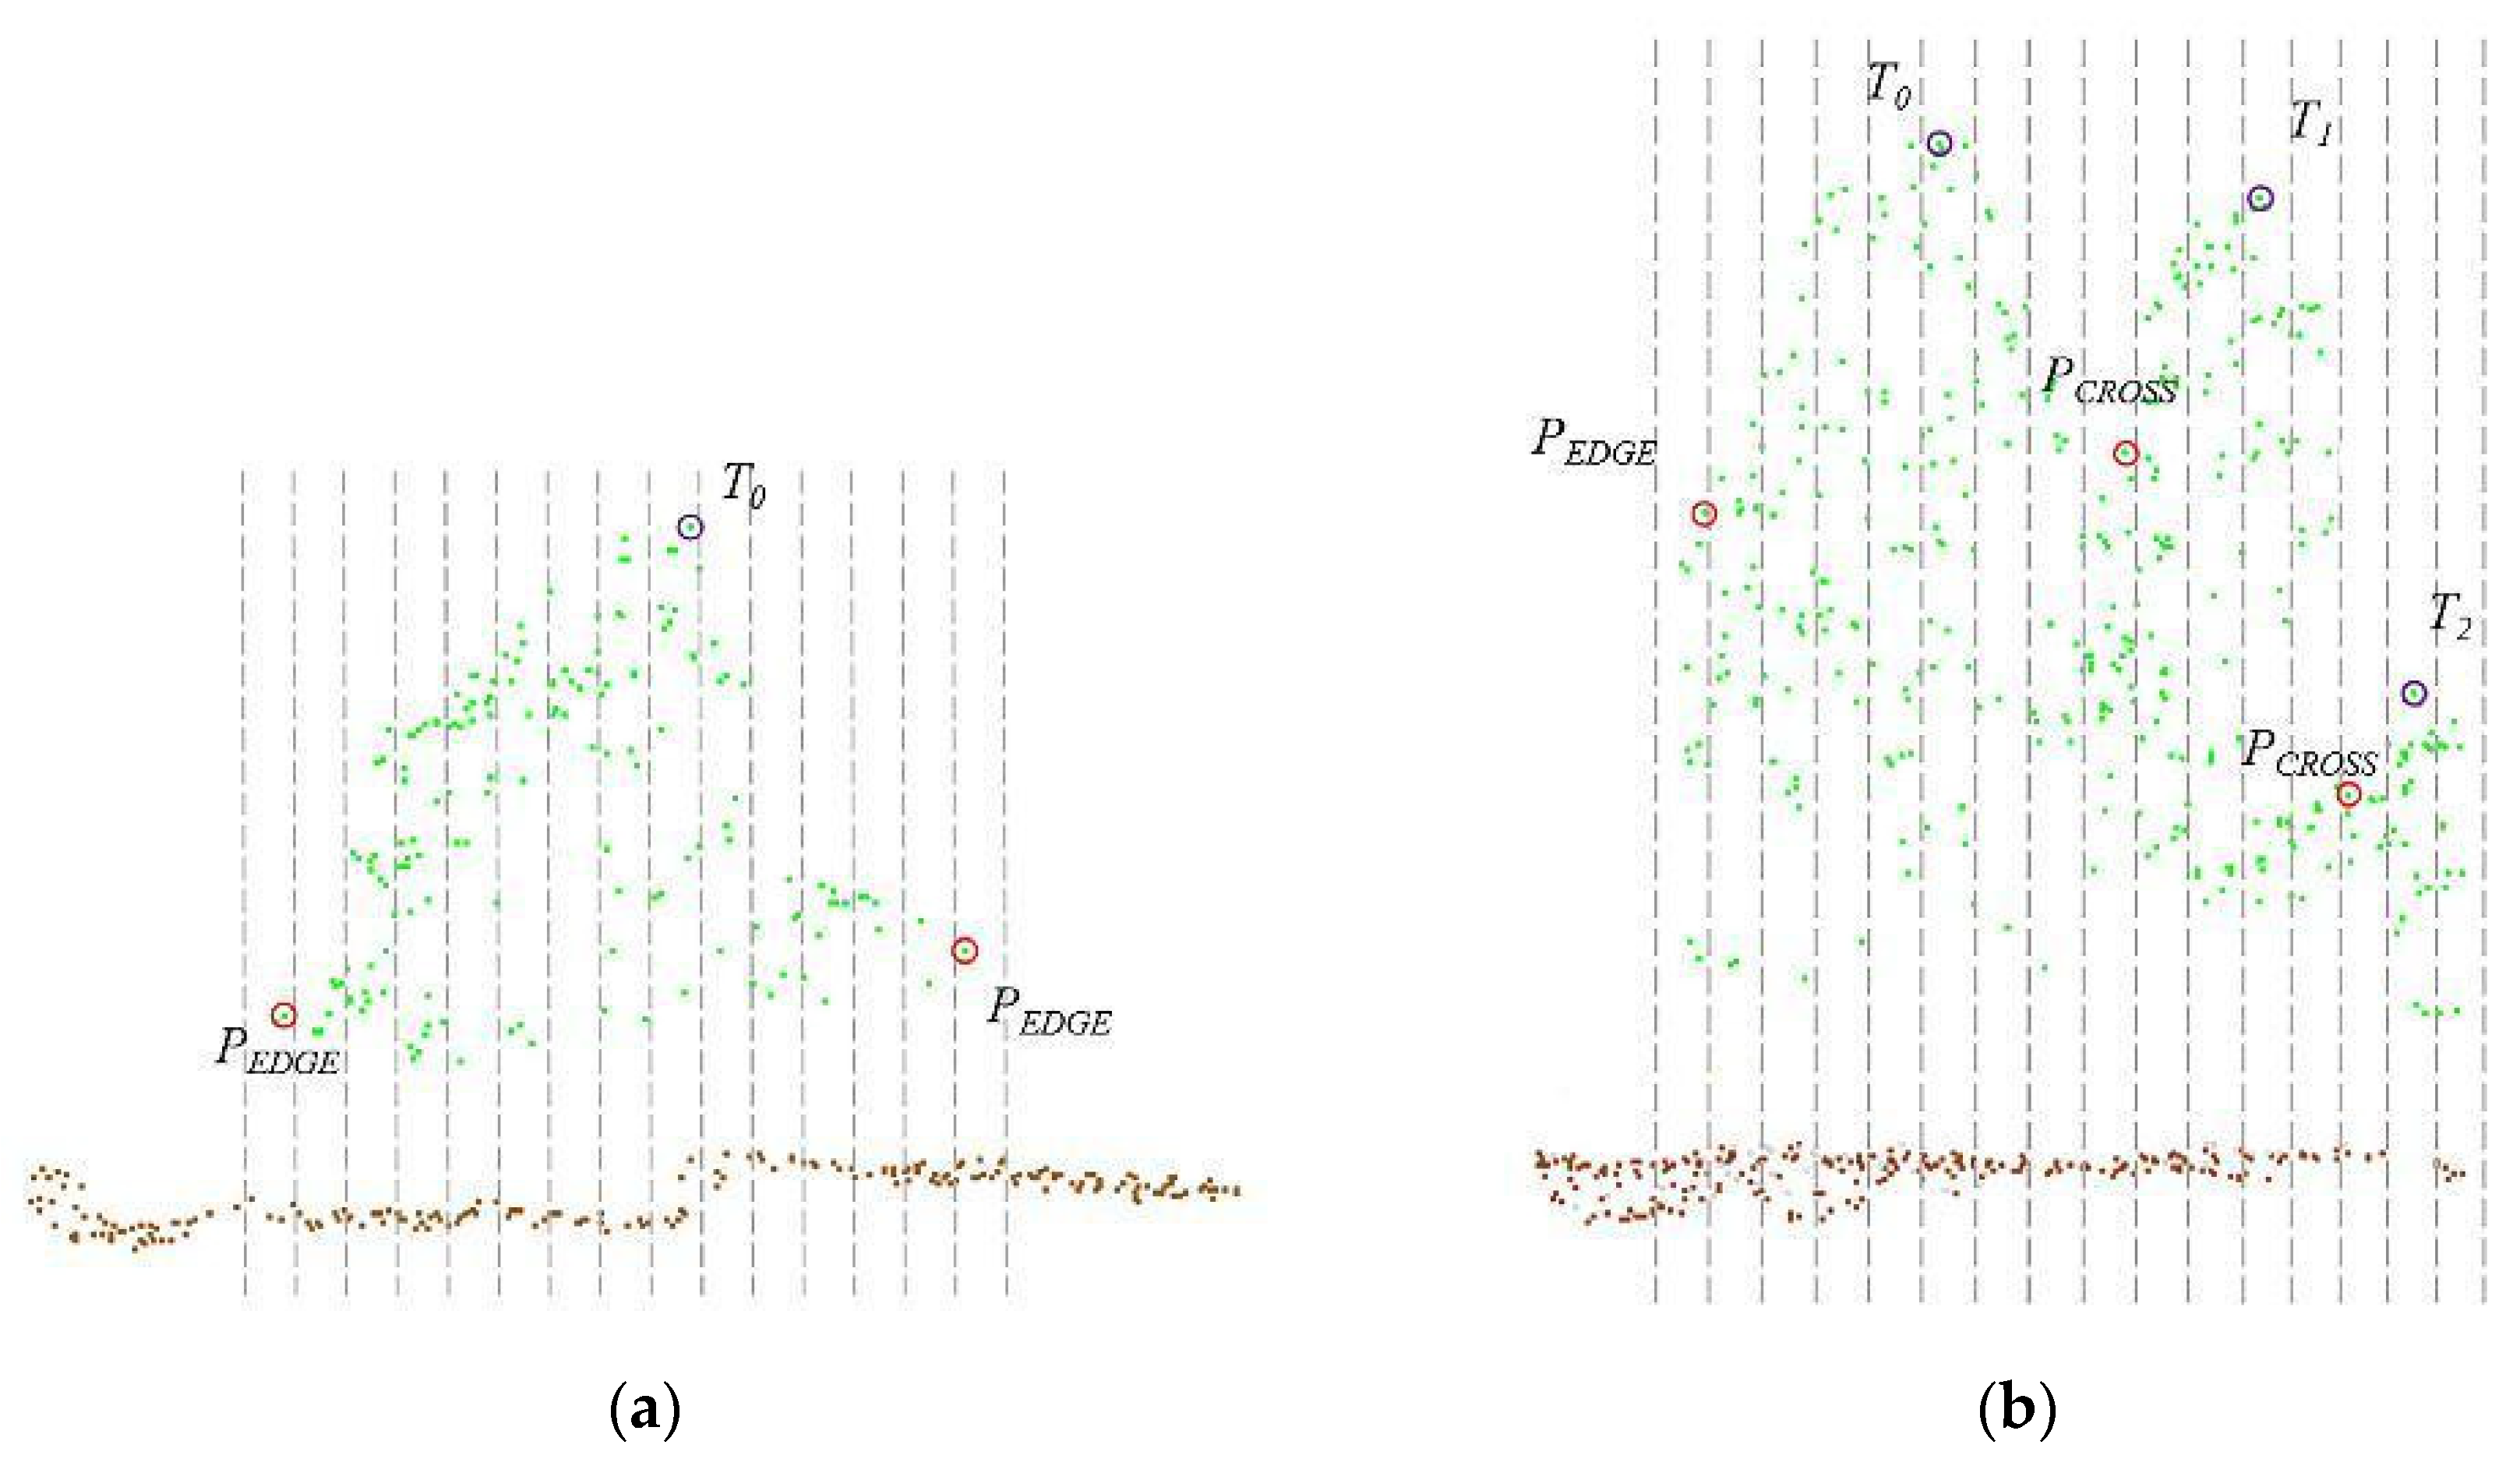
As shown in Figure 6, for a treetop point T0, the longitudinal profile at a certain angle may have the following cases: (a) the profile only contains the canopy of T0; (b) there are N treetop points Ti (1 ≤ i ≤ N) in addition to T0 within the profile, which is the general situation. The profile is divided into M sub-segments Sj (1 ≤ j ≤ M) of equal length and Zj is the maximum Z value of the tree points in the sub-segment Sj, the corresponding tree point is Pj. The edge point PEDGE and the intersection point PCROSS are searched in Pj. For situation (a), where only the canopy of T0 exists in the profile, only PEDGE needs to be searched. In this case, the edge point is located at both ends of the profile, as shown in Figure 6. For situation (b), in addition to the edge point, the intersection point PCROSS between the canopy of T0 and other canopies needs to be found. According to the overlapping situation of tree canopies, the intersection point is regarded as a valley point in the profile. Therefore, Equation 1 for obtaining PEDGE and PCROSS are derived.
where Pj: the vertex of the subsection Sj of the profile, (1 ≤ j ≤ m-1)
Zj: Z value of Pj
Figure 6.
Sub-segments and the location of PEDGE and PCROSS. (a) Single canopy; (b) Multiple canopies.
Figure 6.
Sub-segments and the location of PEDGE and PCROSS. (a) Single canopy; (b) Multiple canopies.
The profile varies in different directions. To accurately identify individual trees, the edges can be extracted by analyzing a series of rotational profiles, which are divided at intervals according to a certain angle. The steps are as follows:
- (1)
- Arrange CTOP in descending order of elevation to obtain the sequence of treetop points Ti;
- (2)
- Get a profile at the given angle for treetop T1. Let Zj be the maximum Z value of the tree points in sub-segment Sj, and Pj is the corresponding tree point. Find PEDGE and PCROSS in Pj (Figure 6 and Equation 1) to obtain the canopy range under this profile;
- (3)
- Rotate the profile around T1 to another angle to obtain the new PEDGE and PCROSS. Repeat the rotation until the rotation angle reaches 180°, then all possible edges are obtained, as well as the rough range Rt of the tree;
- (4)
- Iterate over the remaining treetop points, removing the point from CTOP if it lies within Rt. All high tree points within Rt can be grouped into the tree’s canopy;
- (5)
- Select the next treetop in descending order of elevation and repeat (2) - (4) until all treetop points have been segmented;
- (6)
- High points within a linear distance less than DMAX from the tree’s axis are grouped into the corresponding canopy set. The tree’s axis is the line from the canopy’s center of gravity to the ground, and this method can exclude some isolated high points.
Figure 7.
Workflow of rotational profile algorithm.
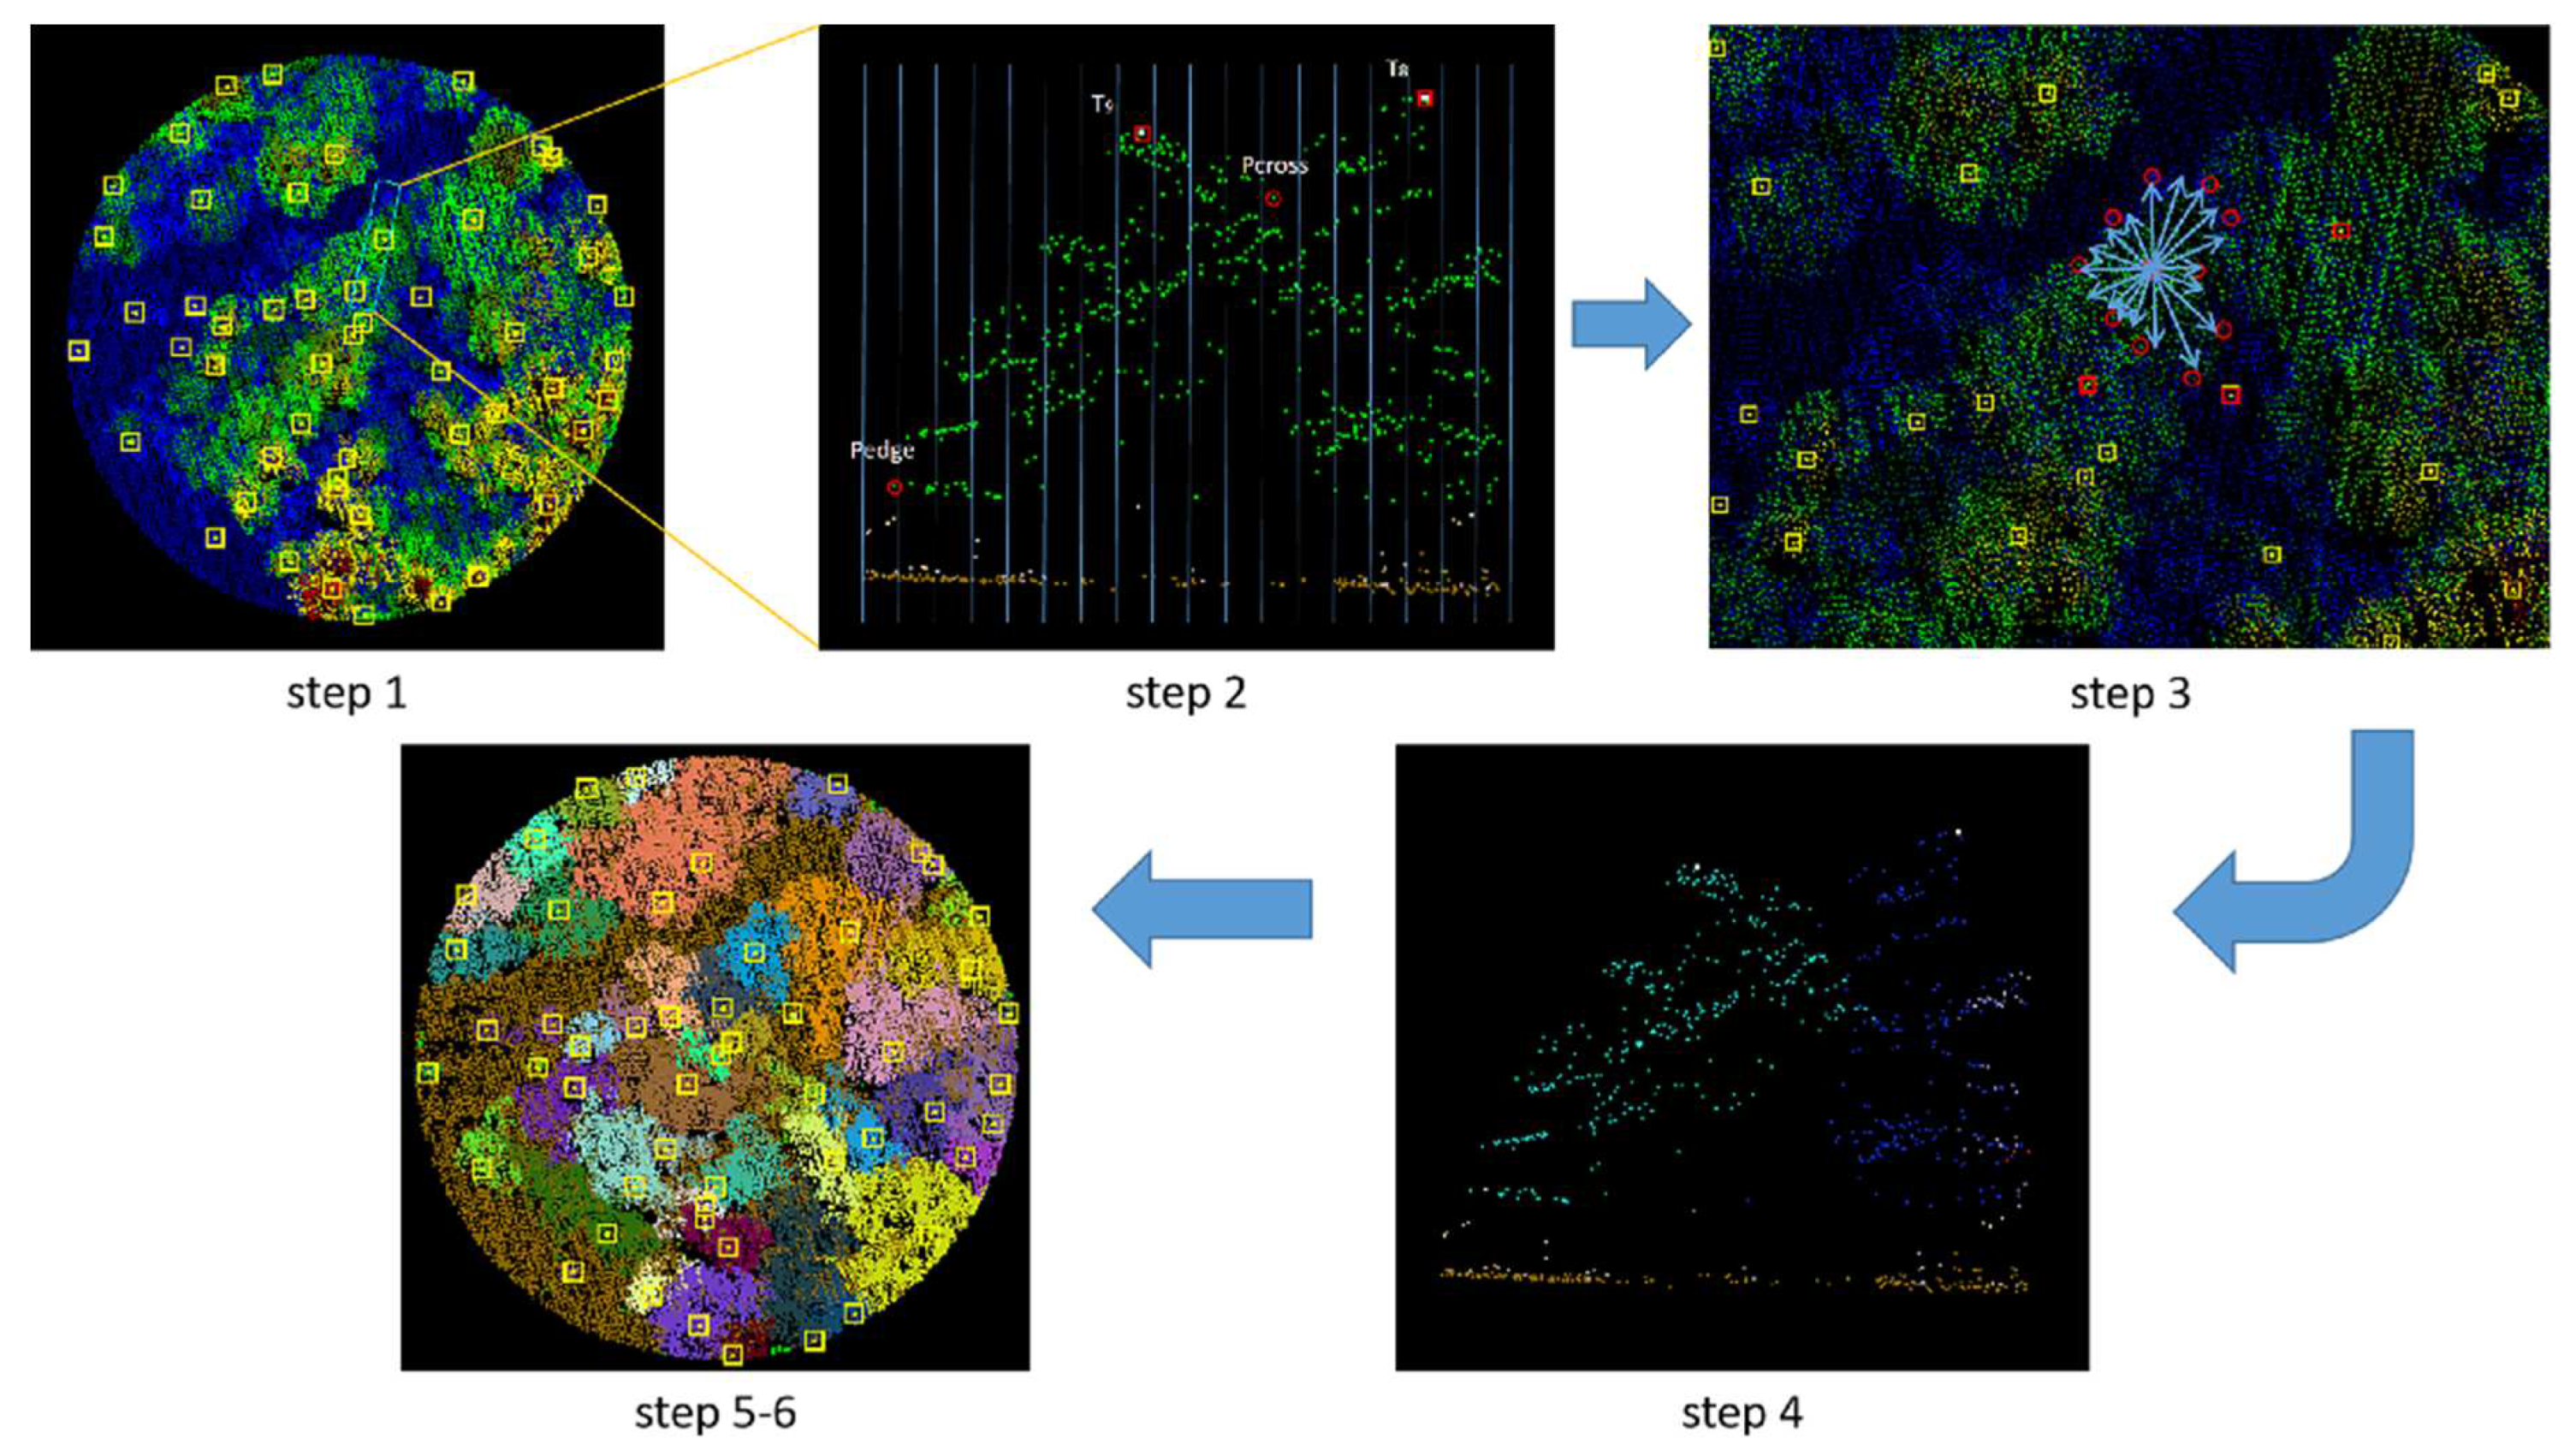
Figure 8.
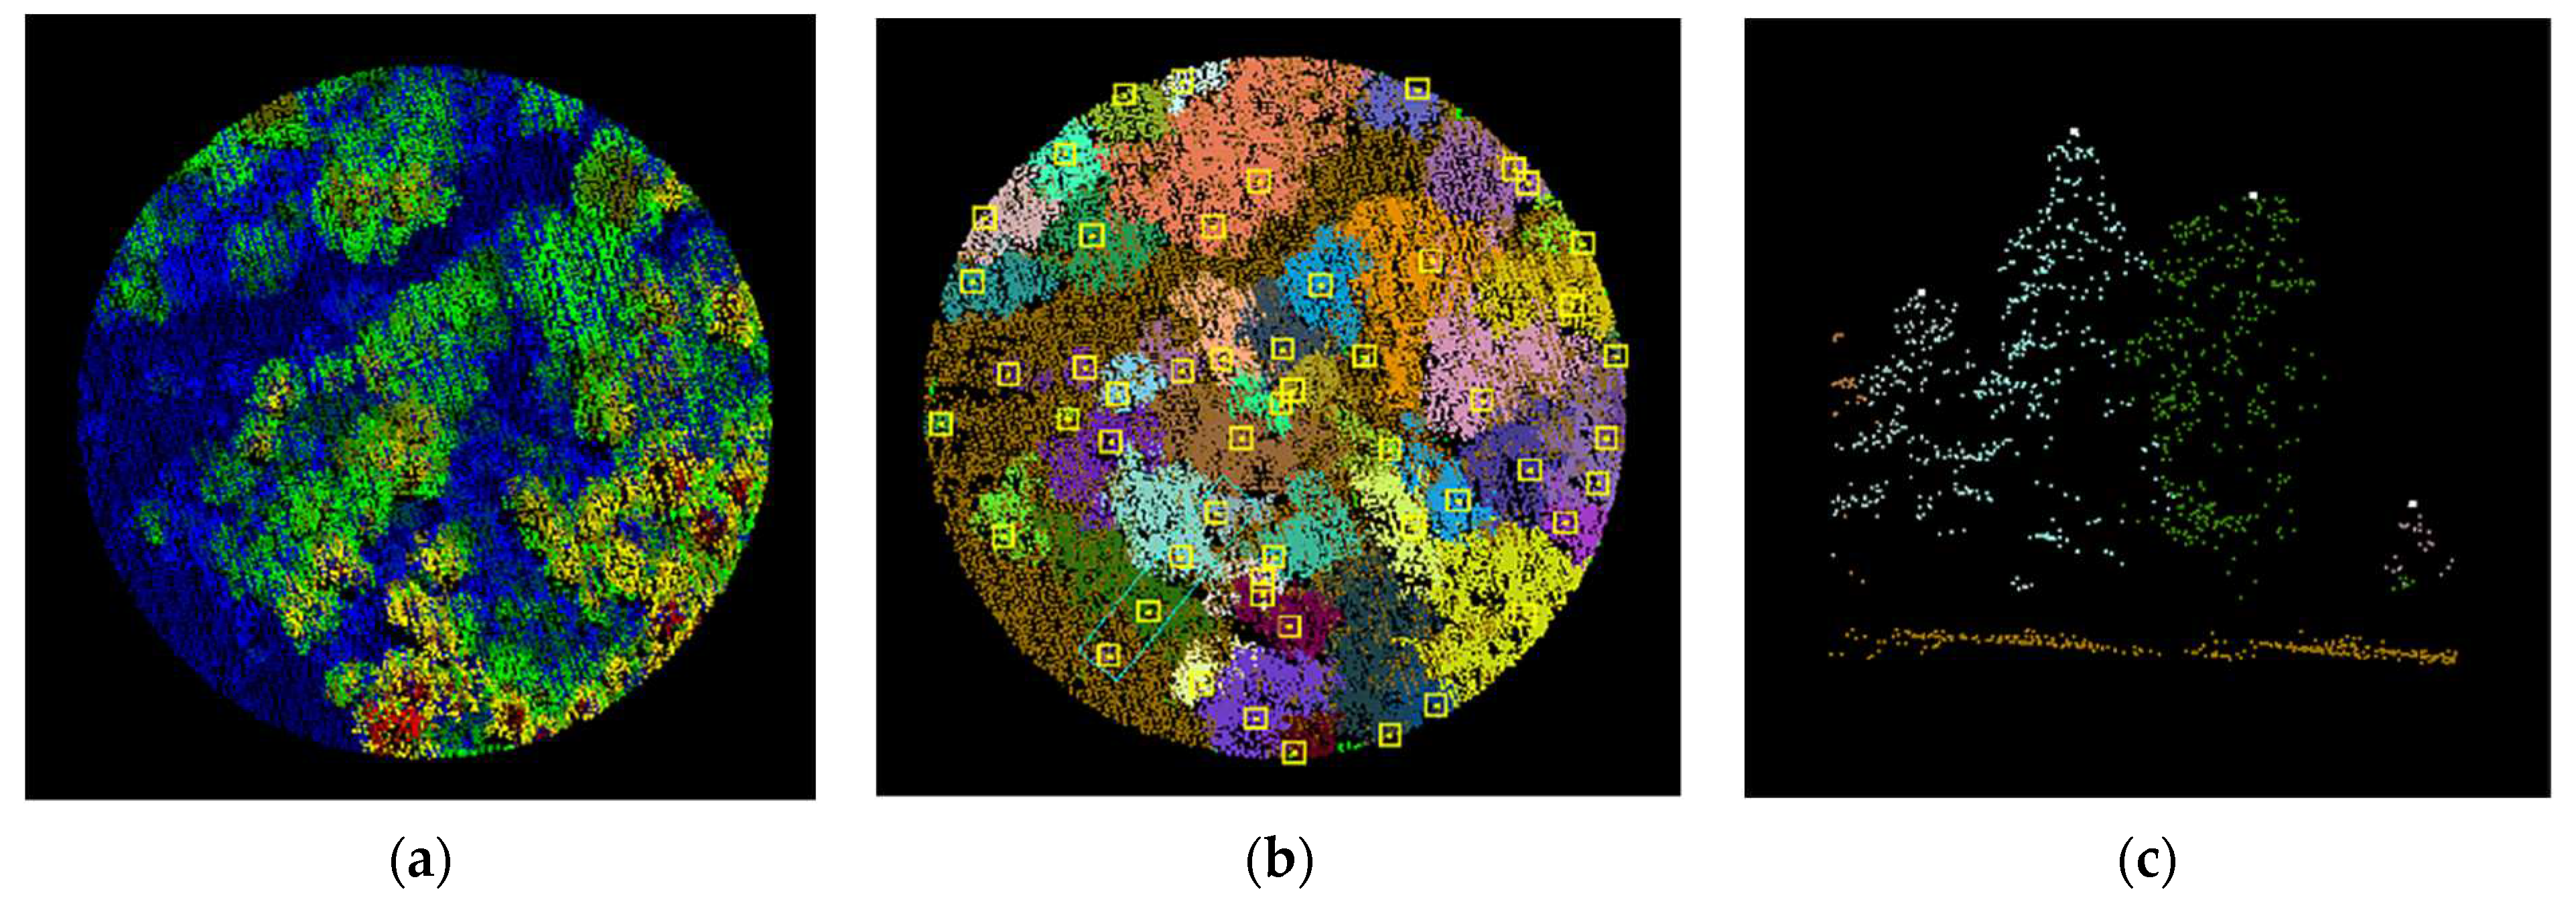
Treetop points location after segmentation. (a) Original point cloud; (b) Segmented point cloud; (a) A partial profile of (b). The treetop points are shown in rectangles or circles in (b) and (c).
Figure 8.
Treetop points location after segmentation. (a) Original point cloud; (b) Segmented point cloud; (a) A partial profile of (b). The treetop points are shown in rectangles or circles in (b) and (c).
2.2.3. Plots Matching Based on Dominant Trees
The spatial accuracy of measured data is limited by the measurement environment, while point clouds are more accurate (see Table 2 for accuracy). The measured data and point cloud data do not match in spatial position, so plot matching is required to register the measured data to the point cloud data, achieving spatial consistency between the two data sets before further operations can be carried out.
The concept of matching degree R is proposed for plots matching: Δh is the difference between the measured tree height and the point cloud height. When the absolute value of Δh is less than the threshold DT, the position of the sample tree is considered correct. The matching degree of the plot is defined as the ratio of the number of trees that satisfy Δh < DT to the total number. When the matching degree of the plot is greater than 90%, the spatial position of the site can be considered accurate.
where R: the matching degree
N: the number of trees in the plot
n: The number of trees in the plot that satisfy Δh < DT
When the matching degree does not meet the requirement, it is necessary to perform plots matching based on dominant trees. Dominant trees in forestry refer to the largest trees in terms of diameter, tree height, tree canopy height, occupying the largest space, receiving the most sunlight and experiencing almost no compression. Based on the positive correlation between tree height, diameter and tree canopy height, we define the top 10% of tree heights (or 5% when there are many trees) in the plot as dominant trees. Using the position information of dominant trees, a translation and rotation coordinate transformation matrix is established between the plot and the LiDAR point cloud data. The plot is rotated and translated so that the position of the dominant trees in the plot matches that of the segmented point cloud, and plot attributes are updated when the matching degree exceeds 90%.
In fact, the positions of the dominant trees in measured data and the segmented point cloud cannot achieve complete consistency. This is because of the presence of inclines and tree canopies, which make the treetop position not fully represent the tree center. Therefore, deviation value D (Equation 3) is proposed to quantitatively reflect the deviation between the positions of the dominant trees in the measured data and the segmented point cloud. It is required that the matching degree R is greater than 90%, and the deviation value D is also smaller than the set threshold. At this point, the matching of the two data sets is considered complete, and can be used for subsequent parameter extraction.
where D: deviation value
n: the number of the dominant trees in the plot
Δdi: deviation of the position of the ith dominant tree in measured data and point cloud. (1 ≤ i ≤ n)
Figure 9.
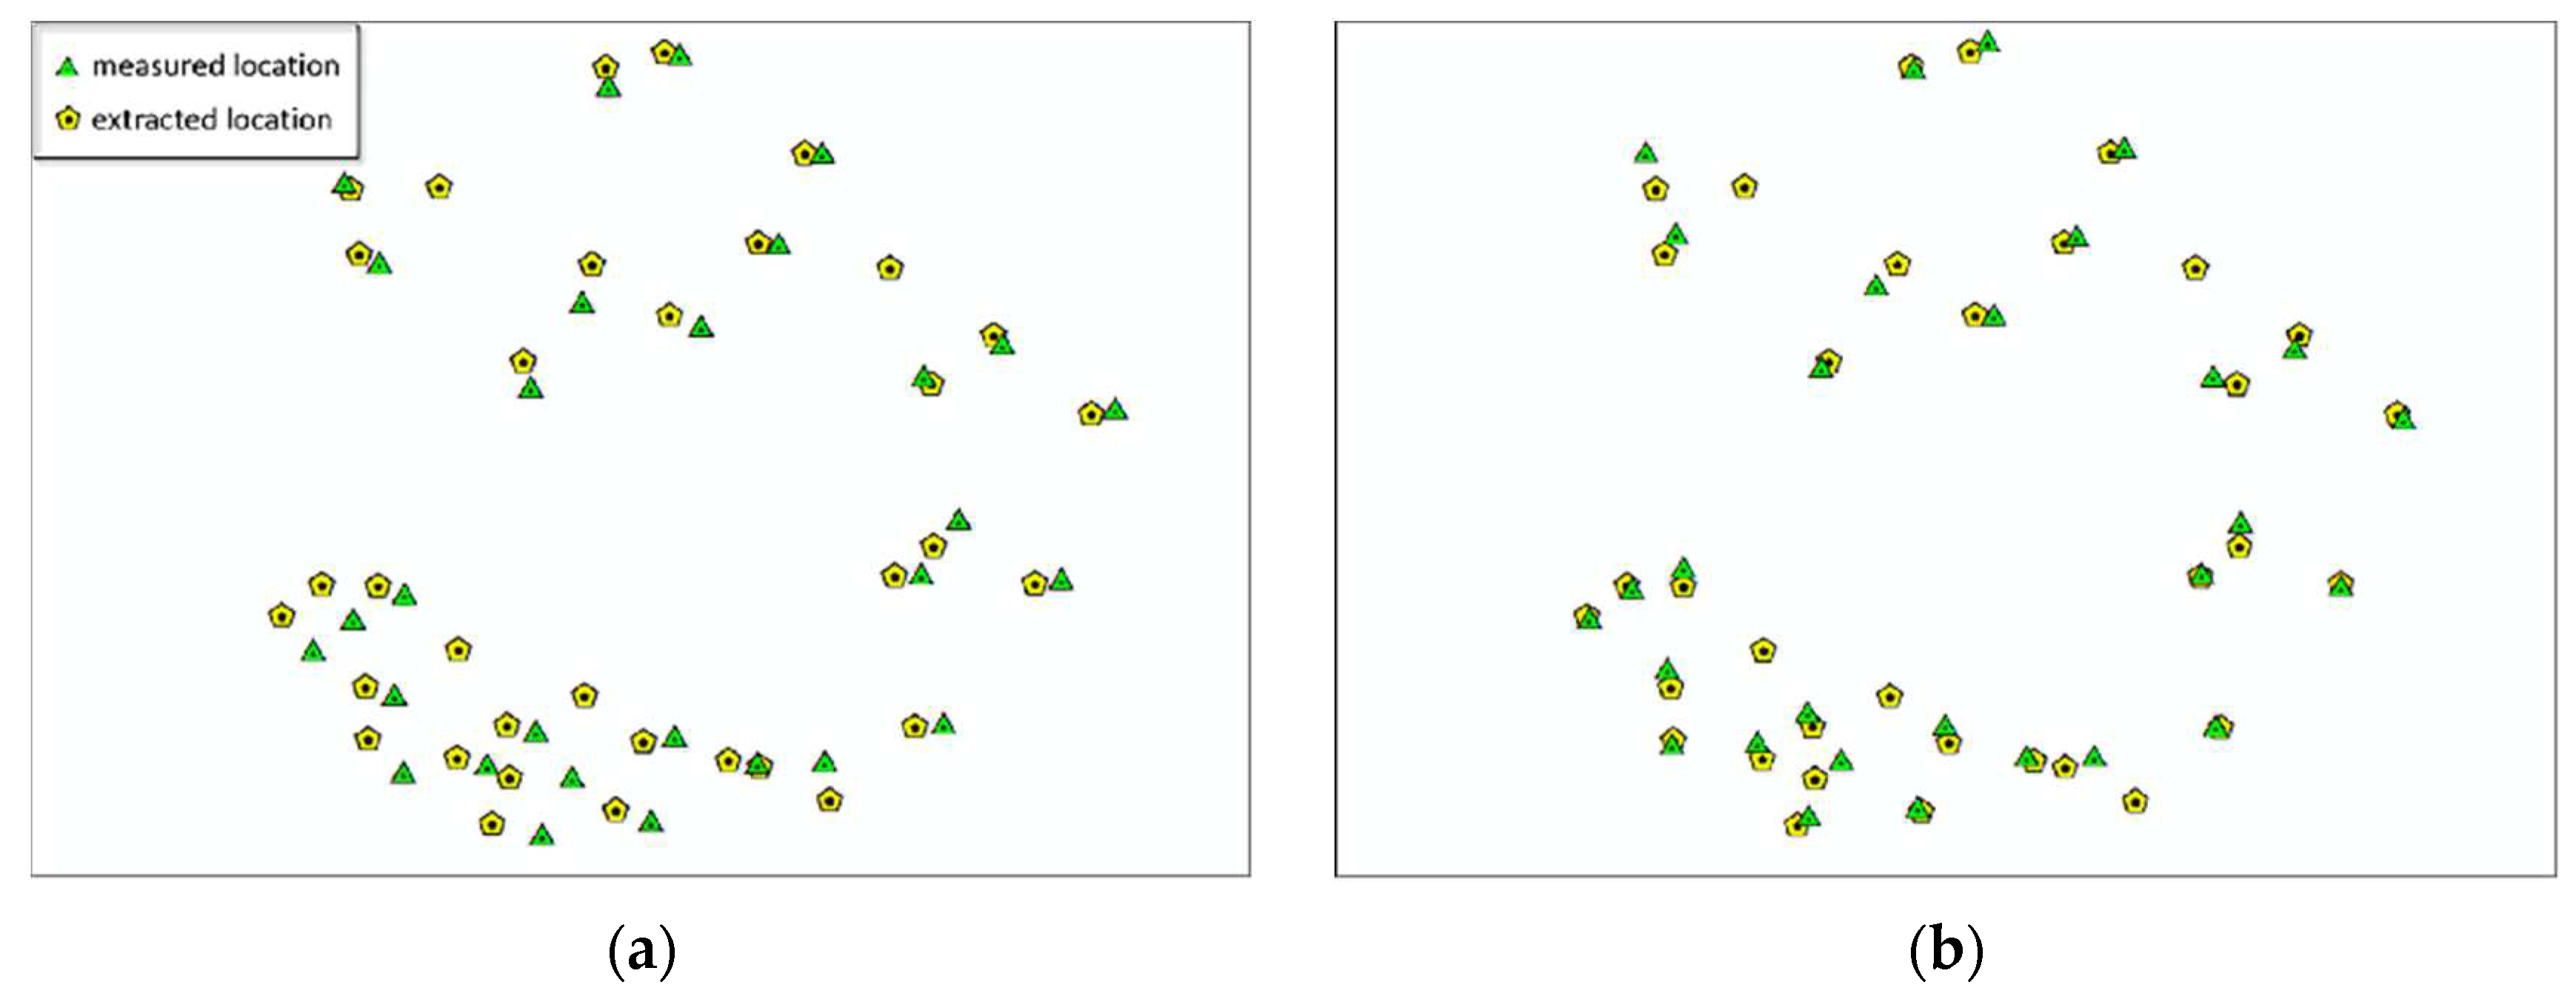
Plots matching based on dominant trees. (a) Locations of the measured trees and extracted trees (from segmented point cloud) before matching; (b) Locations after matching.
Figure 9.
Plots matching based on dominant trees. (a) Locations of the measured trees and extracted trees (from segmented point cloud) before matching; (b) Locations after matching.
2.2.4. Tree Species Identification and Verification
Traditional field surveys are currently the most reliable way to obtain tree species information. However, errors in tree species identification and recording are inevitable. Nonetheless, the majority of tree species information obtained through field surveys is correct. Therefore, this paper utilizes correct tree species information obtained from field surveys to automatically identify and verify tree species information in the sample plots.
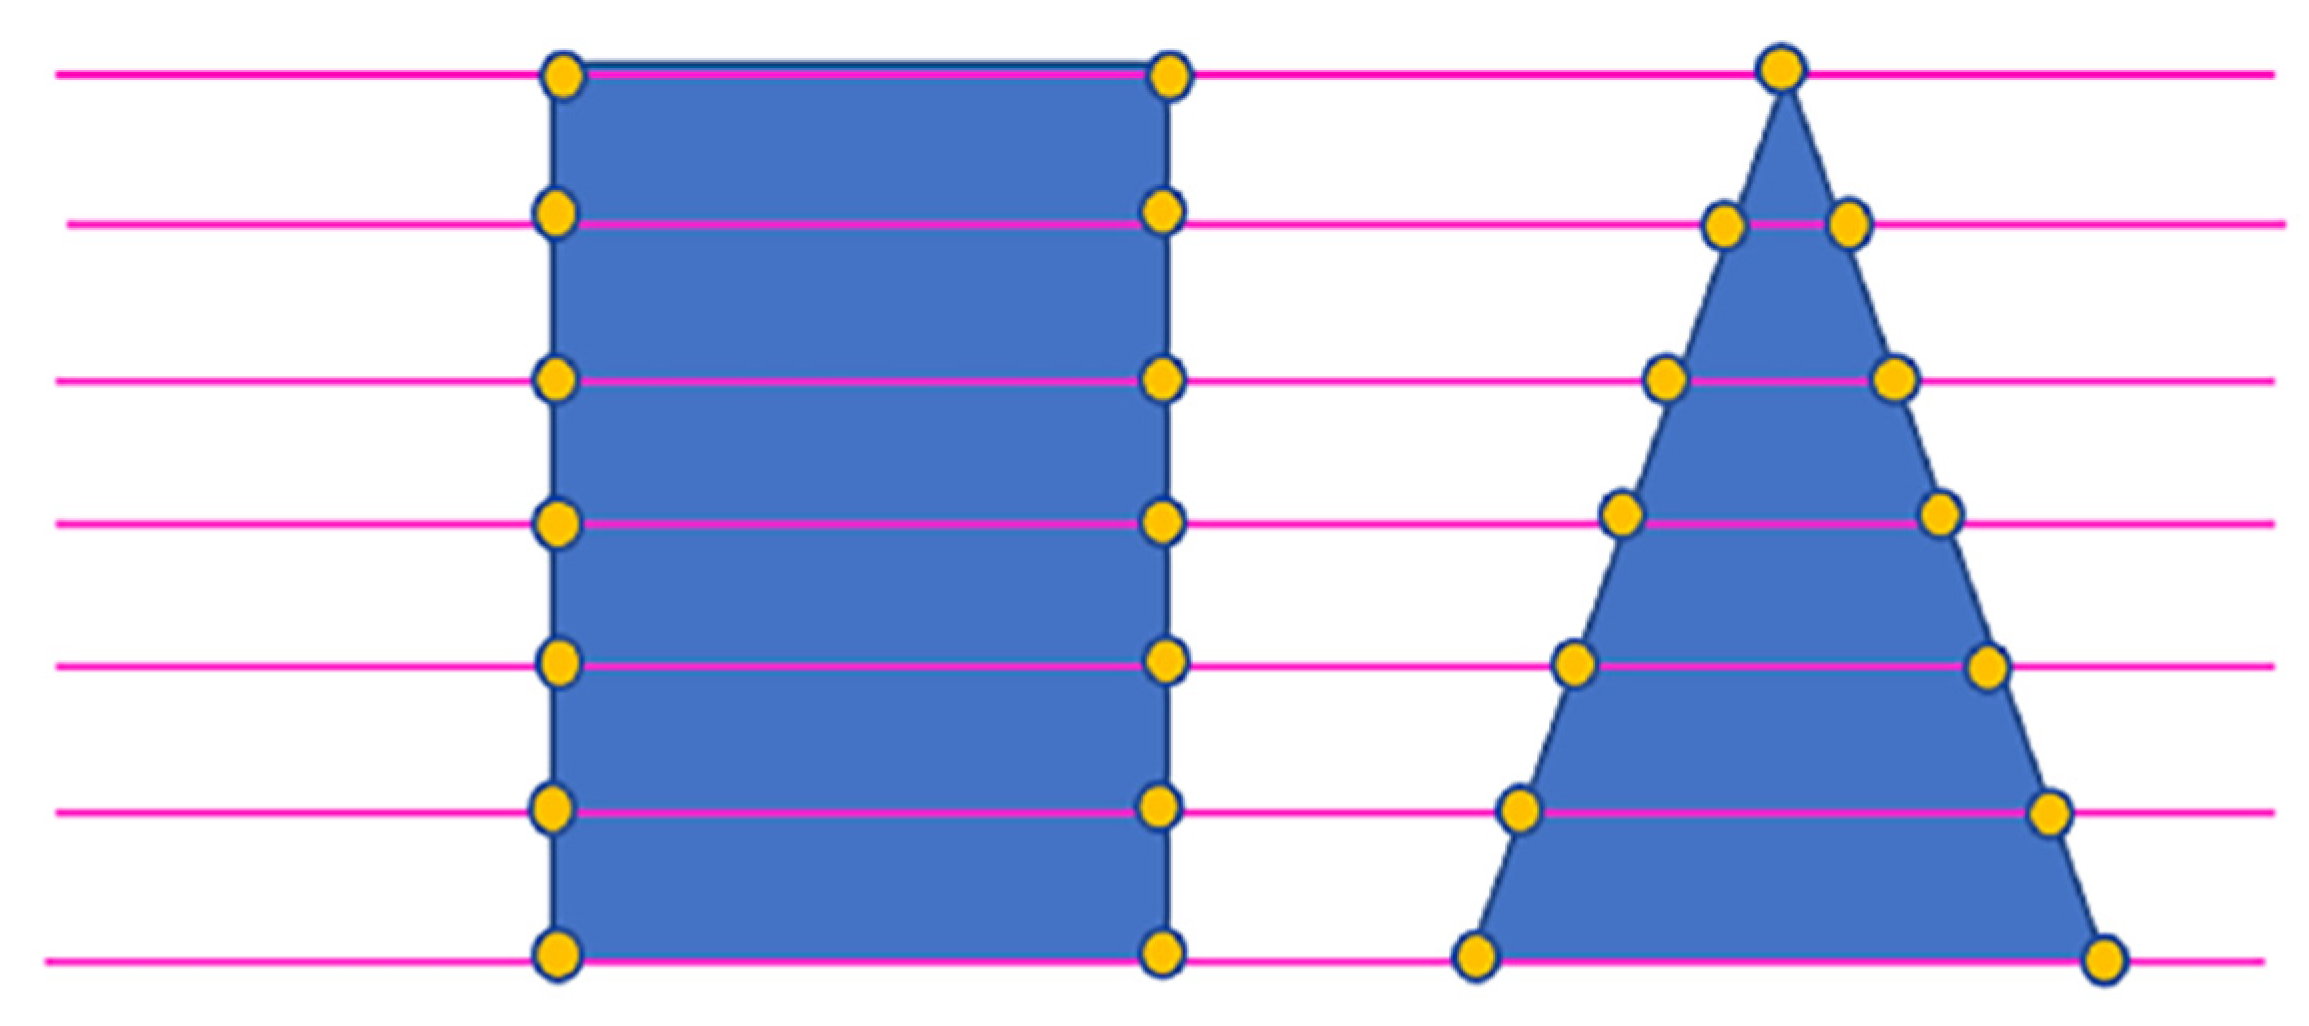
Currently, many scholars use the combination of canopy point cloud and spectral information to achieve tree species identification [45, 46]. However, the spectral information of a certain tree species changes with season, time, and leaf age. Therefore, in addition to deformation caused by occasional lightning strikes or rock invasion, the geometric shape of the tree canopy is the more reliable information for tree species identification. Different tree species often have different tree canopy shapes, as shown in Figure 10. In this paper, we sampled the canopy width of typical species according to height to represent the geometric shape of the canopy profile. The obtained width set is used as a sample to train the DBN classifier, and the specific details are as follows:
- (1)
- Extraction of key points based on parallel lines
For a given set of segmented tree points of a single tree, draw a vertical line L from the treetop to the ground. Choose several profiles with a certain width DW centered on the treetop and use the selection criterion that they should not be connected to other tree canopies. The size of DW is related to the average point distance dis of the point cloud, generally set as DW = 2dis. On a profile, draw parallel lines along L with a certain spacing Δd to obtain the positions of endpoints within the parallel lines space. After all parallel lines are scanned all endpoints can be defined as key points of the canopy under the profile.
Figure 11.
Different profiles of the segmented point cloud from a single tree.
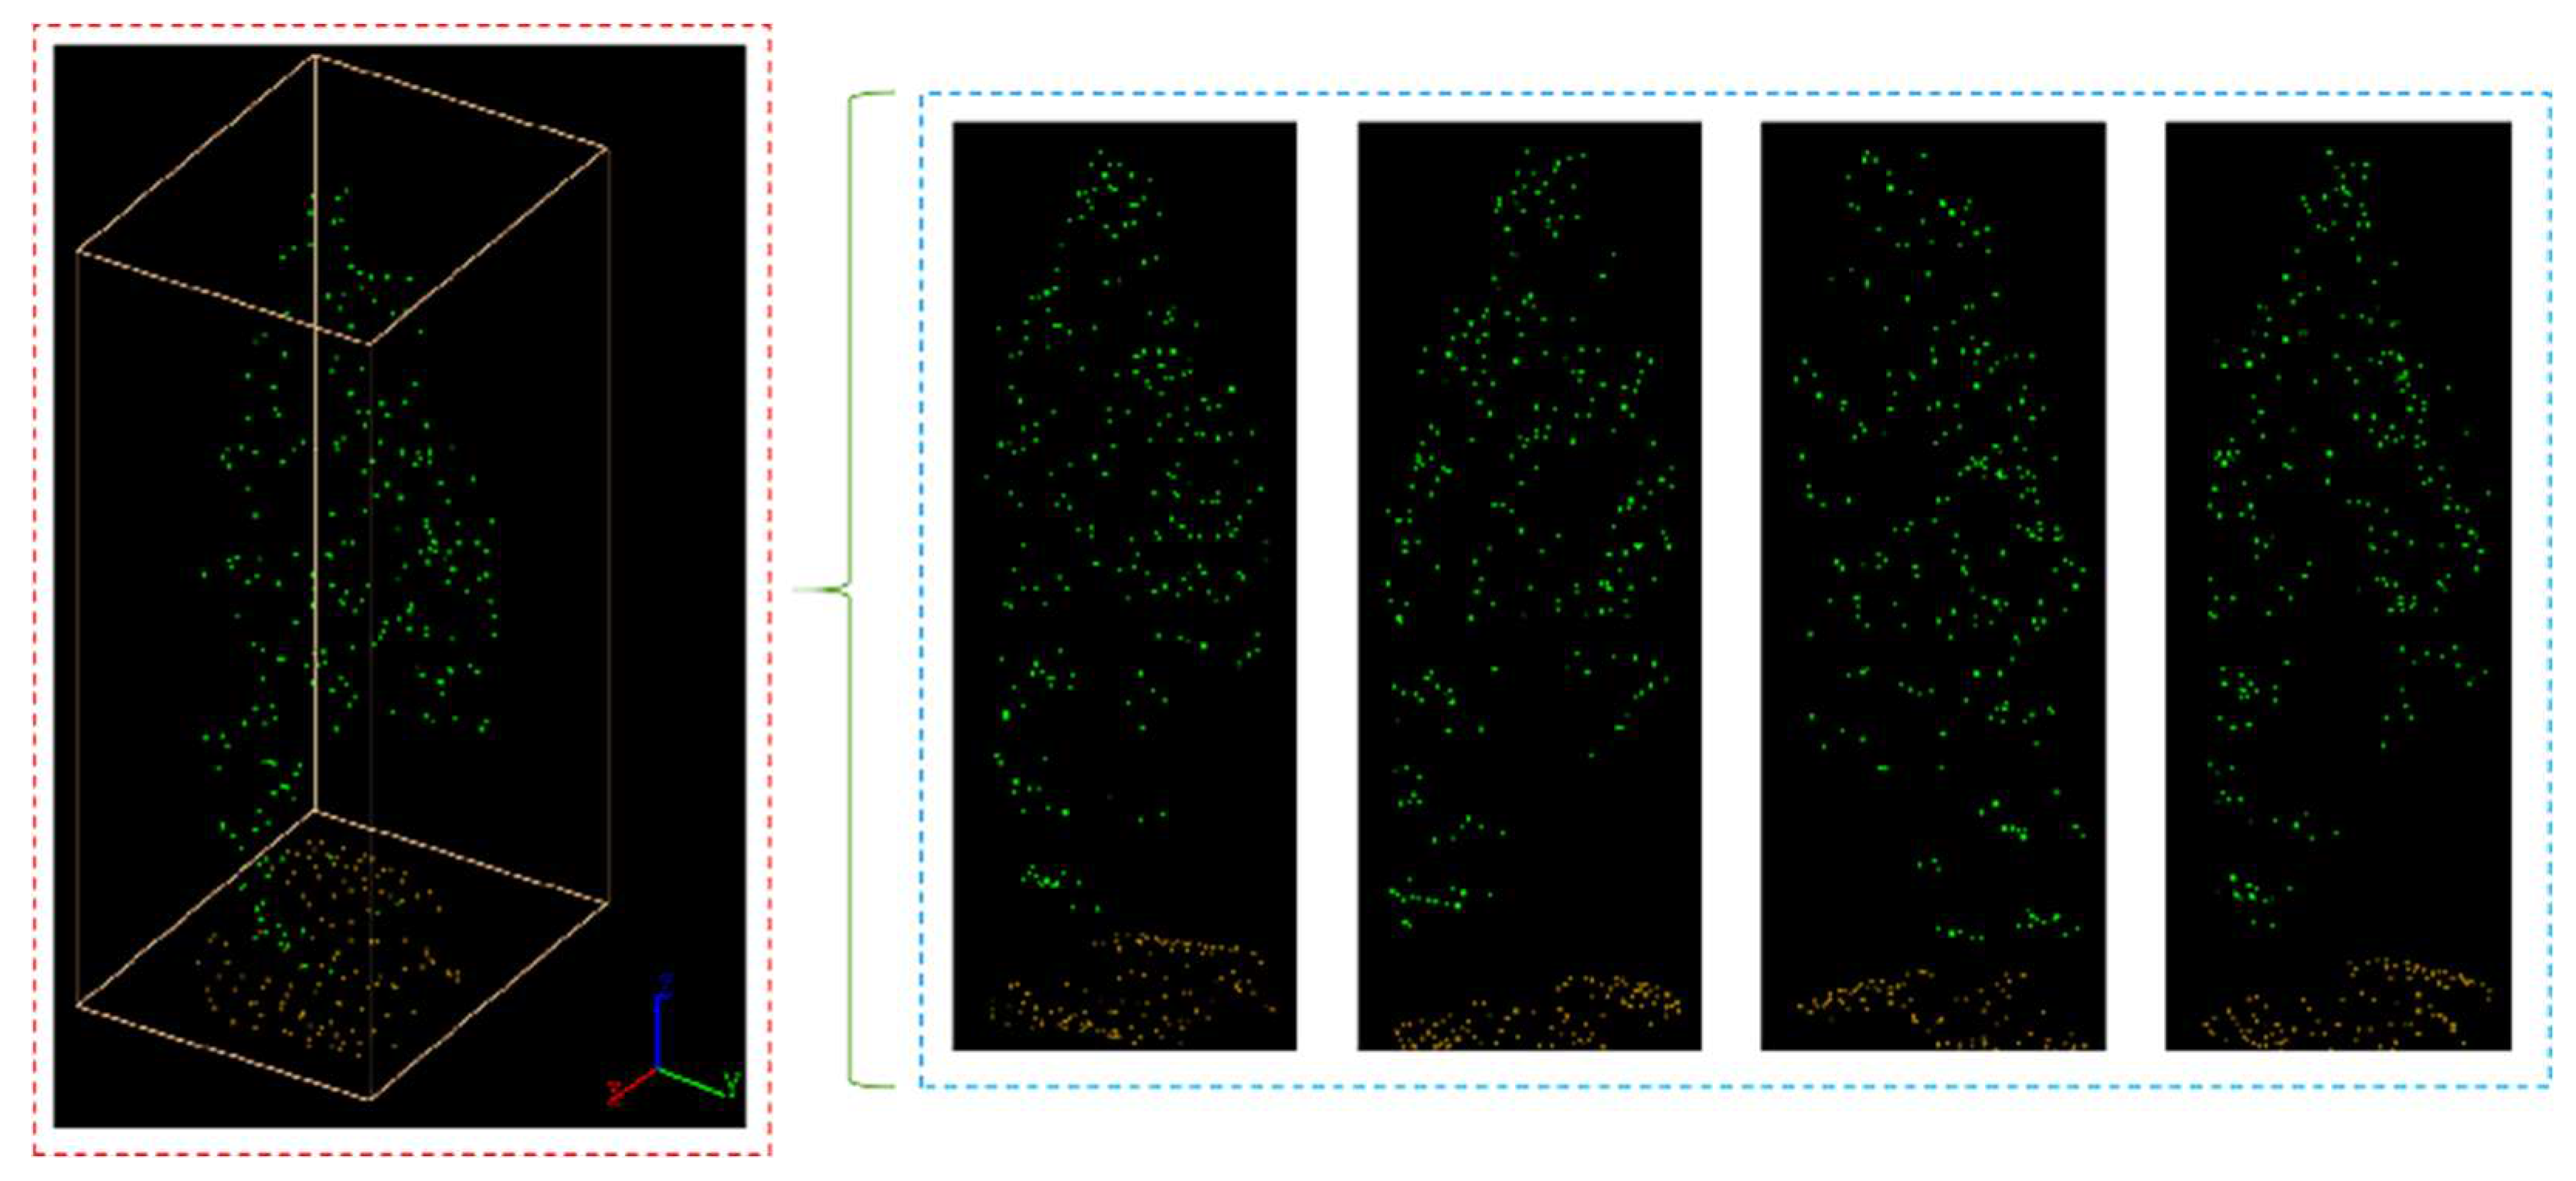
Figure 12.
Extraction of key points based on parallel lines. The yellow points are the key points.
- (2)
- Extraction of geometric morphological features of canopy profiles
Connect key points on the same parallel lines, record the position li and length gi of obtained intersection (1 ≤ i ≤ n, the number of the lines is n+1). The intersection positions and lengths obtained from parallel lines can summarize the shape of the tree canopy, but the number of intersection lines for each tree may not be the same due to the influence of tree height. Due to the limitation of point cloud density, the length accuracy is reduced when the same number of intersection lines are forced to be intercepted for each tree. To facilitate the subsequent training of the DBN, the cubic spline interpolation method is used to interpolate the number of intersection lines for each tree to be consistent. The cubic spline interpolation method is highly accurate and can avoid the Runge phenomenon, which causes violent oscillations in the interpolation function curve during polynomial interpolation.
S(l) is set as the interpolation function. Each small interval of S(l) is a cubic function, as shown in Equation 4 and Equation 5:
The function S(l) should satisfy the value of gi at node li, as shown in Equation 6:
At all nodes (except the first node and last node), the first-order derivative and second-order derivative are continuous, ensuring the same slope and degree of curvature at the nodes, as shown in Equation 7:
The natural spline condition: the second derivative of the first node and last node is 0, allowing the slope of the endpoints to remain balanced at a certain position and minimizing the oscillation of the interpolation function curve. Equation 8:
Based on Equations 6, 7, and 8, the coefficients ai, bi, ci and di in Equation 5 can be solved to determine the interpolation function S(l). Then, by reselecting appropriate positions l’i and substituting them into S(l), the corresponding intersection lengths g’i can be obtained. This process yields a set of lengths with equal dimensions for each profile, which can be used as a feature vector to describe the geometric characteristics of the profile.
- (3)
- Learning and updating of tree species by DBN
Deep belief network (DBN) [47] is chosen for learning and updating of tree species. Compared to most other deep learning models, DBN is more thoroughly trained on data, achieving better convergence in small-scale samples and making it more applicable in forest environments with limited sample sizes.
The DBN is formed by stacking multiple Restricted Boltzmann Machines (RBMs), whose structure is shown in Figure 13. The RBM consists of two layers: a hidden layer and a visible layer. When stacking RBMs to form a deep learning network, the output layer (hidden layer) of the previous RBM serves as the input layer (visible layer) of the next RBM, and so on. Finally, an output layer is added to form the basic structure of the DBN.
RBM is a fully connected layer with no connections within each layer, meaning that neurons in the same layer are independent of each other. Set as the network input; the neuron likelihood functions of the visible and hidden layer can be expressed as follows:
where , is the visible layer input vector
, is the hidden layer input vector
M and N are the number of neurons in the visible and hidden layers, respectively
The energy function between the visible layer and the hidden layer is defined as follow:
where : weight between ith visible layer neuron and jth hidden layer neuron
: bias of ith visible layer neuron
: bias of jth hidden layer neuron
, are the network parameters, obtained by training
The activation functions of visible layer and hidden layer neurons are:
The DBN is formed by stacking multiple RBMs, and Figure 14 shows the DBN structure. During the training process, the previous layer’s RBM is fully trained before the current layer’s RBM is trained, repeating until the final layer where a Softmax classifier is added to form a complete DBN structure.
In this study, the set of interpolated cubic spline intersection lengths g’i are used as input, while the corresponding tree species are used as the target output to train the DBN to achieve the profile-based tree species identification. According to the experiment, this study uses a DBN with three layers of RBMs for the identification, which shows the fastest convergence speed and the highest accuracy among all models tested.
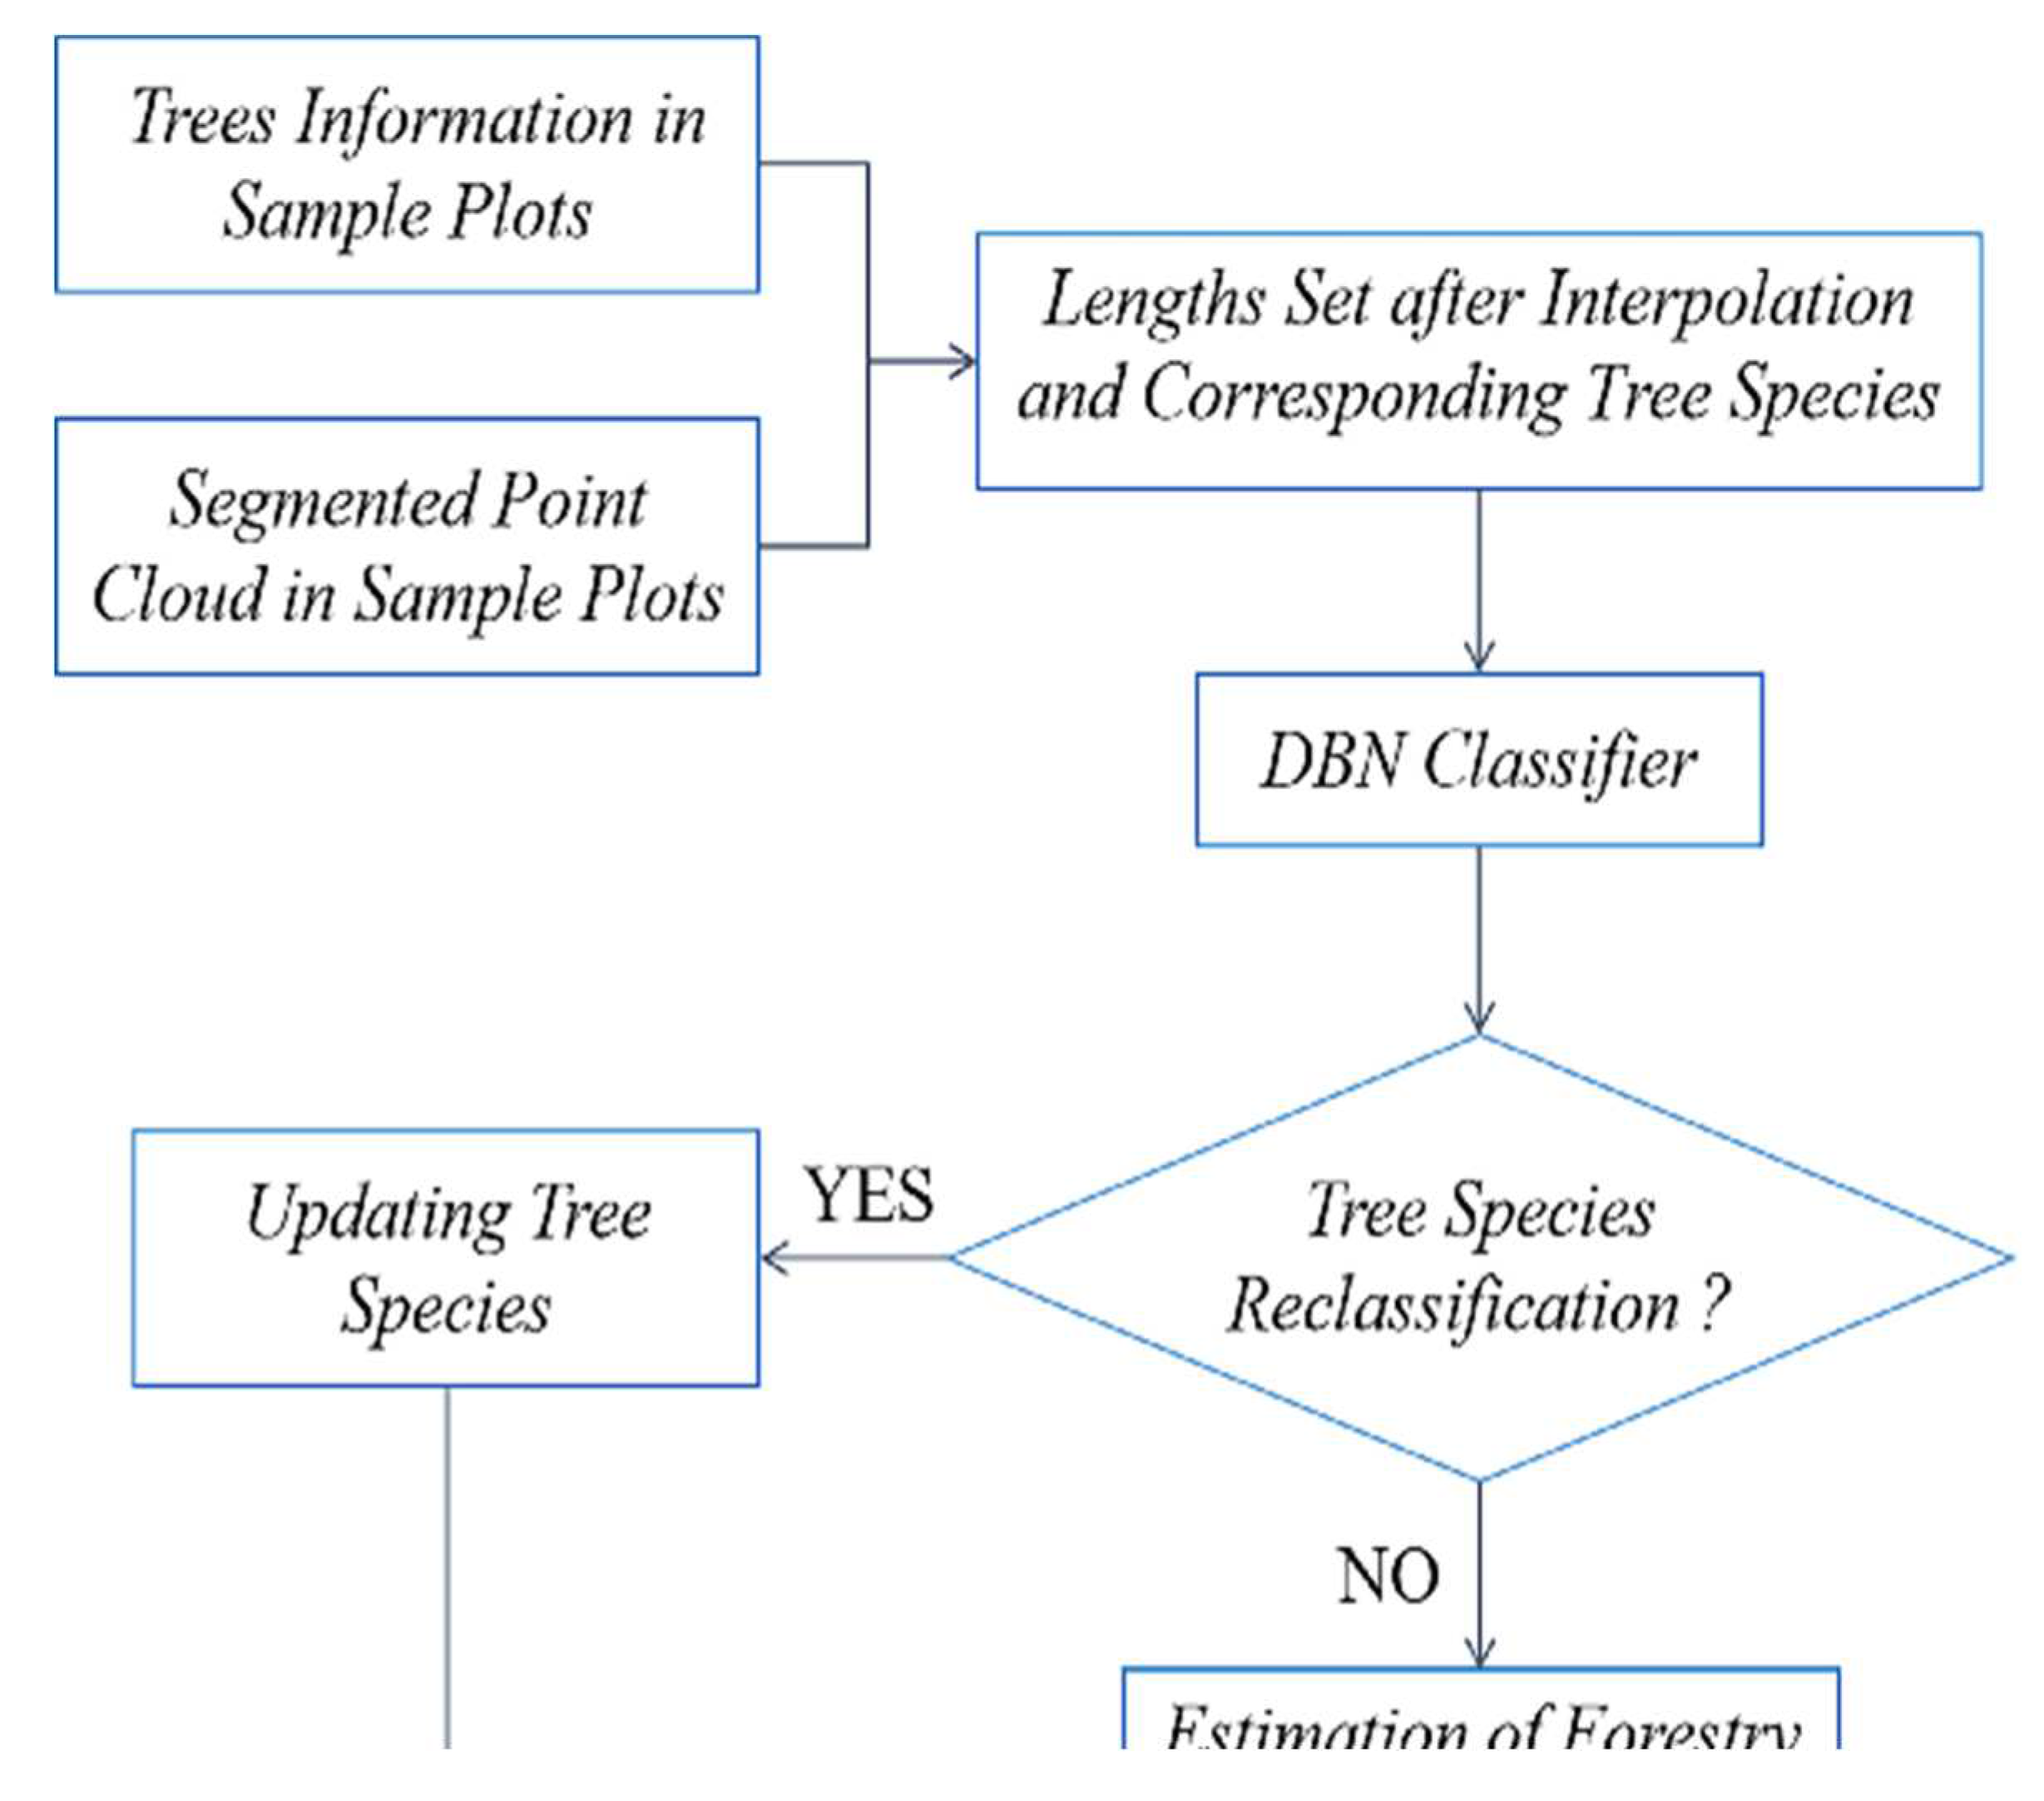
Figure 15.
Tree species information extraction and checking process.
2.2.5. Forestry Parameters Extraction
The segmented point cloud reflects the structure of individual tree canopies, and some forestry parameters are directly reflected in it. For example, the elevation of the treetop point can be used as the tree height. East-west canopy width can be obtained based on the maximum distance in the east-west direction of the canopy point set of an individual tree and the north-south canopy width can be obtained similarly. Some parameters may not be directly obtained, but they can be indirectly calculated through estimating equations using known tree species, tree height, canopy width and other information extracted from the segmented point cloud as parameters. The methods for obtaining forestry parameters and estimating equation factors are shown in Table 3.
DBH refers to the diameter of a tree trunk at a height of 130cm above the ground, and can be estimated by inputting the tree height into the model. Forest biomass is the energy foundation and material source of the forest ecosystem; it is divided into AGB and BGB, usually expressed in terms of dry matter or energy accumulation per unit area or unit time. AGB can be estimated from tree height and DBH. The stock volume is the total volume of living matter of a tree, expressed in cubic meters, and it can be estimated from the DBH. The estimation equations for forest parameters are closely related to tree species, and the models for different tree species are not universal. After tree species identification and updates the tree species information can be considered accurate and applied to the estimation of forestry parameters.
The estimation factor of the DBH estimation model is the tree height (H, in m), and the output is the DBH (D, in cm). The specific equations and application conditions are shown in Table 4.
The factors of the AGB models are tree height (H, in m) and DBH (D, in cm), and the output is AGB (M, in t/ha). The specific equations are shown in Table 5.
The same type of equation is used for the calculation of the stock volume of different tree species.
where V: stock volume, in m3
D: DBH, in cm
The rest of the parameters are shown in the Table 6.
3. Results
Eight sample plots, totaling 318 trees, were chosen from the Northeast Tiger and Leopard National Park to test the plot verification and update method proposed in this paper. The accuracy of the results from the LiDAR data is compared using the outfield-confirmed data.
3.1. Ground Point Extraction
This article uses a PTD algorithm to separate ground points and non-ground points in point cloud data. The eight plots used in this study have diverse terrain conditions, including flat areas, slopes and other situations. To evaluate the accuracy, the following indicators are used:
Separation accuracy: the ratio of correctly classified points to the total number of points in plot;
Type I error: non-ground points classified as ground points after separation;
Type II error: ground points classified as non-ground points after separation.
The ground point separation accuracy of the eight study plots is shown in Table 7.
As shown in Table 7, the separation accuracy for each plot is above 95%, indicating that the PTD algorithm has achieved excellent results, and is suitable for various ground conditions. Considering the high separation accuracy, the separated ground points can be used for DEM generation to achieve normalization of point cloud data.
3.2. Tree Segmentation
By setting the grid size d, the initial position of trees can be obtained. Using rotating profiles with an angular step of θ, segmented canopies can be generated while optimizing the tree positions. The initial positions are the basis for subsequent treetop points acquisition and final segmentation. Therefore, in order to obtain more accurate initial positions, it is necessary to set a more appropriate grid size. The setting of d is based on the size of the tree canopy in the sample plots, which is concentrated in the range of 2-4 meters in diameter. The value of d should be close to the radius of the tree canopy to ensure that the positions of the trees can be identified to the greatest extent possible. In the experiment, d is set to 1m, 1.5m and 2m to segment the eight sample plots.
Figure 16.
The number of trees segmented from each sample plot.
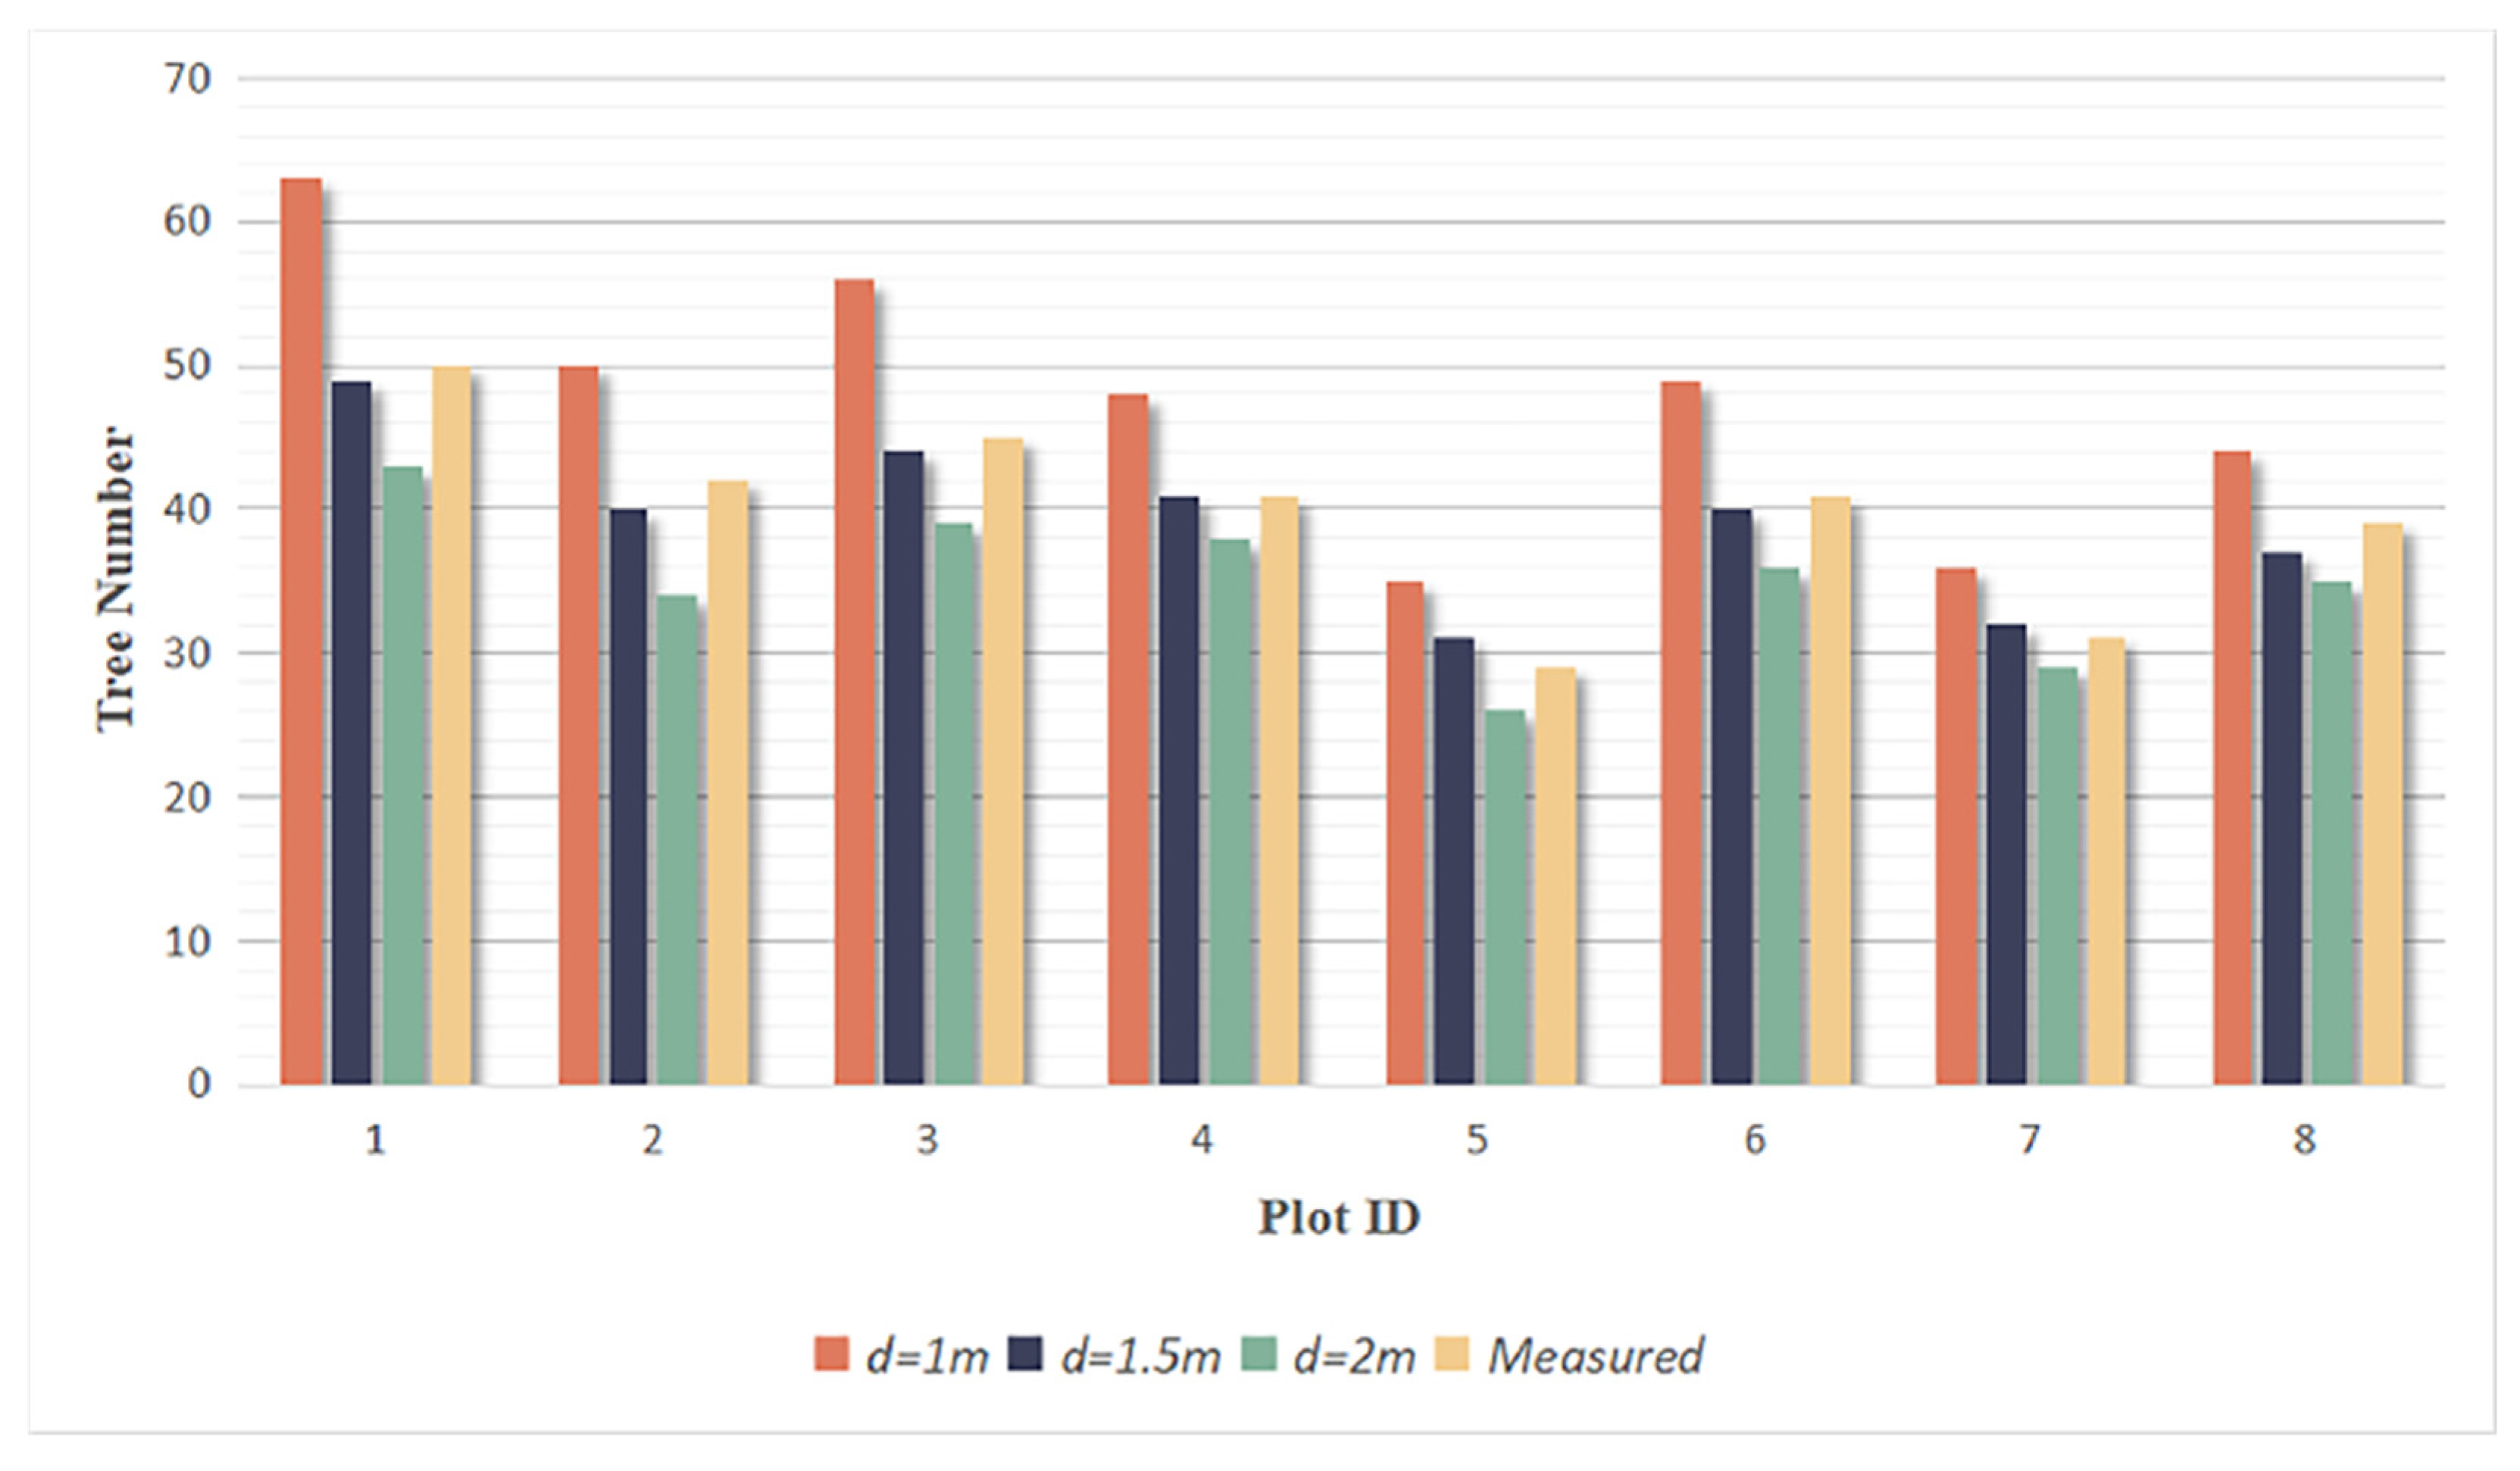
Due to the complexity of natural forest conditions, overlapping canopies can cause short trees to be mistaken as parts of tall trees, resulting in multiple trees being recognized as one tree. Additionally, some trees are divided into multiple trees because of their large canopy or complex shape. These discrepancies cause under-segmentation and over-segmentation in the segmentation results. To evaluate the correct segmentation, under-segmentation and over-segmentation of each plot under different grid sizes d, recall, precision and F-score [48] are used as indicators to verify and evaluate the accuracy of individual tree segmentation (Equations 16, 17 & 18). The results are shown in Table 8.
where r, p& F: recall, precision and F-score
TP: number of correctly segmented trees
FN: number of under-segmented trees
FP: number of over-segmented trees
Table 8.
The TP, FN and FP of different grid sizes d.
| Plot ID |
Real Number |
d= 1 m | d= 1.5 m | d= 2 m | ||||||
| TP | FN | FP | TP | FN | FP | TP | FN | FP | ||
| 1 | 50 | 49 | 1 | 14 | 47 | 3 | 2 | 42 | 8 | 1 |
| 2 | 42 | 41 | 1 | 9 | 40 | 2 | 0 | 34 | 8 | 0 |
| 3 | 45 | 45 | 0 | 11 | 44 | 1 | 0 | 39 | 6 | 0 |
| 4 | 41 | 41 | 0 | 7 | 40 | 1 | 1 | 37 | 4 | 1 |
| 5 | 29 | 29 | 0 | 6 | 29 | 0 | 2 | 25 | 4 | 1 |
| 6 | 41 | 41 | 0 | 8 | 40 | 1 | 0 | 36 | 5 | 0 |
| 7 | 31 | 31 | 0 | 5 | 31 | 0 | 1 | 29 | 2 | 0 |
| 8 | 39 | 39 | 0 | 5 | 37 | 2 | 0 | 35 | 4 | 0 |
| All | 318 | 316 | 2 | 65 | 308 | 10 | 6 | 277 | 41 | 3 |
Among the three selected grid sizes, when d=1.5m, the total number of under-segmented and over-segmented trees is the lowest. The number of correctly segmented trees is similar to the actual number of trees in each plot, with a total of 308 correctly segmented trees, which was close to the total actual number of 318 trees. The recall, precision and F-score are calculated in Table 9, and the F-scores for all eight plots exceed 0.95 when d=1.5m, with the highest overall F-score of 0.976 in three grid sizes, indicating that the rotational profile algorithm achieves good segmentation results. Therefore, the part of the correctly segmented trees with d=1.5m was selected for subsequent species identification and parameters extraction.
Figure 17.
Segmented point cloud of each plot.
3.3. Plots Matching and Tree Species Identification
The main purpose of plot matching is to solve the problem of positional differences between measured data and point cloud. To this end, this paper proposes the concept of matching degree and uses dominant trees for plot matching. However, due to the complexity of the actual situation, it is difficult to achieve complete consistency between the two datasets. Therefore, the deviation of the position of each tree is statistically collected and the deviation values are calculated, as shown in Table 10. Plot matching is considered complete when the matching degrees of the eight plots are greater than 90% and the deviation values are less than the threshold of 8m.
Based on the plots matching, accurate tree positions can be obtained. In forest surveys, the trees species information in sample plots is mostly accurate. This paper utilizes species information from sample plots to identify and extract individual erroneous tree species information, thereby providing correct species information for obtaining accurate forestry parameters in subsequent forestry surveys.
This article successfully converts the classification problem of 3D point clouds into 1D feature vector classification. It also effectively preserves the detailed characteristic information, fully utilizing spatial structural information to summarize the geometric morphology of each tree, thus achieving tree species identification, classification and updating. The main tree species in the plots include pine, oak, birch, elm, poplar, maple and other species. Several typical profiles are selected as training samples to obtain the morphological structure and parameters of each species. Table 10 shows that when the sample size of a certain tree species is insufficient, more data can be obtained by selecting profiles in multiple directions.
The trained model is applied to achieve classification. To evaluate the classification performance, the correct rate is defined as the ratio of the number of successfully classified trees to the number of misclassified trees. The method proposed is used to update the tree species information of the trees in eight plots, and the results are shown in Table 11. Including "Others", which is a collection of trees with extremely low numbers, the overall correct rate reaches 90.9%, providing a reliable tree species classification method and model for forest surveys.
The details are listed in the form of a confusion matrix in Table 13, which can more accurately indicate the error correction information for each tree species.
Table 12 and Table 13 show that most tree species can be corrected with 100% accuracy, and the few misclassified tree species are due to different degrees of damage to the tree canopy or inaccurate profile structural information caused by being close to adjacent trees during segmentation. Overall, using LiDAR data to correct tree species information is a reliable method with high accuracy, suitable for classifying most normally growing tree species.
Table 12.
Accuracy of the tree identification.
| Tree Species | Correct Classification | Type Ⅰ Error 1 | Type Ⅱ Error 2 | Corrected Tree Number | Correct Rate | Overall Correct Rate |
|---|---|---|---|---|---|---|
| Pine | 39 | 1 | 2 | 3 | 100% | 90.9% |
| Oak | 25 | 0 | 2 | 2 | 100% | |
| Birch | 14 | 0 | 1 | 1 | 100% | |
| Elm | 17 | 2 | 1 | 3 | 100% | |
| Linden | 107 | 7 | 0 | 6 | 85.7% | |
| Poplar | 18 | 1 | 1 | 2 | 100% | |
| Maple | 45 | 0 | 3 | 2 | 66.7% | |
| Others | 32 | 0 | 1 | 1 | 100% |
1 Type I Error: record a tree belonging to the correct tree species as another species; 2 Type II Error: record a tree belonging to another species as the current tree species.
Table 13.
Confusion matrix of tree species misinformation correction.
| Collected | Pine | Oak | Birch | Elm | Linden | Polar | Maple | Others | CR 1 | |
| True | ||||||||||
| Pine | 39 | 0 | 0 | 1 | 0 | 0 | 0 | 0 | 100% | |
| Oak | 0 | 25 | 0 | 0 | 0 | 0 | 0 | 0 | 100% | |
| Birch | 0 | 0 | 14 | 0 | 0 | 0 | 0 | 0 | 100% | |
| Elm | 1 | 0 | 0 | 17 | 0 | 0 | 1 | 0 | 100% | |
| Linden | 1 | 2 | 1 | 0 | 107 | 1 | 1 | 1 | 87.5% | |
| Poplar | 0 | 0 | 0 | 0 | 0 | 18 | 1 | 0 | 100% | |
| Maple | 0 | 0 | 0 | 0 | 0 | 0 | 45 | 0 | 66.7% | |
| Others | 0 | 0 | 0 | 0 | 0 | 0 | 0 | 32 | 100% | |
1 CR: Correct Rate.
3.4. Forestry Parameters Extraction
After tree species identification and updating, information is taken from the major tree species’ segmented point cloud, and is utilized to estimate forestry parameters. Linear regressions are performed between the measured forestry parameters and the estimated parameters.
Figure 18.
Linear regression plots of six parameters. Red lines are linear regression lines. (a) Tree height; (b) East-west canopy width; (c) North-south canopy width; (d) DBH; (e) AGB; (f) Stock volume.
Figure 18.
Linear regression plots of six parameters. Red lines are linear regression lines. (a) Tree height; (b) East-west canopy width; (c) North-south canopy width; (d) DBH; (e) AGB; (f) Stock volume.
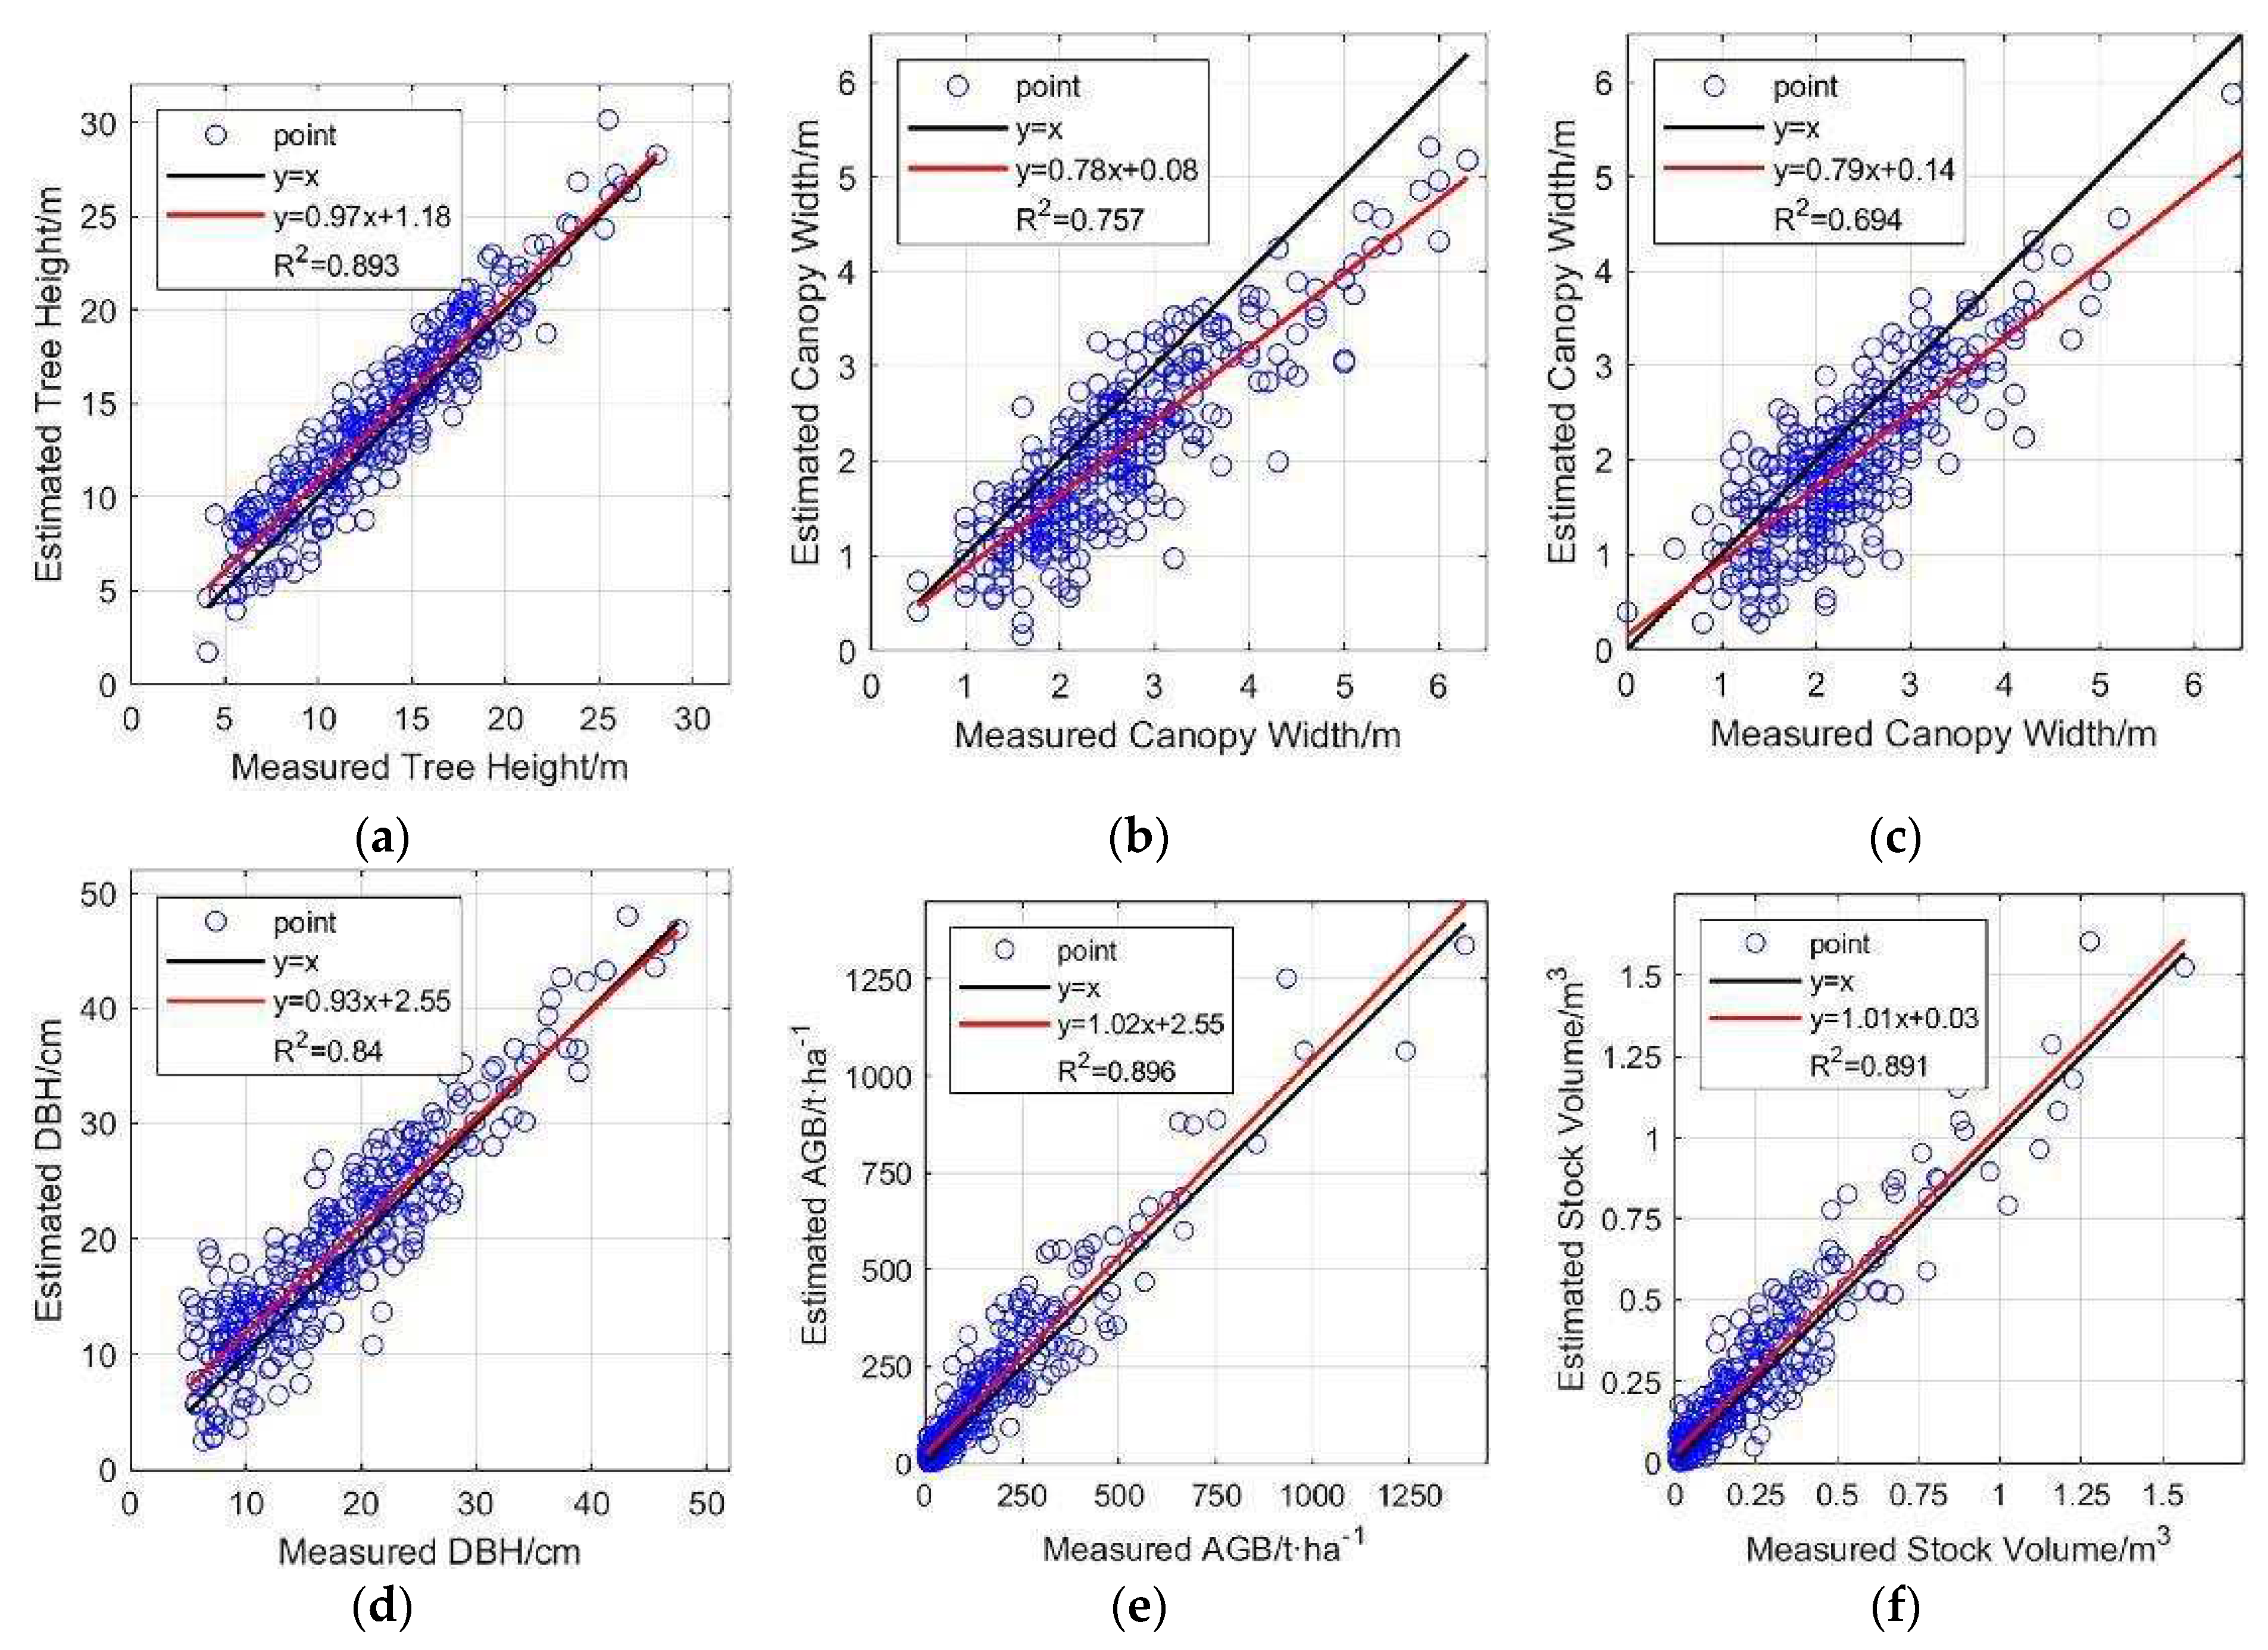
To quantitatively describe the estimation results of each parameter, the coefficient of determination (R2), the mean absolute error (MAE) and the root mean square error (RMSE) are chosen to evaluate the estimation accuracy (Table 14).
where : the measured value. (1 ≤ i ≤ n, n is the number of measured values)
: the estimated value
: average of measured values
Table 14.
Estimation accuracy of forestry parameters.
| Parameters | Tree Height | Canopy Width | DBH | AGB | Stock Volume | |
|---|---|---|---|---|---|---|
| East-West | North-South | |||||
| R2 | 0.893 | 0.757 | 0.694 | 0.840 | 0.896 | 0.891 |
| RMSE | 1.793 | 0.719 | 0.638 | 3.735 | 70.914 | 0.090 |
| MAE | 1.465 | 0.575 | 0.511 | 3.015 | 48.875 | 0.066 |
The estimation results of four forestry parameters, namely, tree height, DBH, AGB, and stock volume, show strong consistency with the measured values, with R2 exceeding 0.8. Tree height shows higher consistency in the range of 20-30 m, and in the range of 5-20 m, the estimated tree heights are slightly higher than the measured heights in general, which was similarly reflected in the estimation of DBH. The accuracy of canopy width estimation is relatively lower (R2=0.757 for east-west and R2=0.694 for north-south), and the estimated values are smaller than the measured values in general. This also confirms that the use of LiDAR data is expected to become a powerful tool for future forestry surveys, significantly reducing human involvement and achieving rapid and accurate acquisition of large-scale forest parameters.
4. Discussion
4.1. Tree Segmentation
Among the three tested grid sizes d, the best segmentation performance is achieved when d=1.5m, with precision, recall and F-score of 0.969, 0.981 and 0.975, respectively.
The eight sample plots utilized in this paper are situated in the natural forest of northeast China, characterized by complex and diverse tree growth. Processing point cloud data directly provides a better representation of the 3D structure of trees than raster-based tree segmentation methods. Compared to traditional tree segmentation algorithms, such as watershed algorithm, the rotation profile algorithm can be applied to complex forest areas with overlapping canopies and diverse tree species; it is universal and can segment trees of different scales.
The results of tree segmentation are closely related to the grid size d. When d=1m, the maximum number of trees are segmented, but the computational cost increases. Moreover, the redundant part in initial treetop points also increases, resulting in 65 over-segmented trees, requiring a lot of effort to exclude in practical work. This also leads to the incompleteness of correctly segmented canopies, which affects the subsequent tree species identification and parameters extraction. However, if the value of d is set too large to 2m, some short trees will be missed, and multiple trees with distances less than 2m will be directly merged into one tree. The selection of the optimal value is related to point cloud density, canopy size and shape.
The results of tree segmentation essentially depend on the point cloud density and forest growth conditions. Some small trees and closely spaced trees will inevitably be ignored, resulting in multiple trees being recognized as one after segmentation. When a tree is too large or the canopy shape is incomplete, it is easily segmented into multiple trees. Based on the selected initial treetop points, the method in this paper avoids the under-segmentation and over-segmentation of tree canopies by seeking profiles in multiple directions. Meanwhile, trees located within the high tree canopy range are identified as redundant parts of high trees and merged to further improve the accuracy of segmentation.
4.2. Tree Species Identification
Unlike plantation forest, overlapping phenomenon exists between the canopies of trees in natural forest areas in Northeast China. Therefore, the canopy point cloud obtained by tree segmentation is incomplete and cannot accurately reflect the tree structure information. This is an important example of the limits to the application of LiDAR data in natural forest areas.
Presently, deep learning methods for 3D data are not perfect, and most algorithms are not highly reliable. Therefore, this paper utilizes the profile information of the segmented point cloud of tree canopies, extracts the geometric variation of canopy profile by using parallel lines, and converts it into a 1D vector. The profiles that have no contact with other canopies are used to train the DBN classifier. Usually, a tree can obtain multiple profiles that satisfy the conditions, and all these profiles will be applied in the training, which increases the number of training samples, and learns the canopy structure information from multiple directions. The DBN model will also identify by multiple profiles to solve the dilemma of sparse samples, thus increasing the accuracy of the tree classification model and improving the accuracy and reliability of tree species correction (the overall correct rate is 90.9%). The canopy profiles are not directly applied to the classification. Instead, interpolated equidistant canopy lengths are used as feature vectors and input into the DBN model. This method reduces the computational burden while preserving the profile features, and effectively eliminates the random errors caused by semi-random scattered point clouds.
The method used in this paper relies entirely on the geometric shape of the tree canopy and does not involve any spectral information. Therefore, if the tree canopy of a tree is damaged naturally or artificially, or if the tree canopies are too close to each other, it will affect the reliability of the geometric shape of the section. This can cause the tree species classification model to be unable to identify incorrect tree species information or to classify tree species information incorrectly. For example, in this experiment the elm and maple both show a combination of triangular and rectangular shapes in their sections, making them more prone to misclassification. However, as the spectral characteristics of the leaves and flowering periods of elm and maple are quite distinct, in future studies, we will try to integrate spectral information based on the distribution characteristics of tree species in the study area to achieve high precision tree species classification.
4.3. Forestry Parameters Extraction
Given that the known species of trees, tree height, canopy width, DBH, AGB and stock volume can be estimated, the estimated values show strong consistency with the measured values.
The accuracy of forestry parameter estimation depends largely on the result of tree segmentation; for example, canopy width is directly determined by the size of the segmented canopy. The study area belongs to natural forest, where canopy overlap is more significant compared to artificial forest, resulting in segmented tree canopies being smaller than the actual situation and leading to an estimated canopy width which is smaller than the actual measured value. This is more obvious for taller trees. Therefore, although both are direct parameters, the accuracy of canopy width estimation is lower than that of tree height (R² of tree height is 0.893, while that of east-west canopy width is 0.757 and north-south canopy width is 0.694).
Indirect forest parameters such as AGB use tree height and DBH as independent variables in estimation equations, and DBH estimation also uses tree height as input. Therefore, the accuracy of tree height is particularly important for the estimation of indirect forest parameters. Tree height has higher consistency within the range of 20-30m, while in the range of 5-20m, the estimated tree height is slightly higher than the measured tree height on average, which is caused by the uneven height distribution and overlapping of trees in natural forest. Correspondingly, in the estimation of DBH, which uses tree height as the only input, the estimated values of larger trees have higher consistency with the measured values (usually larger diameter corresponds to higher tree height), and the estimated values of smaller trees are slightly higher than the measured values. As for AGB and stock volume, they are obtained by substituting tree height and DBH into the estimation equations, and their accuracy (AGB R²=0.896, stock volume R²=0.891) is very close to that of tree height and DBH (tree height R²=0.893, DBH R²=0.840).
5. Conclusions
In this study, based on LiDAR point cloud data and measured data of Northeast Tiger and Leopard National Park, we conducted the verification and update of sample plots information and realized the whole process from data pre-processing to forestry parameters estimation to obtain the following conclusions:
- (1)
- The article uses the PTD algorithm to separate ground and non-ground points with an accuracy of more than 95%, achieving excellent separation results and providing a good preparation for the subsequent steps;
- (2)
- The rotating profile algorithm is applied to the tree segmentation, and the over-segmentation and under-segmentation are suppressed when grid size d=1.5m. Under this condition, the F-scores of the eight sample plots exceed 0.94, and the overall F-score is 0.975;
- (3)
- Using information on tree species from the plot samples, the correspondence between tree species and segmented canopies geometry is established, achieving tree species recognition and information correction based on LIDAR data, with overall correctness rate of 90.9%;
- (4)
- Based on the updated tree species, tree height, east-west canopy width, north-south canopy width, DBH, AGB and stock volume are extracted from the sample plots. R2 of these estimated parameters are 0.893, 0.757, 0.694, 0.840, 0.896 and 0.891, respectively, which strongly correlate with the measured values.
In the future, based on the forest tree species and distribution, comprehensive use of LiDAR point cloud and image data will enable more accurate estimation of forestry parameters. The establishment of tree species morphology databases, spectral databases, regional tree species classification model databases, etc., will promote the comprehensive evaluation system of remote sensing technology and become an important means for future forestry surveys.
Author Contributions
Chunjing Yao conceived and designed the experiments. Chunjing Yao and Jie Wang performed the experiments. Junhao Xu and Chen Qian analyzed the data. Jie Wang and Hongchao Ma wrote the paper.
Acknowledgments
This research is funded and supported by National Key R&D Program of China (2018YFB0504500), National Natural Science Foundation of China (No. 41101417) and National High Resolution Earth Observations Foundation (11-H37B02-9001-19/22).
Conflicts of Interest
The authors declare there is no conflicts of interest regarding the publication of this paper. The founding sponsors had no role in the design of the study; in the collection, analyses, or interpretation of data; in the writing of the manuscript; or in the decision to publish the results.
References
- Eckert, S. Improved Forest Biomass and Carbon Estimations Using Texture Measures from WorldView-2 Satellite Data. Remote Sens. 2012, 4, 810-829. [CrossRef]
- He, X.; Ren, C.; Chen, L.; Wang, Z.; Zheng, H. The Progress of Forest Ecosystems Monitoring with Remote Sensing Techniques. Scientia Geographica Sinica 2018, 38, 97-1011. [CrossRef]
- MALHI, Y.; BALDOCCHI, D. D.; JARVIS, P. G. The carbon balance of tropical, temperate and boreal forests. Plant, Cell and Environment 1999, 22, 715-740. [CrossRef]
- Dong, X.; Li J.; Chen, H.; Zhao L.; Zhang, L.; Xing S. Extraction of individual tree information based on remote sensing images from an Unmanned Aerial Vehicle. Journal of Remote sensing 2019, 23, 1269-1280. [CrossRef]
- Liu, F.; Tan, C.; Zhang, G.; Liu, J. Estimation of Forest Parameter and Biomass for Individual Pine Trees Using Airborne LiDAR. Transactions of the Chinese Society for Agricultural Machinery 2013, 44, 219-224,242. [CrossRef]
- Ouma, Y. O. Optimization of Second-Order Grey-Level Texture in High-Resolution Imagery for Statistical Estimation of Above-Ground Biomass. Journal of Environmental Informatics 2006, 8, 70-85. [CrossRef]
- Marshall, M.; Thenkabail, P. Advantage of hyperspectral EO-1 Hyperion over multispectral IKONOS, GeoEye-1, WorldView-2, Landsat ETM+, and MODIS vegetation indices in crop biomass estimation. ISPRS Journal of Photogrammetry and Remote Sensing 2015, 108, 205-218. [CrossRef]
- Mohammadi, J.; Shataee, S.; Babanezhad, M. Estimation of forest stand volume, tree density and biodiversity using Landsat ETM+Data, comparison of linear and regression tree analyses. Procedia Environmental Sciences 2011, 7, 299-304. [CrossRef]
- Franklin, S. E.; Hall, R. J.; Smith, L.; Gerylo, G. R. Discrimination of conifer height, age and crown closure classes using Landsat-5 TM imagery in the Canadian Northwest Territories. International Journal of Remote Sensing 2003, 24, 1823-1834. [CrossRef]
- Brown, S.; Pearson, T.; Slaymaker, D.; Ambagis, S.; Moore, N.; Novelo, D.; Sabido, W. CREATING A VIRTUAL TROPICAL FOREST FROM THREE-DIMENSIONAL AERIAL IMAGERY TO ESTIMATE CARBON STOCKS. Ecological Application 2005, 15, 1083–1095. [CrossRef]
- Cloude, S. R.; Papathanassiou, K. P. Forest Vertical Structure Estimation using Coherence Tomography. IGARSS 2008 - 2008 IEEE International Geoscience and Remote Sensing Symposium, Boston, USA, 2008. [CrossRef]
- Blomberg, E.; Ferro-Famil, L.; Soja, M. J.; Ulander, L. M. H.; Tebaldini, S. Forest Biomass Retrieval From L-Band SAR Using Tomographic Ground Backscatter Removal. IEEE Geoscience and Remote Sensing Letters 2018, 15, 1030–1034. [CrossRef]
- Matasci, G.; Hermosilla, T.; Wulder, M. A.; White, J. C.; Coops, N. C.; Hobart, G. W.; Zald, H. S. J. Large-area mapping of Canadian boreal forest cover, height, biomass and other structural attributes using Landsat composites and lidar plots. Remote Sensing of Environment 2018, 209, 90–106. [CrossRef]
- Luckman, A.; Baker, J.; Honzák, M.; Lucas, R. Tropical Forest Biomass Density Estimation Using JERS-1 SAR: Seasonal Variation, Confidence Limits, and Application to Image Mosaics. Remote Sensing of Environment 1998, 63, 126–139. [CrossRef]
- Means, J. Use of Large-Footprint Scanning Airborne Lidar To Estimate Forest Stand Characteristics in the Western Cascades of Oregon. Remote Sensing of Environment 1999, 67, 298–308. [CrossRef]
- Hyyppä, J.; Yu, X.; Hyyppä, H.; Vastaranta, M.; Holopainen, M.; Kukko, A.; Kaartinen, H.; Jaakkola, A.; Vaaja, M.; Koskinen, J.; Alho, P. Advances in Forest Inventory Using Airborne Laser Scanning. Remote Sens. 2012, 4, 1190-1207. [CrossRef]
- Kaartinen, H.; Hyyppä, J.; Yu, X.; Vastaranta, M.; Hyyppä, H.; Kukko, A.; Holopainen, M.; Heipke, C.; Hirschmugl, M.; Morsdorf, F.; Næsset, E.; Pitkänen, J.; Popescu, S.; Solberg, S.; Wolf, B.M.; Wu, J.-C. An International Comparison of Individual Tree Detection and Extraction Using Airborne Laser Scanning. Remote Sens. 2012, 4, 950-974. [CrossRef]
- Kampa, K.; Slatton, K.C. An adaptive multiscale filter for segmenting vegetation in ALSM data. IGARSS 2004. 2004 IEEE International Geoscience and Remote Sensing Symposium, Anchorage, USA, 2004. [CrossRef]
- Lee, H.; Slatton, K. C.; Roth, B. E.; Cropper, W. P. Adaptive clustering of airborne LiDAR data to segment individual tree crowns in managed pine forests. International Journal of Remote Sensing 2010, 31, 117–139. [CrossRef]
- Mei, C.; Durrieu, S. Tree crown delineation from digital elevation models and high resolution imagery. proceedings of the isprs working group part. 2004.
- Chen, Q.; Baldocchi, D.; Gong, P.; Kelly, M. Isolating Individual Trees in a Savanna Woodland Using Small Footprint Lidar Data. Photogrammetric Engineering and Remote Sensing 2006, 72, 923–932. [CrossRef]
- Tang, F.; Zhang, X.; Liu, J. Segmentation of tree crown model with complex structure from airborne LIDAR data. Geoinformatics 2007: Remotely Sensed Data and Information. 2007. [CrossRef]
- Leckie, D.; Gougeon, F.; Hill, D.; Quinn, R.; Armstrong, L.; Shreenan, R. Combined high-density lidar and multispectral imagery for individual tree crown analysis. Canadian Journal of Remote Sensing 2003, 29, 633–649. [CrossRef]
- Reitberger, J.; Schnörr, Cl.; Krzystek, P.; Stilla, U. 3D segmentation of single trees exploiting full waveform LIDAR data. ISPRS Journal of Photogrammetry and Remote Sensing 2009, 64, 561–574. [CrossRef]
- Lu, X.; Guo, Q.; Li, W.; Flanagan, J. A bottom-up approach to segment individual deciduous trees using leaf-off lidar point cloud data. ISPRS Journal of Photogrammetry and Remote Sensing 2014, 94, 1–12. [CrossRef]
- Wang, Y.; Weinacker, H.; Koch, B. A Lidar Point Cloud Based Procedure for Vertical Canopy Structure Analysis And 3D Single Tree Modelling in Forest. Sensors 2008, 8, 3938–3951. [CrossRef]
- Morsdorf, F.; Meier, E.H.; Allgöwer, B.; Nüesch, D. CLUSTERING IN AIRBORNE LASER SCANNING RAW DATA FOR SEGMENTATION OF SINGLE TREES. 2003.
- Li, W.; Guo, Q.; Jakubowski, M. K.; Kelly, M. A New Method for Segmenting Individual Trees from the Lidar Point Cloud. Photogrammetric Engineering & Remote Sensing 2012, 78, 75–84. [CrossRef]
- Holmgren, J.; Persson, Å. Identifying species of individual trees using airborne laser scanner. Remote Sensing of Environment 2004, 90, 415–423. [CrossRef]
- Othmani, A.; Lew Yan Voon, L. F. C.; Stolz, C.; Piboule, A. Single tree species classification from Terrestrial Laser Scanning data for forest inventory. Pattern Recognition Letters 2013, 34, 2144–2150. [CrossRef]
- Lin, Y.; Hyyppä, J. A comprehensive but efficient framework of proposing and validating feature parameters from airborne LiDAR data for tree species classification. International Journal of Applied Earth Observation and Geoinformation 2016, 46, 45–55. [CrossRef]
- Kim, S.; McGaughey, R. J.; Andersen, H.-E.; Schreuder, G. Tree species differentiation using intensity data derived from leaf-on and leaf-off airborne laser scanner data. Remote Sensing of Environment 2009, 113, 1575–1586. [CrossRef]
- Ørka, H. O.; Næsset, E.; Bollandsås, O. M. Classifying species of individual trees by intensity and structure features derived from airborne laser scanner data. Remote Sensing of Environment 2009, 113, 1163–1174. [CrossRef]
- Kashani, A.; Olsen, M.; Parrish, C.; Wilson, N. A Review of LIDAR Radiometric Processing: From Ad Hoc Intensity Correction to Rigorous Radiometric Calibration. Sensors 2015, 15, 28099–28128. [CrossRef]
- Solodukhin V. I.; Zukov A. J.; Mazugin I. N. Laser aerial profiling of a forest. Lew NIILKh Leningrad Lesnoe Khozyaistvo 1977, 10, 53-58.
- Shrestha, R.; Wynne, R.H. Estimating Biophysical Parameters of Individual Trees in an Urban Environment Using Small Footprint Discrete-Return Imaging Lidar. Remote Sens. 2012, 4, 484-508. [CrossRef]
- Bortolot, Z. J.; Wynne, R. H. Estimating forest biomass using small footprint LiDAR data: An individual tree-based approach that incorporates training data. ISPRS Journal of Photogrammetry and Remote Sensing 2005, 59, 342–360. [CrossRef]
- Wang, D.; Xin, X.; Shao, Q.; Brolly, M.; Zhu, Z.; Chen, J. Modeling Aboveground Biomass in Hulunber Grassland Ecosystem by Using Unmanned Aerial Vehicle Discrete Lidar. Sensors 2017, 17, 180. [CrossRef]
- García, M.; Riaño, D.; Chuvieco, E.; Danson, F. M. Estimating biomass carbon stocks for a Mediterranean forest in central Spain using LiDAR height and intensity data. Remote Sensing of Environment 2010, 114, 816–830. [CrossRef]
- DONOGHUE, D.; WATT, P.; COX, N.; WILSON, J. Remote sensing of species mixtures in conifer plantations using LiDAR height and intensity data. Remote Sensing of Environment 2007, 110, 509–522. [CrossRef]
- Jin, J.; Yue, C.; Li, C.; Gu, L.; Luo, H.; Zhu, B. Estimation on Forest Volume Based on ALS Data and Dummy Variable Technology. FOREST RESOURCES WANAGEMENT 2021, 0, 77-85. [CrossRef]
- PANG, Y.; LI, Z.-Y. Inversion of biomass components of the temperate forest using airborne Lidar technology in Xiaoxing’an Mountains, Northeastern of China. Chinese Journal of Plant Ecology 2013, 36, 1095–1105. [CrossRef]
- Axelsson, P. Processing of laser scanner data—algorithms and applications. ISPRS Journal of Photogrammetry and Remote Sensing 1999, 54, 138–147. [CrossRef]
- Qian, C.; Yao, C.; Ma, H.; Xu, J.; Wang, J. Tree Species Classification Using Airborne LiDAR Data Based on Individual Tree Segmentation and Shape Fitting. Remote Sens. 2023, 15, 406. [CrossRef]
- Goodenough, D. G.; Chen, H.; Dyk, A.; Richardson, A.; Hobart, G. Data Fusion Study Between Polarimetric SAR, Hyperspectral and Lidar Data for Forest Information. IGARSS 2008 - 2008 IEEE International Geoscience and Remote Sensing Symposium. Boston, USA, 2008, . [CrossRef]
- Alonzo, M.; Bookhagen, B.; Roberts, D. A. Urban tree species mapping using hyperspectral and lidar data fusion. Remote Sensing of Environment 2014, 148, 70–83. [CrossRef]
- Hinton, G. E.; Osindero, S.; Teh, Y.-W. A Fast Learning Algorithm for Deep Belief Nets. Neural Computation 2006, 18, 1527–1554. [CrossRef]
- Goutte, C.; Gaussier, E. A Probabilistic Interpretation of Precision, Recall and F-Score, with Implication for Evaluation. Advances in Information Retrieval 2005, 345–359. [CrossRef]
Figure 3.
Workflow of the overall method.
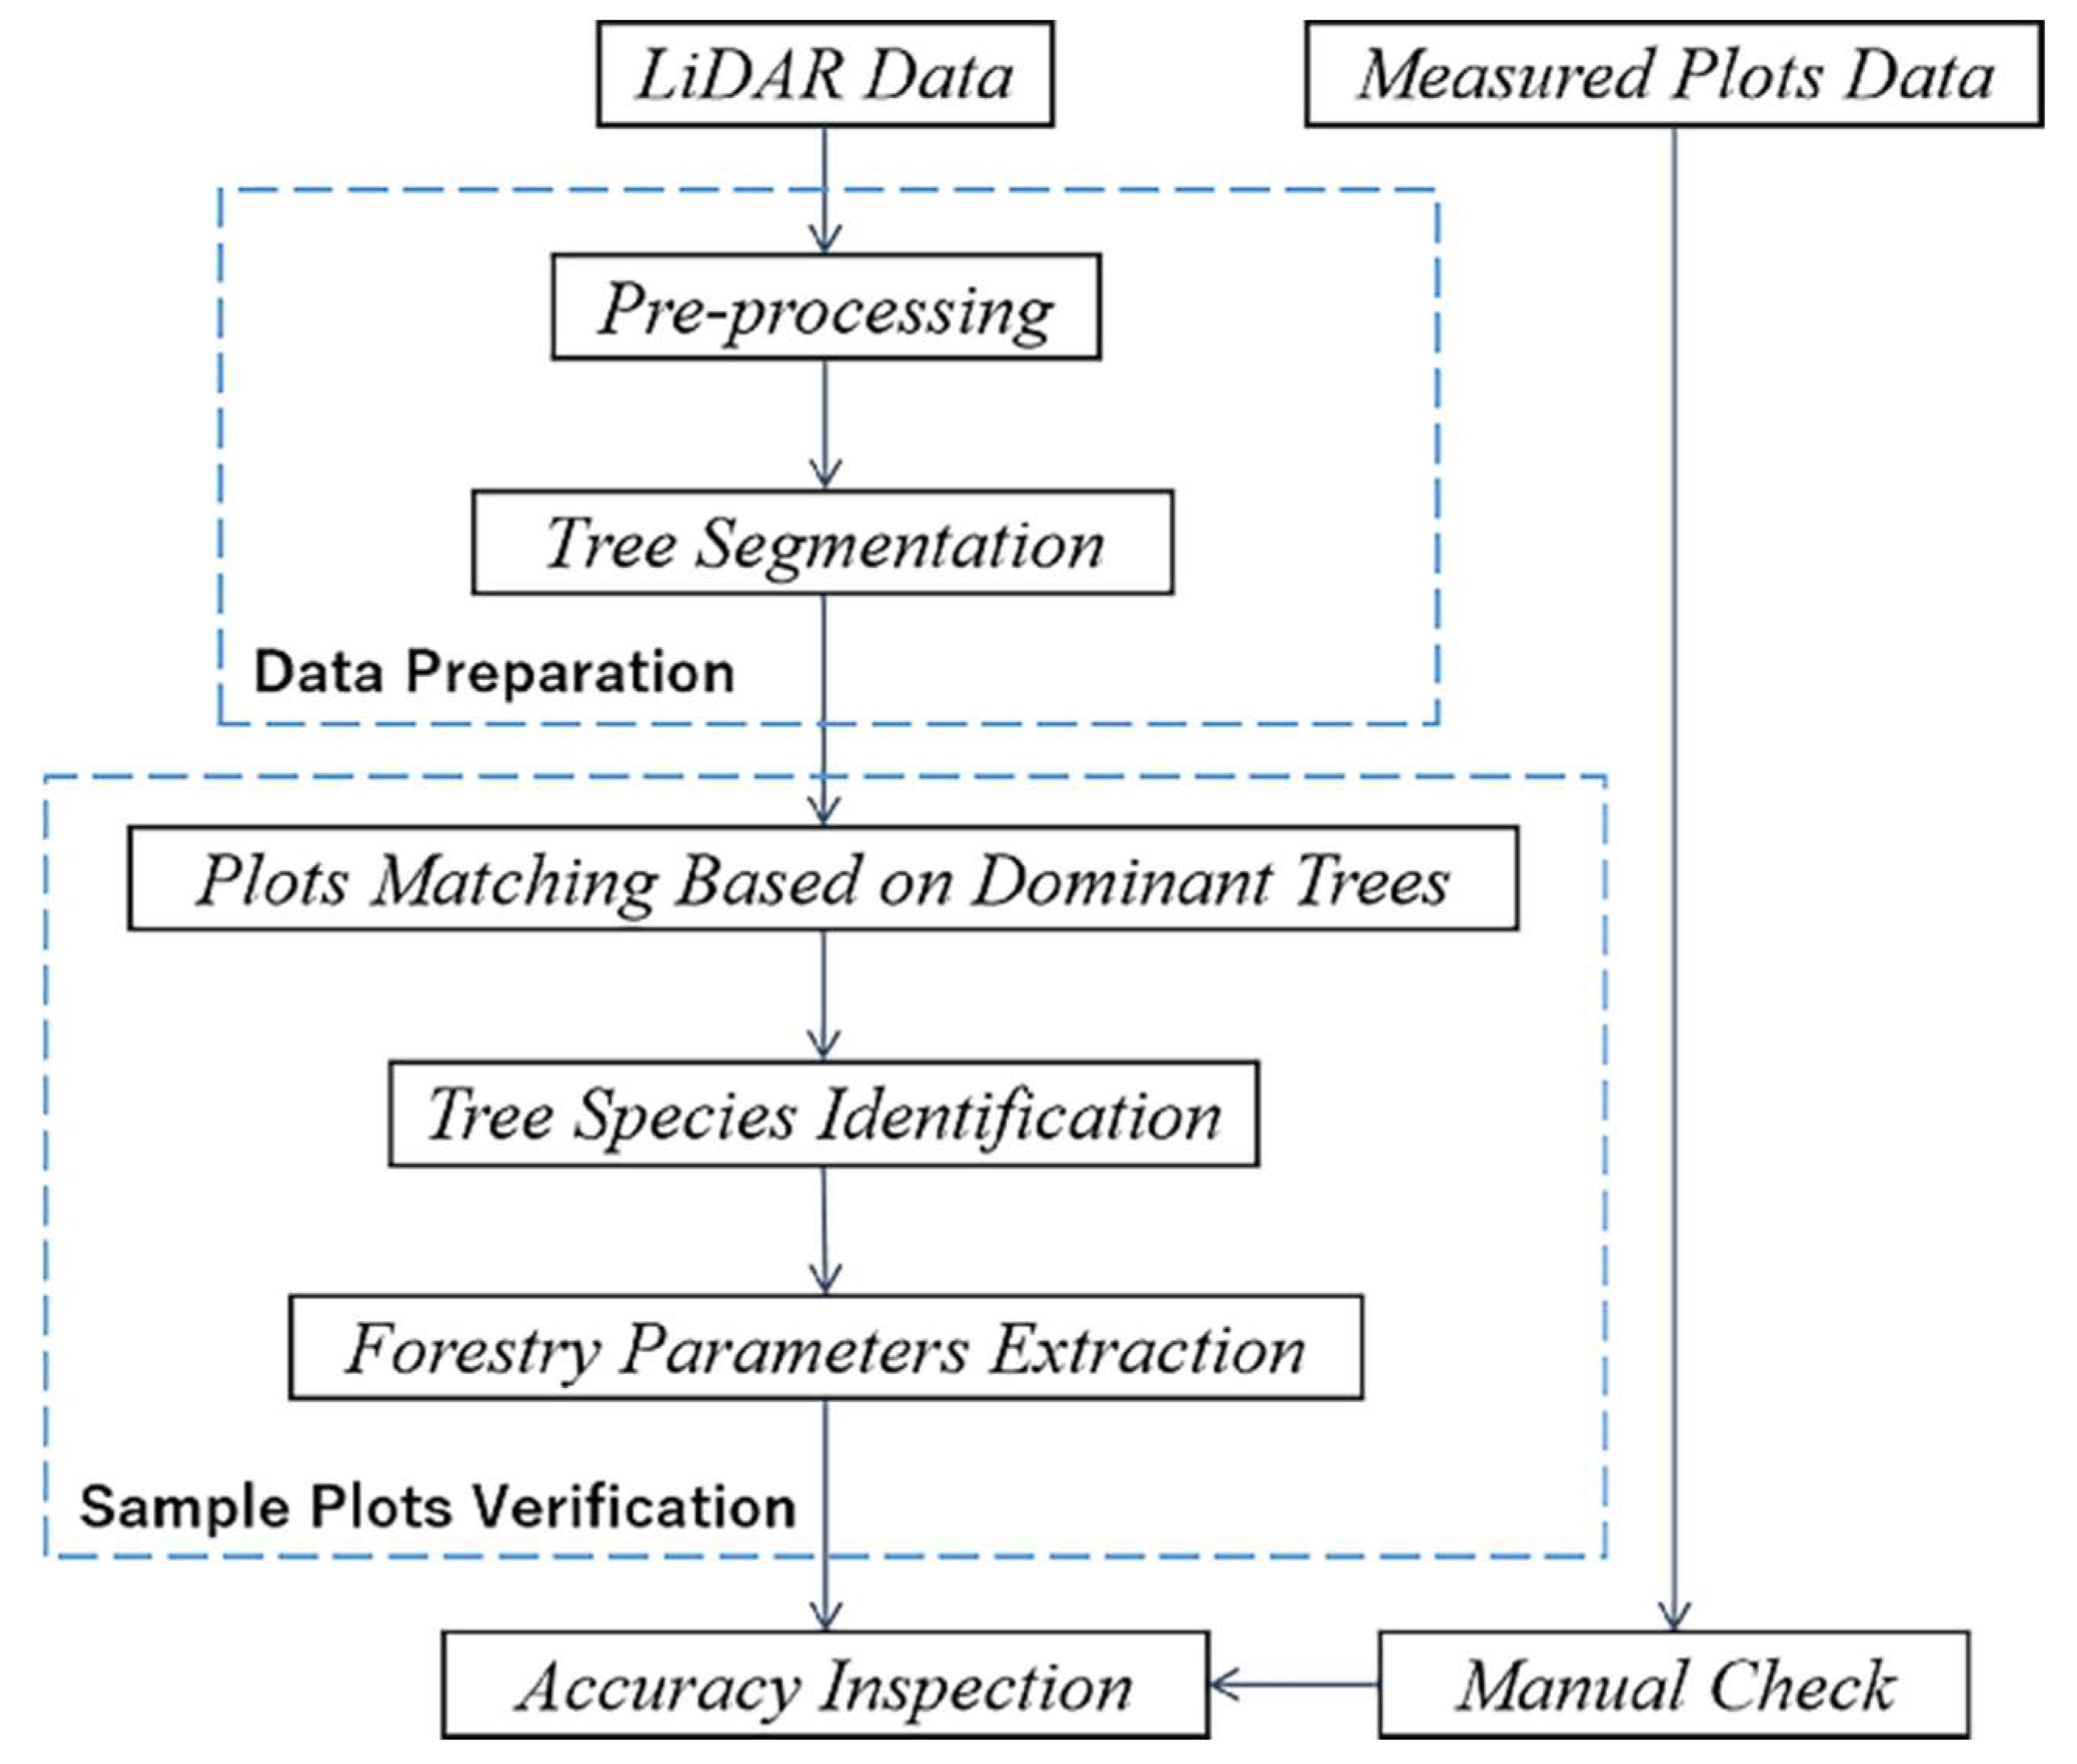
Figure 10.
The shape of the tree canopies and their simplified fitted shapes.
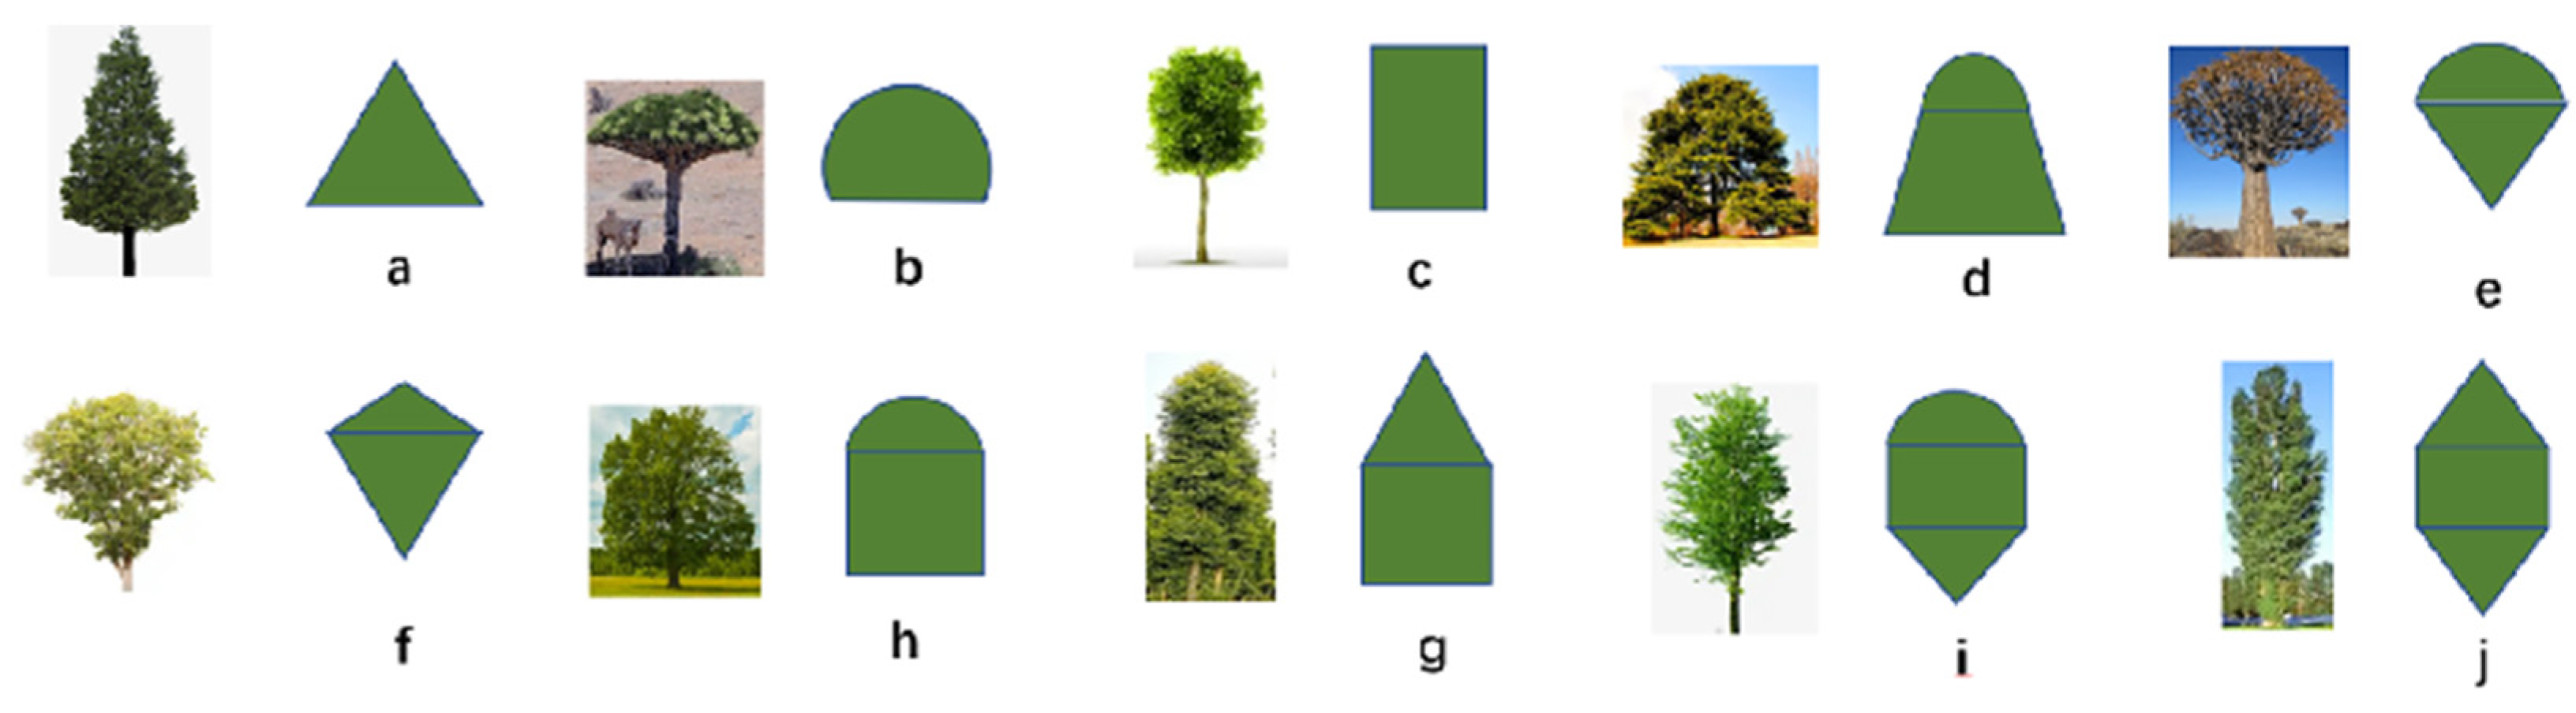
Figure 13.
The structure of RBM.
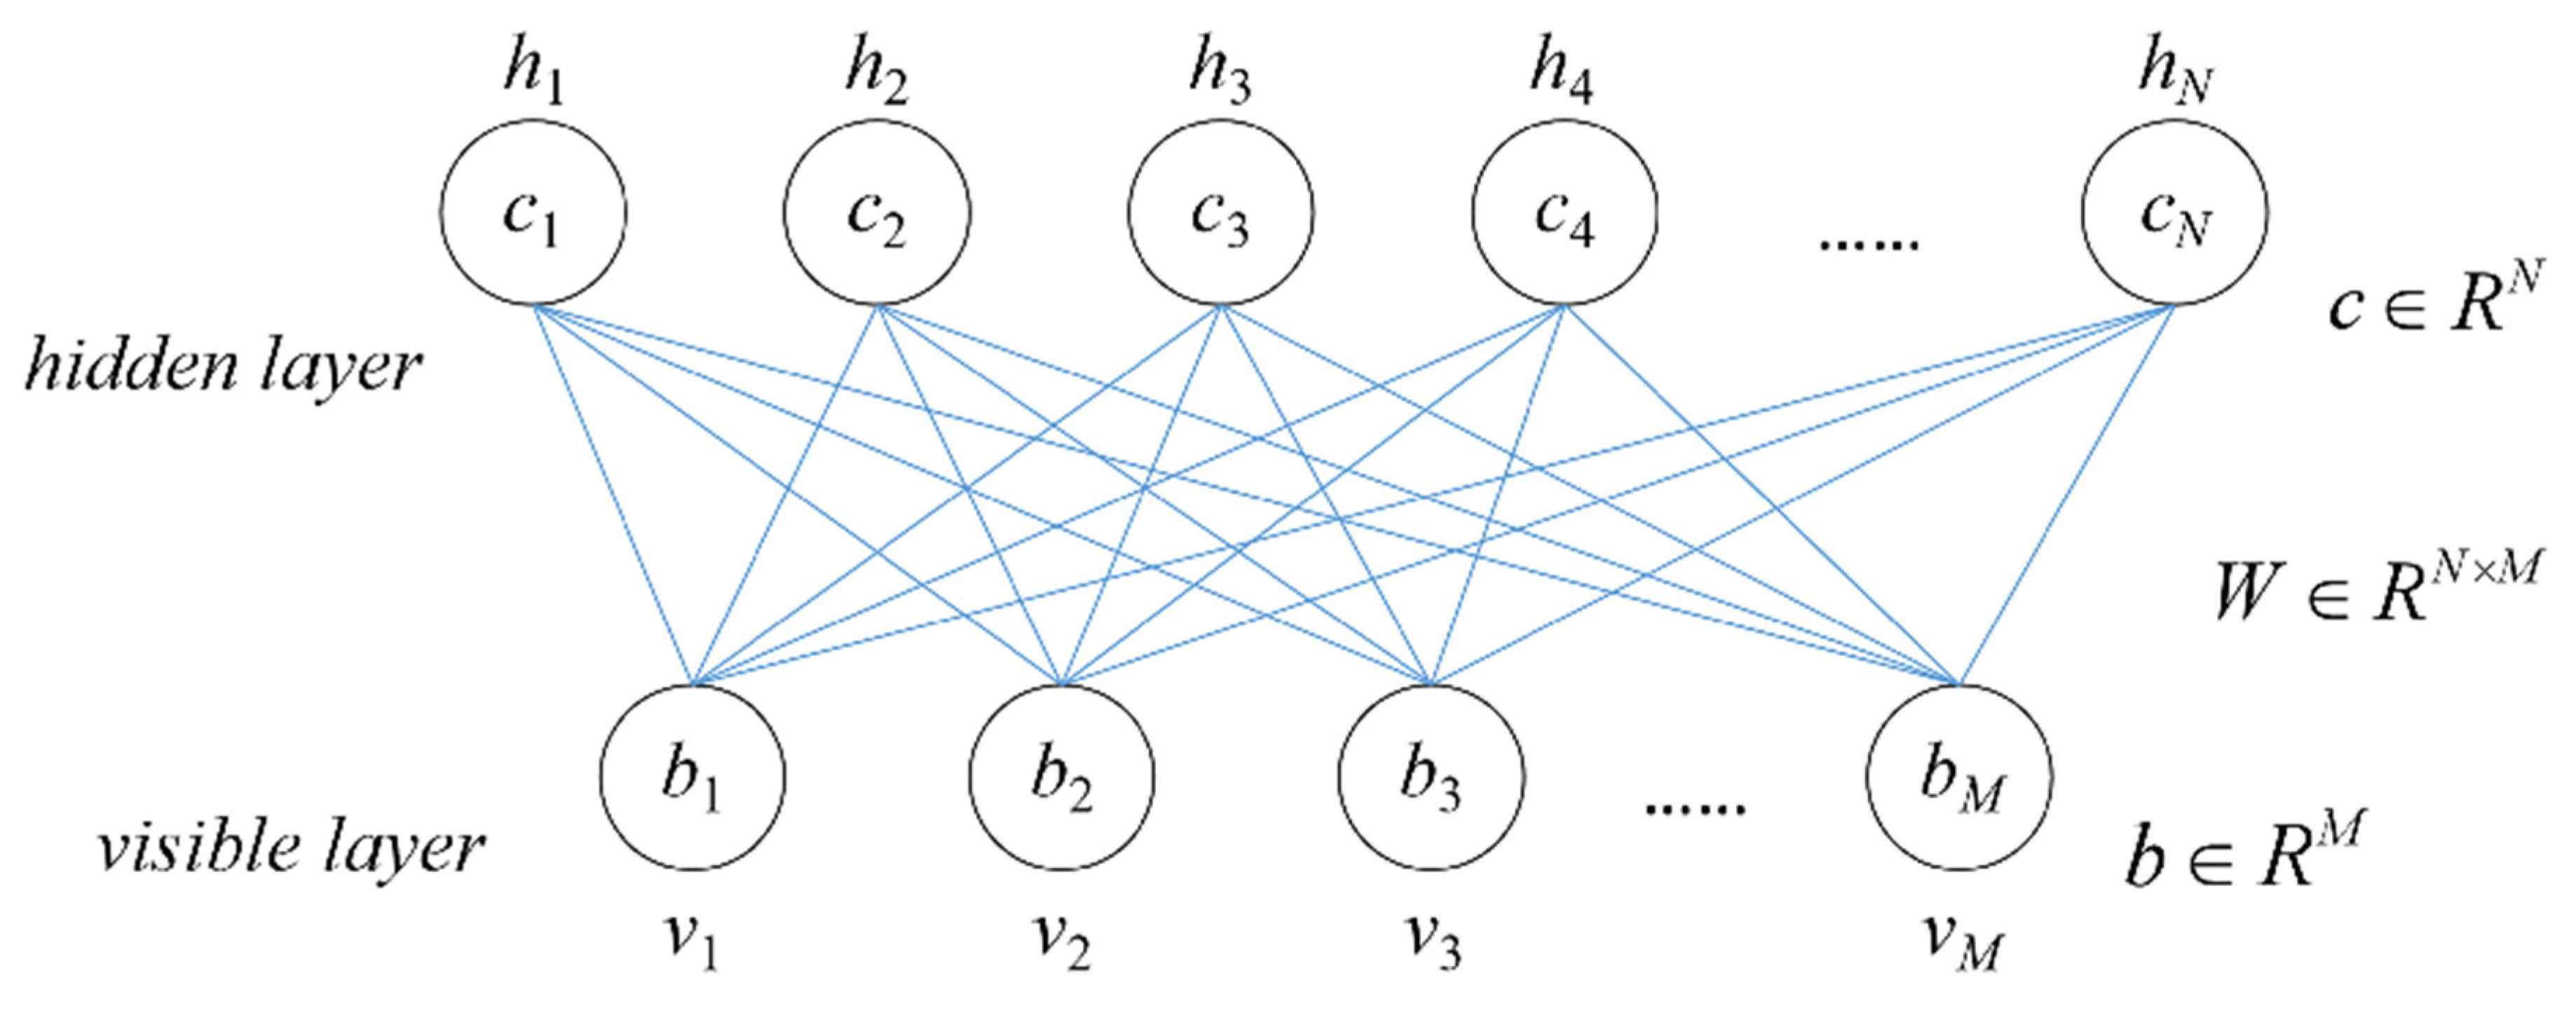
Figure 14.
The structure of DBN.
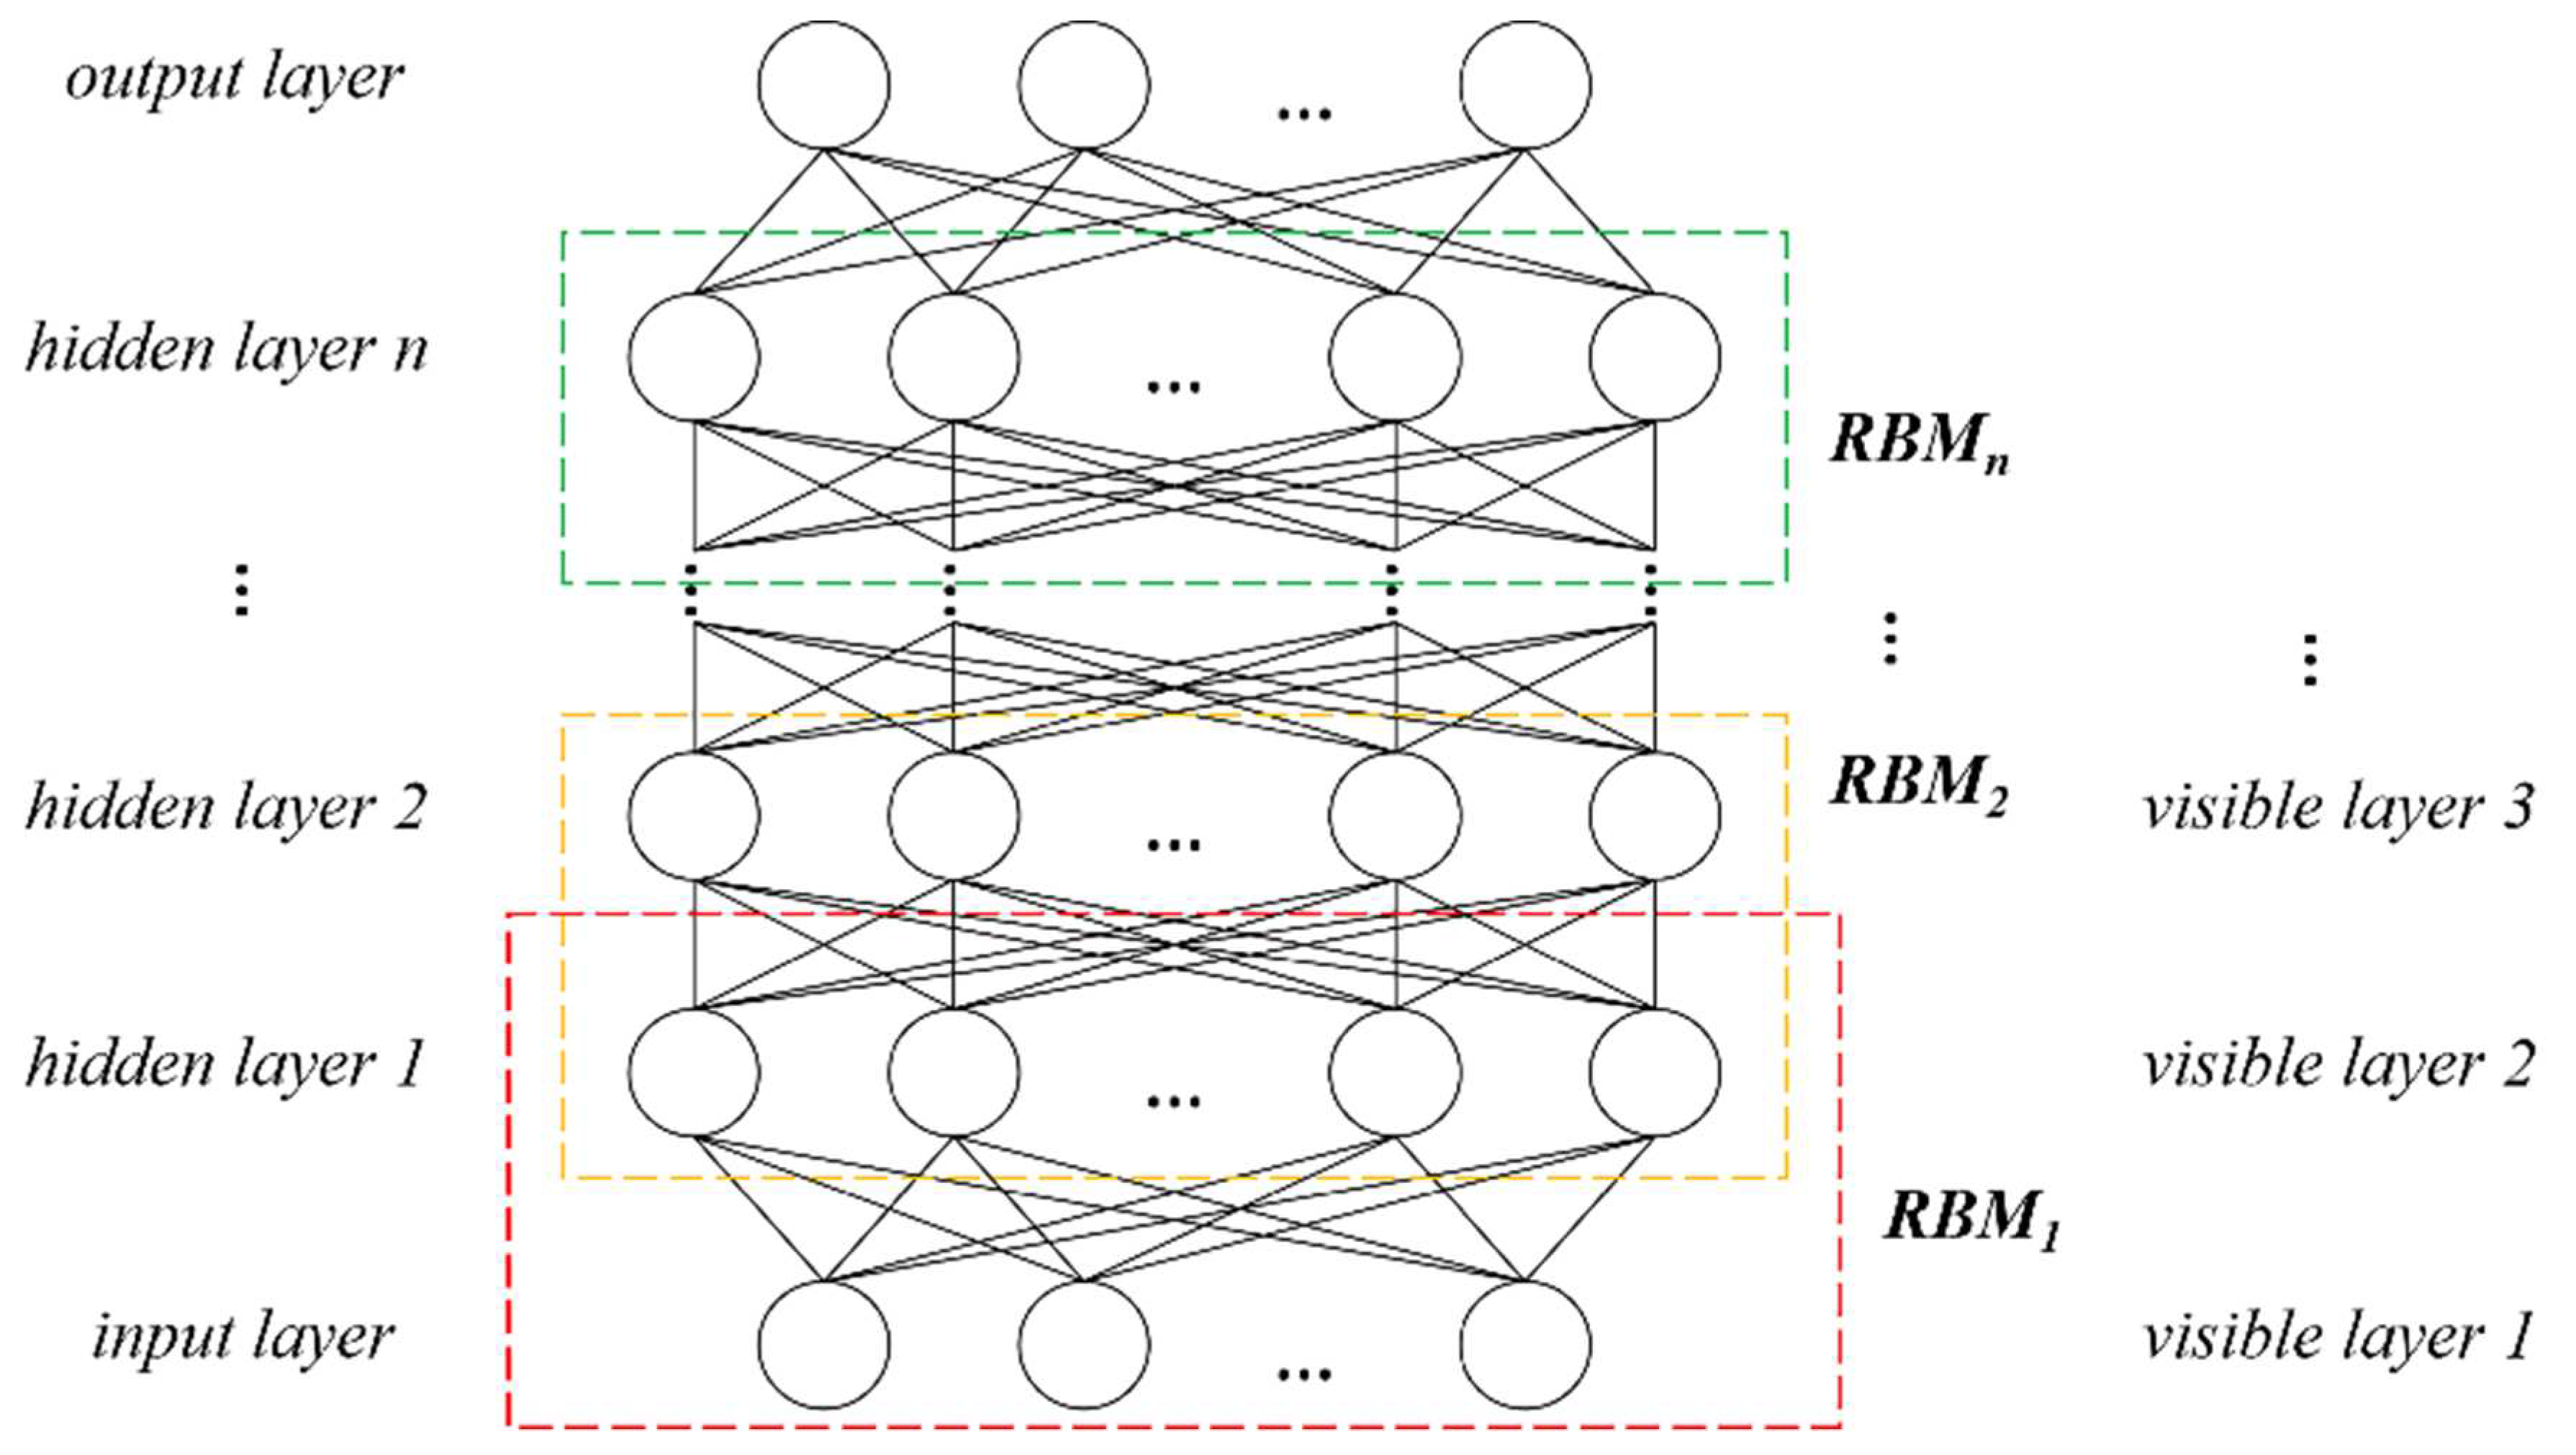
Table 2.
Properties of the point cloud data.
| Properties of the Point Cloud Data | Contents |
|---|---|
| Flight Platform | Cessna 208b aircraft |
| LiDAR Scanner Type | riegl-vq-1560i |
| Attitude of Points (m) | 1000 |
| Overlap of flight lines | 20% |
| Horizontal accuracy (cm) | 15~25 |
| Vertical accuracy (cm) | 15 |
| Point density (pts/m2) | 20 |
Table 3.
Forestry parameters available from LiDAR data.
| Forestry Parameters | Acquisition Method | Estimating equation factors |
|---|---|---|
| Tree Height | Direct measurement | / |
| Canopy width | Segmented Point Cloud Measurements | / |
| DBH | Growth Equation Estimation | Tree Height |
| AGB | Growth Equation Estimation | Tree Height, DBH |
| Stock Volume | Growth Equation Estimation | DBH |
Table 4.
DBH estimation models.
| Tree Species |
Factor | Estimation Formula |
Applicable Condition (H) |
Parameters | |
|---|---|---|---|---|---|
| a | b | ||||
| Pine | H | D=exp(a+b*H) | 2-36.5 | 1.646 | 0.081 |
| Oak | H | D=exp(a+b*H) | 8.8-27.4 | 1.138 | 0.111 |
| Birch | H | D=exp(a+b*H) | 5-24.2 | 1.043 | 0.116 |
| Elm | H | D=exp(a+b*H) | 3-25.9 | 1.040 | 0.121 |
| Linden | H | D=exp(a+b*H) | 8.2-29.9 | 0.733 | 0.129 |
| Poplar | H | D=exp(a+b*H) | 4.8-30.1 | 1.171 | 0.110 |
| Maple | H | D=exp(a+b*H) | 5-22.4 | 0.958 | 0.135 |
Table 5.
AGB estimation models.
| Tree Species |
Factors | Estimation Formula |
Parameters | ||
|---|---|---|---|---|---|
| a | b | c | |||
| Pine | H, D | M=aDbHc | 0.120 | 2.064 | 0.383 |
| Oak | H, D | M=a(D2H)b | 0.020 | 1.039 | / |
| Birch | H, D | M=a(D2H)b | 0.020 | 1.039 | / |
| Elm | H, D | M=a(D2H)b | 0.020 | 1.039 | / |
| Linden | H, D | M=a(D2H)b | 0.020 | 1.039 | / |
| Poplar | D | M=aDb | 0.022 | 2.737 | / |
| Maple | H, D | M=a(D2H)b | 0.020 | 1.039 | / |
Table 6.
Parameters of stock volume estimation models.
| Tree Species | a | b | c | d | e | k |
|---|---|---|---|---|---|---|
| Pine | 5.09E-05 | 1.809 | 1.101 | 48.429 | -2385.550 | 50 |
| Oak | 4.07E-05 | 1.719 | 1.253 | 23.804 | -240.081 | 8 |
| Birch & Poplar | 4.06E-05 | 1.835 | 1.113 | 29.850 | -439.555 | 14 |
| Elm | 3.63E-05 | 1.819 | 1.173 | 26.744 | -472.502 | 18 |
| Linden | 3.55E-05 | 1.767 | 1.243 | 27.297 | -384.328 | 13 |
| Maple | 4.25E-05 | 1.783 | 1.140 | 22.511 | -258.117 | 11 |
Table 7.
The accuracy of the separation in sample plots.
| Plot ID | Type Ⅰ Error | Type Ⅱ Error | Separation Accuracy | Overall Accuracy |
|---|---|---|---|---|
| 1 | 47 | 44 | 98.2% | 97.1% |
| 2 | 46 | 44 | 97.9% | |
| 3 | 120 | 125 | 95.1% | |
| 4 | 69 | 54 | 97.5% | |
| 5 | 91 | 104 | 96.2% | |
| 6 | 72 | 55 | 97.1% | |
| 7 | 68 | 66 | 96.4% | |
| 8 | 6 | 46 | 97.2% |
Table 9.
The recall, precision and F-score of different grid sizes d.
| Plot ID |
Real Number |
d= 1 m | d= 1.5 m | d= 2 m | ||||||
| r | p | F | r | p | F | r | p | F | ||
| 1 | 50 | 0.980 | 0.778 | 0.867 | 0.940 | 0.959 | 0.949 | 0.840 | 0.977 | 0.903 |
| 2 | 42 | 0.976 | 0.820 | 0.891 | 0.952 | 1.000 | 0.976 | 0.810 | 1.000 | 0.895 |
| 3 | 45 | 1.000 | 0.804 | 0.891 | 0.978 | 1.000 | 0.989 | 0.867 | 1.000 | 0.929 |
| 4 | 41 | 1.000 | 0.854 | 0.921 | 0.976 | 0.976 | 0.976 | 0.902 | 0.973 | 0.937 |
| 5 | 29 | 1.000 | 0.829 | 0.906 | 1.000 | 0.935 | 0.967 | 0.862 | 0.962 | 0.909 |
| 6 | 41 | 1.000 | 0.837 | 0.911 | 0.976 | 1.000 | 0.988 | 0.878 | 1.000 | 0.935 |
| 7 | 31 | 1.000 | 0.861 | 0.925 | 1.000 | 0.969 | 0.984 | 0.935 | 1.000 | 0.967 |
| 8 | 39 | 1.000 | 0.886 | 0.940 | 0.949 | 1.000 | 0.974 | 0.897 | 1.000 | 0.946 |
| All | 318 | 0.994 | 0.829 | 0.904 | 0.969 | 0.981 | 0.975 | 0.871 | 0.989 | 0.926 |
Table 10.
Matching degrees and deviation values of eight plots.
| Plot ID | 1 | 2 | 3 | 4 | 5 | 6 | 7 | 8 |
| Matching Degree | 92.1% | 90.5% | 91.7% | 94.2% | 93.2% | 91.8% | 92.5% | 93.7% |
| Deviation Value | 6.32 m | 7.13 m | 6.57 m | 4.63 m | 5.78 m | 7.54 m | 5.84 m | 6.77 m |
Table 11.
The number of training samples.
| Tree Species | Actual Number | Number of Selected | Number of Profiles |
|---|---|---|---|
| Pine | 40 | 20 | 80 |
| Oak | 25 | 10 | 40 |
| Birch | 14 | 8 | 32 |
| Elm | 19 | 8 | 32 |
| Linden | 114 | 50 | 200 |
| Poplar | 19 | 10 | 40 |
| Maple | 45 | 20 | 80 |
Disclaimer/Publisher’s Note: The statements, opinions and data contained in all publications are solely those of the individual author(s) and contributor(s) and not of MDPI and/or the editor(s). MDPI and/or the editor(s) disclaim responsibility for any injury to people or property resulting from any ideas, methods, instructions or products referred to in the content. |
© 2023 by the authors. Licensee MDPI, Basel, Switzerland. This article is an open access article distributed under the terms and conditions of the Creative Commons Attribution (CC BY) license (http://creativecommons.org/licenses/by/4.0/).
Copyright: This open access article is published under a Creative Commons CC BY 4.0 license, which permit the free download, distribution, and reuse, provided that the author and preprint are cited in any reuse.


