
Submitted:
25 April 2023
Posted:
26 April 2023
You are already at the latest version
Abstract
This study assesses the biomethane (CH4) generation and greenhouse gas (GHG) emissions resulting from municipal solid waste landfilling in Phnom Penh, Cambodia, with a focus on the impact of fugitive CH4 emissions and operation processes in four landfilling scenarios: simple dumping (S1), improved management with leachate treatment (S2), engineered landfill with flaring (S3), and engineered landfill with energy recovery (S4). The study also considered the environmental benefits of carbon sequestration and landfill gas utilization. The LandGEM and IPCC FOD models were used to calculate CH4 generation over the period of 2009-2022, and it was found that approximately 18 and 21 M kg/year of CH4 are released, respectively. The energy potential from CH4 recovery was 51–61 GWh/year. Overall GHG emissions in S2 were the highest, amounting to 409–509 M kg CO2-eq/year, while S1 had lower emissions at 397–496 M kg CO2-eq/year. Flaring captured CH4 in S3 could reduce GHG emissions by at least 55%, and using captured CH4 for electricity production in S4 could mitigate at least 83% of GHG emissions. Electricity recovery (S4) could avoid significant amounts of GHG emissions (˗104.5 kg CO2-eq/tMSW). The study suggests that landfill gas-to-energy could significantly reduce GHG emissions.
Keywords:
carbon sequestration
; emission
; greenhouse gas
; landfill gas
; methane
; municipal solid waste
; Phnom Penh.
1. Introduction
Landfilling remains a widely used method for disposing of municipal solid waste (MSW). Biodegradable wastes in the landfill site decompose over time, generating landfill biogas (LFG) which is primarily composed of methane (CH4) and carbon dioxide (CO2), as well as a small proportion of non-methane organic compounds [1,2]. Fugitive CH4 emissions from disposal sites have a high global warming potential (GWP), accounting for about 5% of the world's anthropogenic greenhouse gases (GHGs) [3]. CO2 emitted from landfills is of biogenic origin and is therefore not considered GHGs [4]. LFG generation varies depending on physical composition, permeability and moisture, temperatures, and landfill management, including surface soil cover, leachate recirculation, or other liquid inputs [5,6]. Some countries have regulated the rules for landfill management to mitigate the negative impacts on the environment, including, but not limited to, installation of LFG collection, separation of organic waste, and soil cover for bio-oxidation of CH4 when passing through the top cover [7]. Denmark, for example, has implemented various methods for landfill gas management, such as using CH4 for electric energy and heat, flaring, microbial oxidation of the CH4, and biofilter construction, as regulated by their government [8]. In the USA, the Clean Air Act requires certain landfills to install and operate a gas collection and control system. As a result, many landfill owners voluntarily collect LFG for flaring and take advantage of it as a renewable energy resource. By 2021, 550 LFG-to-energy projects were operating in the USA, producing electricity (70%), direct use (17%), and use as renewable natural gas (RNG) (13%) [9]. Meanwhile, in the United Kingdom (UK), the emission of LFG accounts for about 20% of the country’s total CH4 emissions, and the UK government has regulated GHG emissions policy (WMP 27) by increasing the use of enclosed flares, improving LFG collection efficiency, and increasing the number of LFG utilization projects [10]. However, even with a highly effective LFG collection system in place, some amount of LFG is still released [11], either through the bio-oxidation of CH4 when the landfill surface is covered by soil, leakage of LFG collection system, or the leachate collection system [1].
Collecting the LFG generated from landfill sites for flaring or energy purposes can help reduce fugitive CH4 emissions, thereby reducing direct GHG emissions resulting from landfill management. Moreover, electricity generated from LFG can replace energy from conventional sources like coal and fossil fuel, indirectly reducing CO2 emissions. It is worth noting that not all carbon-containing materials in landfills undergo degradation. Certain degradable carbon compounds persist and can be stored in landfills for an extended period [12,13]. The biogenic carbon storage in landfills brings environmental benefits and should be included in GHG emissions assessments [14]. These avoided emissions can subtract the indirect GHG emissions resulting from landfill operation (e.g. compaction, excavation, and soil cover, which consume diesel), leachate treatment (e.g. water, chemicals, and electricity), and construction (e.g. gravel and synthetic liner) [14]. Studies in European countries have demonstrated that utilizing LFG and carbon sequestration can reduce GHGs as much as overall positive emissions, resulting in net GHG emissions being reduced to zero or even negative values in conventional landfills [15].
In Cambodia, rapid urbanization, coupled with socio-economic development and population growth, has led to a significant increase in MSW generation. Lack of treatment infrastructure, technology, and management has added environmental burden of MSW, particularly in major cities like Phnom Penh. Numerous landfills have been created to accommodate the excessive increase in MSW volumes. Phnom Penh is the most developed city, challenging with a rapid increase in waste disposal. MSW generation in Phnom Penh municipality accounts for about a quarter of the total generation nationwide [16]. In 2022, a daily of 3538 tMSW was collected and sent to a landfill without intermediate treatment. The organic matter with high moisture content is the most predominant waste fraction disposed of at a landfill, accounting for about 56% [17]. The degradation of carbon content in degradable wastes poses a high potential risk, including an increase in global warming through GHG emissions, soil contamination, surface water and groundwater pollution by leachate, human health risks through disease spreading, and fire and explosion hazards by LFG [12,18]. It is important to note that the current landfill is operating without leachate treatment and LFG capture systems, which are mostly found in the majority of cities in Cambodia. Consequently, the study on GHG emissions from a landfill site is very limited in Cambodia. Seng et al. investigated CH4 emissions from a landfill using the IPCC model [18]. However, the researchers considered only the emissions of CH4, which is state of the art in the IPCC model, while the emission of N2O and other NMOC compounds from the landfill and emissions from landfill operations were not included. Carbon storage has the potential to significantly offset GHG emissions from landfills, but it is often overlooked in the studies of GHG emissions from landfill sites.
The MSW landfills in Cambodia are currently experiencing an improving phase due to economic growth and increased environmental awareness among the population. The extraction and treatment of LFG may become increasingly important in the country’s landfill management. Therefore, the data on LFG emissions is essential for developing policies for mitigating the environmental impacts of landfill and designing LFG-to-electricity projects. This study aimed to quantify GHG emissions resulting from MSW landfilling in Phnom Penh municipality for the period of 14 years (2009-2022), considering four different landfill management options.
2. Landfill Gas Generation Investigation Approaches
Several methods have been developed to evaluate LFG generation from disposal sites, including field measurement methods and mathematical models. Field measurement methods, such as flux chambers, tracer gases technique, Horizontal Radial Plume Mapping Optical Remote Sensing (HRPM ORS), inverse modeling technique, differential absorption light detection and ranging (LiDAR), micrometeorological eddy covariance (EC), helicopter-borne spectroscopy, have been used to investigate CH4 collection and fugitive CH4 emissions from landfills [19]. However, these methods are time-consuming and costly and have some uncertainties when measuring in a large-scale landfill due to the spatial and temporal fluctuations in methane flow balance components [1]. Sample site selection and uncontrolled leakage may also lead to uncertainty in on-site measurement [20].
In the meantime, mathematical models have been developed to estimate LFG emissions based on waste disposal data, waste composition, moisture content, landfill cover material, and LFG collection [21]. A significant number of models have been developed over the years and have drawn the attention of many researchers in the industry, including but not limited to the IPCC default model, Modified Triangular method (MTM), Dutch Multiphase First-order model, AMPM, GASSFILL, Scholl Canyon Fir-order model, Rettenberger First-order model, E-PLUS model, Zero-order German EPER model, IPCC First-order model, US EPA Landfill Gas Emissions Model (LandGEM), Afvalzorg model, and Gassim [22]. Among those, LandGEM is widely used for assessing the LFG and other air pollutants from the decomposition of landfilled waste. The model was first developed in 2005 by the US EPA based on a first-order decay (FOD) rate [23]. Users can either input the site-specific data or use the default value if the site-specific data is not available. The default data is based on the empirical data of various landfills in the USA. Another commonly used by many research scholars is the IPCC model, which consists of two methods for quantifying GHG emissions from solid waste disposal sites [4]. Tier 1 method of the IPCC model estimates the CH4 emissions from the mass balance of waste. At the same time, Tier 2 is the FOD method, which produces a high accuracy of the estimated results. Hence, the FOD model is recommended for CH4 emissions estimation. The model estimates CH4 emissions based on waste compositions and assumes a slow degradation of organic matter throughout decades. Challenges in the accuracy of models have been raised associated with the input parameters, including the amount of waste disposed of, the physical composition of landfilled waste, moisture content, temperature, and lag time in gas generation [1]. However, the models have more advantages over field measurement methods when investigating the CH4 emissions in a large-scale landfill [1].
3. Materials and Methods
3.1. Study Area
Phnom Penh municipality had a population of 2,281,951 as of 2019 [24]. Currently, the only active MSW landfill in the city is the Dangkao landfill, which has been in operation since July 2009. The landfill is located about 18 km south of Phnom Penh (11°28'29" N and 104°53'11" E), covering an area of 31.4 ha and dividing into two zones: Zone 1 (consisting of blocks A and B) with a pit depth of 10 m, and Zone 2 (including blocks C and D) with the deepest pit depth of 30 m below the ground surface [25] (Figure 1). Zone 1 was closed and covered with soil in February 2016, while Zone 2 is in operation and partly covered with soil.
3.2. Data Collection
The data of landfilled waste was obtained from the Dangkao landfill office for the period of 14 years, from 2009 to 2022. This historical waste disposal data was used to calculate the landfill gas emissions in the estimation models, namely LandGEM and IPCC FOD models. Daily records of MSW disposal data were available and showed a dramatic increase from 177,224 t/year in 2009 to 1,288,223 t/year in 2022 (see Table 1). In 2022, the MSW collection rate was estimated at 1.34 kg/capita/day, which increased from 0.70 kg/capita/day in 2009.
The physical characteristic of landfilled waste was taken from [17]. As shown in Figure 2, the organic fraction accounted for the highest proportion of disposed of waste, at 55.87%. The second-highest component was recyclables, comprising plastics (21.13%), mixed paper (6.54%), glass (1.42%), and metals (1.05%).
3.3. Landfill Management Scenarios
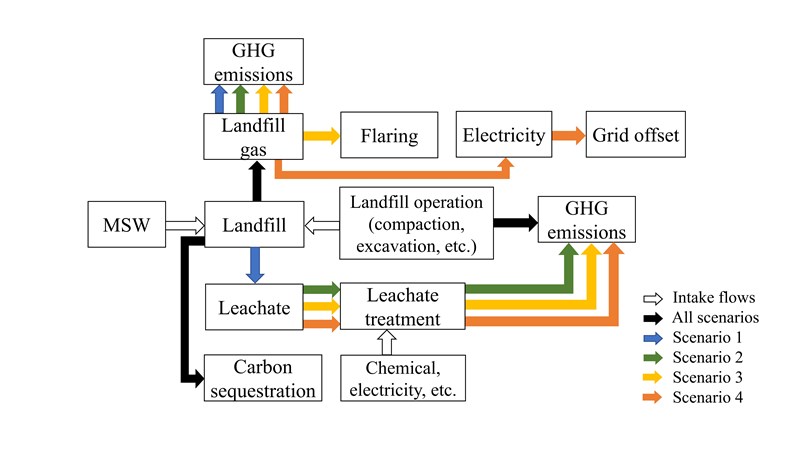
The present management of the Dangkao landfill involves simple dumping without leachate treatment and LFG collection. This method is widely used across the country because it is cost-effective and easy to operate. However, this approach may adversely affect the environment due to LFG emissions and the potential for leachate infiltration that could contaminate soil, surface water, and groundwater resources. Four scenarios for managing the landfill were developed, including the current management practice in scenario 1 (S1), which was compared with three improved scenarios (see Figure 3). In S1, the landfill operates without extracting LFG and treating leachate. The leachate is stored in a lagoon for recirculation without treatment. In this scenario, emissions sources include direct fugitive CH4 emissions that are not captured by the gas capture system as well as emissions from diesel used for heavy-duty equipment, such as excavation and compaction. Biogenic carbon sequestration potential was also taken into account as the landfill’s potential in offsetting GWP. In scenario 2 (S2), landfill management remains the same as in S1, but the leachate is collected and treated instead of recirculated. Indirect GHG emissions from electricity consumption and chemicals used in leachate treatment are additionally included in this scenario. Scenario 3 (S3) is an engineered landfill that is more advanced than S2, as it captures flaring, employs compaction, and implements soil cover frequently. Hence, GHG emissions under S3 are expected to recover 50% of CH4 for flaring. The optimal scenario is presented in scenario 4 (S4), where LFG is captured and utilized for energy production. GHG emissions quantification under S4 is similar to that in the first three scenarios. However, because of the application of LFG-to-energy technology, electricity generation can offset the generation from conventional energy sources. Therefore, indirect GHG emissions saving from electricity substitution are accounted for in S4. In the scenario comparison, the study considered the three main GHGs, such as non-biogenic CO2, CH4, and N2O, using a 100-year GWP of 1, 25, and 298, respectively [4].
3.4. Calculation of LFG Generation
Landfill CH4 generation was calculated using the LandGEM and IPCC FOD models from 2009 to 2022. Different compositions of landfilled waste can generate different amounts of CH4 due to their carbon content. For example, waste containing cellulose degrades quickly under landfill conditions, while waste with lignin decomposes slowly or not at all [14]. The present study only considered wastes that can be degraded, such as organic waste, paper, textiles, nappies, and leather and rubber. Other types of waste were not included in the models’ calculation.
3.4.1. LandGEM Model
The landfill CH4 generation was calculated using the US EPA LandGEM 3.03 model. The model calculates the CH4 gas based on the FOD approach as given in Eq. (1), which considers the degradation of biodegradable matters over time. The model has two important parameters: the CH4 generation rate per year, k, and the CH4 generation potential, L0 (m3/Mg).
where, QCH4 is the annual methane generation in the year of calculation (t/year); i is the one-year time increment; j is the 0.1-year time increment; n is the duration of waste acceptance at the landfill (year); Mi is mass of waste disposed of in year i (t); and ti,j is the time in year jth section of waste Mi accepted (year).
The calculation of CH4 generation potential (Lo) follows Eq. (2).
where, MCF is the CH4 correction factor, taken as 0.8 for unmanaged landfill deeper than 5 m (Table 2); DOC is the degradable organic yielded on the CH4 in landfill gas; DOCf is the fraction of degradable organic carbon which decomposes, taken as 0.77 [4]; F is the fraction of CH4 in landfill gas, taken as 0.5; and 16/12 is the conversion factor from methane to carbon.
The degradable organic carbon (DOC) is calculated using Eq. (3)
where, A is paper and cardboard; B is wood and leaves; C is food waste; and textile and nappies. The value of these waste compositions is presented in Figure 2.
The value of the CH4 generation rate constant (k) reflects the degradation rate of disposed waste composition. The k value in this study is derived from Eq. (4).
where, ki is the degradation rate of decomposable waste composition i and Wi is the fraction of decomposable i. This study used the default values of ki recommended in the IPCC 2006 guidelines for the moist and wet tropical climate region.
3.4.2. IPCC FOD Model
The IPCC FOD model was also employed to estimate the landfill CH4 emissions and compared the result with the LandGEM model. Calculation of CH4 generation using the IPCC OFD model is given as [4].
where, CH4 generated(T) is the CH4 generated in year T; DDOCm decomp(T) is the total mass of Decomposable Degradable Organic Carbon (DDOC) decomposed in landfill in year T; F is the fraction of CH4 by volume in generated landfill gas (0.0–1.0); 16/12 is the molecular weight ratio of CH4/C.
The amount of DDOC decomposed in year T (DDOCm decomp(T)) was calculated as:
where, DDOCma(T-1) is the mass of DDOC accumulated in in the landfill at the end of year T-1 (ton C/year); k is the reaction constant (k (year-1) = ln (2)/t 1/2); t1/2 is the half-life time; DDOCmd(T-1) is the mass of DDOCm deposited into the landfill in year T-1 (ton C/year); W is the mass of waste deposited (tMSW/year); DOC is the degradable organic carbon in the year of deposited (ton C/tMSW).
3.5. Calculation of Energy Recovery Potential
LFG collection cannot be achieve 100% efficiency due to leakage of the gas captured system, methane oxidation in soil cover, or improper cap [11]. Therefore, a 75% CH4 collection efficiency is taken in this study [26]. The energy generation from LFG recovery technology is calculated as follow:
where, ERPLFG is the energy recovery potential from LFG; ρCH4 is the density of CH4 in standard temperature (0.667 t/m3); OF is the oxidation factor of CH4, taken as 10% [4]; LHVCH4 is the low heating value of CH4, taken as 37.2 [27]; ŋ is the electricity conversion efficiency, taken as 30% [1]; λ is the CH4 collection efficiency, taken as 75% [1]; and CF is the capacity factor of an internal combustion engine, taken as 85% [28].
3.6. Calculation of Overall GHG Emissions
3.6.1. Fugitive CH4 Emissions
The landfill in Phnom Penh currently operates without the function of the CH4 capture system, resulting in all generated CH4 being released from the landfill. However, not all the generated CH4 is released into the atmosphere, as a portion of it is oxidized in the topsoil cover. This study used CH4 oxidation rate of 10%, following the IPCC 2006 guidelines. The current landfill operation partially applies soil cover, so this study assumed no CH4 oxidation in scenarios 1 and 2. Fugitive CH4 emissions in these scenarios can be calculated by multiplying the CH4 yield obtained from the LandGEM and IPCC FOD models with GWP for CH4, which is 25. In scenarios 3-4, fugitive CH4 emissions are associated with CH4 collection efficiency, oxidation rate, and CH4 burning out efficiency and are calculated following Eqs. (10-11):
where, EFM is the GHG emissions from the fugitive emissions; FCH4 is the amount of CH4 released from the landfill site; QCH4 is obtained from the LandGEM and IPCC models, and ζ is the burn-out rate of CH4 either by flaring and LFG to energy, taken as 91.1% [29].
3.6.2. Avoided Emissions from Carbon Sequestration
Some biodegradable waste containing biogenic carbon may not be fully degraded even after 100 years of being disposed of in a landfill and may become stored within the landfill body. This biogenic carbon is considered to be sequestered within the landfill and should be counted as emission savings in the quantification process [30]. This study included the avoided emissions from carbon sequestration, following [14,15,30], and can be calculated as follows [31]:
where, ECS is the GHG emissions saving because of carbon sequestered in the landfill; CSF is the carbon sequestered factor (kg C/tMSW).
3.6.3. N2O Emissions
N2O and other volatile organic compounds (VOCs) emitted from landfills also contribute to the GWP. However, VOCs are typically found in very low concentrations and are not considered in GHG accounting [30]. N2O emission from landfills is unavailable in LandGEM or IPCC waste models. However, N2O contributes significantly to GWP because its impact is 298 times higher than CO2 [4], and its atmospheric lifetime is up to 120 years, which needs to be reduced [32]. Therefore, it should be considered, even though it is negligible [18]. N2O generation has been found to have a significant relationship with CH4 in the waste layer, and landfills in tropical climate zones exhibit higher N2O emissions [33]. According to Yang et al. [30], the emission factor for N2O ranges from 0.5 to 2 g/kg of CH4 emitted. Therefore, this study assumes an N2O generation rate of 2 g/kg of CH4 due to our climatic zone, and it can be calculated as follows:
where, EN2O is the GHG emissions due to the emissions of N2O (kg CO2-eq/tMSW); EFN2O is the emission factor for N2O, taken as 2 g/kg of fugitive CH4 [30]; and GWPN2O is the global warming potential of N2O, taken as 298 [4].
3.6.4. Emissions from Landfill Operation
GHG emissions from landfill operations result from the consumption of electricity, diesel, and auxiliary materials such as HDPE and gravel, which are used for liner, leachate collection, and LFG capture systems. Currently, the landfill operation only uses diesel to power heavy-duty equipment like excavators, bulldozers, etc. The daily amount of diesel fuel used for this purpose is 1435 L, equivalent to 0.43 L/tMSW. However, additional diesel is required for daily on-site operations when upgrading the landfill with leachate treatment and LFG collection systems. In the absence of available data, this study adopts the average values reported in Manfredi et al. [15] study, which are 2 L/tMSW of diesel used for daily operation in scenarios 2-4, and 5, 8, and 12 kWh/tMSW of electricity for scenario 2, 3, and 4, respectively. Other auxiliary materials, such as HPDE liner and gravel, are used under scenarios 2-4 and are taken as 1 and 100 kg/tMSW, respectively. To calculate GHG emissions from landfill operations, the following eq. can be used [30]:
where, ELO is the emissions from the operation process of landfill (kg CO2-eq/tMSW); Ai, LO is the amount of the ith auxiliary material or energy used during landfill operation; and EFi is the emission factors for the provision of the ith auxiliary material or energy and presented in Table 3.
3.6.5. Emissions from Leachate Treatment
GHG emissions from leachate treatment are mainly from electricity, water, and chemical (HCl and NaOH) consumption in the leachate treatment process. The emissions from leachate treatment are calculated following [30] and given in Eq. (16).
where, ELT refers to the emissions from leachate treatment (kg CO2-eq/tMSW); L, λ, W, Ci, and EC represents the leachate generated over 100 years of landfilling (2.2527m3/tMSW); the leachate collection efficiency for treatment ( 40%); water used for leachate treatment (83 L/m3 leachate), the chemicals used for leachate treatment (3 and 5 kg/m3 leachate for HCl and NaOH, respectively), and electricity consumption for treating leachate (14.24 kWh/t leachate) [30]. The emission factors for water (EFw), chemicals (EF ci), and electricity (EFgrid) are shown in Table 3.
3.6.6. Calculation of Avoided Emissions from Electricity Substitution
Energy generated from landfill CH4 is used to replace electricity generated from conventional fuels. GHG emissions saving from electricity substitution is calculated as below:
3.6.7. Calculation of Overall Emissions from Landfill Management Technologies
The overall GHG emissions from different landfill management under the four scenarios can be calculated as:
where, EGHGs is the total GHG emissions from the landfill management process.
3.7. Determination of Uncertainty in CH4 Emissions Estimation
According to IPCC [4], estimation of CH4 emissions involves potential uncertainty stemming from both activity data and parameters. Our study addressed the uncertainties in activity data by examining the variability of waste composition (±30%). Additionally, we evaluated parameter uncertainties by accounting for the uncertainty resulting from MCF (±20%) and the fraction of CH4 in generation LFG (±5%).
4. Results and Discussion
4.1. Estimation of CH4 Generation
The CH4 generation from the Dangkao landfill was estimated using the IPCC FOD method and LandGEM model based on available data of landfilled waste recorded at the landfill from 2009 to 2022. The LandGEM model typically considers the most common three landfill gases, CH4, CO2, and NMOC. However, since CO2 is of biogenic origin and NMOC levels are negligible (less than 0.1% compared to CH4), they are not included in GHG emissions quantification. Meanwhile, the IPCC FOD model potentially estimates the CH4, while CO2 and other gases are excluded from the model.
LFG estimated by the LandGEM model reliant on two main parameters: CH4 generation constant rate (k) and CH4 generation potential (L0). The k value is influenced by several factors, including waste composition, moisture content, temperature, waste depth, density, pH, and other environmental conditions [2,35]. Different waste compositions have varying degradation rates [2]. This study estimated a k value of 0.21 per year, which falls within the range of other studies [2,36,37]. Machado et al. conducted field measurements and laboratory tests on landfilled MSW in Brazil and found a good agreement of k value at 0.21 [2]. Meanwhile, Wangyao et al. [36] and Anh et al. [37] obtained relatively higher decay rates (k) from field measurements in Thailand and Vietnam at 0.33 and 0.355 per year, respectively. The LandGEM model recommends a default value of k ranging from 0.02 to 0.7 per year, while the IPCC-recommended default value for tropical areas is 0.17 per year for bulky waste [4].
The CH4 generation potential (L0) was calculated using the IPCC method. A value of 90 m3/t was obtained, which is higher than that reported in Vietnam [37] due to the higher organic fraction of MSW in Phnom Penh. However, the estimated L0 value for Phnom Penh is lower than the recommended of 96 m3/t for the inventory wet landfill in the LandGEM model. Overall, k and L0 values obtained in this study fall within the ranges reported for other landfills operating in tropical regions, as shown in Table 4.
The Dangkao landfill received 177,224 tMSW in 2009 and increased to 1,288,223 tMSW in 2022. As depicted in Figure 4a, CH4 generation rapidly increased in the early stage over time as MSW accumulated in the landfill. Potential landfill CH4 generation was 1.54 and 2.17 M kg in 2010, increasing to 36.50 and 42.83 M kg in 2022, respectively, as calculated by the LandGEM and IPCC FOD models. Assuming the landfill closure in 2022, both models showed a similar trend in CH4 generation, although the IPCC FOD model produced relatively higher results. CH4 emissions are expected to peak in 2023 and then rapidly decline thereafter. The LandGEM model predicted lower CH4 generation than the IPCC FOD model. The results from both models indicate the rapid degradation of degradable matter due to the high moisture content of waste, leading to the production of more LFG in a short period, as typically found in tropical regions [2,36,37]. Many Asian countries are known to produce high levels of LFG emissions, mainly due to the large amounts of food waste in their waste streams, the moist tropical climate, and the high precipitation in this region [41]. In contrast, the LFG generation rate in most European countries is lower due to the high proportion of slowly degradable fractions such as paper, wood, and yard waste, which take longer to decompose [42]. In addition, the temperate climates and lower precipitation levels in Europe significantly impact emissions from solid waste disposal sites [41].
Between 2010 and 2022, CH4 emissions from the Dangkao landfill totaled 248 M kg, with an average emission of 18 M kg/year according to the LandGEM model, and 299 M Kg CH4, with an average annual emission of 21 M kg according to the IPCC FOD model (Figure 4b). A study by Anh et al. conducted in Vietnam using the LandGEM model found that the average CH4 generation in the Nam Binh Duong landfill was 2 M kg/year, which is lower than the results of the present study [37]. However, Chiemchaisri et al. assessed the CH4 generation from two landfills in Bangkok, Thailand, and obtained a higher value of approximately 55 M kg/year [43]. The results of landfill CH4 emissions can vary depending on landfill management practices, the amount of waste, and the fraction of disposed waste [44]. Ghosh et al. estimated CH4 generation from three landfill sites in Delhi and found that the LandGEM model predicted over twice as much as CH4 compared to the IPCC FOD model, which is in contrast to the present study’s findings [20]. Gollapalli and Kota [45] investigated LFG emissions from a landfill in India using a flux chamber and compared them with results calculated in the Modified Triangular Method (MTM), IPCC default model, and LandGEM model. Their study found that MTM, IPCC default model, and LandGEM model predicted 1.9, 1.4, and 1.6 times higher than that measured on-site. Furthermore, Chakraborty et al. compared the simulation results using the IPCC default model, MTM, and FOD model and found that the FOD model gave a better result, which is comparable with that measured in the field [46]. Based on these previous studies, using the models to predict LFG is more likely to obtain a higher result than the field measurement. Ghosh et al. pointed out that a lower CH4 measured on-site may be due to uncertainties in sampling selection and unaccounted-for uncontrolled emissions [20]. However, Amini et al. noted that the LandGEM model underestimates CH4 production [21]. Kumar and Sharma compared several landfill models and concluded that LandGEM is the most advantageous model due to its ability to provide accurate results [47].
4.2. Estimation of Energy Recovery Potential from LFG Recovery
The generation of biomethane from a landfill can be used for power production, direct use and upgrade for fueling vehicle [12]. This study focuses on the use of biomethane for electricity generation. As shown in Table 5, based on the LandGEM model, the energy generation potential ranging from 4.10 to 97.31 GWh, with an average of 50.89 GWh/year between 2010 and 2022. On other hand, the IPCC FOD model suggests an energy potential ranging from 5.78 to 114.18 GWh, with an average of 61.27 GWh/year during the same period. Considering the commonly used internal combustion engine (ICE) technology, which is capable of operating 24 hours/day, 7 days a week, the plant capacity would be approximately 6–7 MW. According to IGES [34], the emission factor for the national grid in Cambodia is 0.586 kg CO2-eq/kWh. Therefore, the electricity generation from LFG recovery could avoid approximately 30–36 M kg CO2-eq/year of GHG generated by the electricity sector in the country.
4.3. Quantification of Emission Factors for Different Landfill Scenarios
In this section, all values are expressed per ton of MSW and converted to Carbon Dioxide Equivalent (CO2-eq) using 100-year GWP of 25 and 298 for CH4 and N2O, respectively. The CH4 generation estimated by the LandGEM and IPCC FOD models from 2009 to 2022 was approximately 32.8 and 39.95 kg CH4/tMSW, respectively. These values were used to quantify emission factors for different landfill management technologies. Landfills have direct GHG emissions due to the degradation of decomposable wastes under landfill conditions and the operation of the landfill site, as well as indirect emissions from the construction and installation of landfill equipment. Emission factors associated with landfill technologies under four selected scenarios were calculated and presented in Table 6. Biogenic CO2 emissions resulting from waste degradation in the landfill were not included in the GHG emissions accounting models. In contrast, carbon sequestration and electricity substitution providing environmental benefits of the landfill were taken into account in the model calculation. The table indicates the emission factors for the four landfill management scenarios. S2 has the highest emissions, with net GHG emissions of 757.72 and 941.49 kg CO2-eq/tMSW, according to the LandGEM and IPCC FOD models, respectively. The factor that led to higher emissions in S2 over the present landfill management scenario (S1) was mainly associated with the application of leachate treatment that requires the installation of liner materials and the use of chemicals and electricity for leachate treatment, which were not available in S1. This result is comparable to that found in China, 619.5–940.7 kg CO2-eq/tMSW, when applying the same landfill management practices and excluding the collection and transportation of MSW [30]. The main reason for a similar result between the two countries could be associated with a high CH4 generation due to waste characteristics (about 55% of the organic waste). Carbon sequestration in the landfill was quantified and considered a negative emission. Carbon sequestration amounts depend on the quantity and waste composition buried in the landfill. In the present study, carbon sequestration was estimated at approximately ˗104.51 kg CO2-eq/tMSW, which falls within the range reported by other studies [14,30].
4.4. Overall GHG Emissions from 2009 to 2022
To quantify overall GHG emissions from the Dangkao landfill from 2009 to 2022, the emissions factors for landfilling options in section 4.3 were used to calculate the total emissions by multiplying them with the amount of annual MSW disposal. As seen in Figure 5, fugitive CH4 emissions contribute significantly to the impact of global warming because its global warming potential is 25 times greater than that of CO2. Fugitive CH4 emissions contributed the most to overall GHG emissions in all scenarios. Among those, the shared GHG emissions from fugitive CH4 was highest in S1 (98%), while they were lowest in S4 (86%). These high emissions are mainly associated with organic composition in landfilled MSW [48]. Other contributors to GHG emissions from landfill management technologies were N2O emission, leachate treatment, and landfill operation. The second-highest emissions came from leachate treatment, which consumed more electricity, injected waster, and chemical inputs. When quantifying overall GHG emissions from landfill site, not only the direct emissions from the landfill operation and leachate treatment are taken into consideration, but also the emission avoidance from carbon sequestration and emission savings from electricity recovery (in S4).
Figure 6 indicates that the overall GHG emissions resulting from current landfill management practices (S1) between 2009 and 2022 were 397 and 496 M kg CO2-eq/year, as determined by the LandGEM and IPCC FOD models, respectively. With the implementation of leachate collection and treatment in S2, GHG emissions increased and averaged 409 M kg CO2-eq/year for the LandGEM and 509 M kg CO2-eq/year for the IPCC FOD model. Although the simple dumping in S1 resulted in lower GHG emissions than S2, it has the potential to pollute groundwater with untreated leachate that can seep through the soil. In contrast, S2 involves installing liners and regularly applying soil cover, which can reduce liquid penetration through the waste and decrease leachate generation by approximately 50% [30]. Given that fugitive CH4 emissions are a key contributor to GHG emissions from landfills, reducing these emissions through LFG-capturing systems for flaring or electricity generation could minimize their potential contribution to global warming [12]. S3 involves installing an LFG collection system for flaring, which can potentially reduce GHG emissions. According to the LandGEM model, S3 resulted in an average of 182 M kg CO2-eq/year emission. In contrast, the value calculated based on the IPCC FOD model was higher, at 231 M kg CO2-eq/year, which is reduced by at least 55%. Previous research has shown that LFG capture systems can mitigate GHG emissions by approximately 50% [48]. On the other hand, S4 is the most effective option for reducing GHG emissions. This scenario involves capturing and utilizing landfill CH4 as a renewable energy source for generating electricity, thereby offsetting emissions from conventional high-emission energy sources. GHG emissions in S4 were 623 and 86 M kg CO2-eq/year, based on the LandGEM and IPCC FOD models, respectively, reduced by at least 83%. Therefore, S4 is a promising approach for reducing GHG emissions from landfill management. Installing these systems requires financial resources and technical expertise, which are currently unavailable in the city. While generating renewable energy generated from CH4 has the potential to generate income, it is unclear whether the LFG-to-energy project would be economically feasible for Phnom Penh.
4.5. Uncertainty Assessment
Based on the above findings, we can see that landfill CH4 predominately contributes to GHG emissions from landfill management. Therefore, uncertainty in CH4 estimation could influence GHG emissions accounting. Uncertainty in predicting landfill CH4 emissions is caused by a lack of precise and reliable data [4]. One of the main uncertainties in data is the characteristics of landfilled MSW. The composition of MSW disposal can vary over time, which can be influenced by factors such as consumption habits, income status, socio-economic, etc. [16]. Another factor that can affect MSW characteristics is improving the waste collection system and proper source segregation. The changing composition of MSW can influence the total amount of DOC in the landfill [4], which in turn affects the estimation of CH4 emissions. The uncertainty in CH4 emissions due to MSW composition has been estimated to be around ±30%, as recommended by the IPCC 2006 guidelines. As shown in Figure 7, the LandGEM and IPCC FOD models have shown different uncertainty levels in predicting CH4 emissions when variating waste composition. The LandGEM model indicated that CH4 yields could be doubled if increasing decomposable waste by 30%, while reducing biodegradable waste by 30% could decrease landfill CH4 generation by 45%. Meanwhile, the IPCC FOD model showed a lower rate of CH4 variation when fluctuating waste composition. Decreasing biodegradable waste composition by 30% resulted in reduced CH4 yields by 28%, and vice versa. This clearly indicates the influence of MSW characteristics, particularly food waste, on landfill CH4 generation. Therefore, minimizing the landfilling of degradable waste reduces the enormous amount of landfill CH4.
Another source of uncertainty in CH4 prediction is associated with the selection of landfill types. The present study selected an unmanaged-deep landfill (MCF=0.8) due to the landfill pit is 10–30 m of depth. The LandGEM model showed that shifting the MCF to 0.6 for uncategorized landfill reduced CH4 generation potential by 17%. However, increasing MCF to 1 for managed-aerobic landfill increased CH4 potential by 33%. In the IPCC FOD model, the uncertainty caused by variation in the MCF resulted in a variation of CH4 emissions ±25%.
According to IPCC [4], the fraction of CH4 in generated LFG can be vary ±5% from the default value of 50%, depending on several factors. The uncertainty in CH4 emissions resulted from variations in CH4 content ranging between 19 and 24 M kg/year based on the IPCC FOD model. Therefore, the availability of data can have a significant impact on the output value, as indicated by the results that uncertainty in available data can lead to huge variations in results [20].
5. Conclusions
This study estimated CH4 generation from the Dangkao landfill in Phnom Penh, as well as its potential to generate electricity and the resulting GHG emissions resulting from different landfill management practices. Firstly, landfill CH4 generation was predicted for the year 2009 to 2022 using two well-known models, namely LandGEM and IPCC FOD models. Both models indicated a similar trend of rapid CH4 degradation soon after disposal, but the LandGEM model produced lower estimates than the IPCC FOD model. Landfill CH4 generation was estimated at approximately 18 and 21 M kg/year based on the LandGEM and IPCC FOD models, respectively. The CH4 generated has the potential to produce an average of 51–61 GWh/year of electricity. In quantifying net GHG emissions, four landfill management scenarios were proposed. S1 represented the current situation with no leachate treatment and no landfill gas collection, while S2 involved leachate treatment but no landfill gas collection. S3 and S4 included leachate treatment and LFG collection for flaring and electricity production. GHG emissions in S2 were highest, averaging 409 and 509 M kg CO2-eq/year according to the LandGEM and IPCC FOD models, respectively. The high emissions in S2 were mainly due to additional emissions from the leachate treatment process. However, through LFG collection for flaring and electricity production, S3 and S4 could significantly reduce GHG emissions by at least 55% and 83%, respectively. Estimating CH4 emissions from landfills can be challenging due to factors such as waste composition, selection of proper landfill type, and CH4 content in LFG. Therefore, field measurements of CH4 emissions are necessary to validate the model calculations and reduce uncertainty. S4 was the most favorable option for GHG mitigation and energy recovery. Further study is needed to evaluate the economic feasibility of the LFG recovery project.
Author Contributions
Conceptualization, methodology, software, formal analysis, data curation, writing—original draft preparation, D.V.P.; validation, writing—review and editing, D.V.P., N.V.Q., V.N. and T.D.X.; supervision, N.V.G. and T.D.X. All authors have read and agreed to the published version of the manuscript.
Funding
This research received no external funding.
Institutional Review Board Statement
Not applicable.
Informed Consent Statement
Not applicable.
Data Availability Statement
Not applicable.
Acknowledgments
The authors thank the Project for Human Resource Development Scholarship (JDS) for providing a scholarship for D.V.P.
Conflicts of Interest
The authors declare no conflict of interest.
References
- Amini, H.R.; Reinhart, D.R.; Niskanen, A. Comparison of First-Order-Decay Modeled and Actual Field Measured Municipal Solid Waste Landfill Methane Data. Waste Manag. 2013, 33, 2720–2728. [Google Scholar] [CrossRef] [PubMed]
- Machado, S.L.; Carvalho, M.F.; Gourc, J.P.; Vilar, O.M.; do Nascimento, J.C.F. Methane Generation in Tropical Landfills: Simplified Methods and Field Results. Waste Manag. 2009, 29, 153–161. [Google Scholar] [CrossRef] [PubMed]
- Bogner, J.; Ahmed, M.A.; Diaz, C.; Faaij, A.; Gao, Q.; Hashimoto, S.; et al. Waste Management, in Climate Change 2007: Mitigation. Contribution of Working Group III to the Fourth Assessment Report of the Intergovernmental Panel on Climate Change. Metz, B., Davidson, O.R., Bosh, P.R., Dave, R., Meyer. L.A., Eds; Cambridge University Press: United Kingdom and New York, NY, USA, 2007. [Google Scholar]
- Intergovernmental Panel on Climate Change. 2006 IPCC Guidelines for National Greenhouse Gas Inventories, Prepared by the National Greenhouse Gas Inventories Programme; Eggleston, H.S., Buendia, L., Miwa, K., Ngara, T., Tanabe, K., Eds.; IGES: Kanagawa, Japan, 2006; Volume 5. [Google Scholar]
- Lizik, W.; Im, J.; Semrau, J.D.; Barcelona, M.J. A Field Trial of Nutrient Stimulation of Methanotrophs to Reduce Greenhouse Gas Emissions from Landfill Cover Soils. J Air Waste Manag Assoc. 2013, 63, 300–309. [Google Scholar] [CrossRef] [PubMed]
- Spokas, K.A.; Bogner, J.; Corcoran, M. Modeling Landfill CH4 Emissions: CALMIM International Field Validation, using CALMIM to Simulate Management Strategies, Current and Future Climate Scenarios. Elem Sci Anthr. 2021, 9, 1–20. [Google Scholar] [CrossRef]
- Mohsen, R.A.; Abbassi, B.; Zytner, R. Investigation of Fugitive Methane and Gas Collection Efficiency in Halton Landfill in Ontario, Canada. Environ Monit Assess. 2020, 192, 326. [Google Scholar] [CrossRef]
- Scheutz, C.; Kjeldsen, P. Guidelines for Landfill Gas Emission Monitoring Using the Tracer Gas Dispersion Method. Waste Manag. 2019, 85, 351–360. [Google Scholar] [CrossRef]
- US EPA. Landfill Gas Energy Cost Model; Landfill Methane Outreach Program (LMOP), U.S. Environmental Protection Agency: Washington, DC, USA, 2016. [Google Scholar]
- Environment Agency. Guidance on Landfill Gas Flaring Version 2.1; Environment Agency: Bristol, UK, 2002. [Google Scholar]
- Barlaz, M.A.; Chanton, J.P.; Green, R.B. Controls on Landfill Gas Collection Efficiency: Instantaneous and lifetime performance. J Air Waste Manag Assoc. 2009, 59, 1399–1404. [Google Scholar] [CrossRef]
- Kumar, A.; Sharma, M.P. GHG Emission and Carbon Sequestration Potential from MSW of Indian Metro Cities. Urban Clim. 2014, 8, 30–41. [Google Scholar] [CrossRef]
- Barlaz, M.A.; Eleazer, W.E.; Odle, W.S., III; Qian, X.; Wang, Y-S. Biodegradative Analysis of Municipal Solid Waste in Laboratory-Scale Landfills; US EPA: Springfield, USA, 1997. [Google Scholar]
- Friedrich, E.; Trois, C. GHG Emission Factors Developed for the Collection, Transport and Landfilling of Municipal Waste in South African Municipalities. Waste Manag. 2013, 33, 1013–1026. [Google Scholar] [CrossRef]
- Manfredi, S.; Tonini, D.; Christensen, T.H.; Scharff, H. Landfilling of Waste: Accounting of Greenhouse Gases and Global Warming Contributions. Waste Manag Res. 2009, 27, 825–836. [Google Scholar] [CrossRef]
- Dek, V.P.; Nguyen, V.Q.; Tran, D.K.; Tran, D.X. Challenges and Priorities of Municipal Solid Waste Management in Cambodia. Int J Environ Res Public Heal. 2022, 19, 8458. [Google Scholar] [CrossRef]
- Seng, B.; Fujiwara, T.; Seng, B. Suitability Assessment for Handling Methods of Municipal Solid Waste. Glob J Environ Sci Manag. 2018, 4, 113–126. [Google Scholar] [CrossRef]
- Seng, B.; Hirayama, K.; Katayama-Hirayama, K.; Ochiai, S.; Kaneko, H. Scenario Analysis of the Benefit of Municipal Organic-Waste Composting Over Landfill, Cambodia. J Environ Manage. 2013, 114, 216–224. [Google Scholar] [CrossRef] [PubMed]
- Babilotte, A.; Lagier, T.; Fiani, E. Fugitive Methane Emissions from Landfills: Field Comparison of Five Methods on a French Landfill. J Environ Eng. 2010, 136, 777–784. [Google Scholar] [CrossRef]
- Ghosh, P.; Shah, G.; Chandra, R.; Sahota, S.; Kumar, H.; Vijay, V.K.; et al. Assessment of Methane Emissions and Energy Recovery Potential from the Municipal Solid Waste Landfills of Delhi, India. Bioresour Technol. 2019, 272, 611–615. [Google Scholar] [CrossRef]
- Amini, H.R.; Reinhart, D.R.; Mackie, K.R. Determination of First-Order Landfill Gas Modeling Parameters and Uncertainties. Waste Manag. 2012, 32, 305–316. [Google Scholar] [CrossRef]
- Majdinasab, A.; Zhang, Z.; Yuan, Q. Modelling of Landfill Gas Generation: A Review. Rev Environ Sci Biotechnol. 2017, 16, 361–380. [Google Scholar] [CrossRef]
- Alexander, A.; Burklin, C.; Singleton, A. Landfill Gas Emissions Model (LandGEM) Version 3.02 User’s Guide; US EPA: Washington, DC 20460, USA, 2005. [Google Scholar]
- National Institute of Statistics. General Population Census of the Kingdom of Cambodia 2019. 2020. (accessed on 20 September 2021).
- Xaypanya, P.; Takemura, J.; Chiemchaisri, C. , Seingheng, H.; Tanchuling, M.A.N. Characterization of Landfill Leachates and Sediments in Major Cities of Indochina Peninsular Countries—Heavy Metal Partitioning in Municipal Solid Waste Leachate. Environments. 2018, 5, 65. [Google Scholar] [CrossRef]
- Cudjoe, D.; Han, M.S.; Chen, W. Power generation from municipal solid waste landfilled in the Beijing-Tianjin-Hebei region. Energy. 2021, 217, 119393. [Google Scholar] [CrossRef]
- Ayodele, T.R.; Ogunjuyigbe, A.S.O.; Alao, M.A. Life Cycle Assessment of Waste-to-Energy (Wte) Technologies for Electricity Generation using Municipal Solid Waste in Nigeria. Appl Energy. 2017, 201, 200–218. [Google Scholar] [CrossRef]
- Hadidi, L.A.; Omer, M.M. A Financial Feasibility Model of Gasification and Anaerobic Digestion Waste-to-Energy (WTE) Plants in Saudi Arabia. Waste Manag. 2017, 59, 90–101. [Google Scholar] [CrossRef] [PubMed]
- Plant, G.; Kort, E.A.; Brandt, A.R.; Chen, Y.; Fordice, G.; Negron, A.M.G.; et al. Inefficient and Unlit Natural Gas Flares Both Emit Large Quantities of Methane. Science. 2022, 377, 1566–1571. [Google Scholar] [CrossRef] [PubMed]
- Yang, N.; Zhang, H.; Shao, L.M.; Lü, F.; He, P.J. Greenhouse Gas Emissions during MSW Landfilling in China: Influence of Waste Characteristics and LFG Treatment Measures. J Environ Manage. 2013, 129, 510–521. [Google Scholar] [CrossRef] [PubMed]
- 31. EPE. Protocol for the quantification of greenhouse gas emissions from waste management activities, Version 5.0, Entreprises pour L’Environnement: Paris, France, 2013.
- Intergovernmental Panel on Climate Chante. The Science of Climate Change: Contribution of Working Group I to the Second Assessment Report of the Intergovernmental Panel on Climate Change. 1995.
- Ishigaki, T.; Nakagawa, M.; Nagamori, M.; Yamada, M. Anaerobic Generation and Emission of Nitrous Oxide in Waste Landfills. Environ Earth Sci. 2016, 75, 1–6. [Google Scholar] [CrossRef]
- Institute for Global Environmental Strategies. List of grid emission factors. https://doi.org/10.57405/iges-1215. (accessed on 10 December 2022).
- Garg, A.; Achari, G.; Joshi, R.C. A Model to Estimate the Methane Generation Rate Constant in Sanitary Landfills using Fuzzy Synthetic Evaluation. Waste Manag Res. 2006, 24, 363–375. [Google Scholar] [CrossRef]
- Wangyao, K.; Yamada, M.; Endo, K.; Ishigaki, T.; Naruoka, T.; Towprayoon, S.; et al. Methane Generation Rate Constant in Tropical Landfill. J Sustain Energy Environ. 2010, 1, 181–184. [Google Scholar]
- Anh, L.H.; Thanh, T.N.T.; Tuyen, N.T.K.; Bang, H.Q.; Son, N.P.; Schneider, P.; et al. Site-Specific Determination of Methane Generation Potential and Estimation of Landfill Gas Emissions from Municipal Solid Waste Landfill: A Case Study in Nam Binh Duong, Vietnam. Biomass Convers Biorefinery. 2021, 12, 3491–3502. [Google Scholar] [CrossRef]
- Abushammala, M.F.M.; Basri, N.E.A.; Kadhum, A.A.H.; Basri, H.; El-Shafie, A.H.; Sharifah, M.S.A. Evaluation of Methane Generation Rate and Potential from Selected Landfills in Malaysia. Int J Environ Sci Technol. 2014, 11, 377–384. [Google Scholar] [CrossRef]
- Srivastava, A.N.; Chakma, S. Quantification of Landfill Gas Generation and Energy Recovery Estimation from the Municipal Solid Waste Landfill Sites of Delhi, India. Energy Sources, Part A Recover Util Environ Eff. 2020; 1–14. [Google Scholar] [CrossRef]
- Ramprasad, C.; Teja, H.C.; Gowtham, V.; Vikas, V. Quantification of Landfill Gas Emissions and Energy Production Potential in Tirupati Municipal Solid Waste Disposal Site by LandGEM Mathematical Model. MethodsX. 2022, 9, 101869. [Google Scholar] [CrossRef]
- Ishigaki, T.; Hirata, O.; Oda, T.; Wangyao, K.; Chiemchaisri, C.; Towprayoon, S.; et al. Greenhouse Gas Emission from Solid Waste Disposal Sites in Asia. In Integrated Waste Management, Kumar, S., Eds; IntechOpen: London, United Kingdom, 2011; Volume 2, pp. 462–72. [Google Scholar] [CrossRef]
- Christensen, T.H.; Manfredi, S.; Knox, K. Landfilling: Reactor Landfills. In Solid Waste Technology & Management, Christensen, T.H., Eds; John Wiley & Sons: United Kingdom; 2010. [CrossRef]
- Chiemchaisri, C.; Juanga, J.P.; Visvanathan, C. Municipal Solid Waste Management in Thailand and Disposal Emission Inventory. Environ Monit Assess. 2007, 135, 13–20. [Google Scholar] [CrossRef]
- Fallahizadeh, S.; Rahmatinia, M.; Mohammadi, Z.; Vaezzadeh, M.; Tajamiri, A.; Soleimani, H. Estimation of Methane Gas by LandGEM Model from Yasuj Municipal Solid Waste Landfill, Iran. MethodsX. 2019, 6, 391–398. [Google Scholar] [CrossRef]
- Gollapalli, M.; Kota, S.H. Methane Emissions from a Landfill in North-East India: Performance of Various Landfill Gas Emission Models. Environ Pollut. 2018, 234, 174–180. [Google Scholar] [CrossRef]
- Chakraborty, M.; Sharma, C.; Pandey, J.; Singh, N.; Gupta, P.K. Methane Emission Estimation from Landfills in Delhi: A Comparative Assessment of Different Methodologies. Atmos Environ. 2011, 45, 7135–7142. [Google Scholar] [CrossRef]
- Kumar, A.; Sharma, M.P. Estimation of GHG Emission and Energy Recovery Potential from MSW Landfill Sites. Sustain Energy Technol Assessments. 2014, 5, 50–61. [Google Scholar] [CrossRef]
- Nordahl, S.L.; Devkota, J.P.; Amirebrahimi, J.; Smith, S.J.; Breunig, H.M.; Preble, C.V.; et al. Life-Cycle Greenhouse Gas Emissions and Human Health Trade-Offs of Organic Waste Management Strategies. Environ Sci Technol. 2020, 54, 9200–9209. [Google Scholar] [CrossRef] [PubMed]
Figure 1.
Map of the study area.
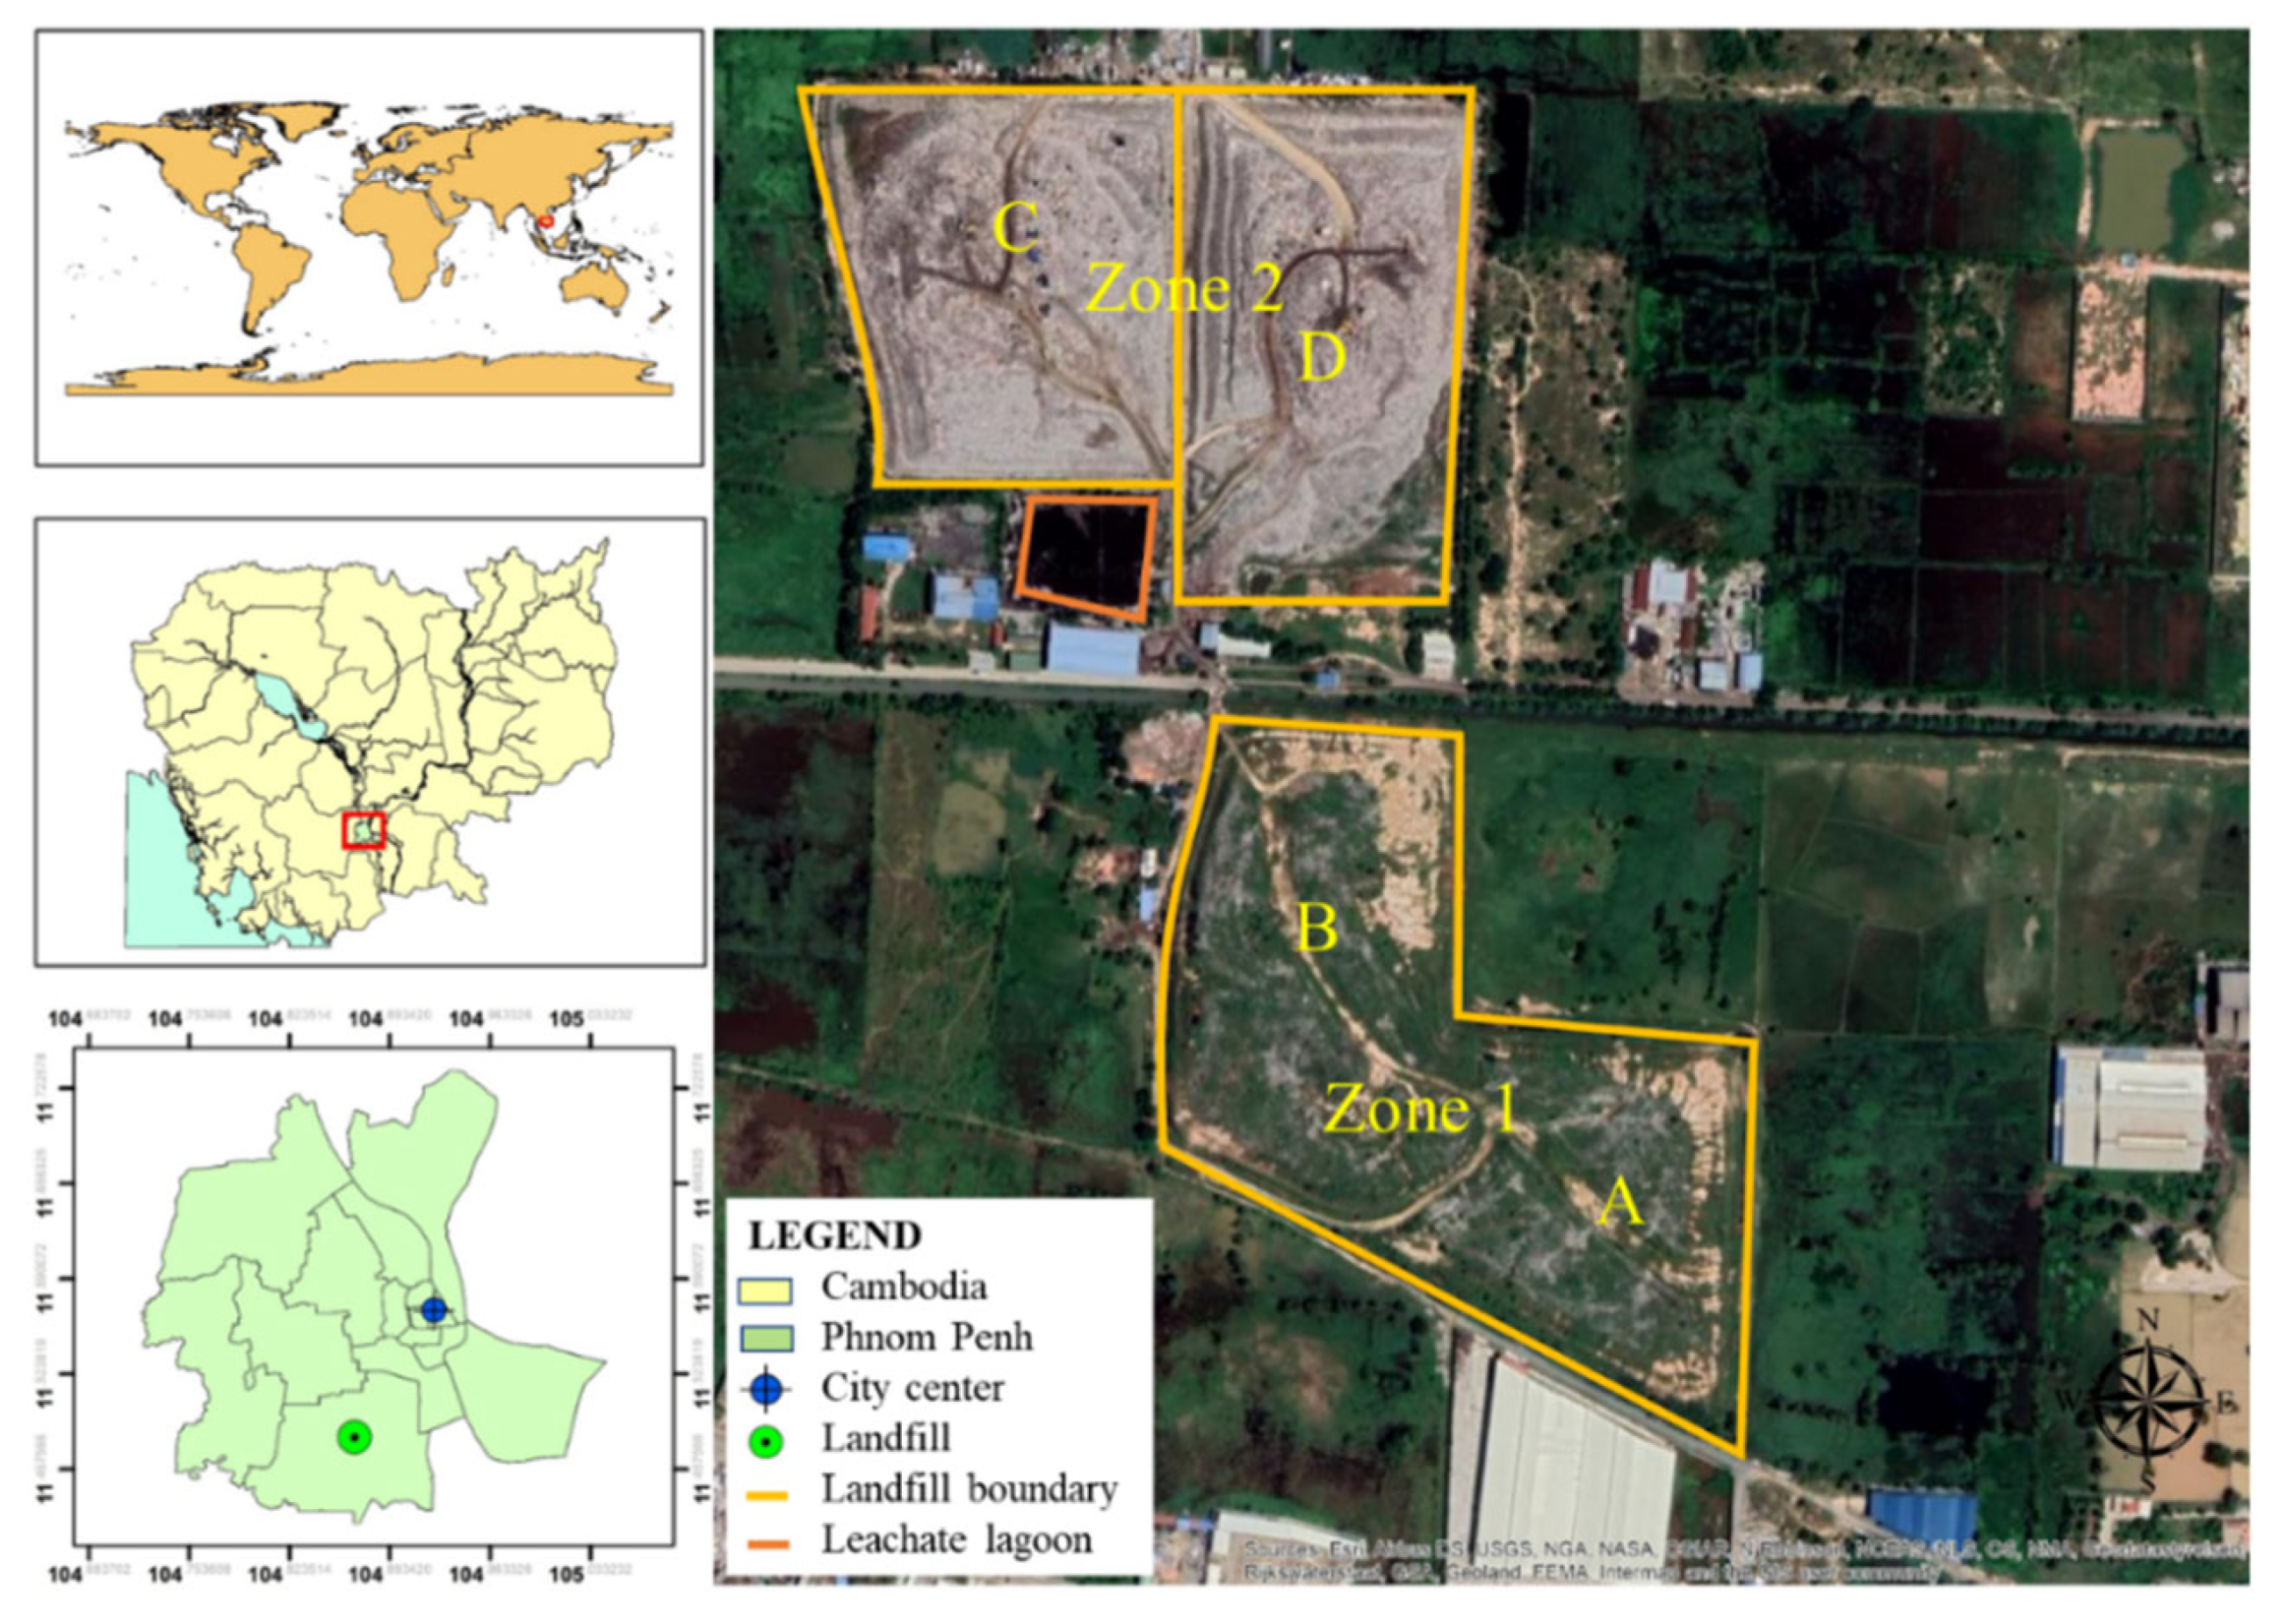
Figure 2.
Landfilled municipal solid waste composition in Phnom Penh [17].
Figure 2.
Landfilled municipal solid waste composition in Phnom Penh [17].
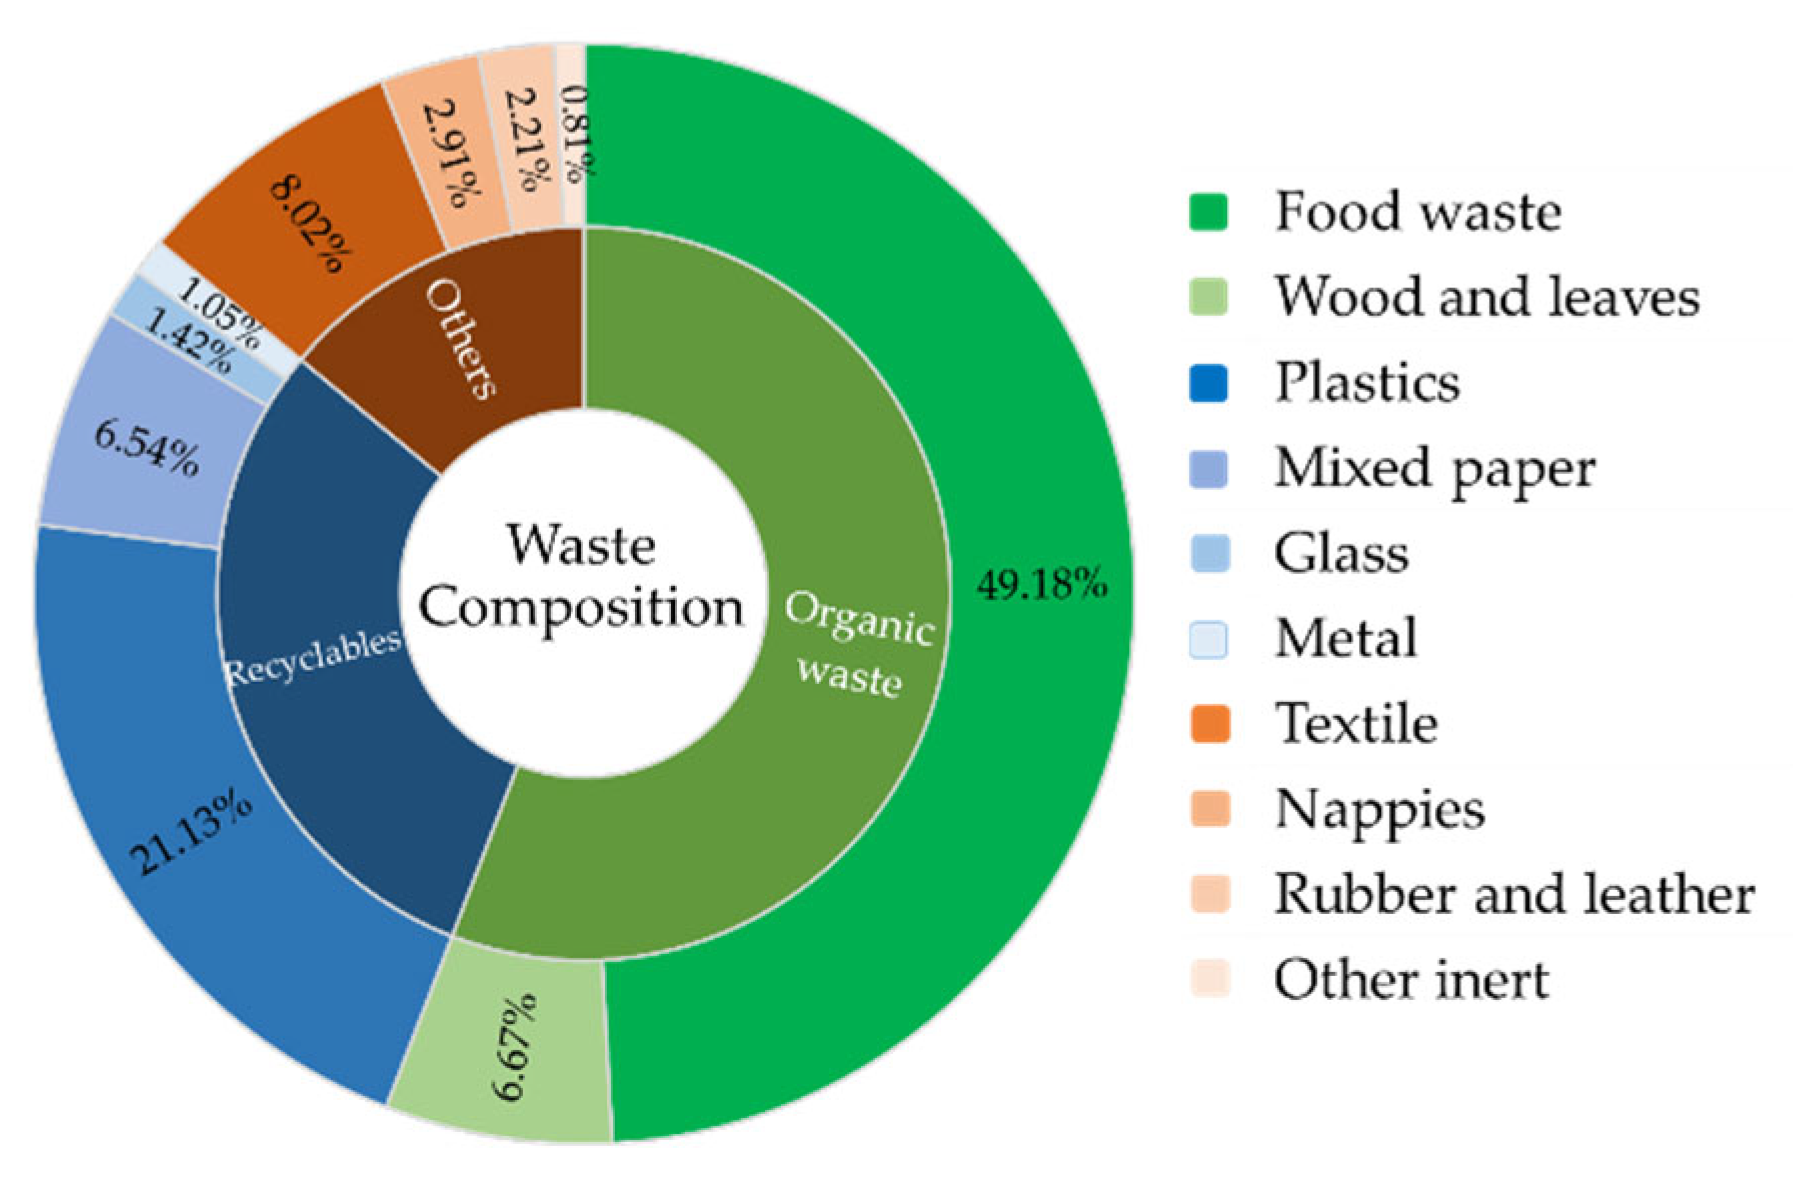
Figure 3.
System boundary for GHG emissions quantification.
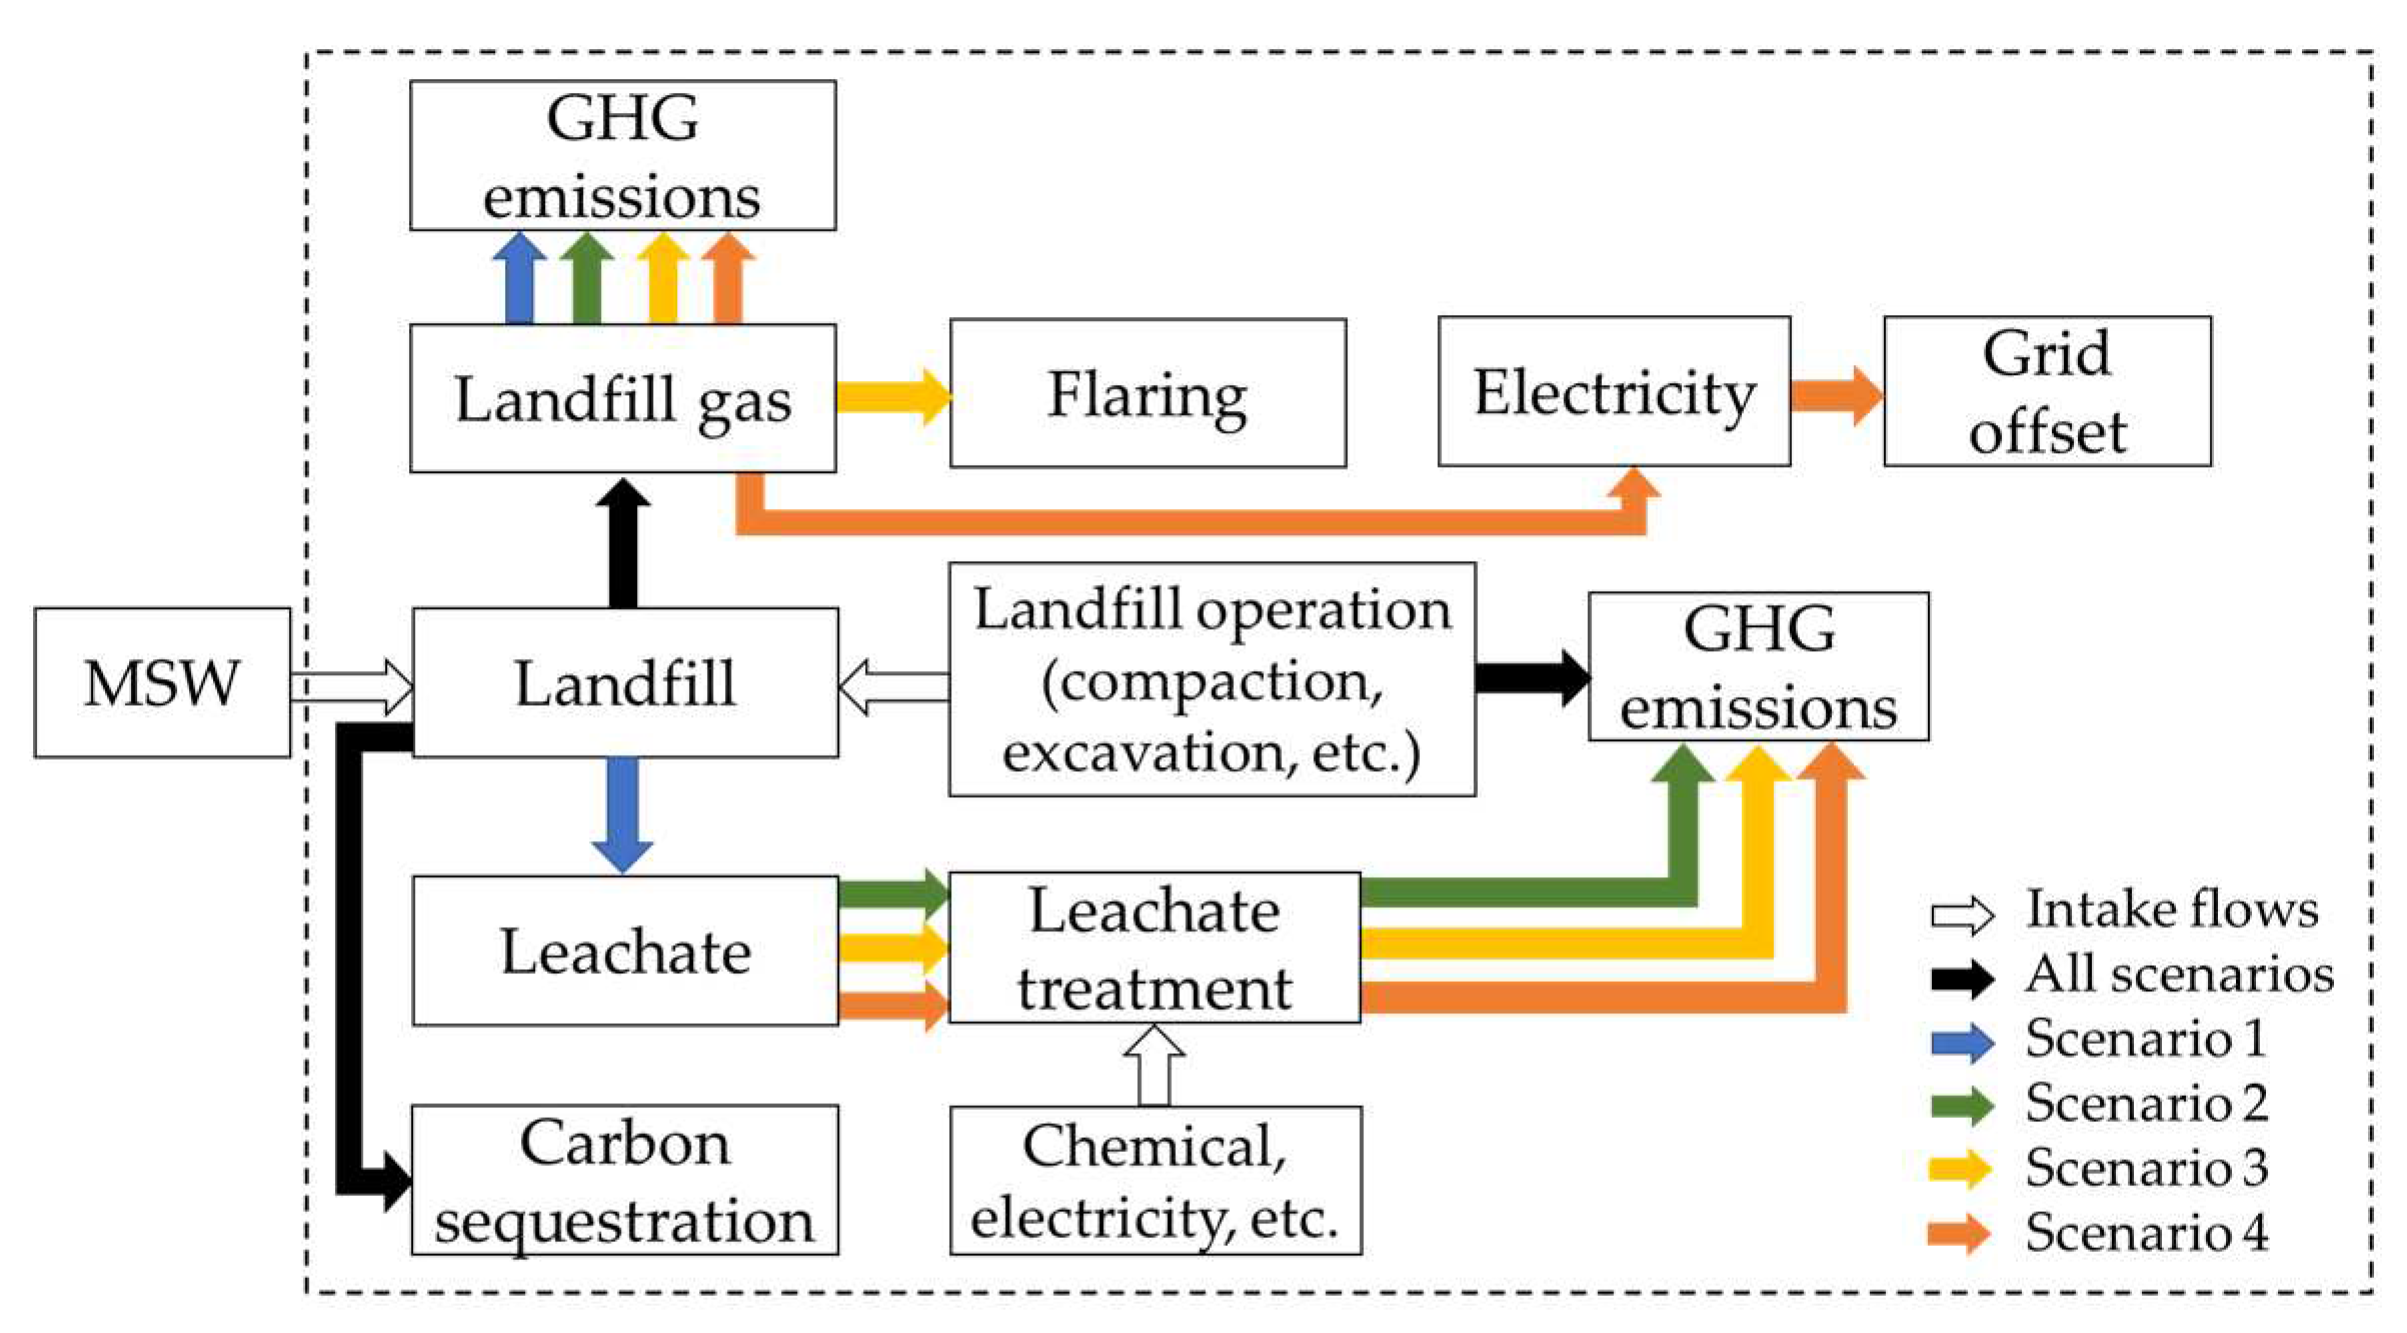
Figure 4.
CH4 emissions based on the LandGEM and IPCC FOD models.
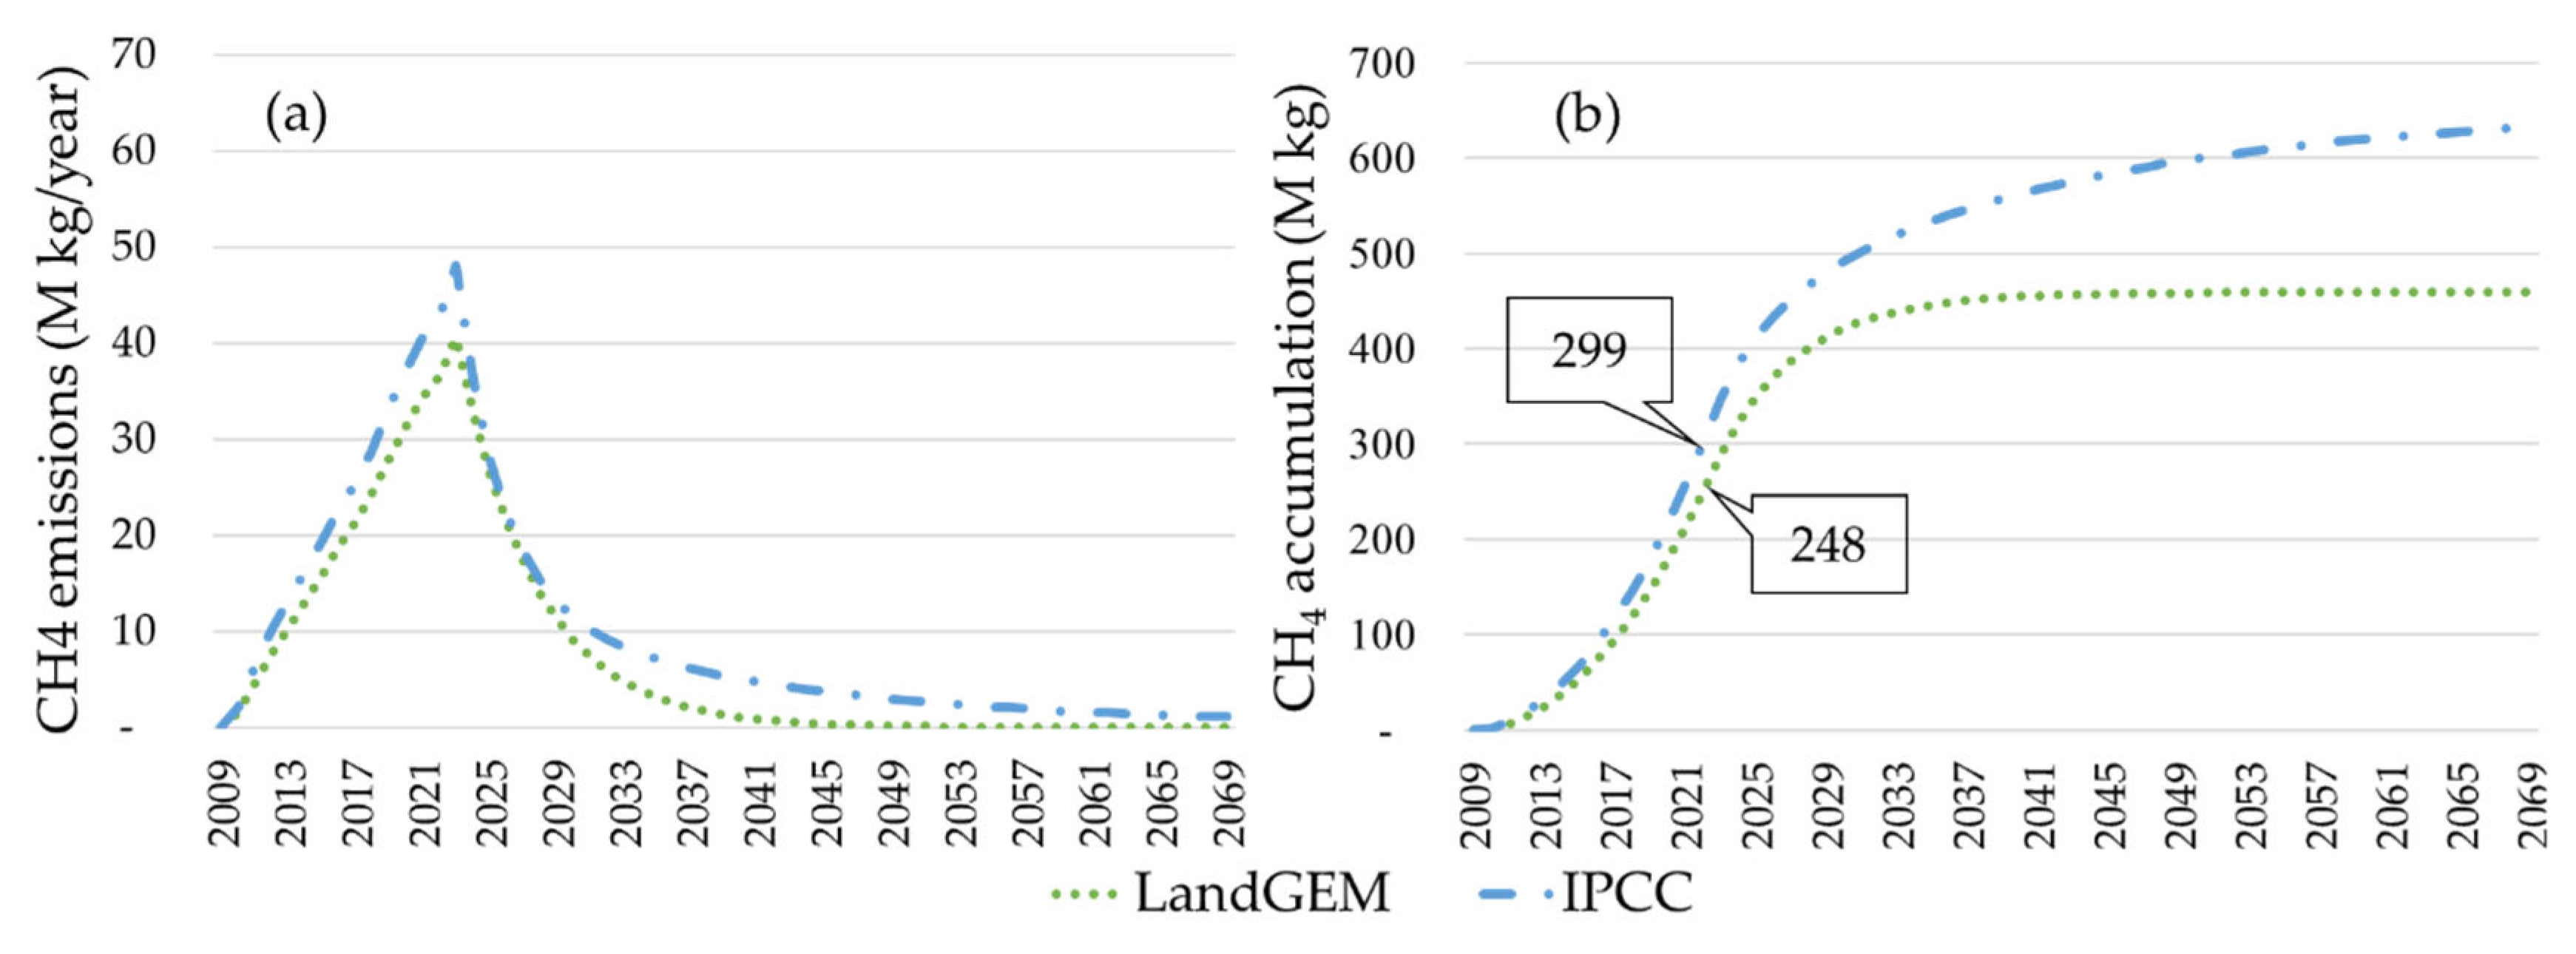
Figure 5.
Contribution of treatments to overall GHG emissions.
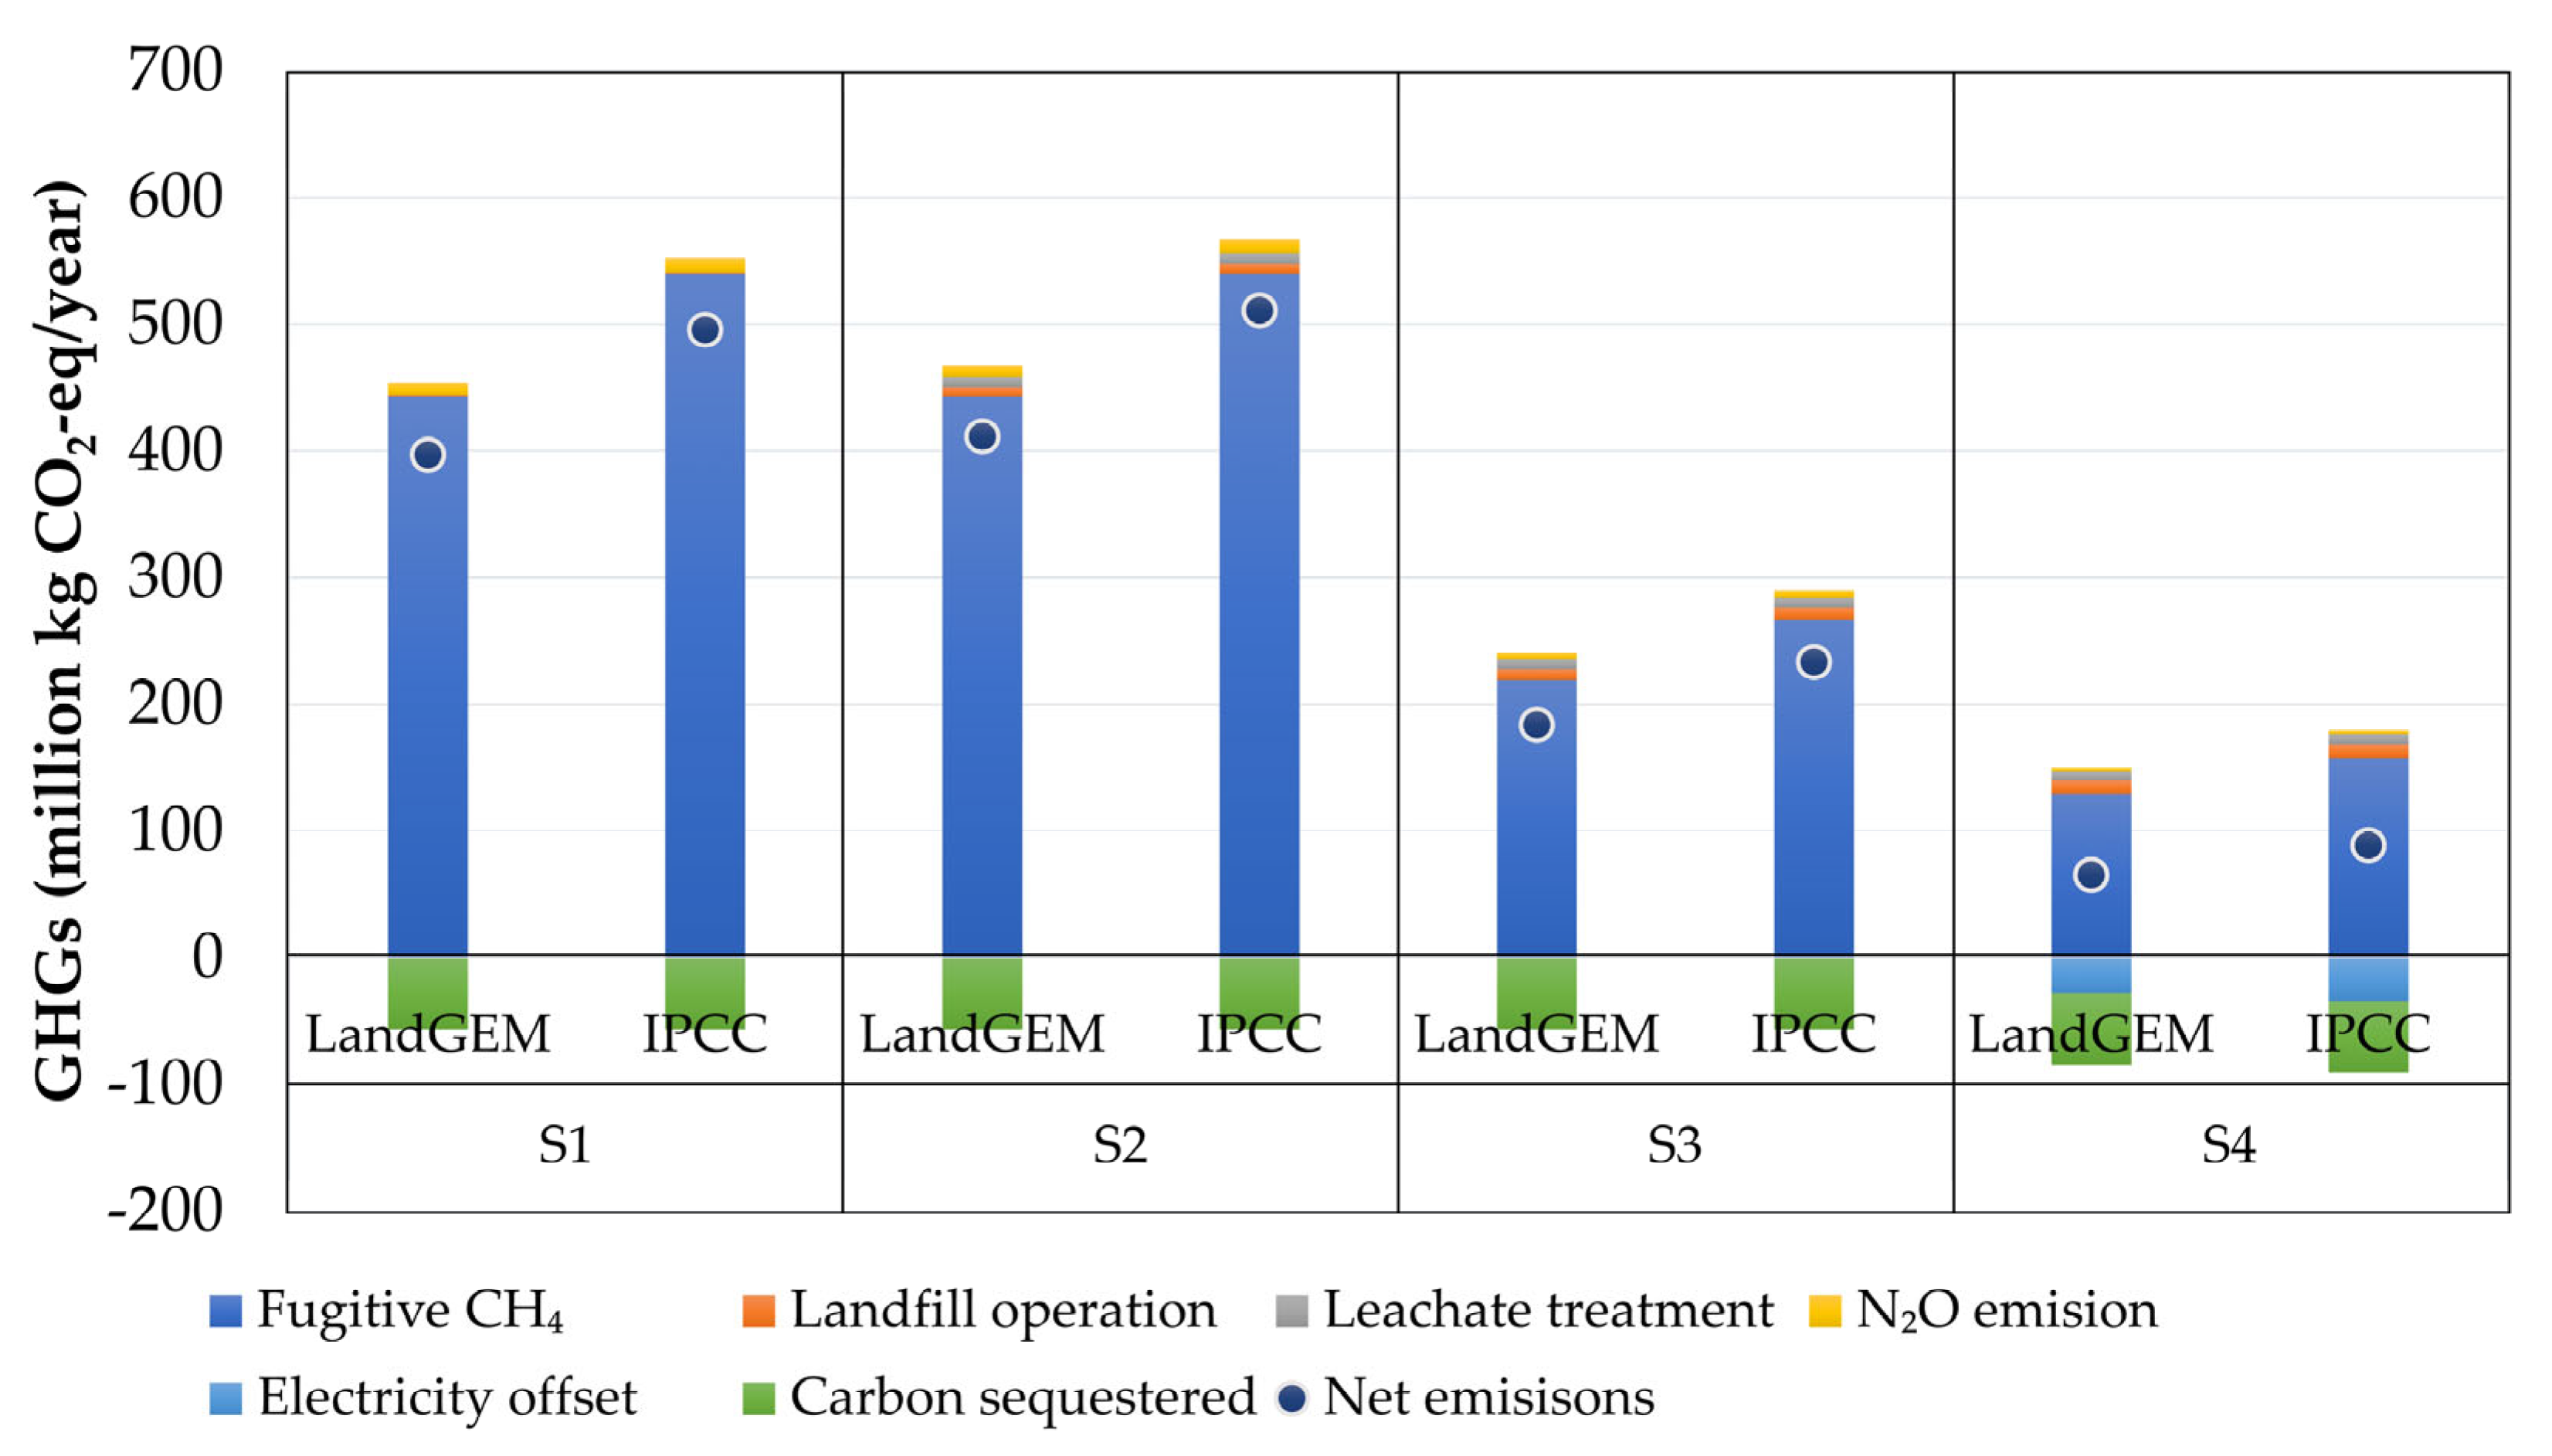
Figure 6.
Overall GHG emissions based on the LandGEM and IPCC FOD models.
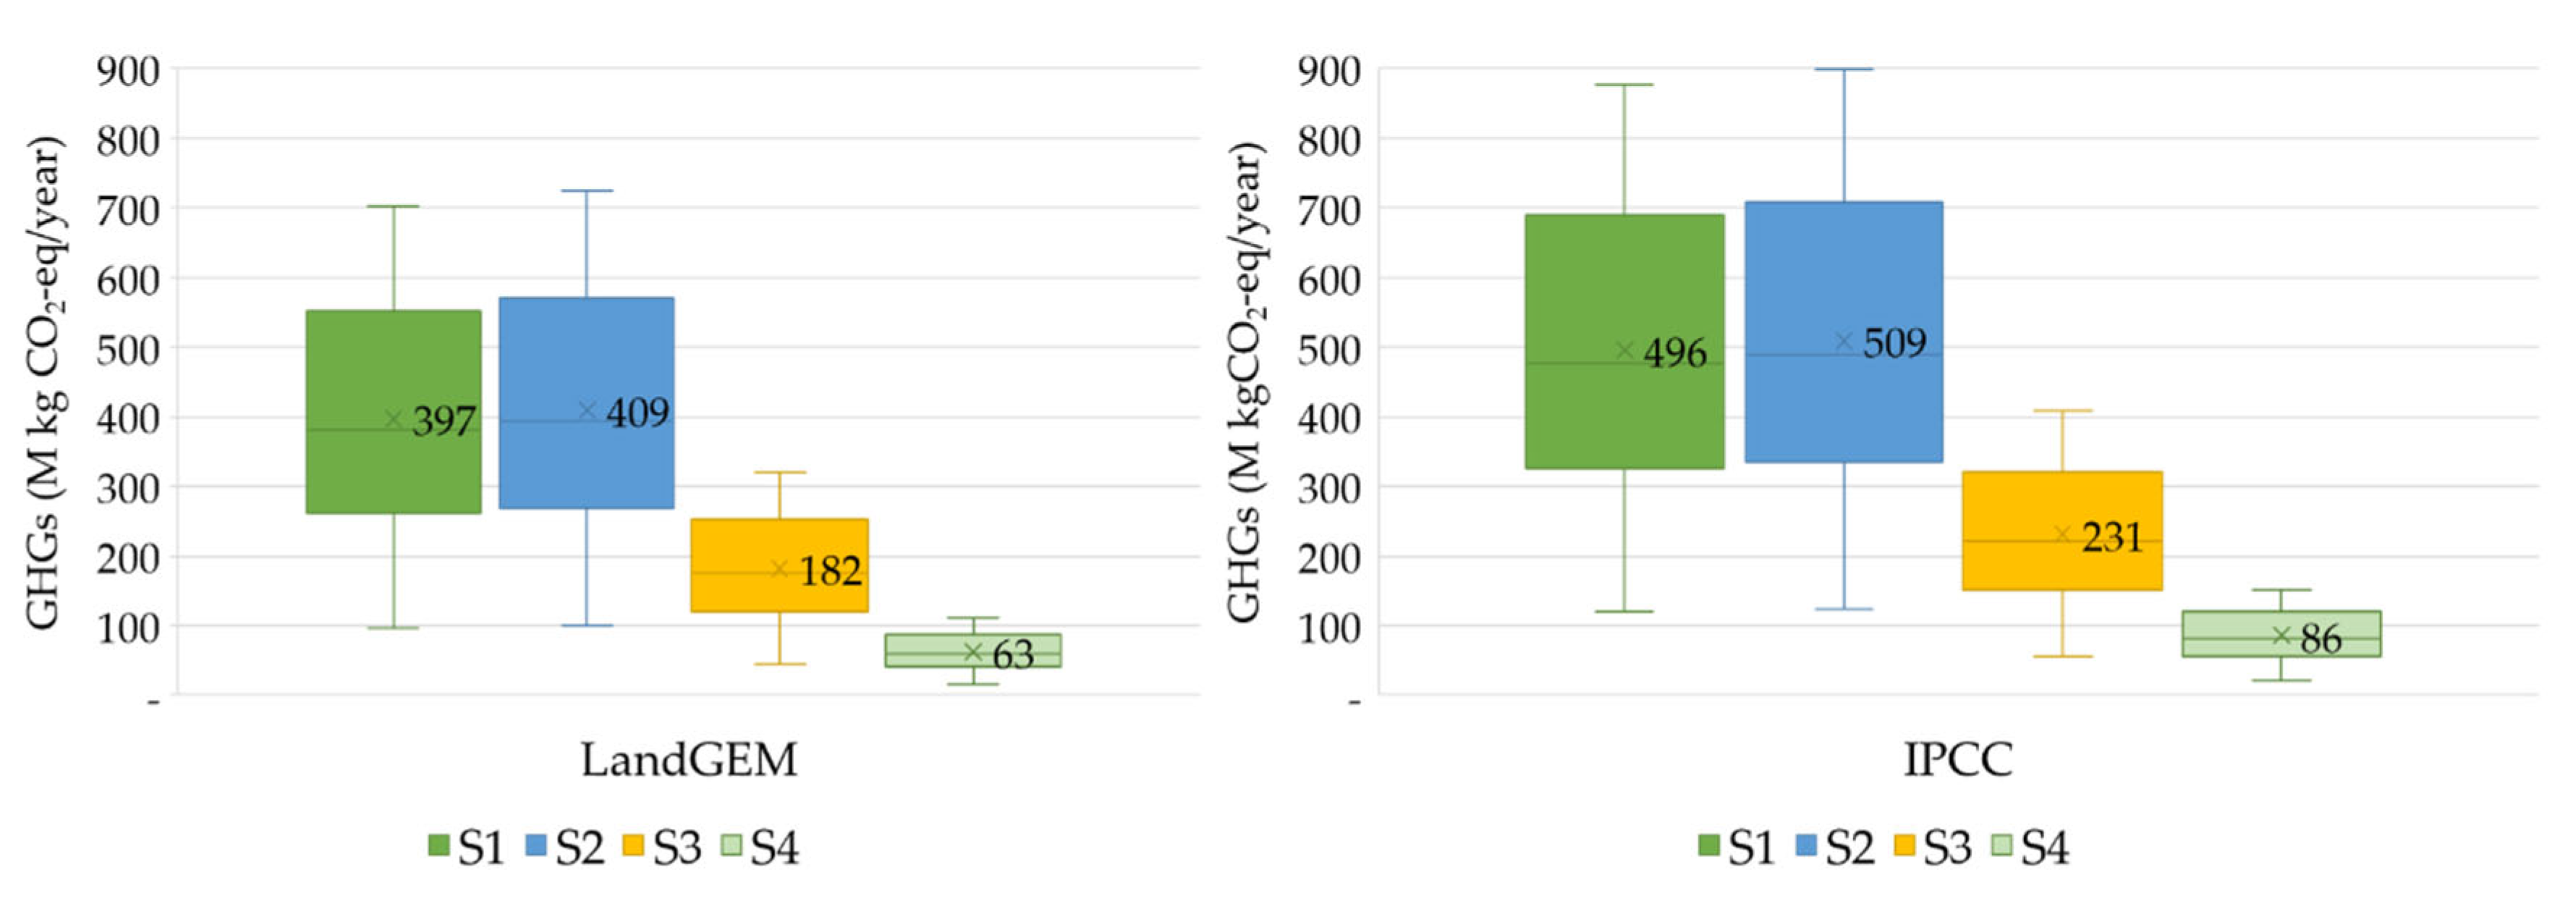
Figure 7.
Uncertainty assessment in landfill CH4 estimation.
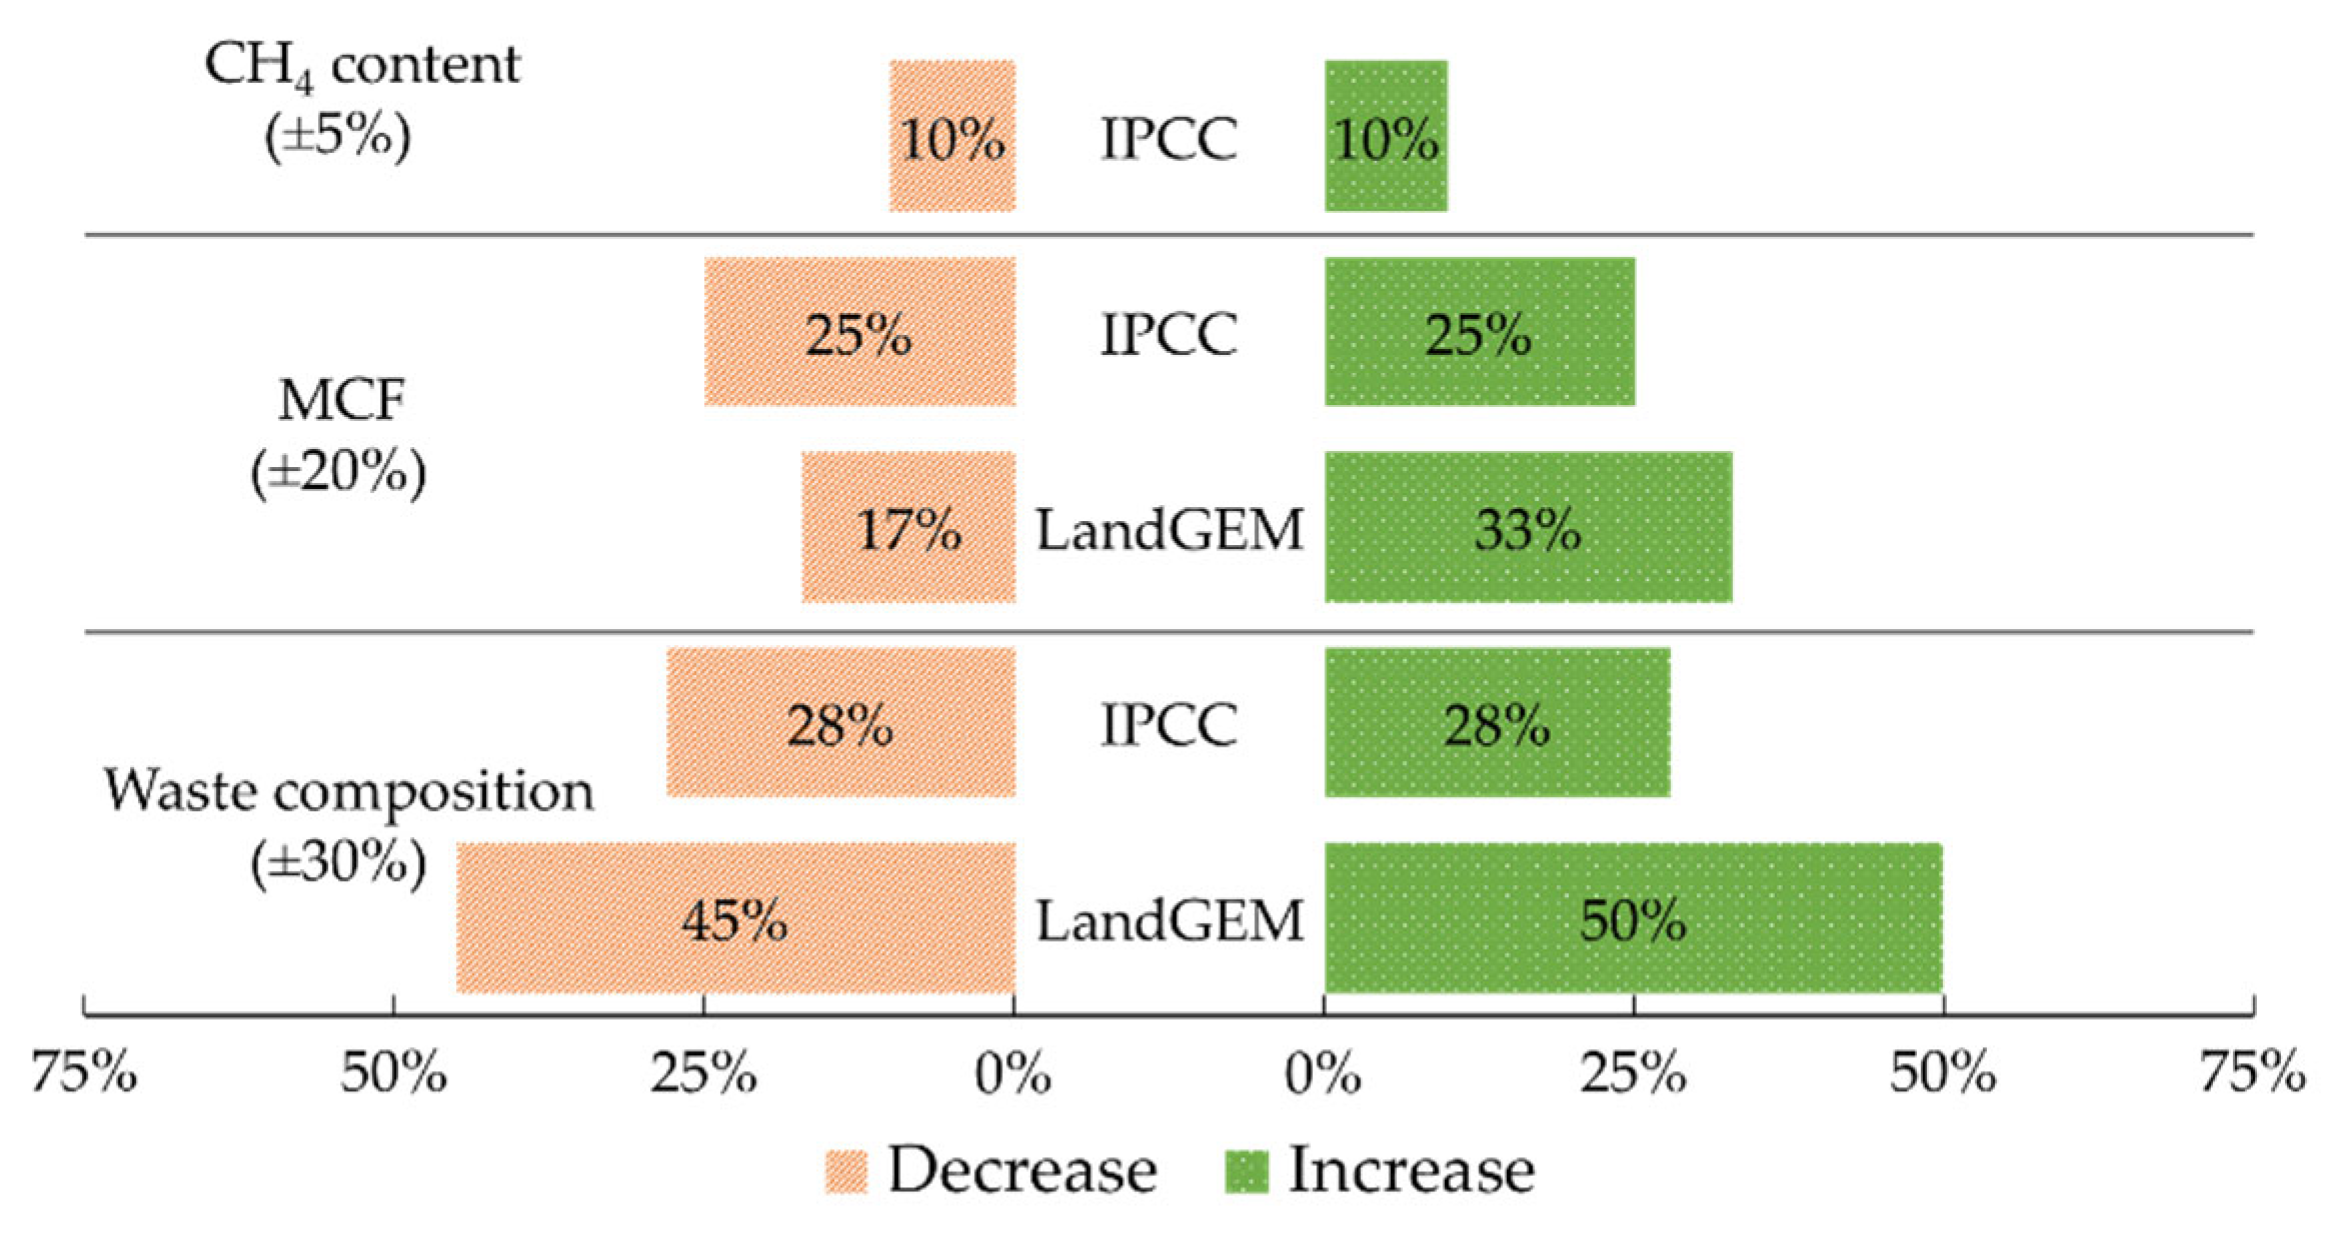

Table 1.
Population, amount of MSW disposal, and per capita MSW disposal from 2009 to 2022.
| Year | Population a (thousand) |
Waste landfilled (t/year) |
Per capita collection (kg/cap/day) |
Year | Population a (thousand) |
Waste landfilled (t/year) |
Per capita collection (kg/cap/day) |
|---|---|---|---|---|---|---|---|
| 2009 | 1393 | 177,224 b | 0.70 | 2016 | 1947 | 717,435 | 1.01 |
| 2010 | 1461 | 409,336 | 0.77 | 2017 | 2043 | 808,530 | 1.08 |
| 2011 | 1533 | 442,469 | 0.79 | 2018 | 2143 | 965,944 | 1.24 |
| 2012 | 1608 | 492,380 | 0.84 | 2019 | 2282 | 1,015,980 | 1.22 |
| 2013 | 1687 | 532,471 | 0.86 | 2020 | 2394 | 1,035,878 | 1.19 |
| 2014 | 1770 | 617,489 | 0.96 | 2021 | 2511 | 1,012,039 | 1.10 |
| 2015 | 1856 | 681,905 | 1.01 | 2022 | 2634 | 1,288,223 | 1.34 |
a The population was estimated based on Generation Population Census 2019 [24]. b The value represents a six-month period (July-December).
Table 2.
The value of MCF recommended in the IPCC 2006 guidelines.
| Type of waste disposal site | MCF default values |
|---|---|
| Managed – anaerobic | 1.0 |
| Managed – semi-aerobic | 0.5 |
| Unmanaged – deep (>5 m waste) and/or high-water table | 0.8 |
| Unmanaged – shallow (<5 m waste) | 0.4 |
| Uncategorized landfill | 0.6 |
Table 3.
Emission factors used in the study.
| Item | Emission factor | Unit | Reference |
|---|---|---|---|
| Diesel fuel | 2.70 | kg CO2-eq/L | This study |
| Electricity grid | 0.586 | kg CO2-eq/kWh | [34] |
| HDPE liner | 1.9 | kg CO2-eq/kg | [14] |
| Gravel | 0.0027 | kg CO2-eq/kg | [30] |
| Water | 0.0002 | kg CO2-eq/L | [30] |
| HCl | 0.8 | kg CO2-eq/kg | [30] |
| NaOH | 1.04 | kg CO2-eq/kg | [30] |
Table 4.
Comparison of k and L0 values reported in different studies.
| Location | k (year-1) | L0 (m3/t) | Reference |
|---|---|---|---|
| Phnom Penh, Cambodia | 0.21 | 90 | This study |
| Nam Binh Duong, Vietnam | 0.355 | 81 | [37] |
| Four landfills, Thailand | 0.33 | - | [36] |
| Sanitary landfills, Malaysia | 0.072–0.136 | 151.7 | [38] |
| Delhi, India | 0.05 | 130 | [39] |
| Andhra Pradesh, India | 0.05 | 110 | [40] |
| Salvador, Brazil | 0.21 | 70 | [2] |
Table 5.
Energy recovery potential from LFG recovery.
| Year | LandGEM (GWh) |
IPCC FOD (GWh) |
Year | LandGEM (GWh) |
IPCC FOD (GWh) |
|---|---|---|---|---|---|
| 2009 | - | - | 2016 | 50.04 | 60.36 |
| 2010 | 4.10 | 5.78 | 2017 | 56.99 | 68.00 |
| 2011 | 12.77 | 17.49 | 2018 | 64.71 | 76.84 |
| 2012 | 20.55 | 27.00 | 2019 | 74.58 | 88.73 |
| 2013 | 27.97 | 35.59 | 2022 | 83.71 | 99.35 |
| 2014 | 34.90 | 43.27 | 2021 | 91.54 | 108.11 |
| 2015 | 42.45 | 51.82 | 2022 | 97.31 | 114.18 |
Table 6.
Quantification of emission factors for landfill scenarios (kg CO2-eq/tMSW).
| Activity | S1 | S2 | S3 | S4 | ||||
|---|---|---|---|---|---|---|---|---|
| LandGEM | IPCC | LandGEM | IPCC | LandGEM | IPCC | LandGEM | IPCC | |
| Fugitive CH4 | 820.09 | 998.86 | 820.09 | 998.86 | 405.53 | 493.94 | 190.67 | 291.42 |
| Landfill operation | 1.16 | 1.16 | 10.16 | 11.32 | 11.92 | 13.08 | 14.27 | 15.43 |
| Leachate treatment | - | - | 14.38 | 14.38 | 14.38 | 14.38 | 14.38 | 14.38 |
| N2O emission | 17.60 | 21.43 | 17.60 | 21.43 | 8.80 | 10.72 | 4.40 | 5.36 |
| Electricity offset | - | - | - | - | - | - | ˗51.89 | ˗63.20 |
| Carbon sequestered | ˗104.51 | ˗104.51 | ˗104.51 | ˗104.51 | ˗104.51 | ˗104.51 | ˗104.51 | ˗104.51 |
| Total | 734.33 | 916.94 | 757.72 | 941.49 | 336.12 | 427.61 | 115.91 | 157.85 |
Disclaimer/Publisher’s Note: The statements, opinions and data contained in all publications are solely those of the individual author(s) and contributor(s) and not of MDPI and/or the editor(s). MDPI and/or the editor(s) disclaim responsibility for any injury to people or property resulting from any ideas, methods, instructions or products referred to in the content. |
© 2023 by the authors. Licensee MDPI, Basel, Switzerland. This article is an open access article distributed under the terms and conditions of the Creative Commons Attribution (CC BY) license (http://creativecommons.org/licenses/by/4.0/).
Copyright: This open access article is published under a Creative Commons CC BY 4.0 license, which permit the free download, distribution, and reuse, provided that the author and preprint are cited in any reuse.


