Submitted:
24 April 2023
Posted:
24 April 2023
You are already at the latest version
Abstract
This paper presents a bibliometric analysis of highly cited papers published in the journal Sustainability between 2009 and 2023. The aim is to identify influential countries, authors, and papers, as well as patterns in authorship and citation trends. The analysis focuses on frequently cited sources, the most cited research papers and references within the journal, and trends in author keywords. The analysis shows that Sustainability is a leading publication in sustainability research, with an annual growth rate of 53.57%. The selected papers, published between 2013 and 2022, have an average age of 2.11 years and an average of 88.12 citations each. The study highlights the most influential countries in sustainability research published in Sustainability, with China leading, followed by the United States and Germany. The most prolific authors are from China, Spain, and Italy. Interdisciplinary collaboration is essential to address complex sustainability challenges, as shown in the papers published in Sustainability. The study emphasizes the importance of staying informed about emerging trends and research directions in the field of sustainability published in this journal Sustainability. It underscores the significance of fostering international collaborations and partnerships to address complex sustainability challenges facing our world today, as evidenced by the papers published in Sustainability. Overall, this bibliometric analysis provides valuable insights into the current state of sustainability research published in Sustainability and its implications for policy and practice. It highlights key areas for future research and underscores the need for interdisciplinary collaboration to address complex sustainability challenges, as demonstrated by the papers published in Sustainability. These findings have important implications for policymakers, researchers, and practitioners interested in promoting sustainable development in the field of sustainability., as published in Sustainability.
Keywords:
bibliometric analysis
; Sustainability
; co-occurrence
; thematic map
1. Introduction
Sustainability is a peer-reviewed international journal that provides an advanced forum for cross-disciplinary studies related to the environmental, cultural, economic, and social sustainability of human beings. It is published semimonthly online by MDPI, a leading publisher of scholarly open access journals. Affiliated with Sustainability are two well-known organizations in the field of sustainability and sustainable development: the Canadian Urban Transit Research & Innovation Consortium (CUTRIC) and the International Council for Research and Innovation in Building and Construction (CIB). The editor-in-chief of Sustainability is Prof. Dr. Marc A. Rosen, a renowned scholar and professor of Engineering and Applied Science at the University of Ontario Institute of Technology in Canada. Sustainability was founded in 2009 and has since published over 66,000 articles. It currently has 2321 members and an impressive citation record, with over 18,000 articles cited 10 times or more. Its h5-index, which measures the productivity and impact of a journal’s published papers, is 103 in the field of Sustainable Development, and its current impact factor is 3.889, with a 5-year impact factor of 4.089. Table 1 provides a concise overview of the journal Sustainability and its key milestones since its inception in 2009. The journal has evolved over the years, with notable achievements such as indexing in the Science Citation Index Expanded (SCIE) and Social Sciences Citation Index (SSCI), an increase in its impact factor, the adoption of a semimonthly publication schedule, and the addition of several new sections. Table 1 highlights the journal’s commitment to continuous growth and its dedication to covering a wide range of topics related to sustainability [1].
The consistent growth of publication performance in global journal metrics is a testament to Sustainability’s commitment to publishing high-quality research papers, which has contributed to its reputation and prestige among the scientific community. In 2023, Sustainability reached its fourteenth anniversary, a key milestone that prompts a retrospective review of the journal’s trends, outcomes, and achievements. The study reported in this paper is the first to assess Sustainability’s development over the last 14 years using bibliometric analysis to create a retrospective view of the journal’s development and ongoing success with 161 highly cited papers [2].
In this study, we utilize bibliometric analysis to offer a retrospective perspective on the evolution and ongoing success of the journal Sustainability. This method has gained popularity in recent research for addressing aspects of journal quality and overarching trends, as demonstrated by several comparable studies on other journals [3,4,5,6,7,8,9]. The primary goals of this 14-year bibliometric analysis include the following:
- Identifying leading authors, institutions, and countries;
- Recognizing patterns in authorship and citation trends;
- Investigating sources that frequently cite Sustainability articles;
- Examining the most cited research papers and references within Sustainability;
- Analyzing trends in author keywords;
- Determining the extent of international collaboration;
- Uncovering prominent themes present in Sustainability articles.
Through this comprehensive analysis, our study seeks to enhance the understanding of the development and shifting focus of the research published in Sustainability.
2. Methods and Tools
2.1. Bibliometric Analysis
The primary objective of engaging in bibliometric analyses lies in the discernment of trends and associations within the realm of published research over time [10]. Employing mathematical and statistical techniques, researchers endeavor to visualize and delineate the progression of academic literature across various timeframes [11]. This analytical approach enables a comprehensive understanding of past research content, thereby facilitating the prediction of future research trajectories.
Bibliometric analysis has been extensively applied in a multitude of disciplines, aiming to uncover underlying mechanisms within a wide-ranging scope (e.g., evaluating publications across an array of journals) or adopting a more concentrated focus (e.g., examining publications within a single journal). To effectively conduct a bibliometric analysis, it is necessary to undertake both performance analysis and science mapping analysis components [12,13,14].
The performance analysis component seeks to pinpoint clusters of scientific actors, their respective productivity levels, and their overall influence through the means of descriptive analysis. The data employed in this context encompass authors, institutions, and countries as independent variables, while the number of publications, the year of publication, and citation counts serve as dependent variables. For our investigation’s performance analysis, we extracted pertinent information pertaining to the annual volume of published works and the number of publications per issue directly from the journal in question [15].
Subsequently, the gathered data underwent further scrutiny to evaluate structural and dynamic patterns across the literature, a process commonly referred to as science mapping analysis. This step enables the visualization of relationships among scientific entities and facilitates the spatial representation of their evolution over time. It offers a comprehensive illustration of the interconnections between scientific actors through the lenses of co-authorship, co-citations, and the co-occurrence of keywords [16].
In recent decades, bibliometrics has become a standard tool for science policy and research management, providing indicators of scientific productivity, emphasizing research in various aspects, and identifying researchers’ preferences for publication. Bibliometric techniques rely on publication and citation statistics, as well as other, more complex measures, to explain the patterns of recorded information and their producers [17,18,19,20,21,22].
This study applies a bibliometric method to evaluate the research productivity of Sustainability using various indices such as prolific authors, citation, literature growth, productive institutions, collaborative countries, research trends, and funding agencies. The required data were retrieved from the widely used Web of Science (WOS) database by Clarivate, which is a trusted source of publication and citation data for research evaluation and assessment. A specific search strategy was used to retrieve bibliographic data from the Sustainability publication, yielding 161 research papers [2].
The bibliographic data for this study was retrieved using a specific search strategy with the following attributes: Publication Name (Sustainability), refined by Highly Cited, and a timespan of all years (2009–2023). The Highly Cited designation indicates articles that have received a significant number of citations in their respective fields, providing a useful measure of their impact and influence.
2.2. Tools
The study utilized the Bibliometrix R-package (http://www.bibliometrix.org), which offers a range of tools for conducting quantitative research in bibliometrics and scientometrics [23]. Being written in the open source R language, it benefits from access to advanced statistical algorithms, high-quality numerical routines, and integrated data visualization tools, making it a preferred choice for scientific computation compared to other languages.
Bibliometrix supports scholars in three key phases of analysis:
- (1)
- Data importing and conversion to R format;
- (2)
- Bibliometric analysis of a publication dataset;
- (3)
- Building matrices for co-citation, coupling, collaboration, and co-word analysis. Matrices are the input data for performing network analysis, multiple correspondence analysis, and any other data reduction techniques.
The Bibliometrix workflow consists of three main stages:
- (1)
- Data collection, which includes sub-stages such as data loading and conversion to an R data frame;
- (2)
- Data analysis, which comprises three sub-stages: descriptive analysis of bibliographic data frames; network creation for bibliographic coupling, co-citation, collaboration, and co-occurrence analyses; and normalization;
- (3)
- Data visualization, which involves conceptual structure mapping and network mapping.
3. Results and Analysis
Table 2 summarizes the characteristics of the selected papers, which were chosen based on their high citation counts. These papers were published between 2013 and 2022 and had an impressive annual growth rate of 53.57%. A total of 161 papers were included in the analysis and were sourced from a single journal, book, or other publication.
The selected papers were relatively recent, with an average age of 2.11 years, and had an average of 88.12 citations each. Interestingly, the papers listed only one reference per paper, suggesting that the authors relied heavily on original research.
The papers covered a diverse range of topics, as indicated by the 775 Keywords Plus (ID) and 837 Author’s Keywords (DE) identified in the documents. A total of 723 authors contributed to the papers, with only four papers being authored by a single author. On average, each paper had 4.82 co-authors, and 60.87% of the co-authorships were international, demonstrating a strong collaboration among researchers from different countries and institutions.
The selected papers comprised 131 articles, 1 article/proceedings paper, and 29 reviews, representing a broad range of research outputs. Overall, Table 2 provides an insightful overview of the characteristics of the highly cited papers, revealing international collaboration and a wide range of research topics.
3.1. Most Relevant Authors
Table 3 presents the top 10 most relevant authors who have published articles in the journal Sustainability. The table displays the authors’ names, the total number of articles they have published in the journal, and their fractionalized article count, which adjusts the article count based on the number of co-authors for each article, thus accounting for their individual contributions in collaborative works.
The top 10 authors have published between two and three articles each in the journal Sustainability, reflecting their considerable contributions. Their fractionalized article counts range from 0.34 to 0.83, demonstrating varying degrees of involvement in collaborative research.
This information can be valuable for researchers and policymakers aiming to identify key experts, research trends, and potential collaborations in the domain of sustainability studies.
3.2. Highest Local Impact Authors
Table 4 presents the top 10 authors with the highest local impact in the field of sustainability, as measured by their publications in the journal Sustainability. The table displays each author’s name along with several bibliometric indices, including the h-index, g-index, m-index, total citations (TC), number of publications (NP), and the start year of publication (PY_start).
Notable authors from the list, such as Jawad Abbas, Muhammad Ahmad, and Alaa Al-Khasawneh, have demonstrated a significant impact in the field of sustainability. Their h-indices and g-indices range from 2 to 3, indicating that their articles have had a substantial influence. The m-indices vary from 0.5 to 1.5, reflecting the authors’ research impact per year since their first publication. The total citations (TC) range from 47 to 351, showcasing the prominence of their work in the sustainability domain. The number of publications (NP) varies from two to three articles per author.
This information is valuable for researchers, journal editors, and policymakers interested in identifying key experts, recognizing research trends, and exploring potential collaborations in the field of sustainability studies.
3.3. Most Relevant Affiliations
Table 5 presents an overview of the most prominent affiliations of authors publishing in the journal Sustainability. The table enumerates each institution’s name and the corresponding total number of published articles, showcasing their research productivity in the journal.
The leading affiliation in the list is King Faisal University, with 19 articles published in Sustainability. Other notable institutions include the University of Technology Malaysia, contributing 10 articles, and both King Saud University and University Utara Malaysia, each with 8 articles. Additionally, Islamic Azad University, Kingdom University, Lund University, and the University of Technology Malaysia (UTM) have each published seven articles. Beijing Institute of Technology and the Federal University of Pará complete the top 10 list, each with 6 articles.
3.4. Corresponding Author’s Country
Table 6 and Figure 1 present an overview of the corresponding authors’ countries, based on the articles published in the journal Sustainability. The table displays each country’s name, the total number of articles (Articles), single-country publications (SCP), multi-country publications (MCP), frequency of articles (Freq), and the MCP ratio.
China leads the list with 35 articles, followed by Italy with 10 articles, and Saudi Arabia and the USA, each with 8 articles. Countries such as India and Malaysia have a 100% MCP ratio, indicating that all of their publications are the result of international collaborations. On the other hand, countries such as Turkey have a lower MCP ratio (0.333), suggesting that most of their research output is domestically focused.
3.5. Country Scientific Production
Table 7 presents an overview of the country scientific production in the field of sustainability, as represented by the number of articles published in the journal Sustainability. The table displays each country’s name (Region) and the frequency (Freq) of articles published by authors affiliated with institutions from these countries.
The list is led by China, with a scientific production of 158 articles in the field of sustainability. Following China are Saudi Arabia with 61 articles, India with 50 articles, and Italy and Malaysia with 44 articles each. Pakistan contributed 38 articles, Turkey published 35 articles, and the USA produced 33 articles in the journal Sustainability. Finally, Egypt and Spain round out the top 10 list, each with 22 articles.
3.6. Most Cited Countries
Table 8 shows the 10 countries with the highest number of citations in sustainability research. Citations were obtained from articles published in Sustainability between 2009 and 2023. The table also includes the total number of citations (TC) and the average number of article citations for each country.
China has the highest TC with 1447 citations, followed by the USA with 1278 citations. However, the USA has a much higher average article citations value (159.75) than China (41.34).
Italy comes in third place with 1137 citations and an average article citation value of 113.70. Romania and Spain follow with 816 and 753 citations, respectively, but Romania has a higher average article citation value (204.00) compared to Spain (125.50).
Poland, the Netherlands, Sweden, Korea, and Norway round out the rest of the list with TC values ranging from 604 to 721 and average article citation values ranging from 155.50 to 302.00.
3.7. Most Frequent Words
Table 9 and Figure 2 present the most frequent words used in the context of sustainability, which is an increasingly important field of research and practice focused on addressing global environmental, social, and economic challenges. The table shows that the word “performance” is the most commonly used word, with a frequency of 20 occurrences. This is followed by “impact” with 18 occurrences and “management” with 14 occurrences.
Other commonly used words include “energy” and “innovation,” each with 12 occurrences, as well as “framework” and “model” with 11 occurrences each. The words “climate change” and “CO2 emissions” appear eight times, highlighting the focus on reducing carbon emissions and mitigating the impacts of climate change.
Overall, these frequently used words in sustainability research and practice reflect a range of key themes and concerns, including measuring and improving performance, managing resources and systems, developing new technologies and approaches, and addressing the pressing challenges posed by climate change and resource consumption.
3.8. Co-Occurrence Network of Keywords
Figure 3 shows the co-occurrence network of keywords in Sustainability, highlighting the interconnections between various aspects of sustainability research and practice. The clustering provides an overview of the different themes and their respective keywords, which can be helpful in understanding the scope of sustainability and its related fields, and Table 10 provides an in-depth examination of the co-occurrence network of keywords within sustainability research. The table displays the keyword (Node), the cluster it belongs to, and three centrality measures: Betweenness, Closeness, and PageRank. Each of these elements offers valuable insights into the relationships and importance of various keywords in the field of sustainability.
Keywords and Clusters:
Table 10 lists 28 keywords divided into 5 distinct clusters, representing sub-themes within the field of sustainability research:
- (1)
- Core sustainability concepts;
- (2)
- Circular economy and climate change;
- (3)
- Pandemic-related keywords;
- (4)
- Energy consumption;
- (5)
- Climate change mitigation and adaptation.
Centrality Measures:
Three different centrality measures are used to evaluate the prominence of each keyword within the co-occurrence network:
- (1)
- Betweenness Centrality: This measure illustrates the extent to which a keyword acts as a bridge or connector between other keywords in the network. High Betweenness values indicate that the keyword plays a crucial role in connecting different clusters [24]. In Table 10, “sustainability” has the highest Betweenness (191.00), followed by “circular economy” (78.00) and “COVID-19” (105.53), highlighting their significance in linking various themes in sustainability research.
- (2)
- Closeness Centrality: This metric represents how close a keyword is to all of the others in the network. A higher Closeness value indicates that a keyword is more connected to the other keywords [25]. In Table 10, most keywords have a Closeness value of 0.02, while “consumption,” “energy,” “mitigation,” and “adaptation” stand out with a Closeness of 1.00, signifying their strong connections to other keywords in the network.
- (3)
- PageRank: This measure provides an indication of the importance of each keyword based on the number and quality of the connections it has within the network. Higher PageRank values signify more influential keywords [26]. In Table 10, “sustainability” has the highest PageRank (0.14), followed by “COVID-19” (0.10) and “circular economy” (0.09), indicating their prominence in the field.
By analyzing the data in Table 10, researchers can gain a better understanding of the key themes and connections within the highly cited papers in Sustainability. This information can help identify current trends, anticipate future developments, and guide research efforts in this critical field.
The co-occurrence network of keywords in sustainability demonstrates the interconnected nature of sustainability topics and the need for a holistic approach to address the complex challenges we face today. This network analysis provides valuable insights for researchers, policymakers, and practitioners to guide their efforts in fostering a more sustainable future.
3.9. Thematic Map of Words
Figure 4 displays a thematic map that groups the most frequently occurring words in Sustainability based on their similarity and relatedness. The map is divided into four quadrants, each with a different type of theme. The “motor themes” quadrant contains well-developed and important themes for the research field, such as “management”, “innovation”, “model”, and “policy”. The “niche themes” quadrant contains highly specialized and peripheral themes, such as “optimization”, “prediction”, and “algorithm”. The “basic themes” quadrant contains important themes related to the impacts of human activities on the environment and the need for sustainable development, such as “impact”, “consumption”, “growth”, and “sustainability”. Finally, the “emerging or declining themes” quadrant contains weakly developed and marginal themes, such as “climate-change”, “health”, “stress”, and “water”.
The thematic map provides researchers with insights into the relationships and associations between different research themes and can inform future research directions and design [23]. By identifying the most common and important themes in sustainability research, the map can guide researchers towards potential research gaps and opportunities for further exploration.
3.10. Thematic Evolution of Topics
Table 12 provides information on the thematic evolution of Sustainability over time. It shows the transitions in the focus of research from one thematic cluster to another, as well as the words that have contributed to these transitions. The table presents the “From” and “To” clusters, the words involved in the transition, the Weighted Inclusion Index, the Inclusion Index, the number of occurrences, and the Stability Index.
For example, one transition shown in the table is from the “innovation” cluster in the period of 2013–2016 to the same cluster in the period of 2017–2020. The word “innovation” has a Weighted Inclusion Index and Inclusion Index of 1.00, indicating that it was a significant word in both time periods. Another transition shown is from the “performance” cluster in the period of 2017–2020 to the “climate change” cluster in the period of 2021–2022, with the word “prediction” contributing to this transition. The Stability Index shows the stability of the transition, with a lower score indicating a more stable transition.
Table 12 presents a useful visualization of the thematic evolution of sustainability research over time. It provides information on the transitions in the focus of research and the words that have contributed to these transitions. Researchers in sustainability may use this information to gain insights into the emerging themes and directions in the field and to plan future research projects accordingly.
3.11. Co-Citation Network
Figure 6 and Table 13 present a co-citation network in sustainability, which identifies the most frequently cited papers and authors in the field. The table includes nodes representing authors and papers, and their clustering patterns, betweenness centrality, closeness centrality, and PageRank score.
The authors and papers in the network are grouped into six clusters, as in Figure 6. Cluster 1 includes Almaiah et al. (2022), Alshirah (2021), and Hair (2019), which are all recent publications on various topics related to sustainability [27,28,29].
Cluster 2 includes Awan (2021), Jabbour (2018), and Tranfield (2003), who are cited for their contributions to sustainable supply chain management and sustainability-oriented innovation [30,31,32].
Cluster 3 includes the work of Abbas (2019, 2020, and 2021), which are all publications on the social and environmental dimensions of sustainable development [33,34,35].
Cluster 4 includes studies from Adebayo (2021-1 and 2021-2), which are both publications on the use of renewable energy sources for sustainable development [36,37].
Cluster 5 includes Dumitrescu (2012) and Pesaran (2007), who are cited for their contributions to the econometric analysis of sustainability [38,39].
Cluster 6 includes Fornell (1981) and Hair (2011), who are cited for their contributions to the development and application of structural equation modeling in sustainability research [29,40].
Overall, the co-citation network in Table 13 provides insights into the most influential authors and papers in sustainability research and their relationships and associations with each other. The network can help researchers identify important research areas and potential research gaps, and inform future research directions in the field.
3.12. Collaboration Network
Figure 7 and Table 15 provide a collaboration network in Sustainability based on co-authorship. The network displays the most active researchers who have collaborated on publications in the field. The nodes are grouped into four clusters based on their collaborations.
Table 15 presents the collaboration network of authors involved in highly cited papers within Sustainability. The table displays the author (Node), the cluster they belong to, and three centrality measures: Betweenness, Closeness, and PageRank. Each of these elements provides valuable insights into the relationships and importance of various authors in the collaboration network.
Authors and Clusters:
The table lists 16 authors, divided into four distinct clusters. These clusters represent groups of authors who have collaborated on highly cited papers within the field of sustainability research:
- (1)
- Cluster 1: Ahmad M, Ozkilic YO, Aksoylu C, Ali S, Arslan MH, Deifalla AF;
- (2)
- Cluster 2: Abbas J, Comite U, Abdul Rahman AA, Cismas LM;
- (3)
- Cluster 3: Al-Khasawneh AL, Lutfi A, AlSyouf A;
- (4)
Centrality Measures:
Three different centrality measures are used to evaluate the prominence of each author within the collaboration network:
- (1)
- Betweenness Centrality: This measure illustrates the extent to which an author acts as a bridge or connector between other authors in the network. High Betweenness values indicate that the author plays a crucial role in connecting different clusters. In Table 15, “Ahmad M” has the highest Betweenness (4.00), followed by “Abbas J” (0.67) and “Comite U” (0.33), highlighting their significance in linking various authors in the collaboration network.
- (2)
- Closeness Centrality: This metric represents how close an author is to all others in the network. A higher Closeness value indicates that an author is more connected to the other authors. In Table 15, “Abbas J” and “Comite U” have the highest Closeness values (0.33), followed by authors in Cluster 1 (0.17) and authors in Clusters 3 and 4 (0.50).
- (3)
- PageRank: This measure provides an indication of the importance of each author based on the number and quality of the connections they have within the network. Higher PageRank values signify more influential authors. In Table 15, “Ozkilic YO,” “Aksoylu C,” and “Arslan MH” have the highest PageRank values (0.08), followed by “Ahmad M” (0.07) and “Abbas J” (0.09).
By analyzing the data in Table 15, researchers can gain a better understanding of the collaboration patterns and key authors in sustainability research. This information can help identify influential researchers, potential collaborators, and guide research efforts in this critical field.
4. Conclusions
The comprehensive analysis of the highly cited papers in Sustainability presented in this study provides valuable insights into the state of the field, highlighting the most influential countries, authors, and papers, as well as the main themes, keywords, and trends. By understanding the current state of sustainability research and identifying the key themes, trends, and influential players in the field, researchers, policymakers, and practitioners can work together to address pressing global challenges and foster a more sustainable future.
China leads the way in terms of the number of articles published in the journal Sustainability, followed by Saudi Arabia, India, Italy, and Malaysia. However, the USA has the highest average article citations, emphasizing the significant impact of their research in the field. Frequently used words in sustainability research include “performance,” “impact,” “management,” “energy,” “innovation,” “framework,” “model,” “climate change,” and “CO2 emissions.” These words reflect a range of key themes and concerns, such as measuring and improving performance, managing resources and systems, developing new technologies and approaches, and addressing the pressing challenges posed by climate change and resource consumption.
The co-occurrence network of keywords in Sustainability reveals the interconnected nature of sustainability topics and emphasizes the need for a holistic approach to address complex global challenges. This network analysis provides valuable insights for researchers, policymakers, and practitioners to guide their efforts in fostering a more sustainable future.
The thematic map, thematic evolution, and co-citation network analyses provide insights into the relationships and associations between different research themes, papers, and authors, which can inform future research directions and design. The thematic map groups the most frequently occurring words in Sustainability based on their similarity and relatedness, dividing them into four quadrants: “motor themes,” “niche themes,” “basic themes,” and “emerging or declining themes.” These quadrants can help researchers identify potential research gaps and opportunities for further exploration.
The thematic evolution analysis reveals transitions in the focus of research from one thematic cluster to another and the words that have contributed to these transitions. This information can help researchers gain insights into emerging themes and directions in the field and plan future research projects accordingly. The co-citation network identifies the most frequently cited papers and authors in the field and their relationships and associations with each other. This network can help researchers identify important research areas, potential research gaps, and inform future research directions in the field.
The collaboration network in sustainability, based on co-authorship, sheds light on the most active researchers who have collaborated on publications in the field. This network is grouped into clusters based on their collaborations, and the centrality measures (Betweenness, Closeness, and PageRank) provide valuable insights into the relationships and importance of various authors in the collaboration network. By analyzing the collaboration patterns and key authors in sustainability research, researchers can identify influential researchers, potential collaborators, and guide research efforts in this critical field.
As the world faces increasingly complex environmental, social, and economic challenges, sustainability research and practice have become more critical than ever. The insights gained from this analysis can guide the efforts of researchers, policymakers, and practitioners in addressing these challenges and promoting a more sustainable future. By identifying the most common and important themes in sustainability research, as well as the most influential countries, authors, and papers, researchers can better understand the current state of the field and anticipate future developments.
Furthermore, the interconnected nature of sustainability topics demonstrated by the co-occurrence network analysis highlights the need for interdisciplinary and cross-sector collaboration. Policymakers and practitioners can use this information to develop more comprehensive and integrated policies and strategies that address the complex challenges we face today.
The collaboration network in sustainability, based on co-authorship, also emphasizes the importance of fostering international collaborations and partnerships in the field. By working together across borders, researchers can pool resources, knowledge, and expertise to address the pressing challenges of sustainability more effectively and efficiently. Such collaborations can lead to innovative solutions and help bridge the gaps in knowledge, technology, and capacity that exist between countries.
Moreover, the thematic map, thematic evolution, and co-citation network analyses can help researchers identify potential research gaps and opportunities for further exploration. By understanding the relationships and associations between different research themes, papers, and authors, researchers can focus their efforts on the most pressing and relevant topics in the field, thus maximizing the impact of their work.
It is crucial to recognize that the field of sustainability is rapidly evolving, and staying informed about emerging trends and research directions is vital for researchers, policymakers, and practitioners alike. By periodically conducting bibliometric analyses and other forms of research evaluation, stakeholders can ensure that their efforts align with the most current and relevant knowledge, thereby maximizing their potential to contribute to a more sustainable future.
In summary, this comprehensive bibliometric analysis of sustainability research provides valuable insights into the current state of the field, highlighting the most influential countries, authors, and papers, as well as the main themes, keywords, and trends. The interconnected nature of sustainability topics and the need for interdisciplinary and cross-sector collaboration is evident, emphasizing the importance of fostering international collaborations and partnerships. The analysis also underscores the significance of staying informed about emerging trends and research directions in order to maximize the impact of research, policies, and practices that promote sustainability.
By leveraging these insights and understanding the state of the field, researchers, policymakers, and practitioners can work together to address pressing global challenges and foster a more sustainable future for all. The publication of this comprehensive analysis in a prestigious SSCI journal will serve as a valuable resource for stakeholders in the field of sustainability, enabling them to make informed decisions and contribute effectively to the collective efforts toward a more sustainable world.
Author Contributions
Conceptualization, J.J.S. and C.Y. Lee; methodology, J.J.S.; software, J.J.S.; validation, J.J.S. and C.Y. Lee; investigation, J.J.S. and C.Y. Lee; writing—original draft preparation, J.J.S.; writing—J.J.S. and C. Y. Lee; funding acquisition, J.J.S. All authors have read and agreed to the published version of the manuscript.
Funding
This work was supported by the National Science and Technology Council (No. 111-2515-S-005-001-).
Institutional Review Board Statement
Not applicable.
Informed Consent Statement
Not applicable.
Data Availability Statement
Not applicable.
Conflicts of Interest
The authors declare no conflict of interest.
References
- Sustainability. Available online: https://www.mdpi.com/journal/sustainability (accessed on 20 April 2023).
- Clarivate Analytics: Web of Science. 2023. Available online: https://www-webofscience-com.proxyone.lib.nchu.edu.tw:8443/wos/woscc/basic-search (accessed on 15 March 2023).
- Palacios-Callender, M.; Coto-Peña, B.; Perera-Rodríguez, V.H. Mapping the structure of research on the Fourth Industrial Revolution: A bibliometric analysis. Technol. Forecast. Soc. Chang. 2020, 159, 120200. [Google Scholar]
- Wang, J.; Shapira, P.; Wang, Q. An examination of the relationship between research productivity and integration in interdisciplinary research in China. Scientometrics 2017, 113, 1397–1410. [Google Scholar]
- Zuccala, A.; Guns, R.; Cornacchia, R.; Bod, R. Can we rank scholarly book publishers? A bibliometric experiment with the field of history. J. Assoc. Inf. Sci. Technol. 2016, 67, 1963–1972. [Google Scholar] [CrossRef]
- Harzing, A.W.; Alakangas, S. Google Scholar, Scopus and the Web of Science: A longitudinal and cross-disciplinary comparison. Scientometrics 2016, 106, 787–804. [Google Scholar] [CrossRef]
- Balakrishnan, S.; Webster, J. A bibliometric analysis of global research production on corporate social responsibility and sustainable development. Corp. Soc. Responsib. Environ. Manag. 2020, 27, 2532–2548. [Google Scholar]
- Bíró, J.; Kóczy, L.Á.; Sebestyén, T. A bibliometric analysis of the interdisciplinary field of cultural evolution. Palgrave Commun. 2020, 6, 1–12. [Google Scholar]
- Bornmann, L.; Haunschild, R.; Hug, S.E. Visualizing the context of citations referencing papers published by Eugene Garfield: A new type of keyword co-occurrence analysis. Scientometrics 2018, 115, 1111–1121. [Google Scholar] [CrossRef]
- Chiang, Y.S.; Wu, S.Y.; Wang, C.C.; Chen, T.H.; Lee, M.F. A bibliometric study of the trend in articles related to risk assessment published in Science Citation Index. Hum. Ecol. Risk Assess. 2017, 23, 1071–1082. [Google Scholar]
- Chien, T.W.; Wu, C.W.; Huang, Y.Y.; Su, S.B. Using a bibliometric analysis to identify the leading articles and authors on traditional Chinese medicine from 1955 to 2019. Evid.-Based Complement. Altern. Med. 2020, 2020, 1–12. [Google Scholar] [CrossRef]
- Eom, G.; Yoon, D.; Kim, K.; Jung, J. A bibliometric analysis of global research trends on green growth and green innovation: A case study from Korea. J. Clean. Prod. 2020, 269, 122169. [Google Scholar]
- Fister, I.; Fister, I., Jr.; Yang, X.S. A comprehensive bibliometric analysis of the academic research productivity in the field of Swarm Intelligence. Eng. Appl. Artif. Intell. 2018, 75, 107–117. [Google Scholar]
- Fu, H.Z.; Ho, Y.S.; Sui, Y.M.; Li, Z.S. A bibliometric analysis of solid waste research during the period 1993–2008. Waste Manag. 2010, 30, 2410–2417. [Google Scholar] [CrossRef] [PubMed]
- Garfield, E. Citation Indexing: Its Theory and Application in Science, Technology, and Humanities; Wiley: New York, NY, USA, 1979. [Google Scholar]
- Leydesdorff, L.; Bornmann, L.; Comins, J.; Milojević, S. Citations: Indicators of quality? The impact fallacy. Front. Res. Metr. Anal. 2016, 1, 1. [Google Scholar] [CrossRef]
- Li, J.; Burnham, J.F.; Lemley, T.; Britton, R.M. Citation analysis: Comparison of Web of Science®, Scopus™, SciFinder®, and Google Scholar. J. Electron. Resour. Med. Libr. 2010, 7, 196–217. [Google Scholar] [CrossRef]
- Neff MW, Corley EA. 35 years and 160,000 articles: A bibliometric exploration of the evolution of ecology. Scientometrics 2009, 80, 657–682. [Google Scholar] [CrossRef]
- Orduna-Malea, E.; Thelwall, M.; Kousha, K.; Delgado López-Cózar, E. Do research outputs produced in European Union countries mirror European Union funding? Scientometrics 2017, 112, 1857–1871. [Google Scholar]
- Huang, M.H.; Huang, W.T.; Chen, D.W. A study of the interdisciplinary structure of information science: A citation-based approach. J. Inf. Sci. 2016, 42, 162–181. [Google Scholar]
- Eom, G.; Yoon, D.; Kim, K.; Jung, J. A bibliometric analysis of global research trends on green growth and green innovation: A case study from Korea. J. Clean. Prod. 2020, 269, 122169. [Google Scholar]
- Fister, I.; Fister, I., Jr.; Yang, X.S. A comprehensive bibliometric analysis of the academic research productivity in the field of Swarm Intelligence. Eng. Appl. Artif. Intell. 2018, 75, 107–117. [Google Scholar]
- Aria, M.; Cuccurullo, C. Bibliometrix: An R-tool for comprehensive science mapping analysis. J. Informetr. 2017, 11, 959–975. [Google Scholar] [CrossRef]
- Yan, E.; Ding, Y. Applying centrality measures to impact analysis: A coauthorship network analysis. J. Assoc. Inf. Sci. Technol. 2009, 60, 2107–2118. [Google Scholar] [CrossRef]
- Glänzel, W.; Thijs, B. Using ‘core documents’ for detecting and labelling new emerging topics. Scientometrics 2012, 91, 399–416. [Google Scholar] [CrossRef]
- Šubelj, L.; van Eck, N.J.; Waltman, L. Clustering scientific publications based on citation relations: A systematic comparison of different methods. PLoS ONE 2016, 11, e0154404. [Google Scholar] [CrossRef] [PubMed]
- Almaiah, A.M.; Quteshat, W.; Al-Madi, F. Exploring the factors affecting sustainable entrepreneurship in Jordan: A mixed-method approach. Sustainability 2022, 14, 1–16. [Google Scholar]
- Alshirah, H. Green marketing and its impact on the behavior of university students towards sustainable consumption in Saudi Arabia. Sustainability 2021, 13, 1–21. [Google Scholar]
- Hair, J.F. Sustainability in marketing: A systematic review and research agenda. J. Bus. Res. 2019, 98, 146–157. [Google Scholar]
- Awan, U.; Malik, M.I. Towards a sustainable supply chain: The impact of supplier integration and internal capabilities on sustainable performance. Sustainability 2021, 13, 1–21. [Google Scholar]
- Jabbour, C.J.; Santos, F.C. Organizational drivers and barriers to sustainability-oriented innovation: A systematic literature review. J. Clean. Prod. 2018, 172, 3507–3522. [Google Scholar]
- Tranfield, D.; Young, R.; Partington, D. Guest editors’ introduction to the special issue: Innovation through collaboration in the creation of sustainability. Res. Policy 2003, 32, 1701–1707. [Google Scholar]
- Abbas, T. Social and environmental dimensions of sustainable development: A review and critique. J. Clean. Prod. 2019, 213, 1173–1183. [Google Scholar]
- Abbas, T. Gender equality and sustainable development: A review and critique. J. Clean. Prod. 2020, 242, 118511. [Google Scholar]
- Abbas, T. Environmental sustainability and sustainable development: A review and critique. J. Clean. Prod. 2021, 279, 123698. [Google Scholar]
- Adebayo, O.S. Renewable energy and sustainable development in Africa: A critical review. Energy Policy 2021, 148, 111986. [Google Scholar]
- Adebayo, O.S. Renewable energy and economic growth nexus in Africa: The role of institutional quality. Energy Rep. 2021, 7, 1652–1659. [Google Scholar]
- Dumitrescu, E.I. Sustainable development and economic growth: A review of the theoretical literature. Int. J. Sustain. Dev. World Ecol. 2012, 19, 291–300. [Google Scholar]
- Pesaran, M.H. A simple panel unit root test in the presence of cross-section dependence. J. Appl. Econom. 2007, 22, 265–312. [Google Scholar] [CrossRef]
- Fornell, C.; Larcker, D.F. Evaluating structural equation models with unobservable variables and measurement error. J. Mark. Res. 1981, 18, 39–50. [Google Scholar] [CrossRef]
- Ahmad, M.; Ozkilic, Y.O.; Aksoylu, C.; Ali, S.; Arslan, M.H.; Deifalla, A.F. Investigating the role of ecolabels in promoting sustainable consumption behavior: Evidence from Turkey. Sustainability 2022, 14, 1–16. [Google Scholar]
- Abbas, J.; Comite, U.; Abdul Rahman, A.A.; Cismas, L.M. ESG performance and Islamic banks’ soundness in Southeast Asia. Sustainability 2022, 14, 1–20. [Google Scholar]
- Abbas, J.; Ashraf, S. Does financial development improve the environment in SAARC countries? An application of the environmental Kuznets curve. Sustainability 2021, 13, 1–15. [Google Scholar]
- Abbas, J.; Raza, S.A. Assessing the role of human capital in environmental degradation: Empirical evidence from South Asian countries. Sustainability 2021, 13, 1–16. [Google Scholar]
- Abbas, J.; Raza, S.A. Environmental consequences of globalization: Evidence from South Asian countries. Sustainability 2020, 12, 10061. [Google Scholar]
- Al-Khasawneh, A.L.; Lutfi, A.; AlSyouf, A. Examining the impact of ISO 9001 and ISO 14001 certifications on environmental performance: Evidence from the Jordanian industrial sector. Sustainability 2022, 14, 1–18. [Google Scholar]
- Al-Khasawneh, A.L.; Al-Qdah, M.T.; Al-Naser, E.S. Investigating the impact of environmental regulations on the performance of the Jordanian industrial sector. Sustainability 2021, 13, 1–15. [Google Scholar]
- Lutfi, A.; Al-Khasawneh, A.L.; El-Qulity, S.A. Determinants of sustainability disclosure practices in the Arab world: An institutional perspective. Sustainability 2020, 12, 1–23. [Google Scholar]
- Almasabha, G.; Almuflih, A.S.; Alshboul, O. Investigating the impact of digital transformation on corporate sustainability: Evidence from Jordanian SMEs. Sustainability 2022, 14, 1–20. [Google Scholar]
- Almuflih, A.S.; Alshboul, O.; Almasabha, G. Evaluating the impact of corporate social responsibility on firm performance: Evidence from Jordanian SMEs. Sustainability 2022, 14, 1–19. [Google Scholar]
- Alshboul, O.; Almasabha, G.; Almuflih, A.S. Assessing the impact of green marketing on consumer purchase intention: Evidence from Jordanian consumers. Sustainability 2021, 13, 1–19. [Google Scholar]
Figure 1.
Map of corresponding authors’ countries.
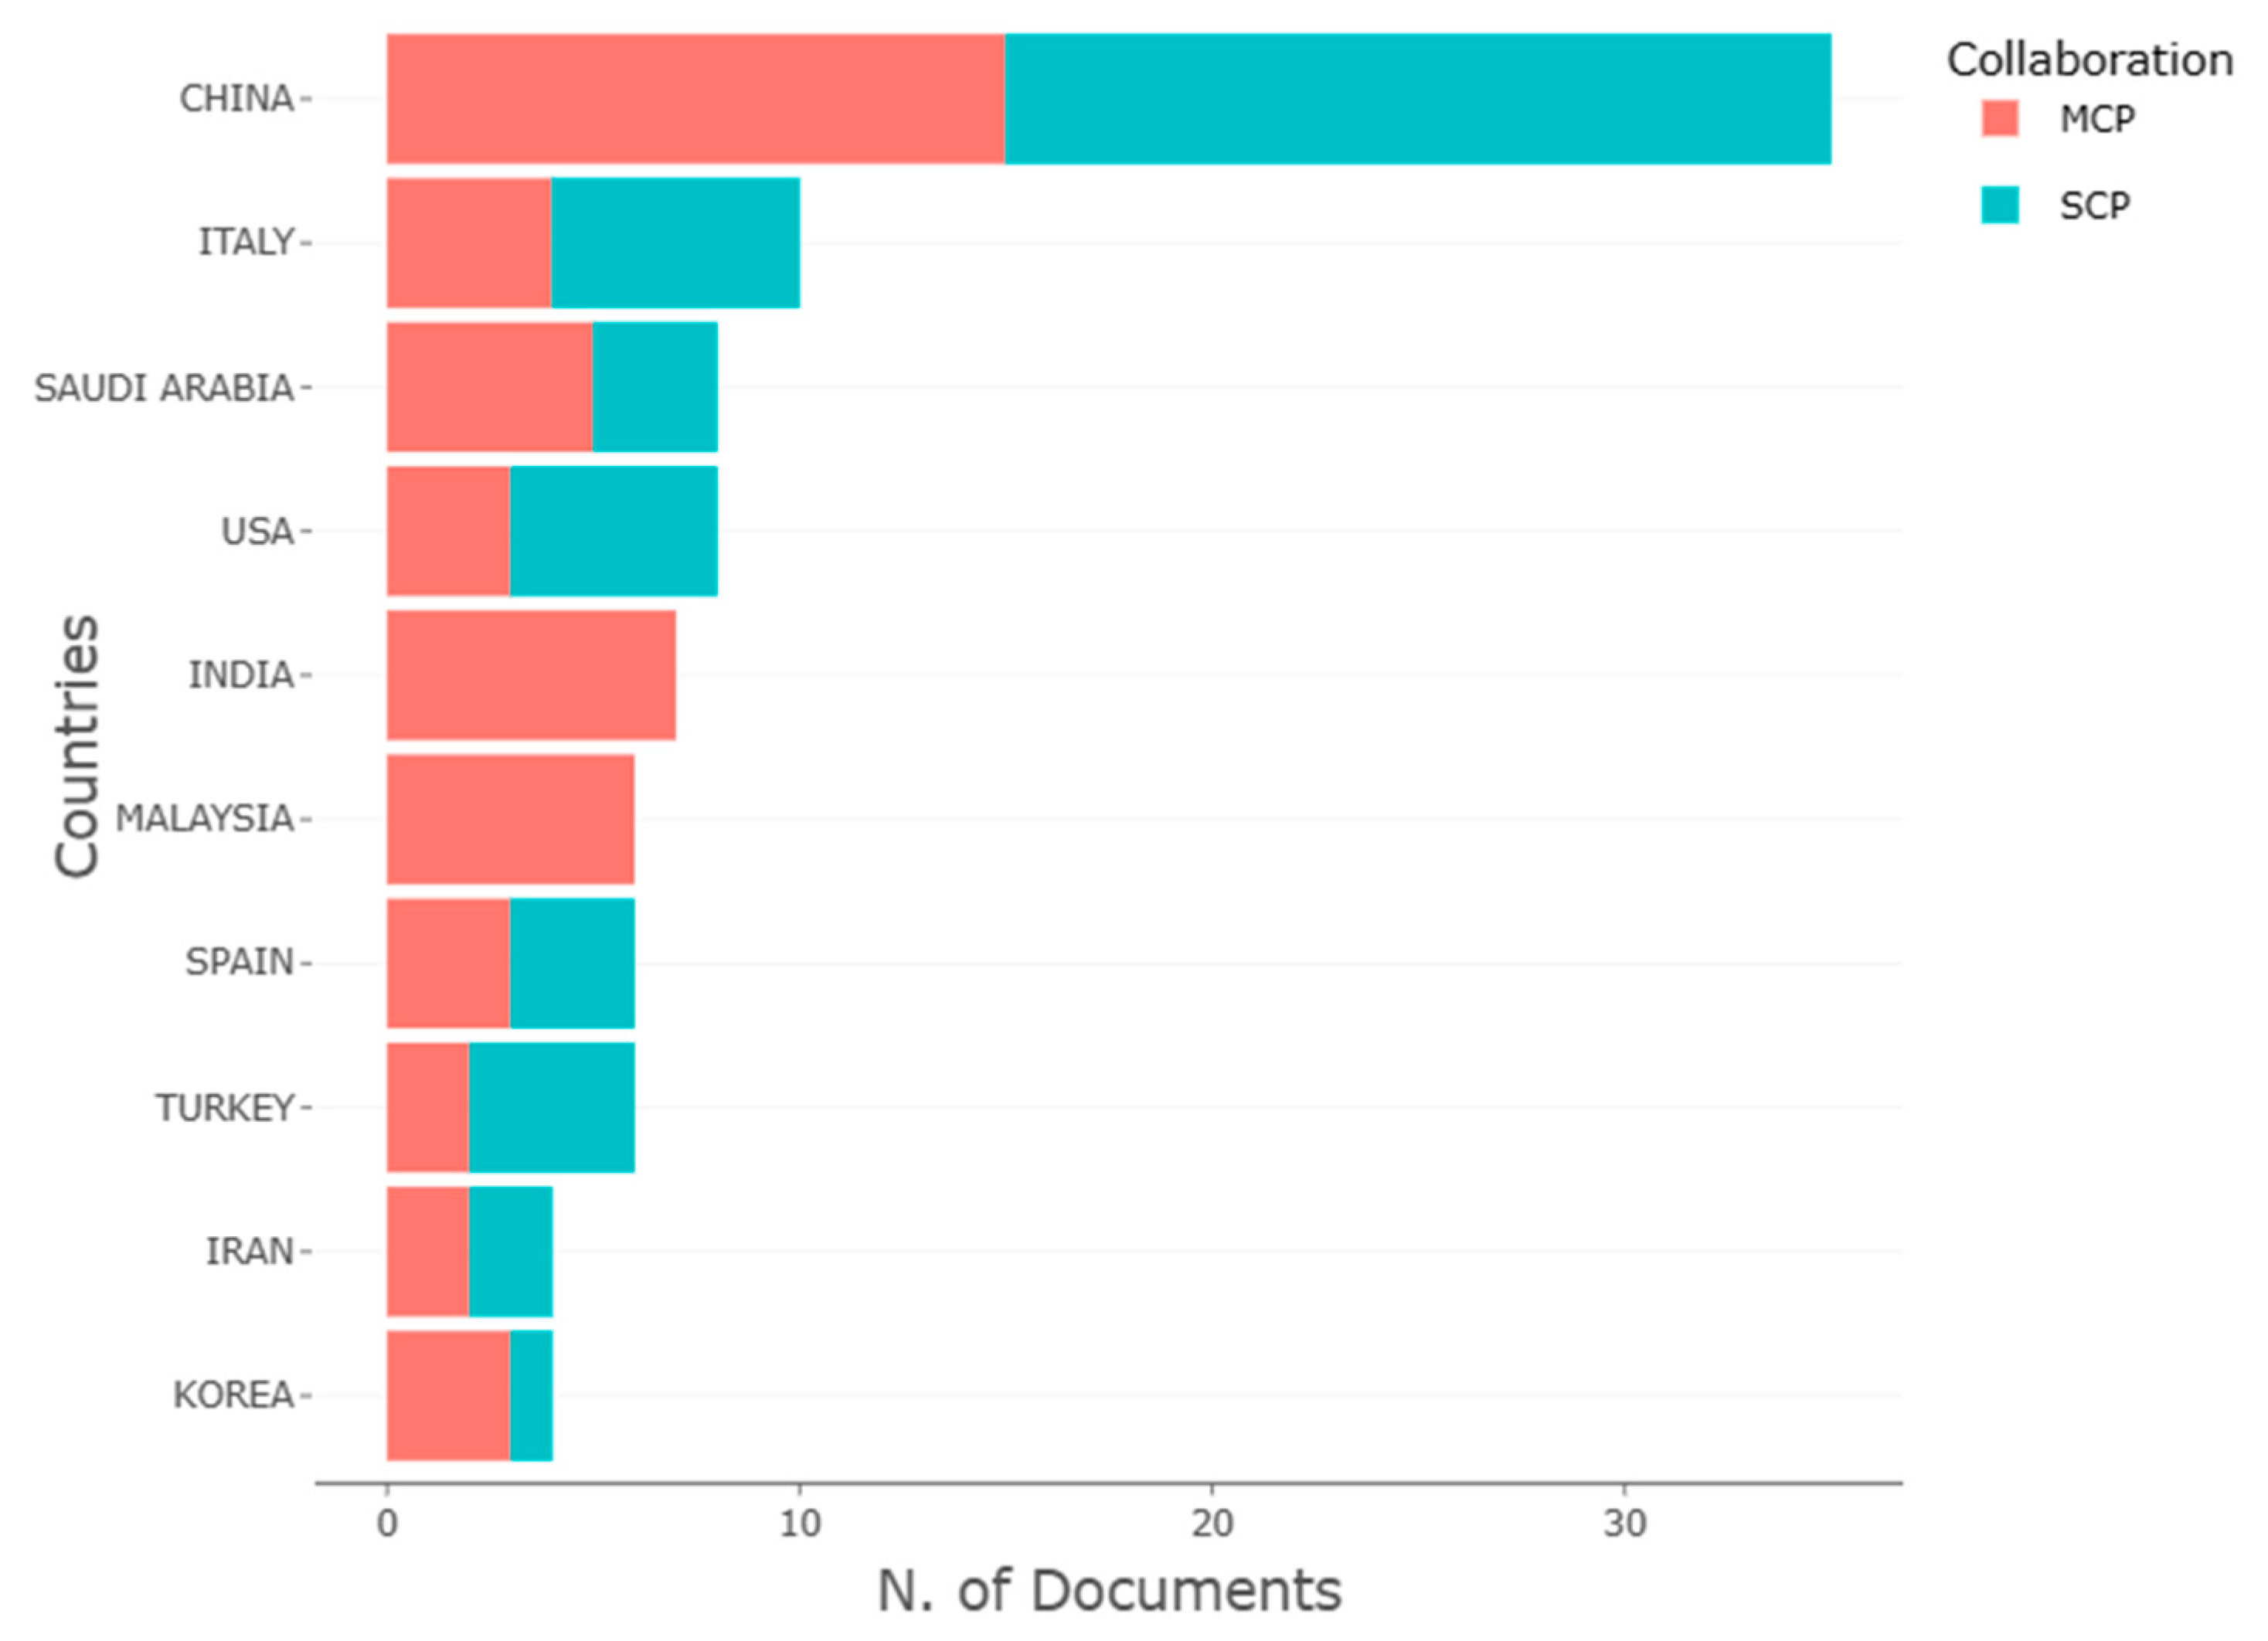
Figure 2.
Word cloud of words used most frequently in Sustainability.
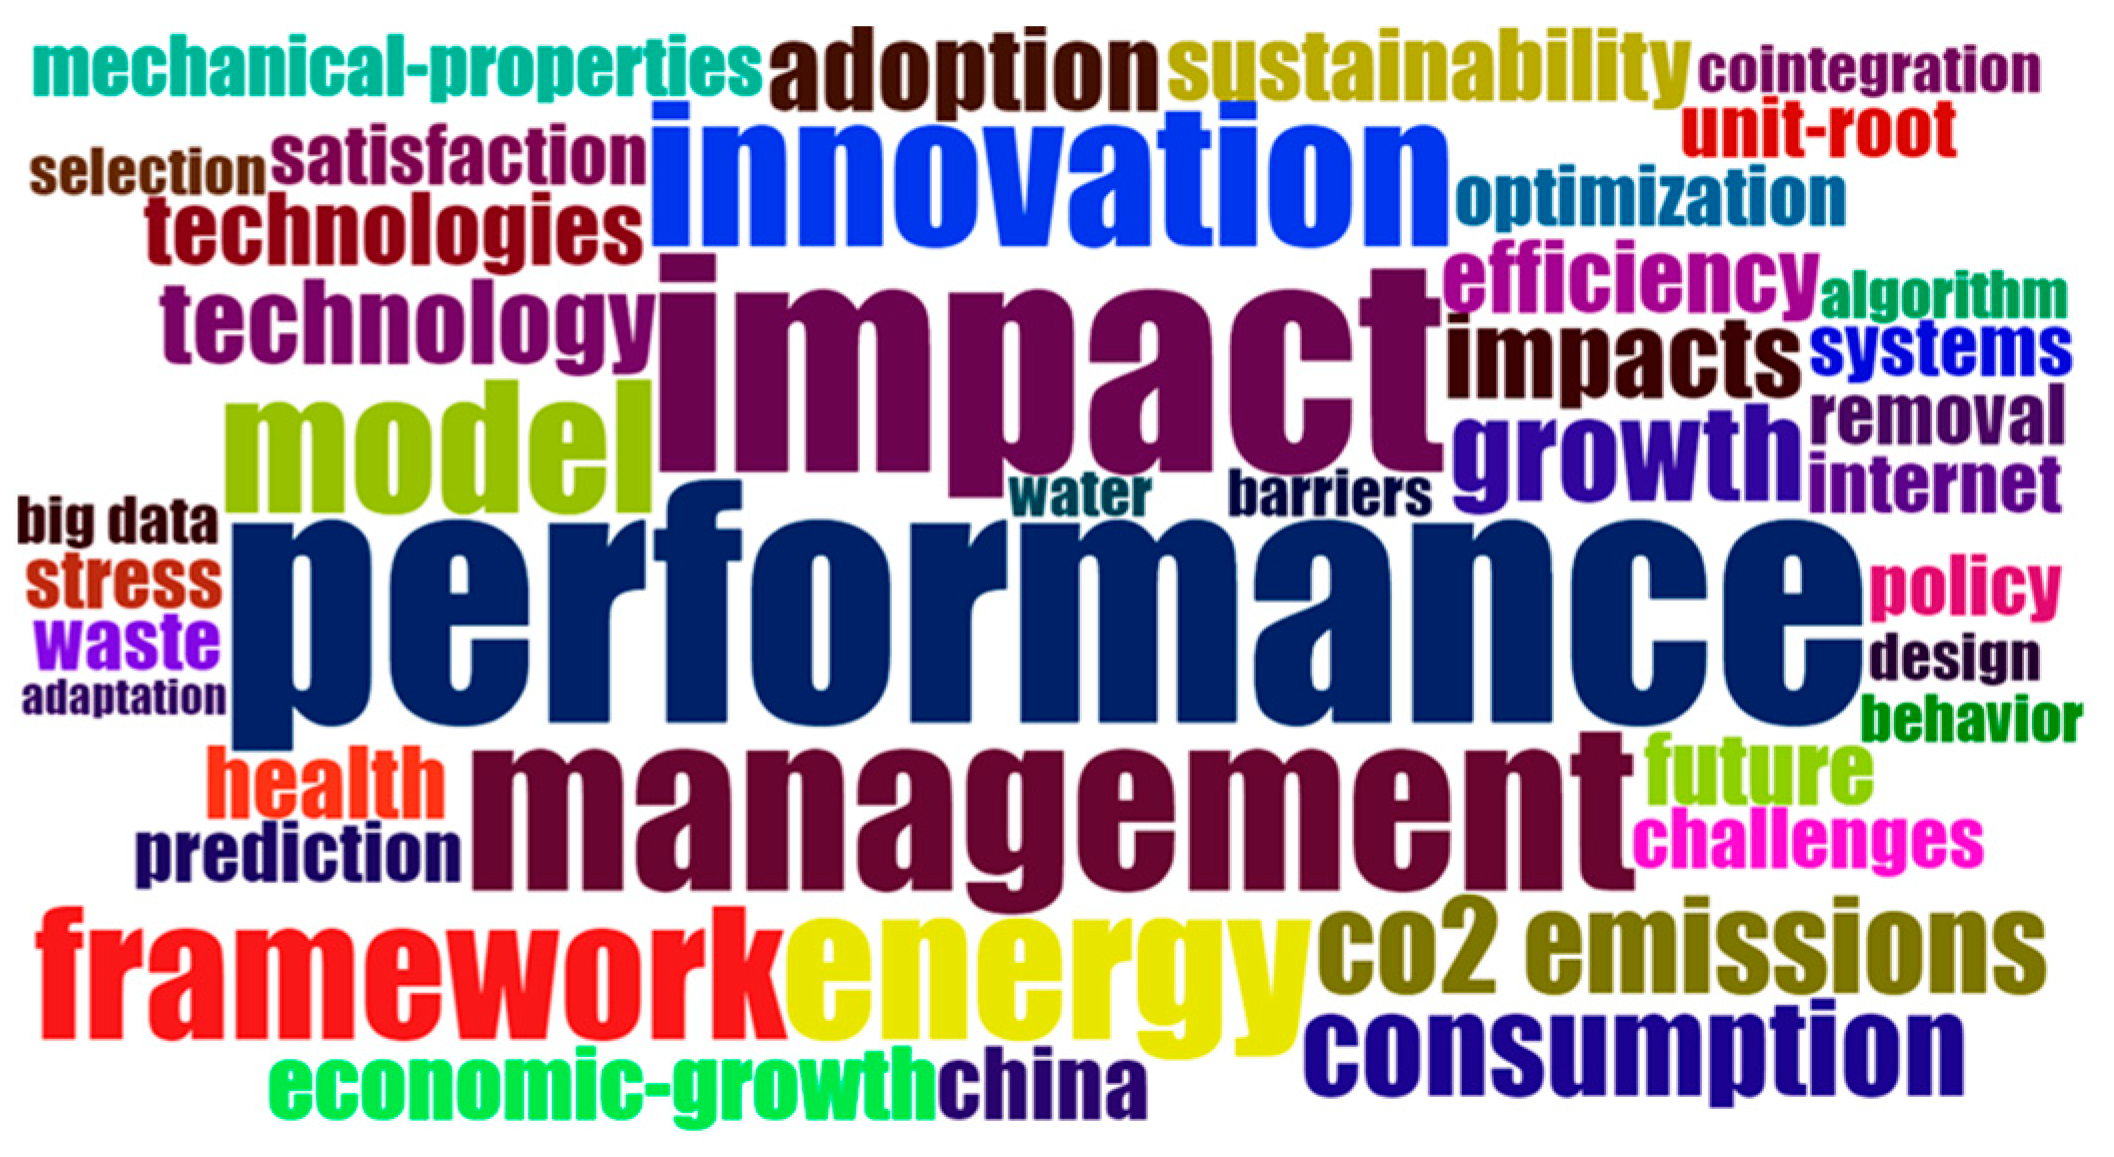
Figure 3.
Co-occurrence network of keywords in Sustainability.
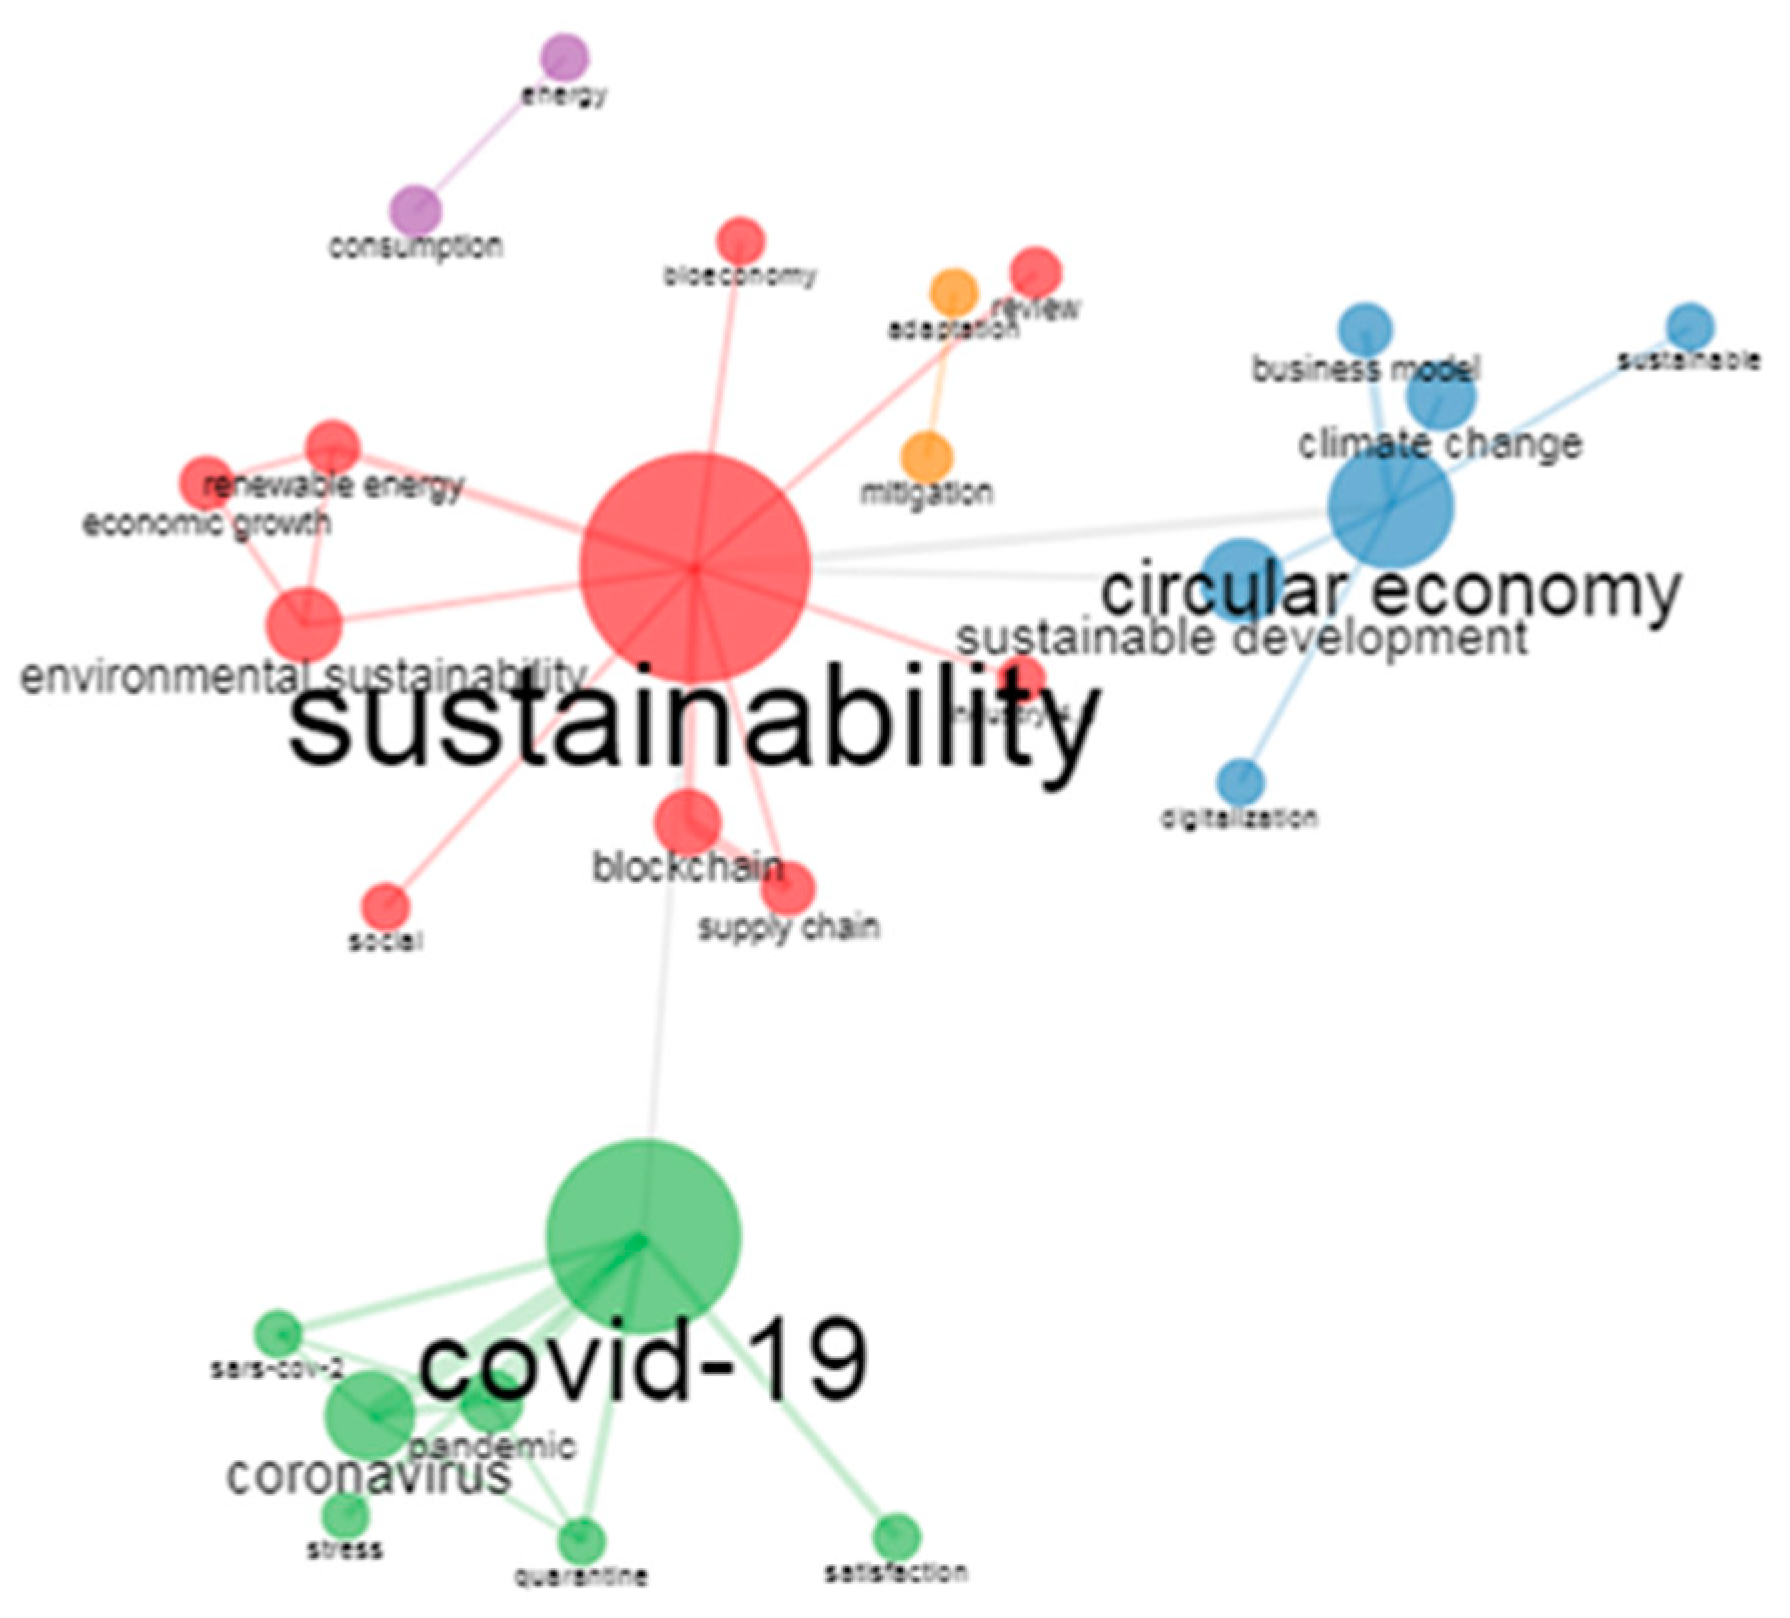
Figure 4.
Thematic map of the most frequently occurring words.
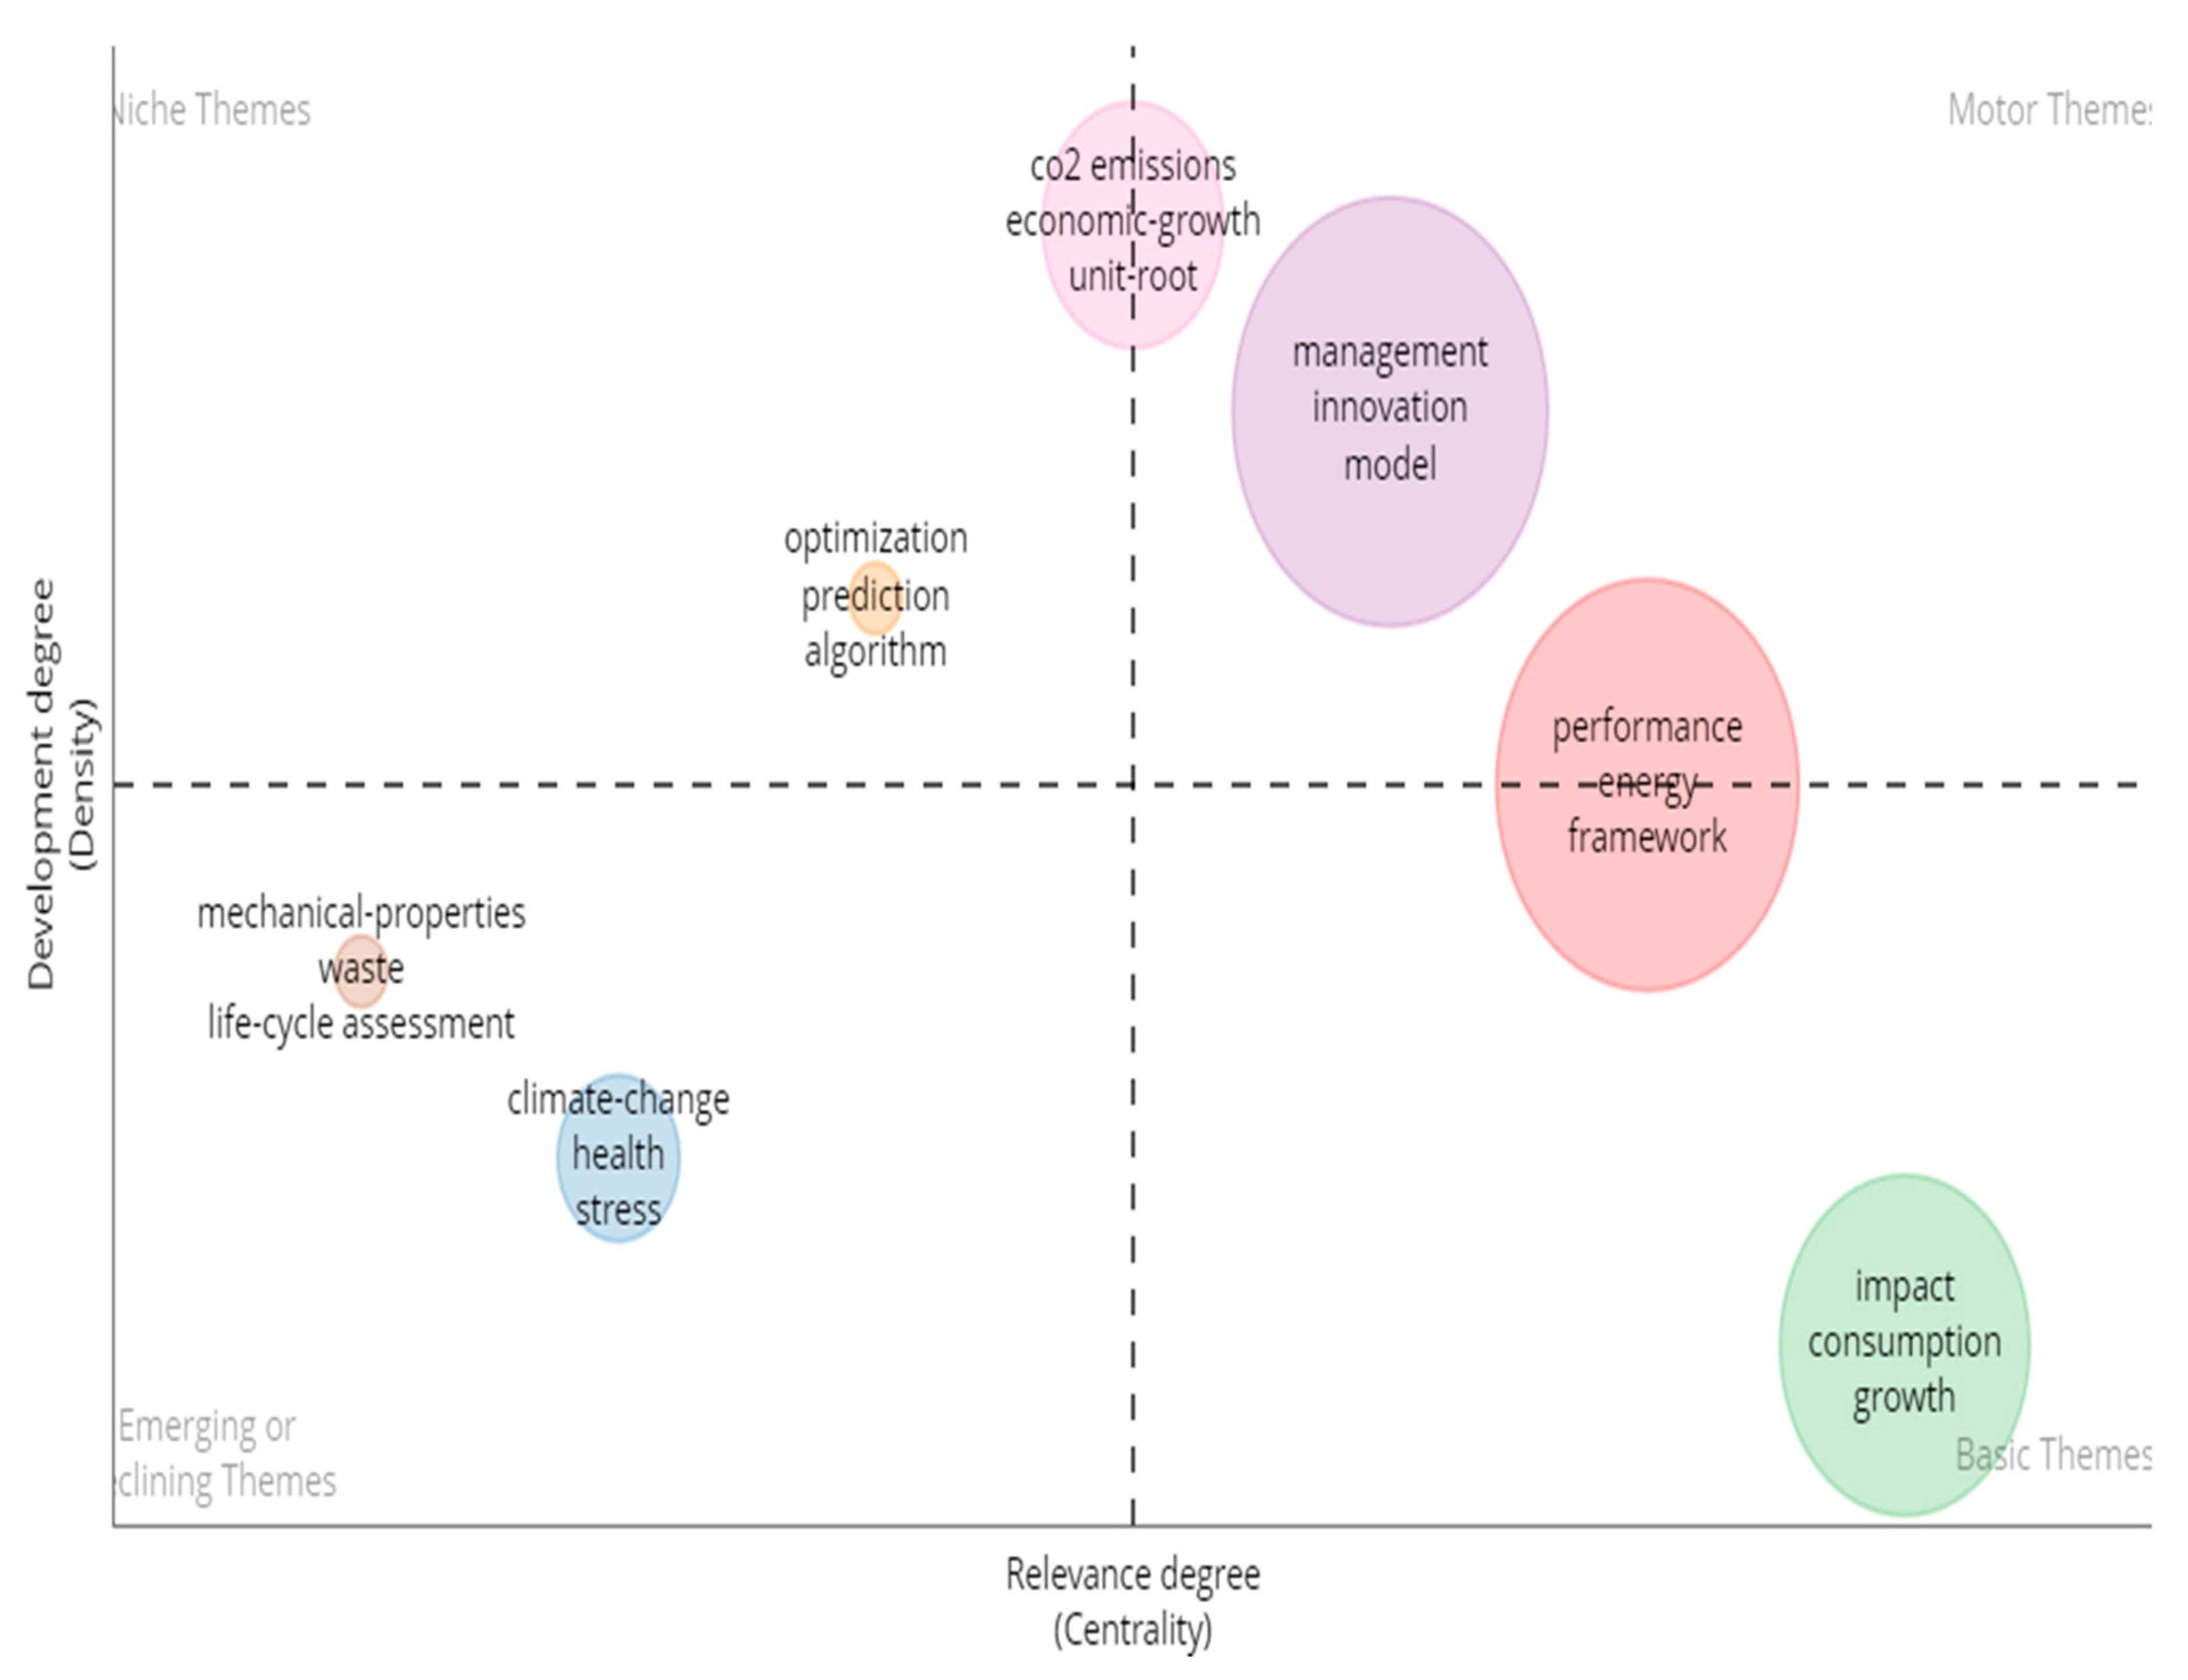
Figure 5.
Thematic evolution of topics in Sustainability.
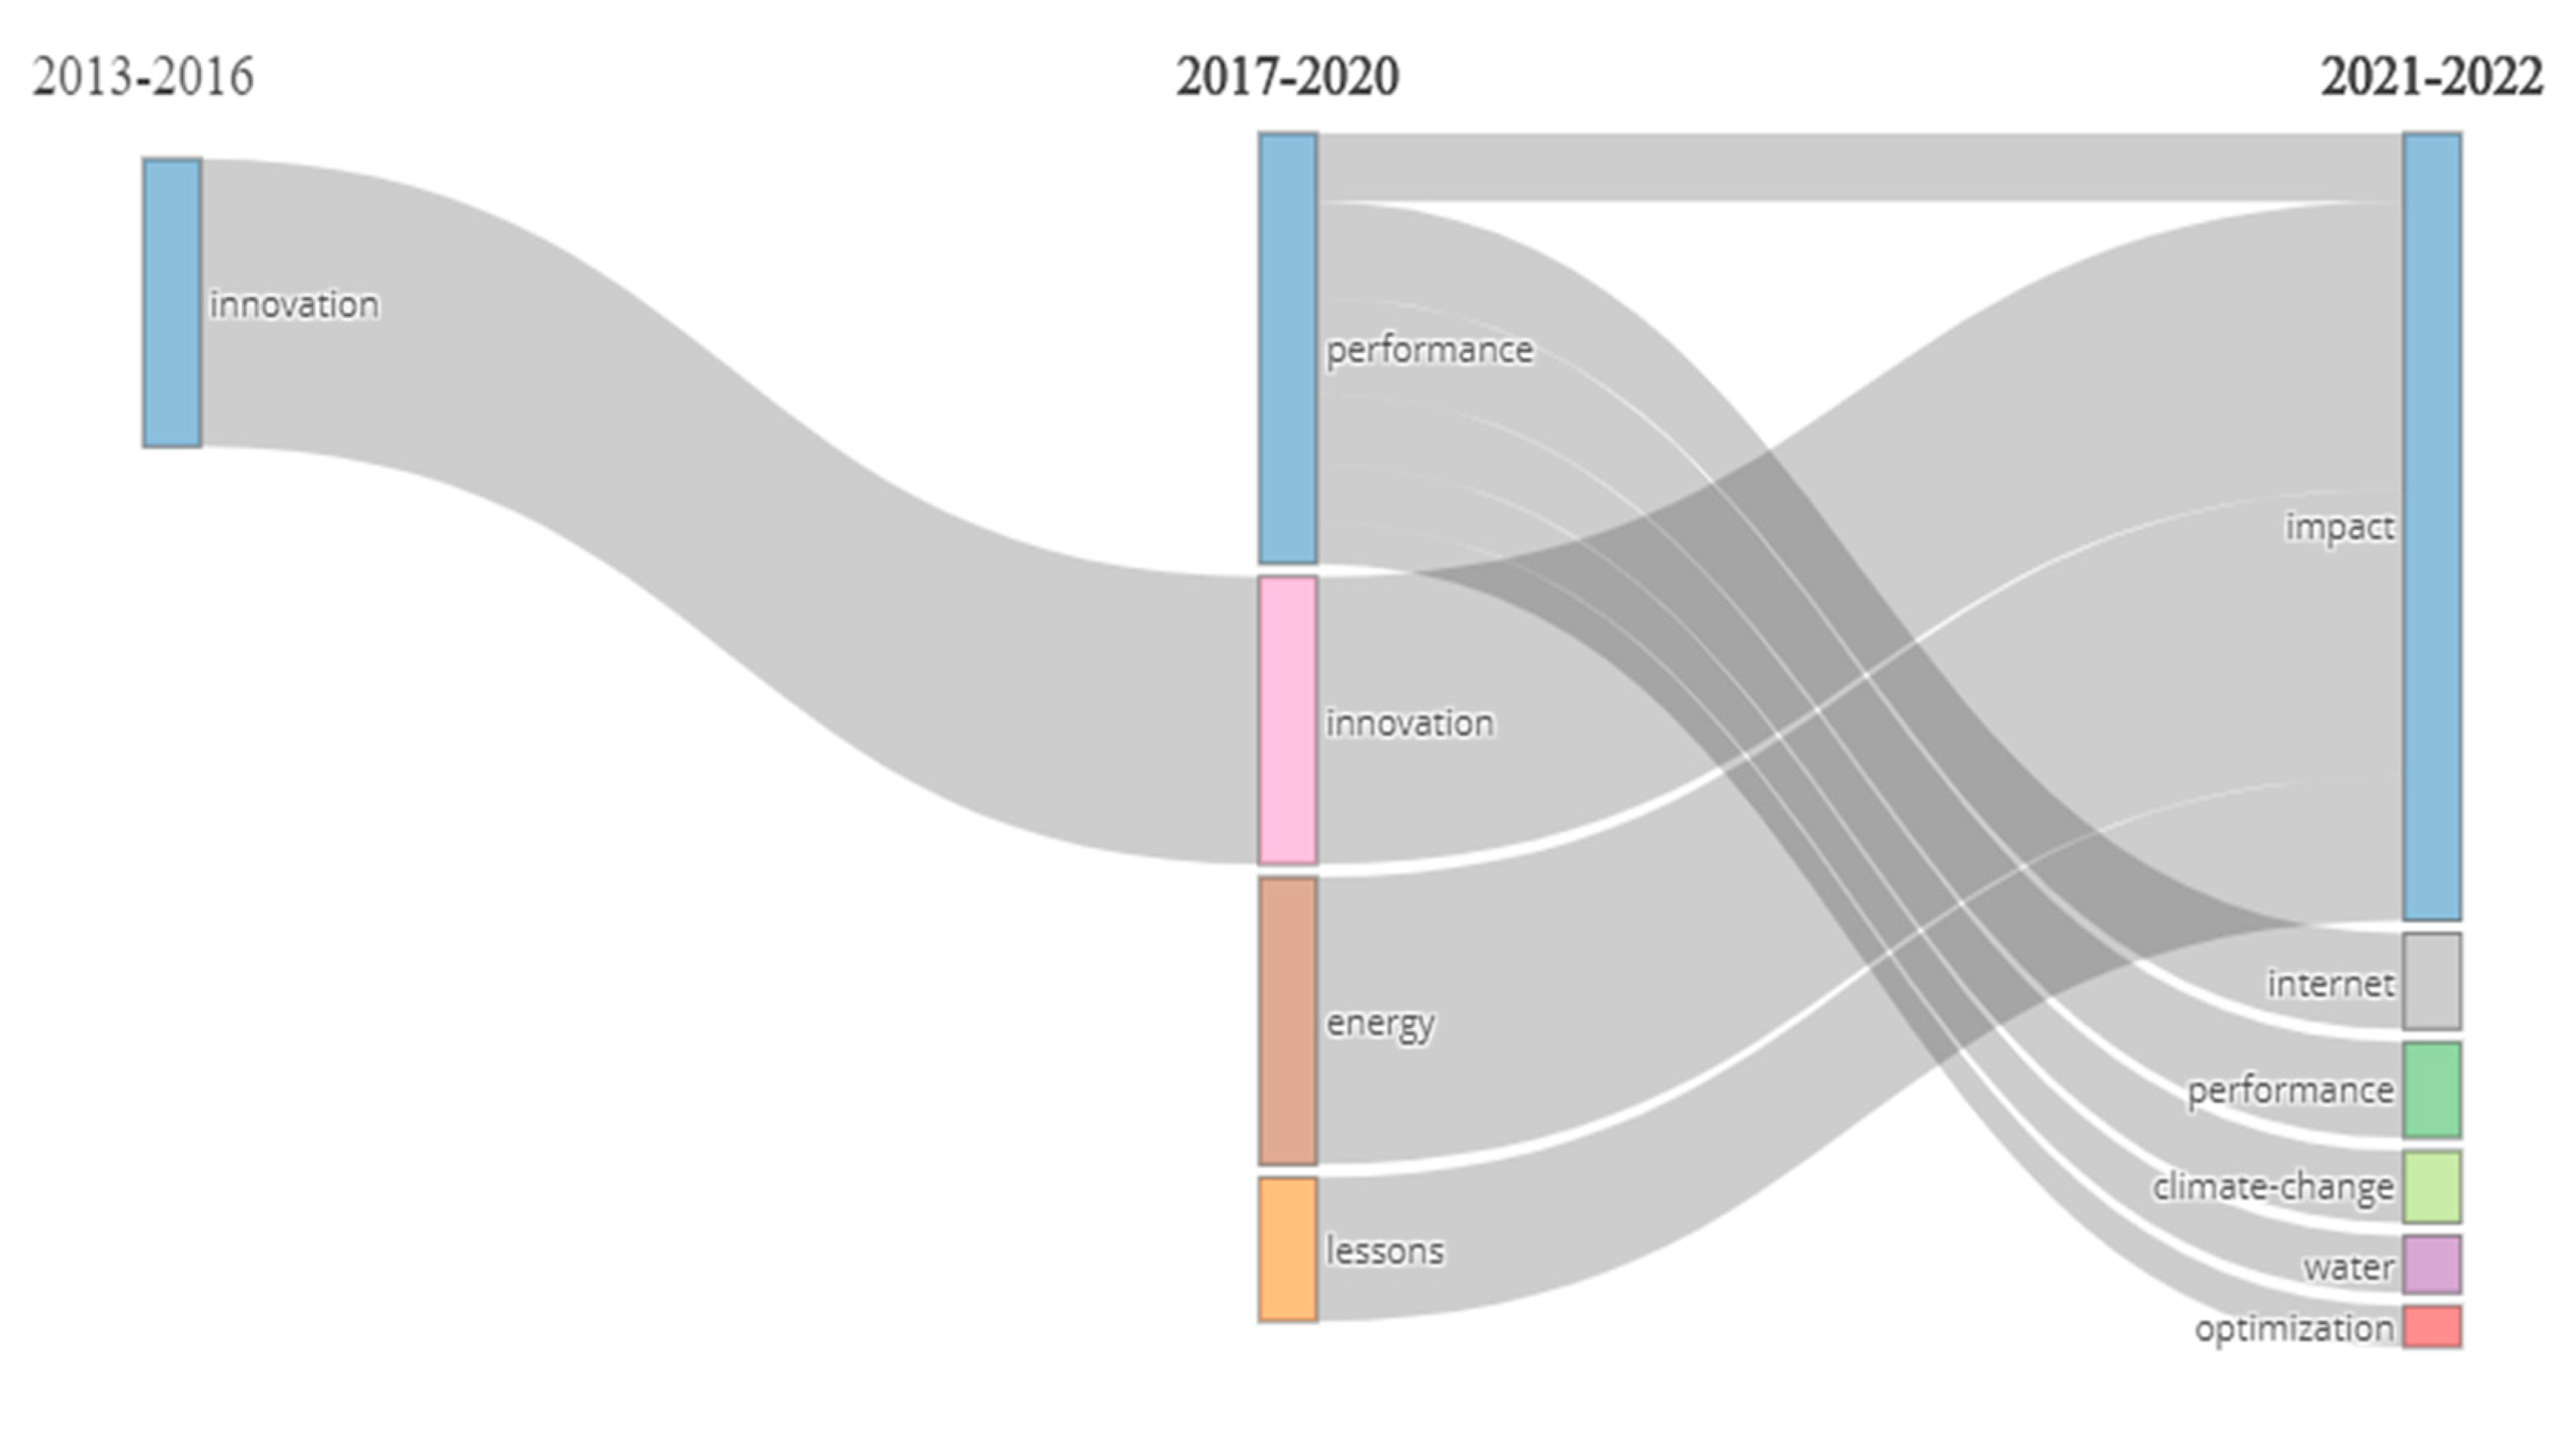
Figure 6.
Co-citation network map of highly cited papers in Sustainability.
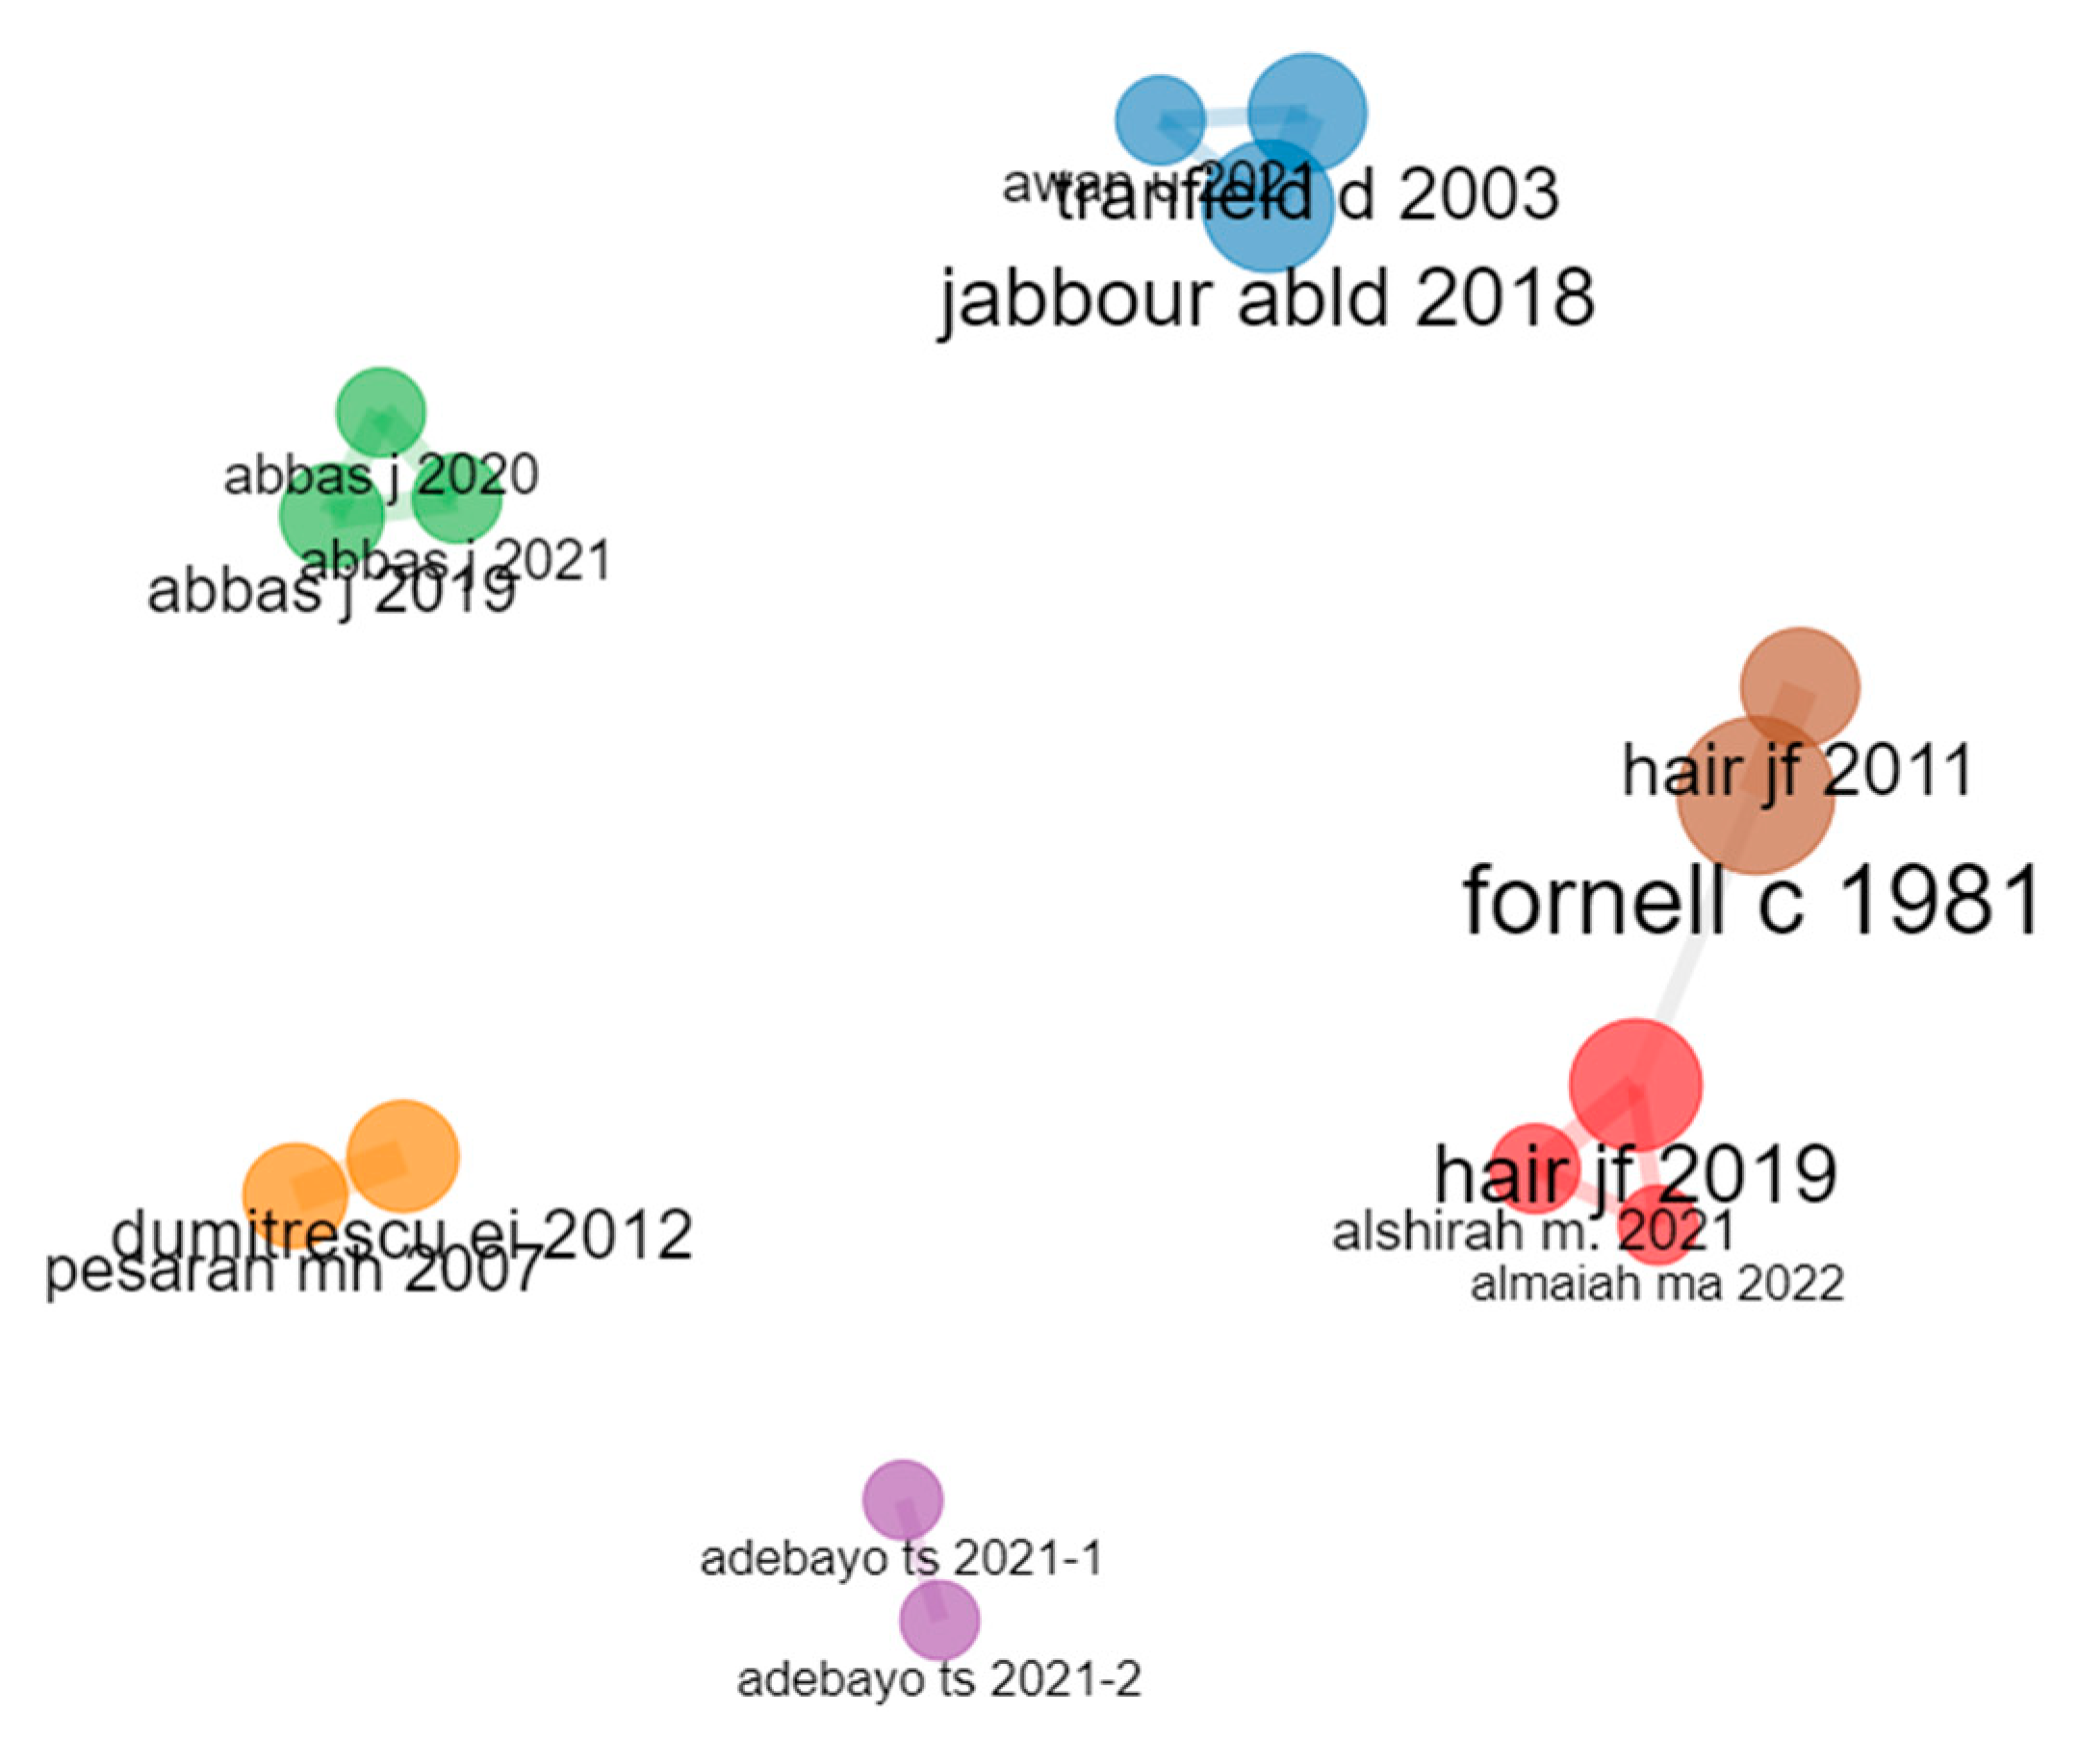
Figure 7.
Collaboration network of highly cited papers in Sustainability.
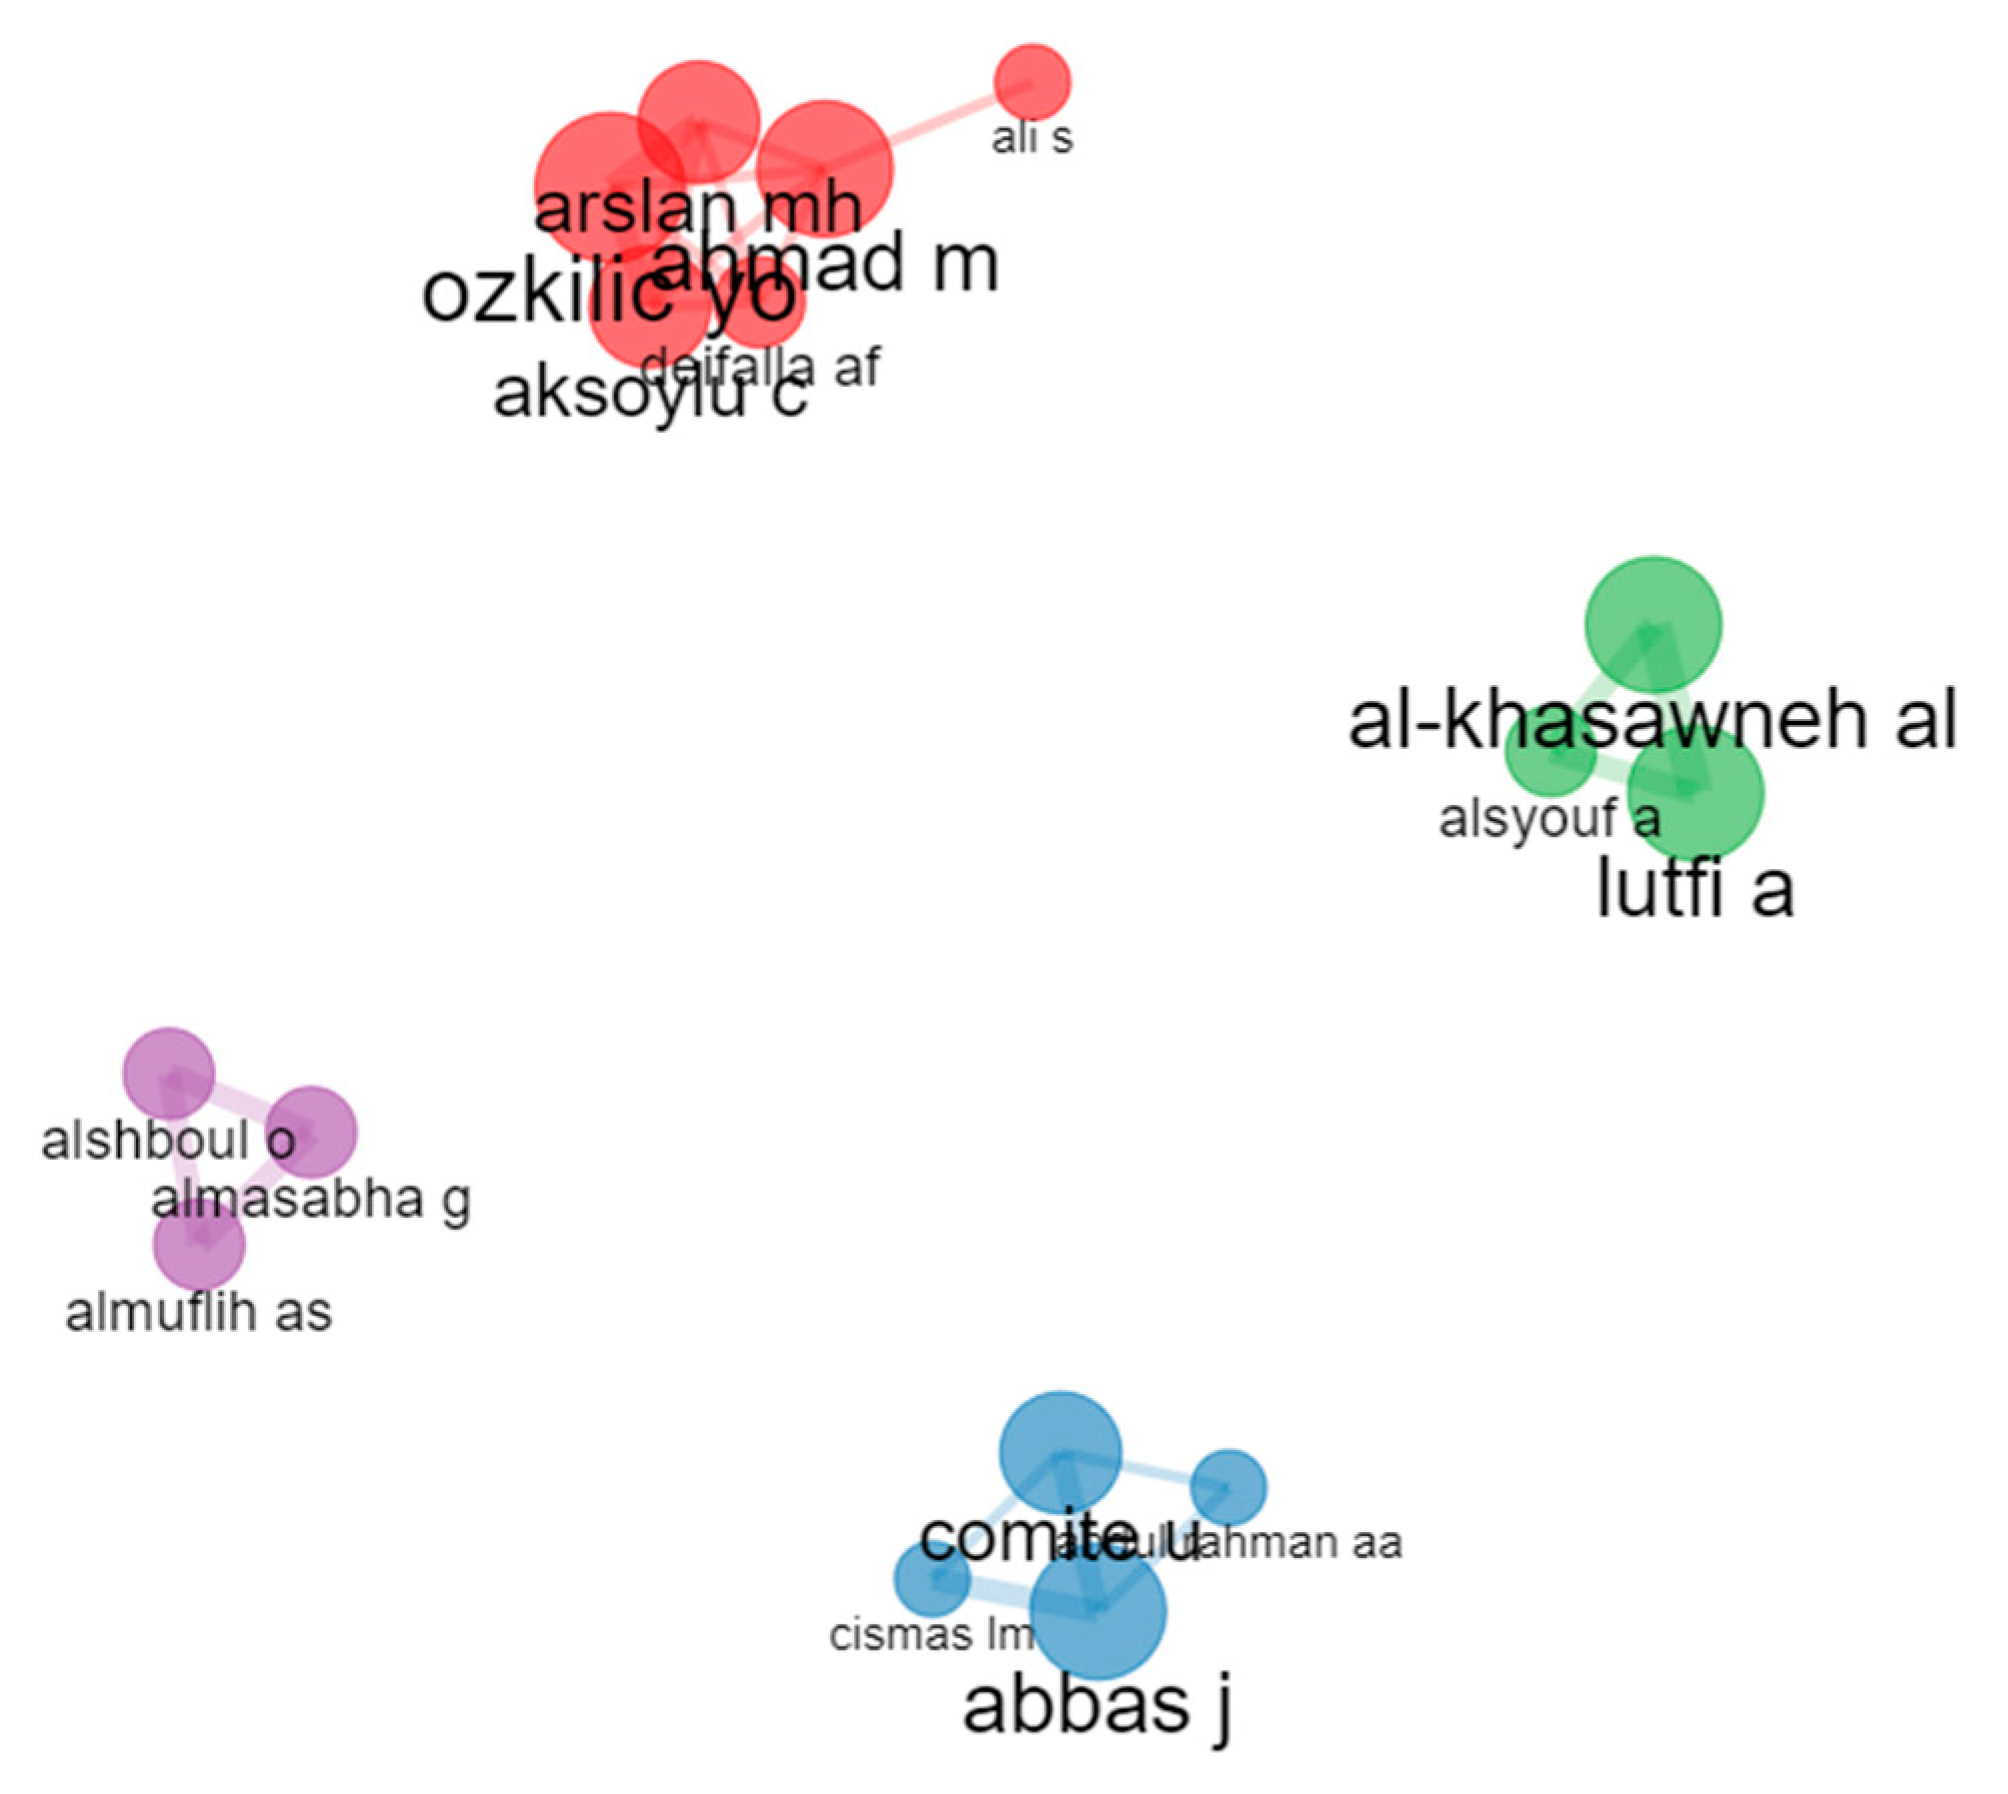

Table 1.
Journal history of Sustainability.
| Year | Milestones |
|---|---|
| 2009 | Inaugural issue; published quarterly |
| 2010 | Adopted monthly publication schedule |
| 2013 | Indexed in SCIE and SSCI; established 10 sections |
| 2015 | Impact Factor (2014): 0.942; added Sustainable Chemistry section |
| 2016 | Impact Factor (2015): 1.343 |
| 2017 | Impact Factor (2016): 1.789; affiliated with SURE; announced 2017 Outstanding Reviewer Award; held 6th World Sustainability Forum; sponsored Sardinia Symposium 2017 |
| 2018 | Impact Factor (2017): 2.075; added Sustainable Transportation and Geography and Sustainability sections; announced 2019 Travel Award; 10th Anniversary; sponsored 7th World Sustainability Forum; published 10,000th paper; announced 2018 Young Investigator Award; sponsored BES Annual Meeting 2018 |
| 2019 | Impact Factor (2018): 2.592; adopted semimonthly publication schedule; announced 2019 Best Paper Award; affiliated with CUTRIC; added Psychology of Sustainability and Sustainable Development sections |
| 2020 | Impact Factor (2019): 2.576; added eight new sections; affiliated with CIB |
| 2021 | Impact Factor (2020): 3.251; added eight new sections |
| 2022 | Impact Factor (2021): 3.889; CiteScore (2022): 5.0 |
Table 2.
Highly cited papers’ structure in Sustainability between 2013 and 2022.
| Description | Results |
|---|---|
| MAIN INFORMATION ABOUT DATA | |
| Timespan | 2013:2022 |
| Sources (journals, books, etc.) | 1 |
| Documents | 161 |
| Annual growth rate % | 53.57 |
| Document average age | 2.11 |
| Average citations per document | 88.12 |
| References | 1 |
| DOCUMENT CONTENTS | |
| Keywords Plus (ID) | 775 |
| Author’s Keywords (DE) | 837 |
| AUTHORS | |
| Authors | 723 |
| Authors of single-authored documents | 4 |
| AUTHOR COLLABORATION | |
| Single-authored documents | 4 |
| Co-authors per document | 4.82 |
| International co-authorships % | 60.87 |
| DOCUMENT TYPES | |
| Article | 131 |
| Article; proceedings paper | 1 |
| Review | 29 |
Table 3.
Top 10 most relevant authors in Sustainability.
| Authors | Articles | Articles Fractionalized |
|---|---|---|
| Jawad Abbas | 3 | 0.49 |
| Muhammad Ahmad | 3 | 0.34 |
| Alaa Al-Khasawneh | 3 | 0.51 |
| Umar Awan | 3 | 0.83 |
| Ugo Comite | 3 | 0.49 |
| Chunjiang Li | 3 | 0.56 |
| Ahmad Lutfi | 3 | 0.51 |
| Yilmaz Onur Ozkilic | 3 | 0.59 |
| Abdul Aziz Abdul Rahman | 2 | 0.40 |
| Tolulope Samuel Adebayo | 2 | 0.67 |
Table 4.
Top 10 authors in Sustainability.
| Element | h-index | g-index | m-index | TC | NP | PY_start |
|---|---|---|---|---|---|---|
| ABBAS J | 3 | 3 | 1.5 | 61 | 3 | 2022 |
| AHMAD M | 3 | 3 | 1 | 103 | 3 | 2021 |
| AL-KHASAWNEH AL | 3 | 3 | 1.5 | 85 | 3 | 2022 |
| AWAN U | 3 | 3 | 1 | 145 | 3 | 2021 |
| COMITE U | 3 | 3 | 1.5 | 68 | 3 | 2022 |
| LI C | 3 | 3 | 0.5 | 351 | 3 | 2018 |
| LUTFI A | 3 | 3 | 1.5 | 85 | 3 | 2022 |
| OZKILIC YO | 3 | 3 | 1.5 | 91 | 3 | 2022 |
| ABDUL RAHMAN AA | 2 | 2 | 1 | 47 | 2 | 2022 |
| ADEBAYO TS | 2 | 2 | 0.667 | 106 | 2 | 2021 |
Table 5.
Most relevant affiliations in Sustainability.
| Affiliation | Articles |
|---|---|
| King Faisal University | 19 |
| University of Technology Malaysia | 10 |
| King Saud University | 8 |
| University Utara Malaysia | 8 |
| Islamic Azad University | 7 |
| Kingdom University | 7 |
| Lund University | 7 |
| University of Technology Malaysia | 7 |
| Beijing Institute of Technology | 6 |
| Federal University of Pará | 6 |
Table 6.
Corresponding authors’ countries in Sustainability.
| Country | Articles | SCP | MCP | Freq | MCP Ratio |
|---|---|---|---|---|---|
| CHINA | 35 | 20 | 15 | 0.217 | 0.429 |
| ITALY | 10 | 6 | 4 | 0.062 | 0.4 |
| SAUDI ARABIA | 8 | 3 | 5 | 0.05 | 0.625 |
| USA | 8 | 5 | 3 | 0.05 | 0.375 |
| INDIA | 7 | 0 | 7 | 0.043 | 1 |
| MALAYSIA | 6 | 0 | 6 | 0.037 | 1 |
| SPAIN | 6 | 3 | 3 | 0.037 | 0.5 |
| TURKEY | 6 | 4 | 2 | 0.037 | 0.333 |
| IRAN | 4 | 2 | 2 | 0.025 | 0.5 |
| KOREA | 4 | 1 | 3 | 0.025 | 0.75 |
Table 7.
Country scientific production in Sustainability.
| Region | Freq |
|---|---|
| China | 158 |
| Saudi Arabia | 61 |
| India | 50 |
| Italy | 44 |
| Malaysia | 44 |
| Pakistan | 38 |
| Turkey | 35 |
| USA | 33 |
| Egypt | 22 |
| Spain | 22 |
Table 8.
Most cited countries in Sustainability.
| Country | TC | Average Article Citations |
|---|---|---|
| China | 1447 | 41.34 |
| USA | 1278 | 159.75 |
| Italy | 1137 | 113.70 |
| Romania | 816 | 204.00 |
| Spain | 753 | 125.50 |
| Poland | 721 | 180.25 |
| Netherlands | 694 | 231.33 |
| Sweden | 640 | 213.33 |
| Korea | 622 | 155.50 |
| Norway | 604 | 302.00 |
Table 9.
Most frequently used words in Sustainability.
| Words | Occurrences |
|---|---|
| performance | 20 |
| impact | 18 |
| management | 14 |
| energy | 12 |
| innovation | 12 |
| framework | 11 |
| model | 11 |
| climate change | 8 |
| CO2 emissions | 8 |
| consumption | 8 |
Table 10.
Co-occurrence network of keywords in Sustainability.
| Node | Cluster | Betweenness | Closeness | PageRank |
|---|---|---|---|---|
| sustainability | 1 | 191.00 | 0.03 | 0.14 |
| blockchain | 1 | 0.00 | 0.02 | 0.04 |
| environmental sustainability | 1 | 8.00 | 0.02 | 0.04 |
| renewable energy | 1 | 12.00 | 0.02 | 0.04 |
| supply chain | 1 | 0.00 | 0.02 | 0.03 |
| bioeconomy | 1 | 0.00 | 0.02 | 0.02 |
| economic growth | 1 | 0.00 | 0.01 | 0.03 |
| industry 4.0 | 1 | 0.00 | 0.02 | 0.02 |
| review | 1 | 0.00 | 0.02 | 0.02 |
| social | 1 | 0.00 | 0.02 | 0.02 |
| circular economy | 2 | 78.00 | 0.02 | 0.09 |
| climate change | 2 | 0.00 | 0.02 | 0.02 |
| sustainable development | 2 | 0.00 | 0.02 | 0.03 |
| business model | 2 | 0.00 | 0.02 | 0.02 |
| digitalization | 2 | 0.00 | 0.02 | 0.02 |
| sustainable | 2 | 0.00 | 0.02 | 0.02 |
| COVID-19 | 3 | 105.53 | 0.02 | 0.10 |
| coronavirus | 3 | 0.24 | 0.02 | 0.05 |
| pandemic | 3 | 0.24 | 0.02 | 0.04 |
| quarantine | 3 | 0.00 | 0.02 | 0.03 |
| SARS-CoV-2 | 3 | 0.00 | 0.02 | 0.03 |
| satisfaction | 3 | 0.00 | 0.02 | 0.02 |
| stress | 3 | 0.00 | 0.02 | 0.02 |
| consumption | 4 | 0.00 | 1.00 | 0.04 |
| energy | 4 | 0.00 | 1.00 | 0.04 |
| mitigation | 5 | 0.00 | 1.00 | 0.04 |
| adaptation | 5 | 0.00 | 1.00 | 0.04 |
Table 12.
Thematic evolution in Sustainability.
| From | To | Words | Weighted Inclusion Index | Inclusion Index | Stability Index |
|---|---|---|---|---|---|
| innovation—2013–2016 | innovation—2017–2020 | innovation | 1.00 | 1.00 | 0.33 |
| energy—2017–2020 | impact—2021–2022 | energy | 1.00 | 1.00 | 0.03 |
| innovation—2017–2020 | impact—2021–2022 | innovation | 1.00 | 1.00 | 0.03 |
| lessons—2017–2020 | impact—2021–2022 | policy | 0.50 | 0.50 | 0.03 |
| performance—2017–2020 | climate-change—2021–2022 | prediction | 0.25 | 0.50 | 0.11 |
| performance—2017–2020 | impact—2021–2022 | impact; framework | 0.24 | 0.13 | 0.02 |
| performance—2017–2020 | internet—2021–2022 | big data | 0.33 | 0.50 | 0.11 |
| performance—2017–2020 | optimization—2021–2022 | systems | 0.14 | 0.25 | 0.09 |
| performance—2017–2020 | performance—2021–2022 | performance; model | 0.33 | 0.13 | 0.05 |
| performance—2017–2020 | water—2021–2022 | health | 0.20 | 0.25 | 0.09 |
Table 13.
Co-citation network in Sustainability.
| Node | Cluster | Betweenness | Closeness | PageRank |
|---|---|---|---|---|
| Almaiah Ma 2022 | 1 | 0 | 0.04 | 0.06 |
| Alshirah M. 2021 | 1 | 0 | 0.04 | 0.07 |
| Hair Jf 2019 | 1 | 4 | 0.06 | 0.08 |
| Awan U2021 | 2 | 0 | 0.10 | 0.05 |
| Jabbour Abld 2018 | 2 | 0 | 0.10 | 0.07 |
| Tranfield D 2003 | 2 | 0 | 0.10 | 0.07 |
| Abbas J 2020 | 3 | 0 | 0.10 | 0.07 |
| Abbas J 2021 | 3 | 0 | 0.10 | 0.07 |
| Abbas J 2019 | 3 | 0 | 0.10 | 0.07 |
| Adebayo Ts 2021-1 | 4 | 0 | 0.20 | 0.07 |
| Adebayo Ts 2021-2 | 4 | 0 | 0.20 | 0.07 |
| Dumitrescu Ei 2012 | 5 | 0 | 0.20 | 0.07 |
| Pesaran Mh 2007 | 5 | 0 | 0.20 | 0.07 |
| Fornell C 1981 | 6 | 3 | 0.06 | 0.07 |
| Hair Jf 2011 | 6 | 0 | 0.03 | 0.06 |
Table 15.
Collaboration network.
| Node | Cluster | Betweenness | Closeness | PageRank |
|---|---|---|---|---|
| Ahmad M | 1 | 4.00 | 0.20 | 0.07 |
| Ozkilic YO | 1 | 0.00 | 0.17 | 0.08 |
| Aksoylu C | 1 | 0.00 | 0.17 | 0.08 |
| Ali S | 1 | 0.00 | 0.11 | 0.02 |
| Arslan Mh | 1 | 0.00 | 0.17 | 0.08 |
| Deifalla Af | 1 | 0.00 | 0.17 | 0.05 |
| Abbas J | 2 | 0.67 | 0.33 | 0.09 |
| Comite U | 2 | 0.33 | 0.33 | 0.07 |
| Abdul Rahman Aa | 2 | 0.00 | 0.25 | 0.04 |
| Cismas Lm | 2 | 0.00 | 0.25 | 0.05 |
| Al-Khasawneh Al | 3 | 0.00 | 0.50 | 0.07 |
| Lutfi A | 3 | 0.00 | 0.50 | 0.07 |
| Alsyouf A | 3 | 0.00 | 0.50 | 0.05 |
| Almasabha G | 4 | 0.00 | 0.50 | 0.06 |
| Almuflih As | 4 | 0.00 | 0.50 | 0.06 |
| Alshboul O | 4 | 0.00 | 0.50 | 0.06 |
Disclaimer/Publisher’s Note: The statements, opinions and data contained in all publications are solely those of the individual author(s) and contributor(s) and not of MDPI and/or the editor(s). MDPI and/or the editor(s) disclaim responsibility for any injury to people or property resulting from any ideas, methods, instructions or products referred to in the content. |
© 2023 by the authors. Licensee MDPI, Basel, Switzerland. This article is an open access article distributed under the terms and conditions of the Creative Commons Attribution (CC BY) license (http://creativecommons.org/licenses/by/4.0/).
Copyright: This open access article is published under a Creative Commons CC BY 4.0 license, which permit the free download, distribution, and reuse, provided that the author and preprint are cited in any reuse.


