
Submitted:
23 April 2023
Posted:
23 April 2023
You are already at the latest version
Abstract
Lameness on dairy goat farms is a welfare concern and could negatively affect milk production. This study's objective was to evaluate the effects of clinical lameness on the daily milk production of dairy goats. Between July 2019 and June 2020, 11,847 test-day records were collected from 3,145 goats on three farms in New Zealand. Locomotion scoring of goats used a 5-point scoring system (0 to 4). The dataset was split into two groups by lactation type, where goats were classified as being in seasonal lactation (≤305 days in milk) or extended lactation (>305 days in milk). A linear mixed model was used to analyze datasets using milk characteristics as the dependent variables. Clinically lame goats (score 3 or 4) in seasonal and extended lactation produced 2.63% and 4.66% less milk than goats not lame, respectively. Severely lame goats (score 4) in seasonal and extended lactation produced 7.10% and 8.56% less milk than goats not lame, respectively. The estimated average daily milk income lost was between NZD 26 and 104 per goat. This study established the negative impact of lameness on milk production and annual income in dairy goats on three farms.
Keywords:
goat
; dairy
; milk production
; fat
; protein
; lactose
; ratio
; lameness
; welfare
; income
1. Introduction
Animal welfare issues on dairy goat farms, such as lameness, have increasingly been highlighted in past studies conducted on goat farms worldwide [1,2,3]. The within-herd prevalence of lameness on some European commercial dairy goat farms ranged from 1.7 to 67% over the last 20 years [1,4,5]. Despite the large variation in prevalence between studies, lameness on commercial farms is a global problem. While lameness prevalence has been quantified, the effects of lameness on dairy goats have been largely overlooked in the past. Increased productivity and animal efficiency would improve resource utilization due to future competition over scarce resources [6].
Lameness has economic consequences for farmers and has been extensively researched on dairy cattle [7,8,9] and sheep [10,11,12] but not on dairy goats. In dairy cattle, lameness is the second most costly animal health problem after mastitis [13]. In the New Zealand dairy cattle industry, the estimated lameness cost for farmers was NZD 94.00 per cow [14]. This study was published over 30 years ago, so the cost will likely be higher now. More recently, a US study estimated that digital dermatitis and white line disease, both causes of lameness, cost farmers NZD 94.00 and NZD 234.89, respectively [15,16].
In the sheep industry, footrot, an infectious cause of lameness, is the second most costly health problem after gastrointestinal parasites. In the New Zealand and British sheep industries, lameness caused by footrot, has cost the industry an estimated NZD 9 million per year and GPB 24 million (NZD 48 million) per year, respectively [10,11]. In a more recent British study, the management of lameness costs farmers between GPB 3.90 and 6.35 (NZD 7.45 and 12.1), depending on the lameness prevalence within the herd [17]. These costs estimate lameness' impact on the dairy cow and sheep industries. Extrapolation of this research to dairy goats studies should be used cautiously because dairy goats on commercial farms are commonly housed indoors and managed differently from dairy cows and sheep [18]. Therefore, it is currently unknown how lameness may impact dairy goat farmers economically.
Literature on the effects of lameness in dairy goats and sheep is scarce. Though not yet quantified, lameness in dairy goats has been linked with reduced milk yield, fertility, and longevity [19,20,21]. Lameness in dairy sheep was also significantly associated with a reduction in milk yield [22]. Additionally, Gelasakis et al. [22] reported that the effect of lameness in high-yielding sheep was associated with greater milk losses than in control sheep. In analogy to dairy cows and dairy sheep, in the present study, it is hypothesized that the milk yield of dairy goats was negatively affected by lameness and claw disorders [23,24]. No goat studies have quantified the association between milk production and lameness. This study aims to evaluate the effect of lameness on milk production and milk characteristics and the potential loss of income on three commercial farms based in New Zealand.
2. Materials and Methods
The animal study protocol was approved by the Ethics Committee of Massey University, New Zealand (MUAEC Protocol 19/51, 29/05/2019).
2.1. Data collection
Data collection consisted of records from 3,145 goats from three farms based in Waikato, New Zealand. The goats were a combination of Saanen, Toggenburg, Alpine breeds, and various crosses, which are generic to the New Zealand goat industry [25]. As the goat breed was not accurately recorded, the goat breed was not included in the analyses. Goats were housed in semi-indoor conditions and kidded once a year. Seasonal lactation goats kidded between June and August 2019 (≤305 days in milk). Farmers also had a group of goats undergoing extended lactation (>305 days in milk). Extended lactation goats were not bred at seasonal breeding periods or had not conceived but were retained in the herd and were continuously milked for prolonged periods. Both groups of goats were housed and managed the same. Goats were milked twice a day and fed ad libitum with a total mixed ration and fresh grass cut and carried from nearby paddocks. A supplementary concentrate meal was given in the milking parlor.
Locomotion scoring events were carried out five times for farm A and four times for farms B and C across one lactation from July 2019 to June 2020. Lameness was scored using a 5-point locomotion scale developed by Deeming et al. [26] with minor modifications (Table S1). Briefly, the scores were defined as 0—normal, 1—uneven, 2—mildly lame, 3—moderately lame, and 4—severely lame. A goat was classified as clinically lame if its locomotion was scored as a three or a four.
2.2. Statistical analysis
All analyses were conducted in SAS (version 9.4, SAS Institute Inc., Cary, NC).
The primary dataset was split by type of lactation, seasonal and extended lactation goats. The seasonal lactation dataset comprised of 1,782 goats with 6,368 test-day records. The extended lactation dataset comprised of 1,363 goats with 5,479 test-day records. Univariate mixed linear models were conducted to determine which variables were significantly associated with test-day milk production characteristics. The dependent variables included daily yields of milk, fat, protein, and lactose; concentrations of fat, protein, and lactose; fat:protein ratio, somatic cell score and milk income. The somatic cell score was calculated as average log2 (somatic cell count/1000). The evaluated milk income assumed a payment for the producers of NZD 19 per kg of milk solids, where milk solids were the sum of fat, protein, and lactose yields.
The linear model for the analysis of seasonal lactation goats included the fixed effects of lameness score, parity, stage of lactation, deviation from the median kidding date, estimated breeding values for lactation yields of milk, fat and protein, and date difference between locomotion scoring event and the herd test event, and the random effects of test-day and residual error. There was a significant interaction between parity and stage of lactation for all the dependent variables except for fat:protein ratio, which had a significant interaction between lameness score and stage of lactation.
The fixed and random effects used for the extended lactation goats were the same as the seasonal lactation goats except for three differences in the variables used. Firstly, within the extended lactation group of goats, there was considerable variation in lactation lengths (ranging from 272 to 3,738 days in milk at the first test-day event). Because of this, season of the year was used as a factor rather than the stage of lactation. Season of the year had two levels, winter-spring (June 2019-November 2019) and summer-autumn (December 2019-May 2020). Secondly, the deviation from the average kidding date was omitted from the model because the deviation from the median kidding date in this group ranged from 272 to 3,738 days, therefore, its effect was considered to be low and not important in this analysis. Lastly, the only significant interaction included in the models was between the lameness score and parity when the daily yields and the milk income were dependent variables.
The random effects of the farm-herd test date, animal, and residual were assumed with zero means and variances , , and , respectively. A repeated effect with a serial autocorrelation was not included in the analysis as it was assumed low because there were 3 to 4 months between herd-testing events.
The marginal means for each fixed effect level were used for multiple comparisons with adjustment by the Tukey-Kramer method [27].
A hypothetical scenario of one herd of 1,000 goats was used to illustrate the average daily milk income lost at the different prevalence levels of severe lameness. The following equations were used:
where milk income assumed a payment for the producers of NZD 19 per kg of milk solids, where milk solids were the sum of fat, protein, and lactose yields, and
Income lost = (percentage of goats severely lame) × (difference in milk income) × 1,000,
Difference in milk income = (average income from goats with a locomotion score of 0) - (average income from goats with a locomotion score of 4) × 1,000
3. Results
The percentage of the goats across parity, locomotion score, and clinical lameness by type of lactation: seasonal and extended lactation, are shown in Table 1. Most seasonal lactation goats (66%) were of parity 1 or 2. Most extended lactation goats had given birth only once before entering the continuous lactation group. Across the 2019-2020 production year, 24.4% and 46.3% of seasonal and extended lactation goats were clinically lame at least once, respectively.
Seasonal and extended lactation goats differed in average milk production characteristics (Table 2). Average milk characteristics were higher for seasonal lactation goats than extended lactation goats except for fat and protein percentages and somatic cell counts.
Effect of lameness on daily milk yield and composition
For seasonal lactation goats, when assessing the effects of locomotion scores on milk production and characteristics , the greatest reduction was between goats with a normal gait (score 0, Table 3), and goats defined as severely lame (score 4). The reduction in milk, protein, and lactose yield was significant (p < 0.05). Milk yield reduced by 7.10%, protein yield decreased by 8.11%, lactose yield decreased by 7.53%, and milk income reduced by 5.93%.
For extended lactation goats, all milk characteristics were significantly (p < 0.05) reduced for goats with severe locomotion impairment compared with goats not lame (Table 4). There was a reduction of 8.56% for milk, 4.59% for fat, 8.26% for protein, and 7.05% for lactose yields. Consequently, the average milk income resulted in a 6.10% reduction.
When severe lameness was present within a herd, the reduction of milk income depended on whether the goats were in seasonal or extended lactation (Figure 1).
In the scenario, when the prevalence of lameness increased, the daily loss of income was higher when the prevalence of severe lameness was high, regardless of lactation type. The cost of severe lameness was higher in seasonal goats than in extended lactation goats.
4. Discussion
The average milk production yields for dairy goats within the study farms were within the range previously reported in New Zealand [21,28,29]. Milk component concentrations also fell within the range of national [29] and international studies [30,31]. Variations were most likely due to management and environmental factors [29,32].
Association of lameness with milk production
This study has highlighted that severely lame goats (score 4), regardless of lactation type, had significantly lower milk production than goats that were not lame. The impact of lameness on milk production differed from dairy sheep and cow studies. Assuming that locomotion scoring was on the day of diagnosis, the estimated daily reduction of milk yield in severely lame seasonal and extended lactation dairy goats was 7.05 and 8.67%, respectively. The total annual loss for a herd would depend on the average prevalence of clinical lameness and the average duration of the clinical lameness. In dairy sheep, the daily milk yield was reduced by 10.8 to 35.8%, depending on when lameness was diagnosed [22]. Gelasakis et al. [22] reported that lameness affected milk production though the effect depended on the time of diagnosis during a lameness episode. A 10.8, 32.5, and 35.8% reduction was recorded two weeks before, during the week, and one week after the lameness diagnosis in those sheep, respectively. The present study did not relate the relative loss to the time of diagnosis. Instead, the estimated milk reduction applied to an 'average day' of lameness throughout the season. Therefore, the actual loss of production is most likely higher than what has been estimated in this study.
In dairy cattle, reduced milk yields in lame cows were reported [33,34]. Similar to this study, dairy cows' daily loss of milk yield was between 0.82 and 11.1% [33 Enting et al. 1997; 35 Kocak and Ekiz, 2006; 36 Bicalho et al. 2008]. Over an entire lactation (305 days), milk yield reduction was between 2.38 and 9.92%, depending on the cause of lameness [34]. In dairy cows, reduced milk yields were apparent for up to four months before and five months after diagnosis [37,38]. Another study on dairy cows reported that lame cows had a reduced test-day milk yield until up to eight months after diagnosis [9]. In addition, there are reports that lame cows had higher production than healthy cows before the onset of lameness [34,38]. This would imply that high production predisposed cows to lameness. Due to only one milk test-day event occurring around the time of the locomotion scoring in the current study, the impact of milk lost for a goat over one lameness event should be investigated further in dairy goats to study the relationship between lameness duration and milk production. Additionally, it would be important to determine if high genetic merit goats had an increased risk of becoming lame.
The effect of lameness on milk production would be the function of the duration and severity of a case of lameness. Where the longer the goat was left untreated, the more severe and painful the conditions became and the increase in the production losses due to the longer recovery. As Gelasakis et al. [22] suggested in their study on lame sheep, lame goats were probably less able to compete for high quality and quantity of feed despite the goats having had ample headspace at the feeding passage (330 mm per head). Like cows, a goat in pain may have drifted lower in the herd's hierarchy and was outcompeted by non-lame goats when the ration is fed out [39]. Alternatively, inflammatory factors could negatively impact the goat's appetite and reduce milk production [22].
The reduction in milk production of severely lame goats was comparable to milk production loss in mildly to severely lame cows [38]. A possible reason for a relatively lower loss in goats with less severe cases of lameness was that they were housed indoors on soft bedding all year and could lie down next to the feeding passage to feed. Thus, lame goats might find it easier to meet their daily nutritional needs, unlike dairy cows or sheep that usually graze outside for all or part of the year and would have to walk more than goats to meet their daily nutritional requirements. Also, cows housed indoors still have to walk to and stand at the feeding passage, while dairy goats on commercial farms do not have to walk or stand to feed themselves. Comparing the time spent lying down and their geographic location in the barn between lame and non-lame goats should be investigated further.
The present study is the first to distinguish between seasonal and extended lactation goat's production and their response to lameness. The reduction in milk production was higher in the extended lactation goats than in seasonal lactation goats; however, the reduction in income of clinical lameness to the farmer was higher in seasonal lactation goats. Clinically lame and severely lame goats in seasonal lactations had a reduction of 2.63 and 7.10%, respectively, in average milk production compared with goats not lame. The milk production of clinically lame and severely lame goats in extended lactation reduced on average by 4.66 and 8.56%, respectively. The physiological differences between seasonal and extended lactation goats are unknown, therefore, some underlying factors could differentiate the goat's response to lameness and the subsequent effect on their production. Another reason extended lactation goats had a higher milk yield reduction could be farm management factors. For example, if seasonal goats breed each year, the farmer could prioritize the treatment of seasonal goats above extended lactation goats. Therefore, delaying treatment could increase the severity of lameness in extended lactation goats. More investigation needs to determine whether this difference is physiological or because of management.
Lameness on UK commercial dairy goat farms appears to be a low priority for most farmers [40]. The farmer survey of that study reported that kidding health, Johnne's disease, tuberculosis, and nutrition were more important production limiting factors than lameness. Lameness appeared less important to farmers because they generally underestimated their herd's lameness prevalence and tended to accept mild lameness within their farm as an unavoidable phenomenon [1,41]. The costs of lameness events are not always directly observed, therefore, farmers may often be unaware of the full extent of the economic impact associated with lameness [41].
When the farm gate price for milk is relatively high, farmers may tend to accept the costs due to lameness. In our estimates, milk income was substantially reduced when goats were clinically lame and further when the goats were severely lame. Farmers within the study incurred regular management costs for preventing or treating lameness, including hoof trimming, feed supplements, footbath supplies, and direct costs like labor and treatment. Unlike dairy cow farmers, it is uncommon for commercial dairy goat farmers to call a veterinarian to treat individual goats for lameness. These factors must be accounted for when undertaking an economic analysis of lameness on farms, which would be the next step forward after this study. Therefore, depending on the incidence rate of lameness per year, the cause and type of lameness, the number of treatments required, the number of herd hoof trimmings, and other prevention strategies, the cost of lameness for farmers will vary substantially. The resulting financial burden can severely impact the farmer's production costs and subsequent profits.
5. Conclusions
This is the first study that quantified the negative effect of lameness on milk production in dairy goats on commercial farms. Milk production was significantly affected, where severe lameness resulted in a 7.10% loss of milk production for seasonally lactating goats and 8.56% for goats in extended lactation. Fat, protein, and lactose concentrations were other milk characteristics significantly affected by severe lameness. At a relatively high prevalence of severe lameness, a reduction in milk income can have grave impacts on the economic efficiency of a commercial dairy goat farm.
Supplementary Materials
The following supporting information can be downloaded at the website of this paper posted on Preprints.org, Table S1: Locomotion scoring strategy used to measure lameness in dairy goats (adapted from Deeming et al. [26]).
Author Contributions
Conceptualization, N.J., N.L.-V., S.-A.T., E.V., and C.H.; methodology, , N.J., N.L.-V., E.V., and C.H.; formal analysis, N.J.; investigation, N.J.; resources, N.J. and N.L.-V.; data curation, N.J. and N.L.-V.; writing—original draft preparation, N.J.; writing—review and editing, N.J., N.L.-V., S.-A.T., E.V., and C.H.; supervision, N.L.-V., S.-A.T., E.V., and C.H.; project administration, N.J. and N.L.-V.; funding acquisition, N.J., E.V., and N.L.-V. All authors have read and agreed to the published version of the manuscript.
Funding
This research was part of the project "Investigation of lameness and claw disorders in New Zealand dairy goats: a multidisciplinary approach". This research was funded by the Dairy Goat Co-Operative (NZ) Ltd. Natasha Jaques was funded and supported by Dairy Goat Co-Operative (NZ) Ltd. and the C. Alma Baker Trust (NZ) Ltd.
Institutional Review Board Statement
The animal study protocol was approved by the Ethics Committee of Massey University, New Zealand (MUAEC Protocol 19/51 and 29/05/2019).
Informed Consent Statement
Informed consent was obtained from all farmers involved in the study.
Data Availability Statement
Restrictions apply to the availability of these data. Data were obtained from New Zealand Dairy Goat Co-Operative Ltd. and are available from the authors with the permission of the New Zealand Dairy Goat Co-Operative Ltd.
Acknowledgments
We thank the farmers, farm workers, and hoof trimmers that were involved in this study for their time and respective expertise. We acknowledge Vicki McLean, from the Dairy Goat Co-Operative, who gave us her expertise on dairy goat health in New Zealand and helped us with the design of the project. We also acknowledge Laura Deeming for her involvement with the locomotion scoring system that was used in this project.
Conflicts of Interest
The authors declare no conflict of interest. However, one of the authors, Sally-Anne Turner, from the Dairy Goat Co-Operative (NZ) Ltd., was involved in the design and collection of data of this study, as well as supervision of the PhD student, however, was not involved in the analyses or interpretation of data and in the original writing of the manuscript.
References
- Anzuino, K.; Bell, N.J.; Bazeley, K.J.; Nicol, C.J. Assessment of welfare on 24 commercial UK dairy goat farms based on direct observations. Vet. Rec. 2010, 167, 774–780. [Google Scholar] [CrossRef]
- Muri, K.; Stubsjøen, S.M.; Valle, P.S. Development and testing of an on-farm welfare assessment protocol for dairy goats. Anim Welfare 2013, 22, 385–400. [Google Scholar] [CrossRef]
- Hempstead, M.N.; Lindquist, T.M.; Shearer, J.K.; Shearer, L.C.; Cave, V.M.; Plummer, P.J. Welfare Assessment of 30 Dairy Goat Farms in the Midwestern United States. Frontiers in Veterinary Science 2021, 8. [Google Scholar] [CrossRef]
- Hill, N.P.; Murphy, P.E.; Nelson, A.J.; Mouttotou, N.; Green, L.E.; Morgan, K.L. Lameness and foot lesions in adult British dairy goats. The Veterinary record 1997, 141, 412–416. [Google Scholar] [CrossRef] [PubMed]
- Groenevelt, M.; Anzuino, K.; Langton, D.A.; Grogono-Thomas, R. Association of treponeme species with atypical foot lesions in goats. Vet. Rec. 2015, 176, 626–626. [Google Scholar] [CrossRef] [PubMed]
- Bastida, F.; Juste, R.A. Paratuberculosis control: a review with a focus on vaccination. J Immune Based Ther Vaccines 2011, 9, 1–17. [Google Scholar] [CrossRef] [PubMed]
- Archer, S.C.; Green, M.J.; Huxley, J.N. Association between milk yield and serial locomotion score assessments in UK dairy cows. J Dairy Sci 2010, 93, 4045–4053. [Google Scholar] [CrossRef]
- Dolecheck, K.; Bewley, J. Animal board invited review: Dairy cow lameness expenditures, losses and total cost. Animal 2018, 12, 1462–1474. [Google Scholar] [CrossRef]
- Alvergnas, M.; Strabel, T.; Rzewuska, K.; Sell-Kubiak, E. Claw disorders in dairy cattle: Effects on production, welfare and farm economics with possible prevention methods. Livest Sci 2019, 222, 54–64. [Google Scholar] [CrossRef]
- Nieuwhof, G.J.; Bishop, S.C. Costs of the major endemic diseases of sheep in Great Britain and the potential benefits of reduction in disease impact. Anim Sci 2005, 81, 23–29. [Google Scholar] [CrossRef]
- Mulvaney, C. A guide to the management of footrot in sheep, 2nd ed. Beef and Lamb New Zealand. 2013. Available online: https://beeflambnz.com/knowledge-hub/PDF/nz-merino-and-blnz-guide-management-footrot-sheep.pdf (accessed on 20 April 2023).
- Lovatt, F. Causes, control and costs of lameness in sheep. Vet. Irel. J. 2015, 5, 189–192. [Google Scholar]
- Cha, E.; Hertl, J.A.; Bar, D.; Grohn, Y.T. The cost of different types of lameness in dairy cows calculated by dynamic programming. Prev Vet Med 2010, 97, 1–8. [Google Scholar] [CrossRef]
- Tranter, W.; Morris, R. A case study of lameness in three dairy herds. N Z Vet J 1991, 39, 88–96. [Google Scholar] [CrossRef] [PubMed]
- Dolecheck, K.A.; Overton, M.W.; Mark, T.B.; Bewley, J.M. Use of a stochastic simulation model to estimate the cost per case of digital dermatitis, sole ulcer, and white line disease by parity group and incidence timing. J Dairy Sci 2019, 102, 715–730. [Google Scholar] [CrossRef] [PubMed]
- Dolecheck, K.A.; Overton, M.W.; Mark, T.B.; Bewley, J.M. Estimating the value of infectious or noninfectious foot disorder prevention strategies within dairy farms, as influenced by foot disorder incidence rates and prevention effectiveness. J Dairy Sci 2019, 102, 731–741. [Google Scholar] [CrossRef]
- Winter, J.R.; Green, L.E. Cost-benefit analysis of management practices for ewes lame with footrot. Vet J 2017, 220, 1–6. [Google Scholar] [CrossRef]
- Groenevelt, M. Foot lameness in goats: like sheep, like cattle or completely different? Livestock 2017, 22, 98–101. [Google Scholar] [CrossRef]
- Eze, C.A. Lameness and reproductive performance in small ruminants in Nsukka Area of the Enugu State, Nigeria. Small Ruminant Res 2002, 44, 263–267. [Google Scholar] [CrossRef]
- Christodoulopoulos, G. Foot lameness in dairy goats. Res Vet Sci 2009, 86, 281–284. [Google Scholar] [CrossRef]
- Solis-Ramirez, J.; Lopez-Villalobos, N.; Blair, H. Dairy goat production systems in Waikato, New Zealand. In Proceedings of the Proceedings of the New Zealand Society of Animal Production, Invercargill, Jan, 2011; pp. 86-91.
- Gelasakis, A.I.; Arsenos, G.; Valergakis, G.E.; Banos, G. Association of lameness with milk yield and lactation curves in Chios dairy ewes. J Dairy Res 2015, 82, 193–199. [Google Scholar] [CrossRef]
- Barkema, H.W.; Westrik, J.D.; Vankeulen, K.A.S.; Schukken, Y.H.; Brand, A. The Effects of Lameness on Reproductive-Performance, Milk-Production and Culling in Dutch Dairy Farms. Prev Vet Med 1994, 20, 249–259. [Google Scholar] [CrossRef]
- Gelasakis, A.I.; Arsenos, G.; Valergakis, G.E.; Fortomaris, P.; Banos, G. Effect of lameness on milk production in a flock of dairy sheep. Vet. Rec. 2010, 167, 533–534. [Google Scholar] [CrossRef] [PubMed]
- Scholtens, M.; Lopez-Lozano, R.; Rebecca, S. New Zealand Goat Industry. 2017. Available online: https://landusenz.org.nz/wp-content/uploads/2017/08/NZ_Goat_Industry_Report_to_Federated_Farmers_14_Mar_2017.pdf (accessed on 6 April 2023).
- Deeming, L.E.; Beausoleil, N.J.; Stafford, K.J.; Webster, J.R.; Zobel, G. Technical Note: The Development of a Reliable 5-Point Gait Scoring System for Use in Dairy Goats. J. Dairy Sci. 2018, 101, 4491–4497. [Google Scholar] [CrossRef] [PubMed]
- Rafter, J.A.; Abell, M.L.; Braselton, J.P. Multiple Comparison Methods for Means. SIAM Review 2002, 44, 259–278. [Google Scholar] [CrossRef]
- Morris, C.A.; Wheeler, M.; Lanuzel, M. Genetic trend and parameter estimates for milk yield traits and kidding date in a Saanen goat herd in New Zealand. New Zeal J Agr Res 2006, 49, 175–181. [Google Scholar] [CrossRef]
- Scholtens, M.; Lopez-Villalobos, N.; Garrick, D.; Blair, H.; Lehnert, K.; Snell, R. Estimates of genetic parameters for lactation curves for milk, fat, protein and somatic cell score in New Zealand dairy goats. N. Z. J. Anim. Sci. Prod. 2019, 79, 1–7. [Google Scholar]
- Vacca, G.M.; Stocco, G.; Dettori, M.L.; Pira, E.; Bittante, G.; Pazzola, M. Milk yield, quality, and coagulation properties of 6 breeds of goats: Environmental and individual variability. J Dairy Sci 2018, 101, 7236–7247. [Google Scholar] [CrossRef]
- Laučienė, L. The influence of crossbreeding and LPL genotype on the yield, composition and quality of goat milk. Mljekarstvo 2021, 72, 33–42. [Google Scholar] [CrossRef]
- Castañeda-Bustos, V.J.; Montaldo, H.H.; Torres-Hernández, G.; Pérez-Elizalde, S.; Valencia-Posadas, M.; Hernández-Mendo, O.; Shepard, L. Estimation of genetic parameters for productive life, reproduction, and milk-production traits in US dairy goats. J Dairy Sci 2014, 97, 2462–2473. [Google Scholar] [CrossRef] [PubMed]
- Enting, H.; Kooij, D.; Dijkhuizen, A.A.; Huirne, R.B.M.; Noordhuizen-Stassen, E.N. Economic losses due to clinical lameness in dairy cattle. Livest Prod Sci 1997, 49, 259–267. [Google Scholar] [CrossRef]
- Hernandez, J.; Shearer, J.K.; Webb, D.W. Effect of lameness on milk yield in dairy cows. J Am Vet Med Assoc 2002, 220, 640–644. [Google Scholar] [CrossRef] [PubMed]
- Kocak, O.; Ekiz, B. The effect of lameness on milk yield in dairy cows. Acta Vet Brno 2006, 75, 79–84. [Google Scholar] [CrossRef]
- Bicalho, R.C.; Warnick, L.D.; Guard, C.L. Strategies to Analyze Milk Losses Caused by Diseases with Potential Incidence Throughout the Lactation: A Lameness Example. J Dairy Sci 2008, 91, 2653–2661. [Google Scholar] [CrossRef] [PubMed]
- Warnick, L.D.; Janssen, D.; Guard, C.L.; Gröhn, Y.T. The Effect of Lameness on Milk Production in Dairy Cows. J Dairy Sci 2001, 84, 1988–1997. [Google Scholar] [CrossRef] [PubMed]
- Green, L.E.; Hedges, V.J.; Schukken, Y.H.; Blowey, R.W.; Packington, A.J. The impact of clinical lameness on the milk yield of dairy cows. J Dairy Sci 2002, 85, 2250–2256. [Google Scholar] [CrossRef] [PubMed]
- Yunta, C.; Guasch, I.; Bach, A. Short communication: Lying behavior of lactating dairy cows is influenced by lameness especially around feeding time. J Dairy Sci 2012, 95, 6546–6549. [Google Scholar] [CrossRef]
- Anzuino, K.; Knowles, T.G.; Lee, M.R.F.; Grogono-Thomas, R. Survey of husbandry and health on UK commercial dairy goat farms. Vet. Rec. 2019, 185, 267–267. [Google Scholar] [CrossRef]
- Wynands, E.M.; Roche, S.M.; Cramer, G.; Ventura, B.A. Dairy farmer, hoof trimmer, and veterinarian perceptions of barriers and roles in lameness management. J Dairy Sci 2021, 104, 11889–11903. [Google Scholar] [CrossRef]
Figure 1.
The average daily loss of income due to a reduction in milk solids (sum of fat, protein and lactose yields) at different prevalence levels of severe lameness (locomotion score 4) on a farm with 1,000 goats and an income from the sale of milk solids at a farm gate price of NZD 19.00/kg for seasonal and extended lactation goats. Note that these averages did not take into account the duration of lameness.
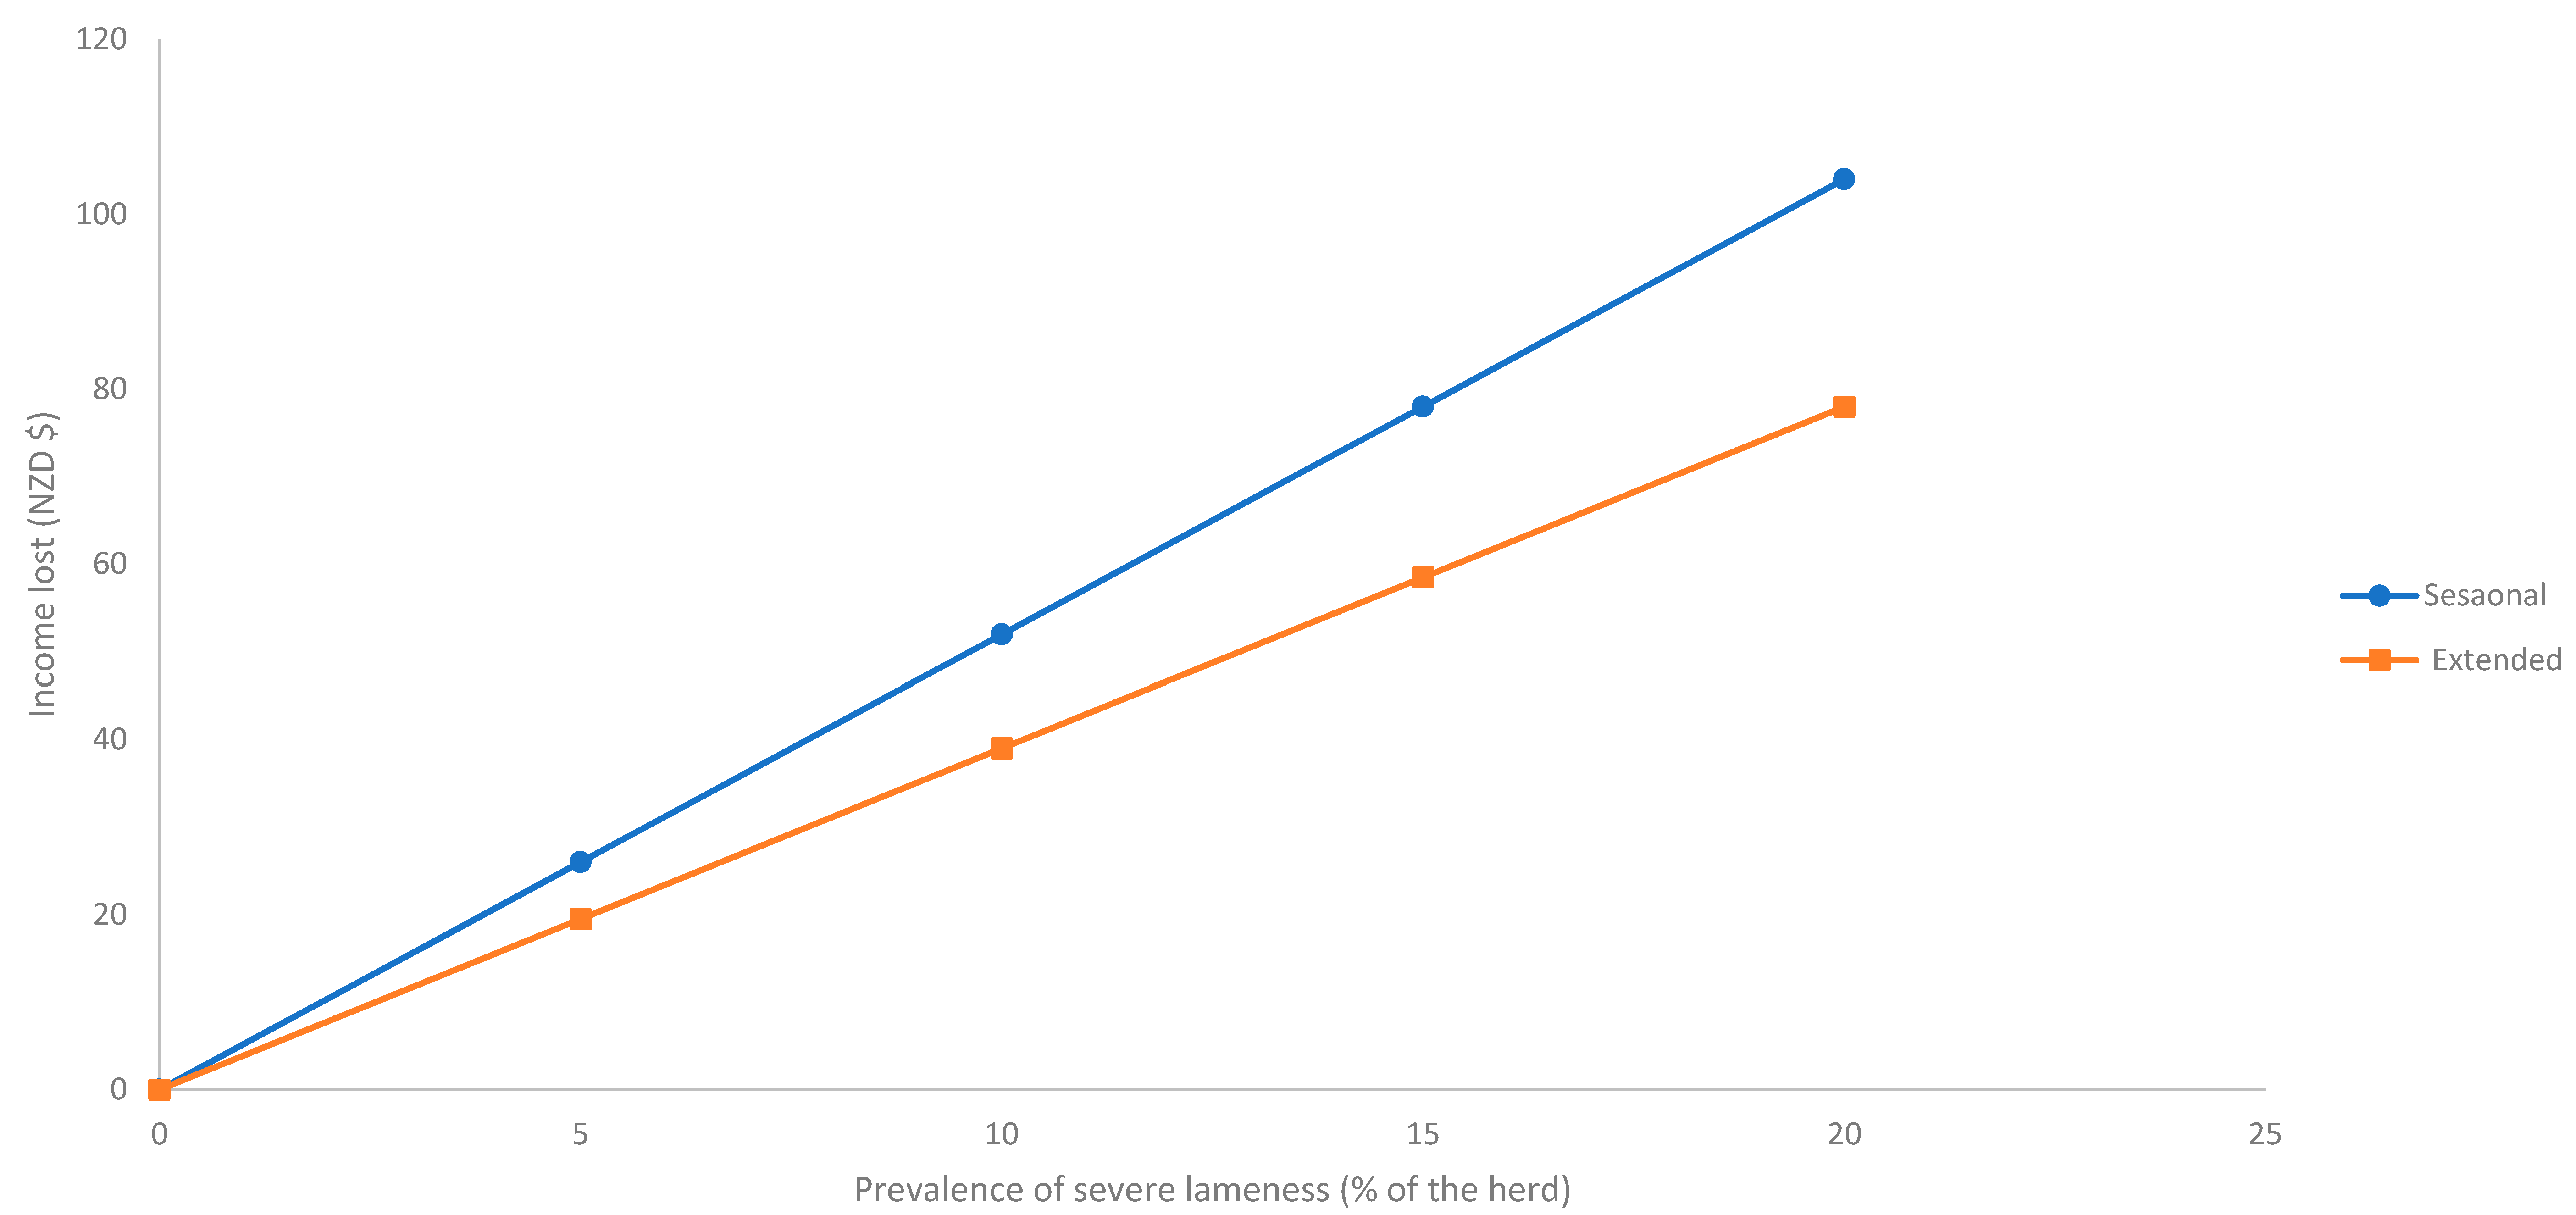

Table 1.
Percentages of goats by parity and clinical lameness status (locomotion score 3 or 4) for seasonal (≤305 days in milk) and extended (>305 days in milk) lactation groups from three farms in New Zealand during the production season of 2019-2020.
Table 1.
Percentages of goats by parity and clinical lameness status (locomotion score 3 or 4) for seasonal (≤305 days in milk) and extended (>305 days in milk) lactation groups from three farms in New Zealand during the production season of 2019-2020.
| Variable | Seasonal goats (n=1,782) |
Extended goats (n= 1,363) |
|---|---|---|
| Parity 1 | 41.4 | 60.1 |
| Parity 2 | 24.3 | 18.1 |
| Parity 3 | 17.8 | 12.5 |
| Parity 4+ | 16.5 | 9.40 |
| Goats clinically lame | 24.4 | 46.3 |
Table 2.
Descriptive statistics of daily milk characteristics by seasonal (≤305 days in milk) and extended (>305 days in milk) lactation groups on three farms in New Zealand during the 2019-2020 production season.
Table 2.
Descriptive statistics of daily milk characteristics by seasonal (≤305 days in milk) and extended (>305 days in milk) lactation groups on three farms in New Zealand during the 2019-2020 production season.
| Trait | Seasonally lactating goats (n=1,782) | Extended lactation goats (n= 1,363) |
||
|---|---|---|---|---|
| Mean | Standard deviation | Mean | Standard deviation | |
| Daily yields | ||||
| Milk (kg) | 3.75 | 1.13 | 3.14 | 0.99 |
| Fat (g) | 117 | 39.0 | 103 | 32.9 |
| Protein (g) | 118 | 35.3 | 103 | 30.9 |
| Lactose (g) | 170 | 53.4 | 140 | 45.1 |
| Concentration (%) | ||||
| Protein | 3.17 | 0.34 | 3.32 | 0.34 |
| Fat | 3.14 | 0.55 | 3.31 | 0.58 |
| Lactose | 4.54 | 0.27 | 4.47 | 0.29 |
| Fat:protein | 0.995 | 0.17 | 1.000 | 0.16 |
| Somatic cell score1 | 9.50 | 1.42 | 10.0 | 1.15 |
| Milk income ($/kg)2 | 7.70 | 2.34 | 6.57 | 1.99 |
1 Somatic cell score = log2(somatic cell count). 2 Milk income = NZD 19 per kg of milk solids, where milk solids are the sum of fat, protein, and lactose yields.
Table 3.
Marginal means (Mean) and standard errors (SE) of daily milk yields and composition in seasonal lactation goats were classified by locomotion score on the test-day on three farms based in New Zealand during the 2019-2020 production year.
Table 3.
Marginal means (Mean) and standard errors (SE) of daily milk yields and composition in seasonal lactation goats were classified by locomotion score on the test-day on three farms based in New Zealand during the 2019-2020 production year.
| Test day milk characteristic | Score 0 | Score 1 | Score 2 | Score 3 | Score 4 | |||||
|---|---|---|---|---|---|---|---|---|---|---|
| Mean | SE | Mean | SE | Mean | SE | Mean | SE | Mean | SE | |
| Daily yields | ||||||||||
| Milk (kg) | 3.83 a | 0.101 | 3.84 a | 0.101 | 3.78 a | 0.103 | 3.78 a | 0.106 | 3.56 b | 0.121 |
| Fat (g) | 120 a | 3.33 | 121 a | 3.34 | 122 a | 3.42 | 120 a | 3.54 | 119 a | 4.19 |
| Protein (g) | 121 a | 3.37 | 121 a | 3.38 | 121 a | 3.43 | 118 a | 3.51 | 111 b | 3.96 |
| Lactose (g) | 170 a | 7.10 | 173 a | 7.11 | 173 a | 7.16 | 170 a | 7.25 | 158 b | 7.77 |
| Concentrations (%) | ||||||||||
| Fat | 3.15 a | 0.072 | 3.16 a | 0.072 | 3.18 ab | 0.073 | 3.24 b | 0.075 | 3.40 c | 0.082 |
| Protein | 3.18 a | 0.042 | 3.17 a | 0.042 | 3.17 a | 0.042 | 3.17 a | 0.043 | 3.16 a | 0.047 |
| Lactose | 4.52 a | 0.035 | 4.52 a | 0.035 | 4.54 ab | 0.035 | 4.56 b | 0.036 | 4.58 b | 0.038 |
| Fat: Protein ratio | 0.99 a | 0.023 | 1.00 a | 0.023 | 1.00 ab | 0.023 | 1.02 b | 0.024 | 1.09 c | 0.026 |
| Somatic cell score1 | 9.54 a | 0.132 | 9.58 a | 0.132 | 9.52 a | 0.135 | 9.56 a | 0.139 | 9.76 a | 0.162 |
| Milk income ($)2 | 7.77 ab | 0.307 | 7.82 a | 0.307 | 7.84 a | 0.310 | 7.70 a | 0.314 | 7.25 b | 0.337 |
1 Somatic cell score = average log2 (somatic cell count). 2 Milk income = NZD 19 per kg of milk solids, where milk solids are the sum of fat, protein, and lactose yields. a,b,c Means with different superscripts within the same row are significantly different (p < 0.05).
Table 4.
Marginal means (Mean) and standard errors (SE) of daily milk yields and composition in extended lactation goats were classified by locomotion scores on the test-day on three farms based in New Zealand during the 2019-2020 production year.
Table 4.
Marginal means (Mean) and standard errors (SE) of daily milk yields and composition in extended lactation goats were classified by locomotion scores on the test-day on three farms based in New Zealand during the 2019-2020 production year.
| Test day milk characteristic | Scores 0 | Scores 1 | Scores 2 | Scores 3 | Scores 4 | |||||
|---|---|---|---|---|---|---|---|---|---|---|
| Mean | SE | Mean | SE | Mean | SE | Mean | SE | Mean | SE | |
| Daily yields | ||||||||||
| Milk (kg) | 3.23 a | 0.092 | 3.19 a | 0.091 | 3.20 a | 0.092 | 3.08 b | 0.093 | 2.95 c | 0.102 |
| Fat (g) | 104 ab | 2.89 | 103 ab | 2.84 | 105 a | 2.88 | 101 ab | 2.94 | 99.0 b | 3.30 |
| Protein (g) | 105 a | 2.92 | 103 ab | 2.88 | 104 ab | 2.91 | 101 ab | 2.96 | 96.1 c | 3.24 |
| Lactose (g) | 143 a | 5.06 | 141 a | 5.02 | 141 a | 5.05 | 136 b | 5.10 | 132 b | 5.44 |
| Concentrations (%) | ||||||||||
| Fat | 3.27 ab | 0.062 | 3.26 a | 0.061 | 3.28 ab | 0.062 | 3.32 b | 0.062 | 3.44 c | 0.065 |
| Protein | 3.27 a | 0.028 | 3.27 a | 0.028 | 3.27 ab | 0.029 | 3.30 bc | 0.029 | 3.32 c | 0.030 |
| Lactose | 4.46 a | 0.019 | 4.47 a | 0.019 | 4.47 a | 0.019 | 4.48 ab | 0.019 | 4.50 b | 0.021 |
| Fat: Protein ratio | 1.00 a | 0.018 | 1.00 a | 0.018 | 1.01 a | 0.018 | 1.01 a | 0.019 | 1.04 b | 0.019 |
| Somatic cell score1 | 9.98 a | 0.081 | 10.0 a | 0.080 | 10.0 a | 0.081 | 10.0 a | 0.083 | 10.1 a | 0.093 |
| Milk income ($)2 | 6.63 a | 0.221 | 6.56 ab | 0.219 | 6.57 ab | 0.220 | 6.38 bc | 0.223 | 6.22 c | 0.238 |
1 Somatic cell score = average log2 (somatic cell count). 2 Milk income = NZD 19 per kg of milk solids, where milk solids are the sum of fat, protein, and lactose yields. a,b,c Means with different superscripts within the same row are significantly different (p < 0.05).
Disclaimer/Publisher’s Note: The statements, opinions and data contained in all publications are solely those of the individual author(s) and contributor(s) and not of MDPI and/or the editor(s). MDPI and/or the editor(s) disclaim responsibility for any injury to people or property resulting from any ideas, methods, instructions or products referred to in the content. |
© 2023 by the authors. Licensee MDPI, Basel, Switzerland. This article is an open access article distributed under the terms and conditions of the Creative Commons Attribution (CC BY) license (http://creativecommons.org/licenses/by/4.0/).
Copyright: This open access article is published under a Creative Commons CC BY 4.0 license, which permit the free download, distribution, and reuse, provided that the author and preprint are cited in any reuse.


