
Submitted:
13 April 2023
Posted:
14 April 2023
You are already at the latest version
Abstract
During their growth, bacteria respond to complex environmental changes through equally com-plex and orderly regulatory mechanisms. sRNA has an important role as a post-transcriptional regulator in the environmental adaptation of Bacillus. In this study, we identified an sRNA Bvs091 located in the intergenic region of the Bacillus velezensis, which is widely present in the genus Bacillus and whose expression is upregulated by salt treatment. The deletion of bvs091 in B. ve-lezensis PEBA20 led to a reduced growth rate and a change in the phenotypes, with simple colony structures and low and easily degradable biofilm. Salt tolerance tests indicated that the deletion of bvs091 results in a reduced salt tolerance. galT2 mRNA is supposed to be a direct target of Bvs091 according to results obtained by using the bioinformatic method and performing qRT-PCR analysis. The microscale thermophoresis (MST) analysis showed that Bvs091 could directly bind 28‒51 bases in front of the promoter of galT2. Subsequently, the deletion of galT2 in B. velezensis resulted in increased salt tolerance. Based on the techniques of double plasmids and a half-life period, sRNA Bvs091 is confirmed as a trans-encoded sRNA that negatively regulates the mRNA expression of galT2. In brief, the trans-encoded sRNA Bvs091 acts by pairing the incomplete complementary bases of galT2 mRNA, reducing galT2 mRNA’s stability and affecting the trans-lation efficiency.
Keywords:
Bacillus velezensis
; salt stress
; sRNA3
; Bvs091
; galT2
1. Introduction
Bacterial sRNAs are essential regulators involved in the post-transcription regulation of environmental signaling responses and they act through base pairing [1]. The post-transcriptional regulation of bacterial sRNAs assists bacteria in dealing with and adapting to the changing environmental conditions in their natural habitat [2,3]. The importance of regulatory RNA’s post-transcriptional control has now been universally recognized in almost all studied organisms [4,5]. Over the past two decades, multiple methods have been used to discover chromosomally encoded sRNAs in numerous Gram-negative and Gram-positive species. Escherichia coli is currently the bacterial species featuring the largest number of well-targeted sRNA‒mRNA interactions, of which, 22 sRNAs and their 102 targets have been experimentally validated, and a complex network of interactions is formed [6]; however, this number may represent only a small fraction of this species’ sRNA-mediated regulation [7,8]. Additionally, more than 100 sRNAs have been discovered by performing transcriptome analysis in the Gram-positive model bacterium Bacillus subtilis [9,10], while a small number of sRNAs have been found using other methods [11,12,13]. sRNA is also being studied in Bacillus non-model organisms. B. velezensis FZB42 is an excellent biocontrol bacterium [14,15]. Of these, 21 sRNAs have been identified and experimentally established. Additionally, B. velezensis PEBA20 is also an excellent biocontrol bacterium [16]. sRNA Bvs196 and its targets spo0A and sspN-tlp have been identified and validated in studies available in our laboratory mRNAs [17].
Regarding the action mechanism, sRNAs can be classified as cis- or trans-encoding [18,19]. The former is usually located at one end of the antisense strand of the regulated gene and is fully complementary to the target mRNA [20,21]. In B. subtilis, it is mostly an antitoxin in the type I toxin‒antitoxin system, e.g., txpA /RatA [22,23], bsrG /SR4 [24], bsrE /SR5 [25], yonT / yoyJ /SR6 [26], etc. (27). In addition, S1290 is a σB-dependent antisense RNA complementary to opuB mRNA. Delaying the expression of opuB favors the expression of opuC, thereby encoding an alternative but more versatile osmoprotectant input system. S1290 is involved in salt stress response regulation [28]. The latter, trans-encoding, is usually paired with the target mRNA through a very short sequence complementary to that located in the gene spacer region [29,30]. For example, sr1 is transcribed under glycoisogenic conditions by the σA-dependent promoter psr1 and is repressed under glycolytic conditions mainly by CcpN and, to a lesser extent, by CcpA [31]. RoxS transcription is activated by the two-component system ResDE in response to nitric oxide, and is Rex [32], which is an NADH-sensitive transcriptional repressor. sRNA regulates target gene expression at the post-transcriptional level in the above ways and thus plays an important regulatory role in bacterial iron metabolism, carbon metabolism, population sensing, stress response, and changes in pathogenicity [33,34,35].
In this study, B. velezensis sRNA Bvs091 is found to be highly expressed in B. velezensis through salt shock compared with LB culture, and disruption of the sRNA leads to it being more sensitive to salt stress. Its homologous sequence was identified as BsrC by Saito et al. in the intergenic region in B. subtilis 168 and was expressed during the exponential growth phase with an unknown function [36]. Our results indicate that Bvs091 acts as a crucial regulator to contribute to the salt tolerance of B. velezensis by directly pairing the incomplete complementary bases with galT2 mRNA. Bvs091’s significant roles in salt tolerance highlight sRNA-mediated regulation’s importance when under stress conditions in the B. velezensis species. It lays the foundation for future studies on regulating biocontrol by sRNAs.
2. Results
2.1. Characterization of sRNA Bvs091
The Rockhopper analysis of Illumina RNA-seq data of B. velezensis PEBA20 cultured in LB to the exponential growth stage identified an independent expressed sequence (for convenience, we call it a hypothetic sRNA) between the ydaG (general stress protein 26) [37] and ydaH (redundant with MurJ; lipid II flippase for PG synthesis) [38] genes that were 271 nt in length (Figure 1A,B). The qRT-PCR revealed that the hypothetic sRNA expression was significantly upregulated under salt shock (Figure 1C), thus suggesting that the hypothetic sRNA may play a physiological role in response to salt stress.
We searched the hypothetic sRNA’s homologous region using BLASTn and found that the sequence was present in 20 species (see Supplementary table S1), all belonging to the genus Bacillus. We compared different homologous sequences’ identities in all Bacillus (47 in total) using the hypothetic sRNA, then found that they ranged from 61.84% to 100% identities (see Supplementary table S1).
Analyzing these 47 homologous sequences revealed that all are in the intergenic region between the ydaG and ydaH in Bacillus (see Supplementary table S1). This hypothetic sRNA was verified using RT-PCR as being co-expressed with neither the upstream gene (ydaH) nor the downstream gene (ydaG) (Figure 1B). This hypothetic sRNA is speculated to be a non-coding sRNA that is independently expressed.
These 47 homologous sequences are divided into three different clades based on a phylogenetic tree (Figure 2), and the clade in the green box consisted of nine Bacillus species. The sRNA sequence in B. velezensis PEBA20 is the most similar to B. amyloliquefaciens, with identities close to 100%; the other sequences in this clade also have high identities between 81.52 and 84.06%, including the sequence of B. subtilis. The remaining sequences were divided into two clades with low identities between 61.84 and 66.55%. Moreover, 78‒196 nt of the sequences in these two clades were found to be highly conserved from using multiple sequence alignment analysis.
The sRNA sequence had 81.25% identities in B. velezensis PEBA20 compared to B. subtilis 168 by Saito et al. The sRNA sequence in B. subtilis was named by Saito et al. as sRNA BsrC in the intergenic region, which was detected as an sRNA by Northern [11]. There are no reports on BsrC’s function in the informed research. This sequence in B. velezensis PEBA20 is an sRNA homologous to BsrC, which is named Bvs091.
In general, the sRNAs’ function is determined by the secondary structures. Bvs091s’ secondary structure was predicted using MFold [39]; as shown in Figure 3B, the structure has a minimum free energy of -65.00 kcal/mol, which indicates a stable secondary structure. The predicted secondary structure has three loops. Based on the principle that sRNAs perform functions [39,40], these three loop structures may perform Bvs091’s function.
2.2. Effect of sRNA Bvs091 on the phenotype of B. velezensis
2.2.1. sRNA Bvs091’s effect on B. velezensis growth
To elucidate sRNA Bvs091’s potential regulatory function in B. velezensis, we constructed the bvs091 deletion mutant strain (∆bvs091) and overexpression strain (obvs091) (Figure 4A). The growth curves and the biofilm phenotypes of WT, ∆bvs091, and obvs091 were determined (Figure 4B, C, D).
The changes in the growth curve caused by bvs091 deletion in B. velezensis are shown in Figure 4A. The delayed period of the WT and ∆bvs091 were equivalent. However, the exponential period of the ∆bvs091 slowed down. By contrast, the WT entered into the stationary period after 2480 minutes, but did not enter the decline period until the end of the experiment (12,000 minutes). Meanwhile, the OD600 value of ∆bvs091 started to decline rapidly around 5100 minutes and dropped below 0.1 by 11000 minutes. The bvs091 deletion affected the maximum growth rate (OD600=2.3, 5080 min), and was lower than WT’s maximum growth rate, which was around OD600=4.3 (after 2480 min). The growth curves of obvs091 and WT showed no significant difference but had slightly different growth rates (OD600=4.3 for WT and OD600=4.4 for obvs091).
The solid‒gas interface biofilm phenotype assay revealed (Figure 4C) that the absence or overexpression of bvs091 changed the structure and degree of wetness of the solid‒gas interface biofilm. Bvs091 affected the biofilm fold formation’s timing and complexity. Specifically, after 12 h of incubation, neither the solid‒gas interface biofilm of the WT nor the ∆bvs091 had formed a fold structure, whereas the biofilm surface of the obvs091 began to develop folds. Additionally, the biofilm of the ∆bvs091 was smooth and wrinkle-free after 24‒72 h of incubation. In addition, the WT had a dry surface with distinctly wavy edges, and the obvs091 had more wrinkles than the wild strain. Finally, it was also found that ∆bvs091 had a higher wetness surface degree than WT, while obvs091 had the same wetness surface degree as WT.
The biofilm phenotype assay at the liquid‒gas interface revealed (Figure 4D) that the strains WT, ∆bvs091, and obvs091 differed in biofilm thickness and wettability. Compared to the WT strain, the biofilm of obvs091 was thicker and had a drier surface, while ∆bvs091 was thinner and had a smooth and moist surface. The initial degradation times of the WT and obvs091 biofilms was 72 h, compared with 60 h for ∆bvs091.
2.2.2. sRNA Bvs091 enhances salt tolerance of B. velezensis
The ∆bvs091 growth was different from the WT in the 8% NaCl LB medium (Figure 5A-a). We found that the retardation periods of obvs091 were the shortest, followed by WT, and ∆bvs091 was the longest (Figure 5A-b). Based on Figure 5A-c, during the exponential growth period, the ∆bvs091 grew slower than the WT strain, and the obvs091 grew faster than the WT strain. The stability period of ∆bvs091 was shorter than WT (Figure 5A-d), the stability period of obvs091 was longer than the WT strain, and the OD600 maximum of obvs091 was larger than WT. Three strains were different in the decline rate and post-decline bacterial load during the decline period (Figure 5A-e). During the decline period, the decrease rate of the OD600 values of the three strains was ∆bvs091>WT>obvs091. The overexpression of bvs091 contributes to the growth of B. velezensis in high salt concentrations.
After the salt shock, the survival fraction of the ∆bvs091 was lower than that of the WT strain (Figure 5B). Before salt treatment, WT, ∆bvs091, and obvs091 all had bacterial growth at dilution gradients 10-5; meanwhile, after salt treatment, ∆bvs091 only grew up to a dilution gradient of 10-3, while both WT and obvs091 had bacterial growth at dilution gradients of 10-5. The results suggest that bvs091 deletion leads to a reduction in the salt tolerance of B. velezensis.
2.3. Target prediction and validation of sRNA Bvs091
Firstly, we need to find Bvs091’s potential mRNA targets to explain why Bvs091 contributes to the salt tolerance. The bioinformatics approach web tool IntaRNA (http:/snowwhite-wellesley.edu/targetRNA2/) was used to predict the potential mRNA targets of Bvs091. The B. velezensis PEBA20 genome (NCBI gene number NZ_CP046145) was used as a reference, the top 100 genes with low energy were selected for further analysis (see Supplementary table S2, Figure 6A), and the genes combined with the secondary structural loop of Bvs091 or with small binding energies (energy ranking in parentheses) were selected, including galT2 (UDP-glucose‒hexose-1-phosphate uridylyltransferase) (1), yueK (nicotinate phosphoribosyltransferase) (2), kdgA (ketohydroxyglutarate aldolase) (4), lrgB (nitrite reductase (NAD(P)H) small subunit) (5), rocR, sigma-54-dependent Fis family transcriptional regulator (6), asd, aspartate-semialdehyde dehydrogenase (7), drm, phosphopentomutase (8), hemD1, uroporphyrinogen-III synthase (10), qoxB, cytochrome aa3 quinol oxidase subunit I (39), yybE, LysR family transcriptional regulator (56), sigG, RNA polymerase sporulation sigma factor SigG (68), and ydhQ, GntR family transcriptional regulator (70). Subsequently, the above genes’ relative expression levels in the WT, ∆bvs091, and obvs091 were calculated to generate a heat map (Figure 6B). The heat map reveals that the expressions of the galT2, lrgB, asd, drm, hemD1, yybE, and qoxB mRNAs were related to bvs091 expression. Among them, galT2 was negatively correlated with the bvs091 expression and the expressions of lrgB, asd, drm, hemD1, yybE, and qoxB mRNAs were positively correlated with bvs091 expression.
To determine Bvs091’s target, the correlation coefficients of mRNAs and Bvs091 expression were calculated (Figure 6C, 6D). The correlation coefficient of the expression levels of galT2 mRNA and Bvs091 is -0.9683, which is the largest absolute value among the 12 pre-selected targets. Hypothesis: the galT2 mRNA is Bvs091’s target. The binding strength between Bvs091 and galT2 mRNA was verified using MST. Bvs091’s positions from 178 to 203 were predicted bind to positions from 28 to 51 (start codon is first) in front of the galT2 mRNA promoter using the IntaRNA program (Figure 6E). The binding force curve indicated that Bvs091 could directly bind to the galT2 mRNA with a dissociation constant (Kd) of 0.5929 ± 0.012μM (Figure 6F), thus suggesting a strong interaction. Therefore, the galT2 mRNA was identified as one of Bvs091’s targets.
2.3. The function of galT2 contributing to salt tolerance
galT2 was deleted (ΔgalT2) in B. velezensis PEBA20 using a homologous recombination approach to then analyze the salt tolerance phenotype of ΔgalT2. The growth curves of WT and ΔgalT2 cultured in LB medium containing 1%, 3%, 5%, and 8% NaCL were measured (Figure 7A). The growth was reduced more in ∆galT2 than in WT. The maximum OD600 value of the ∆galT2 in the LB medium only rose to about 2.0 (7280 min), which was much less than WT (OD600 =4.3); afterward, the OD600 value started declining (7720 min) to about 0.8.
Studies have shown that galT2 deletion enhances the salt tolerance in B. velezensis. The ΔgalT2 strains transferred to LB with 3%, 5%, and 8% NaCl showed shorter retardation periods and entered the exponential growth period faster than the WT strains. The retardation periods of WT in LB with 3%, 5%, and 8% NaCL were approximately 460 min, 540 min, and 940 min, respectively, while ΔgalT2 was 320 min, 400 min, and 720 min, respectively. The growth biomass of the ∆galT2 was lower than WT in the LB medium with 3% and 5% NaCL. Conversely, the growth biomass of the ∆galT2 was higher than WT in LB medium with 8% NaCl, with a more extended stability period and slower descending OD600 value. Moreover, the OD600 value of ∆galT2 with 8% NaCL reached the maximum about 2.3 after 4560 min, and then started to reduce to about 1.8 between 4760‒13500 min. Meanwhile, the OD600 value of WT with 8% NaCL reached the maximum about 2.1 after 4560 min, and then started to reduce about 0.5 after 13500 min. The ∆galT2 grows better in high salt concentrations.
The survival rates of WT and ΔgalT2 that were harvested in the exponential period of the LB medium and after treating with 8% NaCl for 10 minutes were determined (Figure 7B).
To characterize the physiological role of ΔgalT2 under salt tolerance, the WT and ΔgalT2 were exposed to 8 % NaCl for 10 min. Without salt shock treatment (CK), WT showed a higher amount of growth than ΔgalT2. After salt shock treatment, ΔgalT2 had bacterial colonies in the 10-4 dilution gradient, whereas WT still had bacteria colonies in the 10-5 dilution gradient. However, under salt stress conditions, there was a significant difference in the survival ability between ΔgalT2 and WT (Figure 7B). The salt tolerance of galT2 deficient is enhanced.
In summary, we concluded that the galT2 deletion affects the bacterium’s growth, which is attenuated with the increasing NaCl concentration in the culture environment, and the salt tolerance of B. velezensis is enhanced by galT2 deletion.
GalT (UDP glucose hexose 1 phosphate uridylyltransferase) is mainly involved in the Leloir pathway that converts galactose 1-phosphate (Gal-P) to UDP-galactose [42]. To investigate the galactose metabolic pathway’s metabolic profile (in which galT2 is located) in the salt-adapted strains of B. velezensis, we determined the transcriptomes of WT and ST in the exponential period.
Analyzing the Illumina RNA-seq data revealed a significant enrichment of differentially expressed genes for the galactose metabolism pathway WT and ST strains (Figure 7C) and 16 genes with significant differential expressions of this pathway (Figure 7D). The expression of 14 genes was suppressed compared to the WT strain. These 14 genes are involved in galactose’s synthesis and catabolism. Moreover, two genes were expressed in elevated amounts, one being glucose-1-phosphate uridylyl transferase (galU), a UTP required to produce α-D-glucose-1P from UDP-glucose, and the other being oligo-1,6-glucosidase (malL) for generating D-fructose from sucrose. The galactose metabolic pathway is inhibited in high salt concentrations. Presumably, the UDP-glucose used for galactose synthesis in high salt concentrations is mainly used for synthesizing α-D-glucose-1P.
2.4.1. Bvs091 reduces the stability of galT2 mRNA
We hypothesized that Bvs091 negatively regulates galT2 expression based on the Quantitative Real-time PCR results in Figure 6B, C. sRNA’s negative regulation is often carried out by affecting the mRNA leading to a translation reduction. To determine whether Bvs091 negatively regulates galT2 via affecting zgalT2 mRNA’s stability, we analyzed galT2 mRNA’s half-life in the strains WT, ∆bvs091, and obvs091.
Analyzing the real-time PCR results for galt2 mRNA showed that the galT2 mRNA half-life was approximately 7 min in the WT and only 5 min in the obvs091 (Figure 8). However, the galT2 mRNA half-life in the ∆bvs091 increased by approximately 12 min. This indicated that Bvs091 pairs bind to galT2 mRNA and reduces galT2 mRNA’s stability.
2.4.2. Bvs091 reduces the protein synthesis of GalT2
To test whether Bvs091 regulates Galt2 protein expression, a galactose-1-phosphate uridyltransferase (galT2)-inducible green fluorescent protein (GFP) reporter fusion was introduced into the cells. The microplate reader measured the bacteria's fluorescence intensity in the liquid shake flask cultures (Figure 9A). The fluorescence intensity of the dual plasmid fluorescent reporter system constructed using ∆bvs091 (∆bvs091-∆amyE-galT2-sfGFP) was higher than that of the dual plasmid fluorescent reporter system constructed using obvs091 (obvs091-∆amyE-galT2-sfGFP). Specifically, the fluorescence intensity of obvs091-∆amyE-galT2-sfGFP was 1781 and 4113 at 24 h and 48 h, respectively, whereas the fluorescence intensity of ∆bvs091-∆amyE-galT2-sfGFP was 5542.5 and 10581, respectively. WT without sfGFP had faint reflected light. Together, these data suggest that Bvs091 is inhibited by GalT2 protein expression.
The images were acquired using a fluorescent stereomicroscope (Leica, Germany) and analyzed using ImageJ (National Institutes of Health). Performing quantitative analysis of the solid culture colonies’ fluorescence intensities using ImageJ revealed that the fluorescence intensity of the colonies constructed based on ∆bvs091 at 12 h and 24 h of incubation was significantly higher than that of the fluorescent dual plasmid system constructed using bvs091 overexpression (Figure 9B, C). At 24 h and 48 h, the fluorescence intensities of obvs091-∆amyE-galT2-sfGFP were 779244 and 2638240, while the fluorescence intensities of ∆bvs091-∆amyE-galT2-sfGFP were 1463763 and 2829744, respectively. Again, it can be concluded that Bvs091 inhibits GalT2 expression.
Based on the fluorescence intensity measurement results, the sRNA Bvs091 expression reduced sfGFP expression. Combined with the half-life measurements, Bvs091 was determined to negatively regulated galT2. Bvs091 interacted with galT2 mRNA, Bvs091 reduced galT2 mRNA’s stability, and thus GalT2 expression was reduced.
2.4.3. Bvs091 and galT2 mRNA matching binding site.
Our previous studies showed that Bvs091 binds to galT2 mRNA with a dissociation constant (Kd) of 0.5929 ± 0.012 μM (Figure 6F). We used BPROM to predict the promoter -35 region and the extended -10 region of the galT2 gene, with the -35-region located at positions 201‒209 before the galT2 gene start codon. The binding affinity between bvs091-mut and galT2-wt was lost after replacing the 19 bases in the base-pairing region of Bvs091 with identical bases. (Figure 10B-a). In addition, the five bases that did not match in the base-pairing region mutated to complementary bases bvs091-com bound to galT2-wt with a match Kd = 0.2519 ± 0.011 μM (Figure 10B-b), thus indicating stronger interactions. Together, these data strongly suggest that the positions from 178 to 203 of Bvs091 are capable of interacting with the positions 28-51 in front of the galT2 mRNA via direct base pairing, and the data suggest that Bvs091 is a negatively regulated trans sRNA.
3. Discussion
Here, we show that Bvs091 is a regulatory RNA that contributes to the salt tolerance. We demonstrate that the bvs091 deletion in B. velezensis reduces the salt tolerance. The in vitro and in vivo assays (Figure 6F, 9) showed a direct interaction between the two RNAs. Bvs091 matches the galT2 mRNA at the positions from 178 to 203 of Bvs091 binding to genes 28‒51 in front of the galT2 gene promoter. The binding of Bvs091 to galT2 mRNA reduces galT2 mRNA’s stability and, hence, GalT2 expression. The Bvs091 deletion resulted in increased salt tolerance in B. velezensis.
The action mechanisms of the base-paired sRNAs identified to date include the translation inhibition by inducing structural changes around the RBS (ribosomal binding site), direct blockade of the RBS or ribosomal spare site, combined translation inhibition and mRNA decay, degradation, processing, or stabilization of mRNA, target mRNA capture, or induction of the premature transcriptional termination at Rho non-dependent or non-independent transcriptional terminators [30]. As detailed in the Gram-positive bacterial model strain B. subtilis, the first trans sRNA SR1 begins binding between the G region and the G' region 97 nt downstream of the ahrC RBS, SR1 induces a structural change from 20 to 40 nt downstream of the ahrC RBS that blocks the binding of the ribosomal 30S subunit t[42], and sRNA RoxS disrupts the structure at the 5' UTR that prevents the ribosome binding from activating the translation. Furthermore, it stabilizes yflS mRNA against the 5'-3' exo-ribonucleic acid degradation of RNase J1 approximately 3.6-fold [32]. Our study identified a match between Bvs091 and galT2 mRNA at the positions from 178 to 203 of bvs091 binding to genes 28‒51 in front of the galT2 gene promoter and predicted that the -35 promoter of galT2 mRNA is located at genes 201‒209 in front of the galT2 gene start codon. The combination of the two leads to galT2 mRNA’s susceptibility to degradation, and we hypothesized that the binding site of the RNase of galT2 mRNA was exposed upon binding. In contrast, the reduced GalT2expression, in addition to the above reasons, lead to the prediction that sRNA Bvs091 has the potential to disrupt the 5'UTR structure of galT2 mRNA to prevent ribosome binding to mRNA. The above speculations are, of course, the focus of our subsequent studies.
The B. velezensi genome encodes the two GalT 1-phosphogalactosyltransferases (GalT1 and GalT2) involved in galactose metabolism, which are mainly involved in the Leloir pathway that converts galactose 1-phosphate (Gal-P) to UDP-galactoseere [41]; our results suggest that galT2 mRNA is a Bvs091 target and that galT2 expression is negatively regulated by Bvs091 at the post-transcriptional level. B. velezensi showed increased tolerance to 8% NaCl after gene deletion for galT2. Bacteria’s ability to adapt to harsh environments when exposed to the osmotic pressure of their natural habitat environment is critical to their survival [43]. Bacteria balance osmotic pressure inside and outside the cell by enhancing the synthesis of organically compatible solutes such as glycine betaine and proline [44], as well as the K+ uptake and Na+ efflux. Salt stress also has pleiotropic effects on the bacterial physiology, including changes in the membrane composition [45], cell wall properties [46], and several inhibited physiological activities, such as bacterial motility [47] and iron homeostasis [48], among others. Galactose is a common monosaccharide that can be used by all organisms through the three main enzymes’ activities that constitute the Leloir pathway: GalK, GalT, and GalE [49]. Analyzing the transcriptome data revealed that the galactose metabolic pathway was significantly downregulated in B. velezensi after prolonged salt domestication in a high-salt environment. The galactose metabolic pathway is also a metabolic pathway in which osmotic pressure regulation is inhibited. Combined with the ribosomal metabolism’s significant high expression en route in the chronically salt-tolerant strain (Figure 7C), it can be hypothesized that Bvs091 regulates the galactose metabolic pathway and, thus, the sugar metabolic pathway of B. velezensi in favor of salt stress adaptation.
RNA-mediated regulation plays an important role in stress adaptation and gene regulation in almost all bacteria. Furthermore, the post-transcriptional regulation of sRNA allows bacteria to respond to signals in an extremely flexible and sensitive manner. Regarded together, our work suggests that Bvs091 is a trans-coding sRNA involved in B. velezensi salt tolerance. Bvs091’s salt tolerance regulation mechanism in B. velezensi involves, at the post-transcriptional level, reducing galT2 mRNA’s stability by decreasing it. Future studies will explore Bvs091’s mechanisms for promoting galT2 mRNA degradation, focusing on further identifying and characterizing its targets and its biological roles in respective pathways.
4. Materials and Methods
4.1. Bacteria strain, growth conditions, and salt stress treatment.
The hereby adopted B. velezensis PEBA20 was derived from our laboratory strain, and the used strains and plasmids are described in Supplementary Table S3. The derivatives were typically grown in Luria‒Bertani broth (LB), either in liquid culture or on solid plates with 1.5% agar at 28°C or 37°C. The E. coli strains were grown on LB or LB plates supplemented with agar (1.5%) at 37°C. When needed, ampicillin, erythromycin, and chloramphenicol were added to the final concentrations of 100, 1, and 5 μg/mL, respectively [36]. When the bacteria’s OD600 reached 0.8 (~7×10⁶ CFU/mL), the bacterial broth was treated with 8% NaCl, and, 10 min later, the bacteria were collected by performing centrifugation at 8,000 rpm for 5 min. The precipitate was then washed three times using PBS buffer (Phosphate Buffered Saline, 0.02% KH2PO4, 0.29% Na2HPO4-12H2O, 0.8% NaCl, 0.02% KCl, pH 7.5) and finally centrifuged at 10,000 × g for 1 min. The untreated bacteria grown under the same conditions were used as controls.
4.2. RNA extraction
The total bacterial RNA was extracted using the TRIzol method (Invitrogen, Life Technologies, Grand Island, NY, USA). Briefly, the 108 cells were treated with 200 μL of lysozyme and mixed with 1 mL of TRIzol, followed by 200 μL of chloroform. After centrifugation, the supernatant was recovered and precipitated with an equal amount of isopropanol. The pellet was washed twice with 75% ethanol, and the resulting pellet was resuspended in RNase-free water upon the final centrifugation.
4.3. Mutant strain construction
The sRNA Bvs091 and galT2 deletion mutants were constructed as described by Irnov [50]. The specific steps for mutant strain construction are as follows. The modified pMAD plasmids were created and flanked by the upstream and downstream regions of bvs091 or galT2 generated using PCR (for primers, see Table S1 in Supplementary Materials). The plasmid was constructed by ClonExpress MultiS One Step Cloning Kit (ClonExpress® MultiS One Step Cloning Kit, Vazyme), and the target fragment was inserted into the sites of BamHI and HindIII in Pmad [51]. Additionally, the plasmid was electro-transformed into the strain WT of B. velezensis, and the recombinant strain was screened using erythromycin. The pHT01 plasmid was used for constructing the overexpression strains, which was digested using HindIII/BamHI. The bvs091 gene was ligated into the linear pHT01 to obtain the plasmid pHT01-bvs091. the overexpression strain was constructed by transforming pHT01-bvs091 into WT and selected using chloramphenicol. The pMAD and pHT01 plasmids were also used for constructing a two-plasmid fluorescence system [52], while the galT2 mRNA and superfolder GFP were adopted to replace the α-amylase (amyE) gene of the obvs091or ∆bvs091 strains, and obvs091-∆amyE-galT2-sfGFP and ∆bvs091-∆amyE-galT2-sfGFP were obtained. The primers for the plasmid construction are shown in Supplementary Table S4
4.4. Half-life experiment
Herein, galT2 mRNA’s half-life in the WT, Δbvs091, and obvs091 strains were determined as described in the literature [53]. The bacterial solution was transferred to LB medium and cultured to OD600 = 0.8. After treatment with 2.8% NaCl for 10 min, rifampicin with a final concentration of 200 µg/mL was added to the bacterial solution to inhibit RNA synthesis, and was centrifuged at 12,000 g for 2 min after being treated with rifampicin for 0, 5, 10, 15, and 20 min, respectively, to remove the supernatant. RNAlater (Vazyme, Nanjing, China) with two times the volume of rifampicin was added, suspended, and treated at room temperature for 5 min, and was then centrifuged quickly. Then, the supernatant was removed, and the solution was snap-frozen in liquid nitrogen. The sample RNA was extracted and reverse transcribed to synthesize cDNA, and the mRNA’s half-life was detected using qRT-PCR. galT2 mRNA’s expression data were relative to galT2 mRNA’s expression at zero. Finally, three biological replicates were used to calculate the mean.
4.5. Bioinformatics analysis
The secondary structure predictions were performed using MFold [54] based on minimum free energy. The sequence comparison of bvs091 was carried out on all bacterial genomes in the NCBI database using BLASTn, and multiple sequence alignment of the bvs091 homologues was performed using the DNAMAN tool [55]. The target gene of bvs091 was obtained using IntaRNA [56].
4.5. Microscale thermophoresis (MST) measurements
The interactions with the target mRNAs were quantified in vitro using the MST technique [57,58]. The steps include preparing the sRNA, 6-FAM labeled mRNA, and the 5' end of the target mRNA fragment labeled with 6-FAM synthesized by BGI Company (Beijing Genome Research Institute, Beijing, China). The sRNA was prepared using a Novozan T7 High Yield RNA Transcription kit (Vazyme, Nanjing, China) for preparing the primers, as shown in Supplementary Table S4; 5 µL of the samples containing 200 nM of labeled mRNA and competing products with increasing concentration gradients (from 18.3 nM to 600 mM) were loaded onto glass capillaries (Monolith NT.115 series capillaries, Cat#MO-K002). The trace thermal surges were performed using a Monolith NT.115 instrument (NanoTemper Technologies, Germany) in RNase-free water with an excitation power of 40%. The obtained data were analyzed using a Nanotemper MO, and affinity analysis was performed using MO. Additionally, the affinity analysis (x86) and dissociation constants (Kd) were calculated.
4.6. Solid‒gas interface and gas‒liquid biofilm phenotype measurement
Furthermore, 2 μL of the activated WT, ∆bvs091, and obvs091 strains bacterial solution was collected and dripped on the LB solid medium surface. Then, until the bacteria liquid was completely absorbed by the medium, the solution was placed in the training box with a constant temperature of 28 ℃ and cultivated on the right. The growth status of the different strains was detected every 12 h, and a photo record was created using a three-dimensional microscope (Leica, Germany). The observation records were stopped when the biofilm no longer changed. Then, 10 mL LB liquid medium was added to the sterile six-hole cell culture plate, and the activated fungus liquid was inoculated in the ratio of 1:100 on the six-hole cell culture plate. The six-hole cell culture plate was gently shaken to uniformly mix the bacteria solution, which was then placed in the culturing box with a constant temperature of 28 ℃ and cultivated to the biofilm degradation. During the period, the biofilm phenotype’s development status was detected every 12 h, and changes in the biological membrane phenotypes were recorded.
4.7. RNA extraction
The total RNAs were isolated and purified from the bacteria using TRIzol, and the RNA’s integrity was examined using agarose gel electrophoresis after extraction. After passing the test, the sample was sent to Guangzhou Kidio Biotechnology Co., Ltd. establish a library, and the Illumina platform was adopted for sequencing. Fastp was used to QC the raw data [59]. Applying the short-reads alignment tool bowtie2 aligned the clean reads to the species’ full rRNA sequences [60], and a local alignment model was thus used for removing the ribosomal reads from the alignment and retaining the data for subsequent analysis. The reads from the filtered samples were aligned to the reference genome (B. velezensis PEBA20, GenBank: CP046145) using the transcriptome data alignment software bowtie2. Additionally, the differential gene expressions between the groups were analyzed using the software in [61], while the differential genes were screened using FDR and log2FC with FDR <0.05 and |log2FC|>1. Analyzing the significant enrichment in terms of KEGG’s pathway was carried out by using the genome as a background. Additionally, the pathways that were significantly enriched in the differentially expressed genes were identified using hypergeometric tests.
Supplementary Materials
The following supporting information can be downloaded at the website of this paper posted on Preprints.org, Table S1: Analysis of sequence similarity and upstream and downstream genes the name of 5’ sequence; Table S2: sRNA Bvs091 target prediction; Table S3: Strains and plasmid used in this study; Table S4: Primers used in this study.
Author Contributions
Author Contributions: Conceptualization, X.L. and T.X.; methodology, X.L.; software, X.L. T.X. and Y.M.; data curation, X.L. and J.Z.; writing—original draft preparation, T.X.; writing—review and editing, Z.L. and X.L.; visualization, Z.G.; project administration, C.P.; funding acquisition, Z.L. Z.L., T.X., and X.L. contributed equally to this study. All authors have read and agreed to the published version of the manuscript.
Funding
This research was supported by the National Natural Science Foundation of China (Nos. 31770685 and 31270687) and the Shandong Provincial Agricultural Science and Technology Fund Project (No. 2019LY003).
Data Availability Statement
Not applicable.
Acknowledgments
We gratefully acknowledge the help of Susu Fan of the Qilu University of Technology (Shandong Academy of Sciences) for his contribution to the visualization of the paper.
Conflicts of Interest
The authors declare no conflict of interest.
References
- Wagner, E.G.H.; Romby, P. Small RNAs in Bacteria and Archaea: Who They Are, What They Do, and How They Do It. Adv Genet. 2015, 90, 133–208. [Google Scholar] [CrossRef] [PubMed]
- Richmond, C.S.; Glasner, J.D.; Mau, R.; Jin, H.; Blattner, F.R. Genome-Wide Expression Profiling in Escherichia Coli K-12. Nucleic Acids Research. 1999, 27, 3821–3835. [Google Scholar] [CrossRef] [PubMed]
- Fawcett, P.; Eichenberger, P.; Losick, R.; Youngman, P. The Transcriptional Profile of Early to Middle Sporulation in Bacillus Subtilis. Proc Natl Acad Sci U S A. 2000, 97, 8063–8068. [Google Scholar] [CrossRef] [PubMed]
- Waters, L.S.; Storz, G. Regulatory RNAs in Bacteria. Cell. 2009, 136, 615–628. [Google Scholar] [CrossRef] [PubMed]
- Storz, G.; Vogel, J.; Wassarman, K.M. Regulation by Small RNAs in Bacteria: Expanding Frontiers. Mol Cell. 2011, 43, 880–891. [Google Scholar] [CrossRef] [PubMed]
- Pain, A.; Ott, A.; Amine, H.; Rochat, T.; Bouloc, P.; Gautheret, D. An Assessment of Bacterial Small RNA Target Prediction Programs. RNA Biol. 2015, 12, 509–513. [Google Scholar] [CrossRef] [PubMed]
- Melamed, S.; Peer, A.; Faigenbaum-Romm, R.; Gatt, Y.E.; Reiss, N.; Bar, A.; Altuvia, Y.; Argaman, L.; Margalit, H. Global Mapping of Small RNA-Target Interactions in Bacteria. Mol Cell. 2016, 63, 884–897. [Google Scholar] [CrossRef] [PubMed]
- Dar, D.; Sorek, R. Bacterial Noncoding RNAs Excised from within Protein-Coding Transcripts. mBio. 2018, 9, e01730–18. [Google Scholar] [CrossRef]
- Rasmussen, S.; Nielsen, H.B.; Jarmer, H. The Transcriptionally Active Regions in the Genome of Bacillus Subtilis. Mol Microbiol. 2009, 73, 1043–1057. [Google Scholar] [CrossRef]
- Irnov, I.; Sharma, C.M.; Vogel, J.; Winkler, W.C. Identification of Regulatory RNAs in Bacillus Subtilis. Nucleic Acids Res. 2010, 38, 6637–6651. [Google Scholar] [CrossRef]
- Saito, S.; Kakeshita, H.; Nakamura, K. Novel Small RNA-Encoding Genes in the Intergenic Regions of Bacillus Subtilis. Gene. 2009, 428, 2–8. [Google Scholar] [CrossRef] [PubMed]
- Heidrich, N, Chinali, A, Gerth, U, Brantl, S. The small untranslated RNA SR1 from the Bacillus subtilis genome is involved in the regulation of arginine catabolism. Mol Microbiol. 2006, 62, 520–536. [Google Scholar] [CrossRef] [PubMed]
- Silvaggi, J.M.; Perkins, J.B.; Losick, R. Genes for Small, Noncoding RNAs under Sporulation Control in Bacillus Subtilis. J Bacteriol, 2006, 188, 532–541. [Google Scholar] [CrossRef] [PubMed]
- Fan, B.; Blom, J.; Klenk, H.P.; Borriss, R. Bacillus Amyloliquefaciens, Bacillus Velezensis, and Bacillus Siamensis Form an “Operational Group B. Amyloliquefaciens” within the B. Subtilis Species Complex. Front Microbiol. 2017, 8, 22. [Google Scholar] [CrossRef]
- Chen, X.H.; Koumoutsi, A.; Scholz, R.; Eisenreich, A.; Schneider, K.; Heinemeyer, I.; Morgenstern, B.; Voss, B.; Hess, W.R.; Reva, O.; et al. Comparative Analysis of the Complete Genome Sequence of the Plant Growth-Promoting Bacterium Bacillus Amyloliquefaciens FZB42. Nat Biotechnol. 2007, 25, 1007–1014. [Google Scholar] [CrossRef] [PubMed]
- Kong, W.J.; Yan, Y.C.; Li, X.Y.; Liu, Z.Y. Draft Genome Sequence of Bacillus Velezensis PEBA20, a Strain with a Plant Growthpromoting Effect and Biocontrol Potential. Genome Announc. 2018, 6, e00286–18. [Google Scholar] [CrossRef]
- Xu, T.; Li, X.; Chen, K.; Qin, H.; Yi, Z.; Meng, Y.; Liu, Z. A Sporulation-Specific SRNA Bvs196 Contributing to the Developing Spore in Bacillus Velezensis. Microorganisms. 2022, 10, E3487–3496. [Google Scholar] [CrossRef]
- Ul Haq, I.; Müller, P.; Brantl, S. Intermolecular Communication in Bacillus Subtilis: RNA-RNA, RNA-Protein and Small Protein-Protein Interactions. Front Mol Biosci. 2020, 7, 178. [Google Scholar] [CrossRef]
- Brantl, S.; Müller, P. Cis-and Trans-Encoded Small Regulatory RNAs in Bacillus Subtilis. Microorganisms. 2021, 9, 1865. [Google Scholar] [CrossRef]
- Brantl, S. Regulatory Mechanisms Employed by Cis-Encoded Antisense RNAs. Curr Opin Microbiol. 2007, 10, 102–109. [Google Scholar] [CrossRef]
- Brantl, S. Plasmid Replication Control by Antisense RNAs. Microbiol Spectr. 2014, 2, PLAS-0001-2013. [Google Scholar] [CrossRef] [PubMed]
- Durand, S.; Gilet, L.; Condon, C. The Essential Function of B. Subtilis RNase III Is to Silence Foreign Toxin Genes. PLoS Genet. 2012, 8, e1003181. [Google Scholar] [CrossRef] [PubMed]
- Silvaggi, J.M.; Perkins, J.B.; Losick, R. Small Untranslated RNA Antitoxin in Bacillus Subtilis. J Bacteriol. 2005, 187, 6641–6650. [Google Scholar] [CrossRef] [PubMed]
- Jahn N, Preis H, Wiedemann C, Brantl S. BsrG_SR4 from Bacillus Subtilis—The First Temperature-Dependent Type I Toxin-Antitoxin System. Mol Microbiol. 2012, 83, 579–598. [Google Scholar] [CrossRef] [PubMed]
- Müller, P.; Jahn, N.; Ring, C.; Maiwald, C.; Neubert, R.; Meißner, C.; Brantl, S. A Multistress Responsive Type I Toxin-Antitoxin System: BsrE/SR5 from the B. Subtilis Chromosome. RNA Biol. 2016, 13, 511–523. [Google Scholar] [CrossRef] [PubMed]
- Reif, C.; Löser, C.; Brant, S. Bacillus Subtilis Type I Antitoxin SR6 Promotes Degradation of Toxin Yont MRNA and Is Required to Prevent Toxic YoyJ Overexpression. Toxins (Basel). 2018, 10, 74. [Google Scholar] [CrossRef]
- Brantl, S.; Müller, P. Toxin-Antitoxin Systems in Bacillus Subtilis. Toxins (Basel). 2019, 11, 262. [Google Scholar] [CrossRef] [PubMed]
- Rath, H.; Reder, A.; Hoffmann, T.; Hammer, E.; Seubert, A.; Bremer, E.; Völker, U.; Mäder, U. Management of Osmoprotectant Uptake Hierarchy in Bacillus Subtilis via a SigB-Dependent Antisense RNA. Front Microbiol. 2020, 11, 622. [Google Scholar] [CrossRef]
- Brantl, S. Acting Antisense: Plasmid- and Chromosome-Encoded SRNAs from Gram-Positive Bacteria. Future Microbiol. 2012, 7, 853–871. [Google Scholar] [CrossRef]
- Morita, T, Mochizuki, Y, Aiba, H. Translational repression is sufficient for gene silencing by bacterial small noncoding RNAs in the absence of mRNA destruction. Proc Natl Acad Sci. 2006, 103, 4858–4863. [Google Scholar] [CrossRef]
- Licht, A.; Preis, S.; Brantl, S. Implication of CcpN in the Regulation of a Novel Untranslated RNA (SR1) in Bacillus Subtilis. Mol Microbiol. 2005, 58, 189–206. [Google Scholar] [CrossRef] [PubMed]
- Durand, S.; dé rique Braun, F.; Helfer, A.-C.; Romby, P.; Condon, C. SRNA-Mediated Activation of Gene Expression by Inhibition of 5’-3’ Exonucleolytic MRNA Degradation. Elife. 2017, 6, e23602. [Google Scholar] [CrossRef] [PubMed]
- Grainger, D.C.; Lee, D.J.; Busby, S.J. Direct Methods for Studying Transcription Regulatory Proteins and RNA Polymerase in Bacteria. Curr Opin Microbiol. 2009, 12, 531–535. [Google Scholar] [CrossRef] [PubMed]
- Ishihama, A. Prokaryotic Genome Regulation: Multifactor Promoters, Multitarget Regulators and Hierarchic Networks. FEMS Microbiol Rev. 2010, 34, 628–645. [Google Scholar] [CrossRef] [PubMed]
- Arrieta-Ortiz, M.L.; Hafemeister, C.; Bate, A.R.; Chu, T.; Greenfield, A.; Shuster, B.; Barry, S.N.; Gallitto, M.; Liu, B.; Kacmarczyk, T.; et al. An Experimentally Supported Model of the Bacillus Subtilis Global Transcriptional Regulatory Network. Mol Syst Biol. 2015, 11, 839. [Google Scholar] [CrossRef]
- Nicolas, P.; Mäder, U.; Dervyn, E.; Rochat, T.; Leduc, A.; Pigeonneau, N.; Bidnenko, E.; Marchadier, E.; Hoebeke, M.; Aymerich, S.; et al. Condition-Dependent Transcriptome Reveals High-Level Regulatory Architecture in Bacillus Subtilis. Science (1979) 2012, 335, 1103–1106. [Google Scholar] [CrossRef] [PubMed]
- Maaß, S.; Wachlin, G.; Bernhardt, J.; Eymann, C.; Fromion, V.; Riedel, K.; Becher, D.; Hecker, M. Highly Precise Quantification of Protein Molecules per Cell during Stress and Starvation Responses in Bacillus Subtilis. Molecular and Cellular Proteomics. 2014, 13, 2260–2276. [Google Scholar] [CrossRef]
- Meeske, A.J.; Sham, L.T.; Kimsey, H.; Koo, B.M.; Gross, C.A.; Bernhardt, T.G.; Rudner, D.Z. MurJ and a Novel Lipid II Flippase Are Required for Cell Wall Biogenesis in Bacillus Subtilis. Proc Natl Acad Sci U S A. 2015, 112, 6437–6442. [Google Scholar] [CrossRef]
- Zuker, M. Mfold Web Server for Nucleic Acid Folding and Hybridization Prediction. Nucleic Acids Res. 2003, 31, 3406–3415. [Google Scholar] [CrossRef]
- Man, S.; Cheng, R.; Miao, C.; Gong, Q.; Gu, Y.; Lu, X.; Han, F.; Yu, W. Artificial Trans-Encoded Small Non-Coding RNAs Specifically Silence the Selected Gene Expression in Bacteria. Nucleic Acids Res. 2011, 39, e50. [Google Scholar] [CrossRef]
- Backofen, R.; Hess, W.R. Computational Prediction of SRNAs and Their Targets in Bacteria. RNA Biol 2010, 7, 33–42. [Google Scholar] [CrossRef]
- Chai, Y.; Beauregard, P.B.; Vlamakis, H.; Losick, R.; Kolter, R. Galactose Metabolism Plays a Crucial Role in Biofilm Formation by Bacillus Subtilis. mBio. 2012, 3, e00184–12. [Google Scholar] [CrossRef] [PubMed]
- Heidrich, N.; Moll, I.; Brantl, S. In Vitro Analysis of the Interaction between the Small RNA SR1 and Its Primary Target AhrC MRNA. Nucleic Acids Res 2007, 35, 4331–4346. [Google Scholar] [CrossRef] [PubMed]
- Wick, L.M.; Egli, T. Molecular Components of Physiological Stress Responses in Escherichia Coli. Adv Biochem Eng Biotechnol. 2004, 89, 1–45. [Google Scholar] [CrossRef] [PubMed]
- Brill, J.; Hoffmann, T.; Bleisteiner, M.; Bremer, E. Osmotically Controlled Synthesis of the Compatible Solute Proline Is Critical for Cellular Defense of Bacillus Subtilis against High Osmolarity. J Bacteriol. 2011, 193, 5335–5346. [Google Scholar] [CrossRef] [PubMed]
- Asally, M.; Kittisopikul, M.; Rué, P.; Du, Y.; Hu, Z.; Çaǧatay, T.; Robinson, A.B.; Lu, H.; Garcia-Ojalvo, J.; Süel, G.M. Localized Cell Death Focuses Mechanical Forces during 3D Patterning in a Biofilm. Proc Natl Acad Sci U S A. 2012, 109, 18891–18896. [Google Scholar] [CrossRef]
- Finking, R.; Marahiel, M.A. Biosynthesis of Nonribosomal Peptides. Annu Rev Microbiol. 2004, 58, 453–488. [Google Scholar] [CrossRef]
- Liu, Y.; Gao, W.; Wang, Y.; Wu, L.; Liu, X.; Yan, T.; Alm, E.; Arkin, A.; Thompson, D.K.; Fields, M.W.; et al. Transcriptome Analysis of Shewanella Oneidensis MR-1 in Response to Elevated Salt Conditions. J Bacteriol. 2005, 187, 2501–2507. [Google Scholar] [CrossRef]
- Gancz, H.; Merrell, D.S. The Helicobacter Pylori Ferric Uptake Regulator (Fur) Is Essential for Growth under Sodium Chloride Stress. Journal of Microbiology. 2011, 49, 294–298. [Google Scholar] [CrossRef]
- Krispin,O, Allmansberger, R. The Bacillus subtilis galE gene is essential in the presence of glucose and galactose. J Bacteriol. 1998, 180, 2265–2270. [Google Scholar] [CrossRef]
- Irnov, I.; Winkler, W.C. A Regulatory RNA Required for Antitermination of Biofilm and Capsular Polysaccharide Operons in Bacillales. Mol Microbiol. 2010, 76, 559–575. [Google Scholar] [CrossRef] [PubMed]
- Arnaud, M.; Chastanet, A.; Débarbouillé, M. New Vector for Efficient Allelic Replacement in Naturally Nontransformable, Low-GC-Content, Gram-Positive Bacteria. Appl Environ Microbiol. 2004, 70, 6887–6891. [Google Scholar] [CrossRef] [PubMed]
- Pedelacq, J.D.; Cabantous, S. Development and Applications of Superfolder and Split Fluorescent Protein Detection Systems in Biology. Int J Mol Sci. 2019, 20, 3479. [Google Scholar] [CrossRef] [PubMed]
- Zhang, H.; Zhan, Y.; Yan, Y.; Liu, Y.; Hu, G.; Wang, S.; Yang, H.; Qiu, X.; Liu, Y.; Li, J.; et al. The Pseudomonas Stutzeri-Specific Regulatory Noncoding RNA Nfis Targets Katb MRNA Encoding a Catalase Essential for Optimal Oxidative Resistance and Nitrogenase Activity. J Bacteriol. 2019, 201. [Google Scholar] [CrossRef] [PubMed]
- Will, S.; Joshi, T.; Hofacker, I.L.; Stadler, P.F.; Backofen, R. LocARNA-P: Accurate Boundary Prediction and Improved Detection of Structural RNAs. RNA. 2012, 18, 900–914. [Google Scholar] [CrossRef] [PubMed]
- Wright, P.R.; Richter, A.S.; Papenfort, K.; Mann, M.; Vogel, J.; Hess, W.R.; Backofen, R.; Georg, J. Comparative Genomics Boosts Target Prediction for Bacterial Small RNAs. Proc Natl Acad Sci U S A. 2013, 110, E3487–3496. [Google Scholar] [CrossRef] [PubMed]
- Wienken, C.J.; Baaske, P.; Rothbauer, U.; Braun, D.; Duhr, S. Protein-Binding Assays in Biological Liquids Using Microscale Thermophoresis. Nat Commun. 2010, 1, 100. [Google Scholar] [CrossRef]
- Jerabek-Willemsen, M.; André, T.; Wanner, R.; Roth, H.M.; Duhr, S.; Baaske, P.; Breitsprecher, D. MicroScale Thermophoresis: Interaction Analysis and Beyond. J Mol Struct. 2014, 1077, 101–113. [Google Scholar] [CrossRef]
- Chen, S.; Zhou, Y.; Chen, Y.; Gu, J. Fastp: An Ultra-Fast All-in-One FASTQ Preprocessor. Bioinformatics. 2018, 34, i884–i890. [Google Scholar] [CrossRef]
- Langmead, B.; Salzberg, S.L. Fast Gapped-Read Alignment with Bowtie 2. Nat Methods. 2012, 9, 357–359. [Google Scholar] [CrossRef]
- Robinson, M.D.; McCarthy, D.J.; Smyth, G.K. EdgeR: A Bioconductor Package for Differential Expression Analysis of Digital Gene Expression Data. Bioinformatics. 2009, 26, 139–140. [Google Scholar] [CrossRef]
Figure 1.
Characterization of sRNA Bvs091. (A) Physical map and nucleotide sequence of a hypothetic sRNA in B. velezensis. (Blue) Boxes -10 and -35, are promoters of hypothetical sRNAs predicted using BPROM. The arrow indicates the start and direction of the hypothetic sRNA’s transcription. (B) Using RT-PCR technology to verify whether the hypothetic sRNA is co-expressed with upstream or downstream genes: 1, the sequence included ydaG and the hypothetic sRNA; 2, the hypothetic sRNA; and, 3, the sequence included ydaH and the hypothetic sRNA. (C) The hypothetic sRNA’s expression levels before and after salt shock based on RNA-Seq analysis in B. velezensis strain PEBA20. WT is control representing before the salt shock, and WT1 is the relative expression of the hypothetic sRNA at 2.8% NaCl concentration treated with B. velezensis for 10 min.
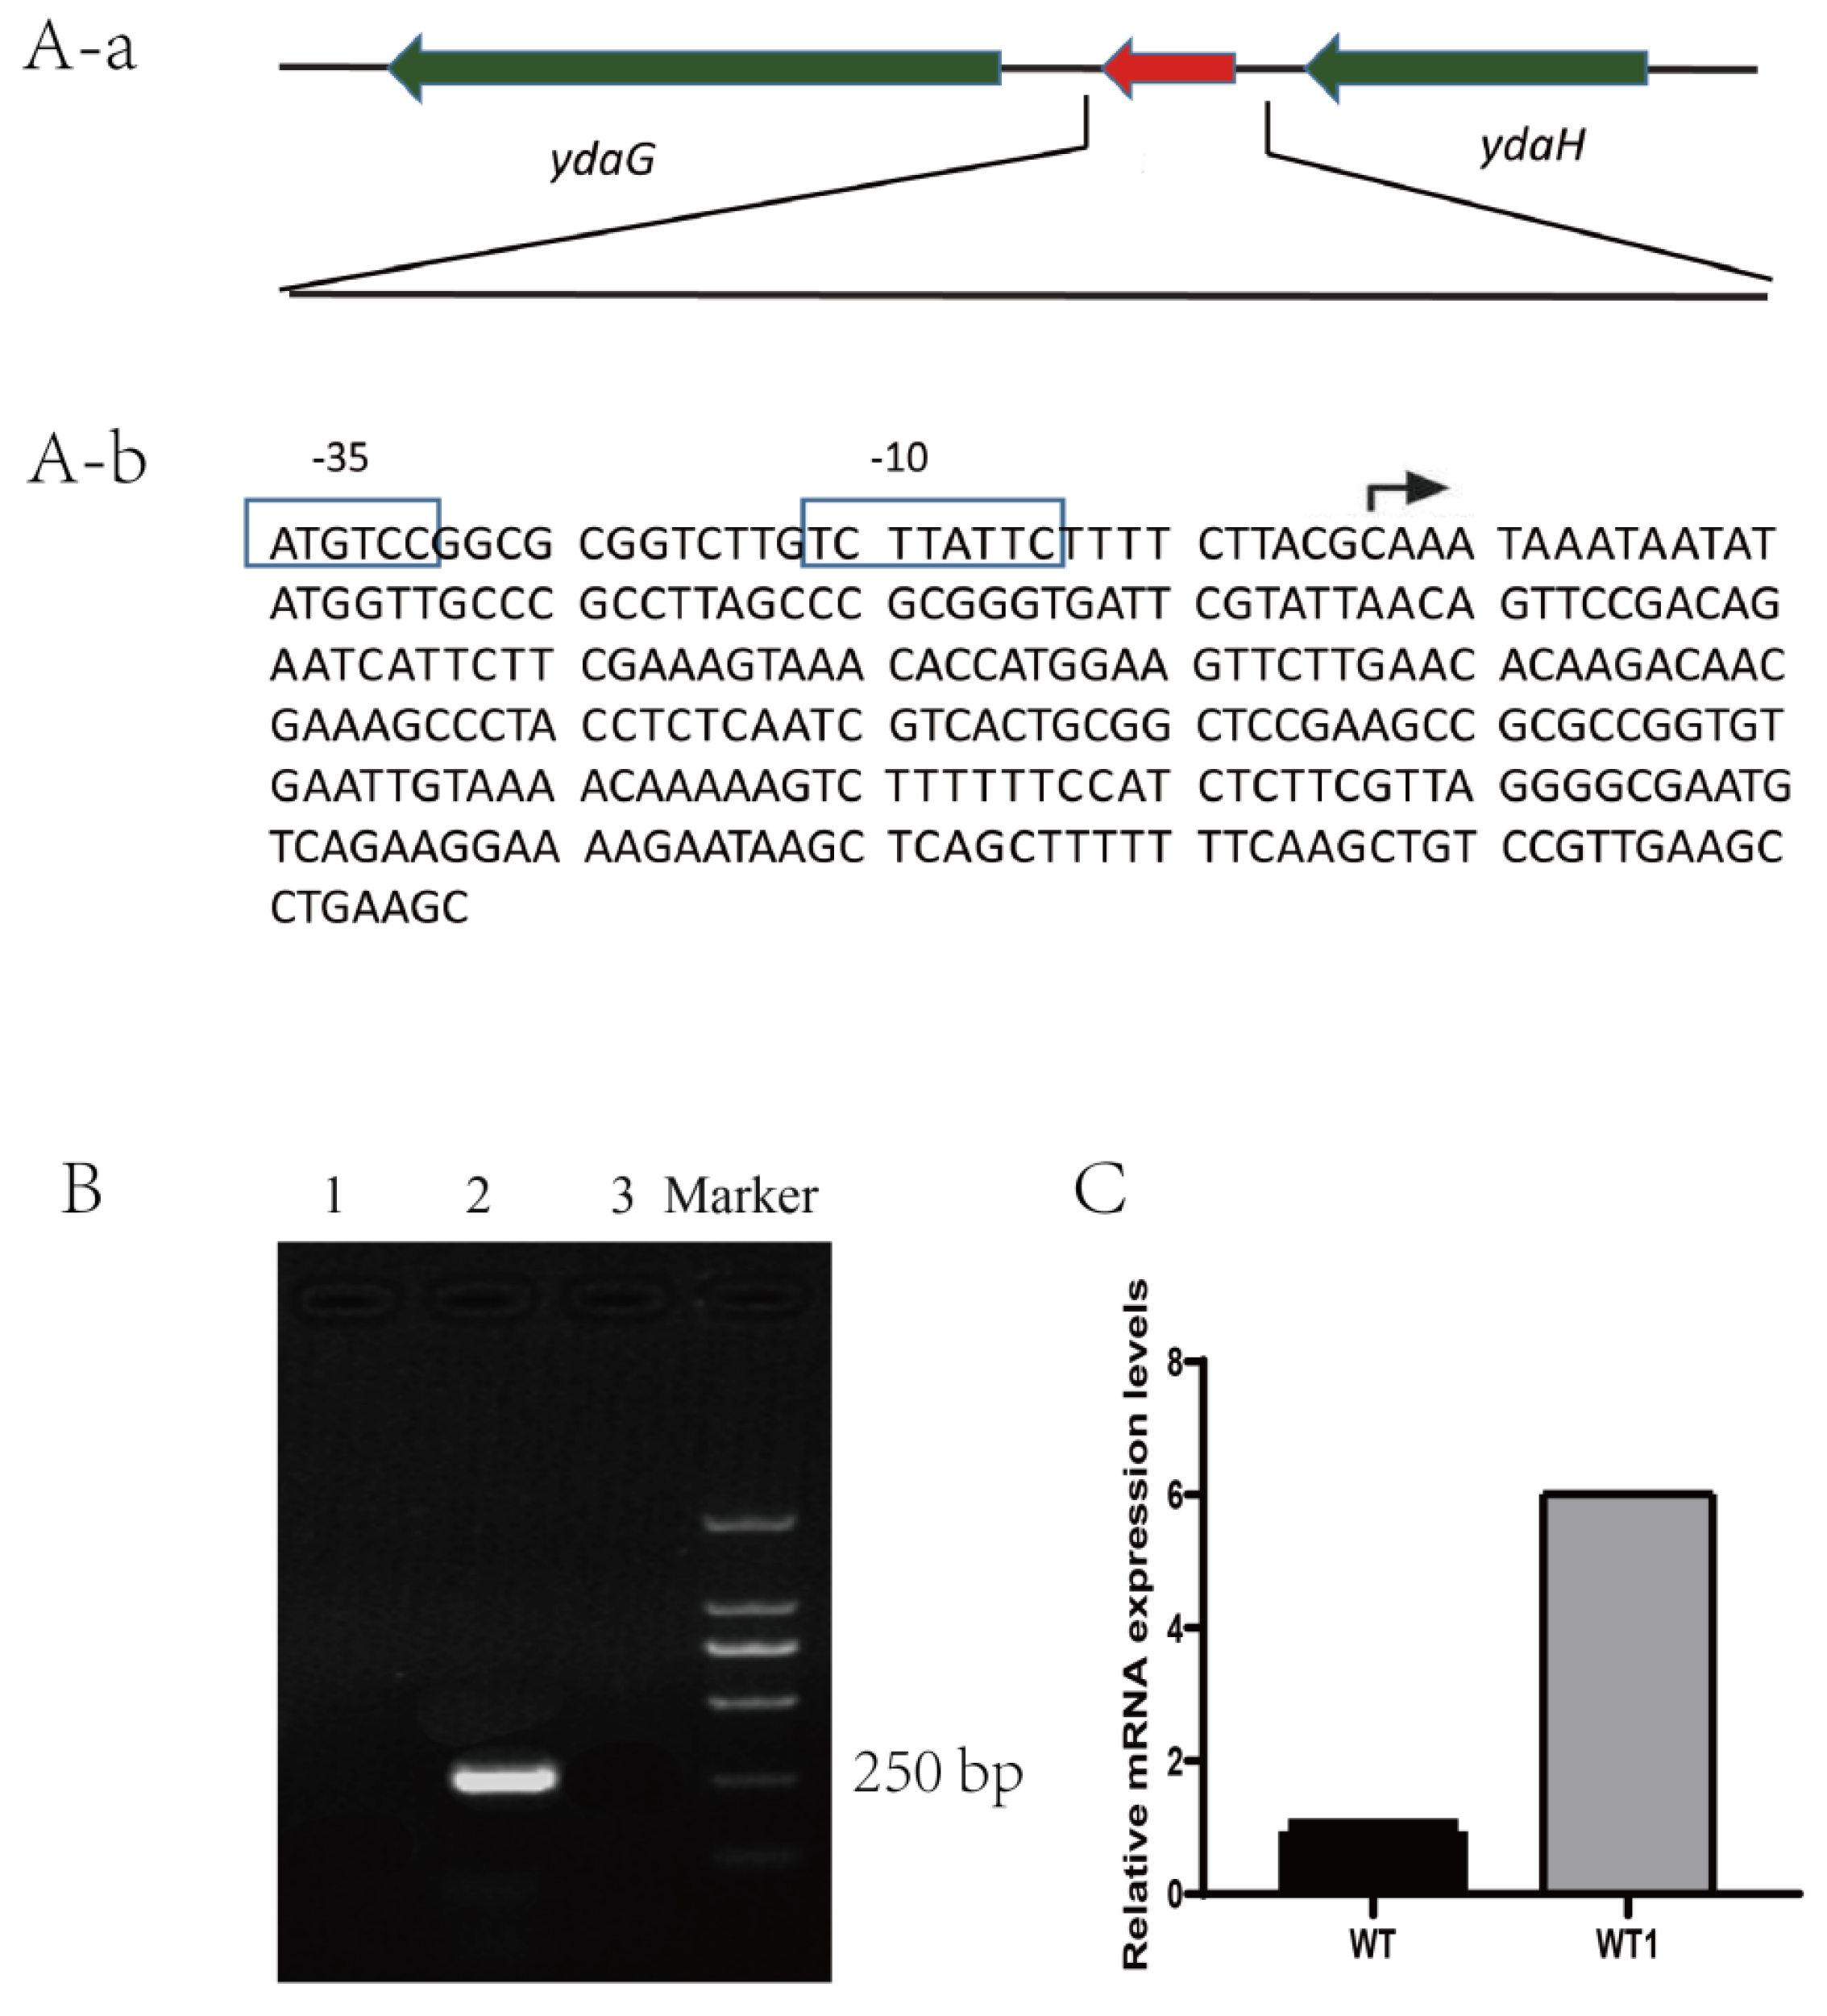
Figure 2.
The homologous sequences phylogenetic tree constructed using MEGA-X by performing the maximum likelihood method.
Figure 2.
The homologous sequences phylogenetic tree constructed using MEGA-X by performing the maximum likelihood method.
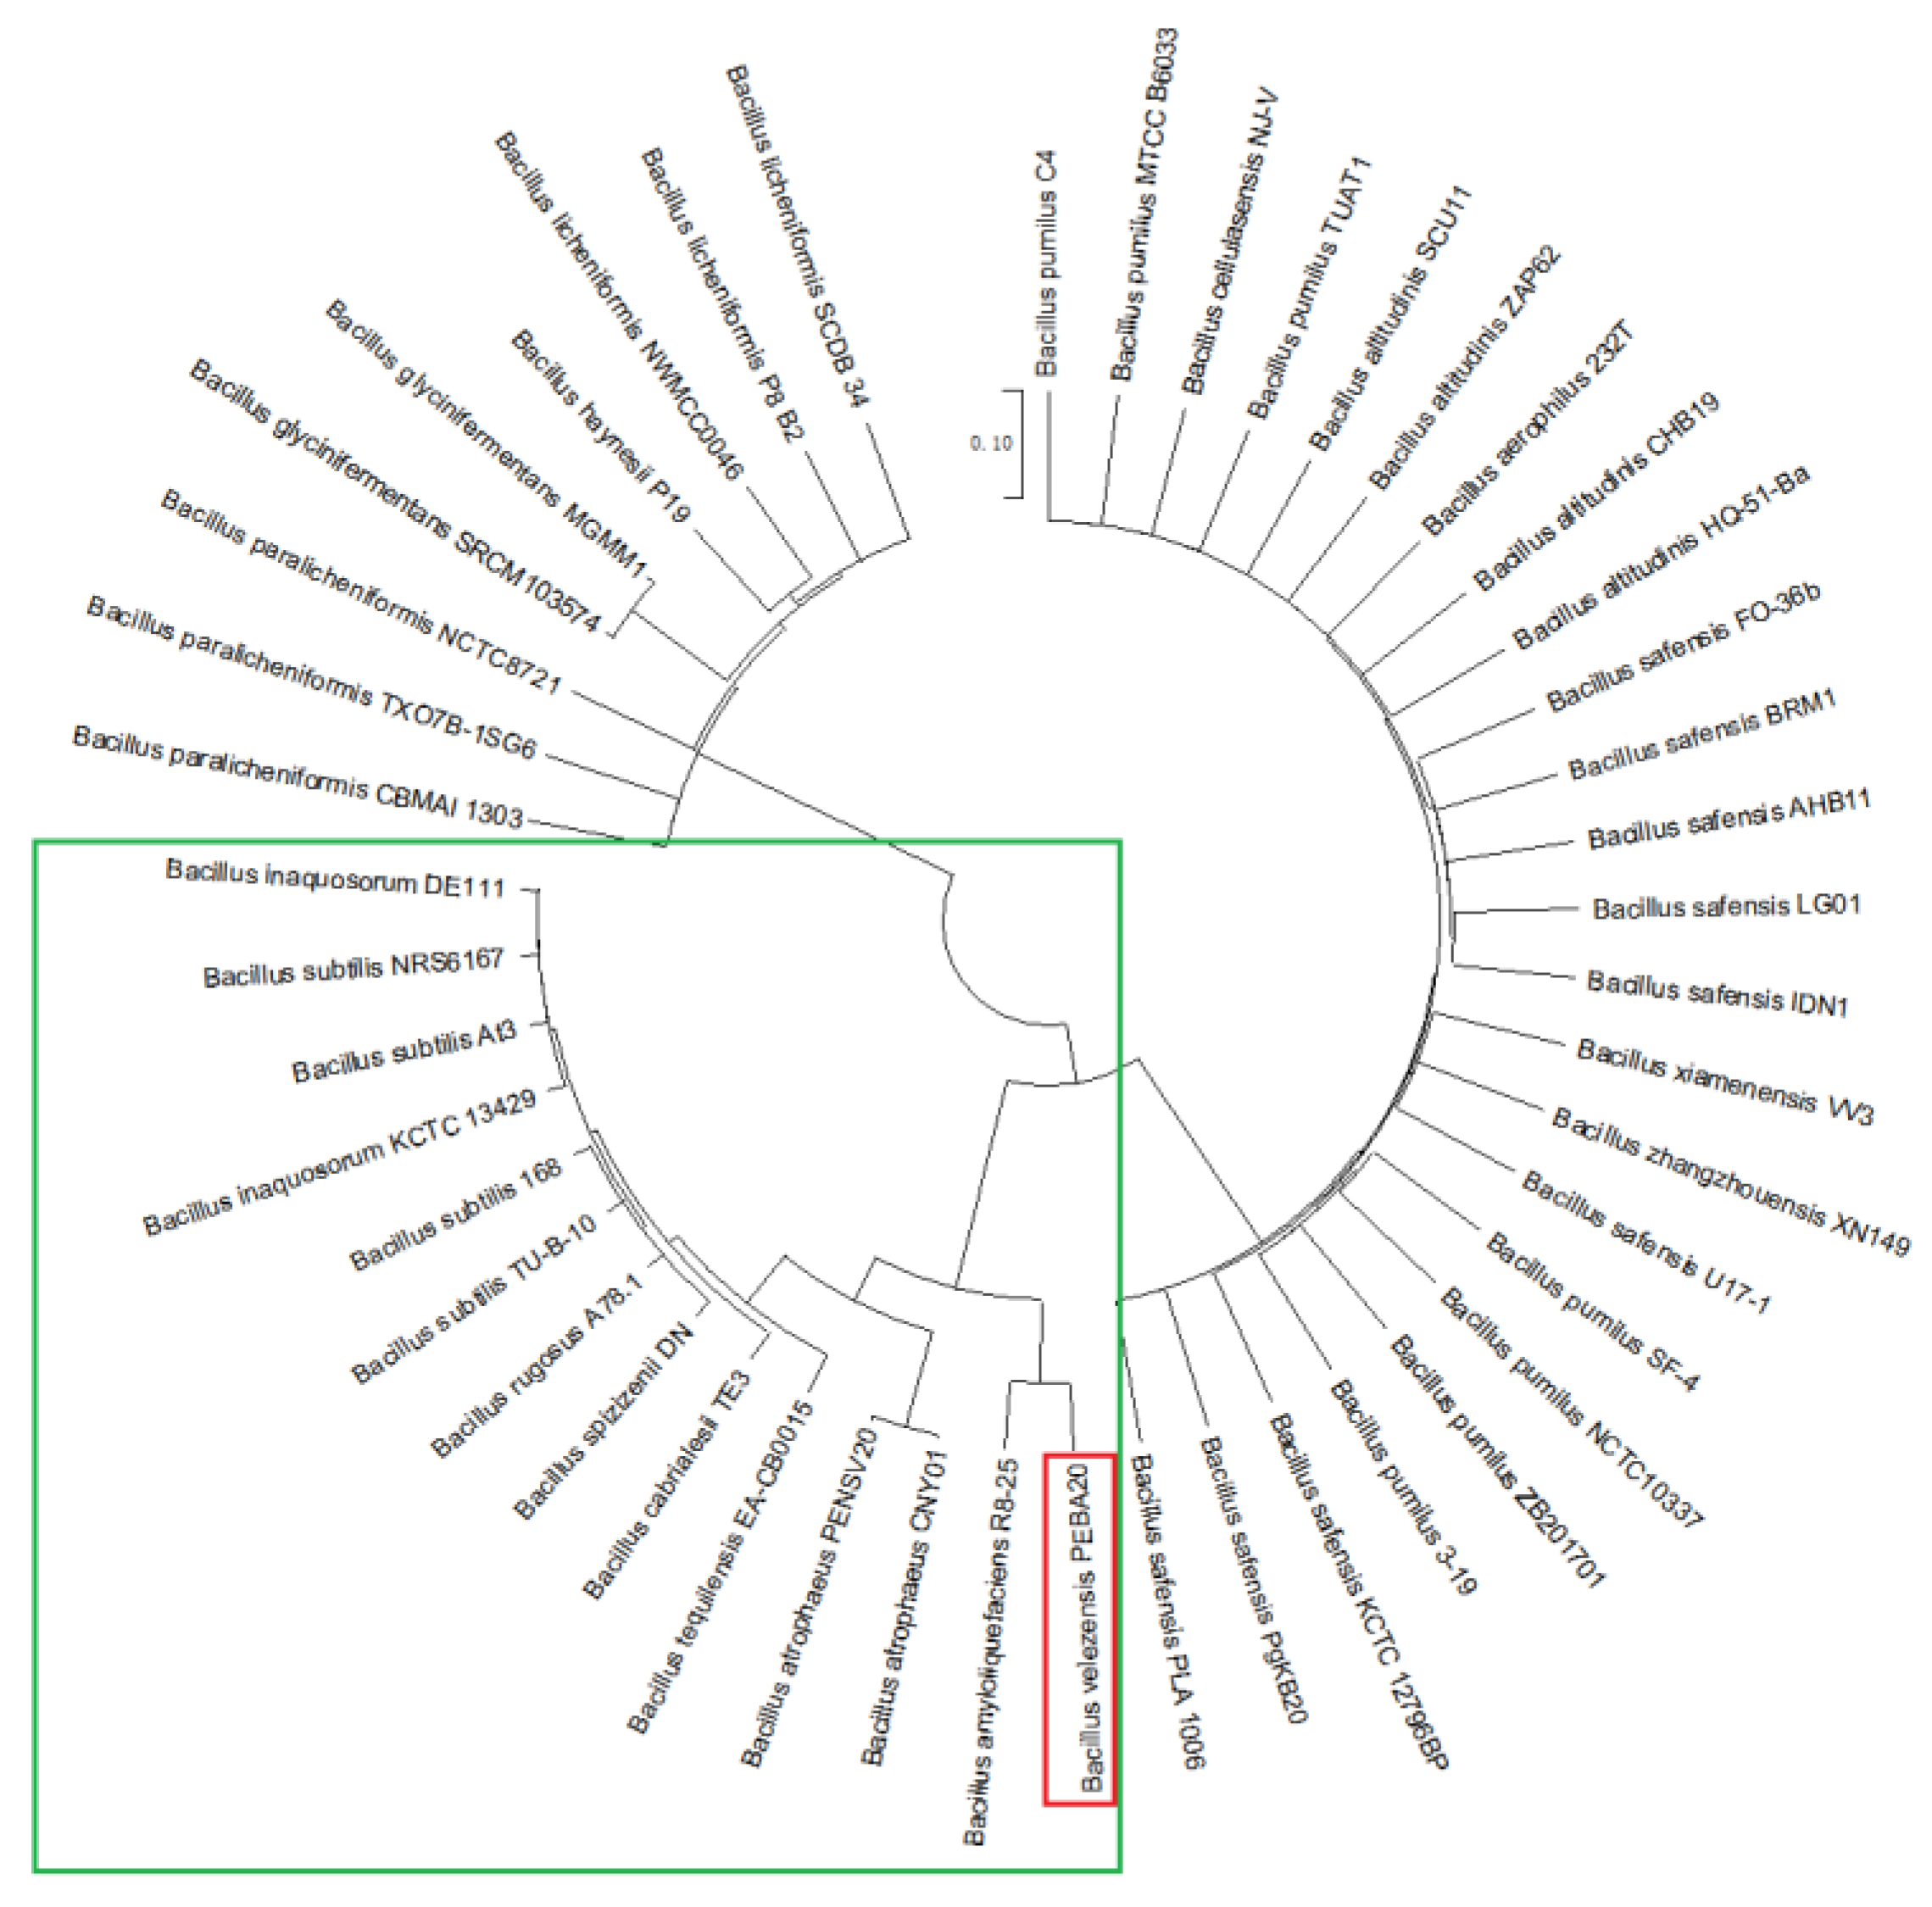
Figure 3.
Sequence conservation and secondary structure of Bvs091. (A) Sequence conservation analysis of 47 bvs091 homologues using DNAMAN. Sequence homology is shown as different colors: dark blue=100%, 100% > pink as ≥ 75%, 75 > blue as ≥ 50% and 50 > yellow as ≥ 25%; (B) Secondary structure of Bvs091; secondary structure is predicted using MFold and shown as minimum free energy values, loop1 (1‒9 nt, 52‒67 nt, and 268‒271 nt), loop2 (81‒84 nt, 165‒185 nt, and 238‒233 nt), and loop3 (88‒89 nt, 121‒141 nt, and 156‒161 nt).
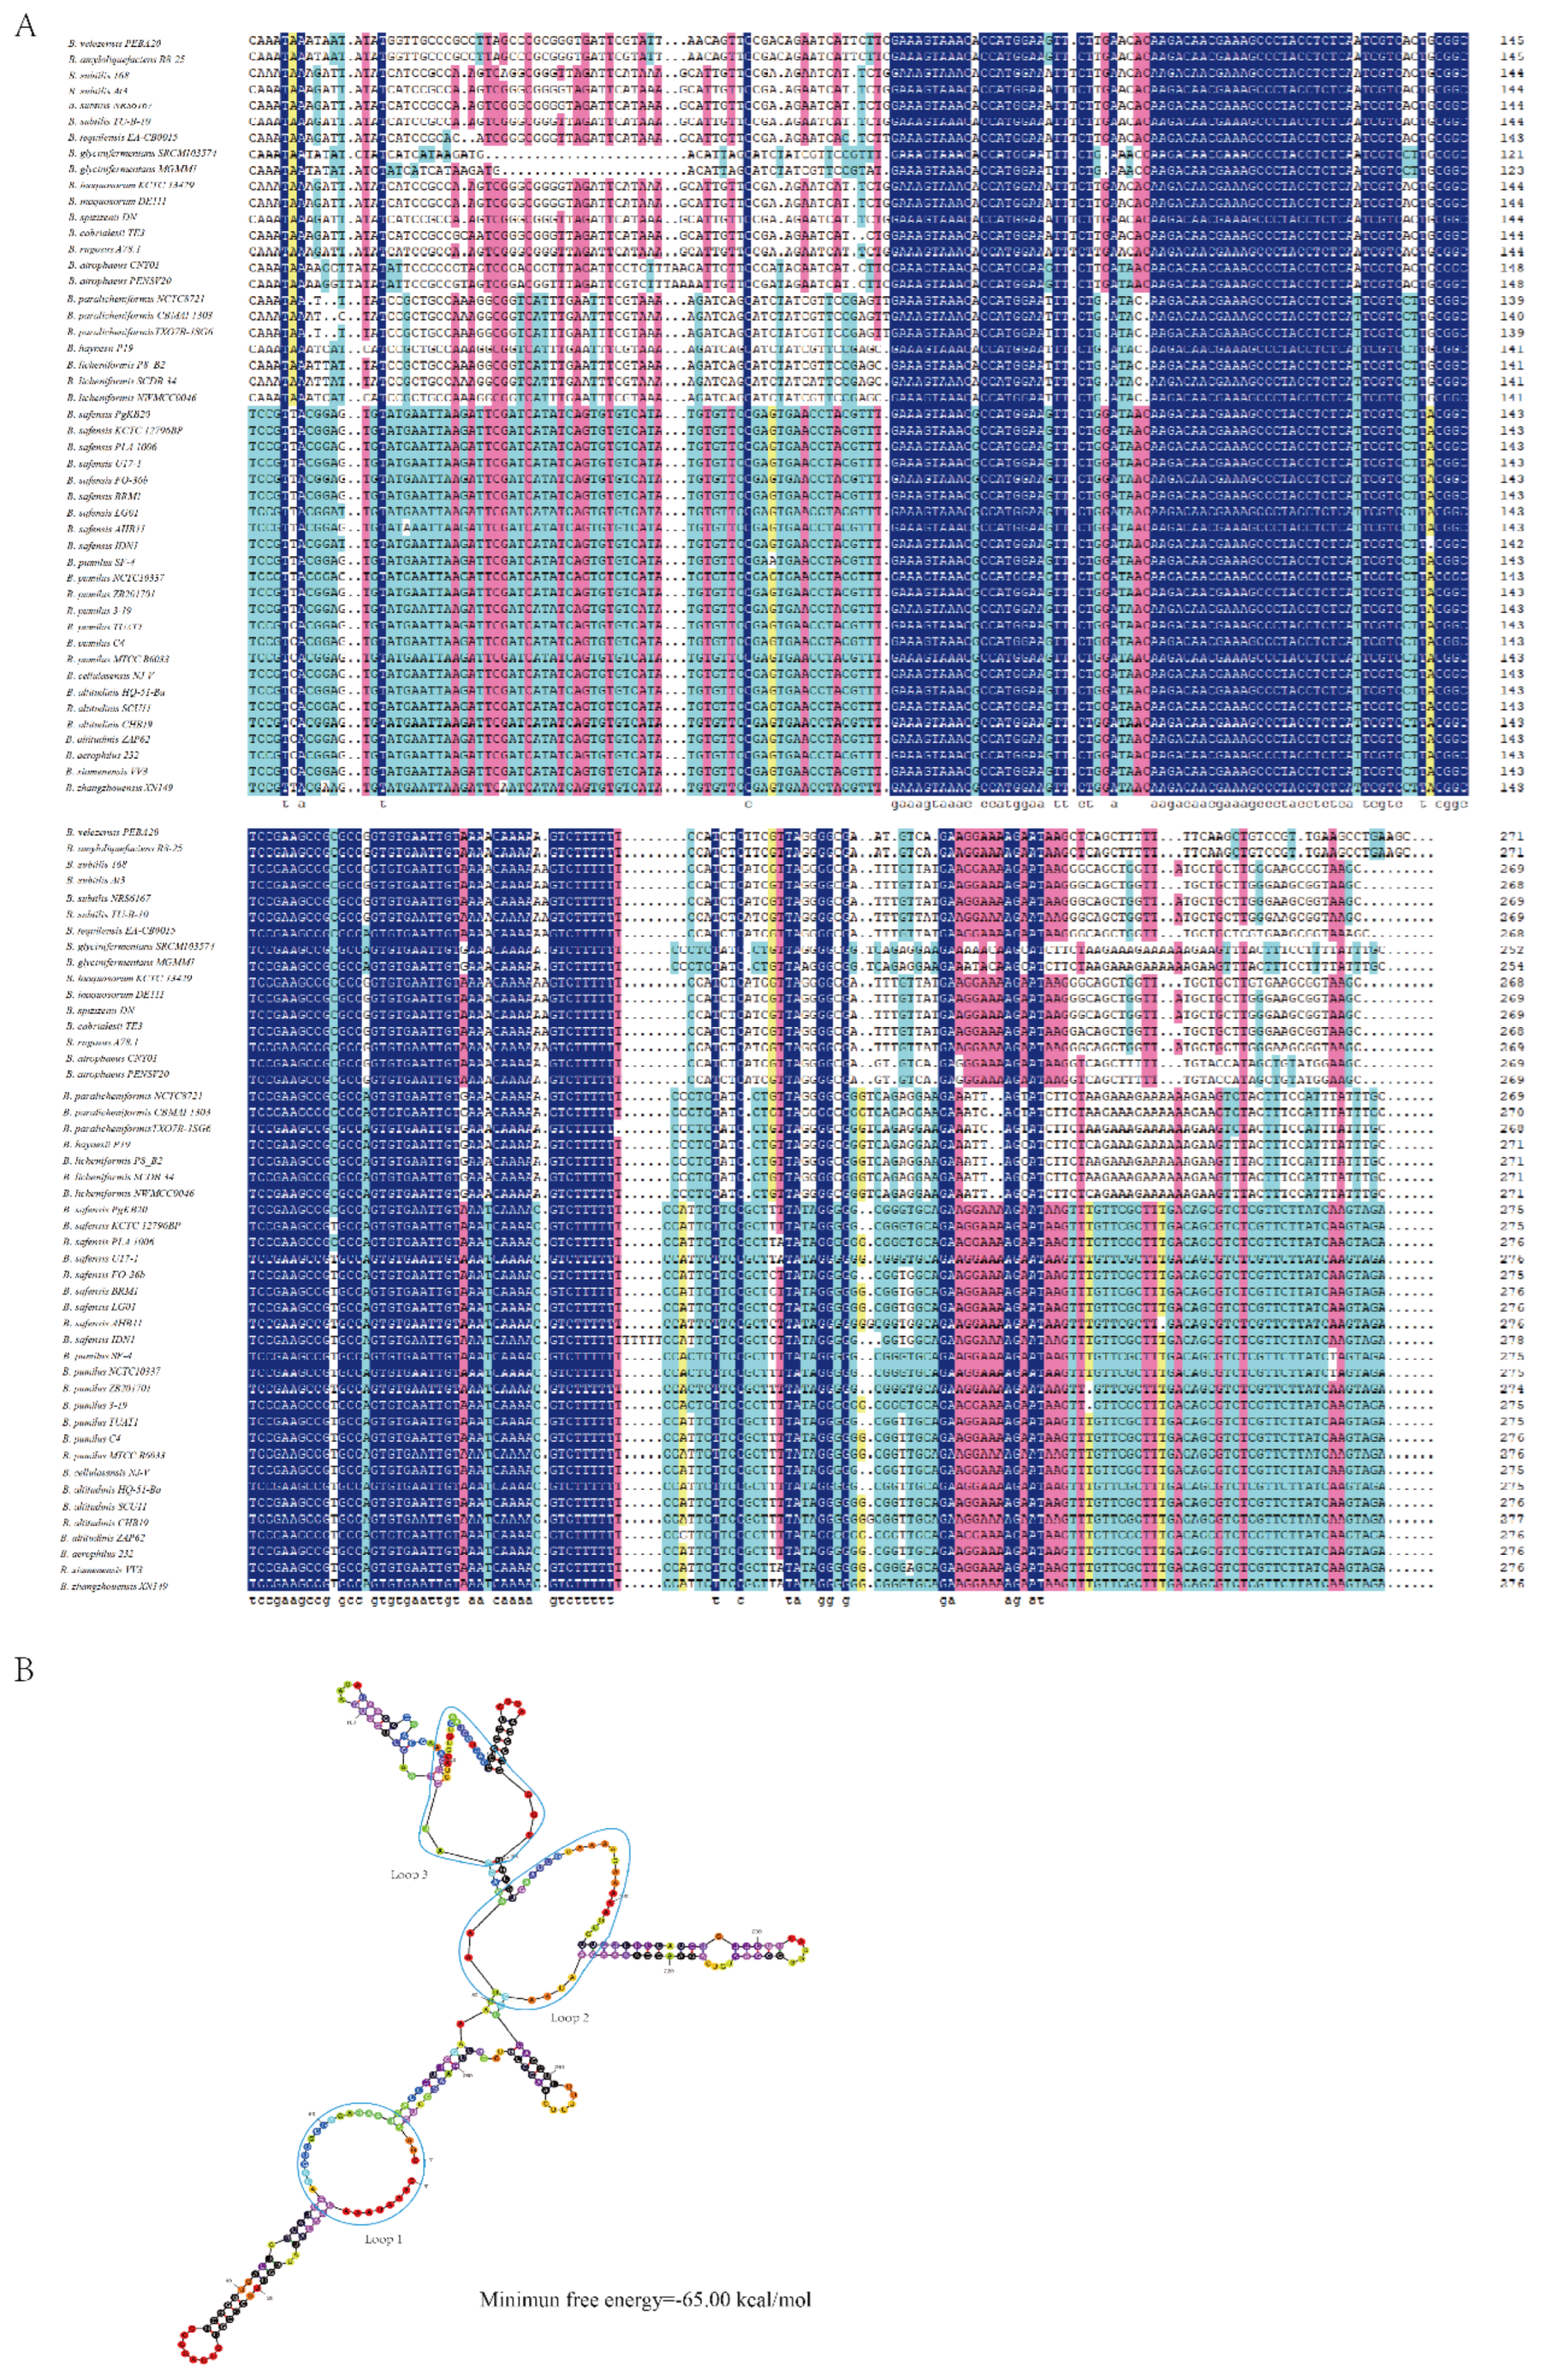
Figure 4.
Deletion of bvs091 affects growth of B. velezensis. (A) Schematic diagram of bvs091 overexpression strain (obvs091) construction; (B) growth curves of WT, ∆bvs091, and obvs091 in LB; (C) biofilm phenotypes at the solid‒gas interface of WT, ∆bvs091, and obvs091; and (D) biofilm phenotypes at the liquid‒gas interface of WT, ∆bvs091, and obvs091.
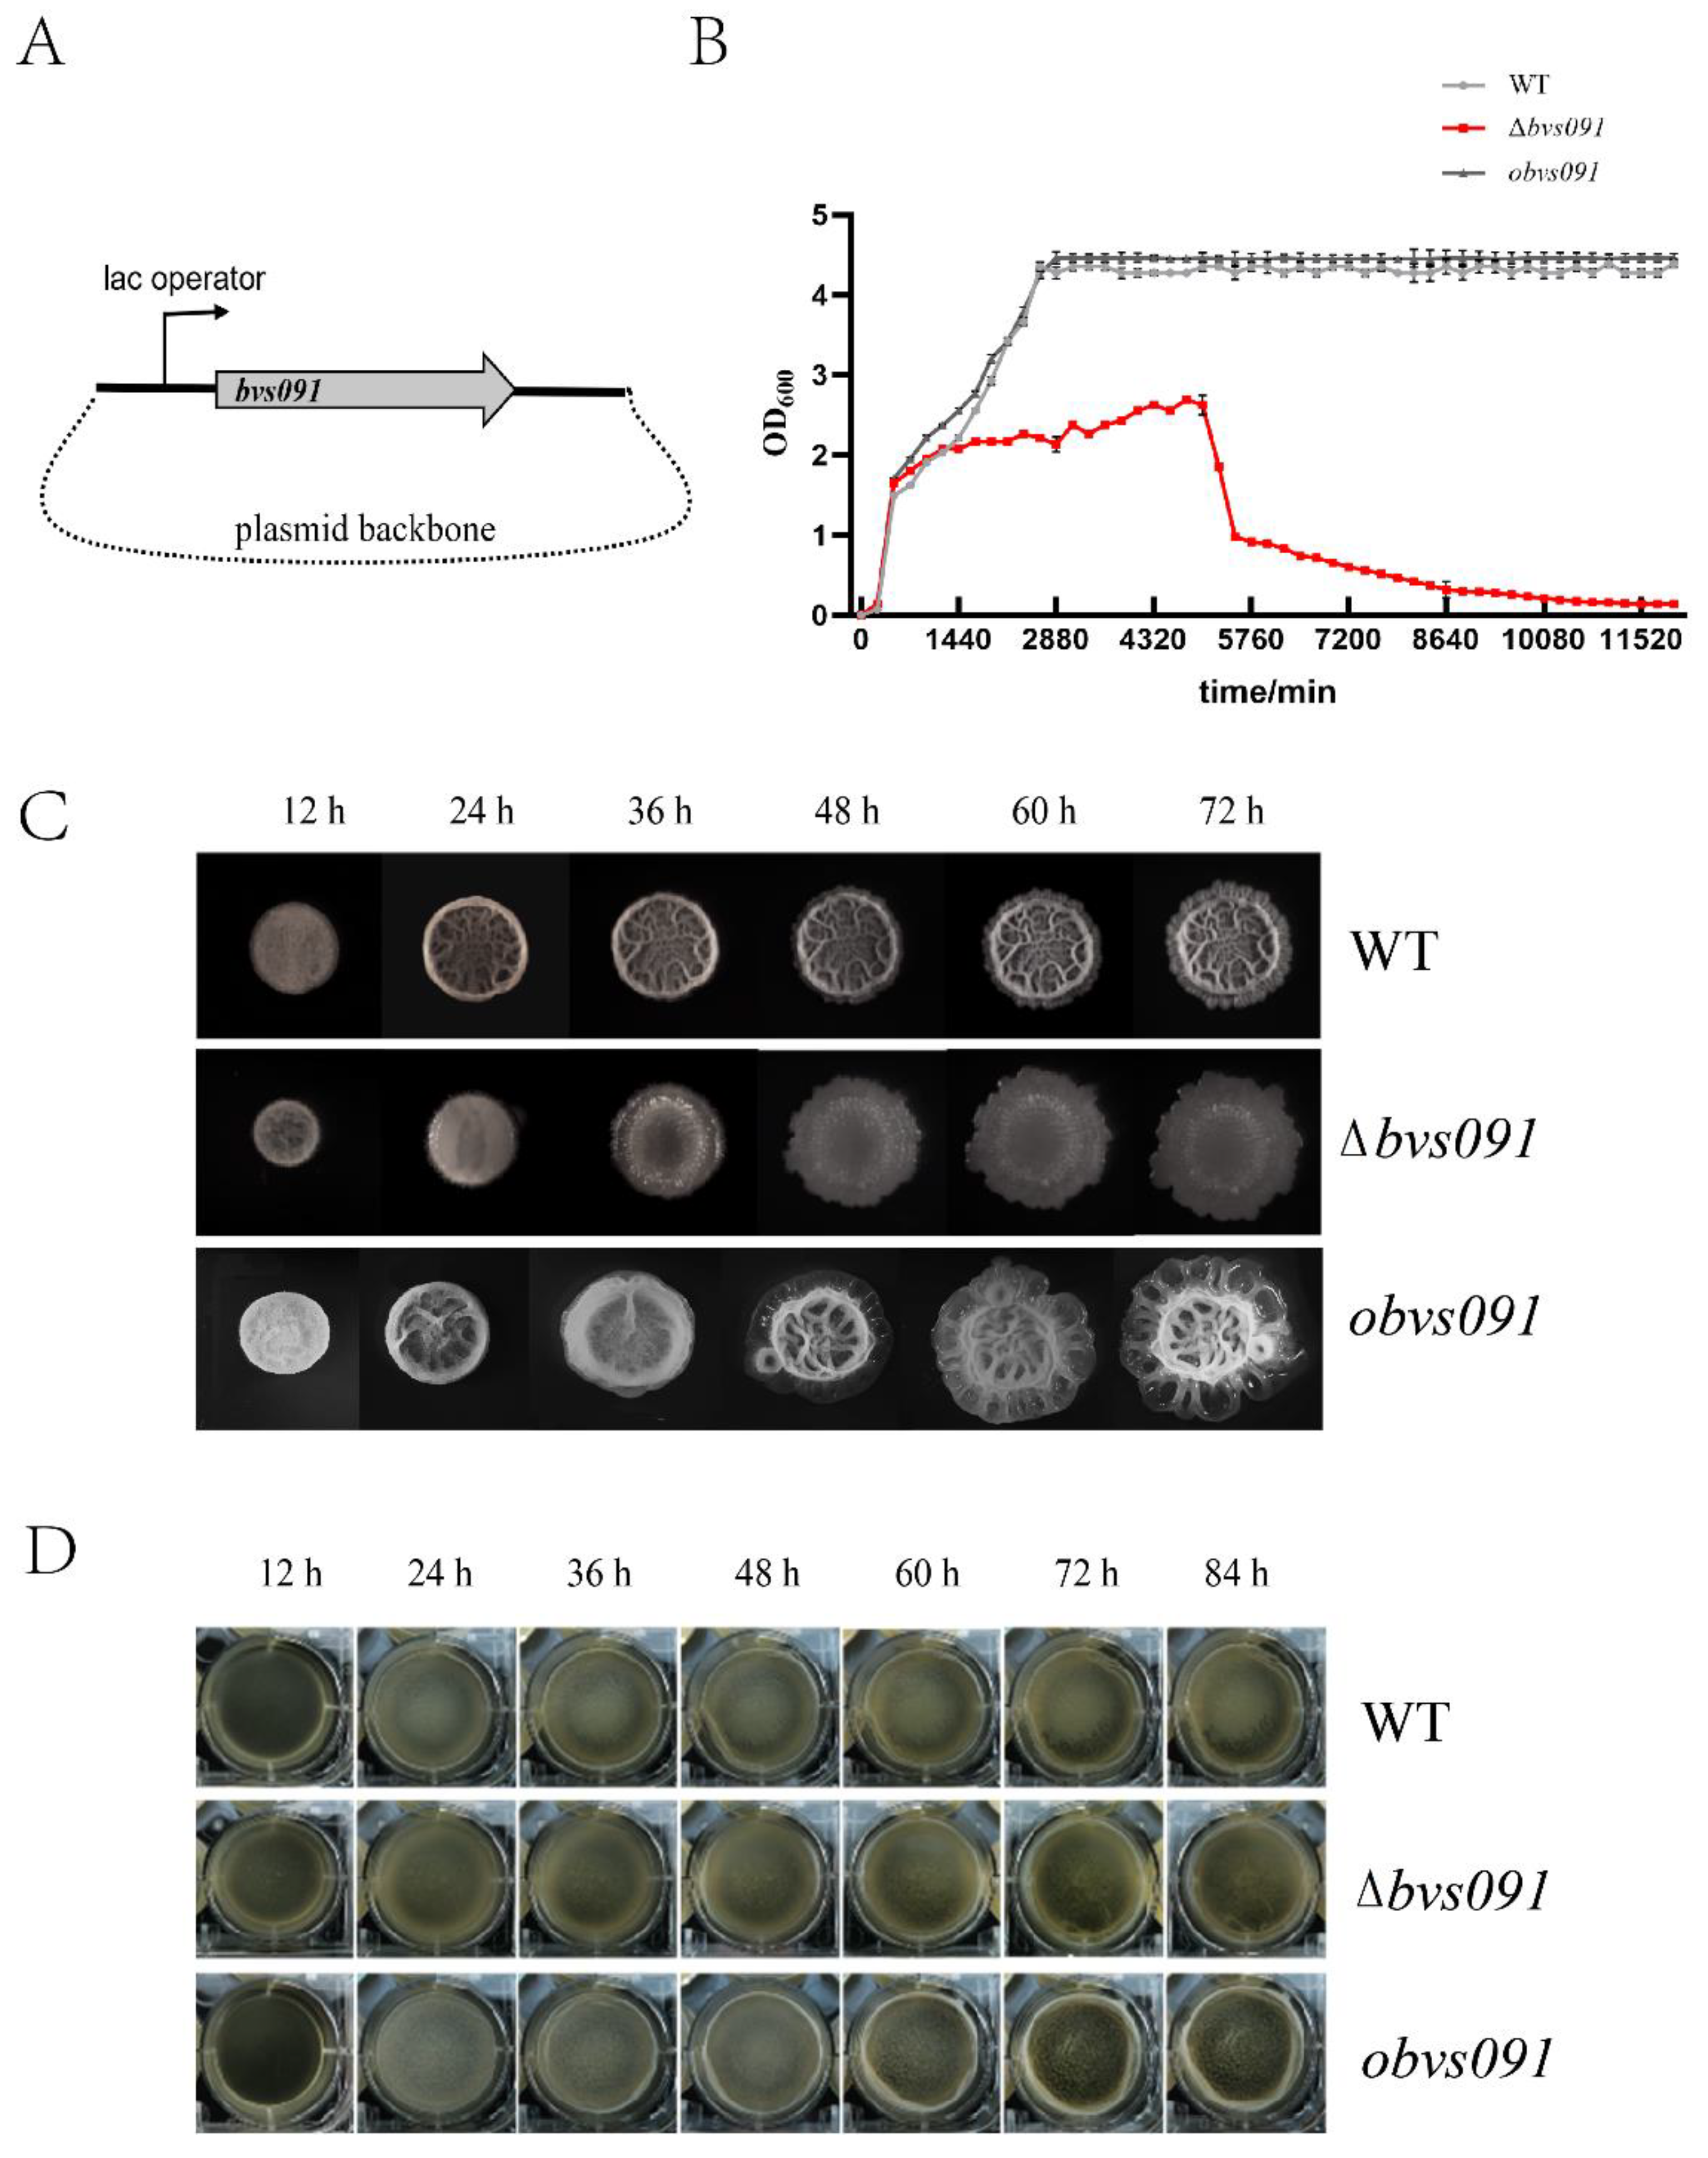
Figure 5.
Deletion of bvs091 decreases salt tolerance of B. velezensis. (A-a) Growth curves of WT, ∆bvs091, and obvs091 in liquid LB containing 8% NaCl; (A-b) WT, ∆bvs091, and obvs091 0‒840 min growth curves; (A-c) WT, ∆bvs091, and obvs091 700-1000 min growth curves; (A-d) length of exponential growth period for WT, ∆bvs091, and obvs091; (A-e) WT, ∆bvs091, and obvs091 1000 min and 1200 min OD600 values; and (B) survival phenotype plate assay of WT, ∆bvs091, and obvs091 salt shock.
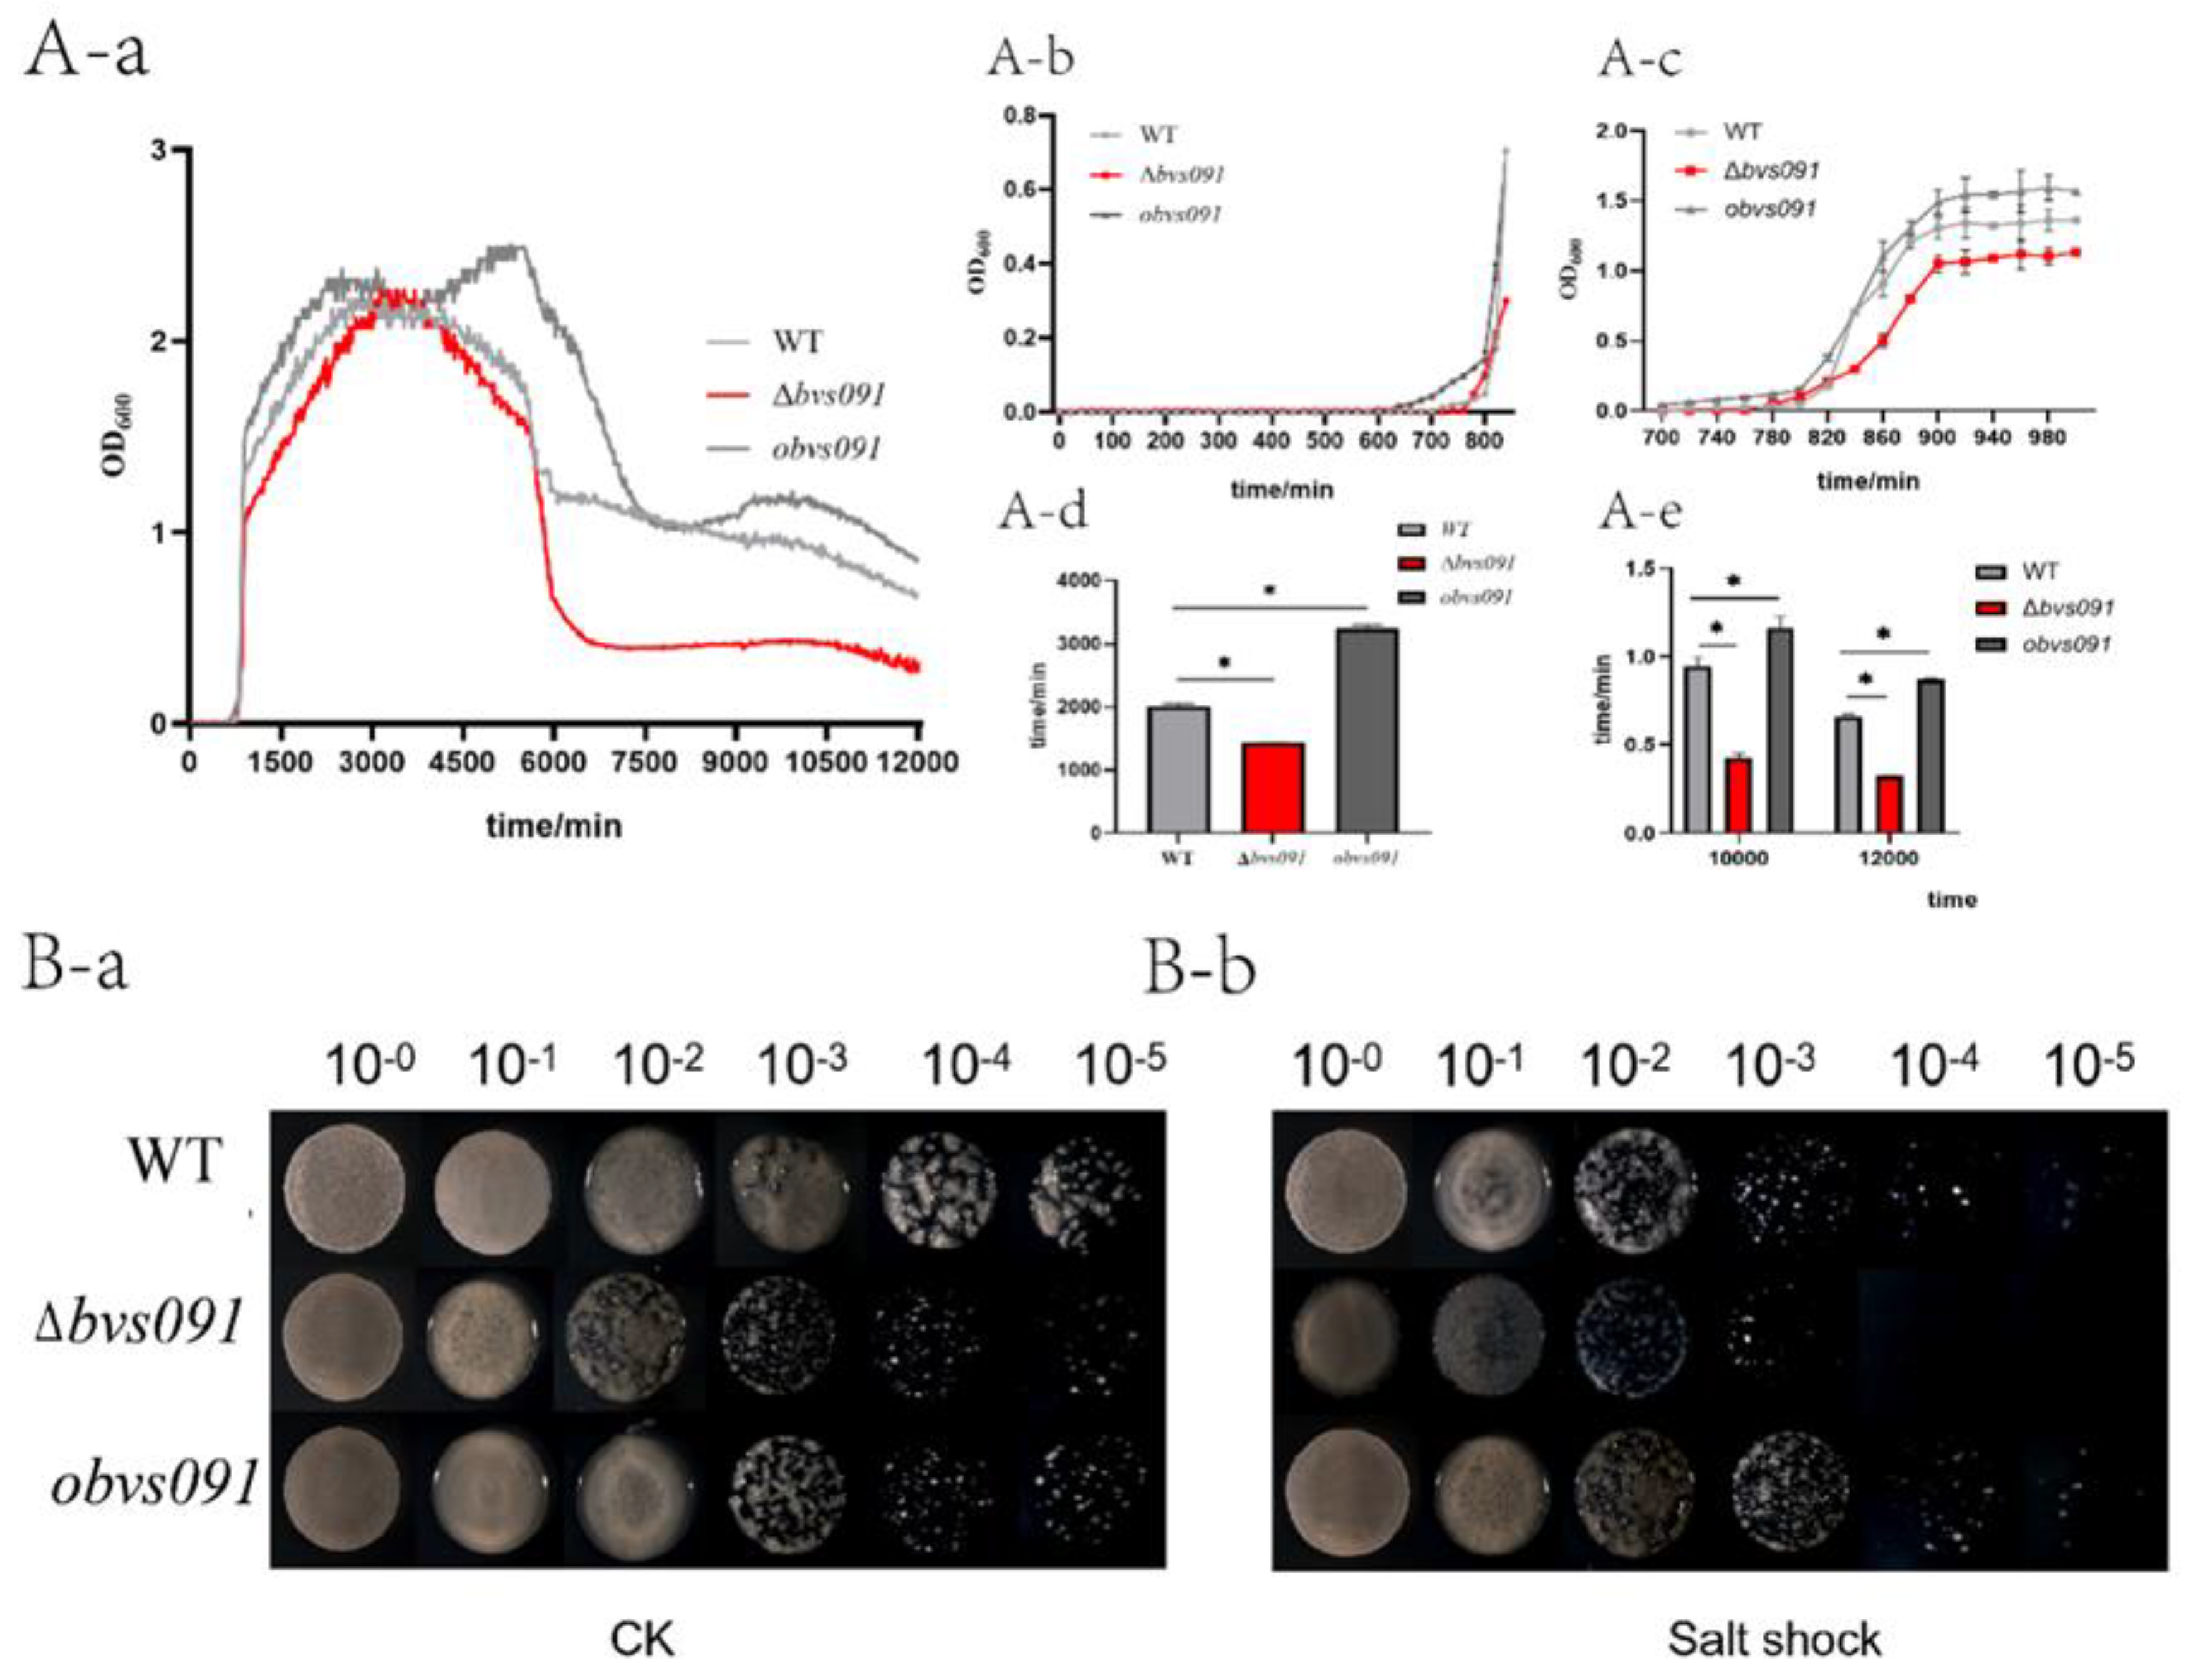
Figure 6.
Discovery of targets of Bvs091. (A) Targets of Bvs091 were predicted using IntaRNA. The dots' size represents the binding intensity based on the thermodynamic energy of hybridization, with larger circles being more intense and smaller circles being less intense; (B) The heat map of expression levels of Bvs091 candidate targets in WT, ∆bvs091, and obvs091. Shades of blue represent the relative expression level with WT, with darker colors showing higher expression and lighter colors showing lower expression; (C) Relative expression level of bvs091 in WT, ∆bvs091, and obvs091; (D) Correlation coefficient of expression level of 12 candidate targets with Bvs091 in WT, ∆bvs091, and obvs091 strains; circle size represents the absolute value of the correlation coefficient’s magnitude. (E) Binding sites of Bvs091 and galT2 mRNA predicted using IntaRNA; (F) Binding affinity of Bvs091 and target mRNA determined using Microscale Thermophoresis (MST). Kd is the binding constant of Bvs091 and its target.
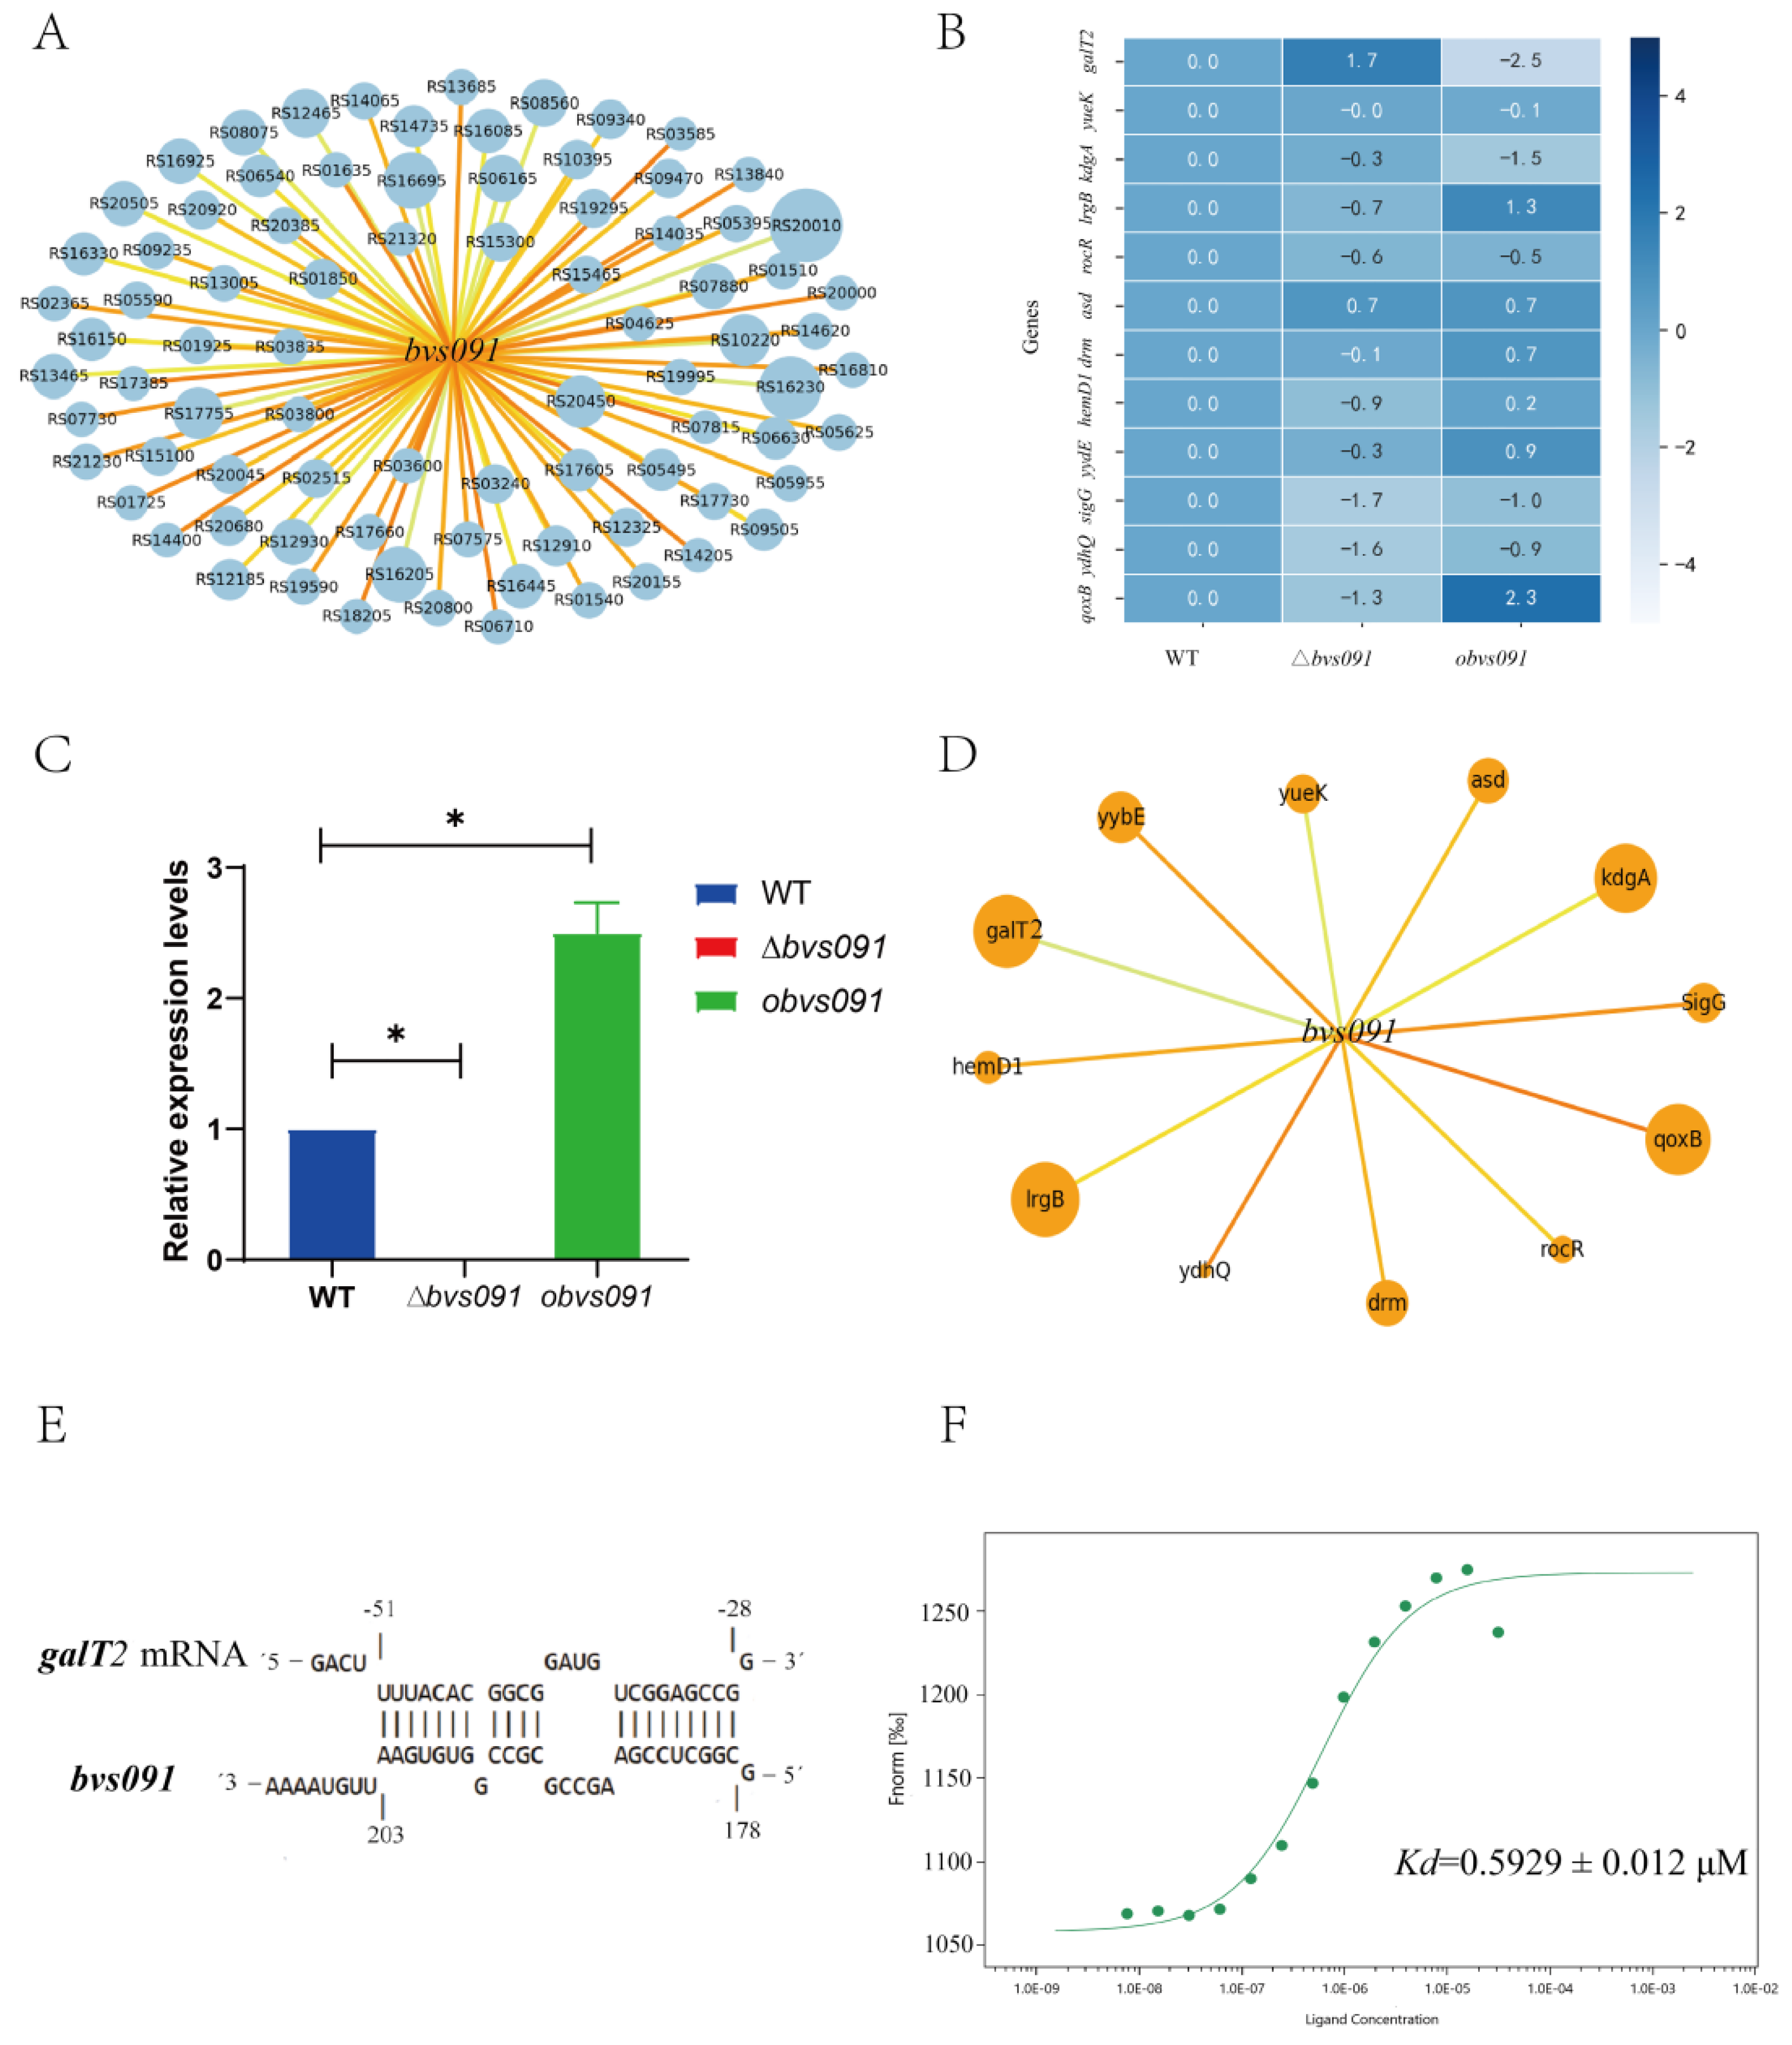
Figure 7.
Effect of sRNA Bvs091 target deletion of galT2 on salt tolerance of B. velezensis. (A) Growth curves of WT and ΔgalT2 in shake flask cultures in LB containing different concentrations of NaCl; a, b, c, growth curves in LB, 3%, 5%, and 8% NaCl LB, respectively. (B) Salt tolerance assays of WT and ΔgalT2 strains. Spotted agar plates after under 8% NaCl treatment and serial dilution; (C) Top 20 pathways significantly enriched in transcriptome differentially expressed genes. (D) Galactose metabolic pathway differentially expressed genes.
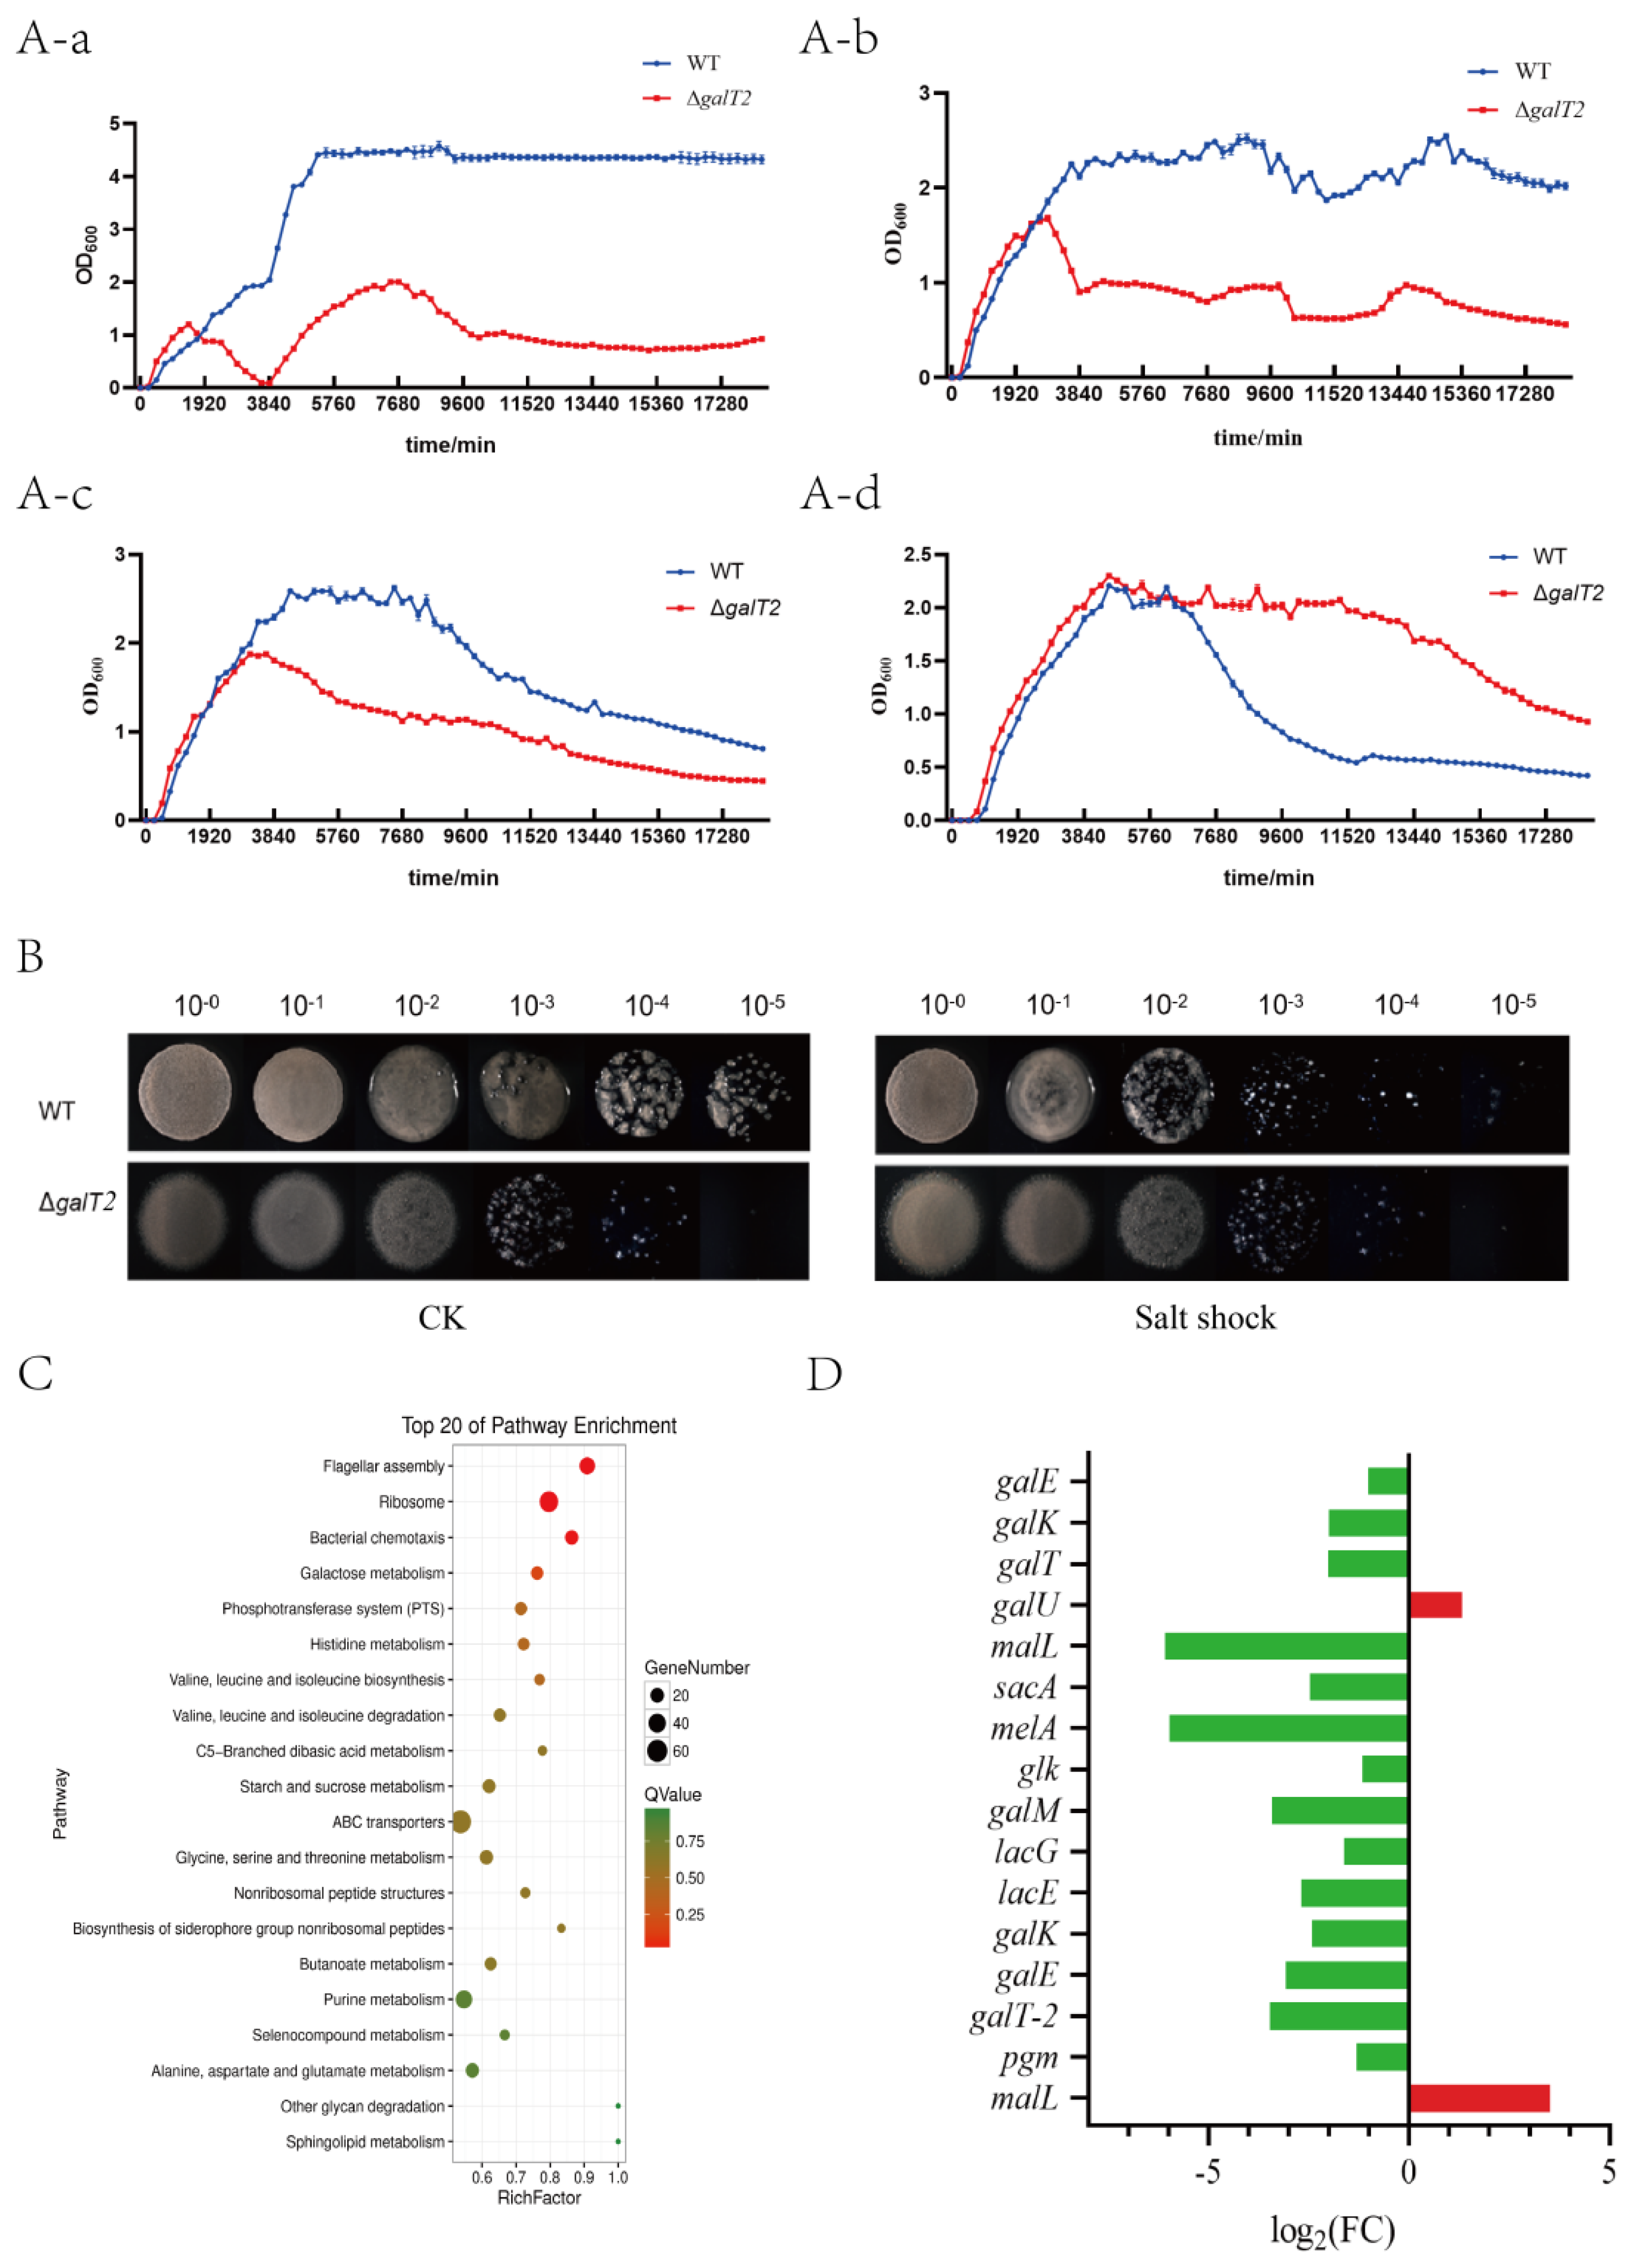
Figure 8.
Determination of galT2 mRNA half-life for WT, ∆bvs091, and obvs091.
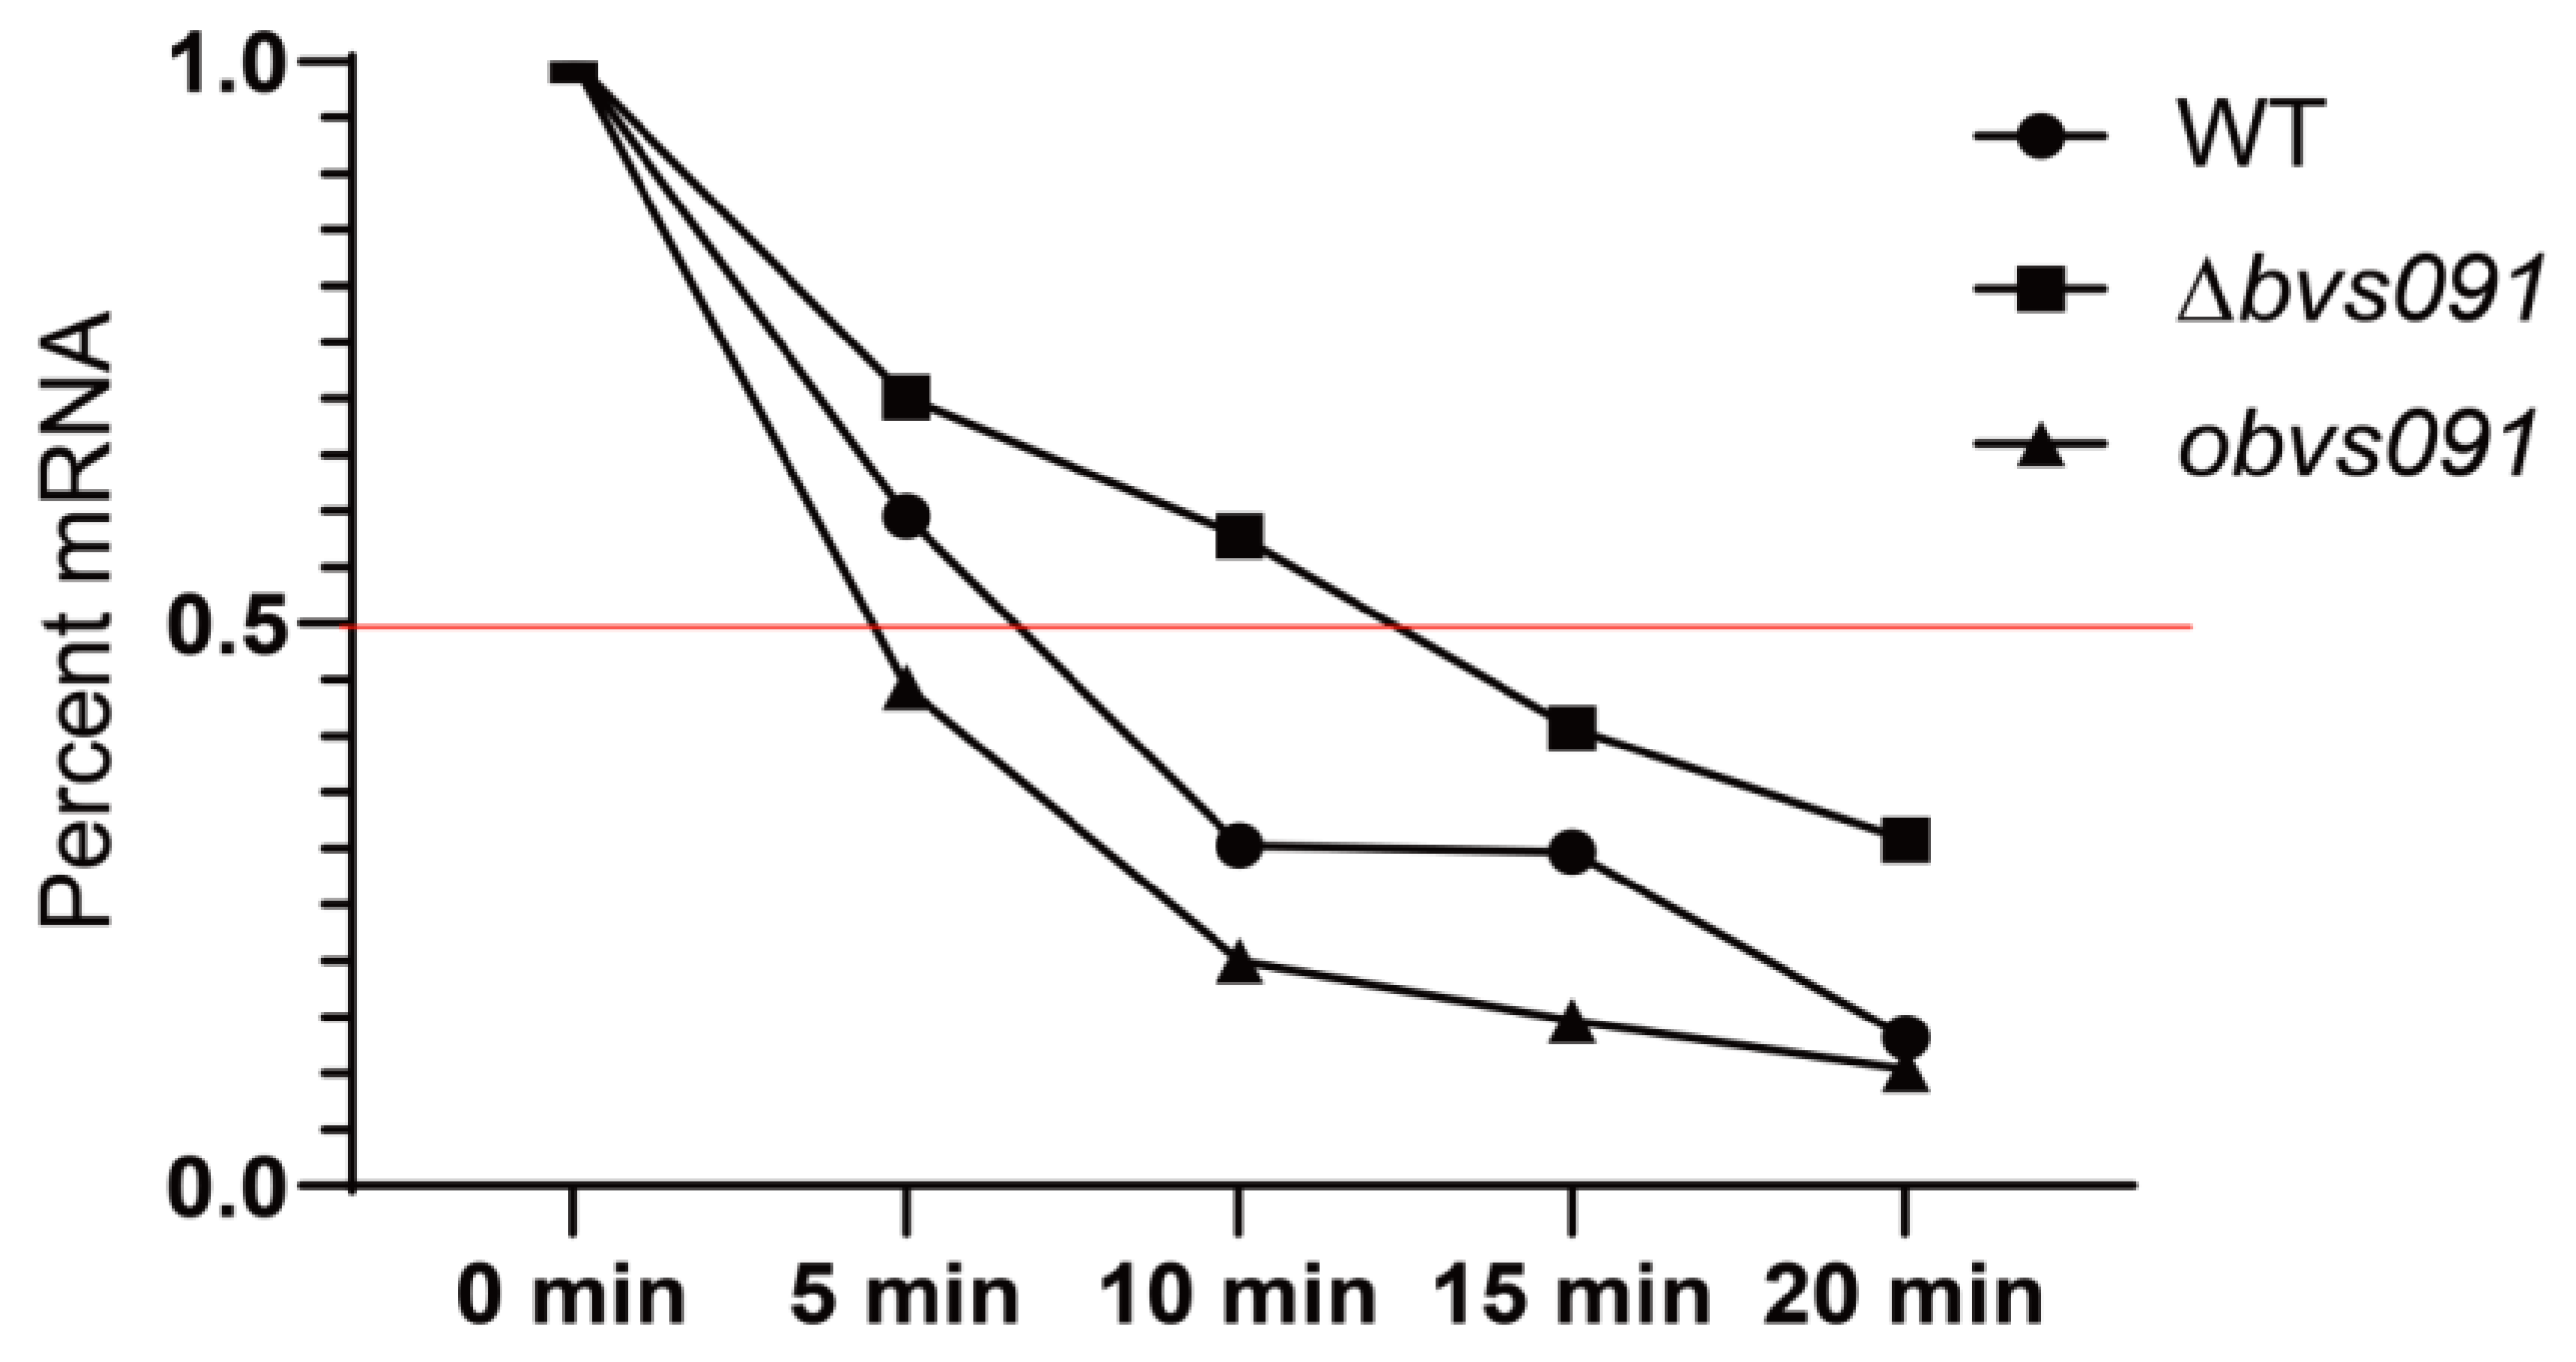
Figure 9.
Increased expression of bvs091 GalT2 deletion. (A) ∆bvs091-∆amyE-galT2-sfGFP and obvs091-∆amyE-galT2-sfGFP liquid shake unit OD fluorescence (GFP) intensity; (B) ImageJ identification of total fluorescence intensity of solid culture colonies; (C) obvs091-∆amyE-galT2-sfGFP is the galT2+sfGFP gene fragment replacing the amyE gene in the obvs091. ∆bvs091-∆amyE-galT2-sfGFP is the galT2+sfGFP gene fragment replacing the amyE gene in the ∆bvs091.
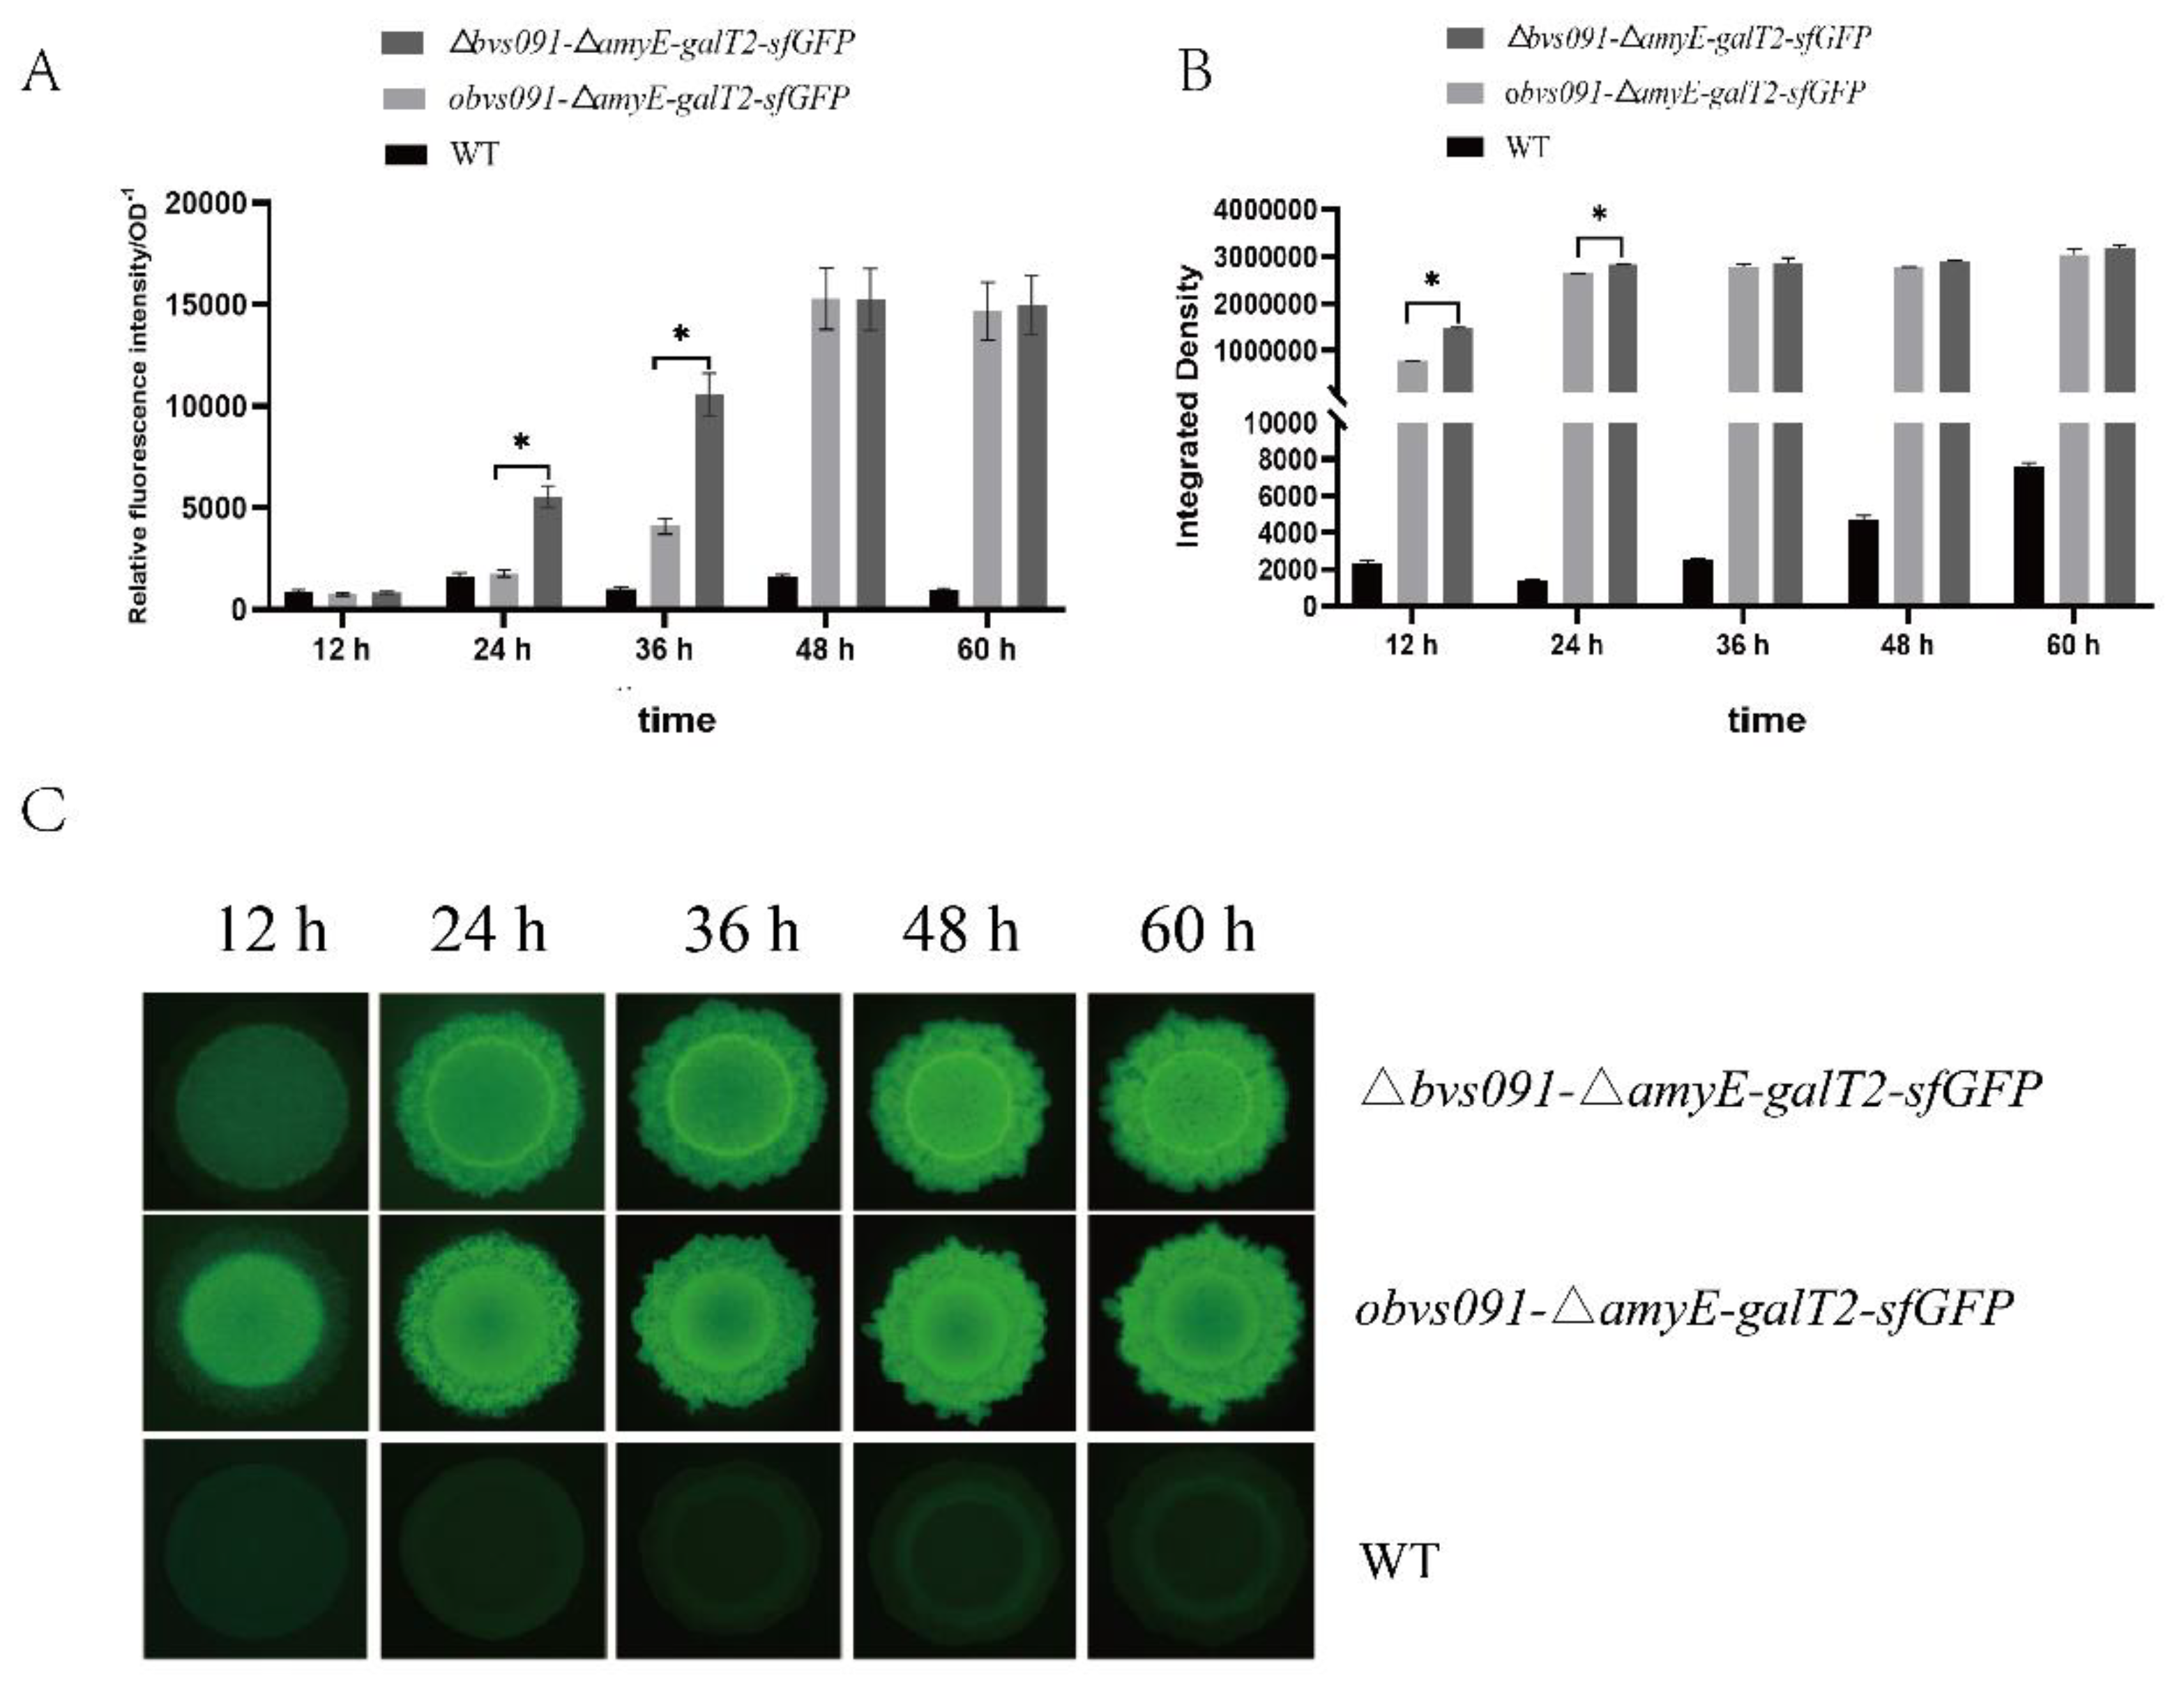
Figure 10.
Identification of binding sites for bvs091 and galT2 mRNA. (A) Binding sites of Bvs091 and galT2 mRNA. The red bases are the promoter -35 region and the extended -10 region obtained using BPROM prediction. (B) MST validation of the binding sites of Bvs091 and galT2 mRNA. Green curves are fitted curves, paired bases are shown in red, mutations to identical bases are shown in green, and compensatory mutations to complementary bases are shown in blue. Kd values reflect the binding affinity between the two molecules; wt indicates wild type; mut mutation of matched loci to mismatched loci; and com indicates mismatched loci mutated to a match.
Disclaimer/Publisher’s Note: The statements, opinions and data contained in all publications are solely those of the individual author(s) and contributor(s) and not of MDPI and/or the editor(s). MDPI and/or the editor(s) disclaim responsibility for any injury to people or property resulting from any ideas, methods, instructions or products referred to in the content. |
© 2023 by the authors. Licensee MDPI, Basel, Switzerland. This article is an open access article distributed under the terms and conditions of the Creative Commons Attribution (CC BY) license (http://creativecommons.org/licenses/by/4.0/).
Copyright: This open access article is published under a Creative Commons CC BY 4.0 license, which permit the free download, distribution, and reuse, provided that the author and preprint are cited in any reuse.


