
Submitted:
07 December 2024
Posted:
09 December 2024
You are already at the latest version
Abstract
The trans-translation system, mediated by transfer-messenger RNA (tmRNA, encoded by the ssrA gene) and its partner protein SmpB, helps release ribosomes stalled on defective mRNA and targets incomplete protein products for hydrolysis. Knocking out the ssrA and smpB genes in various pathogens leads to different phenotypic changes, indicating that they have both cooperative and independent functionalities. This study aims to clarify the functional relationships between tmRNA and SmpB in Aeromonas veronii, the pathogen that cause threats in aquaculture and human health. We characterized the expression dynamics of the ssrA and smpB genes at different growth stages of the pathogen, assessed the responses of deletion strains ΔssrA and ΔsmpB to various environmental stressors and carbon source supplementations, and identified the gene regulatory networks involving both genes by integrating transcriptomic and phenotypic analyses. Our results showed that the gene ssrA maintains stable expression throughout the bacterial growth period, while smpB exhibits upregulated expression in response to nutrient deficiencies. Compared to the wild type, both ΔssrA and ΔsmpB strains exhibit attenuated resistances to most stress conditions. However, ΔssrA independently responds to starvation, while ΔsmpB specifically shows reduced resistance to higher concentration of Fe³⁺/Na⁺ ions and higher utilization of the carbon source β-methylglucoside. Transcriptomic analysis supports these phenotypic results, demonstrating that tmRNA and SmpB cooperate under nutrient-deficient conditions but operate independently in nutrient-rich environments. Phenotypic experiments confirm that SsrA and SmpB collaboratively regulate genes involved in siderophore synthesis and iron uptake systems in response to extracellular iron deficiency. The findings of the present study provide crucial insights into the functions of the trans-translation system and highlight new roles for tmRNA and SmpB beyond trans-translation.
Keywords:
tmRNA
; SmpB
; trans-translation
; transcriptomic
; stress response
; siderophore
1. Introduction
Translation is a crucial biological process of protein synthesis within organisms, tightly regulated to ensure efficiency and accuracy [1]. During translation, if a truncated mRNA is encountered, the ribosome stalls on it, depleting the available ribosome pool. Furthermore, truncated mRNA may encode abnormally toxic proteins, posing a significant threat to the organism’s survival [2]. The mRNA surveillance pathway is essential for accurate gene expression and maintaining translational homeostasis, with trans-translation serving as the primary quality control system for protein synthesis that has evolved in bacteria [3]. Transfer-messenger RNA (tmRNA), which is the core component of trans-translation system, consists of a tRNA-like domain that carries alanine and an mRNA-like domain that encodes the SsrA degradation tag and stop codon. tmRNA is delivered to the ribosome’s A site by its partner proteins SmpB and EF-Tu-GTP, enabling the stalled ribosome to switch templates and resume translation of the coding sequence within the tmRNA molecule [4].
Trans-translation is conserved across bacteria and is essential in many species [5]. Previous studies have demonstrated that the SmpB-SsrA system plays a significant biological role. For instance, the smpB mutant of Salmonella typhimurium exhibits defects in survival within macrophages, while the ssrA mutant shows reduced virulence [6,7]. In Escherichia coli, both ssrA and smpB mutants display increased sensitivity to various antibiotics, as well as to stresses such as acid, weak acid salicylic acid, high temperature, and peroxides, with smpB mutants being more susceptible than ssrA mutants [8]. Although numerous studies indicate that the phenotypes resulting from the deletions of the smpB gene and the ssrA gene are similar [9,10], the mechanisms underlying the increased vulnerability of smpB mutants under most stress conditions remain unclear.
Gene expression is influenced not only by transcription rates but also significantly by post-transcriptional regulation, where translation rates and mRNA decay play crucial roles in determining the final protein levels [11]. This suggests that the SmpB-SsrA system may be involved in the regulation of gene expression. Research has shown that ssrA plays an important role in the transcriptional regulation of Bacillus subtilis spores, as the absence of ssrA prevents the synthesis of active σk [12]. Additionally, ssrA can regulate the levels of active Lac repressor and control the cell cycle in Caulobacter crescentus by mediating the removal of the regulatory factor CtrA [13,14]. In Yersinia pseudotuberculosis, smpB-ssrA mutants exhibit severe defects in the expression and secretion of virulence effector proteins, with these defects occurring at the transcriptional level [15]. Furthermore, tmRNA has been shown to act as an antisense RNA targeting crtMN mRNA, inhibiting the synthesis of pigments in Staphylococcus aureus [16]. Studies have also found that SmpB directly or indirectly regulates the expression of at least 4% of the proteome of S. Typhimurium [17]. These findings indicate that SmpB and tmRNA may play important roles in gene regulation.
Previously, it was believed that tmRNA and SmpB could not function in the absence of each other [18]. However, in Mycobacterium tuberculosis, bacteria can survive normally when smpB is knocked out without altering ssrA [19]. Additionally, six bacterial species were found to lack only tmRNA, while sixteen species lacked only smpB, suggesting that there are more independent functions between tmRNA and SmpB than previously recognized [20]. While most studies focus on revealing the cooperative functions of the two, there has been relatively little attention paid to the pathways and activities in which they participate independently.
Aeromonas veronii is found in various aquatic environments and serves as a pathogen for aquatic animals, capable of causing diseases such as skin ulcers and systemic hemorrhagic septicemia in fish [21,22]. Additionally, it is an emerging human intestinal pathogen frequently identified in patients with inflammatory bowel disease [23]. More than 300 virulence factors have been characterized in A. veronii, with aerolysin, microbial collagenase, and various hemolysins detected in all strains isolated from patients suffering from gastrointestinal diseases [24]. Our previous research demonstrated that the knockout of ssrA and smpB reduces the virulence of A. veronii [25], while smpB influences its antibiotic resistance [26]. Furthermore, the knockout of tmRNA affects its metabolism and resistance to antibiotics that target the cell wall [27].
In this study, we characterized the expression dynamics of ssrA and smpB in A. veronii. We also investigated the changes in the responses of ssrA and smpB single knockout strains to environmental stress and their ability to utilize various carbon sources. Through transcriptomic analysis, we identified differentially expressed genes to explore the similarities and differences in the regulatory effects of SsrA and SmpB on gene expression. Our findings indicate that SsrA and SmpB collaboratively regulate the utilization of L-asparagine and D-mannitol, as well as the synthesis of iron transporters. However, they exhibit independent or opposing effects in response to starvation, low iron, high sodium stress, peptidoglycan synthesis, and bacterial chemotaxis. Furthermore, we discovered that the cooperation between SsrA and SmpB is enhanced under nutrient-deficient conditions, while SsrA and SmpB demonstrate greater independence in nutrient-rich environments. This study provides significant evidence and critical insights into the novel functions of tmRNA and SmpB in A. veronii, which are independent of trans-translation.
2. Results
2.1. tmRNA is Stable During the Bacterial Growth, Whereas Higher smpB Expression Responds to Nutrient Deficiency
Considering that both tmRNA and SmpB are core functional components of trans-translation system, we examined the expression dynamics of ssrA and smpB genes in the wild type A. veronii under nutrient-rich LB and nutrient-deficient M9 culture conditions at different stages of bacterial growth. The results indicate that under nutrient-rich LB conditions, the expression of the ssrA gene remains stable during both the exponential and stationary phases, showing no significant differences during different growth phases (Figure 1A). In contrast, the expression of the smpB gene significantly decreases during the transition from the logarithmic to the stationary phase, with expression levels in the stationary phase (22h) being approximately 30% of those in the exponential phase (7h) (Figure 1B). Under nutrient-deficient M9 conditions, the expression of the ssrA gene also remains stable during both the exponential and stationary phases, with no significant differences observed (Figure 1C). Conversely, the expression of the smpB gene significantly increases during the transition from the logarithmic to the stationary phase, reaching about seven times the expression level observed in the exponential phase (9h) as compared with that in the stationary phase (22h) (Figure 1D). Taken together, during the transition from the exponential to the stationary phase, the expression of tmRNA remains stable while smpB expression is influenced by nutrient availability. Specifically, the nutrient-rich condition induces a significant lower smpB expression in the stationary phase, whereas the nutrient-deficient condition stimulates a significant increase in the smpB expression in the stationary phase. This may be due to fewer mRNA translation errors in nutrient-rich environments, leading to reduced expression of the trans-translation system, while nutrient deficiency increases error rates and elevates its expression. This suggests that pathogenic bacteria may regulate the activity and function of the trans-translation system in response to environments primarily by adjusting smpB expression.
2.2. tmRNA and SmpB Collaborate or Independently Participate in Specific Types of Stress Responses
If tmRNA and SmpB take actions in an independent way in the environmental adaptation of pathogenic bacteria, the ΔssrA and ΔsmpB strains, which are individually deficient in these components, should exhibit distinct phenotypes under the same stress conditions. Therefore, we comprehensively assessed the growth status of the wild type, ΔssrA, and ΔsmpB strains under various environmental stress treatments, including iron deficiency, hypoxia, high salinity, and varying pH levels, to explore potential regulatory pathways in which both components may be involved.
When bacteria were cultured in PBS under starvation conditions for different durations, the growth of the ΔtmRNA and ΔsmpB strains demonstrated no significant differences from the wild type strain after 24 hours of starvation. However, after 72 hours of starvation, the ΔsmpB strain exhibited growth comparable to that of the wild type, while the ΔtmRNA strain displayed a significant decline in growth capacity (Figure 2B). This suggests that tmRNA may independently regulate the starvation tolerance of the strain. A similar phenomenon has been observed in Escherichia coli previously [8]. When the environmental concentration of iron ion is reduced by 2,2’-bipyridine chelators, the growth of the ΔtmRNA and ΔsmpB strains shows no significant differences from the wild type strain at low concentrations. However, at 100 μM 2,2’-bipyridine, both knockout strains exhibit a significant decrease in tolerance, with the ΔsmpB strain showing a more pronounced decline at 200 μM (Figure 2C). Similarly, treatment with 1 mM EDTA reduces tolerance in both strains compared to the wild type, with the ΔsmpB strain demonstrating a more significant reduction (Figure S1A), indicating that the absence of smpB specifically impairs the pathogen’s iron acquisition capability. Under salt stresses with varying NaCl concentrations, the ΔtmRNA and ΔsmpB strains show no significant differences from the wild type under lower salt conditions. However, at 0.5 M NaCl, the ΔsmpB strain exhibits a significant decrease in tolerance, while the ΔtmRNA strain’s tolerance is nearly identical to that of the wild type. The growth curve analysis is consistent with the results of plate assay (Figure 2D).
Treatment with bile salts, nitrate, and the metal oxidant CuCl₂ did not result in significant differences in growth ability between the ΔtmRNA and ΔsmpB strains compared to the wild type strain (Figure S1B-D). Moreover, treatments with 1% butanol and 3% ethanol weakened the growth of both the ΔtmRNA and ΔsmpB strains relative to the wild type, with their growth abilities being comparable. This indicates that tmRNA and SmpB do not participate in the stress responses to bile salts, nitrate, and metal oxidants, but they do collaborate in response to alcohol stress. The bacterial growth status under different pH conditions shows that both the ΔtmRNA and ΔsmpB strains exhibit reduced growth compared to the wild type under alkaline conditions, with their growth abilities being similar. However, under neutral and acidic conditions, there are no significant differences in tolerance between the ΔtmRNA and ΔsmpB strains and the wild type strain.
Based on these results, it is evident that the individual knockout of the ssrA or smpB gene significantly reduces the tolerance of A. veronii under conditions of low iron, high salinity, starvation, alcohol stress, and alkalinity. The smpB gene plays a crucial role when the bacteria face iron deficiency and high osmotic pressure stress, while the ssrA gene independently regulates the growth capacity of the pathogen under starvation conditions.
2.3. tmRNA and SmpB Collaborate or Independently Participate in the Utilizations of Different Types of Carbon Sources
Previous studies have demonstrated that the SsrA-SmpB system is involved in purine and amino acid metabolism [28,29]. Our earlier research also indicated that the knockout of the ssrA gene affects the accumulation of specific metabolites in A. veronii [27]. To further investigate the role of trans-translation in nutrient utilization, we employed the BIOLOG ECO microplate assay to assess the growth capabilities of the wild type, ΔtmRNA, and ΔsmpB strains of A. veronii on 31 different sole carbon sources. The results showed that the individual knockout of either the ssrA or smpB gene significantly impacted the pathogen’s ability to utilize carbon sources β-Methyl D-Glucoside, L-Asparagine, Tween 40, and D-Mannitol compared to the wild type strain (Figure 3). After 24 hours of cultivation, the OD590 values of the ΔtmRNA and ΔsmpB strains grown on D-Mannitol as the sole carbon source were half that of the wild type. However, by 48 hours, the growth levels of all three strains reached parity, indicating that the individual knockouts of the ssrA or smpB genes reduced the utilization rate of D-Mannitol by A. veronii (Figure 3C). After 48 hours, the OD590 values for the ΔtmRNA and ΔsmpB strains grown on L-Asparagine as the sole carbon source were only 17% and 27% of the wild type, respectively; however, this difference diminished over time, suggesting that the individual knockouts also slowed the utilization rate of L-Asparagine (Figure 3A). Additionally, the OD590 values for the ΔtmRNA and ΔsmpB strains on Tween 40 as the carbon source were 1.2 times that of the wild type, and this growth advantage persisted for up to 72 hours (Figure 3D) or longer (data not shown), indicating that the individual knockouts of the ssrA or smpB genes consistently enhanced the utilization of Tween 40 by A. veronii.
These results suggest that the ssrA and smpB genes work together in the carbon metabolism of A. veronii for D-Mannitol, L-Asparagine, and Tween 40. Surprisingly, the OD value for the ΔsmpB strain grown on β-Methyl D-Glucoside was 1.3 times that of the wild type, while the growth of the ΔtmRNA strain on the same carbon source showed no significant difference from the wild type (Figure 3B). This finding suggests that SmpB may independently regulate the metabolic activity of A. veronii towards β-Methyl D-Glucoside.
2.4. tmRNA and SmpB Respond to Different Nutritional Conditions and Regulate the Expressions of Specific Genes
Our findings indicate that tmRNA and SmpB exhibit collaboration and functional specialization in pathogenic bacteria’s responses to environmental stress and carbon source utilization. To further investigate the mechanisms underlying the consistent or independent phenotypic differences observed in the ΔssrA and ΔsmpB strains, we performed RNA sequencing on stationary-phase bacteria cultured under nutrient-deficient M9 and nutrient-rich LB conditions. This approach enabled us to screen and analyze the differential gene expression profiles of the ΔssrA and ΔsmpB strains compared to the wild type.
Under M9 culture conditions, the ΔssrA and ΔsmpB strains exhibited 434 (279 upregulated, 155 downregulated) and 338 (199 upregulated, 139 downregulated) differentially expressed genes (DEGs) compared to the wild type, respectively (Figure 4A). Under LB conditions, these numbers were 218 (187 upregulated, 31 downregulated) and 87 (35 upregulated, 52 downregulated) (Figure 4B). The total number of DEGs was significantly higher under M9, indicating greater reliance on tmRNA and SmpB in nutrient-deficient conditions (Figure 4A and Figure 4B). Venn diagram analysis showed that 121 genes were co-regulated by ΔsmpB and ΔssrA under M9 (Figure 4D), while only 13 were co-regulated under LB (Figure 4C). These results suggest that SmpB and tmRNA cooperate more tightly under nutrient-deficient conditions (Figure 4A and Figure 4B). The ΔsmpB strain had 338 and 87 DEGs under M9 and LB conditions, respectively, with more pronounced changes in M9. This correlates with the decreased expression of the smpB gene in LB and increased expression in M9 (Figure 1D), indicating that SmpB is primarily activated under nutrient-deficient conditions to stimulate trans-translation system and thus regulate downstream genes. We hypothesize that bacteria activate the trans-translation system under nutrient deficiency by regulating smpB expression, with tmRNA and SmpB cooperating in this function.
In addition, we also noticed that under both nutrient-deficient and nutrient-rich conditions, the ΔssrA strain exhibited significantly more DEGs compared to the wild type than the ΔsmpB strain (Figure 4A and Figure 4B). This tendency was significant in the number of upregulated genes, indicating that tmRNA may also play an important role in gene expression regulation alongside its collaboration with SmpB in trans-translation. KEGG pathway enrichment analysis revealed that, under LB conditions, the differentially expressed genes in the ΔssrA strain were mainly enriched in ribosome biogenesis, microbial metabolism in diverse environments, and the tricarboxylic acid (TCA) cycle (Figure 5A). Under M9 conditions, enrichment was observed in oxidative phosphorylation, amino acid biosynthesis, and the TCA cycle (Figure 5C), suggesting increased demands for protein synthesis due to slow ribosome recycling from trans-translation defects, similar to changes seen in Bacillus subtilis lacking ssrA [28]. In contrast, the ΔsmpB strain showed that, under both LB (Figure 5B) and M9 (Figure 5D) conditions, DEGs were primarily enriched in two-component systems and chemotaxis pathways, with additional enrichment in sulfur metabolism, biosynthesis of siderophore groups and non-ribosomal peptides under M9 conditions. We also illustrated the models for the changes of the cellular processes in ΔssrA and ΔsmpB based on the highly enriched pathways under M9 culture conditions (Figure. 6A and Figure. 6B). These findings indicate that deletions of ssrA and smpB result in distinct gene changes, highlighting their different roles in gene regulation, influenced by nutrient availability.
2.5. Cooperation of tmRNA and SmpB in Maintaining Iron Utilization in Pathogenic Bacteria
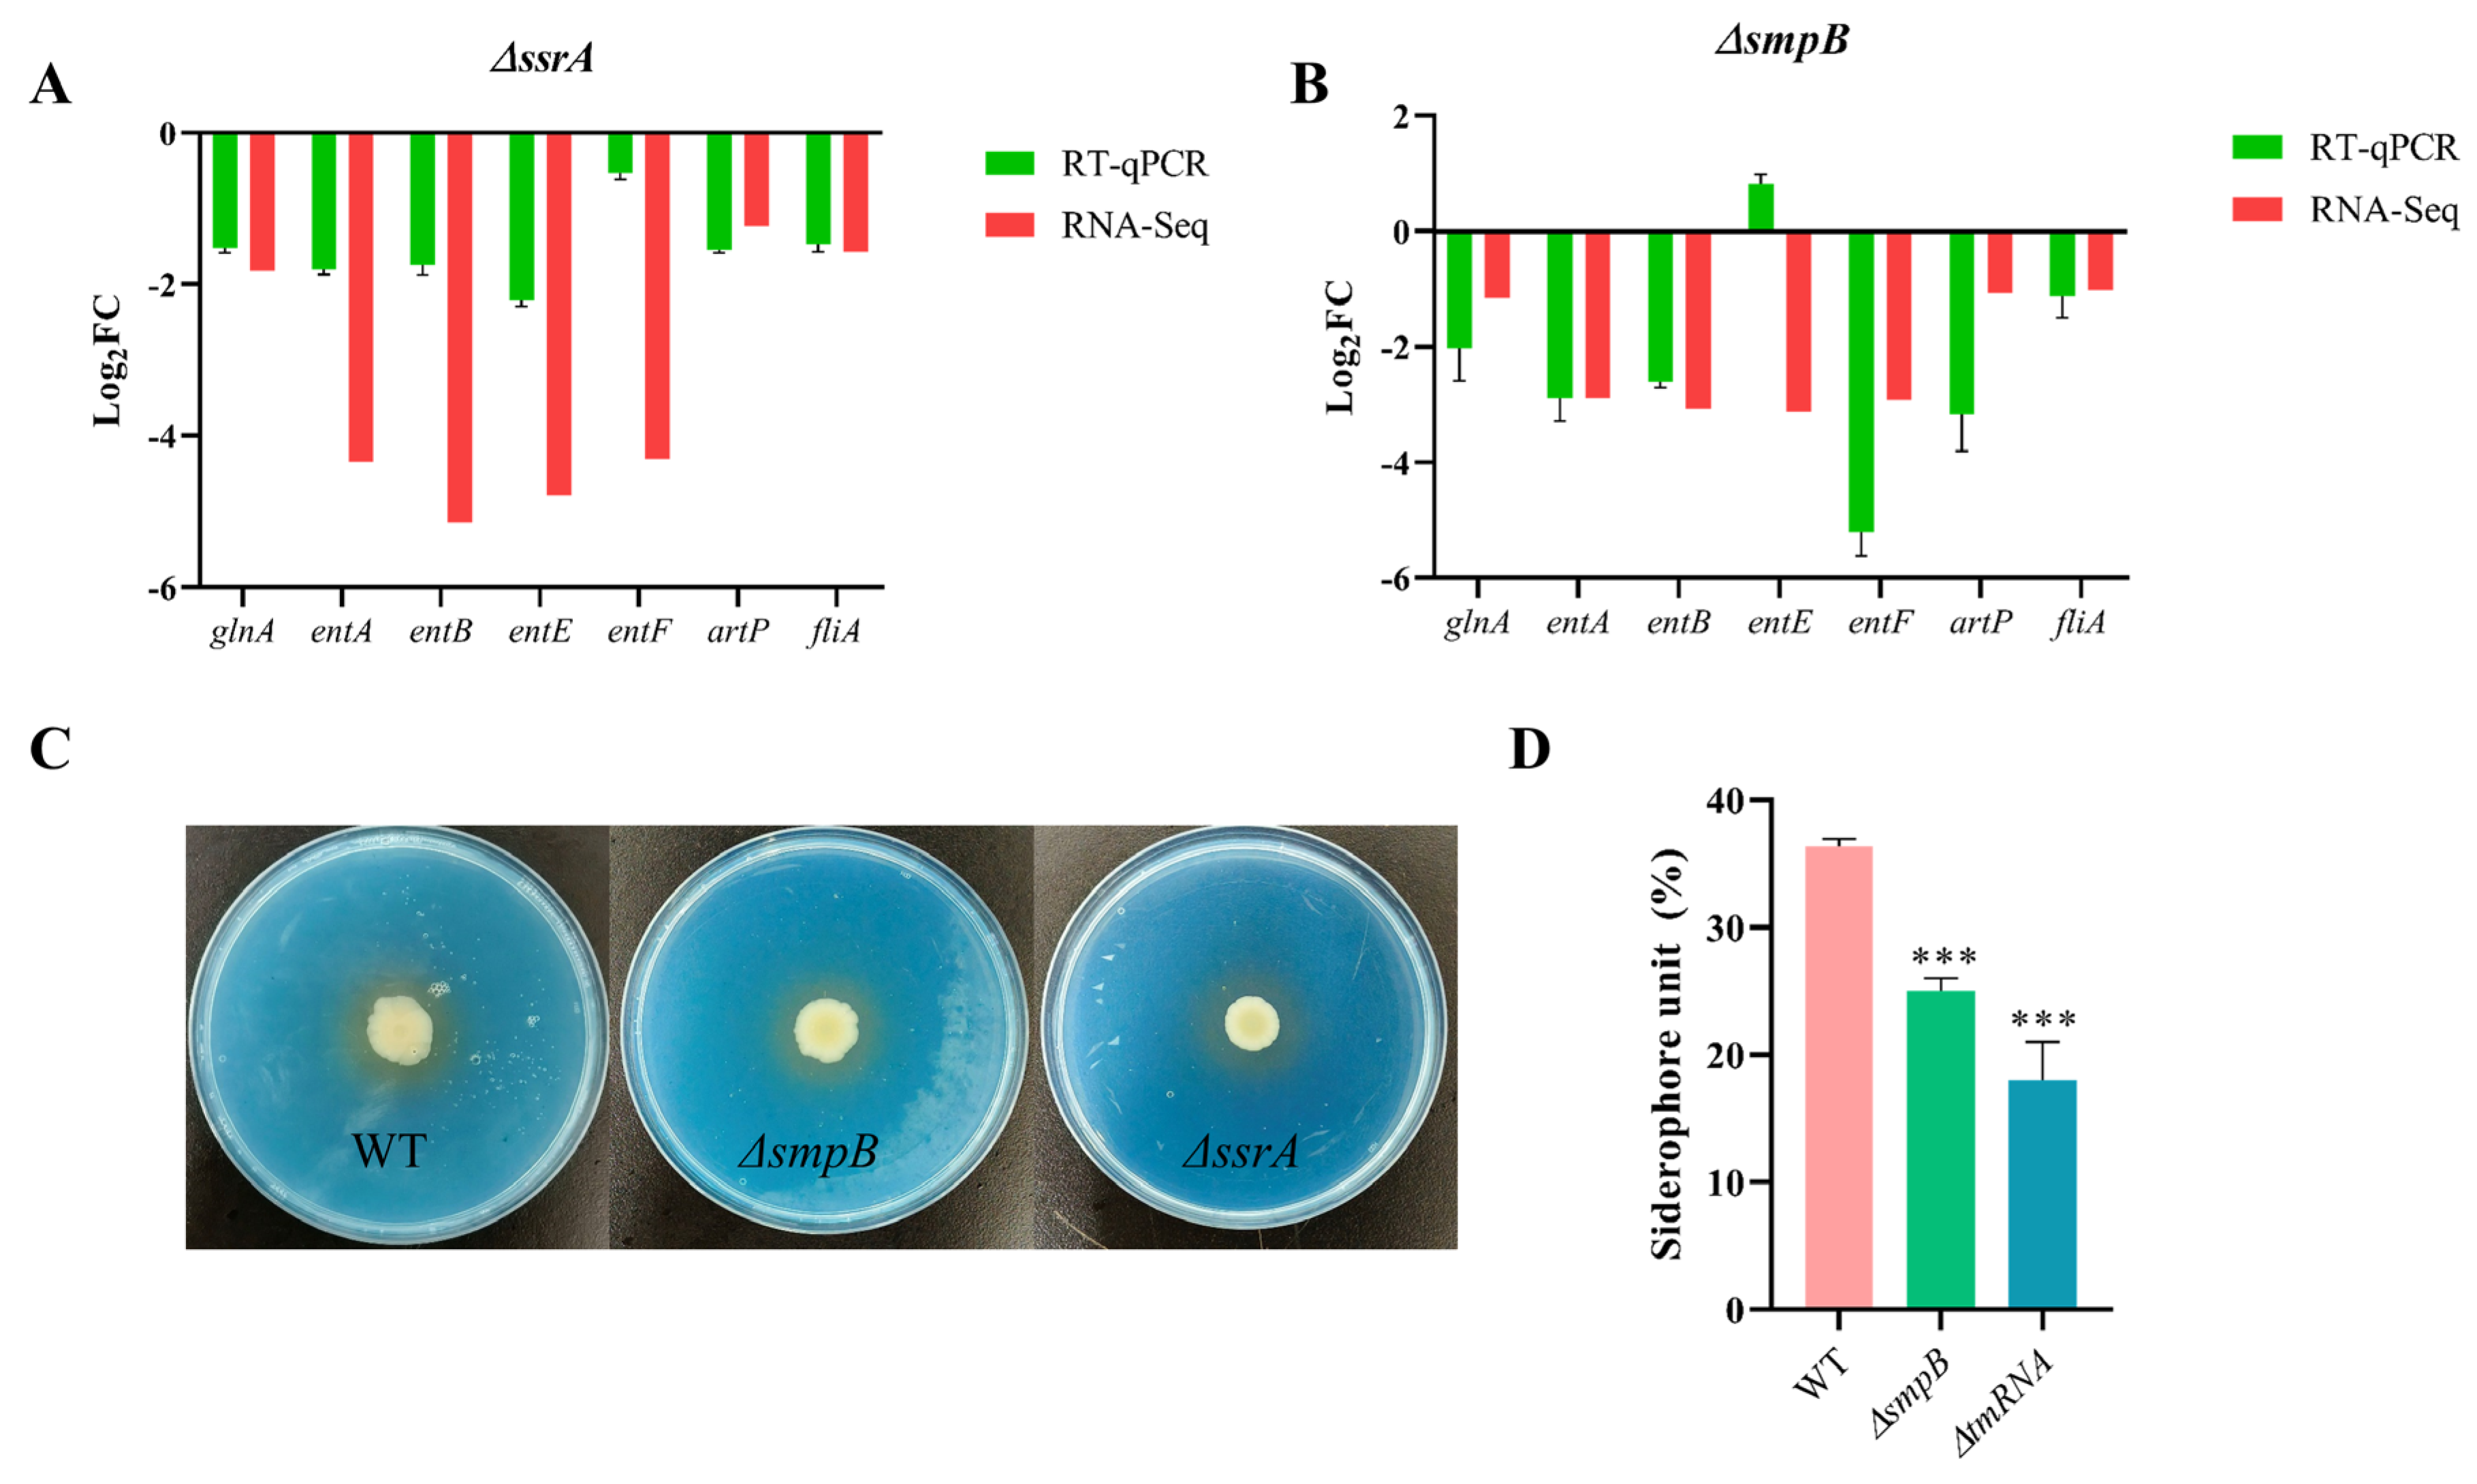
KEGG pathway enrichment analysis revealed that the deletion of both smpB and ssrA significantly reduced the expression of genes associated with siderophore and non-ribosomal peptide biosynthesis pathway under M9 condition (Figure 5C and Figure 5D). Additionally, we also observed that smpB and ssrA jointly regulate the expression of genes related to the ferric hydroxamate uptake (Fhu) system, specifically fhuB, fhuC, and fhuD, as well as the gene for the transmembrane transport protein tonB (Figure. 6A and Figure. 6B). During the inflammation, the host secretes antimicrobial proteins to sequester iron, zinc, and manganese ions, thereby limiting microbial growth. In response, pathogenic bacteria develop iron transporters and related systems to overcome iron availability challenges [30]. We first validated the expression levels of genes involved in iron transporter synthesis, including glnA, entA, entB, entE, and entF, in ΔssrA and ΔsmpB strains using RT-qPCR. The results showed a significant decrease in expression, consistent with transcriptomic sequencing data (Figure 7A and Figure 7B). Further assessment of siderophore synthesis capabilities was conducted using CAS agar plates, where the wild type produced a deeper yellow chelation zone compared to ΔssrA and ΔsmpB (Figure 7C). Quantitative analysis of the CAS detection liquid also indicated a significant reduction in iron transporter production in ΔssrA and ΔsmpB compared to the wild type (Figure 7D). These findings elucidate the cooperation of tmRNA and SmpB in the regulation of siderophore synthesis and indicate the potential molecular mechanism underlying the significant growth retardation observed in ΔssrA and ΔsmpB under treatment with 200 μM 2,2’-bipyridine (Figure 2C).
3. Discussion
mRNA synthesis can be interrupted by various events, including premature transcription termination, nuclease activity, and physical damage. When the ribosome reaches the 3’ end of a truncated mRNA, it becomes trapped in an incomplete translation complex [31]. The tmRNA-SmpB system specifically recognizes these stalled translation complexes and releases the blocked ribosomes, which is crucial for maintaining the cell’s protein synthesis capacity. Under adverse growth conditions, the RNase toxin components of toxin-antitoxin systems, such as RelE and MazF, can cleave most intracellular mRNA, resulting in the production of a large amount of truncated mRNA, which allows cells to conserve resources during periods of severe stress [32]. Under optimal growth conditions, these toxins are activated only in a small fraction of cells [33]. E. coli mutants lacking trans-translation activity show defects in recovering from toxin-induced stasis, indicating that trans-translation is important for resuming growth after prolonged severe nutritional stress [34]. The findings of this study further elucidate the molecular mechanisms by which the trans-translation system responds to severe nutritional stress. First, our detection of the expression levels of ssrA and smpB genes indicates that the trans-translation system is activated under nutrient-deficient conditions through the responsive expression of smpB. This also helps explain why strains with a single knockout of smpB are more vulnerable under the same nutritional stress conditions compared to strains with a single knockout of ssrA. Second, our transcriptomic analysis reveals that the total number of differentially expressed genes and co-regulated genes in the ΔssrA and ΔsmpB strains under M9 conditions is higher than these under LB conditions. The increase in co-regulated genes under nutrient-poor conditions can be considered evidence of the enhanced cooperation between tmRNA and SmpB, highlighting the importance of the trans-translation system in nutrient deficiency. In addition, we also found that tmRNA is stably expressed throughout the growth cycle of A. veronii, which is consistent with reports of stable tmRNA expression in Staphylococcus aureus, where tmRNA has been used as a reference gene [35].
The results of this study indicate that tmRNA and SmpB collaborate and specialize in the response of pathogenic bacteria to stress and in carbon source utilization, with transcriptomic analysis providing a series of molecular insights into these phenotypic observations. Here, we further validated the impact of tmRNA and SmpB on the iron uptake capability of A. veronii. Both RT-qPCR and phenotypic experiments demonstrated the positive role of tmRNA and SmpB in the synthesis of siderophore. Additionally, when pathogenic bacteria are exposed to osmotic pressure from the environment, peptidoglycan plays a crucial role in protecting the bacteria from external and cytoplasmic stress while maintaining their cellular morphology [36]. Bacteria sense physical stimuli related to changes in external osmotic pressure and promptly regulate genes to sustain cellular viability [37]. Transmembrane signal transduction primarily relies on two-component systems (TCS) and membrane-bound chemical receptors, such as components of chemotaxis systems [38]. KEGG pathway enrichment analysis revealed that the deletion of smpB led to a significant downregulation of genes associated with the peptidoglycan synthesis pathway and chemotaxis systems, while the deletion of ssrA had the opposite effect on the same set of genes. This initially explains the significant growth inhibition observed in the ΔsmpB strain under 0.5 M NaCl stress conditions, while the growth of the ΔssrA strain was even slightly higher than that of the wild type (Figure 2D). Furthermore, we found that the deletion of ssrA led to a significant reduction in the expression of arginine transporter-related genes artM, artQ, and artP, while the deletion of smpB resulted in a notable decrease in the expression of artP. Although bacteria can synthesize L-arginine on their own, it is energetically more advantageous to uptake L-arginine from the environment at the expense of ATP [39]. The changes in arginine transporter-related genes in the ΔssrA and ΔsmpB strains explain the slower growth of these strains compared to the wild type when L-arginine is the sole carbon source (Figure 4C).
The trans-translation system is commonly understood to regulate gene expression by using the peptide tag encoded by tmRNA to facilitate the rapid degradation of rescue proteins. For example, in C. crescentus, tmRNA targets multiple proteins involved in DNA replication, recombination, and repair, with tmRNA deletion causing delays in DNA replication initiation [40]. In our previous study, GlnA was identified as a substrate of tmRNA [41], and here we found that glnA is significantly downregulated in the ΔssrA and ΔsmpB strains. Additionally, we observed a significant downregulation of tonB, a gene encoding a transmembrane iron transporter, in both strains. Twelve TonB-dependent receptors in C. crescentus have been identified as tmRNA substrates [40]. This raises the question of how tmRNA’s tagging activity primarily affects protein levels while also influencing transcription levels. One possible explanation is that tmRNA tags certain transcription factors, such as σk[12], thereby regulating downstream expression. Alternatively, tmRNA may directly bind to target mRNAs as sRNA. Future studies should explore tmRNA’s regulatory mechanisms on specific genes from these two perspectives.
The collaboration and functional roles of tmRNA and SmpB have been extensively studied, but research on their independent pathways and activities is limited [20]. Our transcriptomic results indicate that the KEGG pathways involving tmRNA and SmpB are inconsistent, with only 13 co-regulated genes (4.4% of the total DEGs) under LB conditions, providing direct evidence for their independent functions. In this study, we found that tmRNA and SmpB regulate peptidoglycan synthesis and bacterial chemotaxis gene expression with opposing activities. Previous research showed that tmRNA deletion increases GlcNAc content in the cell wall and upregulates peptidoglycan biosynthesis genes, enhancing resistance to osmotic stress [27]. Conversely, the deletion of smpB increases sensitivity to high sodium osmotic pressure. These phenotypic results align with transcriptomic changes, indicating a functional division between tmRNA and SmpB in cell wall synthesis and osmotic stress response. Flagellum synthesis is energy-intensive and fundamental to bacterial chemotaxis [42]. We observed significant downregulation of flagellar genes in the ΔssrA strain, likely due to reduced protein synthesis and energy utilization, consistent with findings in B. subtilis [28] and Y. pseudotuberculosis [15]. However, the upregulation of multiple chemotaxis genes in the ΔssrA strain contradicts observations in B. subtilis [28] and is inconsistent with the downregulation of flagellar genes in A. veronii. Given the unclear distribution, function, and regulatory relationships between chemotaxis gene clusters and flagellar synthesis genes in A. veronii, tmRNA may serve as a key clue for elucidating the regulatory mechanisms of chemotactic activity in this organism.
4. Materials and Methods
4.1. Strains and Media
Aeromonas veronii C4 and its derivatives were cultivated in Luria-Bertani (LB) medium or M9 medium with shaking at 30°C. 50 μg/mL ampicillin (Amp) was supplemented for regular cultivation of A. veronii strains. CAS medium was used to measure siderophore production [43]. Each 1 L of CAS medium contains 20% sucrose 10 mL, 10% acid hydrolyzed casein 30 mL, 1 mmol/L CaCl2 1 mL, 1 mmol/L MgSO4 20 mL, Agar 15 g, and phosphate buffer 50 mL. CAS detection staining solution were slowly added at 60℃.
4.2. Quantitative Real-Time PCR (RT-qPCR) Analysis
Total RNA was extracted from the specified cultures using the Bacterial Total RNA Isolation kit (Shengong, Shanghai, China), and genomic DNA remnants were eliminated with gDNA Wiper Mix (Vazyme, Nanjing, China). After assessing the concentration and purity of the RNA, 1 μg of RNA was used as a template for cDNA synthesis with HiScript II QRT SuperMix (Vazyme, Nanjing, China). The resulting cDNA was then diluted for RT-qPCR reactions conducted on an ABI Prism® 7300 instrument (ABI, New York, NY, USA), with fluorescence detection performed using ChamQ SYBR Color qPCR Master Mix (Vazyme, Nanjing, China). The gapdH gene served as a reference for data normalization and all the primers were designed using Primer Premier 6 software (Table S1). Relative expression levels were quantified using the 2−ΔΔCT method [44].
4.3. Phenotypic Determination Under Stress Conditions
For the measurement of growth curves, the overnight cultures were collected at an OD600 of 1, diluted 1:100 into LB medium, and cultivated on a 96-well microplate at 30℃. Optical densities of the cultures were recorded using a microplate reader (Synergy H1, BioTeK) at 600 nm at 1-hr intervals until 24 h. For the starvation test, stationary phase cultures grown in LB were washed three times with phosphate buffer solution. The culture was diluted to the same OD600 in a phosphate buffer and incubated without shaking at 30°C for different time points. A ten-fold serial dilution of the bacterial suspension was prepared, and 3 μL of each dilution was spotted onto LB agar plates. For low iron and high sodium salt stress, the culture was washed 3 times with PBS, then diluted to the same OD600 value. A ten-fold serial dilution of the bacterial suspension was prepared, and 3 μL of each dilution was spotted onto LB agar plates supplemented with different concentrations of 2’2 bipyridine or sodium chloride. For the growth curves measured under other stress conditions mentioned in this paper, the wild type and its derived strains were transferred to LB medium supplemented with corresponding compounds with the same OD value. For the determination of growth curves at different pH conditions, LB medium is adjusted with hydrochloric acid or sodium hydroxide to the specified pH value, filtered, and then inoculated with bacteria.
4.4. Carbon Source Utilization Capacity Testing
BIOLOG ECO microplate method was used to analyze the carbon source metabolic function of A. veronii. Overnight cultures were diluted with sterile water to the same OD600 value. BIOLOG ECO microplate (Biolog, Hayward, CA, USA)was preheated to 25℃ before use, and 150 μL diluted liquid was added into each hole. The sterile water was added as the control. The absorption value of 590 nm was read by microplate reader at 0 h, 24 h, 48 h, 72 h, 96 h, 120 h and 144 h at 30℃. The experiment was repeated three times.
4.5. RNA Sequencing and Bioinformatics Analysis
The strains were incubated in LB or M9 medium with the same initial OD600 indicative of the stationary stage. The cells were collected and lysed and total RNA were extracted by phenol-chloroform. RNA degradation and contamination was monitored on 1% agarose gels. RNA integrity was assessed using the RNA Nano 6000 Assay Kit of the Bioanalyzer 2100 system (Agilent Technologies, CA, USA). The resulting sequence was mapped to the reference genome of Aeromonas veronii C4 (NCBI reference sequence: GCF_008693705.1). RSEM and DESeq2 software were used to calculate gene expression levels to compare and analyze gene expression differences among samples. The threshold values of significant differences were p < 0.05 and | log2FC | ≥1. The significantly differentially expressed genes were analyzed for GO and KEGG functional enrichment.
4.6. Siderophore Production Assay
For qualitative analysis, after the overnight culture was washed twice with PBS, the bacterial suspension was diluted to the same OD600 value, and 5 μL of liquid was cultured on the CAS agar plate at 30℃ for 5 days. The siderophore formation was preliminarily determined by the size and color of yellow chelating rings around bacterial colonies. For quantitative analysis, overnight cultures were transferred to new LB medium at the same OD600 value and incubated at 30°C for 36 h with shaking. 1 mL bacterial solution was centrifuged at 10000 r/min for 10 min, and 100 μL supernatant was added into the 96-well microplate and mixed with CAS detection solution in equal volume. After incubation for 1 h at room temperature, the absorbance value of the mixture (As) was measured at the wavelength of 630 nm. The absorbance of uninoculated medium mixed with CAS reagent was determined as the reference ratio (Ar). The percent siderophore unit (SU) was calculated according to the formula [(Ar-As)/Ar]× 100%.
Supplementary Materials
The following supporting information can be downloaded at the website of this paper posted on Preprints.org.
Author Contributions
Conceptualization, X Ma and Z Liu; methodology, H Li and J Li; investigation, T Bai; resources, X Chi and Y Tang; data curation, X Ma and T Bai; writing—original draft preparation, review, and editing, X Ma and T Bai. All authors contributed to manuscript revision and approved the submitted version.
Funding
This work was supported by the National Natural Science Foundation of China (Nos. 32360047 and 32000089 to Xiang Ma).
Institutional Review Board Statement
Not applicable.
Data Availability Statement
The transcriptome data under M9 conditions have been submitted to NCBI’s Sequence Read Archive (SRA) database, with GEO accession number GSE120603. The GEO accession numbers for LB conditions will be provided during the review.
Conflicts of Interest
The authors declare no conflicts of interest.
References
- Schmeing, T.M.; Ramakrishnan, V. What Recent Ribosome Structures Have Revealed about the Mechanism of Translation. Nature 2009, 461, 1234–1242. [Google Scholar] [CrossRef] [PubMed]
- Miller, M.R.; Buskirk, A.R. The SmpB C-Terminal Tail Helps tmRNA to Recognize and Enter Stalled Ribosomes. Front. Microbiol. 2014, 5. [Google Scholar] [CrossRef] [PubMed]
- Monaghan, L.; Longman, D.; Cáceres, J.F. Translation-Coupled mRNA Quality Control Mechanisms. EMBO J 2023, 42, e114378. [Google Scholar] [CrossRef] [PubMed]
- Keiler, K.C. Mechanisms of Ribosome Rescue in Bacteria. Nat Rev Microbiol 2015, 13, 285–297. [Google Scholar] [CrossRef]
- Moore, S.D.; Sauer, R.T. The tmRNA System for Translational Surveillance and Ribosome Rescue. Annu Rev Biochem 2007, 76, 101–124. [Google Scholar] [CrossRef] [PubMed]
- Bäumler, A.J.; Kusters, J.G.; Stojiljkovic, I.; Heffron, F. Salmonella Typhimurium Loci Involved in Survival within Macrophages. Infect Immun 1994, 62, 1623–1630. [Google Scholar] [CrossRef]
- Julio, S.M.; Heithoff, D.M.; Mahan, M.J. ssrA (tmRNA) Plays a Role in Salmonella Enterica Serovar Typhimurium Pathogenesis. J Bacteriol 2000, 182, 1558–1563. [Google Scholar] [CrossRef] [PubMed]
- Li, J.; Ji, L.; Shi, W.; Xie, J.; Zhang, Y. Trans-Translation Mediates Tolerance to Multiple Antibiotics and Stresses in Escherichia Coli. J Antimicrob Chemother 2013, 68, 2477–2481. [Google Scholar] [CrossRef]
- Karzai, A.W.; Susskind, M.M.; Sauer, R.T. SmpB, a Unique RNA-binding Protein Essential for the Peptide-tagging Activity of SsrA (tmRNA). The EMBO Journal 1999. [Google Scholar] [CrossRef]
- Shin, J.-H.; Price, C.W. The SsrA-SmpB Ribosome Rescue System Is Important for Growth of Bacillus Subtilis at Low and High Temperatures. J Bacteriol 2007, 189, 3729–3737. [Google Scholar] [CrossRef]
- Domingues, S.; Moreira, R.N.; Andrade, J.M.; Dos Santos, R.F.; Bárria, C.; Viegas, S.C.; Arraiano, C.M. The Role of RNase R in Trans-Translation and Ribosomal Quality Control. Biochimie 2015, 114, 113–118. [Google Scholar] [CrossRef]
- Abe, T.; Sakaki, K.; Fujihara, A.; Ujiie, H.; Ushida, C.; Himeno, H.; Sato, T.; Muto, A. tmRNA-Dependent Trans-Translation Is Required for Sporulation in Bacillus Subtilis. Mol Microbiol 2008, 69, 1491–1498. [Google Scholar] [CrossRef] [PubMed]
- Abo, T.; Inada, T.; Ogawa, K.; Aiba, H. SsrA-Mediated Tagging and Proteolysis of LacI and Its Role in the Regulation of Lac Operon. EMBO J 2000, 19, 3762–3769. [Google Scholar] [CrossRef] [PubMed]
- Keiler, K.C.; Shapiro, L. tmRNA in Caulobacter Crescentus Is Cell Cycle Regulated by Temporally Controlled Transcription and RNA Degradation. J Bacteriol 2003, 185, 1825–1830. [Google Scholar] [CrossRef] [PubMed]
- Okan, N.A.; Bliska, J.B.; Karzai, A.W. A Role for the SmpB-SsrA System in Yersinia Pseudotuberculosis Pathogenesis. PLoS Pathog 2006, 2, e6. [Google Scholar] [CrossRef] [PubMed]
- Liu, Y.; Wu, N.; Dong, J.; Gao, Y.; Zhang, X.; Shao, N.; Yang, G. SsrA (tmRNA) Acts as an Antisense RNA to Regulate Staphylococcus Aureus Pigment Synthesis by Base Pairing with crtMN mRNA. FEBS Letters 2010, 584, 4325–4329. [Google Scholar] [CrossRef] [PubMed]
- Ansong, C.; Yoon, H.; Porwollik, S.; Mottaz-Brewer, H.; Petritis, B.O.; Jaitly, N.; Adkins, J.N.; McClelland, M.; Heffron, F.; Smith, R.D. Global Systems-Level Analysis of Hfq and SmpB Deletion Mutants in Salmonella: Implications for Virulence and Global Protein Translation. PLoS One 2009, 4, e4809. [Google Scholar] [CrossRef] [PubMed]
- Felden, B.; Gillet, R. SmpB as the Handyman of tmRNA during Trans-Translation. RNA Biol 2011, 8, 440–449. [Google Scholar] [CrossRef]
- Personne, Y.; Parish, T. Mycobacterium Tuberculosis Possesses an Unusual tmRNA Rescue System. Tuberculosis (Edinb) 2014, 94, 34–42. [Google Scholar] [CrossRef] [PubMed]
- Hudson, C.M.; Lau, B.Y.; Williams, K.P. Ends of the Line for tmRNA-SmpB. Front Microbiol 2014, 5, 421. [Google Scholar] [CrossRef] [PubMed]
- Ning, X.; Peng, Y.; Tang, P.; Zhang, Y.; Wang, L.; Zhang, W.; Zhang, K.; Ji, J.; Yin, S. Integrated Analysis of Transcriptome and Metabolome Reveals Distinct Responses of Pelteobagrus Fulvidraco against Aeromonas Veronii Infection at Invaded and Recovering Stage. Int J Mol Sci 2022, 23, 10121. [Google Scholar] [CrossRef] [PubMed]
- Wang, Y.; Huang, W.; Li, Y.; Yu, F.; Penttinen, P. Isolation, Characterization, and Evaluation of a High-Siderophore-Yielding Bacterium from Heavy Metal–Contaminated Soil. Environ Sci Pollut Res 2022, 29, 3888–3899. [Google Scholar] [CrossRef]
- Zhang, H.-P.; Kang, Y.-H.; Kong, L.-C.; Ju, A.-Q.; Wang, Y.-M.; Muhammad, I.; Zhang, D.-X.; Qian, A.-D.; Shan, X.-F.; Ma, H.-X. Functional Analysis of hisJ in Aeromonas Veronii Reveals a Key Role in Virulence. Ann N Y Acad Sci 2020, 1465, 146–160. [Google Scholar] [CrossRef] [PubMed]
- Liu, F.; Yuwono, C.; Tay, A.C.Y.; Wehrhahn, M.C.; Riordan, S.M.; Zhang, L. Analysis of Global Aeromonas Veronii Genomes Provides Novel Information on Source of Infection and Virulence in Human Gastrointestinal Diseases. BMC Genomics 2022, 23, 166. [Google Scholar] [CrossRef] [PubMed]
- Yike Xu; Yuchen Sun; Qianglong Sheng; Hong Li;Xiang Ma; Yanqiong Tang; Screening of smpB, tmRNA and hfq knock-out attenuated live vaccine of Aeromonas liuzhuvicki. Journal of Shandong Agricultural University (Natural Science Edition), 2019, 50, 186–190.
- Liu, Z.; Hu, K.; Tang, Y.; Li, H.; Tang, H.; Hu, X.; Ma, X.; Liu, Z. SmpB Down-Regulates Proton-Motive Force for the Persister Tolerance to Aminoglycosides in Aeromonas Veronii. Biochem Biophys Res Commun 2018, 507, 407–413. [Google Scholar] [CrossRef]
- Yu, W.; Li, D.; Li, H.; Tang, Y.; Tang, H.; Ma, X.; Liu, Z. Absence of tmRNA Increases the Persistence to Cefotaxime and the Intercellular Accumulation of Metabolite GlcNAc in Aeromonas Veronii. Front Cell Infect Microbiol 2020, 10, 44. [Google Scholar] [CrossRef] [PubMed]
- Vázquez-Hernández, M.; Leedom, S.L.; Keiler, K.C.; Bandow, J.E. Physiology of Trans-Translation Deficiency in Bacillus Subtilis – a Comparative Proteomics Study. PROTEOMICS 2023, 23, 2200474. [Google Scholar] [CrossRef] [PubMed]
- Wang, D.; Li, H.; Khan, W.U.; Ma, X.; Tang, H.; Tang, Y.; Huang, D.; Liu, Z. SmpB and tmRNA Orchestrate Purine Pathway for the Trimethoprim Resistance in Aeromonas Veronii. Front Cell Infect Microbiol 2020, 10, 239. [Google Scholar] [CrossRef]
- Behnsen, J.; Zhi, H.; Aron, A.T.; Subramanian, V.; Santus, W.; Lee, M.H.; Gerner, R.R.; Petras, D.; Liu, J.Z.; Green, K.D.; et al. Siderophore-Mediated Zinc Acquisition Enhances Enterobacterial Colonization of the Inflamed Gut. Nature Communications 2021, 12, 7016. [Google Scholar] [CrossRef]
- Keiler, K.C.; Feaga, H.A. Resolving Nonstop Translation Complexes Is a Matter of Life or Death. Journal of Bacteriology 2014, 196, 2123. [Google Scholar] [CrossRef] [PubMed]
- Pedersen, K.; Zavialov, A.V.; Pavlov, M.Y.; Elf, J.; Gerdes, K.; Ehrenberg, M. The Bacterial Toxin RelE Displays Codon-Specific Cleavage of mRNAs in the Ribosomal A Site. Cell 2003, 112, 131–140. [Google Scholar] [CrossRef] [PubMed]
- Cataudella, I.; Trusina, A.; Sneppen, K.; Gerdes, K.; Mitarai, N. Conditional Cooperativity in Toxin–Antitoxin Regulation Prevents Random Toxin Activation and Promotes Fast Translational Recovery. Nucleic Acids Research 2012, 40, 6424. [Google Scholar] [CrossRef] [PubMed]
- Christensen, S.K.; Pedersen, K.; Hansen, F.G.; Gerdes, K. Toxin-Antitoxin Loci as Stress-Response-Elements: ChpAK/MazF and ChpBK Cleave Translated RNAs and Are Counteracted by tmRNA. J Mol Biol 2003, 332, 809–819. [Google Scholar] [CrossRef] [PubMed]
- Maurer, M.; Klassert, T.E.; Löffler, B.; Slevogt, H.; Tuchscherr, L. Extraction of High-Quality RNA from S. Aureus Internalized by Endothelial Cells. Microorganisms 2023, 11, 1020. [Google Scholar] [CrossRef] [PubMed]
- Egan, A.J.F.; Errington, J.; Vollmer, W. Regulation of Peptidoglycan Synthesis and Remodelling. Nat Rev Microbiol 2020, 18, 446–460. [Google Scholar] [CrossRef] [PubMed]
- Krämer, R. Bacterial Stimulus Perception and Signal Transduction: Response to Osmotic Stress. The Chemical Record 2010, 10, 217–229. [Google Scholar] [CrossRef] [PubMed]
- Am, S.; Vl, R.; Pn, G. Two-Component Signal Transduction. Annual review of biochemistry 2000, 69. [Google Scholar] [CrossRef]
- Torres Montaguth, O.E.; Bervoets, I.; Peeters, E.; Charlier, D. Competitive Repression of the artPIQM Operon for Arginine and Ornithine Transport by Arginine Repressor and Leucine-Responsive Regulatory Protein in Escherichia Coli. Front Microbiol 2019, 10, 1563. [Google Scholar] [CrossRef]
- Hong, S.-J.; Lessner, F.H.; Mahen, E.M.; Keiler, K.C. Proteomic Identification of tmRNA Substrates. Proceedings of the National Academy of Sciences of the United States of America 2007, 104, 17128. [Google Scholar] [CrossRef] [PubMed]
- Peng, M.; Cao, X.; Tang, Y.; Li, H.; Ma, X.; Liu, Z. Large-Scale Identification of Trans-Translation Substrates Targeted by tmRNA in Aeromonas Veronii. Microbial Pathogenesis 2020, 145, 104226. [Google Scholar] [CrossRef] [PubMed]
- Soutourina, O.A.; Bertin, P.N. Regulation Cascade of Flagellar Expression in Gram-Negative Bacteria. FEMS Microbiol Rev 2003, 27, 505–523. [Google Scholar] [CrossRef] [PubMed]
- Schwyn, B.; Neilands, J.B. Universal Chemical Assay for the Detection and Determination of Siderophores. Anal Biochem 1987, 160, 47–56. [Google Scholar] [CrossRef] [PubMed]
- Schmittgen, T.D.; Livak, K.J. Analyzing Real-Time PCR Data by the Comparative C(T) Method. Nat Protoc 2008, 3, 1101–1108. [Google Scholar] [CrossRef] [PubMed]
Figure 1.
The genes ssrA and smpB exhibit different expression patterns in response to nutrition deletion. RT-qPCR was used to determine the relative expression levels of tmRNA (A, C) or smpB (B, D) at different times under LB conditions (A, B) or M9 conditions (C, D). Tukey’s post-test was used for statistical analysis, with **representing P < 0.01, ***representing P < 0.005 in one-way ANOVA.
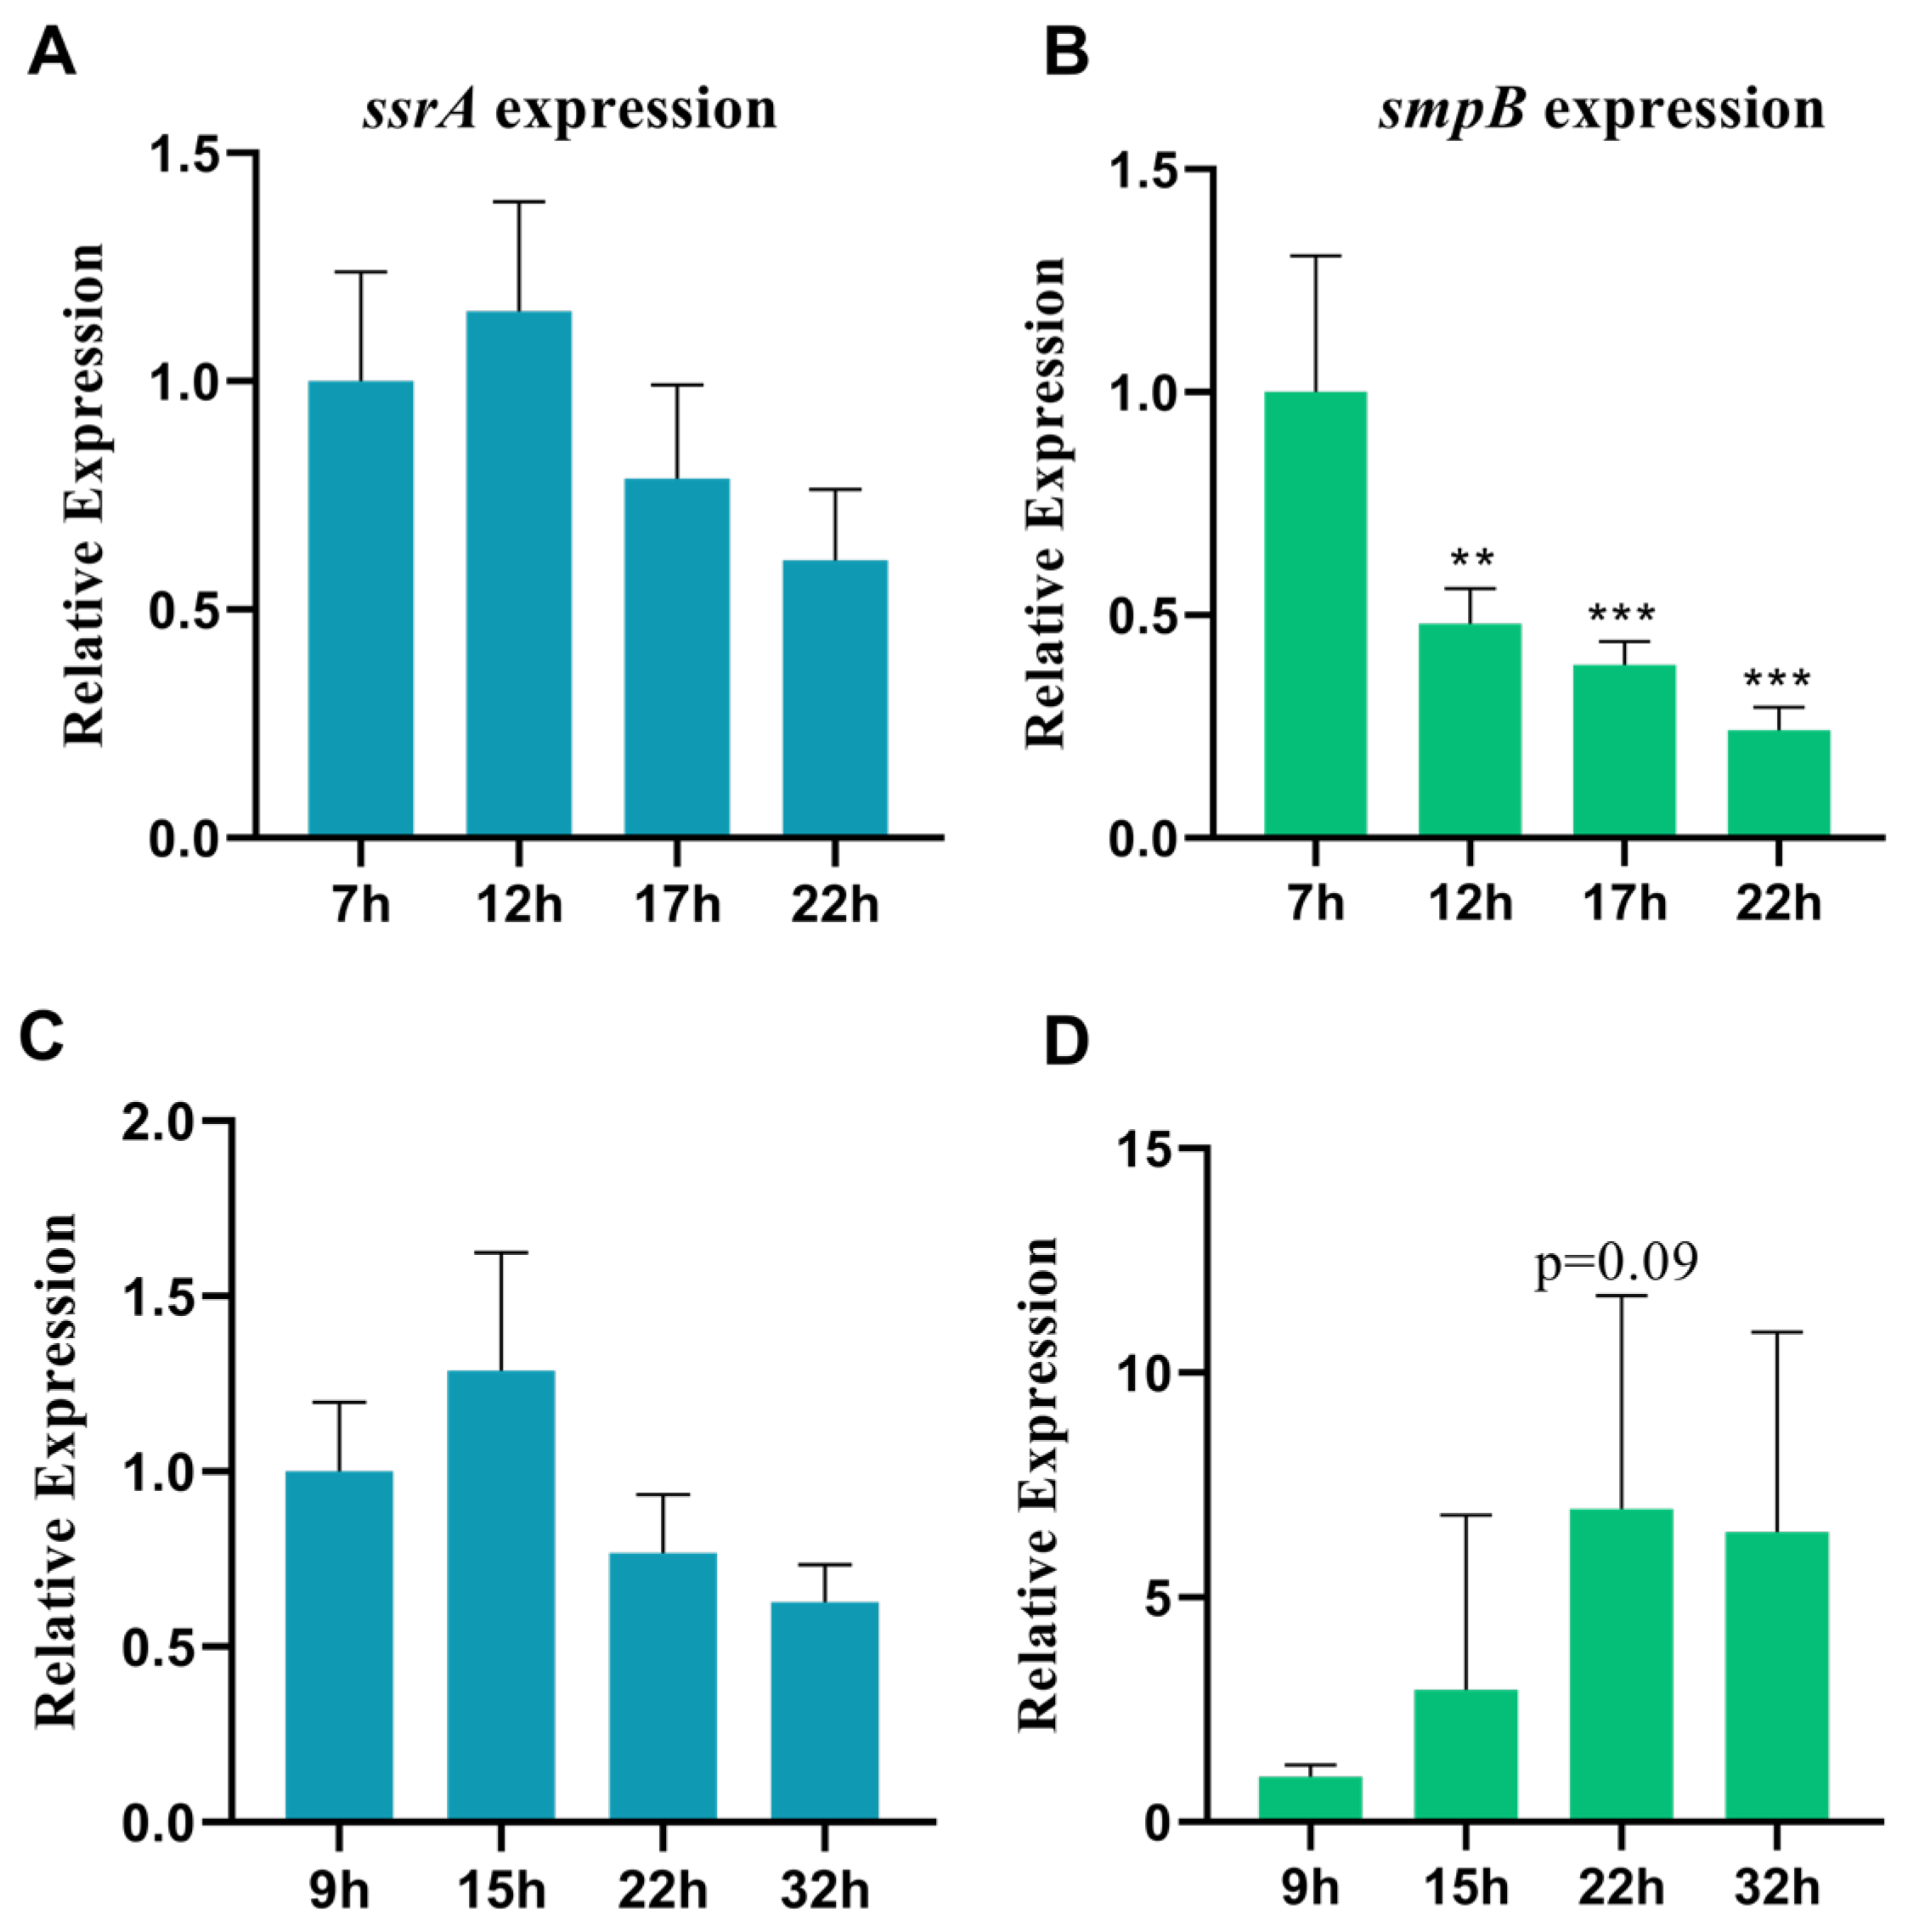
Figure 2.
tmRNA and SmpB cooperate or independently participate in the responses to starvation, osmotic pressure, and low iron stress. For the determination of the growth curve, the bacteria were transferred to LB medium supplemented with 200 μM 2,2’-bipyridine or 0.5 M sodium chloride. Data were presented as mean± SD from three replicates. For the plate experiment, after the overnight culture was washed with PBS, a ten-fold serial dilution of the bacterial suspension was prepared, and 3 μL of each dilution was spotted onto LB agar plates supplemented with different concentrations of 2’2 bipyridine or sodium chloride. For the starvation treatments, bacterial suspensions were allowed to stand in PBS buffer and dot on LB plates after 24 h or 72 h.
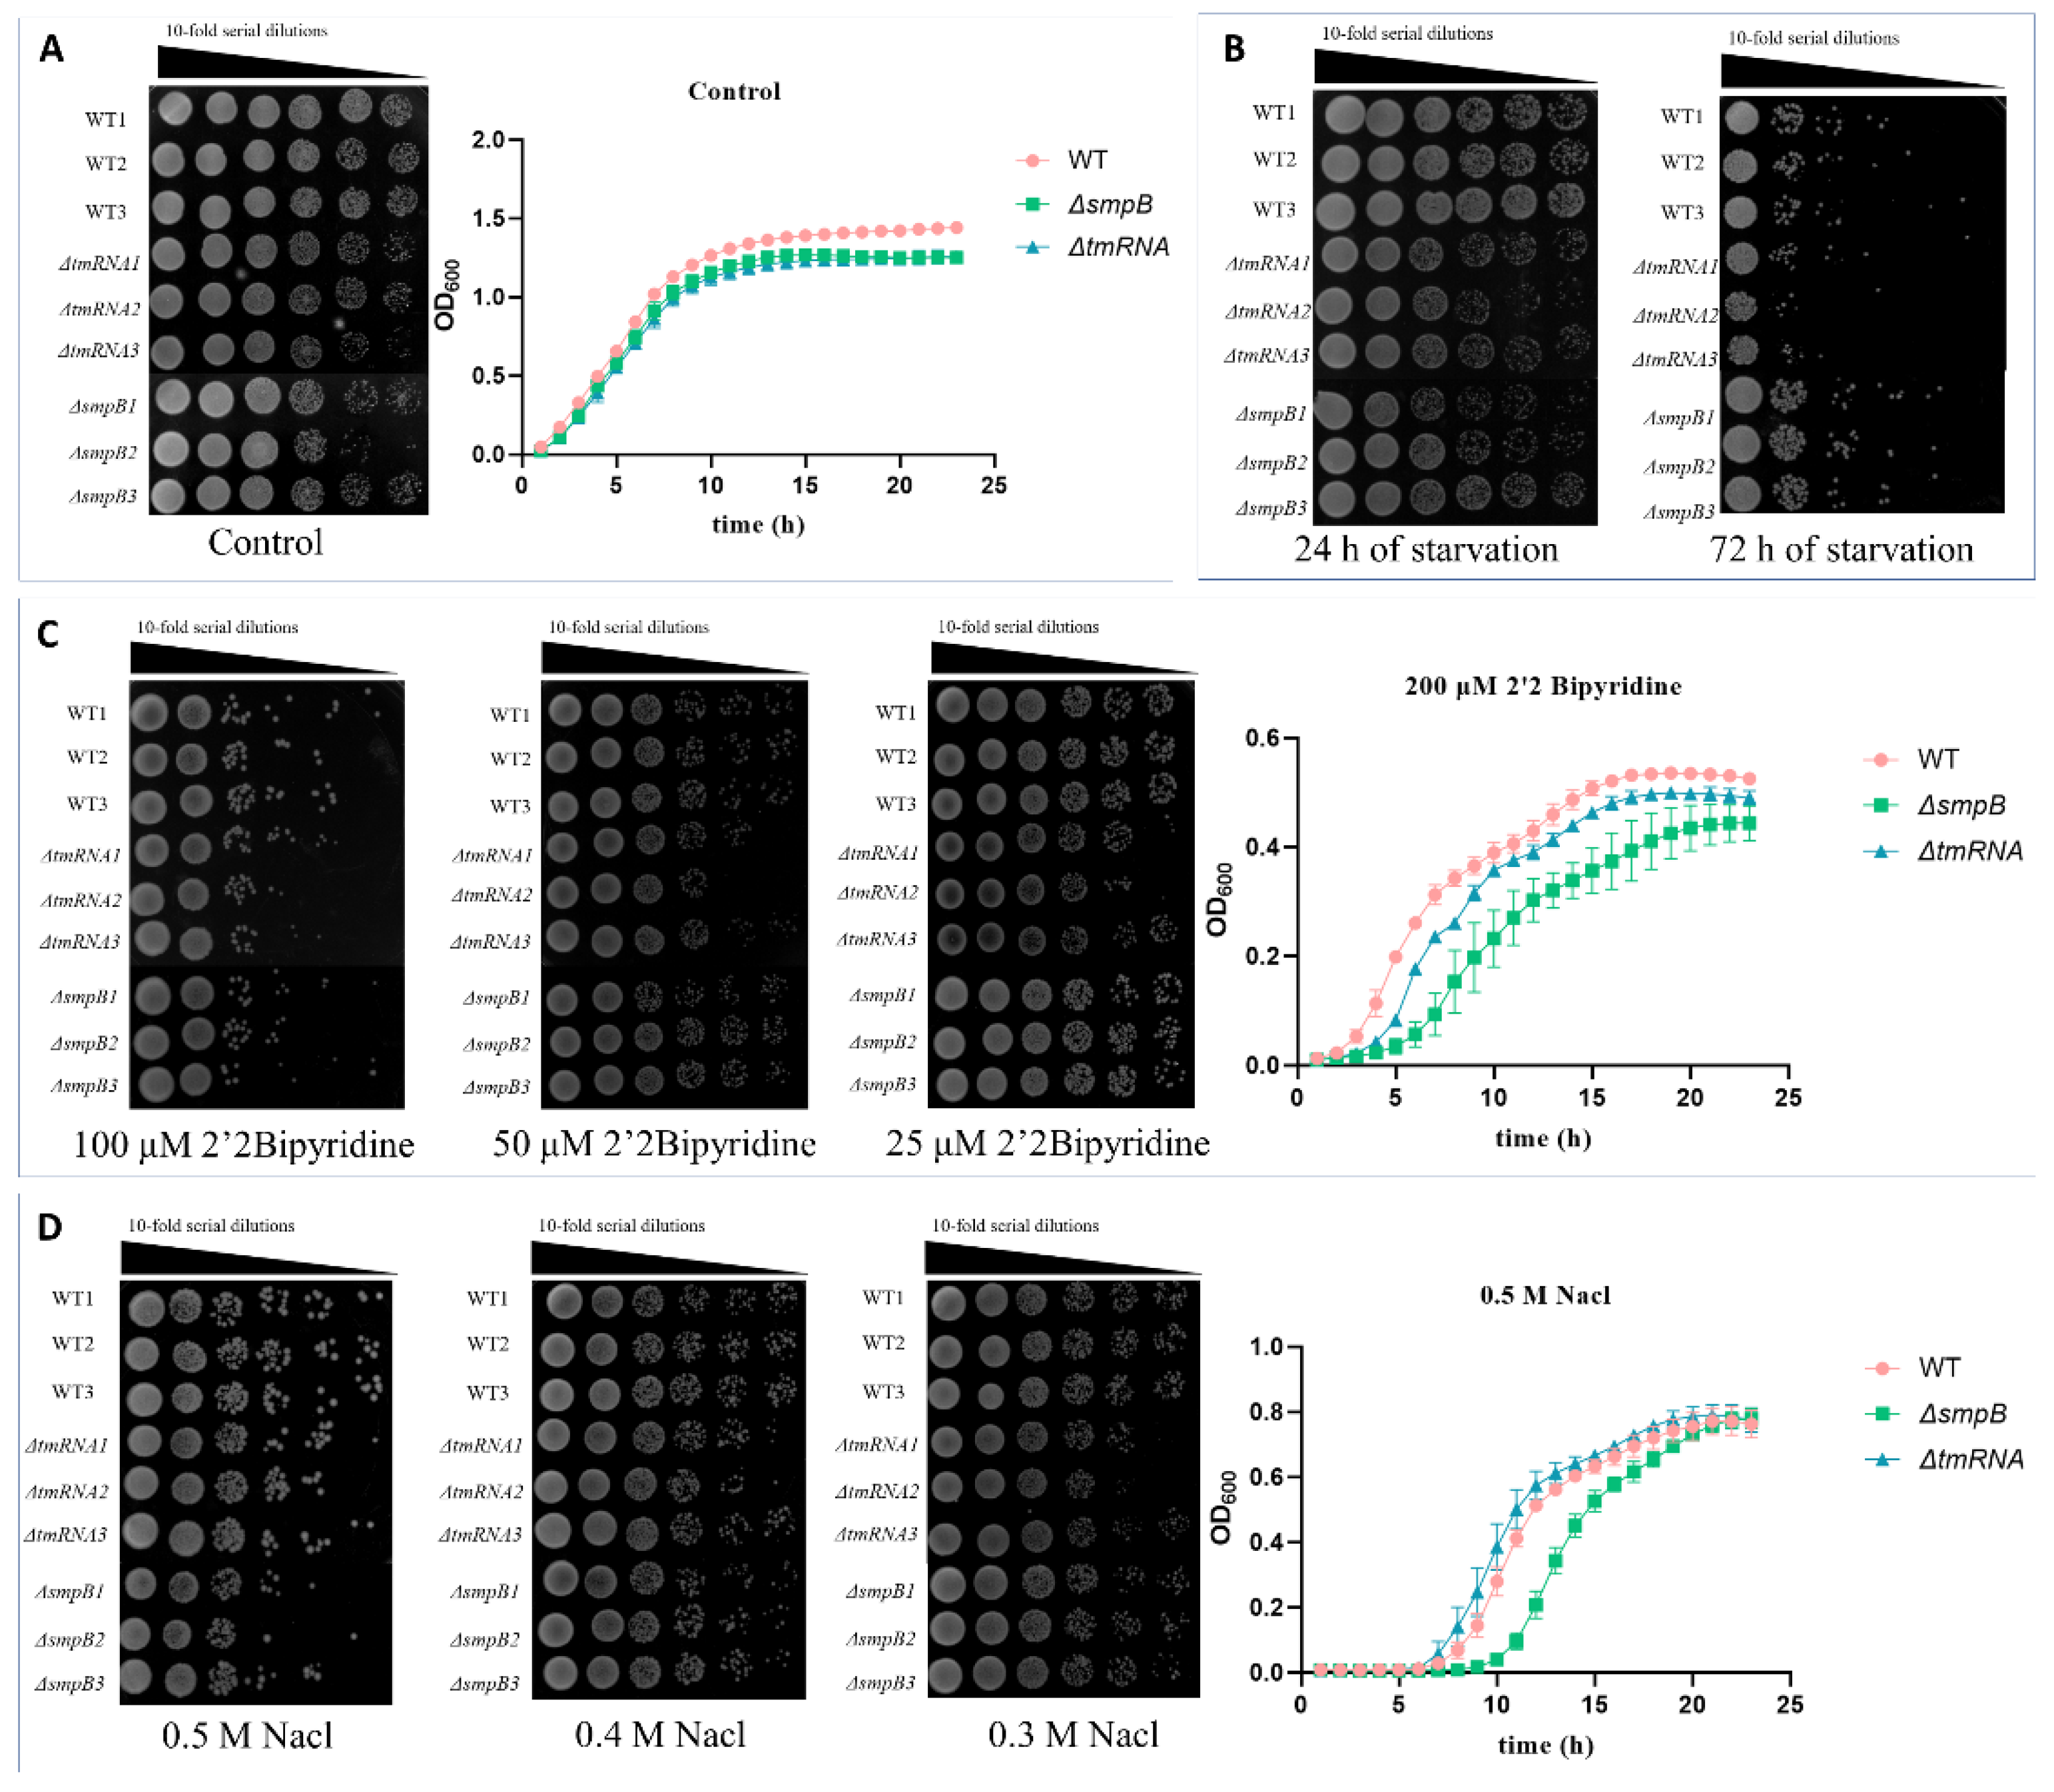
Figure 3.
tmRNA and SmpB participate in the metabolism of different types of carbon sources cooperatively or independently. WT, ΔtmRNA and ΔsmpB were inoculated on BIOLOG ECO microplate at 30℃ with L-aspartate (A), β-Methyl D-glucoside (B), D-mannitol (C) and Tween 40 (D) as sole carbon sources. The absorption values were recorded at 590 nm at an interval of 24 hours. Data were presented as mean± SD from three replicates. Tukey’s post-test was used for statistical analysis, with * representing P < 0.05, ** representing P < 0.01 in one-way ANOVA.
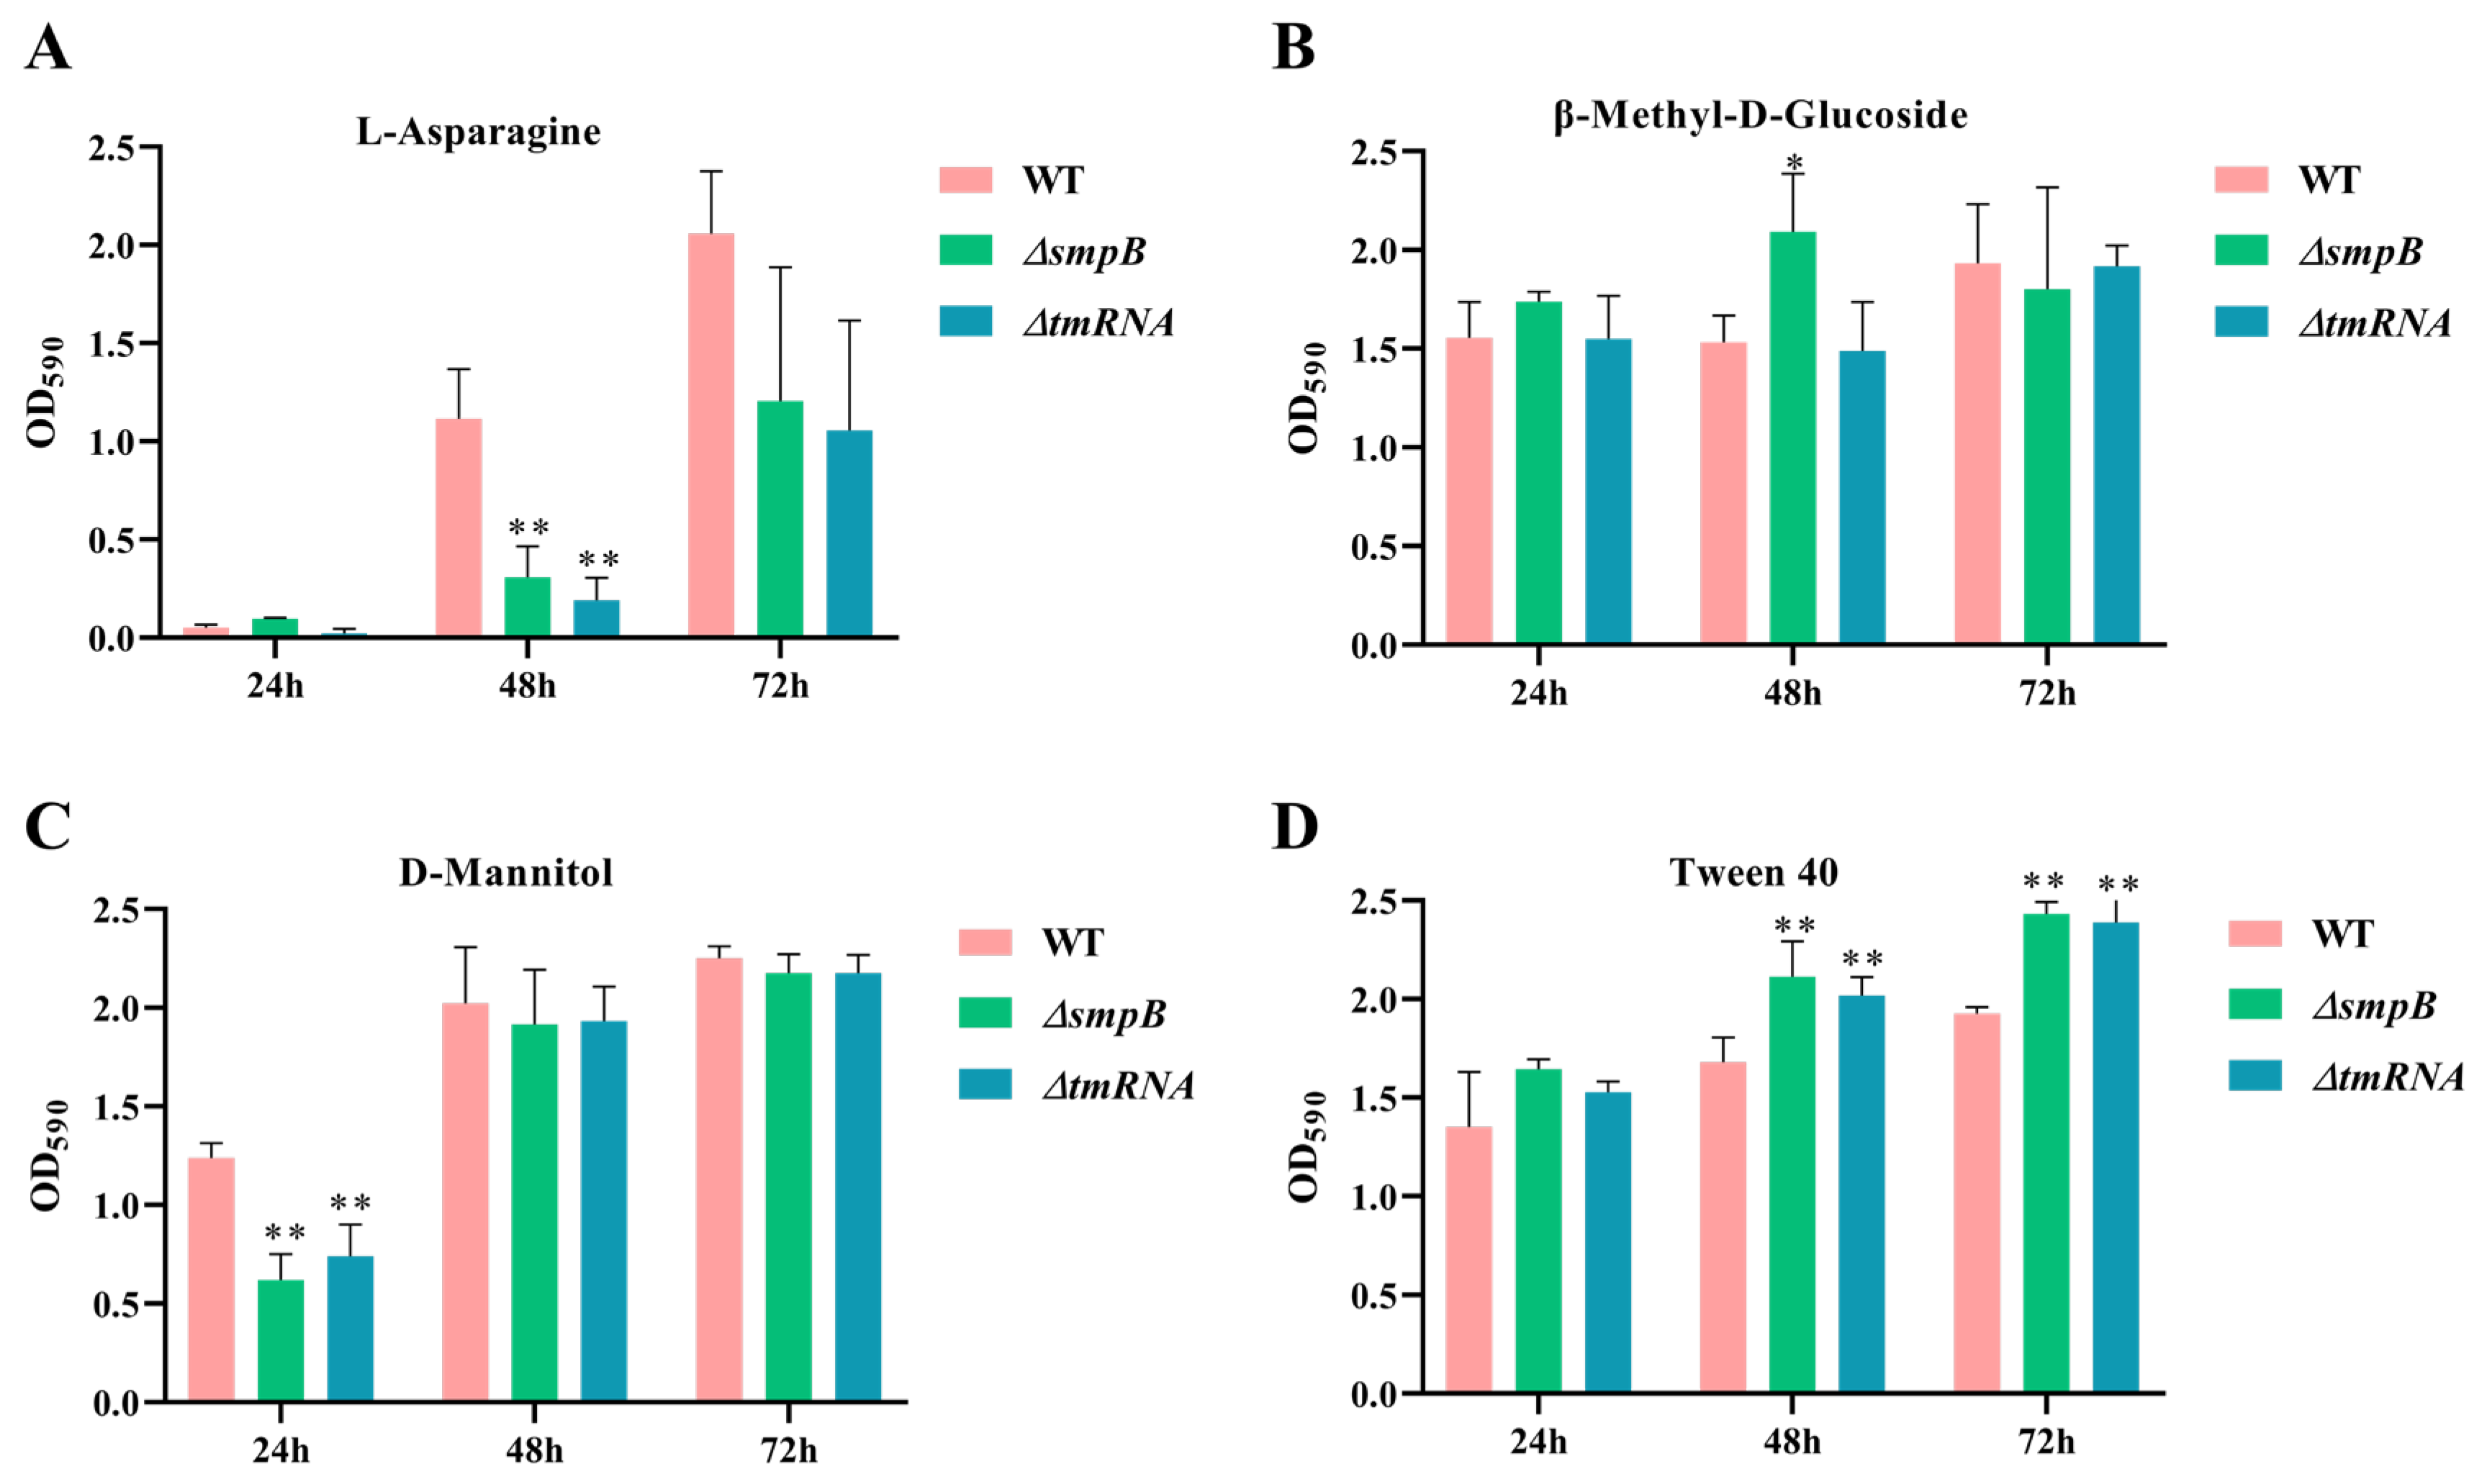
Figure 4.
The tmRNA and SmpB exhibit enhanced collaboration under nutrient deficiency condition, but show significant independence in nutrient enrichment condition. Total number of differential genes of ΔsmpB or ΔssrA compared with wild type were analyzed through histogram (A, B) or venn analysis (C, D) under LB medium (A, C) or M9 medium (B, D) conditions.
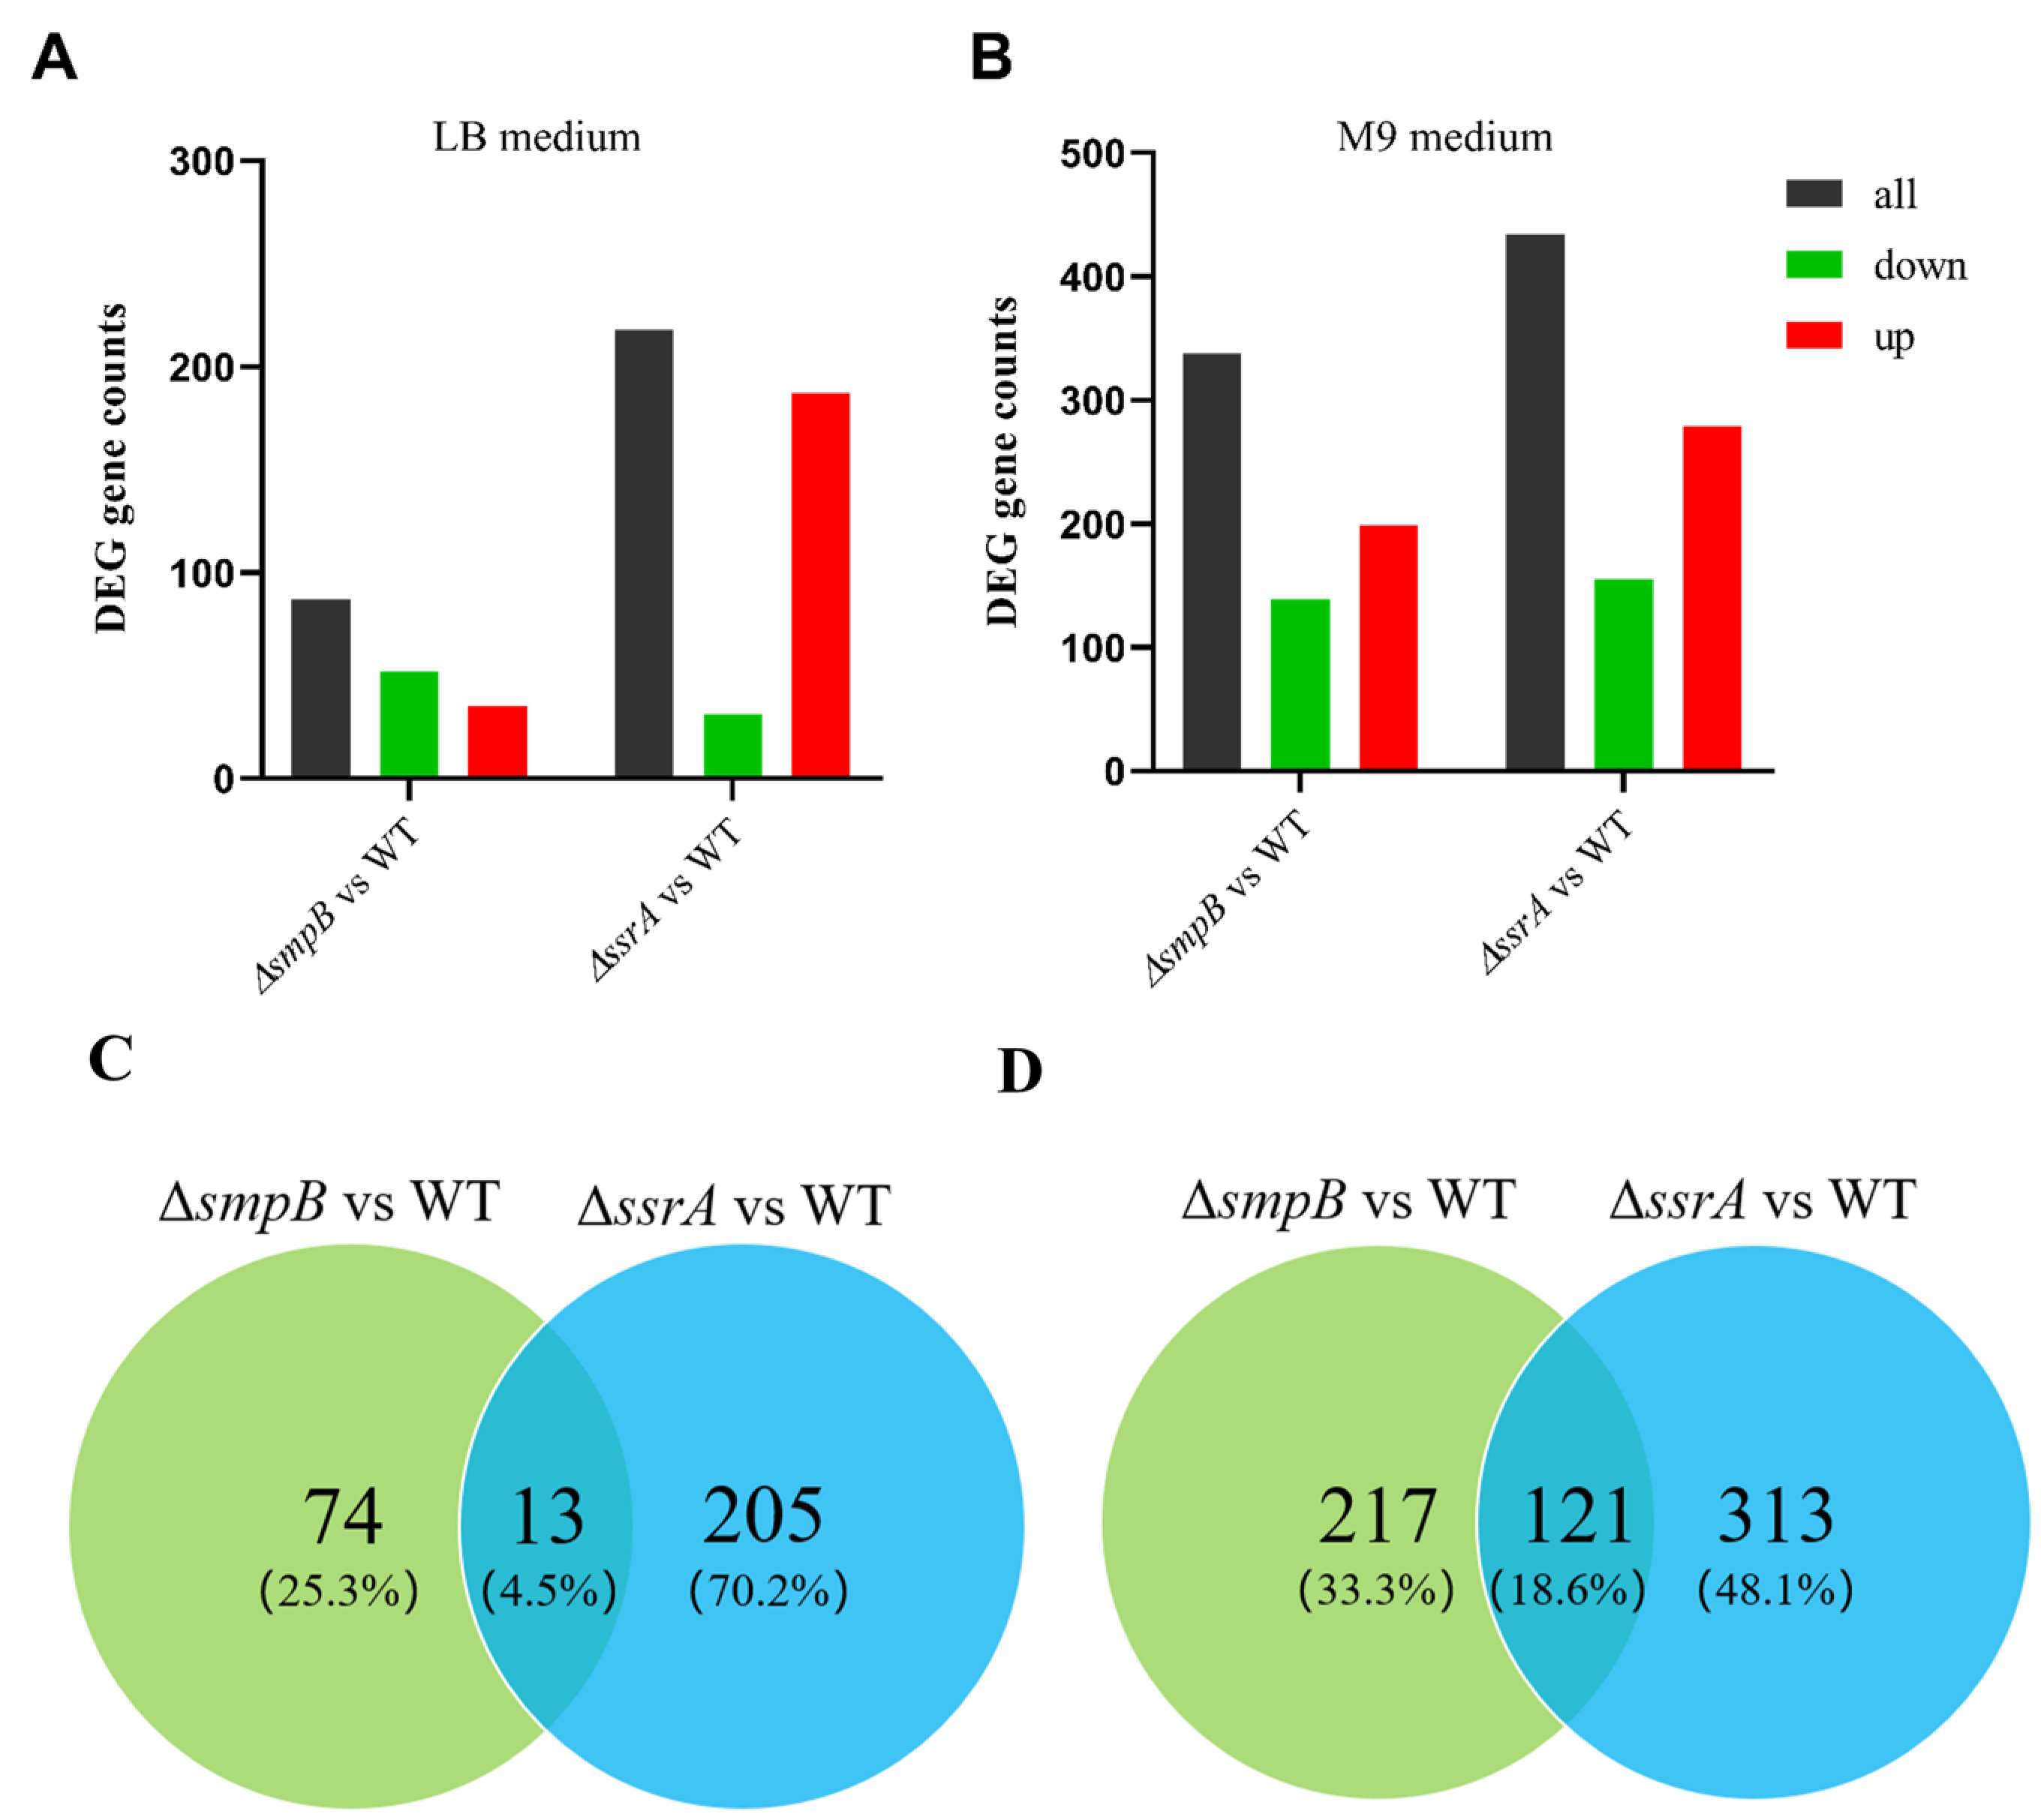
Figure 5.
Functional enrichment analysis of DEGs based on the KEGG database. Top 20 statistics of pathway enrichment for ΔssrA vs WT (A, C) and ΔsmpB vs WT (B, D) in LB medium (A, B) and M9 medium (C, D).
Figure 5.
Functional enrichment analysis of DEGs based on the KEGG database. Top 20 statistics of pathway enrichment for ΔssrA vs WT (A, C) and ΔsmpB vs WT (B, D) in LB medium (A, B) and M9 medium (C, D).
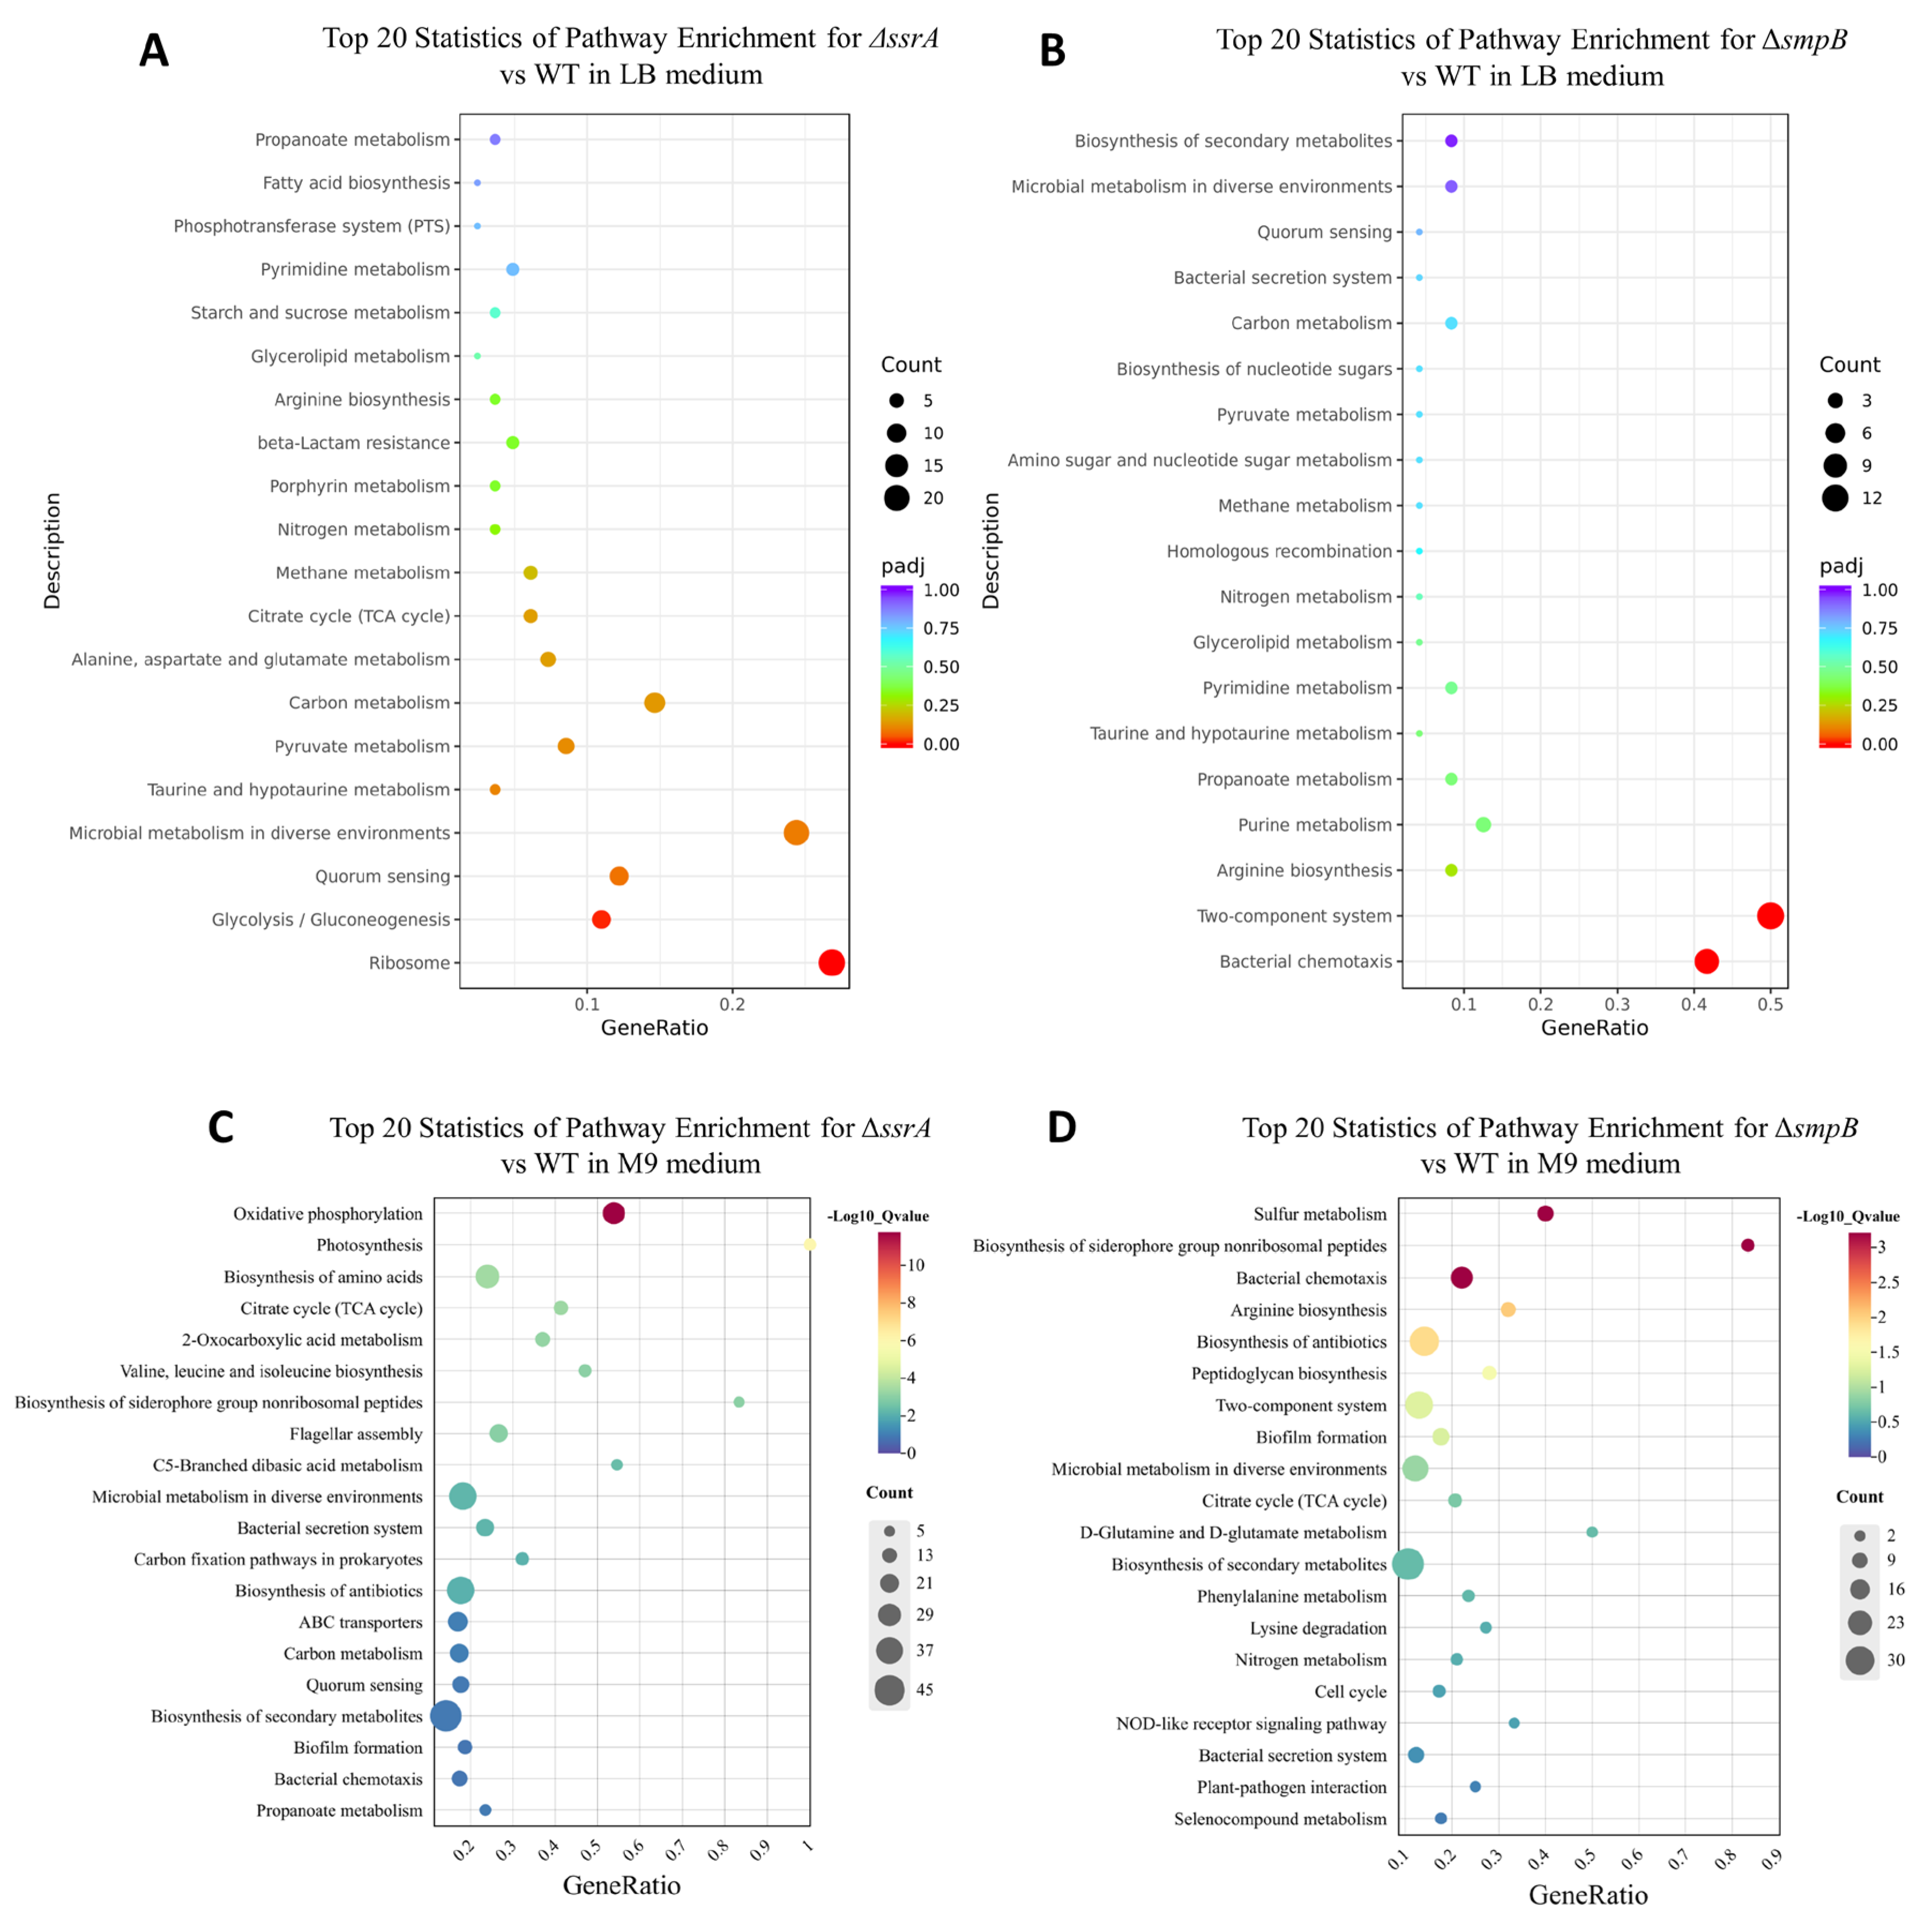
Figure 6.
The model for the changes of cellular processes in ΔssrA (A) and ΔsmpB (B) as compared with the wild type based on the highly enriched pathways under M9 culture conditions. Red, green, and black marked genes indicate theses with significant upregulation (FC > 2 and p-value < 0.05), significant downregulation (FC < 0.5 and p-value < 0.05), and no significant regulation (0.5 ≤ FC ≤ 2 or p-value ≥ 0.05), respectively.
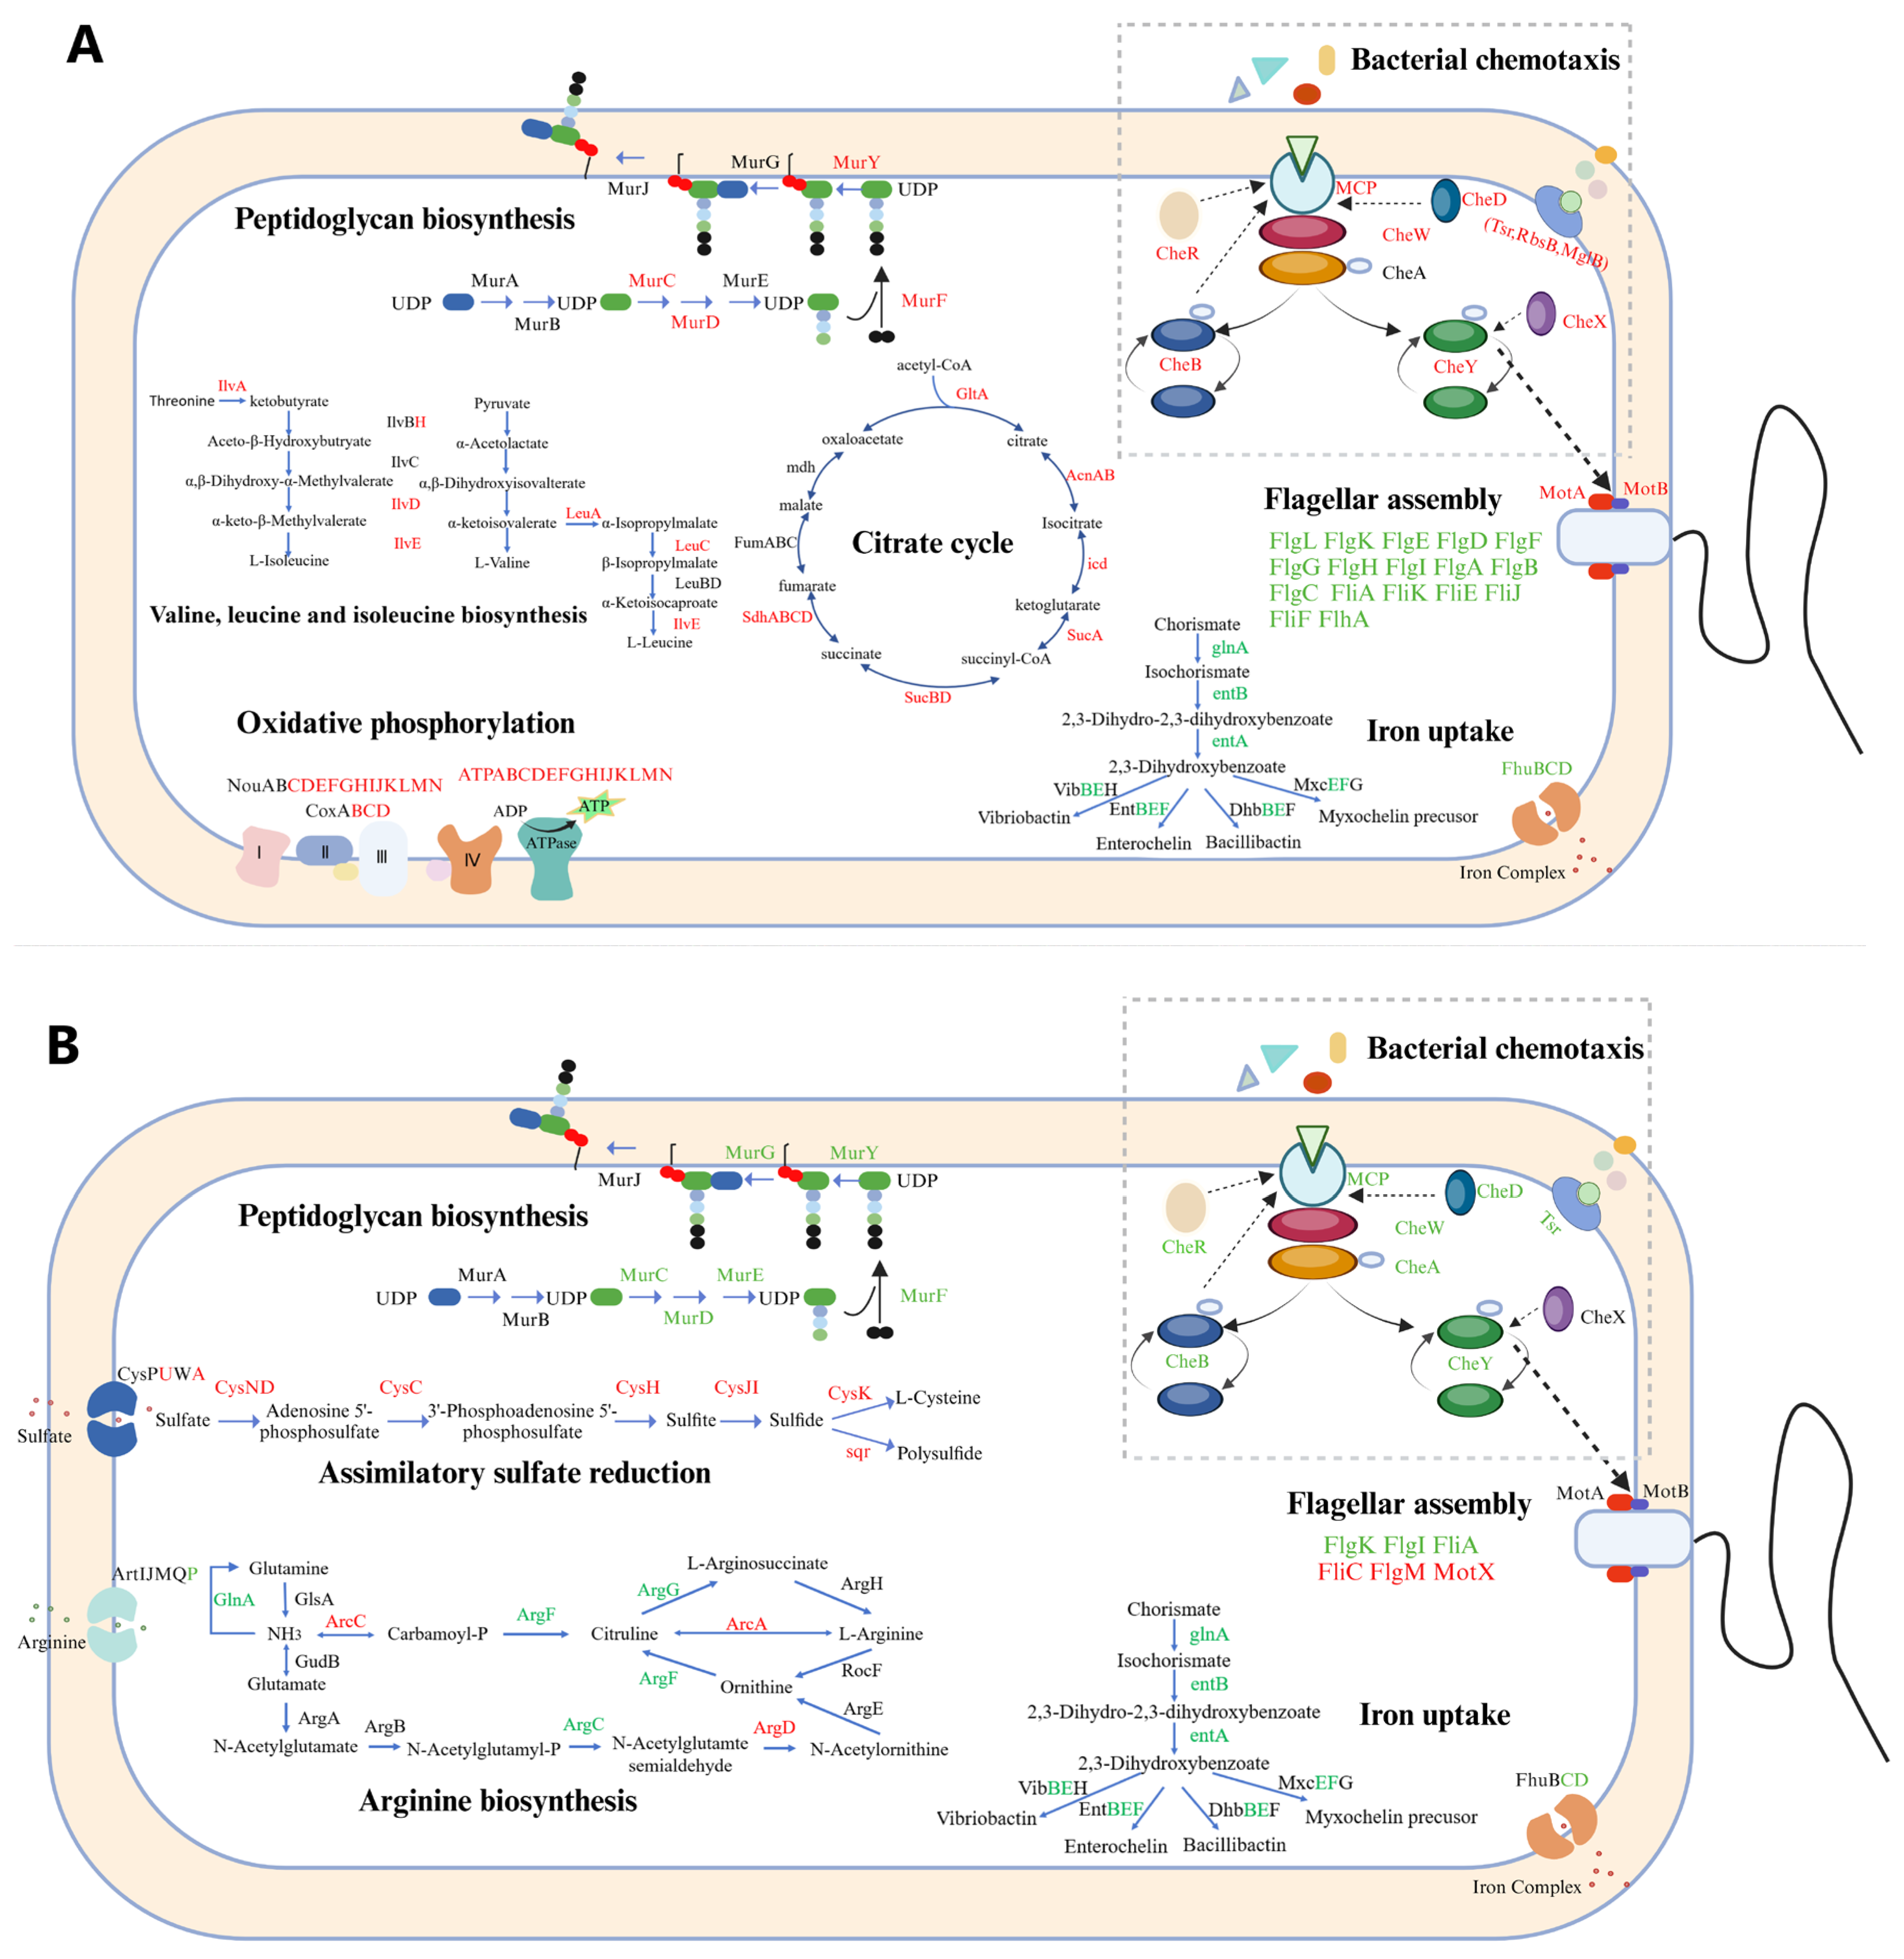
Figure 7.
tmRNA and SmpB cooperatively regulate siderophore synthesis. RT-qPCR validation of genes involved in siderophore synthesis in ΔssrA (A) and ΔsmpB (B). Qualitative and quantitative analysis of siderophore formation. For qualitative analysis (C), 5μLbacterial suspension were cultured on CAS agar plates at 30 ℃ for 5 days. The yellow halo shows that siderophores produced by bacteria can strip the blue complex formed by cas and Fe3+ from the medium, and the wild type produces a darker yellow halo. For quantitative analysis (D), the bacteria were cultured in LB medium for 36 h, centrifugation at 10000 rpm for 10 min, 100 μLsupernatant was mixed with equal volume cas detection solution, and the absorption value at 630 nm was measured after standing in the dark for 1 h. Error bars represented standard deviations of triplicate experiments. Tukey’s posttest was used to assess statistical significance with *** representing P < 0.005 in one-way ANOVA.
Disclaimer/Publisher’s Note: The statements, opinions and data contained in all publications are solely those of the individual author(s) and contributor(s) and not of MDPI and/or the editor(s). MDPI and/or the editor(s) disclaim responsibility for any injury to people or property resulting from any ideas, methods, instructions or products referred to in the content. |
© 2024 by the authors. Licensee MDPI, Basel, Switzerland. This article is an open access article distributed under the terms and conditions of the Creative Commons Attribution (CC BY) license (http://creativecommons.org/licenses/by/4.0/).
Copyright: This open access article is published under a Creative Commons CC BY 4.0 license, which permit the free download, distribution, and reuse, provided that the author and preprint are cited in any reuse.


